


Languages
Pages
Legal


Prepared for the KPU Board of Governors
September 2013
Office of Institutional Analysis and Planning
Baseline Measures
of Performance

2
FOREWORD
This report presents the baseline measures
for KPU’s Strategic Plan Vision 2018 and an
update on measures that are still being
developed. No targets have been
established although there are some
measures that are part of the
postsecondary accountability framework
for which system targets already exist.
Trend and comparable data are presented if
available. KPU’s performance is compared
to the other teaching lead universities
(referred to as TLU throughout the
document) in British Columbia. This
includes: Capilano, Vancouver Island,
Fraser Valley, and Thompson Rivers.
The KPU and TLU data are a role up of:
certificate, diploma, associate degree,
baccalaureate and trades
students/programs data. Developmental
data are not included, because the
comparable data were not readily available.
A reporting system to track activity that
advances the goals in Vision 2018 is
currently being sourced. It is anticipate that
implementation will begin this year. The
reporting system will allow all units in KPU
to report their priorities and actions in a
single information repository, cultivating a
culture of planning, evaluation and
accountability and facilitating reporting.
Plans are being developed in both academic
and service units that align with Vision
2018.

3
GOALS
Learner engagement and retention at
KPU show continuous improvement.
Includes measures of:
III. Retention
IV. Learner Engagement
All KPU graduates are prepared for
global citizenship and rewarding
careers.
Includes measures of:
I. Post-Study Employment and Further
Study
II. Measures of Citizenship and
Internationalization
KPU is a well-managed, integrated, and
transparent organization that supports
learning.
Includes measures of:
V. Continuous Quality Improvement
VI. Efficiency
VII. Effectiveness
VIII. Sustainability
IX. Financial Health
X. Employee Engagement
4
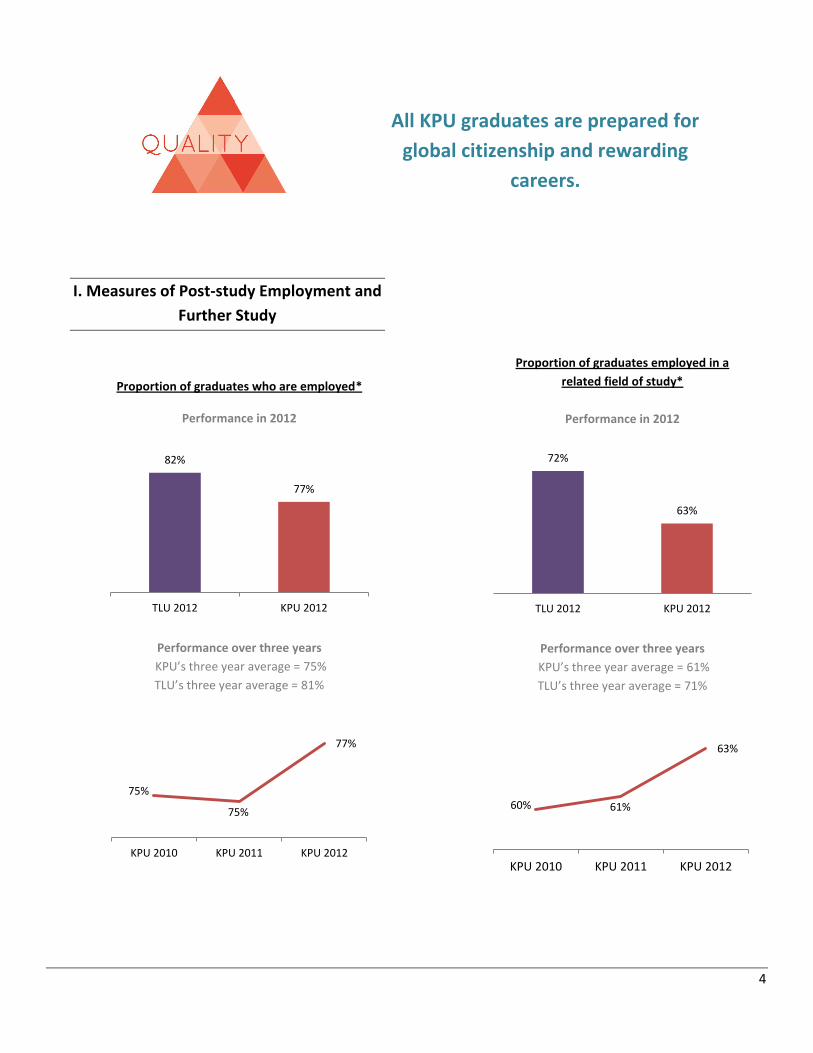
I. Measures of Post-study Employment and
Further Study
Proportion of graduates who are employed*
Performance in 2012
Performance over three years
KPU’s three year average = 75%
TLU’s three year average = 81%
Proportion of graduates employed in a
related field of study*
Performance in 2012
Performance over three years
KPU’s three year average = 61%
TLU’s three year average = 71%
82%
77%
TLU 2012 KPU 2012
75%
75%
77%
KPU 2010 KPU 2011 KPU 2012
72%
63%
TLU 2012 KPU 2012
60% 61%
63%
KPU 2010 KPU 2011 KPU 2012
All KPU graduates are prepared for
global citizenship and rewarding
careers.

5
Usefulness of knowledge and skills in performing
job (obtained in program of study)*
Performance in 2012
Performance over three years
KPU’s three year average = 73%
TLU’s three year average = 82%
Proportion of graduates pursuing further studies*
Performance in 2012
Performance over three years
KPU’s three year average = 54%
TLU’s three year average = 47%
II. Measures of Citizenship and
Internationalization
Developed ability to work effectively with others
Performance in 2012
Performance over three years
KPU’s three year average = 80%
TLU’s three year average = 85%
82%
76%
Very Useful/Useful Very Useful/Useful
TLU 2012 KPU 2012
70%
74%
81%
KPU 2010 KPU 2011 KPU 2012
47%
53%
TLU 2012 KPU 2012
56%
52%
53%
KPU 2010 KPU 2011 KPU 2012
85% 83%
Very Well/Well Very Well/Well
TLU 2012 KPU 2012
81%
79%
83%
KPU 2010 KPU 2011 KPU 2012

6
7% 7%
9%
AY 2010/11 AY 2011/12 AY 2012/13
How well program provided opportunities for developing
ability to analyze and think critically*
Performance in 2012
Performance over three years
KPU’s three year average = 82%
TLU’s three year average = 86%
Exposure to culturally diverse viewpoints during
educational experience at KPUi
% International student at KPUii
# Students taking part in formal exchanges or
international learning opportunities
% Students completing Global Competency Certificate
A Global Competency Certification is being developed at KPU.
An advisory committee has been created and is working
through the fall 2013 to develop the framework and the
implementation strategy. The scheduled launch is fall 2014.
Frequency that learning is connected to
societal problems or issues
National Survey of Student Engagement is being conducted in
2014. Results will be available in late summer 2014.
83% 81%
Very Well/Well Very Well/Well
TLU 2012 KPU 2012
82%
81% 81%
KPU 2010 KPU 2011 KPU 2012
76% 69%
StronglyAgree/Agree
StronglyAgree/Agree
StronglyAgree/Agree
2009 2011 2013
60
99 104
53
71 72
2011 2012 2013 2011 2012 2013
Inbound Students Outbound Students
23 18
27
2011 2012 2013
Field Schools
2013 data
will be
collected
this fall.

7
III. Measures of Retention
Retention rates for open and selective entry
baccalaureate programs
Retention rates for open and selective entry
Non-baccalaureate programs
Retention – new students first to second semester.
Retention rates for trades and
developmental programs
Retention of first semester students to
the following academic year
90% of baccalaureate students in a limited-entry
program are retained the following year.
72% of baccalaureate students in an open access
program are retained the following year.
65% of non-baccalaureate students in a limited-
entry program are retained the following year.
62% of non-baccalaureate students in an open
access program are retained the following year.
68% of trades student are retained in the following
year.
40% of developmental student are retained in the
following year.
IV. Measures of Learner Engagement
National Survey of Student Engagement is being conducted in
2014. Results will be available in late summer 2014.
90% 83% 81% 79%
72%
55% 46% 45%
1 yr. 2 yrs. 3 yrs. 4 yrs.
Limited Entry Baccalaureate ProgramsOpen Access Baccalaureate Programs
65% 72% 70%
62%
44% 35%
1 yr. 2 yrs. 3 yrs.
Limited Entry Non-Baccalaureate Programs
Open Access Non-Baccalaureate Programs
68% 76%
81%
40%
25% 23% 24%
Trades Programs Developmental Programs
Learner engagement and
retention at KPU show
continuous improvement.
8
V. Measures of Continuous Quality
Improvement
Successful implementation (report on action and
measurable change) of plans identified in VISION 2018
Academic Plan – Consultation sessions are being
held to in late Septembers to early October to obtain
input on the draft Academic Plan. The plan is
scheduled to go to Senate for endorsement in
December/ January.
The Academic Plan defines KPU’s polytechnic
university character, describes the role of faculty and
staff in shaping the academic endeavour, and
highlights distinctive elements of campus identities
that are shaping KPU’s community engagement
strategies.
Teaching and Learning Plan (including the role of
instructional technologies) - The Vice Provost
Teaching and Learning has begun to develop the
Institute for Innovation and Scholarship in Teaching
and Learning.
Research and Scholarship Plan - Consultations, in
the form of publicly posted questions on the future of
Research and Scholarship at KPU, will be held in early
October through mid-November. Select questions will
also be sent to community partners and industry. The
Associate Vice President Research will convene a
panel with representation from Deans, senior
scholars, aspiring scholars and students to discuss
the feedback from the questions, and formulate a
plan for KPU’s Research and Scholarship.
Strategic Enrolment Management Plan – Noel Levitz
Enrolment Consultants have conducted a situational
Analysis for KPU and provided recommendations for
moving forward.
Successful development and implementation of
service unit plans that align with VISION 2018
Planning workshops are being held in October 2013 to
support unit leaders to develop operational plans that align
with VISION 2018 and the Academic Plan.
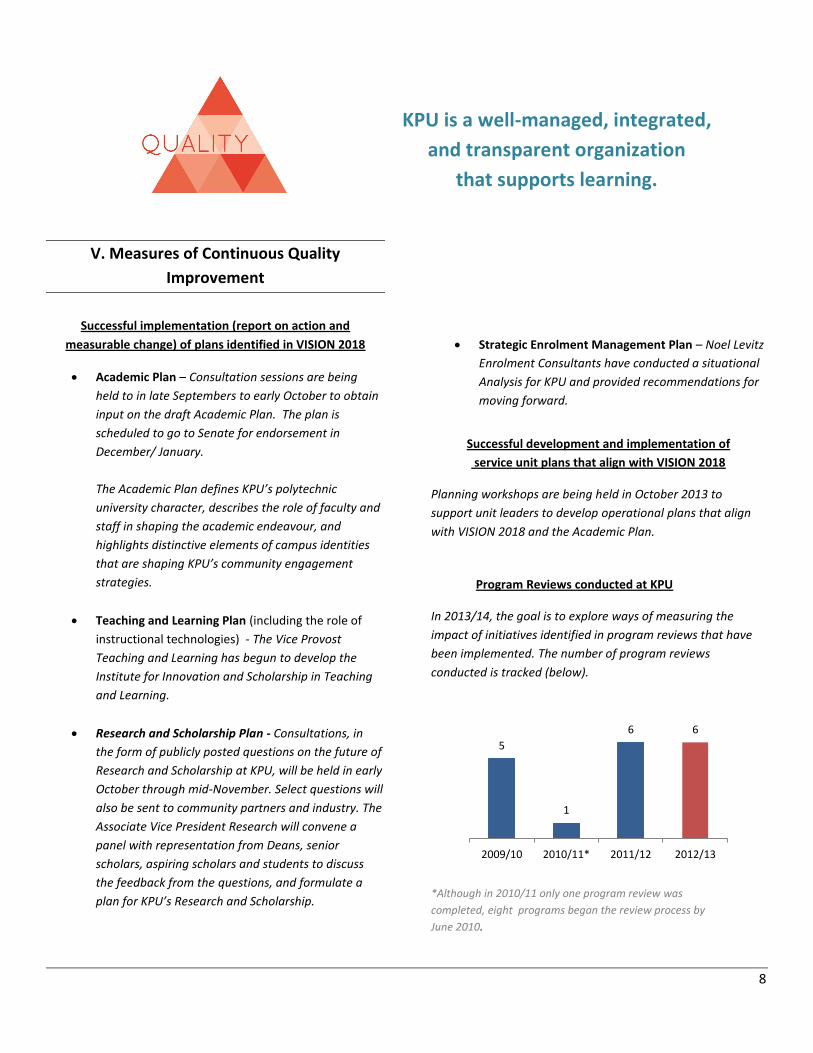
Program Reviews conducted at KPU
In 2013/14, the goal is to explore ways of measuring the
impact of initiatives identified in program reviews that have
been implemented. The number of program reviews
conducted is tracked (below).
*Although in 2010/11 only one program review was
completed, eight programs began the review process by
June 2010.
5
1
6 6
2009/10 2010/11* 2011/12 2012/13
KPU is a well-managed, integrated,
and transparent organization
that supports learning.
9
Service Reviews conducted at KPU
Service Reviews have been conducted in an ad-hoc manner in
the last few years. However, there is no formalized Service
Review process at KPU.
Continuous improvement processes taking place at KPU
A Process Improvement/Lean Steering committee was
formed to prioritize, support and sustain cross institutional
improvement initiatives. High priority projects have been
identified and improvement workshops are being conducted
at KPU.
Lean Thinking provides the enabling framework for the
University to ‘do things differently’ in order to achieve
sustainable growth and quality in an environment of
increasing financial constraint. Lean Thinking principles and
tools can be applied towards increasing the efficiency and
effectiveness of University operations by eliminating waste
and continuous improvement while focusing on maximizing
value to the University’s students, faculty, staff and
community.
Status of Lean initiatives at KPU
5 in process
3 accepted
5 defined
1 rejected
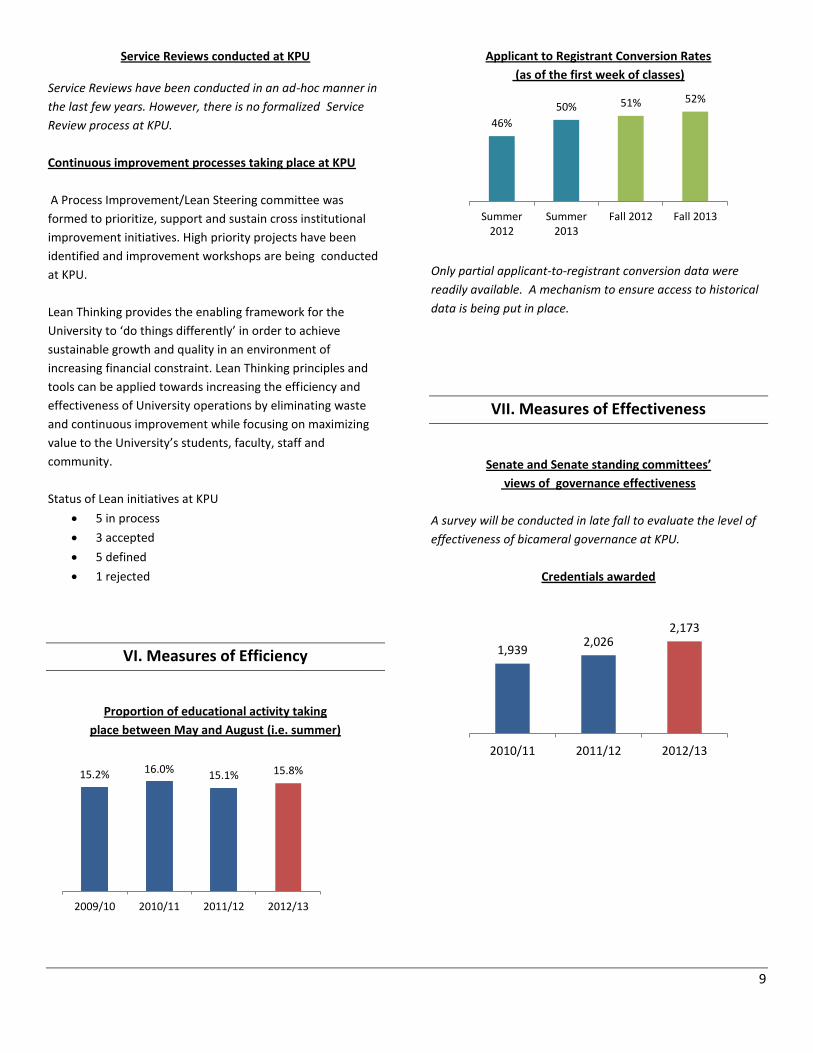
VI. Measures of Efficiency
Proportion of educational activity taking
place between May and August (i.e. summer)
Applicant to Registrant Conversion Rates
(as of the first week of classes)
Only partial applicant-to-registrant conversion data were
readily available. A mechanism to ensure access to historical
data is being put in place.
VII. Measures of Effectiveness
Senate and Senate standing committees’
views of governance effectiveness
A survey will be conducted in late fall to evaluate the level of
effectiveness of bicameral governance at KPU.
Credentials awarded
15.2% 16.0% 15.1% 15.8%
2009/10 2010/11 2011/12 2012/13
46%
50% 51% 52%
Summer2012
Summer2013
Fall 2012 Fall 2013
1,939 2,026
2,173
2010/11 2011/12 2012/13

10
VIII. Measures of Sustainability
GHG emission - reduction levels in tonnesiii
KPU currently has a target for GHG reduction levels
to be 487 tonnes by 2016. Figures are adjusted for
weather conditions.
Energy density levels of electricity (eGJ/m2)
iv
KPU currently has a target to maintain
levels at 0.85 eGJ/m2. Figures are adjusted for
weather conditions.
Employees’ options regarding environmental
sustainability at KPU in 2013.v
This is the first year the following questions are asked in the
KPU Employee Survey.
58% of employees who responded to the 2013
Employee Survey agreed or strongly agreed that
there are effective structures in place to make
environmentally friendly choice at KPU (e.g. recycling,
reducing waste, using more environmentally friendly
products, providing sustainable transportation
options.)
70% agreed or strongly agreed that they choose
environmentally friendly options in their day-to-day
decisions at work (e.g. purchase environmentally friendly
products, reduce travel between campuses, and minimize
waste and energy consumption).
Students’ options regarding environmental
sustainability at KPU in 2013.
Questions related to KPU’’s commitment to sustainability will
be asked in the KPU Student Satisfaction Survey this fall.
IX. Measures of Financial Health
Government Grant per funded FTEvi
Operating Costs as a proportion
of non-goventment revenue sourcesvii
391
34
498
2010/11 2011/12 2012/13
tonnes tonnes
tonnes
0.8
0.91
0.87
2010/11 2011/12 2012/13
eGJ/m2
eGJ/m2
eGJ/m2
$8,120 $8,043
$8,135
$/FTE2010/11
$/FTE2011/12
$/FTE2012/13
51.1% 51.6% 50.1%
2010/11 2011/12 2012/13
Other measures of sustainability TBD
11
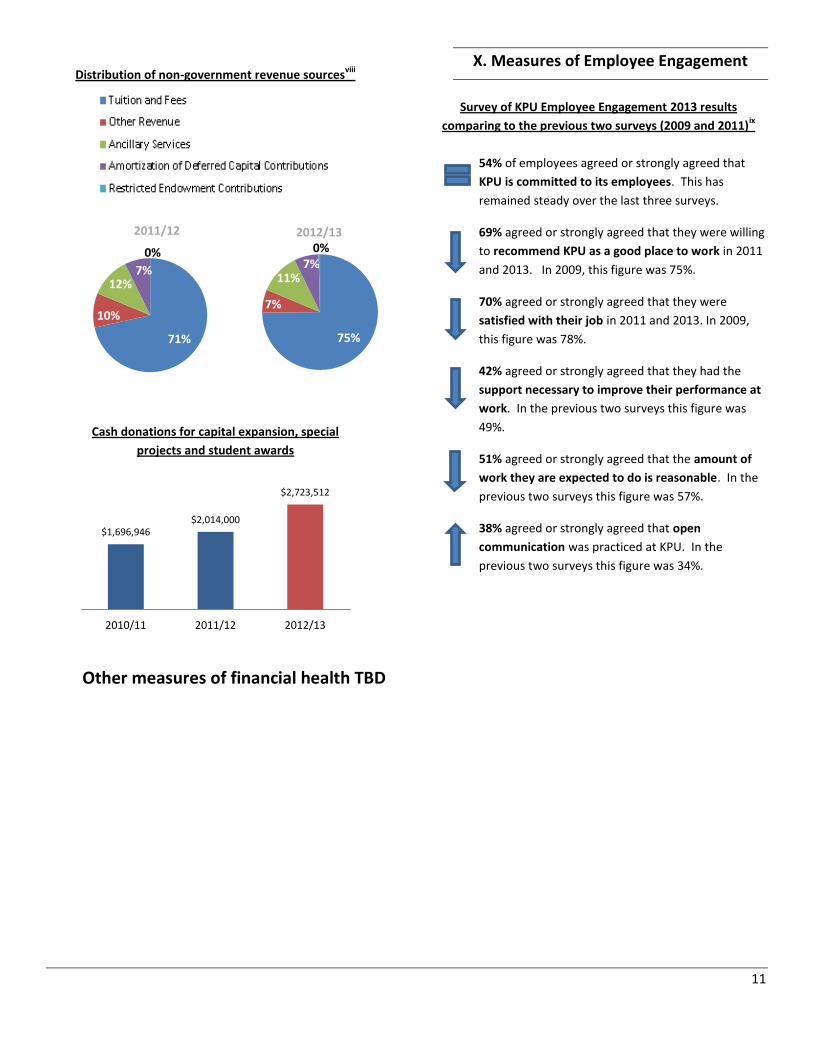
75%
7%
11% 7%
0% 2012/13
71%
10%
12% 7%
0%
2011/12
Distribution of non-government revenue sourcesviii
Cash donations for capital expansion, special
projects and student awards
X. Measures of Employee Engagement
Survey of KPU Employee Engagement 2013 results
comparing to the previous two surveys (2009 and 2011)ix
54% of employees agreed or strongly agreed that
KPU is committed to its employees. This has
remained steady over the last three surveys.
69% agreed or strongly agreed that they were willing
to recommend KPU as a good place to work in 2011
and 2013. In 2009, this figure was 75%.
70% agreed or strongly agreed that they were
satisfied with their job in 2011 and 2013. In 2009,
this figure was 78%.
42% agreed or strongly agreed that they had the
support necessary to improve their performance at
work. In the previous two surveys this figure was
49%.
51% agreed or strongly agreed that the amount of
work they are expected to do is reasonable. In the
previous two surveys this figure was 57%.
38% agreed or strongly agreed that open
communication was practiced at KPU. In the
previous two surveys this figure was 34%.
$1,696,946 $2,014,000
$2,723,512
2010/11 2011/12 2012/13
Other measures of financial health TBD
12
KPU’s unique identity is clearly
articulated and well understood across
the University and beyond.
Includes measures of:
III. Identify
KPU is widely recognized for its
teaching and its scholarship.
Includes measures of:
I. Teaching Quality
II. Scholarly Activity
KPU is the foremost provide of
continuing and professional education
in the region.
Includes measures of:
IV. Continuing Education
13
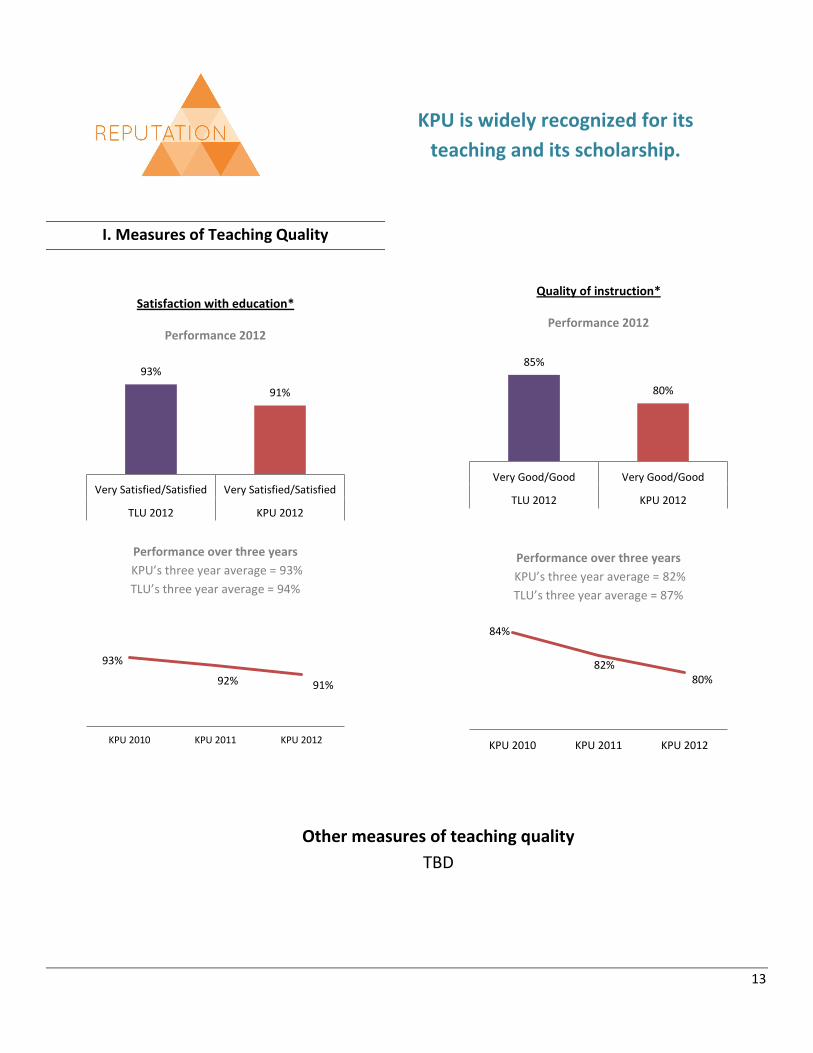
I. Measures of Teaching Quality
Satisfaction with education*
Performance 2012
Performance over three years
KPU’s three year average = 93%
TLU’s three year average = 94%
Quality of instruction*
Performance 2012
Performance over three years
KPU’s three year average = 82%
TLU’s three year average = 87%
93%
91%
Very Satisfied/Satisfied Very Satisfied/Satisfied
TLU 2012 KPU 2012
93%
92% 91%
KPU 2010 KPU 2011 KPU 2012
85%
80%
Very Good/Good Very Good/Good
TLU 2012 KPU 2012
84%
82% 80%
KPU 2010 KPU 2011 KPU 2012
KPU is widely recognized for its
teaching and its scholarship.
Other measures of teaching quality
TBD

14
II. Measures of Scholarly Activity
$ Received from sponsored research initiativesx
Identifying other measures of scholarly activity is dependent
on defining the dimension that will be tracked and the
development of the Research and Scholarship Plan. A likely
measure will be the publication and dissemination of scholarly
activity.
$578,806
$941,958 $991,243
2010/11 2011/12 2012/13

15
III. Measures of Identity
Community’s awareness and understanding
of KPU and its programs
A ten minute phone survey of the KPU region with a sample
size of 500 costs approximately $20,000.
Employee ratings of KPU’s reputation in the community in
2009, 2011 and 2013 xi
47% of employees agreed or strongly agreed that
KPU has a good reputation in the community. This
figure has consistently dropped; from 58% in 2009
and 50% in 2011.
46% agreed or strongly agreed that a clear vision for
KPU’s future direction has been articulated. This is
higher than in 2011 (42%) but lower than 2009 (48%)
Number and $ value of public relations hits
KPU has a system that reports the PR hits and their dollar
value. A mechanism for aggregating this data is being
explored.
KPU’s unique identity is clearly
articulated and well understood
across the University and beyond.
Other measures of identity
TBD

16
IV. Measures of Continuing Education
Student Headcount in Continuing and
Professional Studies Programs
The defining the distinction between Continuing Studies and
Professional Studies is currently in process.
Other measure of continuing education will be developed that
account for the proportion of the adult population in the
region.
286 242 324
803
962 947
2010/11 2011/12 2012/13
Continuing Studies Professional Studies
KPU is the foremost provide of
continuing and professional
education in the region.

17
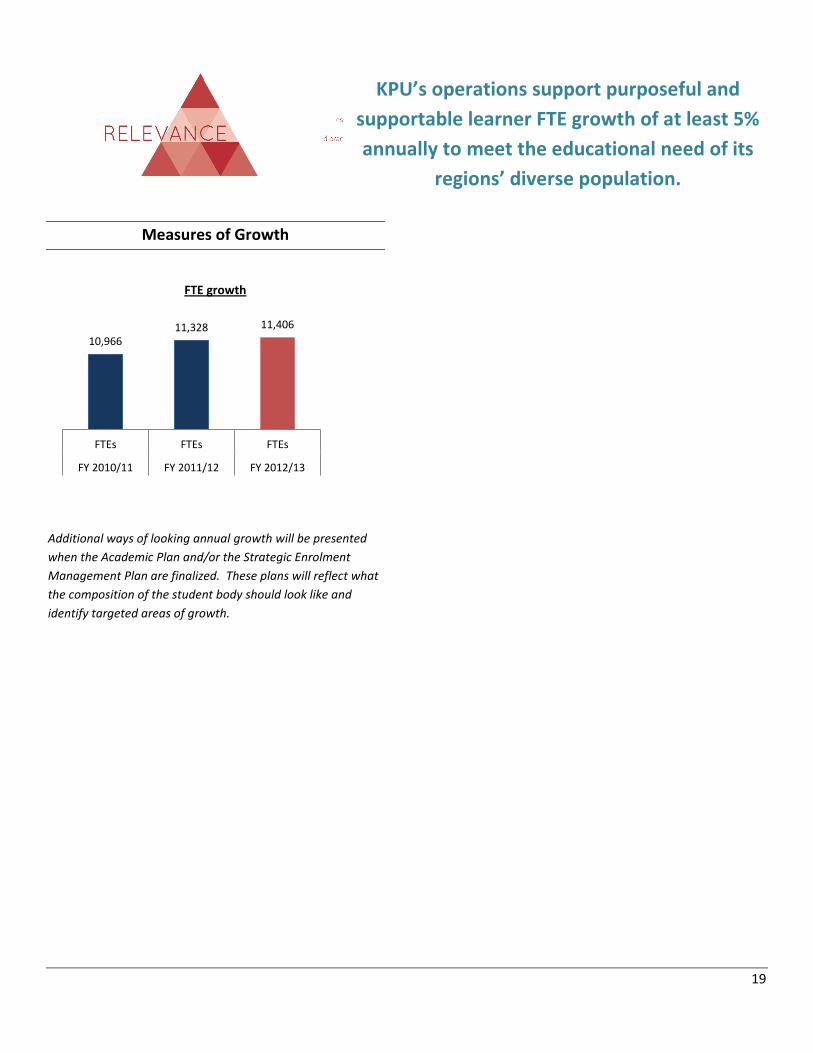
KPU’s operations support purposeful
and supportable learner FTE growth of
at least 5% annually to meet the
educational need of its regions’
diverse population.
Includes measures of:
II. Growth
The impact of KPU’s community
engagement has doubled by 2018.
Includes measures of:
I. Community Engagement
Experiential learning is integrated into
every KPU program, connecting
theory to application and
the classroom to the community.
Includes measures of:
III. Experiential Learning
18
Measures of Community Engagement
Community engagement is in the process of being defined in
consultation with KPU’s External Advisory Committee.
The impact of KPU’s
community engagement has
doubled by 2018.
19
Measures of Growth
FTE growth
Additional ways of looking annual growth will be presented
when the Academic Plan and/or the Strategic Enrolment
Management Plan are finalized. These plans will reflect what
the composition of the student body should look like and
identify targeted areas of growth.
10,966 11,328 11,406
FTEs FTEs FTEs
FY 2010/11 FY 2011/12 FY 2012/13
KPU’s operations support purposeful and
supportable learner FTE growth of at least 5%
annually to meet the educational need of its
regions’ diverse population.

20
Measures of Experiential Learning
Number of Work Integrated Learning Experiencexii
Other measures of experiential
learning TBD with the development
of the Academic Plan
4,239 4,855
6,315
2010/11 2011/12 2012/13
Experiential learning is integrated into
every KPU program, connecting
theory to application and
the classroom to the community.

21
ENDNOTES
i Source: KPU Student Satisfaction Survey. Sample size in 2009: 1,222 and in 2011: 667. The 2013 survey will be conducted in October 2013. The National Survey of Student Engagement also captures data related to this measure. NSSE will be administered for in the spring of 201 and the data will be available in late summer 2014. ii Percentage of international student headcount to total
student headcount for academic year. iii This measure is included in the annual Accountability Plan.
The target is toreduce GHG emission (tonnes) using weather adjusted calculations for energy use. The reduction target for 2016 is a 487 tonnes reduction. iv This measure is included in the annual Accountability Plan.
The target is to maintain energy density levels at 0.85 eGJ/m2
using weather adjusted calculations for energy use. v 2013 is the first time these questions are asked in the
Employee Survey. vi This includes the government grant by the FTE target for
KPU. FTE figures exclude international and ITA . The grant amount excludes ITA funding. vii
Non-government revenue sources include: tuition and fees, other revenue: ancillary services, amortization of deferred capital contributions restricted endowment contributions. Source: Institutional Accountability Plan Summary Financial Report. viii
Two years of data are available in the new reporting format. ix Source: KPU Employee Survey. Response rates: 2009: 32.5%
, 2011: 42.5%, 2013:50% x For example, agencies, industry and research councils
xi Source: KPU Survey of Student Engagement
xii Includes co-op education, internships, practicums, work
placements, apprenticeships, service learning, school projects that connect to community organization. Note that in 2012/13, the tracking method was refined which partially explains the significant jump in 2012/13.
Top Related