


Languages
Pages
Legal

ABANYAN TREE
Banyan Tree Holdings Limited 4Q13 & FY13 Results Briefing
ABANYAN TREE
4Q13 & FY13 Results Briefing
ABANYAN TREE
This document is provided to you for information only and should not be relied on or used as a basis for making any specific investment, businessor commercial decision. No representation or warranty, expressed or implied, is made as to, and no reliance should be placed on, the informationor opinions contained herein. This document does not constitute and should not be construed as, any offer or solicitation for the subscription,purchase or sale of any securities of Banyan Tree Holdings Limited (“Banyan Tree”). Nothing in this document should be construed as arecommendation regarding the securities of Banyan Tree.
Certain statements in this document may constitute "forward-looking statements”, including statements regarding, amongst other things, BanyanTree’s business and growth strategy. These statements reflect Banyan Tree’s expectations and are subject to risks and uncertainties that maycause actual results to differ materially and may adversely affect the outcome and financial effects of the plans described herein. You arecautioned not to rely on such forward-looking statements. Banyan Tree disclaims any obligation to update their view of such risks anduncertainties or to publicly announce the result of any revisions to the forward-looking statements made herein, except where they would berequired to do so under applicable law.
Banyan Tree is under no obligation to keep current the information contained in this document and any opinions expressed in it are subject tochange without notice. None of Banyan Tree or any of its affiliates, advisers or representatives shall have any liability whatsoever for any loss
Disclaimer
2
change without notice. None of Banyan Tree or any of its affiliates, advisers or representatives shall have any liability whatsoever for any losswhatsoever arising from any use of this document or its contents, or otherwise arising in connection with this document (whether direct, indirect,consequential or other). This document is not intended to provide professional advice and should not be relied upon in that regard. Prospectiveinvestors should consult their tax, legal, accounting or other advisers.
The information in this document is given in confidence and reproduction of this document, in whole or in part, or disclosure of any of its contents,without prior consent of Banyan Tree, is prohibited. This document remains the property of Banyan Tree and on request must be returned andany copies destroyed.
ABANYAN TREE
Agenda
1. Overview Eddy See
2. Property Business Eddy See
3. Hotel & Fee-Based Business Abid Butt
3
3. Hotel & Fee-Based Business Abid Butt
ABANYAN TREE
Overview
4
ABANYAN TREE
Overview
Revenue stable at S$97.9m mainly due to:
Group Financial Highlights
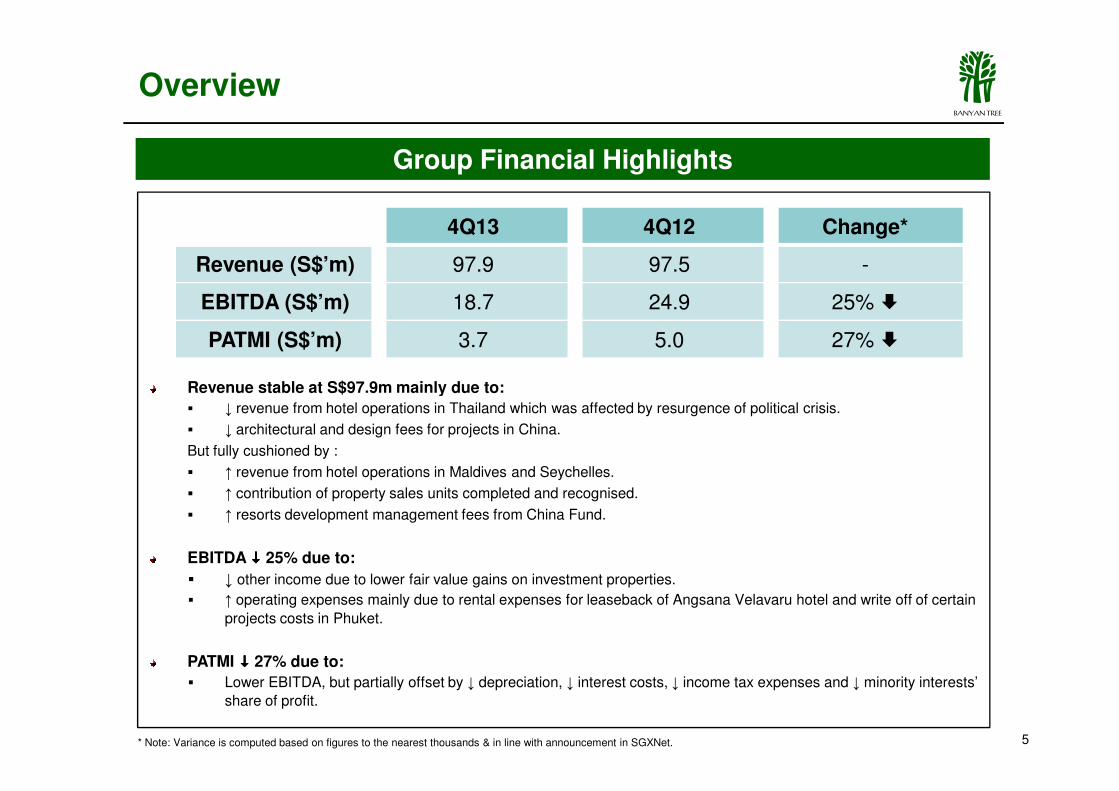
4Q13 4Q12 Change*
Revenue (S$’m) 97.9 97.5 -
EBITDA (S$’m) 18.7 24.9 25% �
PATMI (S$’m) 3.7 5.0 27% �
5
Revenue stable at S$97.9m mainly due to:
� ↓ revenue from hotel operations in Thailand which was affected by resurgence of political crisis.
� ↓ architectural and design fees for projects in China.
But fully cushioned by :
� ↑ revenue from hotel operations in Maldives and Seychelles.
� ↑ contribution of property sales units completed and recognised.
� ↑ resorts development management fees from China Fund.
EBITDA ���� 25% due to:
� ↓ other income due to lower fair value gains on investment properties.
� ↑ operating expenses mainly due to rental expenses for leaseback of Angsana Velavaru hotel and write off of certain
projects costs in Phuket.
PATMI ���� 27% due to:
� Lower EBITDA, but partially offset by ↓ depreciation, ↓ interest costs, ↓ income tax expenses and ↓ minority interests’
share of profit.
* Note: Variance is computed based on figures to the nearest thousands & in line with announcement in SGXNet.
ABANYAN TREE
Revenue (S$’m)
EBITDA (S$’m)
PATMI (S$’m)
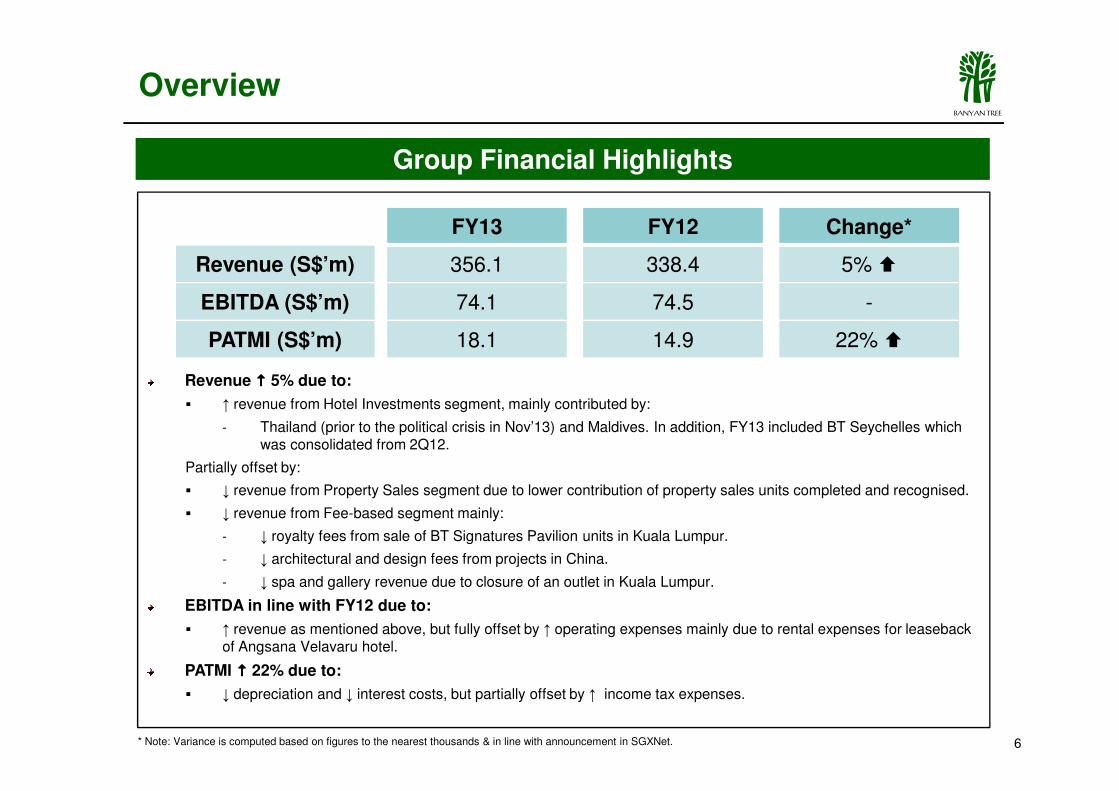
FY13
356.1
74.1
18.1
FY12
338.4
74.5
14.9
Change*
5% �
-
22% �
Revenue ���� 5% due to:
Group Financial Highlights
Overview
6* Note: Variance is computed based on figures to the nearest thousands & in line with announcement in SGXNet.
� ↑ revenue from Hotel Investments segment, mainly contributed by:
- Thailand (prior to the political crisis in Nov’13) and Maldives. In addition, FY13 included BT Seychelles which was consolidated from 2Q12.
Partially offset by:
� ↓ revenue from Property Sales segment due to lower contribution of property sales units completed and recognised.
� ↓ revenue from Fee-based segment mainly:
- ↓ royalty fees from sale of BT Signatures Pavilion units in Kuala Lumpur.
- ↓ architectural and design fees from projects in China.
- ↓ spa and gallery revenue due to closure of an outlet in Kuala Lumpur.
EBITDA in line with FY12 due to:
� ↑ revenue as mentioned above, but fully offset by ↑ operating expenses mainly due to rental expenses for leaseback of Angsana Velavaru hotel.
PATMI ���� 22% due to:
� ↓ depreciation and ↓ interest costs, but partially offset by ↑ income tax expenses.
ABANYAN TREE
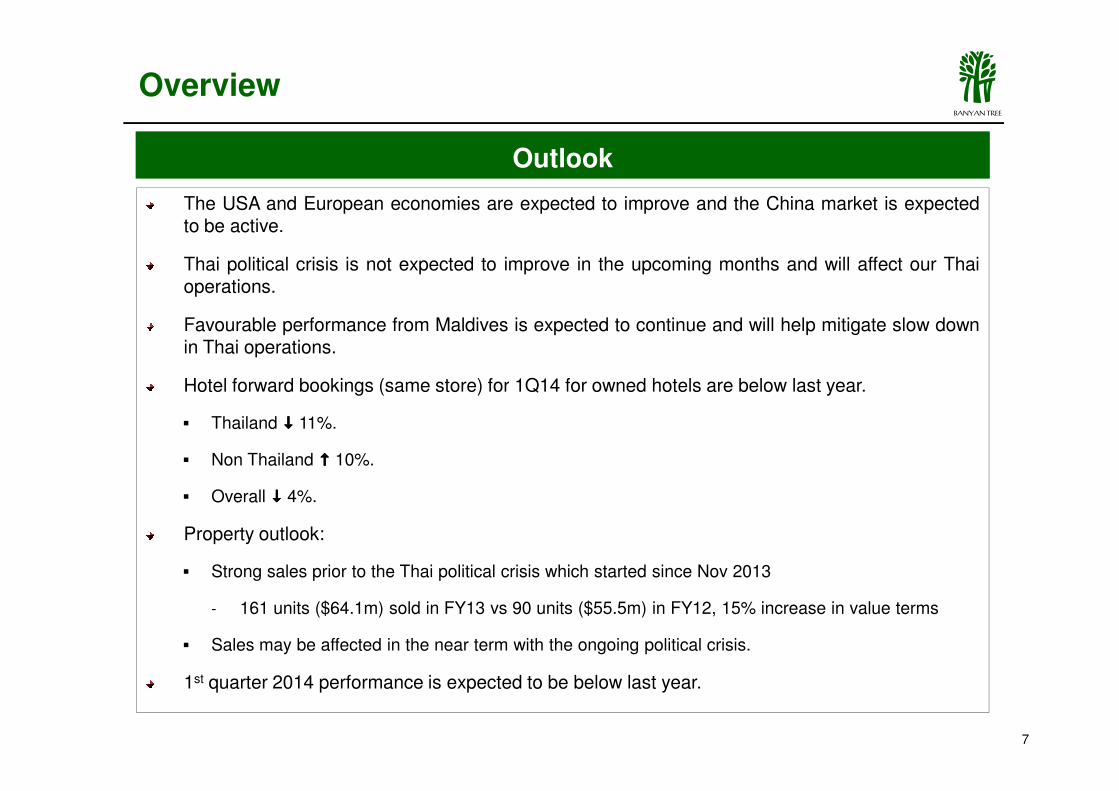
The USA and European economies are expected to improve and the China market is expectedto be active.
Thai political crisis is not expected to improve in the upcoming months and will affect our Thaioperations.
Favourable performance from Maldives is expected to continue and will help mitigate slow downin Thai operations.
Hotel forward bookings (same store) for 1Q14 for owned hotels are below last year.
Outlook
Overview
7
Hotel forward bookings (same store) for 1Q14 for owned hotels are below last year.
� Thailand ���� 11%.
� Non Thailand ���� 10%.
� Overall ���� 4%.
Property outlook:
� Strong sales prior to the Thai political crisis which started since Nov 2013
- 161 units ($64.1m) sold in FY13 vs 90 units ($55.5m) in FY12, 15% increase in value terms
� Sales may be affected in the near term with the ongoing political crisis.
1st quarter 2014 performance is expected to be below last year.
ABANYAN TREE
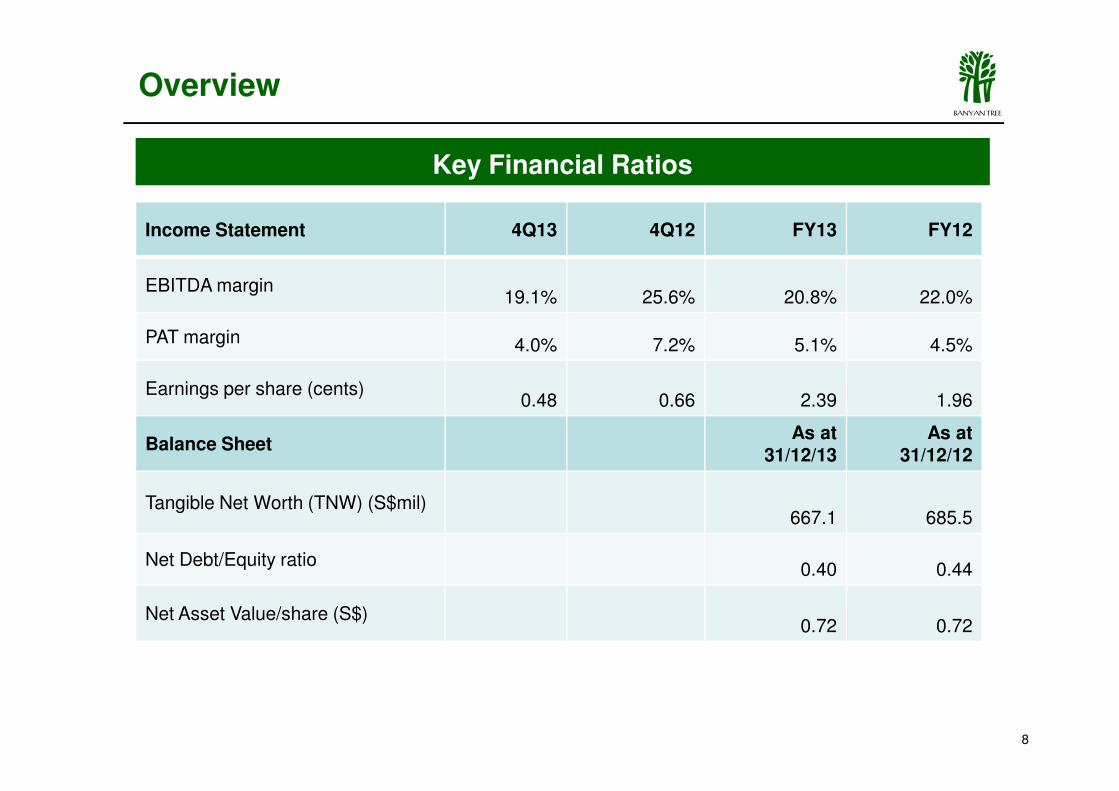
Key Financial Ratios
Income Statement 4Q13 4Q12 FY13 FY12
EBITDA margin19.1% 25.6% 20.8% 22.0%
PAT margin 4.0% 7.2% 5.1% 4.5%
Earnings per share (cents)0.48 0.66 2.39 1.96
Overview
8
Earnings per share (cents)0.48 0.66 2.39 1.96
Balance SheetAs at
31/12/13As at
31/12/12
Tangible Net Worth (TNW) (S$mil)667.1 685.5
Net Debt/Equity ratio0.40 0.44
Net Asset Value/share (S$)0.72 0.72
ABANYAN TREE
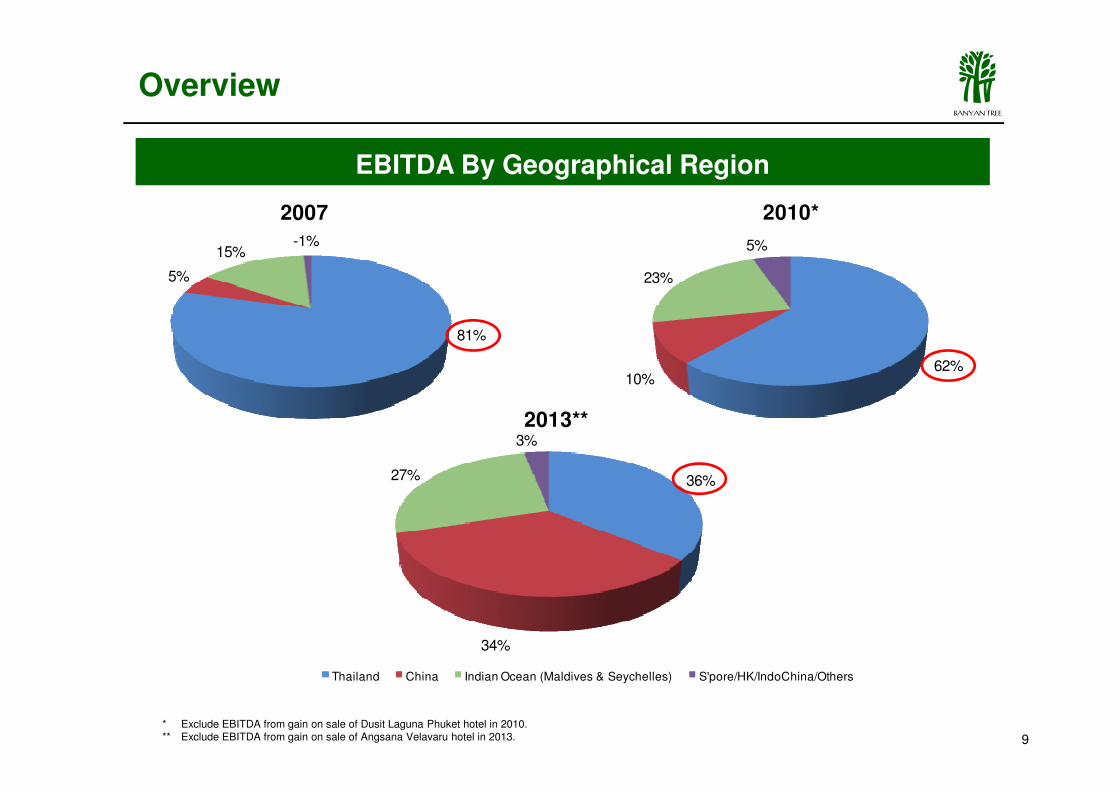
EBITDA By Geographical Region
81%
5%
15%-1%
2007
0
62%10%
23%
5%
2010*
Overview
9
0
36%
34%
27%
3%
2013**
Thailand China Indian Ocean (Maldives & Seychelles) S'pore/HK/IndoChina/Others
* Exclude EBITDA from gain on sale of Dusit Laguna Phuket hotel in 2010.** Exclude EBITDA from gain on sale of Angsana Velavaru hotel in 2013.
ABANYAN TREE
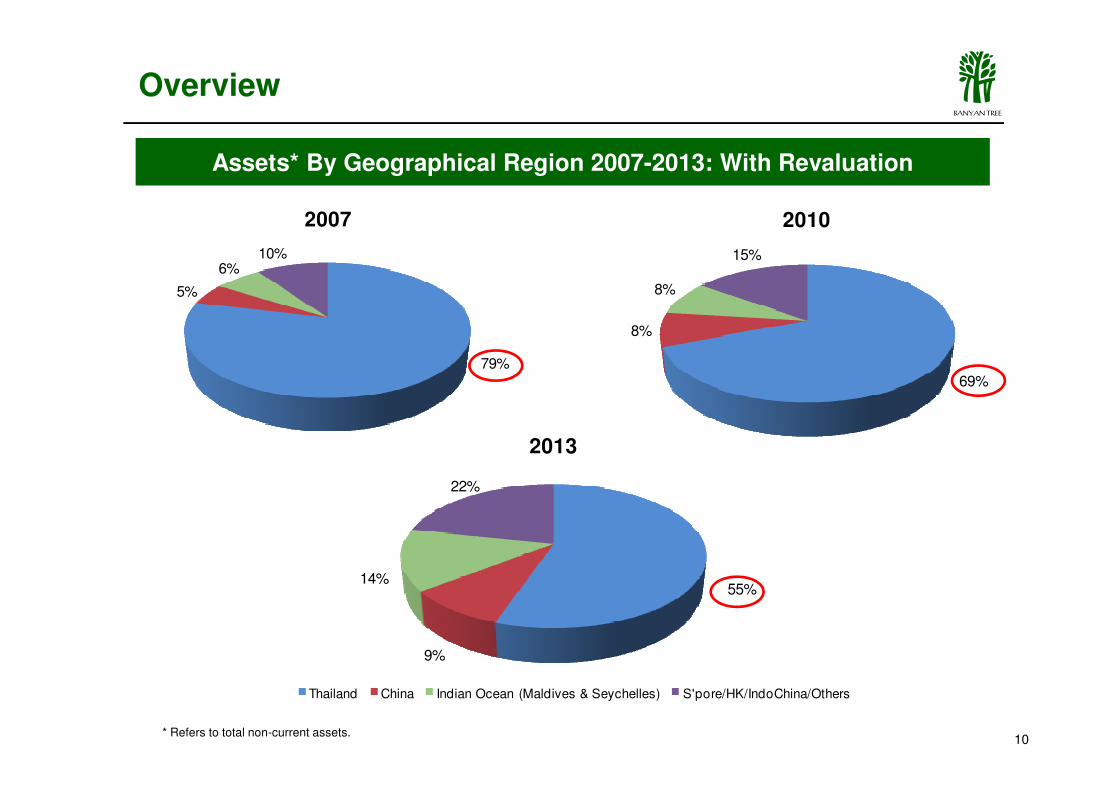
Assets* By Geographical Region 2007-2013: With Revaluation
79%
5%
6%10%
2007
69%
8%
8%
15%
2010
Overview
10
55%
9%
14%
22%
2013
Thailand China Indian Ocean (Maldives & Seychelles) S'pore/HK/IndoChina/Others
* Refers to total non-current assets.
ABANYAN TREE
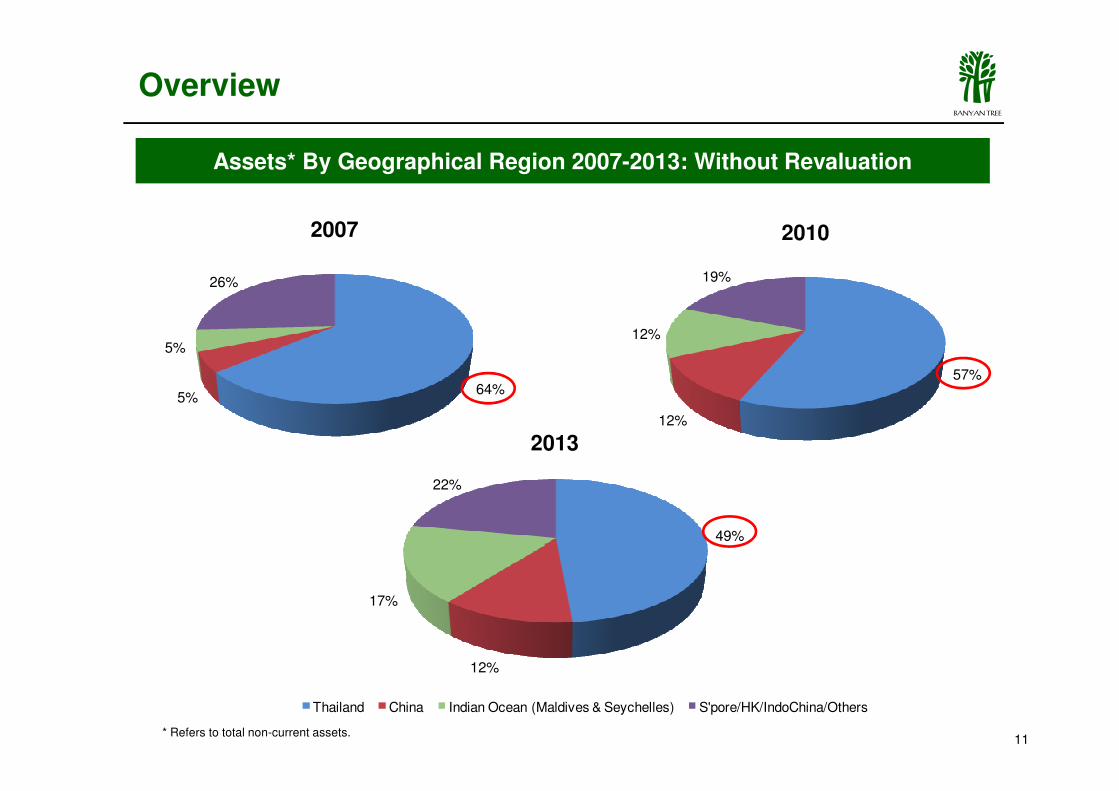
Assets* By Geographical Region 2007-2013: Without Revaluation
64%5%
5%
26%
2007
57%
12%
19%
2010
Overview
11
64%5%
49%
12%
17%
22%
2013
Thailand China Indian Ocean (Maldives & Seychelles) S'pore/HK/IndoChina/Others
12%
* Refers to total non-current assets.
ABANYAN TREE
Property Business
12
ABANYAN TREE
EBITDA Highlights
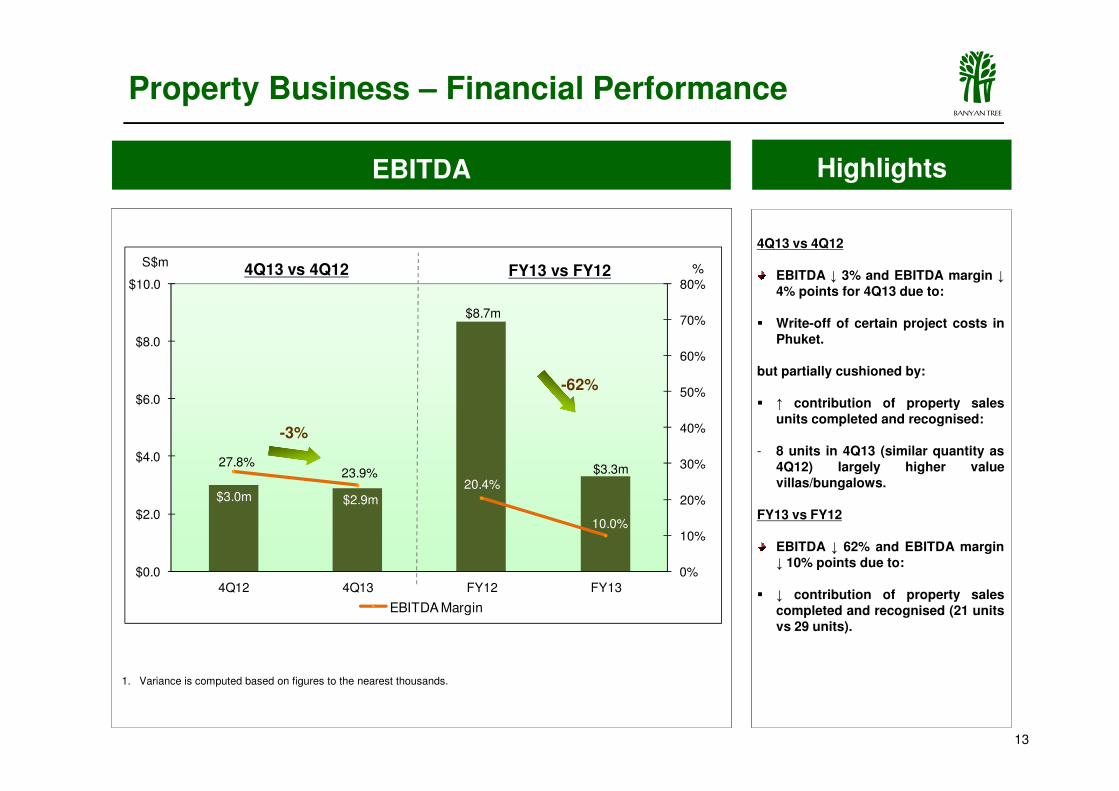
4Q13 vs 4Q12
EBITDA ↓ 3% and EBITDA margin ↓4% points for 4Q13 due to:
� Write-off of certain project costs inPhuket.
but partially cushioned by:
↑ contribution of property sales
$8.7m
50%
60%
70%
80%
$6.0
$8.0
$10.0
S$m%
-62%
FY13 vs FY124Q13 vs 4Q12
Property Business – Financial Performance
13
1. Variance is computed based on figures to the nearest thousands.
� ↑ contribution of property salesunits completed and recognised:
- 8 units in 4Q13 (similar quantity as4Q12) largely higher valuevillas/bungalows.
FY13 vs FY12
EBITDA ↓ 62% and EBITDA margin↓ 10% points due to:
� ↓ contribution of property salescompleted and recognised (21 unitsvs 29 units).
$3.0m $2.9m
$3.3m27.8%
23.9%20.4%
10.0%
0%
10%
20%
30%
40%
50%
$0.0
$2.0
$4.0
$6.0
4Q12 4Q13 FY12 FY13
EBITDA Margin
-3%
ABANYAN TREE
Property Business – Hotel Residences
Sales Progress Highlights
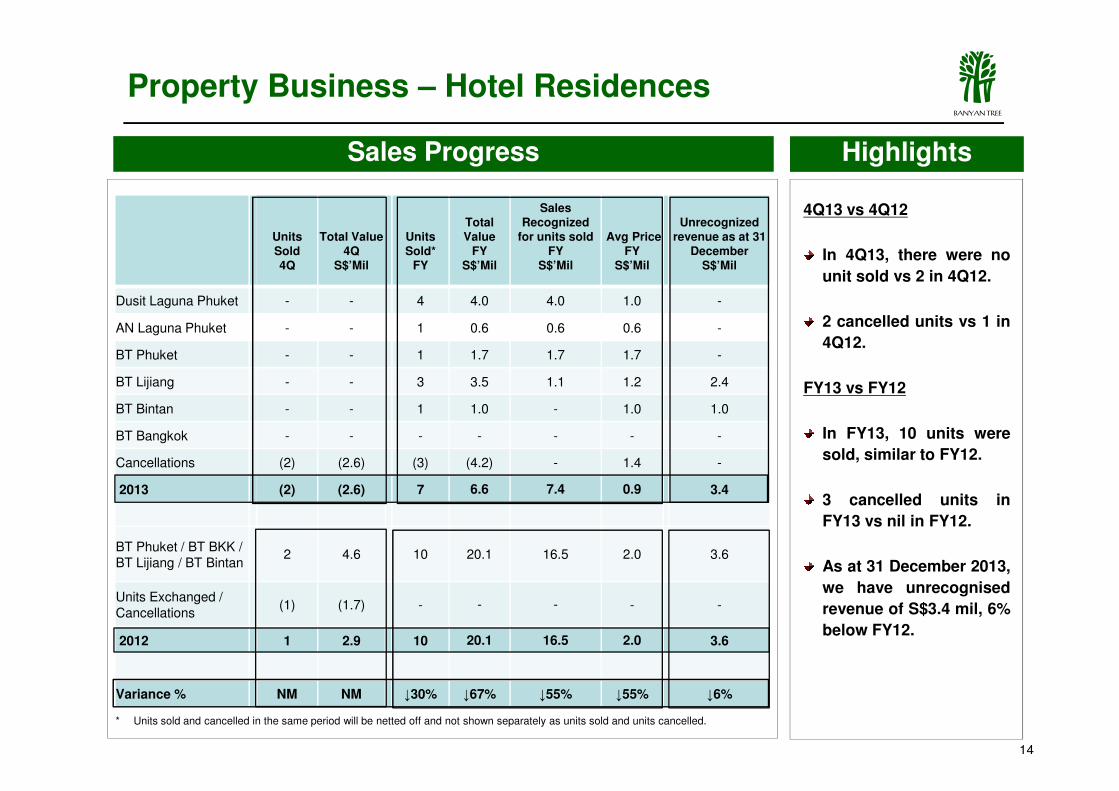
4Q13 vs 4Q12
In 4Q13, there were no
unit sold vs 2 in 4Q12.
2 cancelled units vs 1 in
4Q12.
FY13 vs FY12
Units Sold 4Q
Total Value 4Q
S$’Mil
Units Sold*
FY
Total Value
FYS$’Mil
Sales Recognized
for units sold FY
S$’Mil
Avg Price FY
S$’Mil
Unrecognized revenue as at 31
DecemberS$’Mil
Dusit Laguna Phuket - - 4 4.0 4.0 1.0 -
AN Laguna Phuket - - 1 0.6 0.6 0.6 -
BT Phuket - - 1 1.7 1.7 1.7 -
BT Lijiang - - 3 3.5 1.1 1.2 2.4
14
* Units sold and cancelled in the same period will be netted off and not shown separately as units sold and units cancelled.
FY13 vs FY12
In FY13, 10 units were
sold, similar to FY12.
3 cancelled units in
FY13 vs nil in FY12.
As at 31 December 2013,
we have unrecognised
revenue of S$3.4 mil, 6%
below FY12.
BT Bintan - - 1 1.0 - 1.0 1.0
BT Bangkok - - - - - - -
Cancellations (2) (2.6) (3) (4.2) - 1.4 -
2013 (2) (2.6) 7 6.6 7.4 0.9 3.4
BT Phuket / BT BKK / BT Lijiang / BT Bintan
2 4.6 10 20.1 16.5 2.0 3.6
Units Exchanged / Cancellations
(1) (1.7) - - - - -
2012 1 2.9 10 20.1 16.5 2.0 3.6
Variance % NM NM ↓30% ↓67% ↓55% ↓55% ↓6%
ABANYAN TREE
Sales Progress Highlights
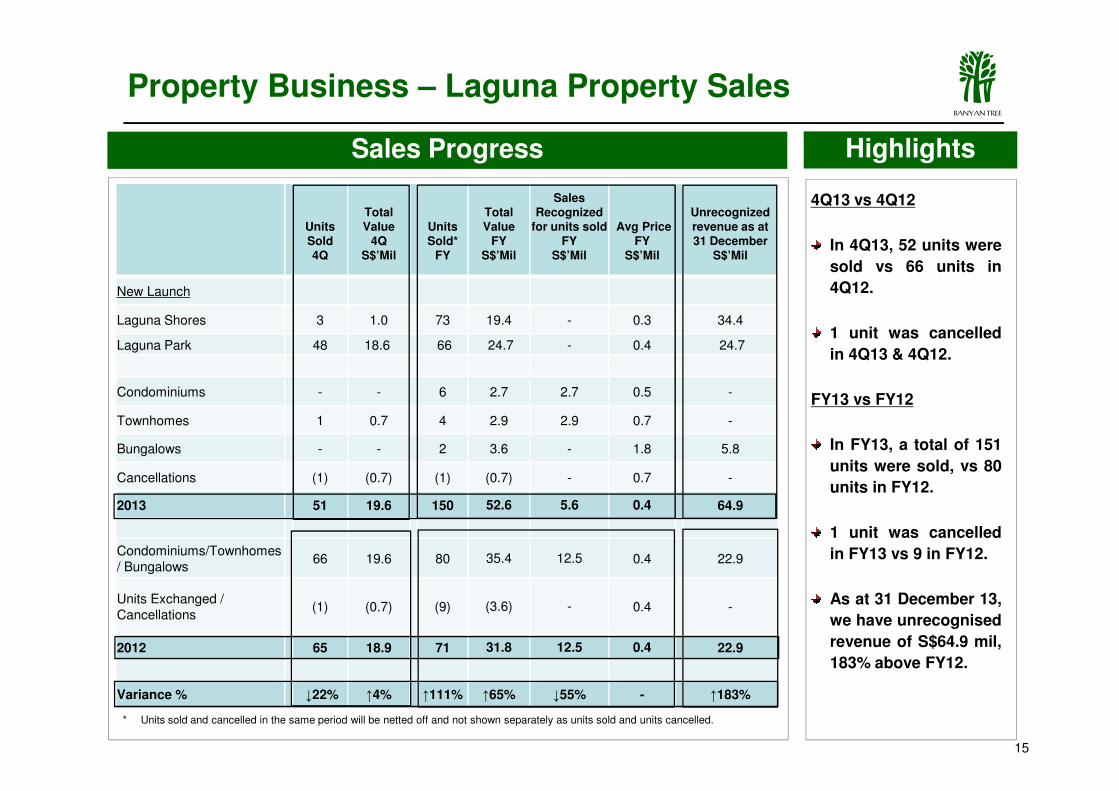
4Q13 vs 4Q12
In 4Q13, 52 units were
sold vs 66 units in
4Q12.
1 unit was cancelled
in 4Q13 & 4Q12.
FY13 vs FY12
Units Sold4Q
Total Value
4QS$’Mil
Units Sold*
FY
Total Value
FYS$’Mil
Sales Recognized
for units soldFY
S$’Mil
Avg PriceFY
S$’Mil
Unrecognized revenue as at 31 December
S$’Mil
New Launch
Laguna Shores 3 1.0 73 19.4 - 0.3 34.4
Laguna Park 48 18.6 66 24.7 - 0.4 24.7
Condominiums - - 6 2.7 2.7 0.5 -
Property Business – Laguna Property Sales
15
* Units sold and cancelled in the same period will be netted off and not shown separately as units sold and units cancelled.
FY13 vs FY12
In FY13, a total of 151
units were sold, vs 80
units in FY12.
1 unit was cancelled
in FY13 vs 9 in FY12.
As at 31 December 13,
we have unrecognised
revenue of S$64.9 mil,
183% above FY12.
Condominiums - - 6 2.7 2.7 0.5 -
Townhomes 1 0.7 4 2.9 2.9 0.7 -
Bungalows - - 2 3.6 - 1.8 5.8
Cancellations (1) (0.7) (1) (0.7) - 0.7 -
2013 51 19.6 150 52.6 5.6 0.4 64.9
Condominiums/Townhomes/ Bungalows
66 19.6 80 35.4 12.5 0.4 22.9
Units Exchanged / Cancellations
(1) (0.7) (9) (3.6) - 0.4 -
2012 65 18.9 71 31.8 12.5 0.4 22.9
Variance % ↓22% ↑4% ↑111% ↑65% ↓55% - ↑183%
ABANYAN TREE
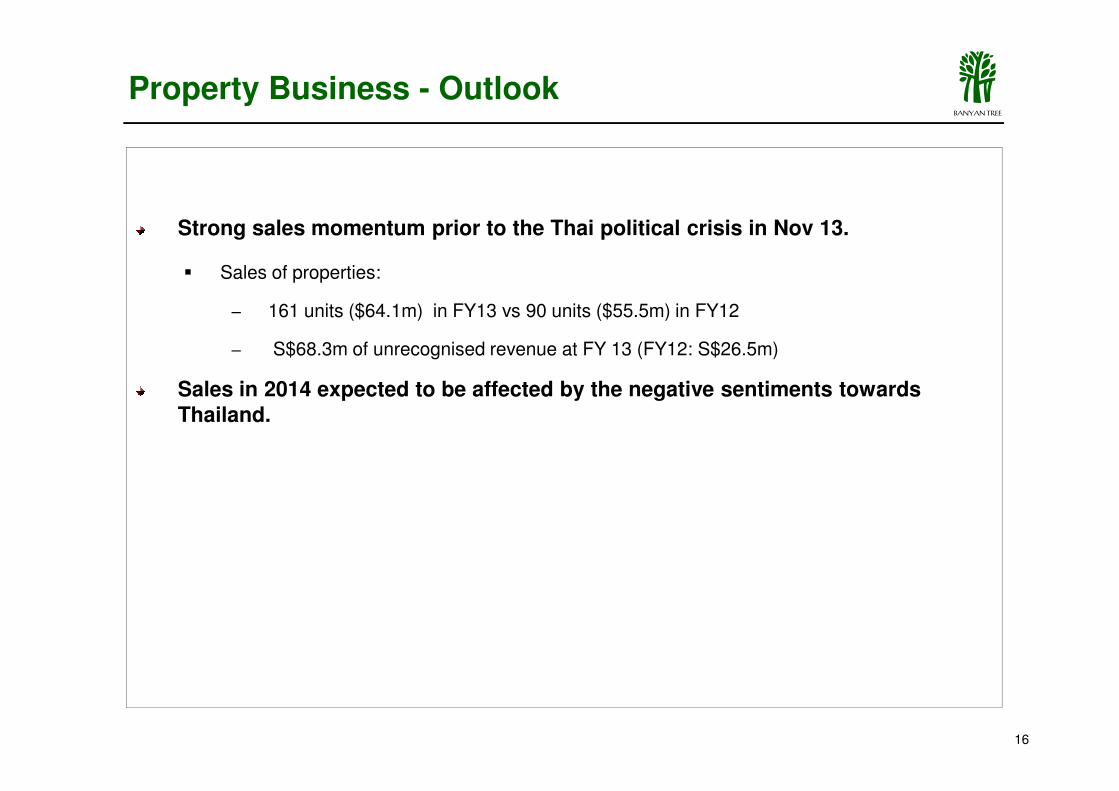
Strong sales momentum prior to the Thai political crisis in Nov 13.
� Sales of properties:
‒ 161 units ($64.1m) in FY13 vs 90 units ($55.5m) in FY12
‒ S$68.3m of unrecognised revenue at FY 13 (FY12: S$26.5m)
Sales in 2014 expected to be affected by the negative sentiments towards
Property Business - Outlook
16
Sales in 2014 expected to be affected by the negative sentiments towards Thailand.
ABANYAN TREE
Hotel & Fee-Based Business
17
ABANYAN TREE
14.430%
40%
50%
$20.0
$24.0
$28.0
S$m FY13 vs FY12
$25.2M
$16.4M
4Q13 vs 4Q12
53%
%
Highlights
Hotel Investments – Financial Performance
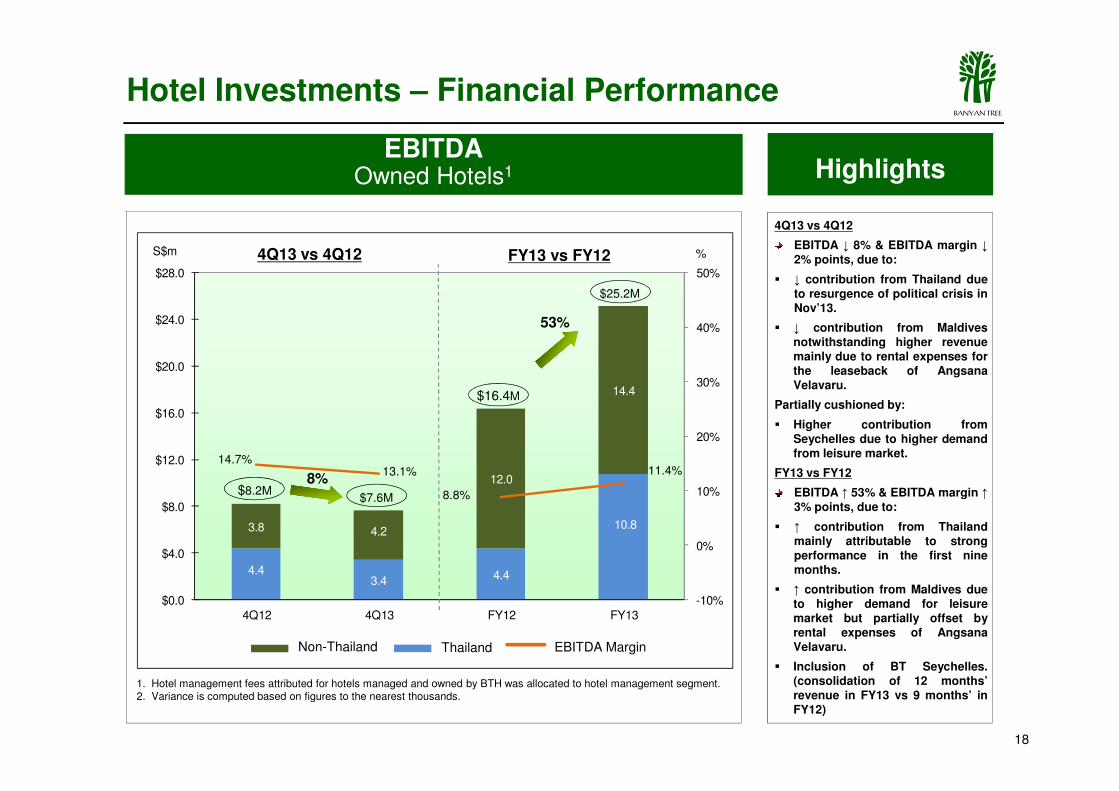
4Q13 vs 4Q12
EBITDA ↓ 8% & EBITDA margin ↓2% points, due to:
� ↓ contribution from Thailand dueto resurgence of political crisis inNov’13.
� ↓ contribution from Maldivesnotwithstanding higher revenuemainly due to rental expenses forthe leaseback of AngsanaVelavaru.
EBITDAOwned Hotels1
18
4.43.4 4.4
10.83.8 4.2
12.0
14.4
-10%
0%
10%
20%
$0.0
$4.0
$8.0
$12.0
$16.0
4Q12 4Q13 FY12 FY13
$16.4M
$7.6M$8.2M
8%
14.7%13.1%
8.8%
11.4%
Partially cushioned by:
� Higher contribution fromSeychelles due to higher demandfrom leisure market.
FY13 vs FY12
EBITDA ↑ 53% & EBITDA margin ↑3% points, due to:
� ↑ contribution from Thailandmainly attributable to strongperformance in the first ninemonths.
� ↑ contribution from Maldives dueto higher demand for leisuremarket but partially offset byrental expenses of AngsanaVelavaru.
� Inclusion of BT Seychelles.(consolidation of 12 months’revenue in FY13 vs 9 months’ inFY12)
1. Hotel management fees attributed for hotels managed and owned by BTH was allocated to hotel management segment. 2. Variance is computed based on figures to the nearest thousands.
Non-Thailand Thailand EBITDA Margin
ABANYAN TREE
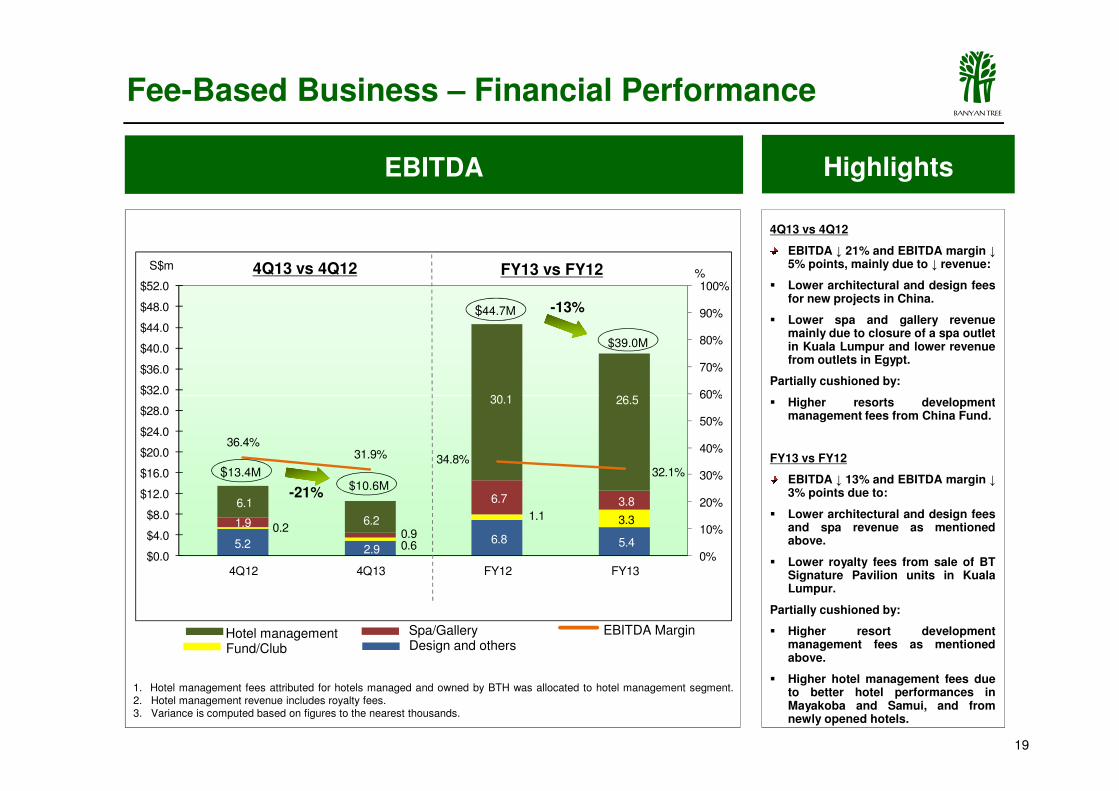
4Q13 vs 4Q12
EBITDA ↓ 21% and EBITDA margin ↓5% points, mainly due to ↓ revenue:
� Lower architectural and design feesfor new projects in China.
� Lower spa and gallery revenuemainly due to closure of a spa outletin Kuala Lumpur and lower revenuefrom outlets in Egypt.
Partially cushioned by:
Higher resorts development
Fee-Based Business – Financial Performance
30.1 26.5 60%
70%
80%
90%
100%
$32.0
$36.0
$40.0
$44.0
$48.0
$52.0
S$m FY13 vs FY12
$39.0M
$44.7M
4Q13 vs 4Q12
-13%
%
HighlightsEBITDA
19
1. Hotel management fees attributed for hotels managed and owned by BTH was allocated to hotel management segment.2. Hotel management revenue includes royalty fees.3. Variance is computed based on figures to the nearest thousands.
� Higher resorts developmentmanagement fees from China Fund.
FY13 vs FY12
EBITDA ↓ 13% and EBITDA margin ↓3% points due to:
� Lower architectural and design feesand spa revenue as mentionedabove.
� Lower royalty fees from sale of BTSignature Pavilion units in KualaLumpur.
Partially cushioned by:
� Higher resort developmentmanagement fees as mentionedabove.
� Higher hotel management fees dueto better hotel performances inMayakoba and Samui, and fromnewly opened hotels.
5.2 2.9 6.8 5.4
0.2
0.6
1.1 3.3 1.9 0.9
6.7 3.8
6.2
6.1
30.1 26.5
36.4%31.9% 34.8%
32.1%
0%
10%
20%
30%
40%
50%
60%
$0.0
$4.0
$8.0
$12.0
$16.0
$20.0
$24.0
$28.0
$32.0
4Q12 4Q13 FY12 FY13
$10.6M$13.4M
-21%
Hotel managementDesign and othersFund/Club
Spa/Gallery EBITDA Margin
ABANYAN TREE
Highlights
4Q13 vs 4Q12
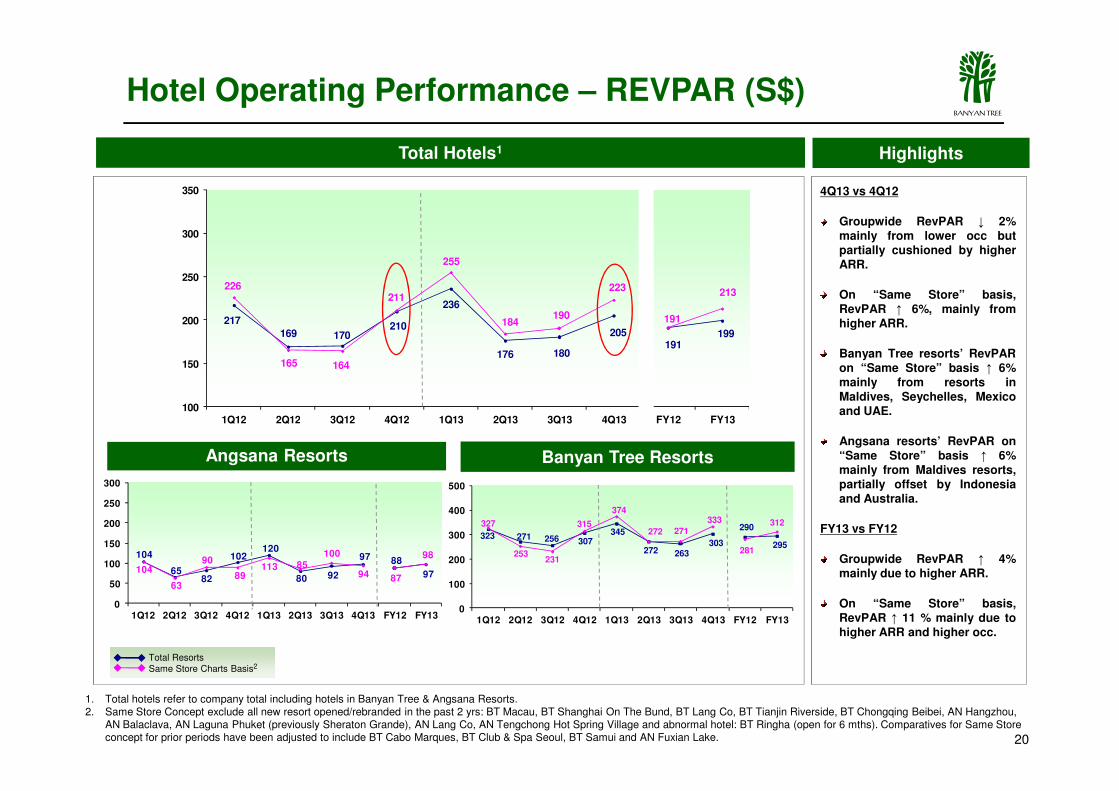
Groupwide RevPAR ↓ 2%mainly from lower occ butpartially cushioned by higherARR.
On “Same Store” basis,RevPAR ↑ 6%, mainly fromhigher ARR.
Banyan Tree resorts’ RevPARon “Same Store” basis ↑ 6%mainly from resorts inMaldives, Seychelles, Mexico
Total Hotels1
217
169 170210
236
176 180
205191
199
226
165 164
211
255
184190
223
191
213
150
200
250
300
350
Hotel Operating Performance – REVPAR (S$)
20
Maldives, Seychelles, Mexicoand UAE.
Angsana resorts’ RevPAR on“Same Store” basis ↑ 6%mainly from Maldives resorts,partially offset by Indonesiaand Australia.
FY13 vs FY12
Groupwide RevPAR ↑ 4%mainly due to higher ARR.
On “Same Store” basis,RevPAR ↑ 11 % mainly due tohigher ARR and higher occ.
Angsana Resorts Banyan Tree Resorts
Total ResortsSame Store Charts Basis2
323 271 256 307345
272 263303
290
295
327
253231
315
374
272 271
333
281
312
0
100
200
300
400
500
1Q12 2Q12 3Q12 4Q12 1Q13 2Q13 3Q13 4Q13 FY12 FY13
104
6582
102120
80 92
97 88
97104
63
90
89113 85
100
94 87
98
0
50
100
150
200
250
300
1Q12 2Q12 3Q12 4Q12 1Q13 2Q13 3Q13 4Q13 FY12 FY13
1001Q12 2Q12 3Q12 4Q12 1Q13 2Q13 3Q13 4Q13 FY12 FY13
1. Total hotels refer to company total including hotels in Banyan Tree & Angsana Resorts.2. Same Store Concept exclude all new resort opened/rebranded in the past 2 yrs: BT Macau, BT Shanghai On The Bund, BT Lang Co, BT Tianjin Riverside, BT Chongqing Beibei, AN Hangzhou,
AN Balaclava, AN Laguna Phuket (previously Sheraton Grande), AN Lang Co, AN Tengchong Hot Spring Village and abnormal hotel: BT Ringha (open for 6 mths). Comparatives for Same Store concept for prior periods have been adjusted to include BT Cabo Marques, BT Club & Spa Seoul, BT Samui and AN Fuxian Lake.
ABANYAN TREE
Total Hotels1 Highlights
4Q13 vs 4Q12
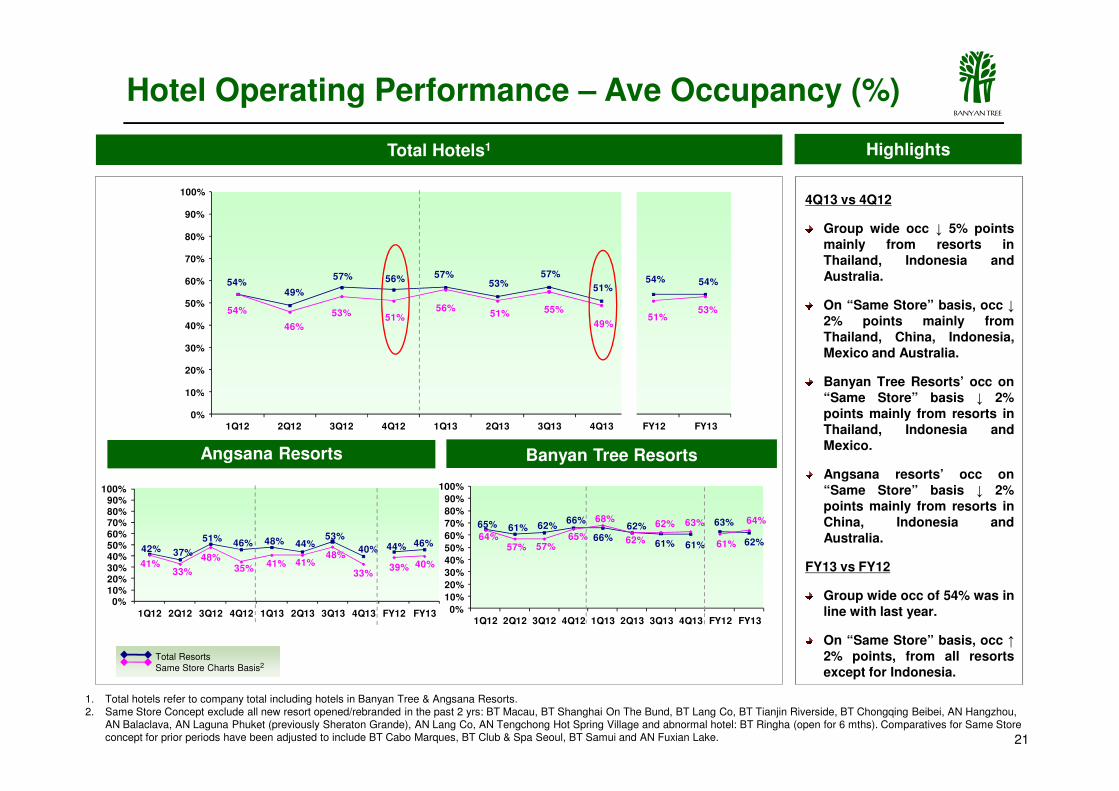
Group wide occ ↓ 5% pointsmainly from resorts inThailand, Indonesia andAustralia.
On “Same Store” basis, occ ↓2% points mainly fromThailand, China, Indonesia,Mexico and Australia.
Banyan Tree Resorts’ occ on“Same Store” basis ↓ 2%
54%49%
57% 56% 57%53%
57%
51%54% 54%
54%
46%
53% 51%56%
51% 55%
49%51%
53%
10%
20%
30%
40%
50%
60%
70%
80%
90%
100%
Hotel Operating Performance – Ave Occupancy (%)
42% 37%
51%46% 48% 44%
53%
40% 44% 46%
41%33%
48%35%
41% 41%48%
33%39% 40%
0%10%20%30%40%50%60%70%80%90%
100%
1Q12 2Q12 3Q12 4Q12 1Q13 2Q13 3Q13 4Q13 FY12 FY13
21
Banyan Tree ResortsAngsana Resorts
“Same Store” basis ↓ 2%points mainly from resorts inThailand, Indonesia andMexico.
Angsana resorts’ occ on“Same Store” basis ↓ 2%points mainly from resorts inChina, Indonesia andAustralia.
FY13 vs FY12
Group wide occ of 54% was inline with last year.
On “Same Store” basis, occ ↑2% points, from all resortsexcept for Indonesia.
0%
10%
1Q12 2Q12 3Q12 4Q12 1Q13 2Q13 3Q13 4Q13 FY12 FY13
65% 61% 62%66%
66%62%
61% 61%
63%
62%64%
57% 57%65%
68%
62%
62% 63%
61%
64%
0%
10%
20%
30%
40%
50%
60%
70%
80%
90%
100%
1Q12 2Q12 3Q12 4Q12 1Q13 2Q13 3Q13 4Q13 FY12 FY13
Total ResortsSame Store Charts Basis2
1. Total hotels refer to company total including hotels in Banyan Tree & Angsana Resorts.2. Same Store Concept exclude all new resort opened/rebranded in the past 2 yrs: BT Macau, BT Shanghai On The Bund, BT Lang Co, BT Tianjin Riverside, BT Chongqing Beibei, AN Hangzhou,
AN Balaclava, AN Laguna Phuket (previously Sheraton Grande), AN Lang Co, AN Tengchong Hot Spring Village and abnormal hotel: BT Ringha (open for 6 mths). Comparatives for Same Store concept for prior periods have been adjusted to include BT Cabo Marques, BT Club & Spa Seoul, BT Samui and AN Fuxian Lake.
ABANYAN TREE
401
344
300
373
410
333317
403
354365
421
357
311
410
458
358 343
453
375402
200
300
400
500
600
Highlights
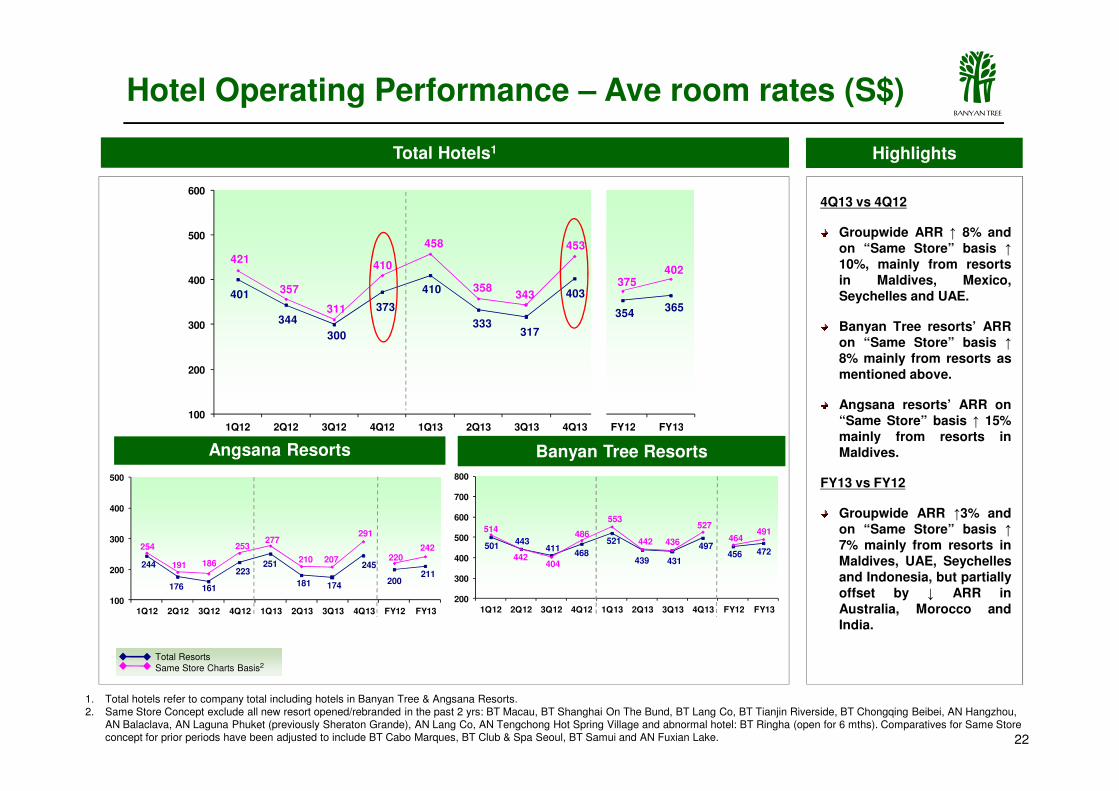
4Q13 vs 4Q12
Groupwide ARR ↑ 8% andon “Same Store” basis ↑
10%, mainly from resortsin Maldives, Mexico,Seychelles and UAE.
Banyan Tree resorts’ ARRon “Same Store” basis ↑
8% mainly from resorts asmentioned above.
Total Hotels1
Hotel Operating Performance – Ave room rates (S$)
1001Q12 2Q12 3Q12 4Q12 1Q13 2Q13 3Q13 4Q13 FY12 FY13
22
Angsana resorts’ ARR on“Same Store” basis ↑ 15%mainly from resorts inMaldives.
FY13 vs FY12
Groupwide ARR ↑3% andon “Same Store” basis ↑
7% mainly from resorts inMaldives, UAE, Seychellesand Indonesia, but partiallyoffset by ↓ ARR inAustralia, Morocco andIndia.
Banyan Tree ResortsAngsana Resorts
501443
411468
521
439 431
497 456 472
514
442404
486
553
442 436
527
464491
200
300
400
500
600
700
800
1Q12 2Q12 3Q12 4Q12 1Q13 2Q13 3Q13 4Q13 FY12 FY13
244
176 161
223 251
181 174
245
200211
254
191 186
253 277
210 207
291
220242
100
200
300
400
500
1Q12 2Q12 3Q12 4Q12 1Q13 2Q13 3Q13 4Q13 FY12 FY13
Total ResortsSame Store Charts Basis2
1. Total hotels refer to company total including hotels in Banyan Tree & Angsana Resorts.2. Same Store Concept exclude all new resort opened/rebranded in the past 2 yrs: BT Macau, BT Shanghai On The Bund, BT Lang Co, BT Tianjin Riverside, BT Chongqing Beibei, AN Hangzhou,
AN Balaclava, AN Laguna Phuket (previously Sheraton Grande), AN Lang Co, AN Tengchong Hot Spring Village and abnormal hotel: BT Ringha (open for 6 mths). Comparatives for Same Store concept for prior periods have been adjusted to include BT Cabo Marques, BT Club & Spa Seoul, BT Samui and AN Fuxian Lake.
ABANYAN TREE
Thailand operation is expected to be affected by the political upheaval in thenear term.
The USA and European economies are on track for further recovery and theactive China market will further boost our operation in Maldives.
Demand from China market will continue to be strong:
� China nationals visiting our resorts outside China ���� 59% in FY13 vs FY12.
� Overall contribution to room revenue ���� 35% in FY13 vs FY12.
Hotel Business - Outlook
23
Forward bookings (same store) for 1Q14 pulled down by Thailand.
We expect to open 4 resorts within 12 months.
i. Banyan Tree Yangshuo, Guilin, China
ii. Banyan Tree Huangshan, Anhui, China
iii. Angsana Xian Lintong, Shaanxi, China
iv. Angsana Nanjing Tangshan, Nanjing, China
We expect to launch 7 new spa outlets in the next 12 months.
ABANYAN TREE
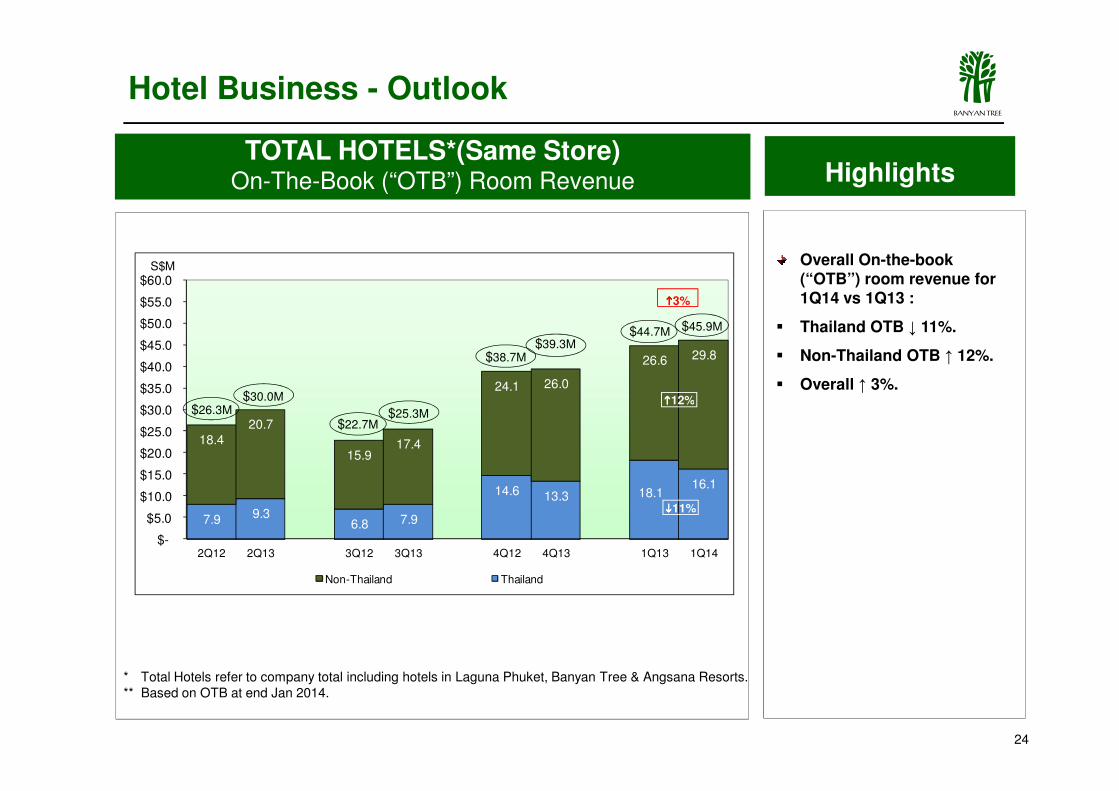
TOTAL HOTELS*(Same Store)On-The-Book (“OTB”) Room Revenue Highlights
Overall On-the-book (“OTB”) room revenue for 1Q14 vs 1Q13 :
� Thailand OTB ↓ 11%.
� Non-Thailand OTB ↑ 12%.
� Overall ↑ 3%.24.1 26.0
26.6 29.8
$35.0
$40.0
$45.0
$50.0
$55.0
$60.0 S$M
Hotel Business - Outlook
$30.0M
$38.7M$39.3M
$44.7M $45.9M
����12%
����3%
24
* Total Hotels refer to company total including hotels in Laguna Phuket, Banyan Tree & Angsana Resorts.** Based on OTB at end Jan 2014.
7.9 9.36.8 7.9
14.6 13.3 18.116.1
18.420.7
15.917.4
$-
$5.0
$10.0
$15.0
$20.0
$25.0
$30.0
2Q12 2Q13 3Q12 3Q13 4Q12 4Q13 1Q13 1Q14
Non-Thailand Thailand
$26.3M$30.0M
$22.7M$25.3M
����12%
����11%
ABANYAN TREE
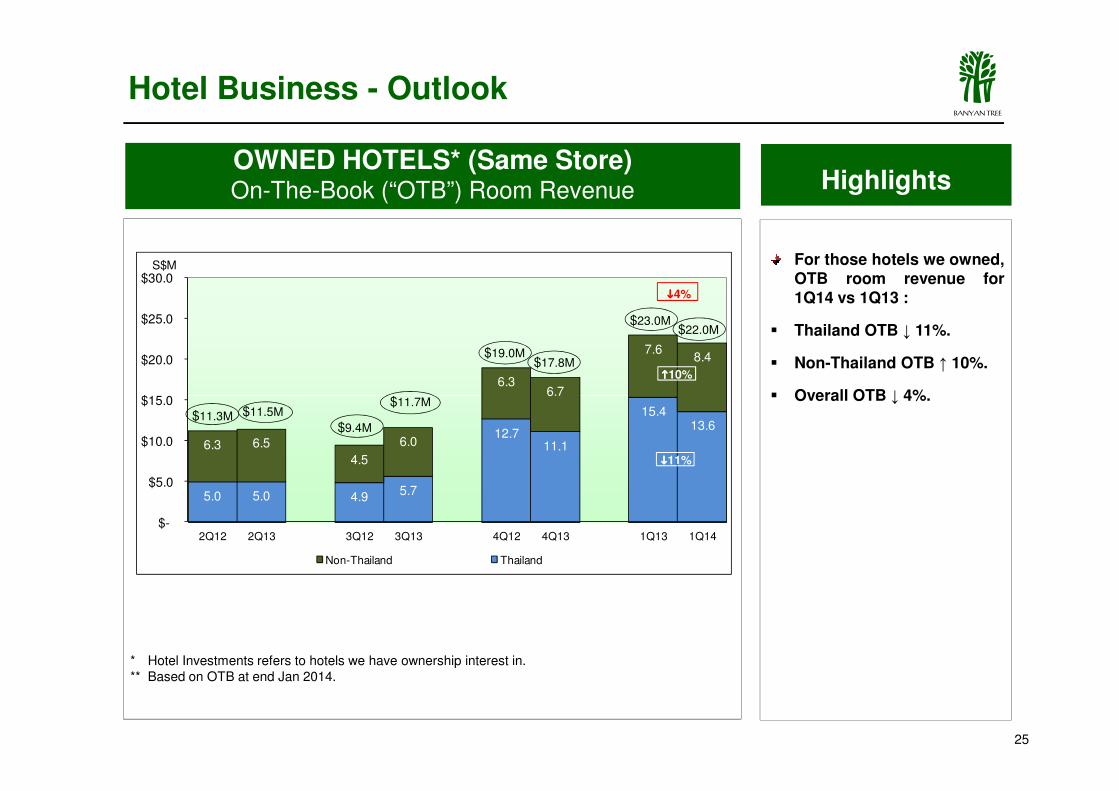
OWNED HOTELS* (Same Store)On-The-Book (“OTB”) Room Revenue Highlights
For those hotels we owned,OTB room revenue for1Q14 vs 1Q13 :
� Thailand OTB ↓ 11%.
� Non-Thailand OTB ↑ 10%.
� Overall OTB ↓ 4%.
Hotel Business - Outlook
6.36.7
7.68.4
$15.0
$20.0
$25.0
$30.0 S$M
$11.7M
$19.0M$17.8M
$23.0M$22.0M
����4%
����10%
25
� Overall OTB ↓ 4%.
* Hotel Investments refers to hotels we have ownership interest in.** Based on OTB at end Jan 2014.
5.0 5.0 4.9 5.7
12.711.1
15.413.6
6.3 6.5
4.5
6.0
6.7
$-
$5.0
$10.0
$15.0
2Q12 2Q13 3Q12 3Q13 4Q12 4Q13 1Q13 1Q14
Non-Thailand Thailand
$11.3M $11.5M
$9.4M
$11.7M
����11%
ABANYAN TREE
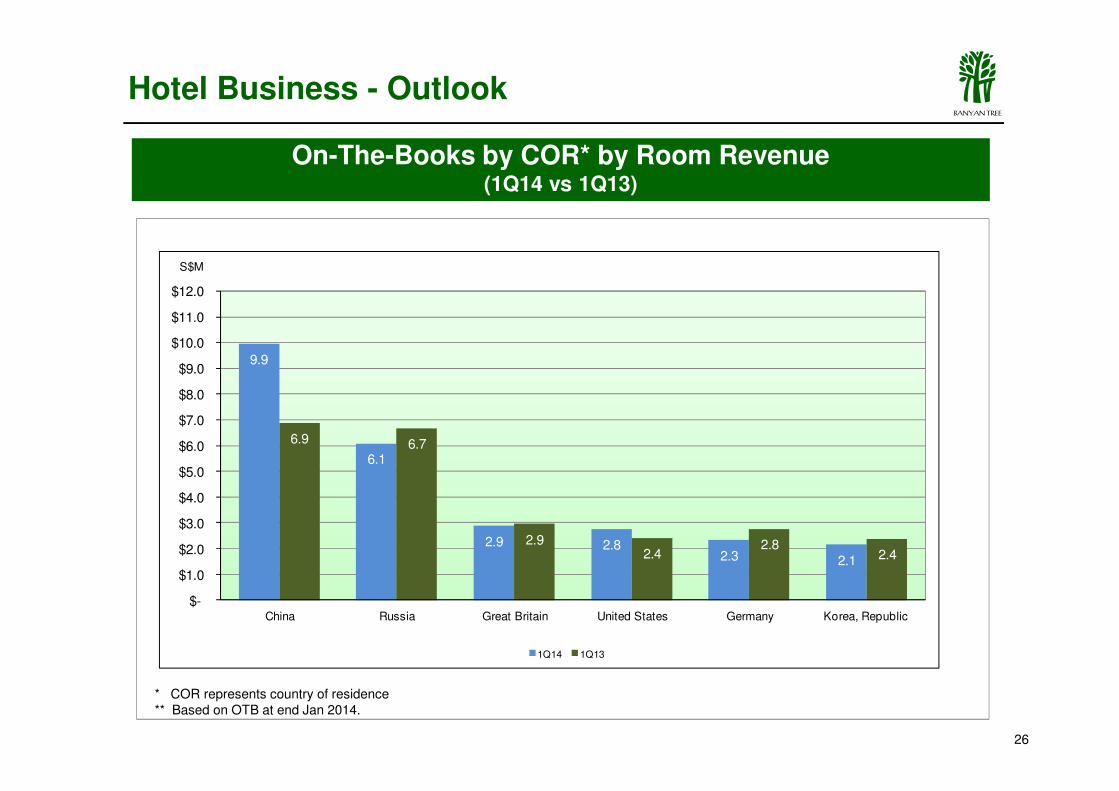
On-The-Books by COR* by Room Revenue (1Q14 vs 1Q13)
Hotel Business - Outlook
9.9
$8.0
$9.0
$10.0
$11.0
$12.0
S$M
26
6.1
2.9 2.82.3 2.1
6.9 6.7
2.92.4
2.82.4
$-
$1.0
$2.0
$3.0
$4.0
$5.0
$6.0
$7.0
$8.0
China Russia Great Britain United States Germany Korea, Republic
1Q14 1Q13
* COR represents country of residence** Based on OTB at end Jan 2014.
ABANYAN TREE
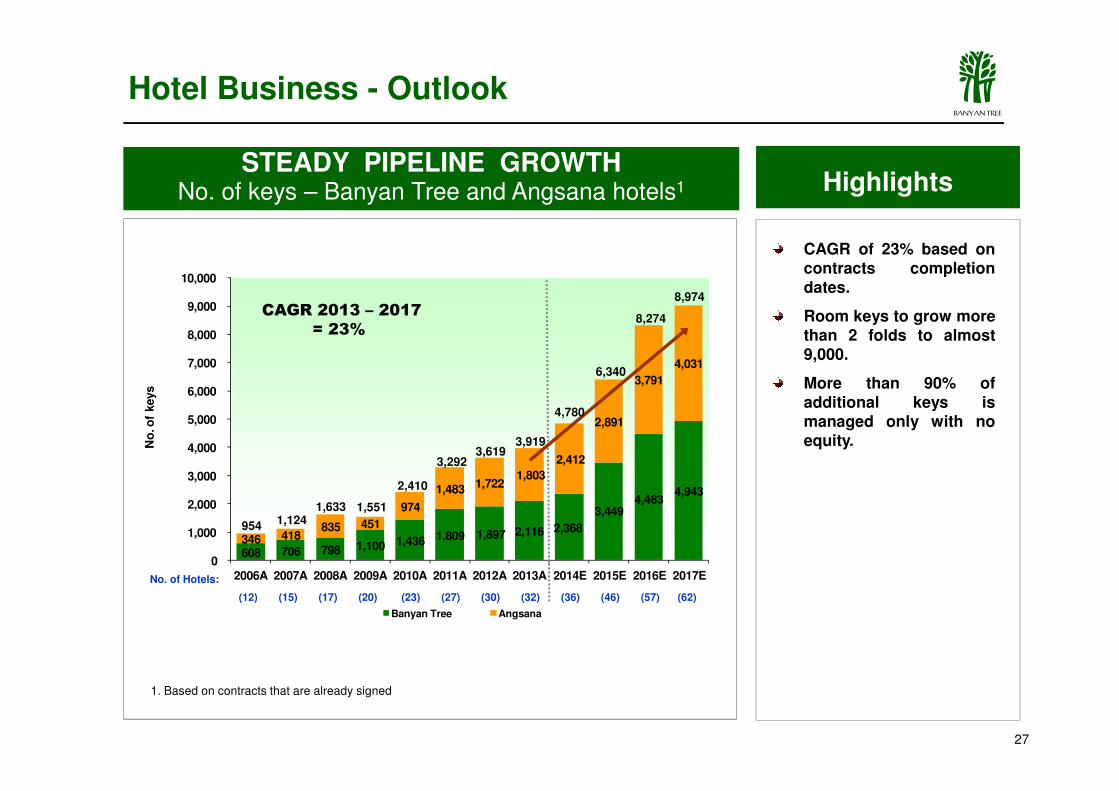
Highlights
CAGR of 23% based oncontracts completiondates.
Room keys to grow morethan 2 folds to almost9,000.
More than 90% ofadditional keys is
STEADY PIPELINE GROWTHNo. of keys – Banyan Tree and Angsana hotels1
3,791
4,031
6,000
7,000
8,000
9,000
10,000
No
. of
keys
CAGR 2013 – 2017
= 23%
6,340
8,274
8,974
Hotel Business - Outlook
27
1. Based on contracts that are already signed
additional keys ismanaged only with noequity.
608 706 798 1,100 1,436 1,809 1,897 2,116 2,368
3,449 4,483
4,943
346 418 835 451
974
1,483 1,722 1,803
2,412
2,891
0
1,000
2,000
3,000
4,000
5,000
6,000
2006A 2007A 2008A 2009A 2010A 2011A 2012A 2013A 2014E 2015E 2016E 2017E
No
. of
keys
Banyan Tree Angsana
954 1,1241,633 1,551
2,410
(12) (15) (17) (20) (23) (27) (30) (32) (36) (46) (57) (62)
No. of Hotels:
3,919
3,292
4,780
3,619
ABANYAN TREE
Mission Statement
“ We want to build globally recognised brands
which by inspiring exceptional experiences among
our guests, instilling pride and integrity in our
associates and enhancing both the physical and
28
associates and enhancing both the physical and
human environment in which we operate, will
deliver attractive returns to our shareholders. ”
Top Related