


Languages
Pages
Legal

© HEC Montréal. All rights reserved. institutcoop.hec.ca
BANKING BUSINESS MODELS AND OWNERSHIP STRUCTURES IN EUROPE – A CASE FOR DIVERSITY AND PROPORTIONALITY
Rym Ayadi, Professor and Director of IRCCF, HEC Montréal
Central Bank of Athens, Athens 13 January 2017
© HEC Montréal. All rights reserved. institutcoop.hec.ca
Contents
ü Background on EU Financial Integration ü Bank Business Models (BBM) and
Ownership Diversity in Europe ü Evidence based – 2005-2015
- Contribution to real economy - (Financial) performance - Risk - Response to regulation
ü BBM and Ownership: A case for Proportionality in regulation
ü Conclusion 2
© HEC Montréal. All rights reserved. institutcoop.hec.ca 3
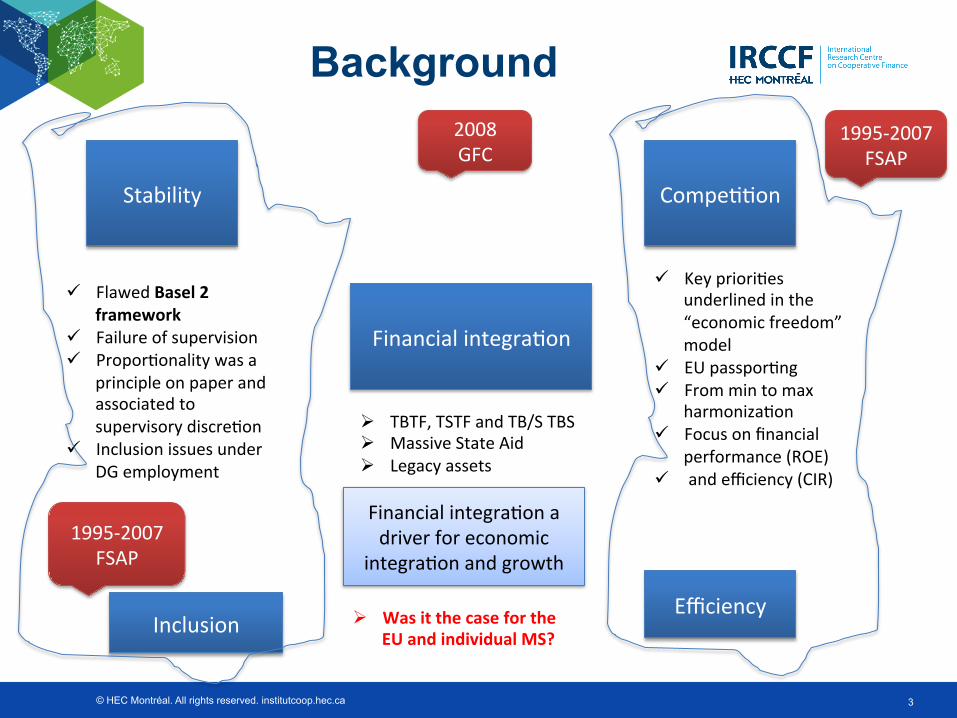
Background
Financial integra,on
Compe,,on
Efficiency
Stability
Inclusion
1995-‐2007 FSAP
ü Key priori,es underlined in the “economic freedom” model
ü EU passpor,ng ü From min to max
harmoniza,on ü Focus on financial
performance (ROE) ü and efficiency (CIR)
ü Flawed Basel 2
framework ü Failure of supervision ü Propor,onality was a
principle on paper and associated to supervisory discre,on
ü Inclusion issues under DG employment
Ø TBTF, TSTF and TB/S TBS Ø Massive State Aid Ø Legacy assets
2008 GFC
Financial integra,on a driver for economic
integra,on and growth
Ø Was it the case for the EU and individual MS?
1995-‐2007 FSAP
© HEC Montréal. All rights reserved. institutcoop.hec.ca 4
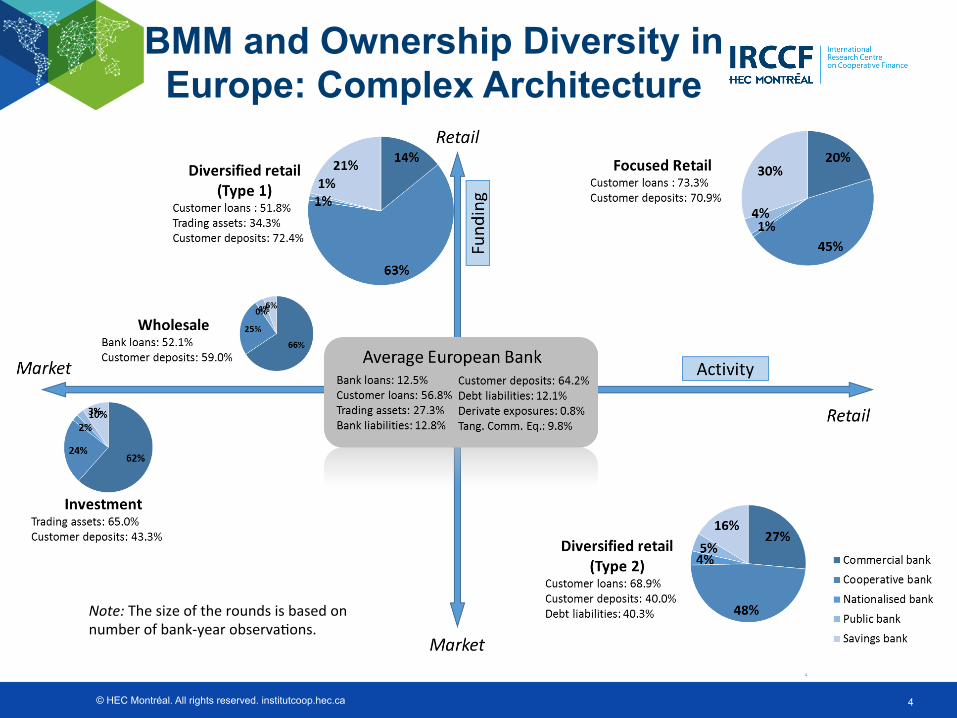
BMM and Ownership Diversity in Europe: Complex Architecture
Note: The size of the rounds is based on number of bank-‐year observa,ons.

© HEC Montréal. All rights reserved. institutcoop.hec.ca 5
Ownership across business models (% of assets) - Stakeholder value
(STV) banks (e.g. cooperatives and savings banks) divided across all five business models
- Highest share among retail banks (i.e. focused and diversified)
- Shareholder value (SHV) banks relatively more wholesale and investment oriented
Commercial (4914) 25%
Coopera,ve (9550) 49%
Na,onalised (264) 1%
Public (526) 3%
Savings (4167) 22%
BMM and Ownership Diversity
27%
49% 53%
26%
73% 29%
9%
20%
10%
15%
9%
24% 10%
0%
9%
9%
2% 3%
33%
1%
26% 16% 14%
32%
3%
0%
10%
20%
30%
40%
50%
60%
70%
80%
90%
100%
Focused retail Diversified retail type 1
Diversified retail type 2
Wholesale Investment
Savings
Public
Na,onalised
Coopera,ve
Commercial
ObservaBons by cluster (share in obs)
© HEC Montréal. All rights reserved. institutcoop.hec.ca 6
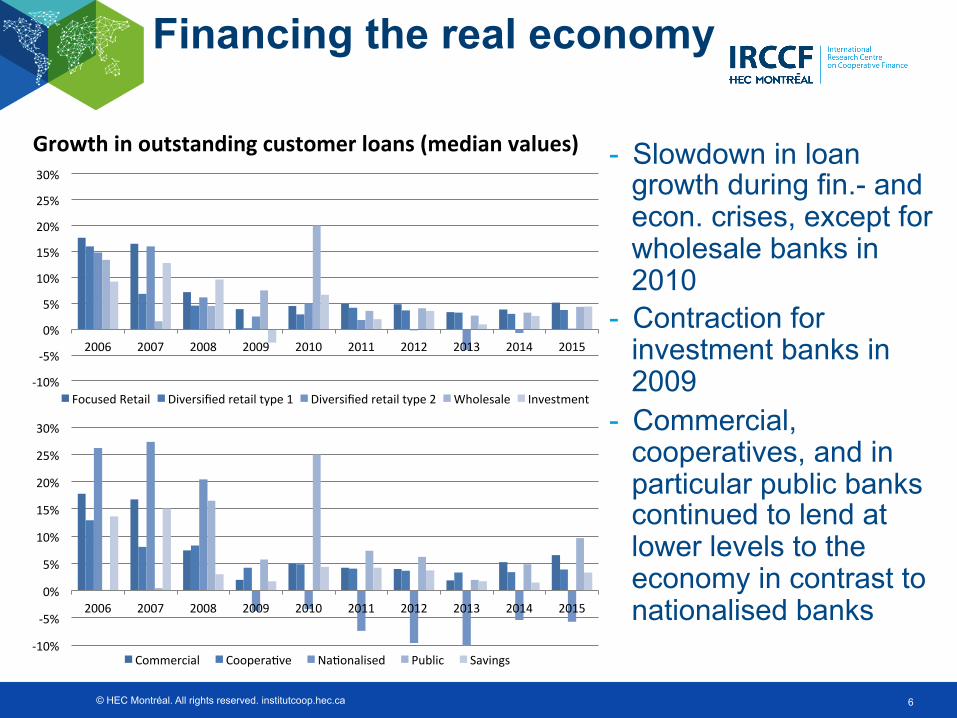
Financing the real economy
Growth in outstanding customer loans (median values) - Slowdown in loan growth during fin.- and econ. crises, except for wholesale banks in 2010
- Contraction for investment banks in 2009
- Commercial, cooperatives, and in particular public banks continued to lend at lower levels to the economy in contrast to nationalised banks
-‐10%
-‐5%
0%
5%
10%
15%
20%
25%
30%
2006 2007 2008 2009 2010 2011 2012 2013 2014 2015
Focused Retail Diversified retail type 1 Diversified retail type 2 Wholesale Investment
-‐10%
-‐5%
0%
5%
10%
15%
20%
25%
30%
2006 2007 2008 2009 2010 2011 2012 2013 2014 2015
Commercial Coopera,ve Na,onalised Public Savings
© HEC Montréal. All rights reserved. institutcoop.hec.ca 7
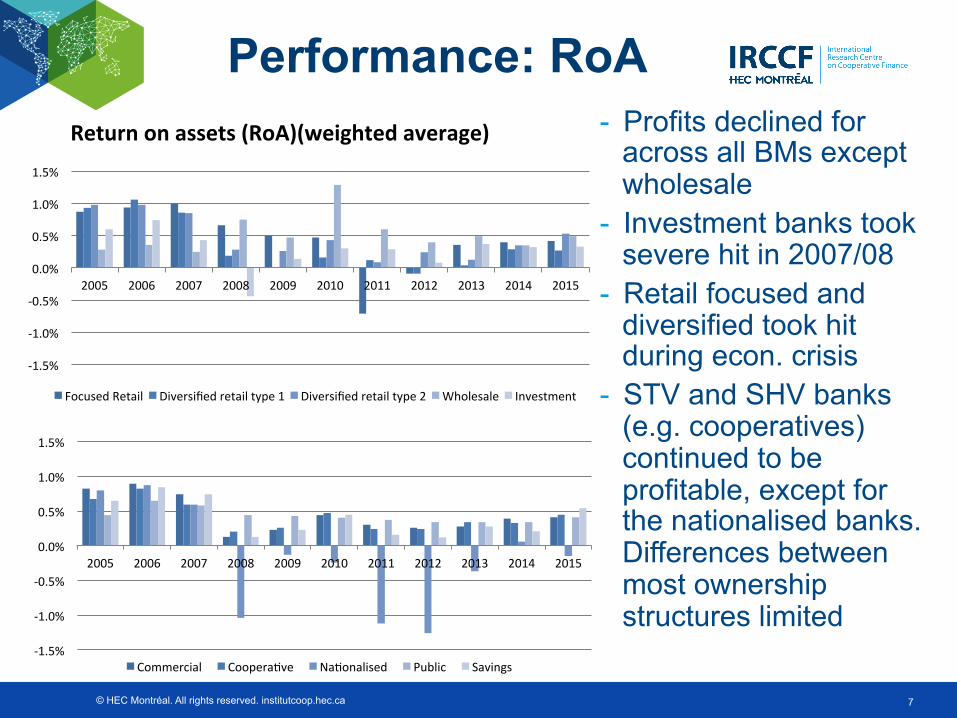
Performance: RoA Return on assets (RoA)(weighted average) - Profits declined for
across all BMs except wholesale
- Investment banks took severe hit in 2007/08
- Retail focused and diversified took hit during econ. crisis
- STV and SHV banks (e.g. cooperatives) continued to be profitable, except for the nationalised banks. Differences between most ownership structures limited
-‐1.5%
-‐1.0%
-‐0.5%
0.0%
0.5%
1.0%
1.5%
2005 2006 2007 2008 2009 2010 2011 2012 2013 2014 2015
Focused Retail Diversified retail type 1 Diversified retail type 2 Wholesale Investment
-‐1.5%
-‐1.0%
-‐0.5%
0.0%
0.5%
1.0%
1.5%
2005 2006 2007 2008 2009 2010 2011 2012 2013 2014 2015
Commercial Coopera,ve Na,onalised Public Savings

© HEC Montréal. All rights reserved. institutcoop.hec.ca 8
Performance: RoE
- Similar results for RoE
- Relatively better performance investment and wholesale banks compared to other models due to lower equity ratios
- SHV & STV models profitable, except for nationalised banks
Return on equity (RoE)(weighted average)
-‐20%
-‐15%
-‐10%
-‐5%
0%
5%
10%
15%
20%
25%
2005 2006 2007 2008 2009 2010 2011 2012 2013 2014 2015
Focused Retail Diversified retail type 1 Diversified retail type 2 Wholesale Investment
-‐32.3% -‐20%
-‐15%
-‐10%
-‐5%
0%
5%
10%
15%
20%
25%
2005 2006 2007 2008 2009 2010 2011 2012 2013 2014 2015
Commercial Coopera,ve Na,onalised Public Savings
© HEC Montréal. All rights reserved. institutcoop.hec.ca 9
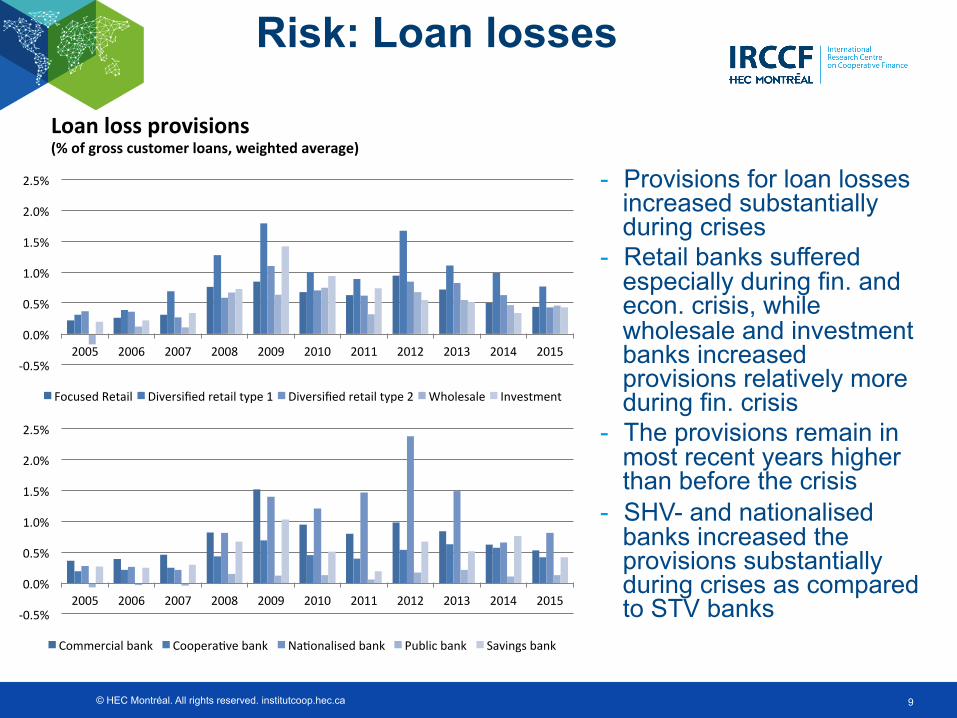
Risk: Loan losses
Loan loss provisions (% of gross customer loans, weighted average)
- Provisions for loan losses increased substantially during crises
- Retail banks suffered especially during fin. and econ. crisis, while wholesale and investment banks increased provisions relatively more during fin. crisis
- The provisions remain in most recent years higher than before the crisis
- SHV- and nationalised banks increased the provisions substantially during crises as compared to STV banks -‐0.5%
0.0%
0.5%
1.0%
1.5%
2.0%
2.5%
2005 2006 2007 2008 2009 2010 2011 2012 2013 2014 2015
Commercial bank Coopera,ve bank Na,onalised bank Public bank Savings bank
-‐0.5%
0.0%
0.5%
1.0%
1.5%
2.0%
2.5%
2005 2006 2007 2008 2009 2010 2011 2012 2013 2014 2015
Focused Retail Diversified retail type 1 Diversified retail type 2 Wholesale Investment
© HEC Montréal. All rights reserved. institutcoop.hec.ca 10
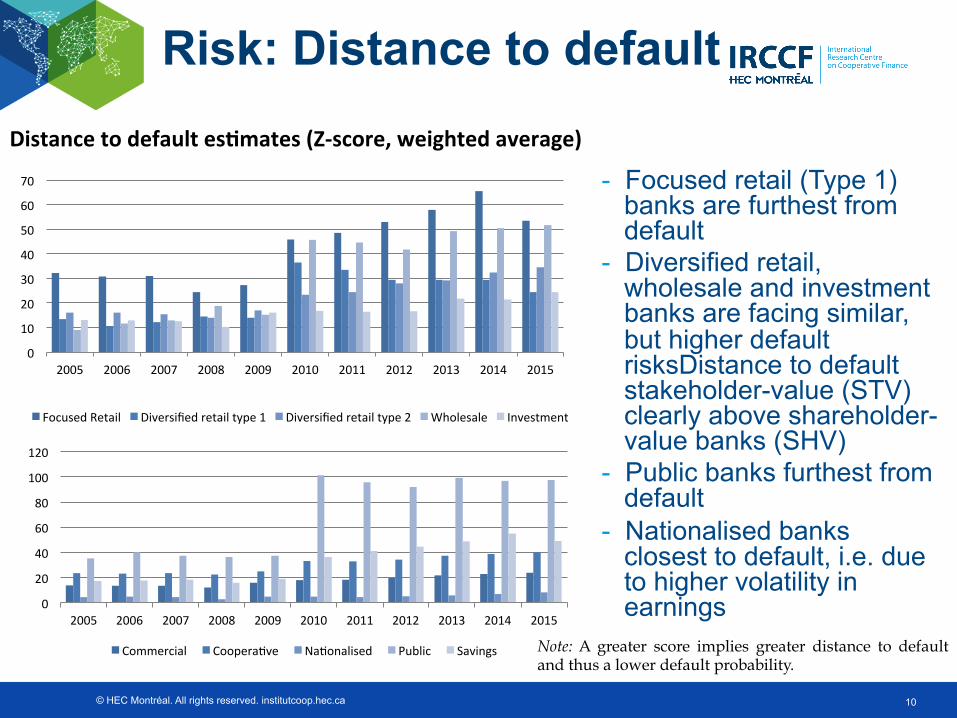
Risk: Distance to default Distance to default esBmates (Z-‐score, weighted average)
- Focused retail (Type 1) banks are furthest from default
- Diversified retail, wholesale and investment banks are facing similar, but higher default risksDistance to default stakeholder-value (STV) clearly above shareholder-value banks (SHV)
- Public banks furthest from default
- Nationalised banks closest to default, i.e. due to higher volatility in earnings
Note: A greater score implies greater distance to default and thus a lower default probability.
0
10
20
30
40
50
60
70
2005 2006 2007 2008 2009 2010 2011 2012 2013 2014 2015
Focused Retail Diversified retail type 1 Diversified retail type 2 Wholesale Investment
0
20
40
60
80
100
120
2005 2006 2007 2008 2009 2010 2011 2012 2013 2014 2015
Commercial Coopera,ve Na,onalised Public Savings
© HEC Montréal. All rights reserved. institutcoop.hec.ca 11
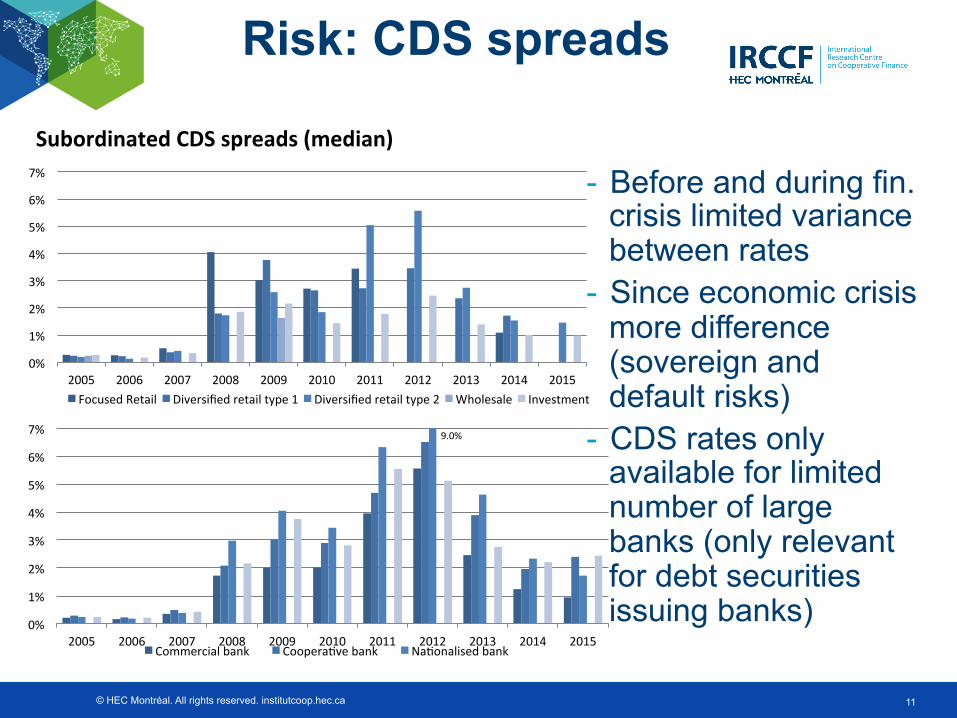
Risk: CDS spreads
Subordinated CDS spreads (median)
- Before and during fin. crisis limited variance between rates
- Since economic crisis more difference (sovereign and default risks)
- CDS rates only available for limited number of large banks (only relevant for debt securities issuing banks)
0%
1%
2%
3%
4%
5%
6%
7%
2005 2006 2007 2008 2009 2010 2011 2012 2013 2014 2015 Focused Retail Diversified retail type 1 Diversified retail type 2 Wholesale Investment
0%
1%
2%
3%
4%
5%
6%
7%
2005 2006 2007 2008 2009 2010 2011 2012 2013 2014 2015 Commercial bank Coopera,ve bank Na,onalised bank
9.0%
© HEC Montréal. All rights reserved. institutcoop.hec.ca 12
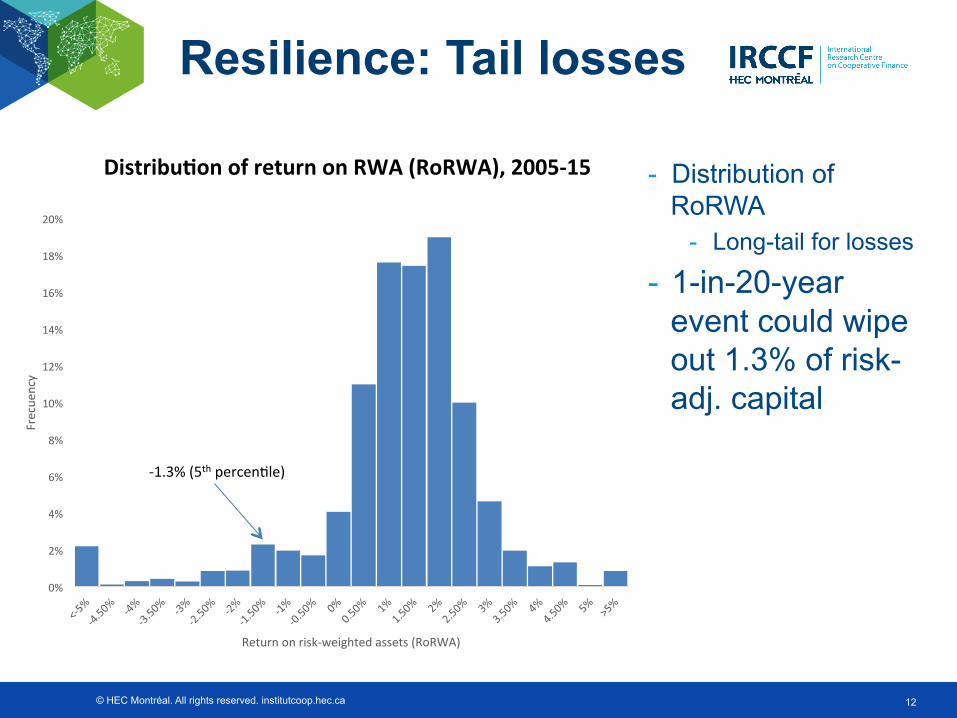
Resilience: Tail losses
DistribuBon of return on RWA (RoRWA), 2005-‐15 - Distribution of RoRWA
- Long-tail for losses
- 1-in-20-year event could wipe out 1.3% of risk-adj. capital
0%
2%
4%
6%
8%
10%
12%
14%
16%
18%
20%
Frecue
ncy
Return on risk-‐weighted assets (RoRWA)
-‐1.3% (5th percen,le)
© HEC Montréal. All rights reserved. institutcoop.hec.ca
-‐15% -‐13% -‐11% -‐9% -‐7% -‐5% -‐3% -‐1%
Focused Retail
Diversified retail type 1
Diversified retail type 2
Wholesale
Investment
All banks
1st pctl. 5th pctl. 10tc pctl.
13
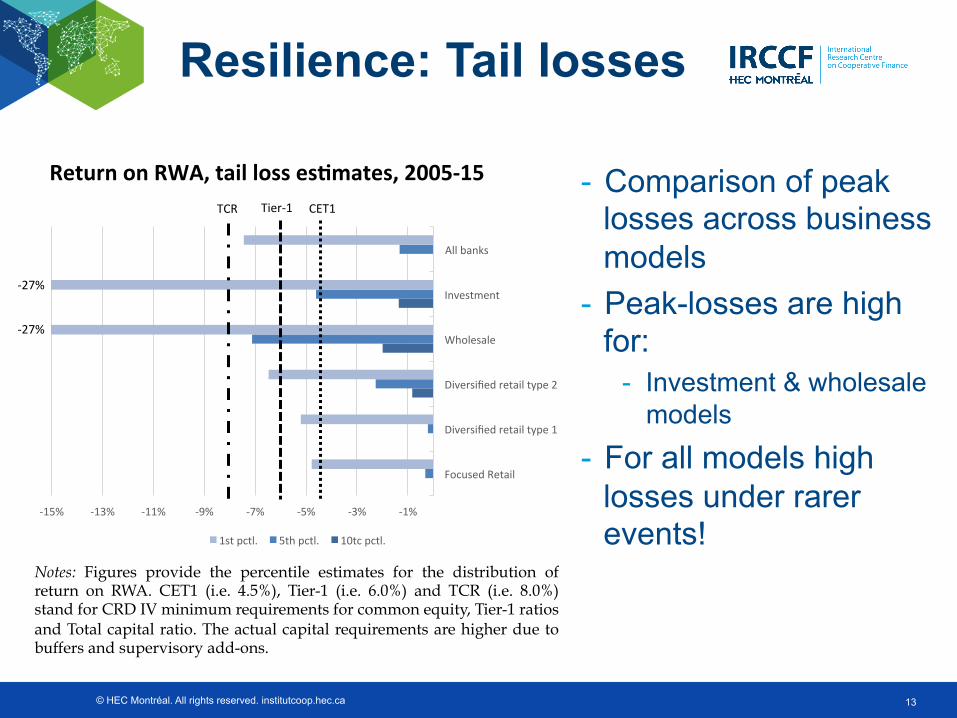
Resilience: Tail losses
Return on RWA, tail loss esBmates, 2005-‐15 - Comparison of peak losses across business models
- Peak-losses are high for:
- Investment & wholesale models
- For all models high losses under rarer events!
Notes: Figures provide the percentile estimates for the distribution of return on RWA. CET1 (i.e. 4.5%), Tier-1 (i.e. 6.0%) and TCR (i.e. 8.0%) stand for CRD IV minimum requirements for common equity, Tier-1 ratios and Total capital ratio. The actual capital requirements are higher due to buffers and supervisory add-ons.
CET1 Tier-‐1
-‐27%
-‐27%
TCR
© HEC Montréal. All rights reserved. institutcoop.hec.ca
-‐15% -‐13% -‐11% -‐9% -‐7% -‐5% -‐3% -‐1%
Commercial bank
Coopera,ve bank
Na,onalised bank
Public bank
Savings bank
Total
1st pctl. 5th pctl. 10tc pctl.
14
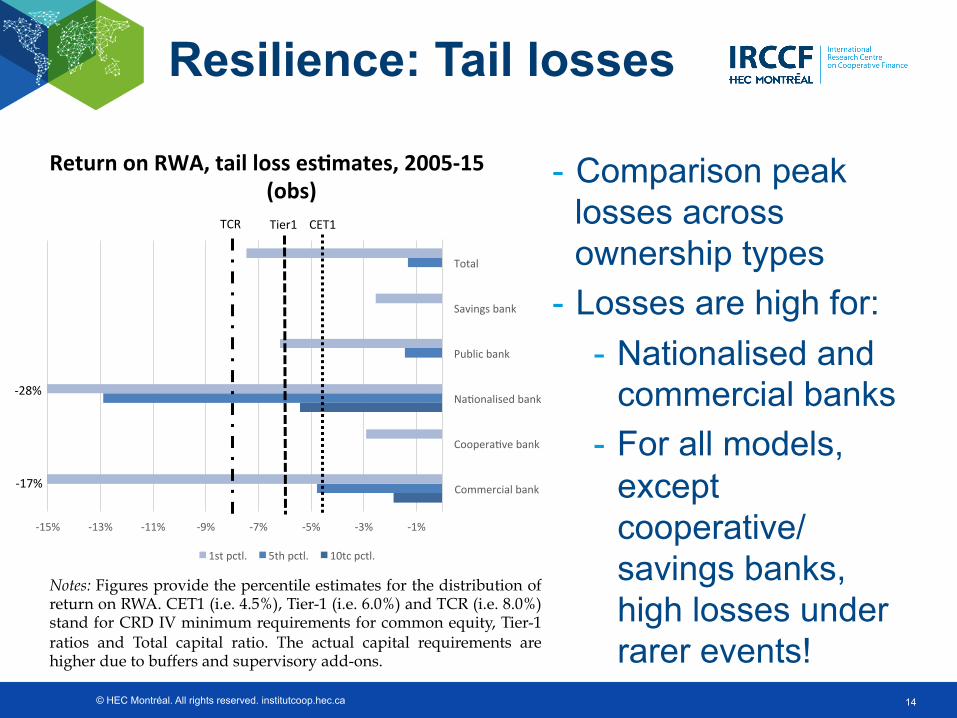
Resilience: Tail losses
Return on RWA, tail loss esBmates, 2005-‐15 (obs)
- Comparison peak losses across ownership types
- Losses are high for: - Nationalised and
commercial banks - For all models,
except cooperative/ savings banks, high losses under rarer events!
Notes: Figures provide the percentile estimates for the distribution of return on RWA. CET1 (i.e. 4.5%), Tier-1 (i.e. 6.0%) and TCR (i.e. 8.0%) stand for CRD IV minimum requirements for common equity, Tier-1 ratios and Total capital ratio. The actual capital requirements are higher due to buffers and supervisory add-ons.
-‐28%
Tier1 CET1
-‐17%
TCR
© HEC Montréal. All rights reserved. institutcoop.hec.ca 15
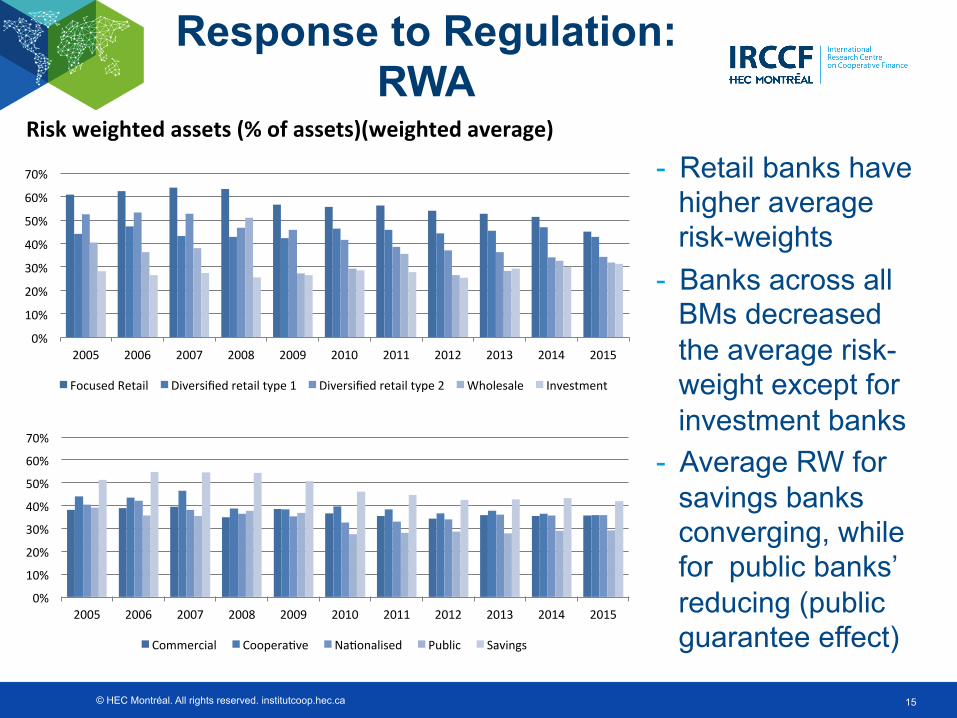
Response to Regulation: RWA
Risk weighted assets (% of assets)(weighted average) - Retail banks have
higher average risk-weights
- Banks across all BMs decreased the average risk-weight except for investment banks
- Average RW for savings banks converging, while for public banks’ reducing (public guarantee effect)
0%
10%
20%
30%
40%
50%
60%
70%
2005 2006 2007 2008 2009 2010 2011 2012 2013 2014 2015
Focused Retail Diversified retail type 1 Diversified retail type 2 Wholesale Investment
0%
10%
20%
30%
40%
50%
60%
70%
2005 2006 2007 2008 2009 2010 2011 2012 2013 2014 2015
Commercial Coopera,ve Na,onalised Public Savings
© HEC Montréal. All rights reserved. institutcoop.hec.ca 16
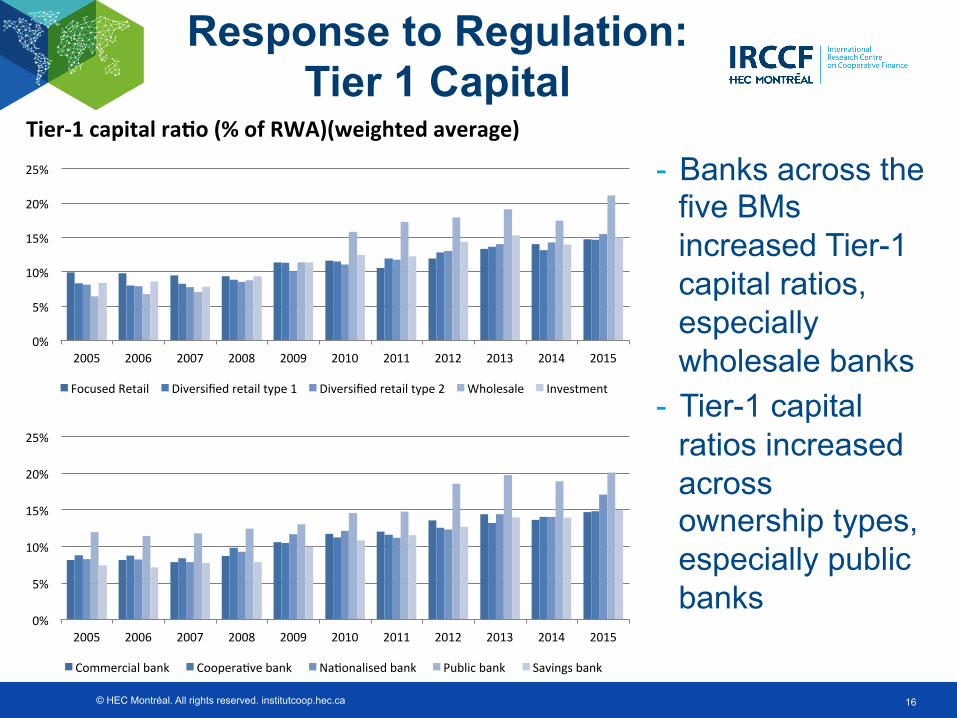
Response to Regulation: Tier 1 Capital
Tier-‐1 capital raBo (% of RWA)(weighted average) - Banks across the
five BMs increased Tier-1 capital ratios, especially wholesale banks
- Tier-1 capital ratios increased across ownership types, especially public banks
0%
5%
10%
15%
20%
25%
2005 2006 2007 2008 2009 2010 2011 2012 2013 2014 2015
Focused Retail Diversified retail type 1 Diversified retail type 2 Wholesale Investment
0%
5%
10%
15%
20%
25%
2005 2006 2007 2008 2009 2010 2011 2012 2013 2014 2015
Commercial bank Coopera,ve bank Na,onalised bank Public bank Savings bank
© HEC Montréal. All rights reserved. institutcoop.hec.ca 17
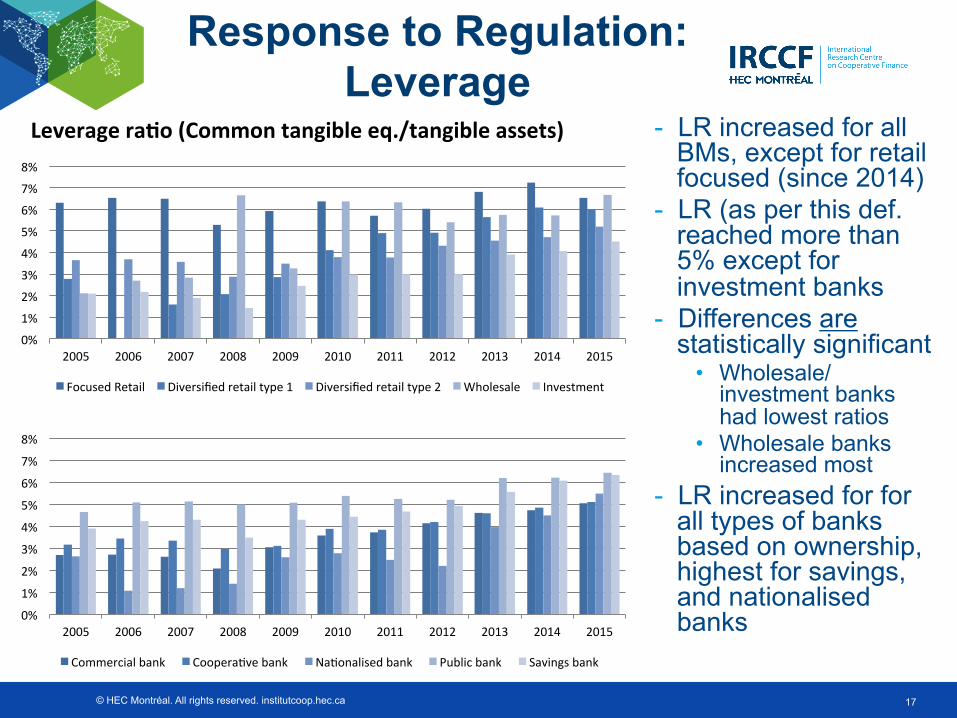
Leverage raBo (Common tangible eq./tangible assets) - LR increased for all BMs, except for retail focused (since 2014)
- LR (as per this def. reached more than 5% except for investment banks
- Differences are statistically significant
• Wholesale/ investment banks had lowest ratios
• Wholesale banks increased most
- LR increased for for all types of banks based on ownership, highest for savings, and nationalised banks
Response to Regulation: Leverage
0%
1%
2%
3%
4%
5%
6%
7%
8%
2005 2006 2007 2008 2009 2010 2011 2012 2013 2014 2015
Focused Retail Diversified retail type 1 Diversified retail type 2 Wholesale Investment
0%
1%
2%
3%
4%
5%
6%
7%
8%
2005 2006 2007 2008 2009 2010 2011 2012 2013 2014 2015
Commercial bank Coopera,ve bank Na,onalised bank Public bank Savings bank
© HEC Montréal. All rights reserved. institutcoop.hec.ca 18
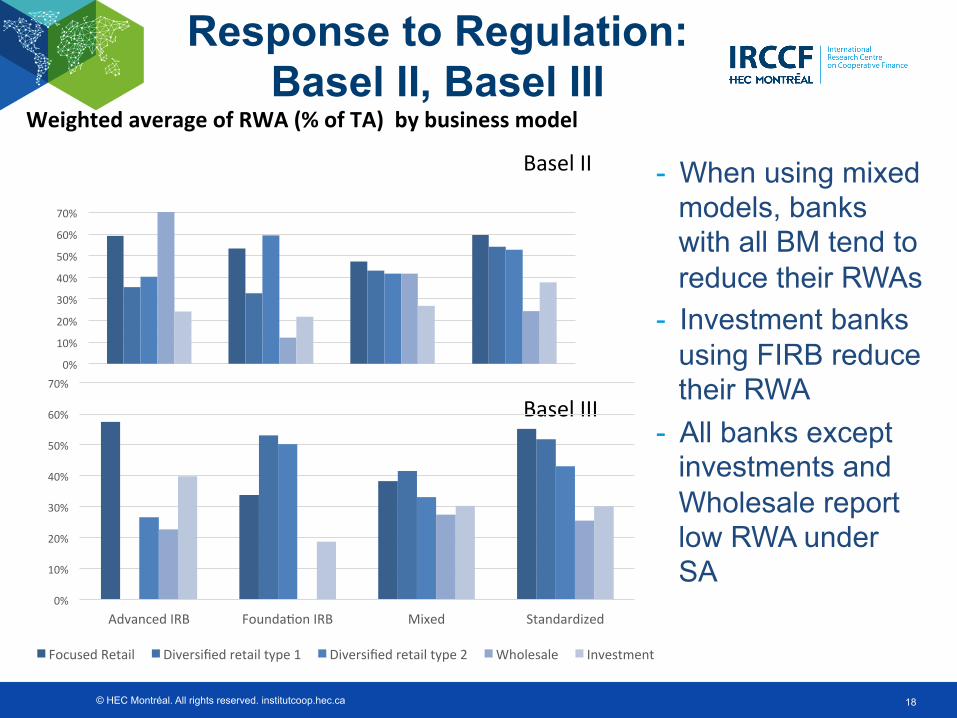
Response to Regulation: Basel II, Basel III
Weighted average of RWA (% of TA) by business model
- When using mixed models, banks with all BM tend to reduce their RWAs
- Investment banks using FIRB reduce their RWA
- All banks except investments and Wholesale report low RWA under SA
Basel II
Basel III
0%
10%
20%
30%
40%
50%
60%
70%
0%
10%
20%
30%
40%
50%
60%
70%
Advanced IRB Founda,on IRB Mixed Standardized
Focused Retail Diversified retail type 1 Diversified retail type 2 Wholesale Investment
© HEC Montréal. All rights reserved. institutcoop.hec.ca 19
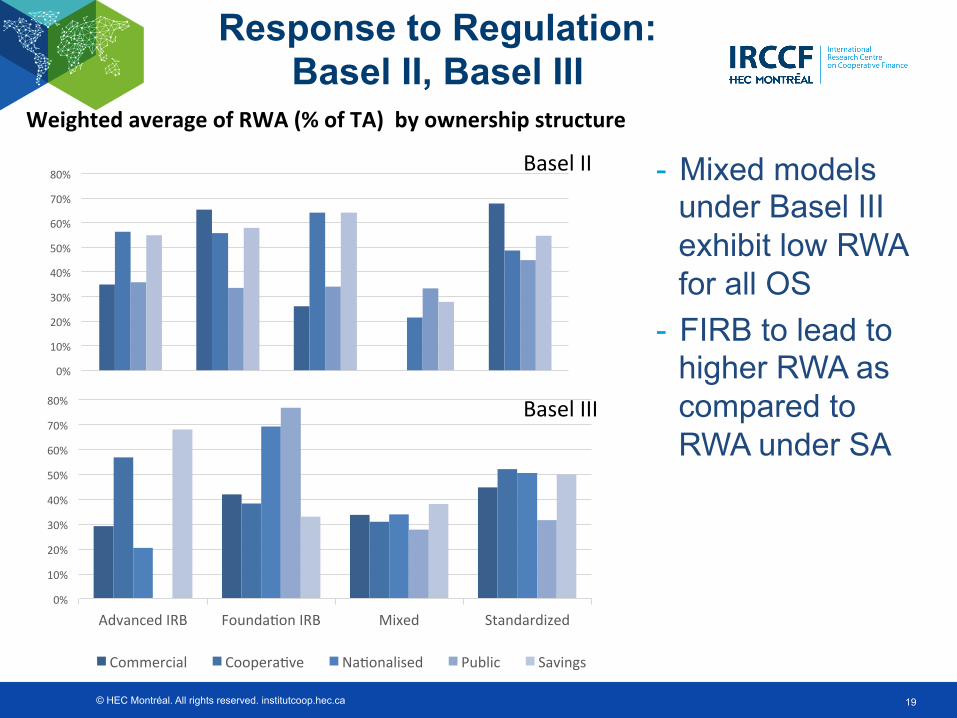
Response to Regulation: Basel II, Basel III
Weighted average of RWA (% of TA) by ownership structure
- Mixed models under Basel III exhibit low RWA for all OS
- FIRB to lead to higher RWA as compared to RWA under SA
Basel II
Basel III
0%
10%
20%
30%
40%
50%
60%
70%
80%
0%
10%
20%
30%
40%
50%
60%
70%
80%
Advanced IRB Founda,on IRB Mixed Standardized
Commercial Coopera,ve Na,onalised Public Savings
© HEC Montréal. All rights reserved. institutcoop.hec.ca 20
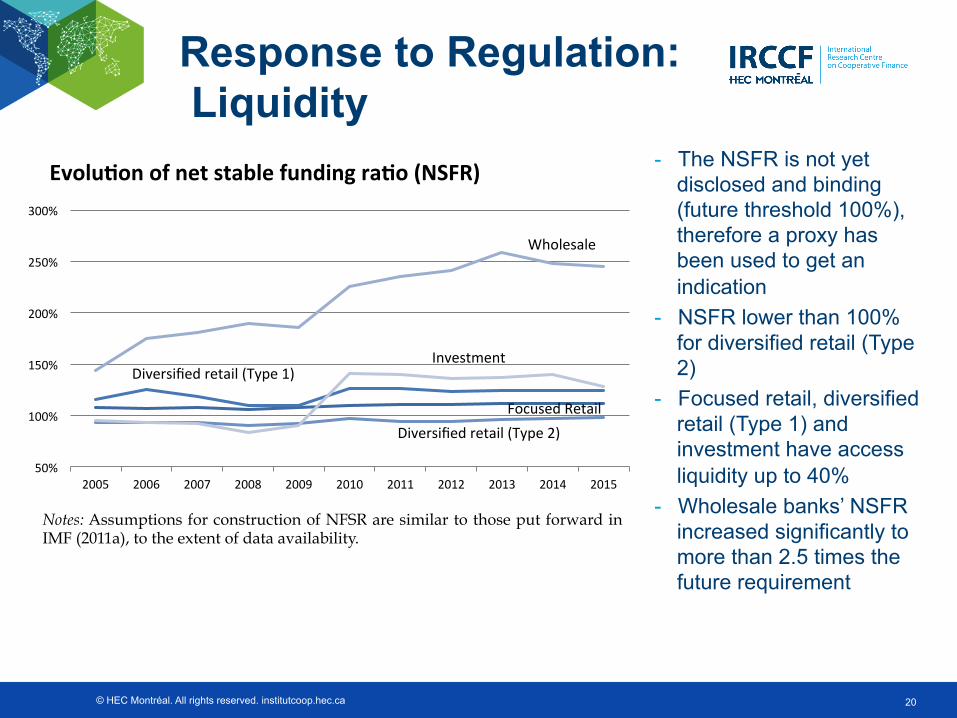
Response to Regulation: Liquidity
EvoluBon of net stable funding raBo (NSFR) - The NSFR is not yet disclosed and binding (future threshold 100%), therefore a proxy has been used to get an indication
- NSFR lower than 100% for diversified retail (Type 2)
- Focused retail, diversified retail (Type 1) and investment have access liquidity up to 40%
- Wholesale banks’ NSFR increased significantly to more than 2.5 times the future requirement
Notes: Assumptions for construction of NFSR are similar to those put forward in IMF (2011a), to the extent of data availability.
50%
100%
150%
200%
250%
300%
2005 2006 2007 2008 2009 2010 2011 2012 2013 2014 2015
Wholesale
Investment Diversified retail (Type 1)
Focused Retail Diversified retail (Type 2)
© HEC Montréal. All rights reserved. institutcoop.hec.ca 21
BBM & OS Diversity: A case for Proportionality
– Institutional diversity (the co-existence of stakeholders and shareholders banks) promotes systemic stability (Ayadi et al (2009, 2010))
– The Business Model (BM) analysis is key for bank regulation and supervision (Ayadi et al (2011, 2012)
– Since Bank Business Models (BBM) contribute differently to performance and risk, bank regulation (pillars 1 and 2) should be calibrated to BM (Ayadi et al (2011, 2012))
– BBM diversity important to support the economy throughout the economic cycles (Ayadi et al (2015, 2016))
– Changes in the economic, regulatory and market conditions can lead to changes in the BMs of banks towards more diversity or convergence (Ayadi (forthcoming 2017))
– Each BBM contributes differently to the accumulation of risk in the system (Investment and wholesale banks accelerate systemic risk while typically exhibit higher financial performance as compared to peers) (Ayadi (2017))
– Each BBM reacts differently to external shocks – and therefore have different characteristics that make them more or less resilient to shocks (Ayadi (2017)
⇒ Monitoring BBM is the tool for dynamic supervision ⇒ BBM and OS diversity is a driver to design a proportional regulation
• Paper by Ayadi (2016) on BBM for regulation and resolution

© HEC Montréal. All rights reserved. institutcoop.hec.ca 22
BBM & OS Diversity: A case for Proportionality
– Institutional diversity in banking is assessed via the co-existence of different ownership structure (OS) that is stakeholders (e.g. cooperatives banks and savings banks) and shareholders banks (e.g. commercial private banks and investment firms) is linked to varied incentives and therefore different mandates and risk appetites
– Bank Business Models is assessed via the different behaviour of banks (irrespective to their ownership structure) in the system where they operate
⇒ To maintain a diverse banking system, which is a condition
for systemic stability, proportionality in regulation and supervision means to take into account the OS and BBM in the current regulatory and supervisory framework
⇒ BBM and OS diversity is a driver to design a proportional regulation
© HEC Montréal. All rights reserved. institutcoop.hec.ca 23
– Capital requirements (CR) • Each BM has a distinct risk profile and reacts differently to external
shocks ⇒ CR should distinguish between business models
• Minimum capital requirements (Tier 1 capital ratio) are insufficient to account for the risk profiles of BBM
• RWAs do not capture overall risk, in particular for the more market oriented BMs (diversified retail (type 2), wholesale, investment banks)
• Capital floor of Basel can potentially answer this weakness but must be assessed in terms of its perverse incentives
• Do not allow the use of mixed models (Cherry picking) • CR must be topped up with a buffer for riskier BBMs
– Leverage ratio • Addresses weakness w/ risk-sensitive requirements • Must be binding and a minimum of 5% (based on definition used in
this presentation) • Must be calibrated per BM
BBM & OS Diversity: A case for Proportionality
© HEC Montréal. All rights reserved. institutcoop.hec.ca 24
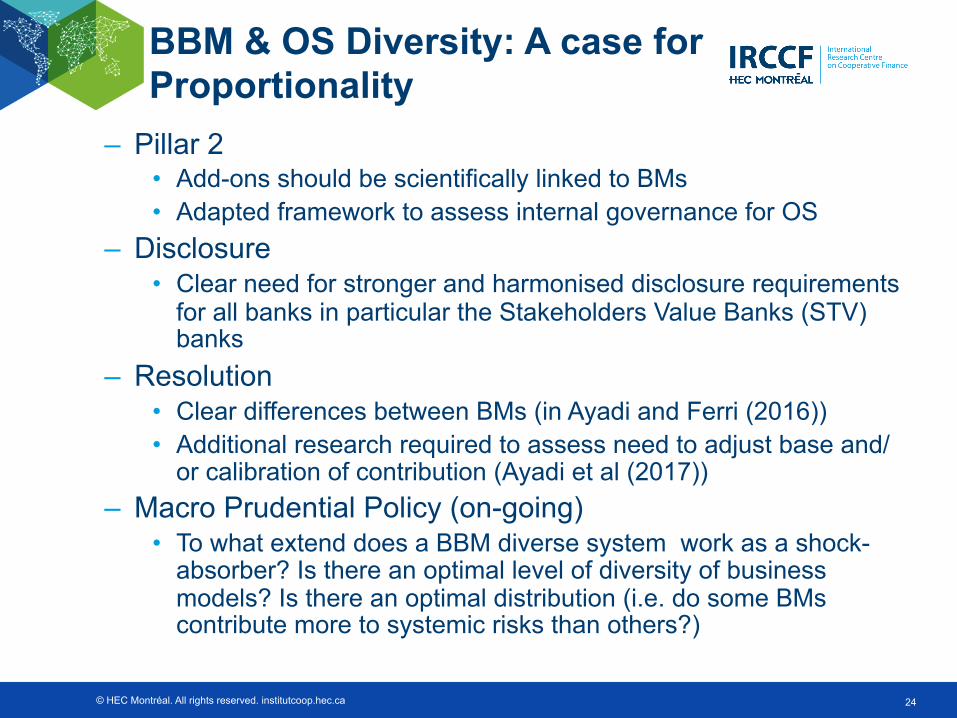
– Pillar 2 • Add-ons should be scientifically linked to BMs • Adapted framework to assess internal governance for OS
– Disclosure • Clear need for stronger and harmonised disclosure requirements
for all banks in particular the Stakeholders Value Banks (STV) banks
– Resolution • Clear differences between BMs (in Ayadi and Ferri (2016)) • Additional research required to assess need to adjust base and/
or calibration of contribution (Ayadi et al (2017)) – Macro Prudential Policy (on-going)
• To what extend does a BBM diverse system work as a shock-absorber? Is there an optimal level of diversity of business models? Is there an optimal distribution (i.e. do some BMs contribute more to systemic risks than others?)
BBM & OS Diversity: A case for Proportionality
© HEC Montréal. All rights reserved. institutcoop.hec.ca 25
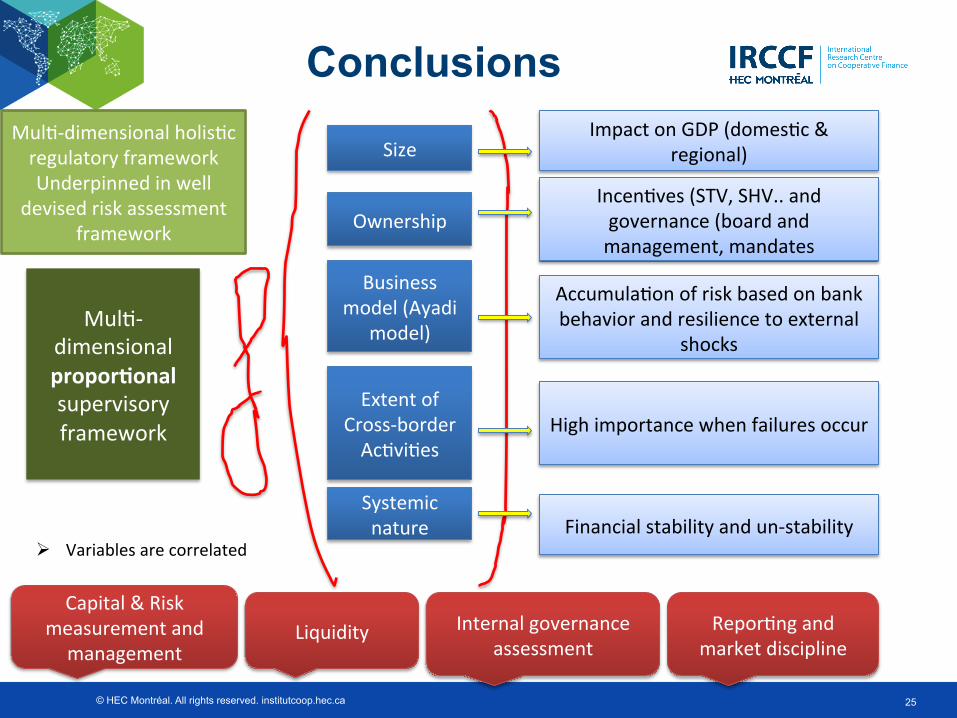
Conclusions
Size Impact on GDP (domes,c &
regional)
Business model (Ayadi
model)
Ownership
Mul,-‐dimensional proporBonal supervisory framework
Extent of Cross-‐border Ac,vi,es
Systemic nature
Capital & Risk measurement and
management Liquidity Internal governance
assessment Repor,ng and
market discipline
Incen,ves (STV, SHV.. and governance (board and management, mandates
Accumula,on of risk based on bank behavior and resilience to external
shocks
High importance when failures occur
Financial stability and un-‐stability
Mul,-‐dimensional holis,c regulatory framework Underpinned in well
devised risk assessment framework
Ø Variables are correlated
© HEC Montréal. All rights reserved. institutcoop.hec.ca
Annex
26
© HEC Montréal. All rights reserved. institutcoop.hec.ca 27
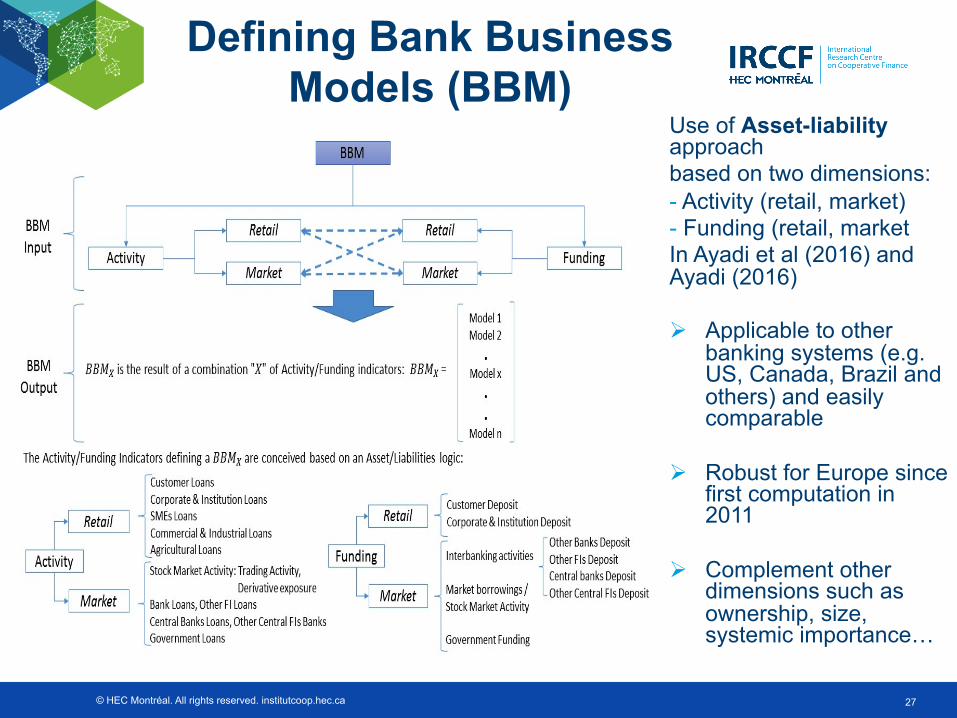
Defining Bank Business Models (BBM)
Use of Asset-liability approach based on two dimensions: - Activity (retail, market) - Funding (retail, market In Ayadi et al (2016) and Ayadi (2016) Ø Applicable to other
banking systems (e.g. US, Canada, Brazil and others) and easily comparable
Ø Robust for Europe since first computation in 2011
Ø Complement other
dimensions such as ownership, size, systemic importance…
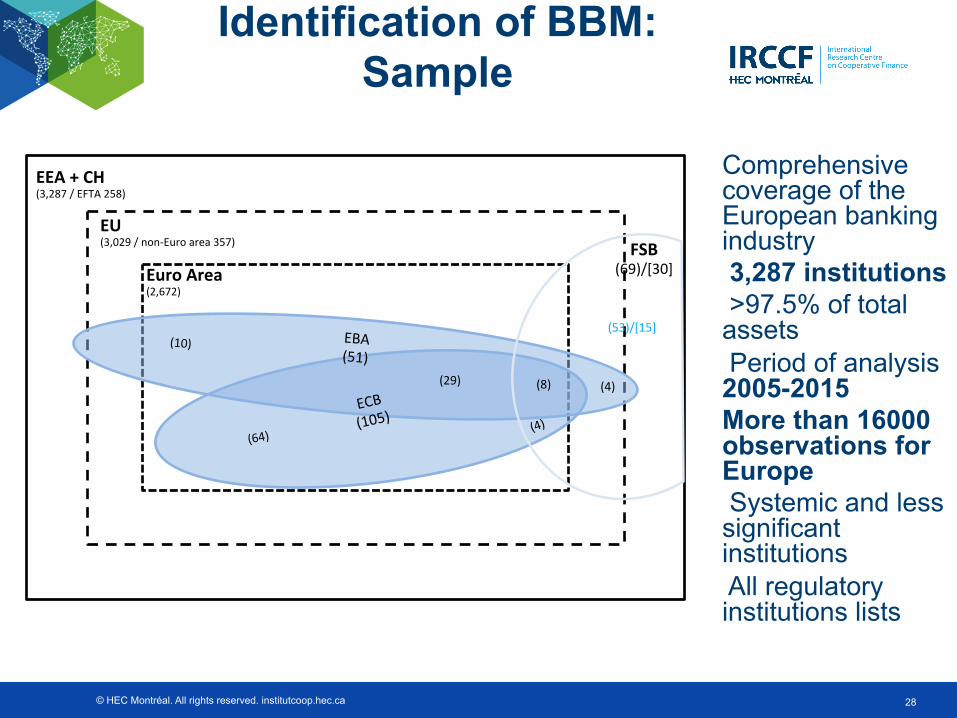
© HEC Montréal. All rights reserved. institutcoop.hec.ca 28
Identification of BBM: Sample
Comprehensive coverage of the European banking industry 3,287 institutions >97.5% of total assets Period of analysis 2005-2015 More than 16000 observations for Europe Systemic and less significant institutions All regulatory institutions lists
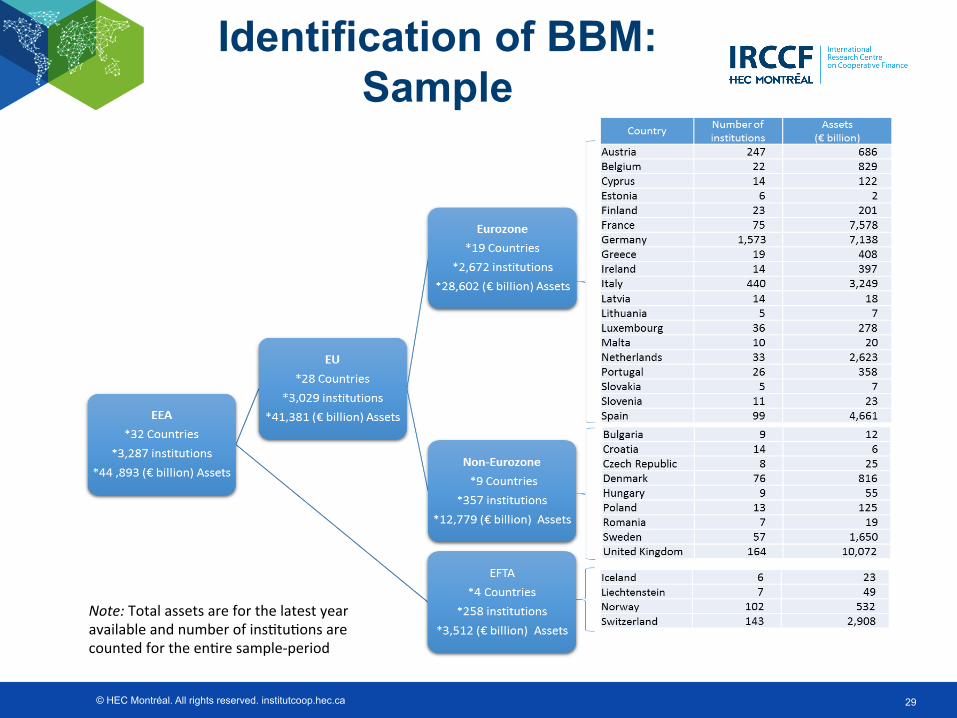
EEA + CH (3,287 / EFTA 258)
EU (3,029 / non-‐Euro area 357)
Euro Area (2,672)
ECB (105)
EBA (51)
(10)
(64)
(29) (4) (8)
FSB (69)/[30]
(4)
(53)/[15]
© HEC Montréal. All rights reserved. institutcoop.hec.ca 29
Identification of BBM: Sample
Note: Total assets are for the latest year available and number of ins,tu,ons are counted for the en,re sample-‐period

© HEC Montréal. All rights reserved. institutcoop.hec.ca
• Clustering analysis – statistical technique that assigns a set of observations into a distinct cluster used in Ayadi et al (2016)
– A particular bank-year observation is assigned to a business model – Selection of instruments which are the defining activity – funding features of the BM
• Loans to banks (as % of assets). This indicator measures the scale of wholesale and interbank activities, which proxy for exposures to risks arising from interconnectedness in the banking sector.
• Debt liabilities (as % of assets). These are defined as non-equity liabilities other than deposits and derivatives. Although bank liabilities are comprised of short-term interbank debt, the broader debt liabilities indicator provides a general insight into the bank’s exposure to market funding.
• Customer loans (as % of assets). This indicator identifies the share of customer loans to non-bank customers, indicating a reliance on more traditional banking activities.
• Trading assets (as % of assets). These are defined as non-cash assets other than loans; a greater value would indicate the prevalence of investment activities that are prone to market and liquidity risks.
• Derivative exposures (as % of assets). This measure aggregates the carrying value of all negative derivative exposures of a bank, which are often identified as one of the key (and most risky) financial exposures of banks with heavy investment and trading activities.
• Common tangible equity (as % of tangible assets). Control variable – Ward’s (1963) procedure to calculate the distance between clusters was used – Calinski & Harabasz’s (1974) pseudo-F index used to identify the optimal number of
clusters – Does not impose any probability distribution to the data collected – Methodology relies largely on the quality and granularity of data collected
30
Identification of BBM: Methodology

© HEC Montréal. All rights reserved. institutcoop.hec.ca
5 distinct banking models: - Focused retail - Diversified retail (Type 1) - Diversified retail (Type 2) - Wholesale - Investment
31
Standardized scores
Notes: Indicators marked with an asterisk (*) were used as instruments in the cluster analysis. The figures represent the number of standard devia,ons from the sample mean, implying that any observa,on above (below) the zero-‐axis is above (below) the sample mean.
Identification of BBM
-2
-1
0
1
2 Bank loans*
Bank liabilities
Customer loans*
Customer deposits Trading assets*
Debt liabilities*
Derivative exposures
Focused retail
Diversified retail (Type 1)
Diversified retail (Type 2)
Wholesale
Investment
Updated for data 2015
© HEC Montréal. All rights reserved. institutcoop.hec.ca 32
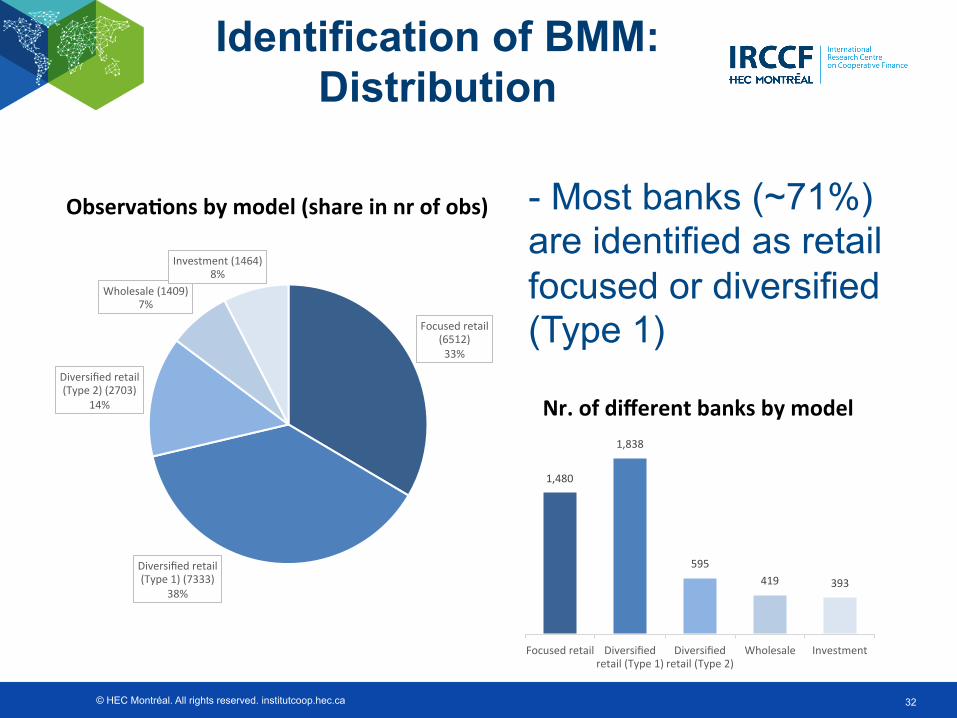
ObservaBons by model (share in nr of obs)
Nr. of different banks by model
- Most banks (~71%) are identified as retail focused or diversified (Type 1)
1,480
1,838
595 419 393
Focused retail Diversified retail (Type 1)
Diversified retail (Type 2)
Wholesale Investment
Identification of BMM: Distribution
Focused retail (6512) 33%
Diversified retail (Type 1) (7333)
38%
Diversified retail (Type 2) (2703)
14%
Wholesale (1409) 7%
Investment (1464) 8%
© HEC Montréal. All rights reserved. institutcoop.hec.ca 33
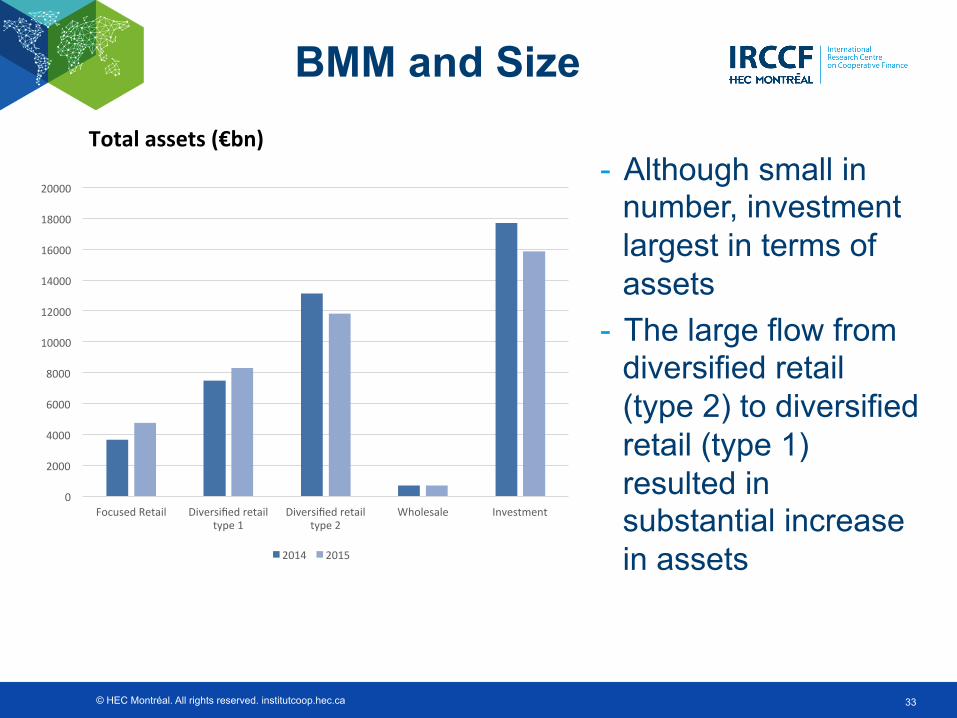
BMM and Size
- Although small in number, investment largest in terms of assets
- The large flow from diversified retail (type 2) to diversified retail (type 1) resulted in substantial increase in assets
Total assets (€bn)
0
2000
4000
6000
8000
10000
12000
14000
16000
18000
20000
Focused Retail Diversified retail type 1
Diversified retail type 2
Wholesale Investment
2014 2015
© HEC Montréal. All rights reserved. institutcoop.hec.ca
Public access to the publica,on hjp://financecoop.hec.ca/en/publica,ons/studies/banking-‐business-‐models-‐monitor-‐2015-‐europe/ Contact: Professor Rym Ayadi [email protected] [email protected] Disclaimer: Unless otherwise indicated, the views expressed are a8ributable only to the author’s in a personal capacity and not to any ins=tu=on with which they is associated.
34
Top Related