


Languages
Pages
Legal


U.S. employment situation: September 2013
Release date: October 22, 2013
July’s growth demonstrates the
resilience of the labor market
U.S. employment situation: July 2015 August 7, 2015
July 2015 employment summary
• After a bumpy beginning to 2015, the labor market continued its steady and upward trajectory with the addition of 215,000 net new jobs in
July. While slightly lower than the previous few months, year-to-date job creation now rests at 1.5 million and is in line with 2014.
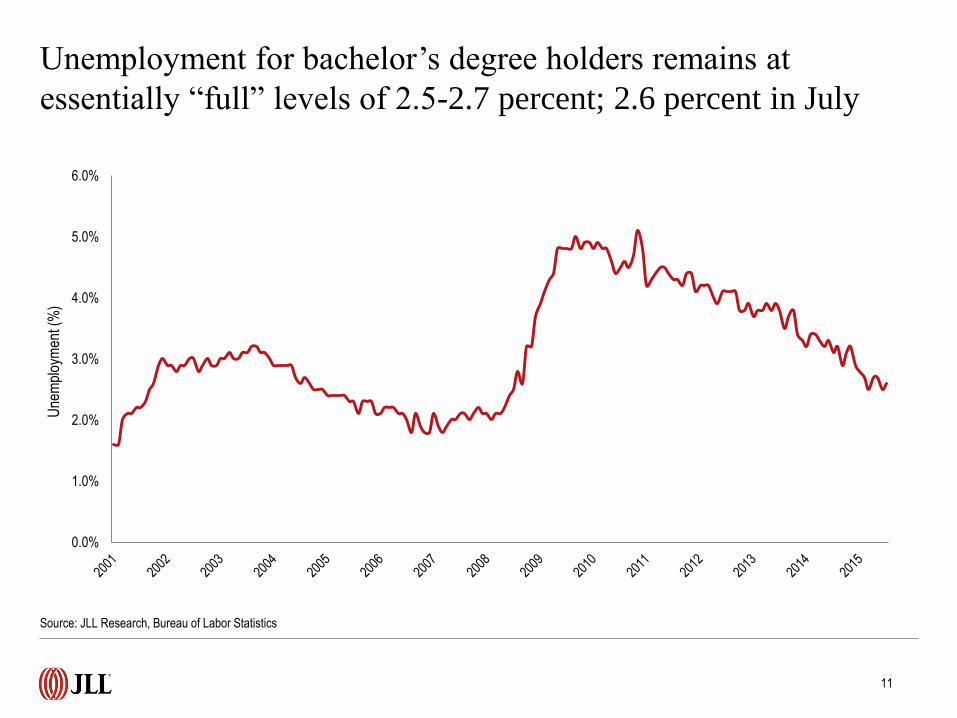
• Unemployment remained unchanged at 5.3 percent, while unemployment for college graduates continues to hover between 2.5 and 2.7
percent, slightly less than half the national rate. However, labor force participation remains relatively flat across demographic segments,
particularly for high-school graduates.
• Sustained employment and a looming talent crunch in major markets becoming more apparent have enabled wages to grow even more
above the rate of inflation, in part due to the ongoing collapse in energy prices. Private-sector wages are up 2.1 percent year-on-year, while
those in professional and business services are growing even faster at 2.6 percent.
• Office-using industries contributed 59,000 jobs to May’s growth, much lower than the past two months. This more muted level of growth
was not limited to the office-using sectors: durable goods, which had previously been powering improvements in manufacturing, contracted
moderately in July.
• At the market level, Silicon Valley saw 5.5-percent annual job growth, among the highest rates recorded for a JLL-tracked market this cycle.
Tech-heavy markets such as San Francisco and Seattle as well as the rapidly growing Sun Belt markets such as the Carolinas, South
Florida and Texas remain leaders, although Houston is beginning to see a sharp slowdown in employment growth to 1.9 percent, compared
to the nearly 4.0-percent growth just one year ago.
- Even slower-growth markets, particularly those in the Great Lakes, Midwest and Northeast, posted small but significant bumps in annual
growth rates.
Source: JLL Research, Bureau of Labor Statistics

July 2015 labor market at a glance
+215,000
1-month net change
+2,915,000
12-month net change
+782,000
10-year average annual growth
Source: JLL Research, Bureau of Labor Statistics
5.3%
Unemployment rate
-90bp
12-month change in unemployment
7.0%
10-year average unemployment
5,334,000
Job openings
5,000,000
Hires
2,699,000
Quits
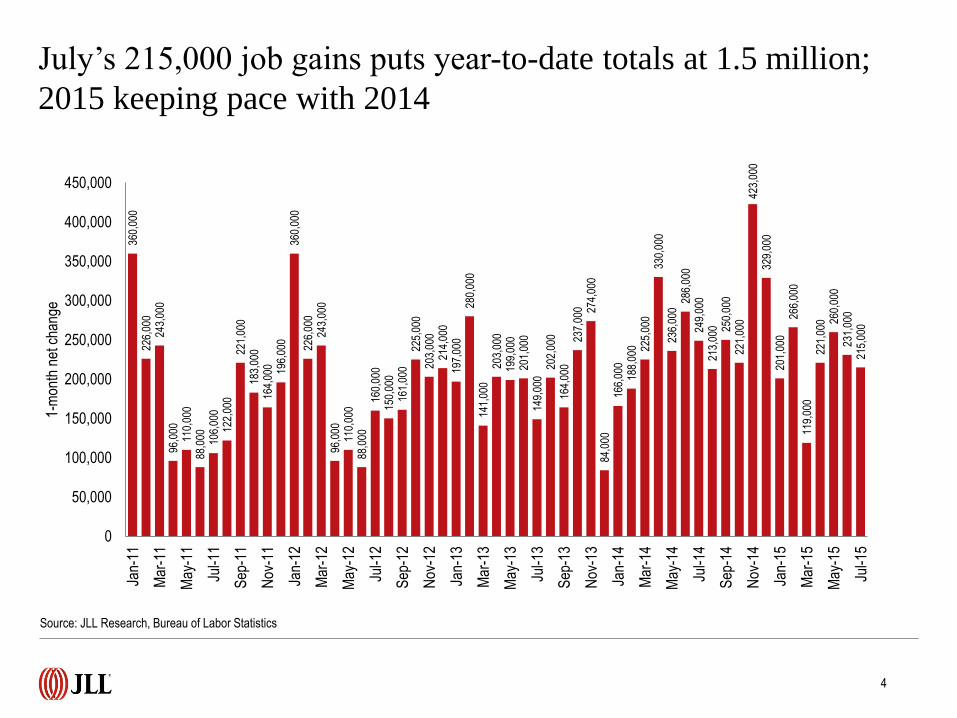
July’s 215,000 job gains puts year-to-date totals at 1.5 million;
2015 keeping pace with 2014 36
0,00
0 22
6,00
0 24
3,00
0 96
,000
11
0,00
0 88
,000
10
6,00
0 12
2,00
0 22
1,00
0 18
3,00
0 16
4,00
0 196,
000
360,
000
226,
000
243,
000
96,0
00
110,
000
88,0
00
160,
000
150,
000
161,
000
225,
000
203,
000
214,
000
197,
000
280,
000
141,
000
203,
000
199,
000
201,
000
149,
000
202,
000
164,
000
237,
000 27
4,00
0 84
,000
16
6,00
0 18
8,00
0 225,
000
330,
000
236,
000
286,
000
249,
000
213,
000 25
0,00
0 22
1,00
0 42
3,00
0 32
9,00
0 20
1,00
0 26
6,00
0 11
9,00
0 22
1,00
0 260,
000
231,
000
215,
000
0
50,000
100,000
150,000
200,000
250,000
300,000
350,000
400,000
450,000
Jan-
11
Mar
-11
May
-11
Jul-1
1
Sep
-11
Nov
-11
Jan-
12
Mar
-12
May
-12
Jul-1
2
Sep
-12
Nov
-12
Jan-
13
Mar
-13
May
-13
Jul-1
3
Sep
-13
Nov
-13
Jan-
14
Mar
-14
May
-14
Jul-1
4
Sep
-14
Nov
-14
Jan-
15
Mar
-15
May
-15
Jul-1
5
1-m
onth
net
cha
nge
4
Source: JLL Research, Bureau of Labor Statistics

Unemployment stable at 5.3 percent as job growth matches
volatility in labor market
0.0%
2.0%
4.0%
6.0%
8.0%
10.0%
12.0%
-1,000.0
-800.0
-600.0
-400.0
-200.0
0.0
200.0
400.0
600.0
Une
mpl
oym
ent r
ate
(%)
1-m
onth
net
cha
nge
(tho
usan
ds)
Monthly employment change Unemployment rate
Source: JLL Research, Bureau of Labor Statistics
5
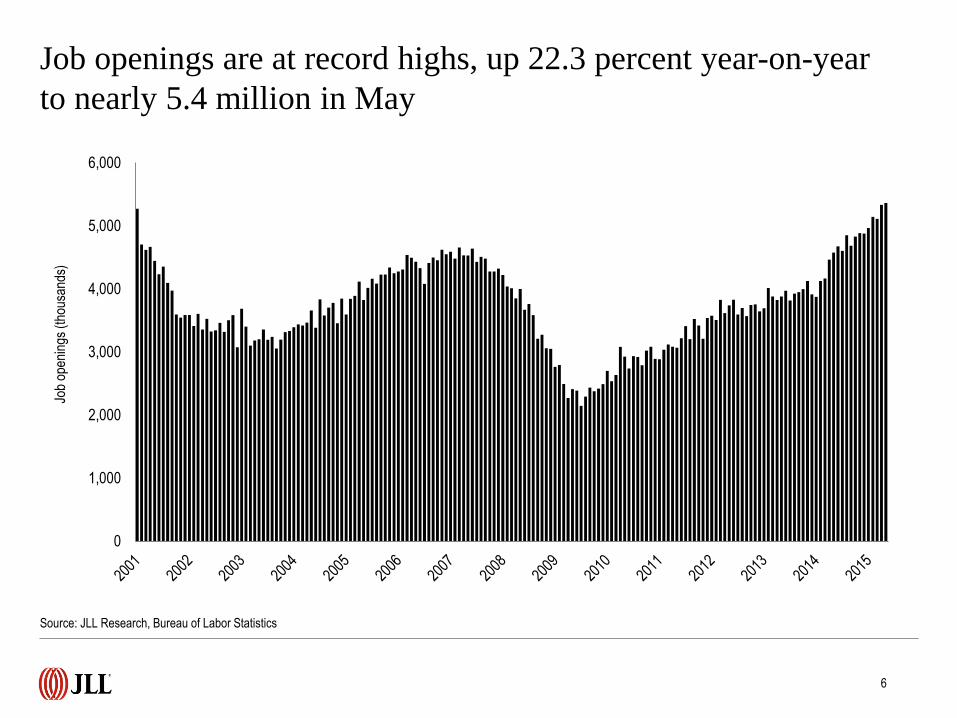
Job openings are at record highs, up 22.3 percent year-on-year
to nearly 5.4 million in May
Source: JLL Research, Bureau of Labor Statistics
6
0
1,000
2,000
3,000
4,000
5,000
6,000
Job
open
ings
(th
ousa
nds)
0.0
20.0
40.0
60.0
80.0
100.0
120.0
140.0
Con
sum
er c
onfid
ence
inde
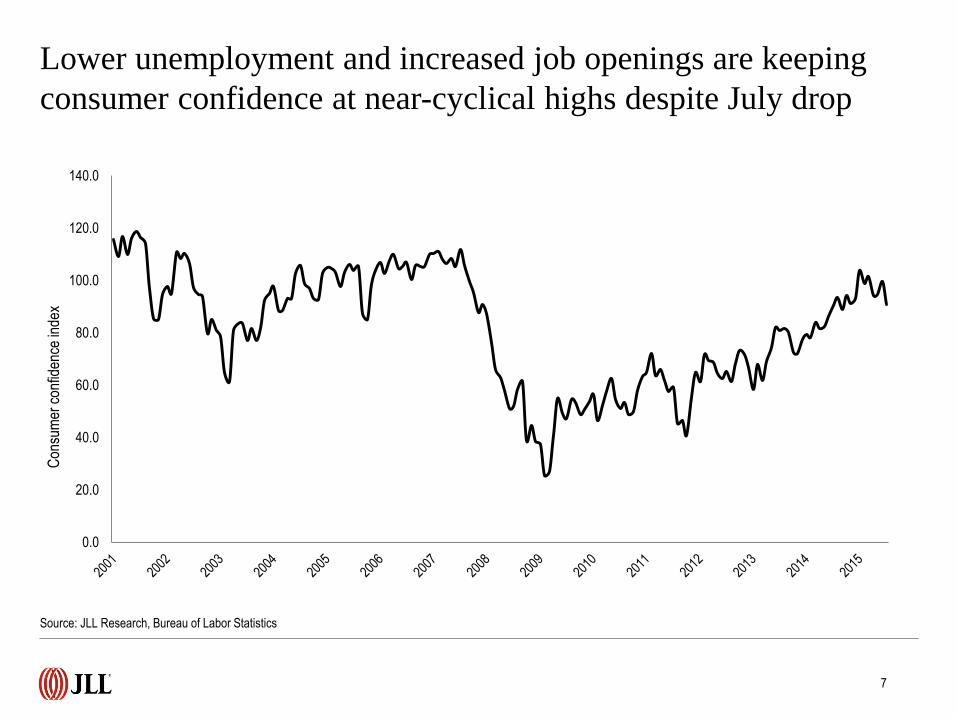
x Lower unemployment and increased job openings are keeping
consumer confidence at near-cyclical highs despite July drop
Source: JLL Research, Bureau of Labor Statistics
7

-8.9
-8.0
-4.0
-1.4
2.0
2.6
5.0
6.0
6.3
7.0
14.4
15.0
17.0
23.0
30.0
30.1
35.9
37.0
40.0
-20 -10 0 10 20 30 40 50
Temporary help services
Durable goods
Mining and logging
Motor vehicles and parts
Information
Utilities
Government
Construction
Wholesale trade
Other services
Transportation and warehousing
Manufacturing
Financial activities
Nondurable goods
Leisure and hospitality
Health care and social assistance
Retail trade
Education and health services
Professional and business services
1-month net change (thousands)
Monthly growth by industry more muted, with PBS, education,
health and retail growing at similar rates
Source: JLL Research, Bureau of Labor Statistics
8
PBS
Education and health
Retail trade
All other subsectors
Top three
subsectors
responsible for
52.6 percent of
monthly
growth.

A sharp uptick in non-durable goods pushed goods-producing
employment to its highest monthly gain in 2015 (+17,000)
-1,000.0
-800.0
-600.0
-400.0
-200.0
0.0
200.0
400.0
600.0
2008 2009 2010 2011 2012 2013 2014 2015
1-m
onth
net
cha
nge
(tho
usan
ds)
Goods-producing Service-providing
Source: JLL Research, Bureau of Labor Statistics
9

-64.0
11.6
39.5
53.0
62.0
62.0
80.0
84.4
97.0
125.3
145.5
156.0
159.0
231.0
321.7
436.0
526.6
572.0
666.0
-200 0 200 400 600 800
Mining and logging
Utilities
Motor vehicles and parts
Information
Nondurable goods
Government
Other services
Wholesale trade
Durable goods
Temporary help services
Transportation and warehousing
Financial activities
Manufacturing
Construction
Retail trade
Leisure and hospitality
Health care and social assistance
Education and health services
Professional and business services
12-month net change (thousands)
PBS
Education and health
Leisure and hospitality
Retail trade
Manufacturing
Financial activities
All other jobs
Mining and logging continues to see annual job losses due to
unstable oil prices; PBS leads with 666,000 new jobs created
Source: JLL Research, Bureau of Labor Statistics
10
Core subsectors added 76.2 percent
of all jobs over the past 12 months.
0.0%
1.0%
2.0%
3.0%
4.0%
5.0%
6.0%
Une
mpl
oym
ent (
%)
Unemployment for bachelor’s degree holders remains at
essentially “full” levels of 2.5-2.7 percent; 2.6 percent in July
Source: JLL Research, Bureau of Labor Statistics
11
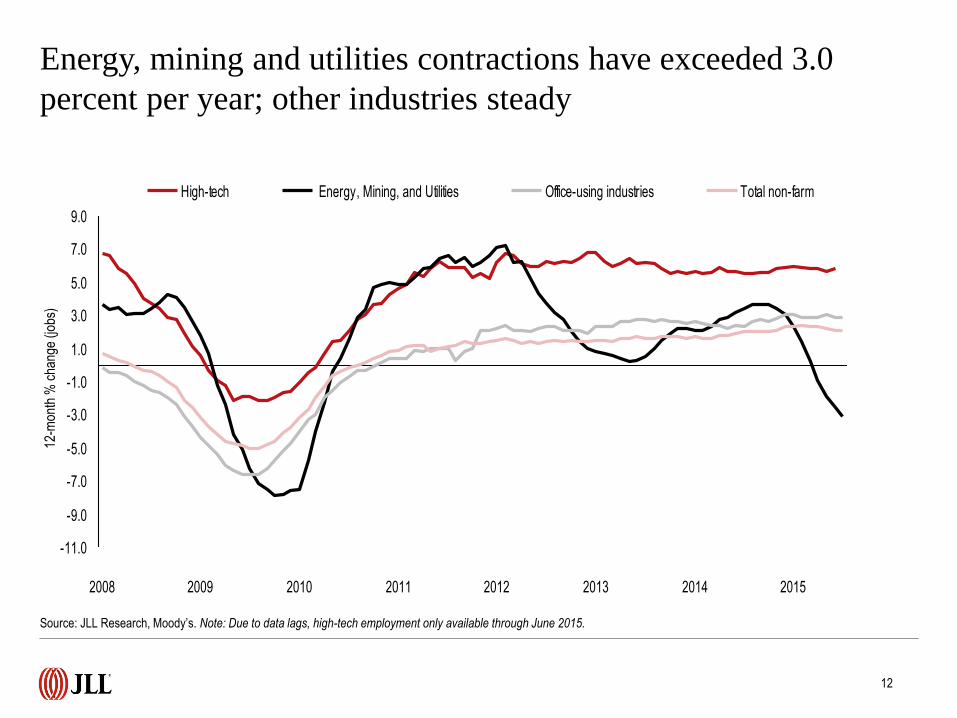
Energy, mining and utilities contractions have exceeded 3.0
percent per year; other industries steady
-11.0
-9.0
-7.0
-5.0
-3.0
-1.0
1.0
3.0
5.0
7.0
9.0
2008 2009 2010 2011 2012 2013 2014 2015
High-tech Energy, Mining, and Utilities Office-using industries Total non-farm
Source: JLL Research, Moody’s. Note: Due to data lags, high-tech employment only available through June 2015.
12
12-m
onth
% c
hang
e (jo
bs)

Tech job creation continues to hover slightly below 6.0 percent
due to sustained industry demand Year-on-year percent employment growth
Source: JLL Research, Bureau of Labor Statistics
13

Weekly claims over the course of 2015 have averaged just
285,000 and have remained relatively flat
Source: JLL Research, U.S. Department of Labor
14
200,000
250,000
300,000
350,000
400,000
450,000
500,000
550,000
600,000
650,000
700,000
Cla
ims
Initial claims 4-week moving average
0
1,000
2,000
3,000
4,000
5,000
6,000
2007 2008 2009 2010 2011 2012 2013 2014 2015
Hire
s an
d qu
its (
thou
sand
s)
Hires Quits
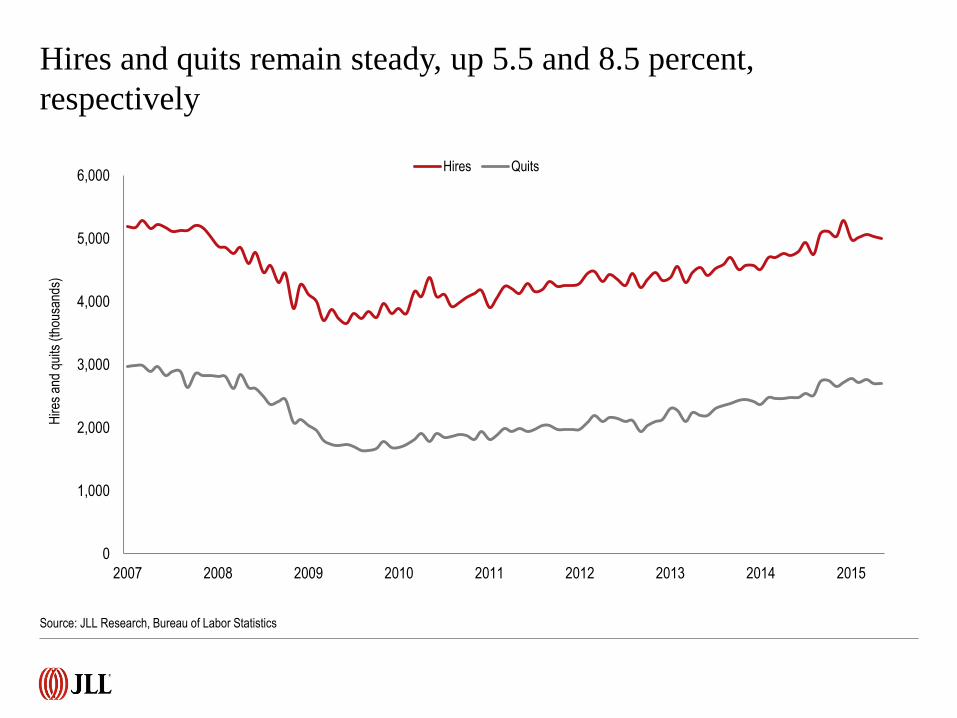
Hires and quits remain steady, up 5.5 and 8.5 percent,
respectively
Source: JLL Research, Bureau of Labor Statistics
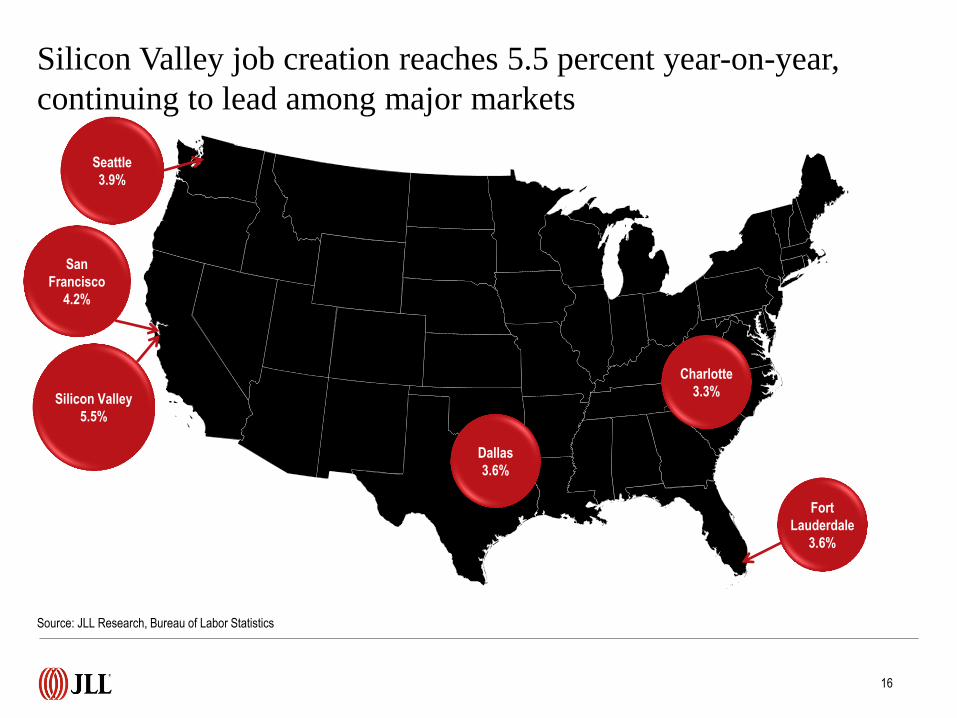
Silicon Valley job creation reaches 5.5 percent year-on-year,
continuing to lead among major markets
Source: JLL Research, Bureau of Labor Statistics
16
Silicon Valley
5.5%
San
Francisco
4.2%
Fort
Lauderdale
3.6%
Seattle
3.9%
Dallas
3.6%
Charlotte
3.3%
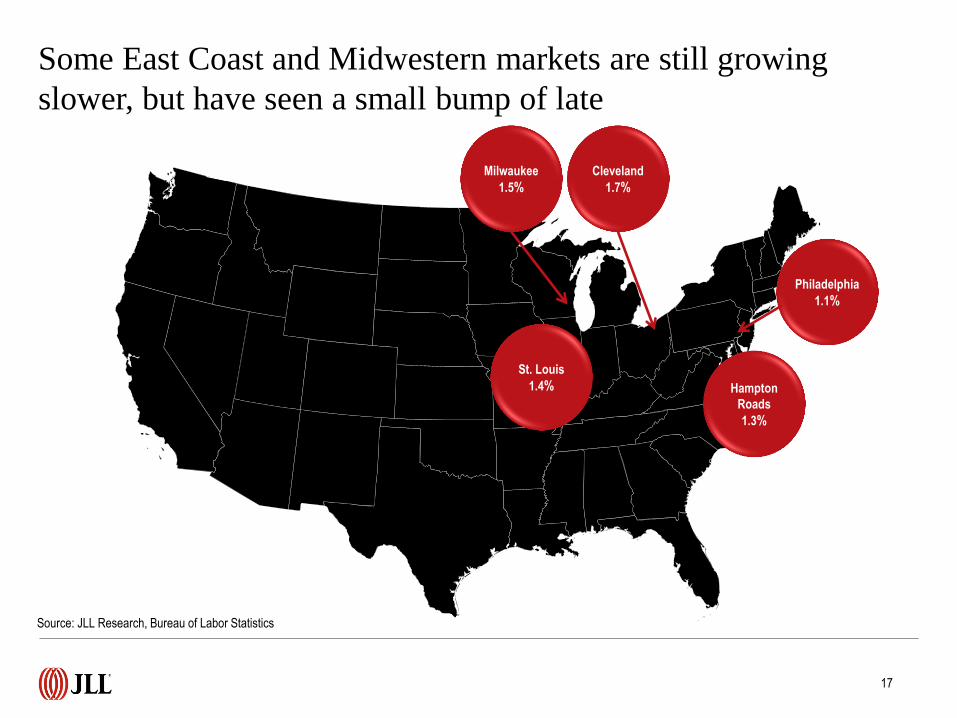
Some East Coast and Midwestern markets are still growing
slower, but have seen a small bump of late
17
Source: JLL Research, Bureau of Labor Statistics
Hampton
Roads
1.3%
St. Louis
1.4%
Milwaukee
1.5%
Cleveland
1.7%
Philadelphia
1.1%
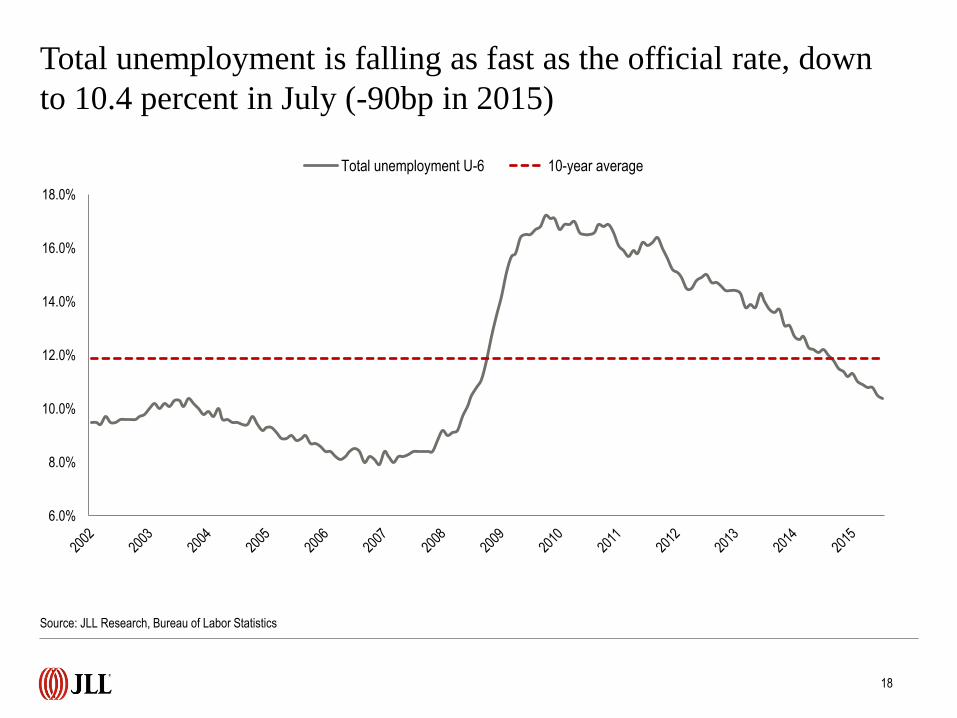
Total unemployment is falling as fast as the official rate, down
to 10.4 percent in July (-90bp in 2015)
6.0%
8.0%
10.0%
12.0%
14.0%
16.0%
18.0%
Total unemployment U-6 10-year average
Source: JLL Research, Bureau of Labor Statistics
18
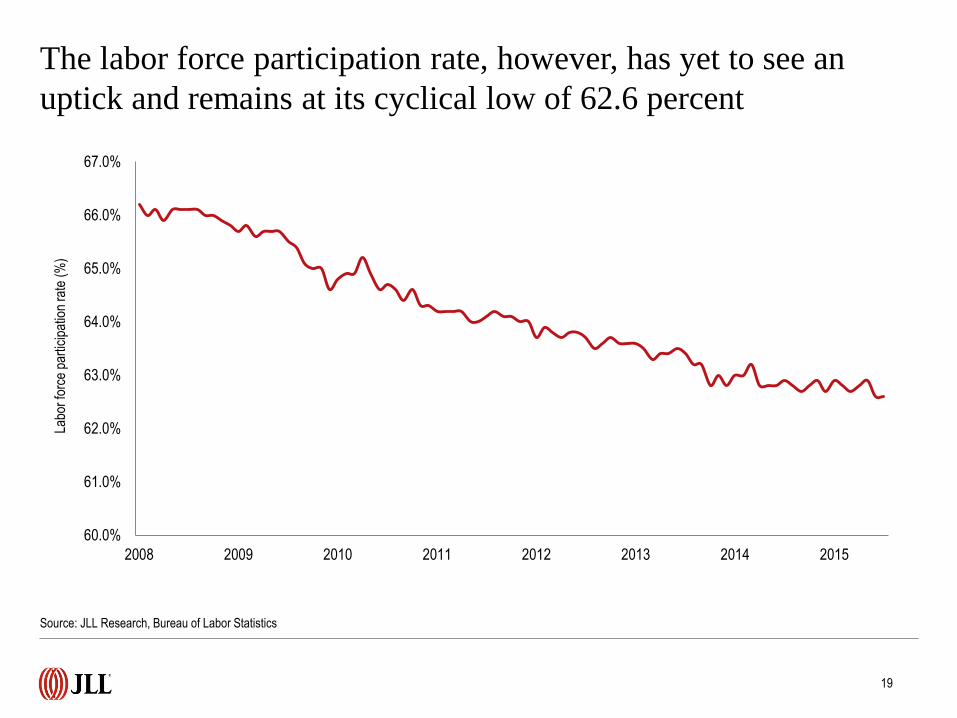
The labor force participation rate, however, has yet to see an
uptick and remains at its cyclical low of 62.6 percent
Source: JLL Research, Bureau of Labor Statistics
19
60.0%
61.0%
62.0%
63.0%
64.0%
65.0%
66.0%
67.0%
2008 2009 2010 2011 2012 2013 2014 2015
Labo
r fo
rce
part
icip
atio
n ra
te (
%)
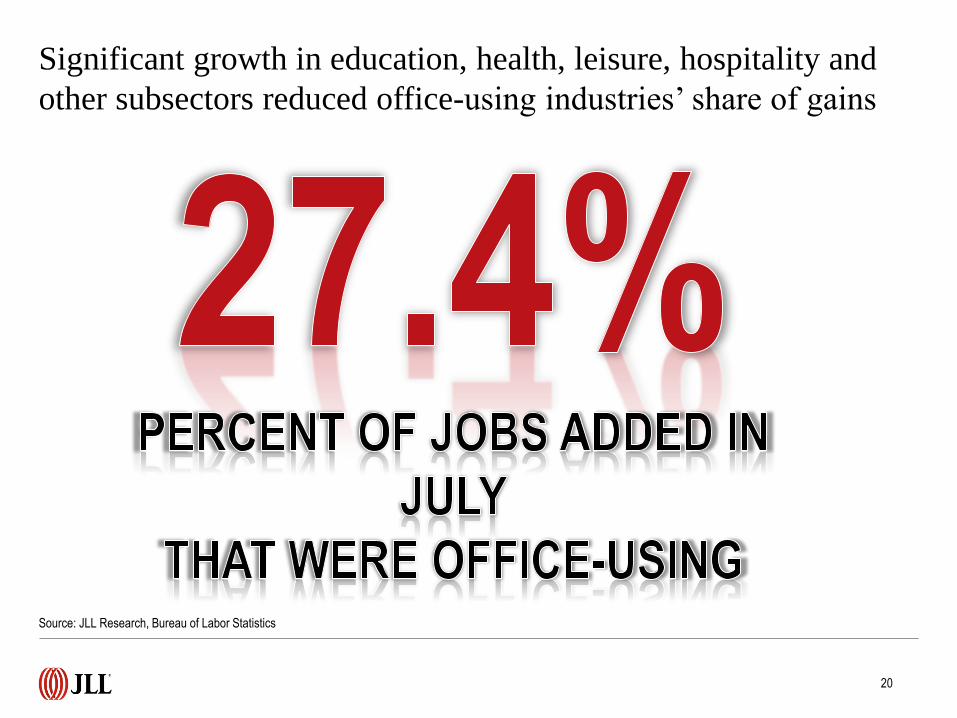
Significant growth in education, health, leisure, hospitality and
other subsectors reduced office-using industries’ share of gains
Source: JLL Research, Bureau of Labor Statistics
20

PBS’ slowdown to 40,000 new jobs was likely a monthly
aberration; financial activities steady at 17,000 new jobs
-300
-250
-200
-150
-100
-50
0
50
100
150
200
2009 2010 2011 2012 2013 2014 2015
Information Professional and business services Financial activities
Source: JLL Research, Bureau of Labor Statistics
21
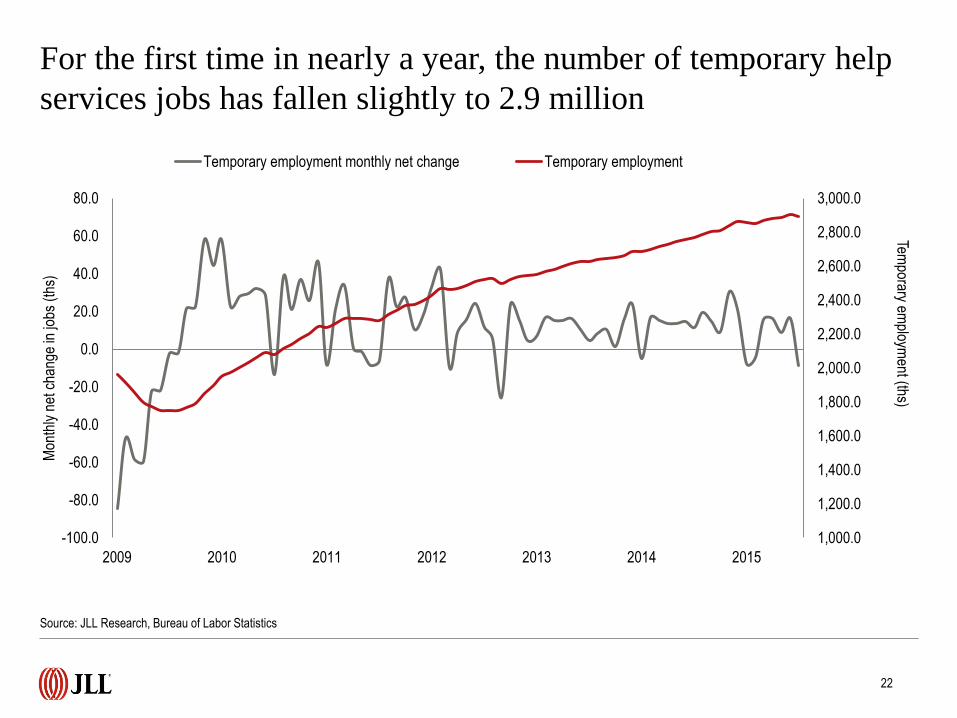
For the first time in nearly a year, the number of temporary help
services jobs has fallen slightly to 2.9 million
1,000.0
1,200.0
1,400.0
1,600.0
1,800.0
2,000.0
2,200.0
2,400.0
2,600.0
2,800.0
3,000.0
-100.0
-80.0
-60.0
-40.0
-20.0
0.0
20.0
40.0
60.0
80.0
2009 2010 2011 2012 2013 2014 2015
Mon
thly
net
cha
nge
in jo
bs (
ths)
Temporary employment monthly net change Temporary employment
Temporary em
ployment (ths)
Source: JLL Research, Bureau of Labor Statistics
22

©2015 Jones Lang LaSalle Research IP, Inc. All rights reserved. All information contained herein is from sources deemed reliable; however, no representation or warranty is made to the accuracy thereof.
For more information, please contact:
Ben Breslau
Managing Director - Americas Research
John Sikaitis
Managing Director - Office and Local Markets Research
Phil Ryan
Research Analyst – Office and Economy Research
Or, find more employment, business and real estate
research at jll.com.
>>> Click here to check it out.
Top Related