


Languages
Pages
Legal


Asia Pacific Energy Research Centre
APERC Workshop The 49th APEC Energy Working Group and Associated Meetings
Gyeongju, Republic of Korea, 22 June, 2015
6th APEC Energy Demand and Supply Outlook
Cecilia TamDeputy Vice President, APERC

2APERC Asia Pacific Energy Research Centre
Business as Usual (BAU) Scenario

3APERC Asia Pacific Energy Research Centre
0
1000
2000
3000
4000
5000
6000
7000
8000
2012 2020 2030 2040
Mto
e
Non-energy
Agricultural andnon-specified
Commercial
Residential
Transport
Industry
APEC Total Final Energy Demand
Energy demand rises 50% by 2040, led by higher demand in transport
Source: APERC Analysis
Preliminary results

4APERC Asia Pacific Energy Research Centre
Growth in Final Energy Demand compared to 2012
China and South East Asia account for nearly 90% of all additional demand
Note: Oceania (Australia, New Zealand and PNG), Other Americas (Canada, Chile, Mexico and Peru), Other North East Asia (Hong Kong, Japan, Korea and Chinese Taipei), South East Asia (Brunei Darussalam, Indonesia, Malaysia, Philippines, Singapore, Thailand and Vietnam)
-500
0
500
1000
1500
2000
2500
2020 2030 2040
Mto
e
South East Asia
Oceania
Other Americas
Other NE Asia
Russia
US
China
Source: APERC Analysis
Preliminary results

5APERC Asia Pacific Energy Research Centre
2012 20400
2000
4000
6000
8000
10000
12000
HydroNuclearOther RenewablesGasOilCoal
Axis Title
Mto
eFossil Fuels Continue to Dominate
Fuel Shares 1990 2012 2040
Coal 27.9% 37.5% 34.3%Oil 35.7% 28.3% 28.6%Gas 20.2% 20.2% 22.2%Hydro 1.9% 2.2% 2.7%Other Renewables 8.6% 7.2% 7.9%Nuclear 5.8% 4.6% 4.2%
86% Fossi
lfuel
85% Fossi
lfuel
Natural gas demand will increase by 57% in 2040 from 2012 level while hydro and other renewables will increase by 63% within the same period.
Source: APERC Analysis
Preliminary results

6APERC Asia Pacific Energy Research Centre
APEC Energy Supply Gap
1990
2000
2012
2030
2040
-2000 -1000 0 1000 2000 3000 4000
-402
-353
-569
-812
-1004
494
680
772
778
785
304
650
345386
1594
1784
-243
-276 251
ChinaRussiaOther NEAUSOther AmericasOceaniaSEA
Mtoe
Axis Title
Net Exporter Net Importer
Supply gap is define as demand minus production.
Source: APERC Analysis
Preliminary results

7APERC Asia Pacific Energy Research Centre
Generation, 2012 and 2040 [TWh]
Electricity Generation By Region 7
[TWh]
2012 20400
2000400060008000
1000012000 China
Axis Title
2012 20400
200400600800
100012001400 Russia
Axis Title
2012 20400
1000
2000
3000
4000
5000
6000 United States
Axis Title
2012 20400
500
1000
1500
2000Other Amer-
icas
Axis Title
2012 20400
100
200
300
400
500 Oceania
Axis Title
2012 20400
500
1000
1500
2000
2500
3000 SE Asia
Axis Title
China and South East Asia drive future electricity demand in APEC
Note: This map is for illustrative purposes and is without prejudice to the status of or sovereignty over any territory covered by this map. Source: APERC Analysis
Preliminary results
2012 20400
500
1000
1500
2000
2500Other NEA

8APERC Asia Pacific Energy Research Centre
APEC Energy Investment in Energy Supply
Low Cost Investment Case – USD 24 Trillion High Cost Investment Case – USD 73 Trillion
Total Energy Investment by Sub-Sector
Investments in power and upstream dominate the energy sector. Power sector investments are estimated to range from US$ 8 trillion to US$ 36 trillion, while those for upstream production range from US$ 14 trillion to US$ 30.5 trillion
(In USD Trillion)
(Source: APERC Analysis)
Note: Upstream (oil, gas and coal production), Downstream (refinary, LNG import and expoert terminals), Transport (oil, gas and coal) and Power (generation, transmission and distribution
Preliminary results
14.01
1.01
8.11
0.86Upstream (Oil, Gas and Coal Production)
Downstream (Refinery and LNG Import and Export Terminals)
Power (Generating Capac-ity, Transmission and Distribution Lines)
Transport (Oil, Gas and Coal Transport)

9APERC Asia Pacific Energy Research Centre
Alternative Scenarios

10APERC Asia Pacific Energy Research Centre
1990 1995 2000 2005 2010 2015 2020 2025 2030 2035 204040
50
60
70
80
90
100
110
120
130
140
Chart Title
BAU Energy Intensity Index Alternative Energy Intensity Index
Axis Title
Energ
y inte
nsit
y index (
2005 b
ase y
ear)
APEC’s Energy Intensity BAU vs Alternative
APEC’s target in 2035 can be met under the alternative scenario
Source: APERC Analysis
45% reduction target
Preliminary results

11APERC Asia Pacific Energy Research Centre
Energy Savings Compared to BAU
-
50
100
150
200
250
300
350
400
Indust
ry
Tra
nsp
ort
Res
iden
tial
Indust
ry
Tra
nsp
ort
Res
iden
tial
Indust
ry
Tra
nsp
ort
Res
iden
tial
2020 2030 2040
Mto
e
South East Asia
Oceania
Other Americas
Other NE Asia
Russia
US
China
Preliminary results
Source: APERC Analysis

12APERC Asia Pacific Energy Research Centre
Renewables in APEC – 2012, 2030 and 2040
Source: APERC Analysis
2012 BAU: 761 GW2030 High Renewables (HR): 2,526 GW2040 High Renewables (HR): 2,874 GW
China
Russia
United States
Other North East Asia
Other Americas
South East Asia
Note: This map is for illustrative purposes and is without prejudice to the status of or sovereignty over any territory covered by this map.
BAU-2012
HR-2030
HR-2040
0
500
1000
1500
Axis TitleBAU-2012
HR-2030 HR-2040
0
50
100
150
200
250
300
Axis Title
BAU-2012
HR-2030
HR-2040
0
20
40
60
80
100
Axis TitleBAU-2012
HR-2030 HR-2040
0
50
100
150
200
250
300
Axis Title
BAU-2012
HR-2030
HR-2040
0
50
100
150
200
Axis Title
Oceania
BAU-2012
HR-2030
HR-2040
0
100
200
300
400
500
600
Axis Title
BAU-2012
HR-2030
HR-2040
0
50
100
150
200
250
300
350
400
Axis Title
#REF!
Geothermal
Other Renewables
Solar
Wind
Hydro
Preliminary results

13APERC Asia Pacific Energy Research Centre
Renewables in Transport
• Just considering the gov’t blend targets, the share of biofuels will more than double from 2.2% in the total transport demand in 2010 to 6.0% in 2030
• However as only 1st generation biofuels are assumed in the model, supply potential for bioethanol for both BAU and high supply does not meet the demand by 2020 onwards.
Source: APERC Analysis
Mtoe 2010 2020 2030 2040
Hi-Bioethanol Demand
26 78 91 89
Hi-Biodiesel Demand 2 20 34 42
Hi-Supply, Bioethanol
57 68 83 101
Hi-Supply, Biodiesel 22 33 48 66
Preliminary results

14APERC Asia Pacific Energy Research Centre
• The scenario strives to maximize the use of clean coal, natural gas and nuclear in the electricity generation of APEC member economies
• To illustrate the hypothetical effects and policy implications from drastic changes in the power mix
Alternative Power Mix Scenario

15APERC Asia Pacific Energy Research Centre
Alternative Power Mix
APEC’s electricity generation, 2012 and 2040: Preliminary results
Actual BAU Cleaner Coal
High Nuc High Gas(50%)
High Gas(100%)
2012 2040
0
5,000
10,000
15,000
20,000
25,000 Chart Title
Other Re-newables
Hydro
Oil
Gas
Coal
Nuclear
Axis Title
TW
h
Data excludes importsSource: APERC Analysis

16APERC Asia Pacific Energy Research Centre
CO2 Emissions in Power Sector
Preliminary results
Source: APERC Analysis
6
7
8
9
10
11
12
2012 2020 2030 2040
Gt CO
2
BAU High Nuc
Cleaner Coal with CCS Cleaner Coal no CCS
High Gas (50%) High Gas (100%)
17APERC Asia Pacific Energy Research Centre
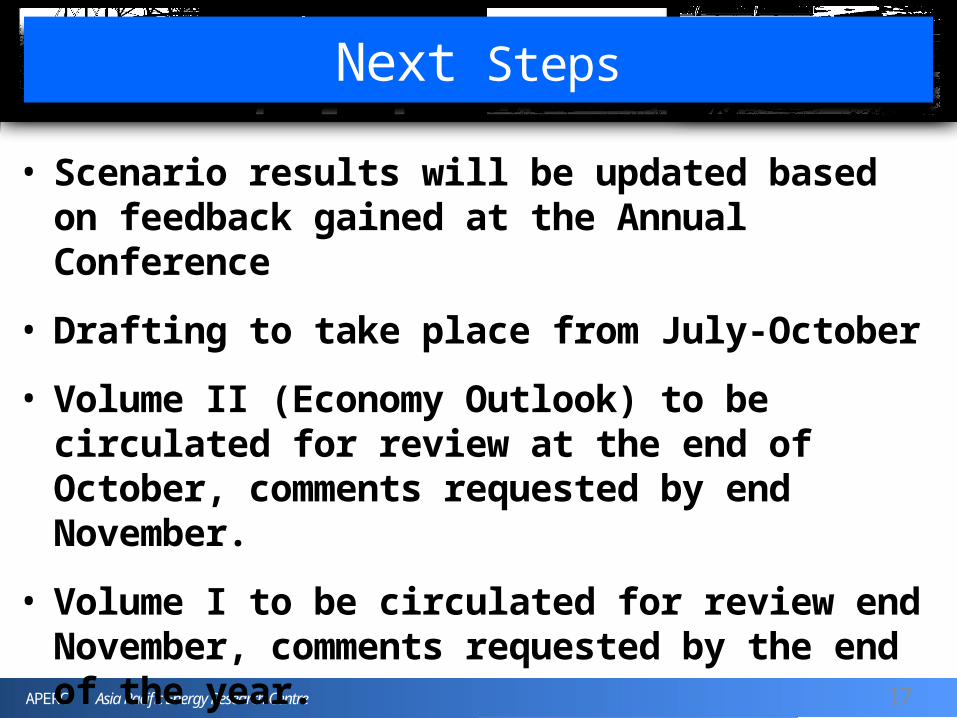
• Scenario results will be updated based on feedback gained at the Annual Conference
• Drafting to take place from July-October
• Volume II (Economy Outlook) to be circulated for review at the end of October, comments requested by end November.
• Volume I to be circulated for review end November, comments requested by the end of the year.
• Release Spring 2016
Next Steps

APERC Asia Pacific Energy Research Centre
We look forward to your feedback on APERC’s Outlook!

19APERC Asia Pacific Energy Research Centre
Part 1 – APEC Demand and Supply under BAU Case• Introduction• Final Energy Demand• Primary Energy Supply• Outlook for Power
Part 2 – APEC Demand and Supply under
Alternative Scenarios• APEC Energy Intensity Goal• APEC Doubling Renewable Energy Goal• Alternative Power Mix Scenarios• Energy Investments• Implications for Energy Security and Climate
Change
Table of Contents of 6th edition Vol I

20APERC Asia Pacific Energy Research Centre
• Key Messages
• Economy Overview• Business as Usual
• Alternative Scenarios APEC Energy intensity goal APEC Doubling renewables goal Alternative power mix
• Scenario Implications Energy investments Sustainable energy future Opportunities for policy action
Table of Contents of 6th edition Vol II
Top Related