


Languages
Pages
Legal

March 2015
Arvind Limited At An Inflection
2
Agenda
• Snapshot and Overall Growth Vision
• Division-wise Roadmap
• Summary and Conclusion: Overall Value Creation Path
3
Agenda
• Snapshot and Overall Growth Vision
• Division-wise Roadmap
• Summary and Conclusion: Overall Value Creation Path
4
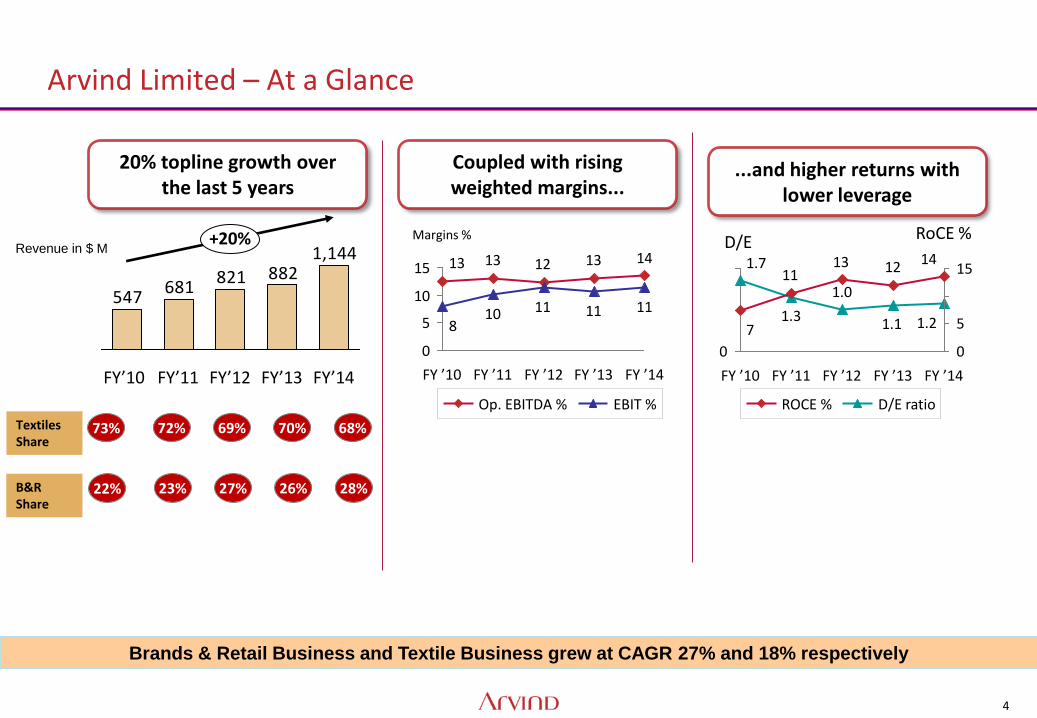
Arvind Limited – At a Glance
20% topline growth over the last 5 years
1413121313
111111108
0
5
10
15
Margins %
FY ’14 FY ’13 FY ’12 FY ’11 FY ’10
EBIT % Op. EBITDA %
Coupled with rising weighted margins...
...and higher returns with lower leverage
1.21.1
1.0
1.3
1.7 14121311
7
15
5
0 0
RoCE % D/E
FY ’14 FY ’13 FY ’12 FY ’11 FY ’10
D/E ratio ROCE %
1,144882821
681547
+20%
FY’14 FY’13 FY’12 FY’11 FY’10
Textiles Share
B&R Share
73% 72% 69% 70% 68%
22% 23% 27% 26% 28%
Brands & Retail Business and Textile Business grew at CAGR 27% and 18% respectively
Revenue in $ M
5
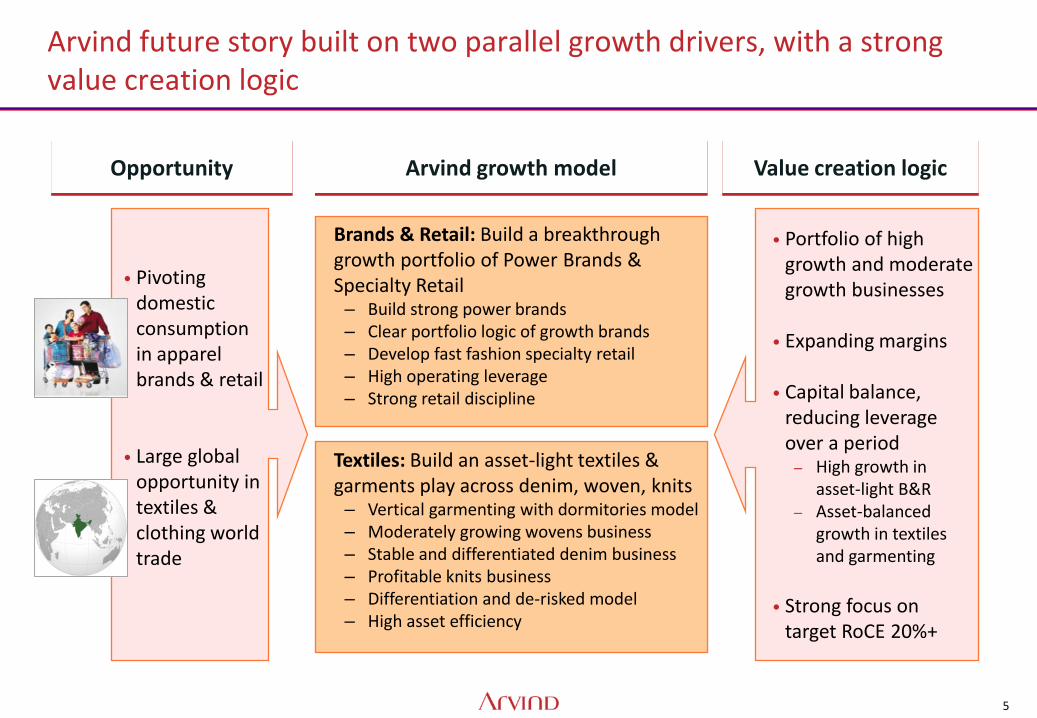
• Pivoting domestic consumption in apparel brands & retail
• Large global opportunity in textiles & clothing world trade
Arvind future story built on two parallel growth drivers, with a strong value creation logic
Textiles: Build an asset-light textiles & garments play across denim, woven, knits – Vertical garmenting with dormitories model – Moderately growing wovens business – Stable and differentiated denim business – Profitable knits business – Differentiation and de-risked model – High asset efficiency
Opportunity Arvind growth model Value creation logic
Brands & Retail: Build a breakthrough growth portfolio of Power Brands & Specialty Retail – Build strong power brands – Clear portfolio logic of growth brands – Develop fast fashion specialty retail – High operating leverage – Strong retail discipline
• Portfolio of high growth and moderate growth businesses
• Expanding margins
• Capital balance, reducing leverage over a period – High growth in
asset-light B&R – Asset-balanced
growth in textiles and garmenting
• Strong focus on
target RoCE 20%+
6
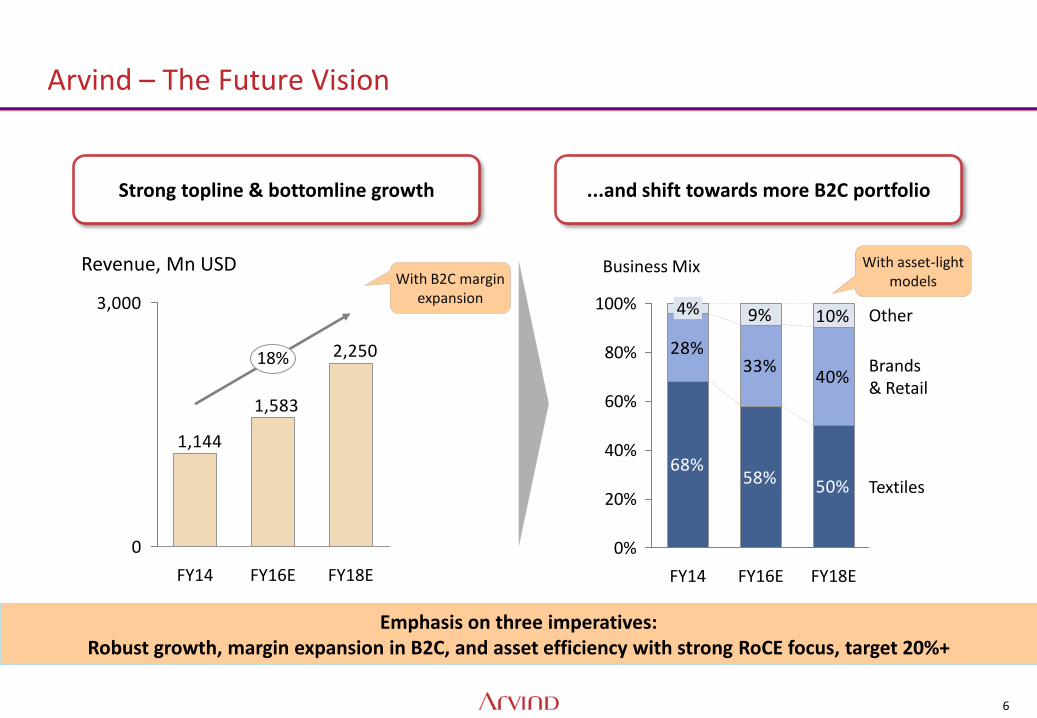
Arvind – The Future Vision
2,250
1,583
1,144
0
3,000
Revenue, Mn USD
18%
FY18E FY16E FY14
With B2C margin expansion
68%58% 50%
28%33%
40%
9% 10%
0%
100%
60%
40%
20%
80%
Textiles
Brands & Retail
Other
Business Mix
FY18E FY16E FY14
4%
...and shift towards more B2C portfolio Strong topline & bottomline growth
With asset-light models
Emphasis on three imperatives: Robust growth, margin expansion in B2C, and asset efficiency with strong RoCE focus, target 20%+
7
Agenda
• Snapshot and Overall Growth Vision
• Division-wise Roadmap
• Summary and Conclusion: Overall Value Creation Path
8
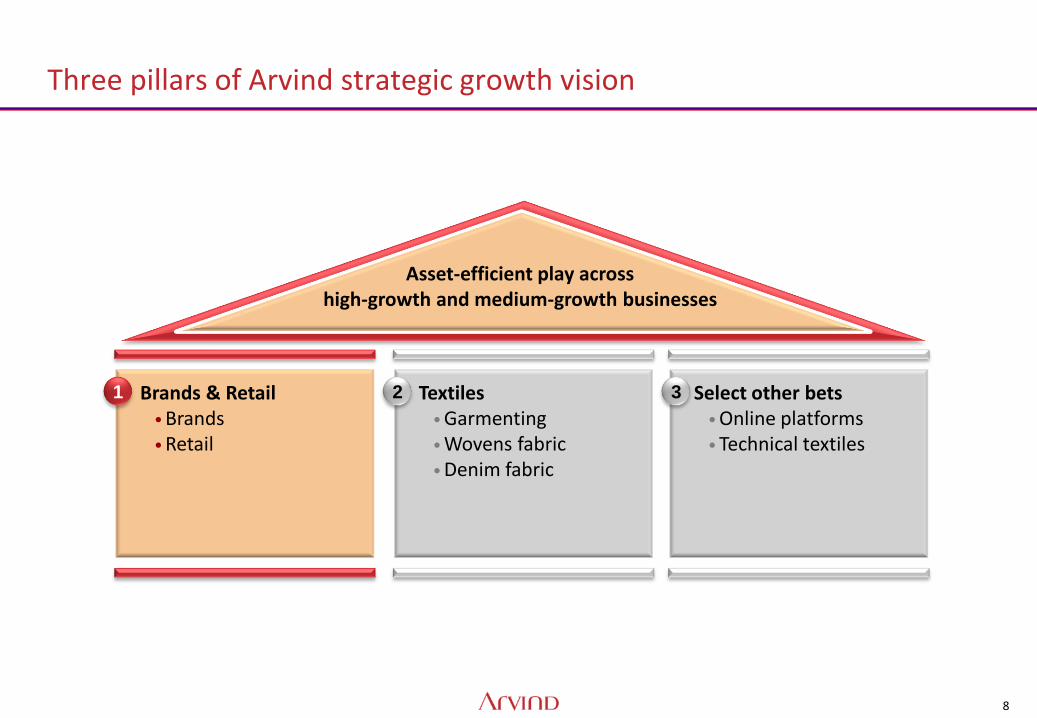
Textiles • Garmenting • Wovens fabric • Denim fabric
Brands & Retail • Brands • Retail
Select other bets • Online platforms • Technical textiles
Three pillars of Arvind strategic growth vision
Asset-efficient play across high-growth and medium-growth businesses
1 2 3
9
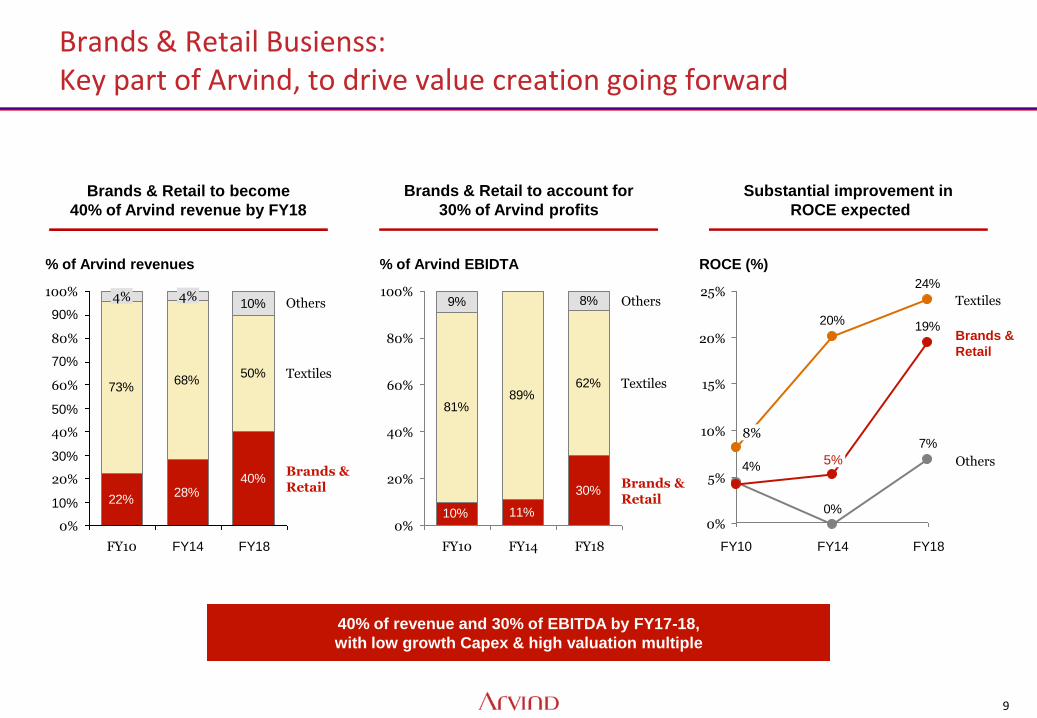
Brands & Retail Busienss: Key part of Arvind, to drive value creation going forward
Brands & Retail to become
40% of Arvind revenue by FY18
Brands & Retail to account for
30% of Arvind profits
Substantial improvement in
ROCE expected
22%28%
40%
73%68%
50%
10%
50%
70%
90%
100%
80%
60%
40%
20%
0%
10%
30%
% of Arvind revenues
Brands & Retail
Textiles
Others
FY18 FY14
4%
FY10
4%
11%
30%
81%
62%
9% 8%
10%
89%
100%
80%
60%
40%
20%
0%
% of Arvind EBIDTA
Brands & Retail
Textiles
Others
FY18 FY14 FY10
7%
0%
4%
24%
20% 19%
25%
20%
15%
10%
5%
0%
Textiles
Others
FY18
ROCE (%)
Brands &
Retail
FY14
5%
FY10
8%
40% of revenue and 30% of EBITDA by FY17-18,
with low growth Capex & high valuation multiple
10
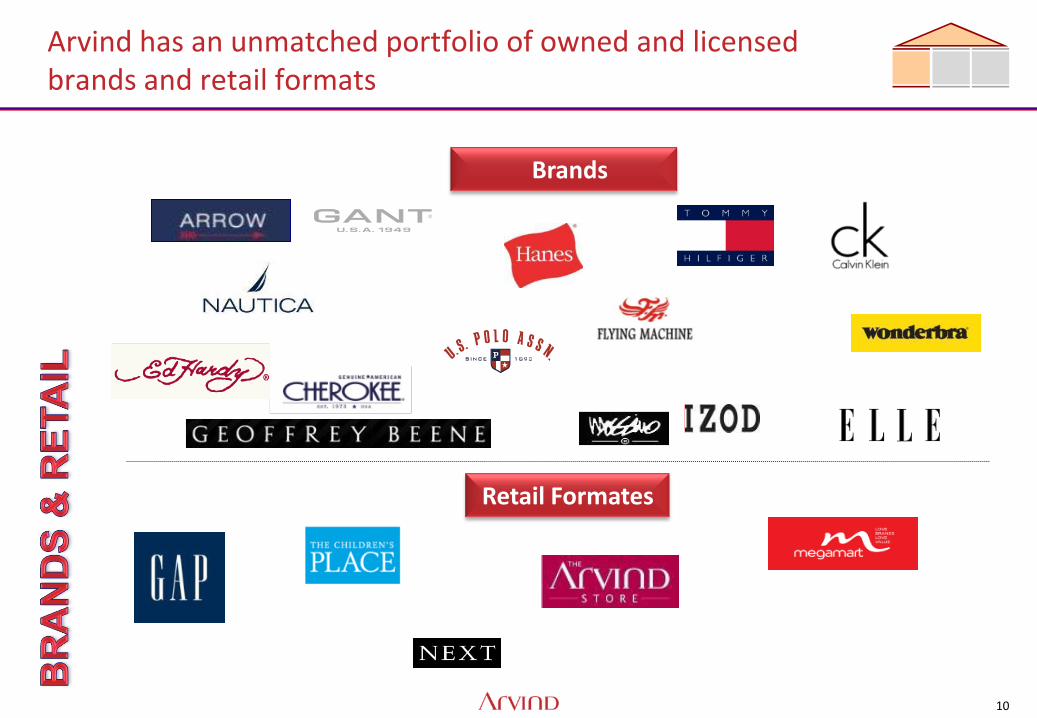
Arvind has an unmatched portfolio of owned and licensed brands and retail formats
Brands
Retail Formates
11
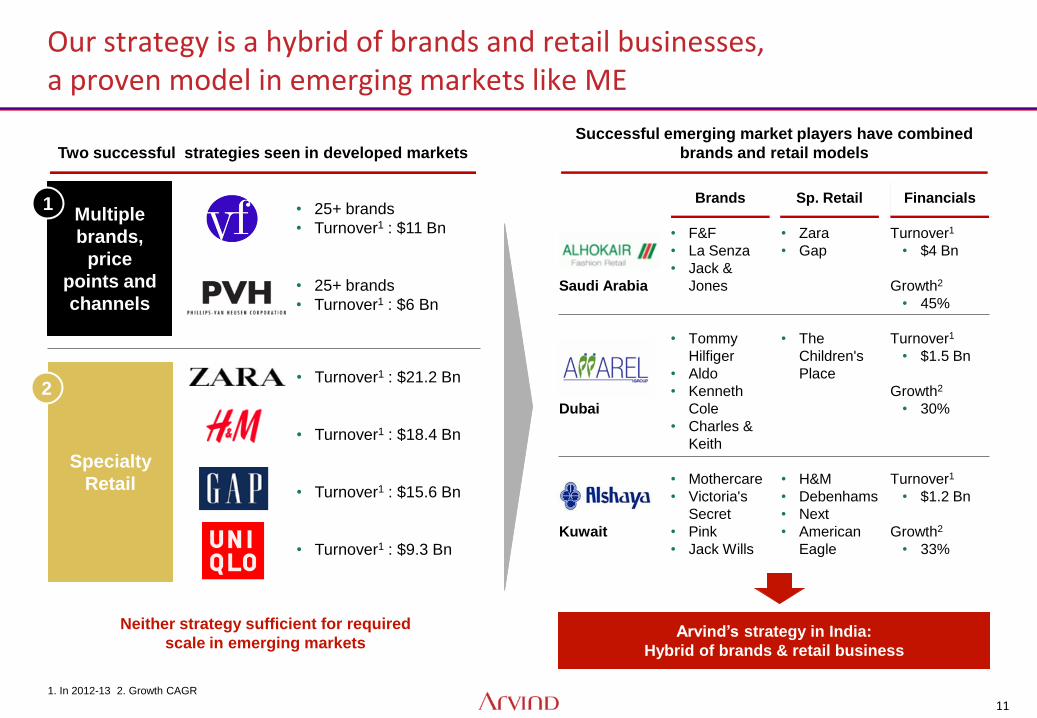
Our strategy is a hybrid of brands and retail businesses, a proven model in emerging markets like ME
Two successful strategies seen in developed markets
• 25+ brands
• Turnover1 : $11 Bn
• 25+ brands
• Turnover1 : $6 Bn
Successful emerging market players have combined
brands and retail models
Multiple
brands,
price
points and
channels
Specialty
Retail
1. In 2012-13 2. Growth CAGR
• Turnover1 : $21.2 Bn
• Turnover1 : $18.4 Bn
• Turnover1 : $15.6 Bn
• Turnover1 : $9.3 Bn
1
2
Saudi Arabia
Dubai
Kuwait
• F&F
• La Senza
• Jack &
Jones
• Tommy
Hilfiger
• Aldo
• Kenneth
Cole
• Charles &
Keith
• Mothercare
• Victoria's
Secret
• Pink
• Jack Wills
• Zara
• Gap
• The
Children's
Place
• H&M
• Debenhams
• Next
• American
Eagle
Turnover1
• $4 Bn
Growth2
• 45%
Turnover1
• $1.5 Bn
Growth2
• 30%
Turnover1
• $1.2 Bn
Growth2
• 33%
Brands Sp. Retail Financials
Neither strategy sufficient for required
scale in emerging markets Arvind’s strategy in India:
Hybrid of brands & retail business
12
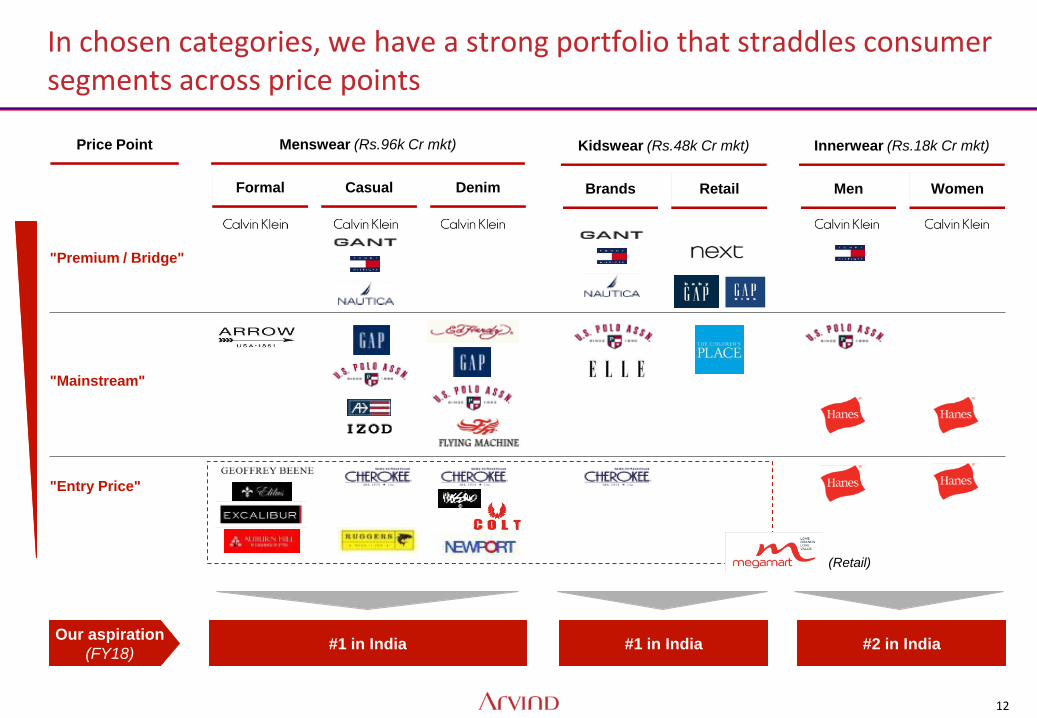
In chosen categories, we have a strong portfolio that straddles consumer segments across price points
Menswear (Rs.96k Cr mkt) Price Point
"Premium / Bridge"
"Mainstream"
"Entry Price"
Formal Casual Denim
Kidswear (Rs.48k Cr mkt)
Brands Retail
Innerwear (Rs.18k Cr mkt)
Men Women
(Retail)
Our aspiration
(FY18) #1 in India #1 in India #2 in India
13
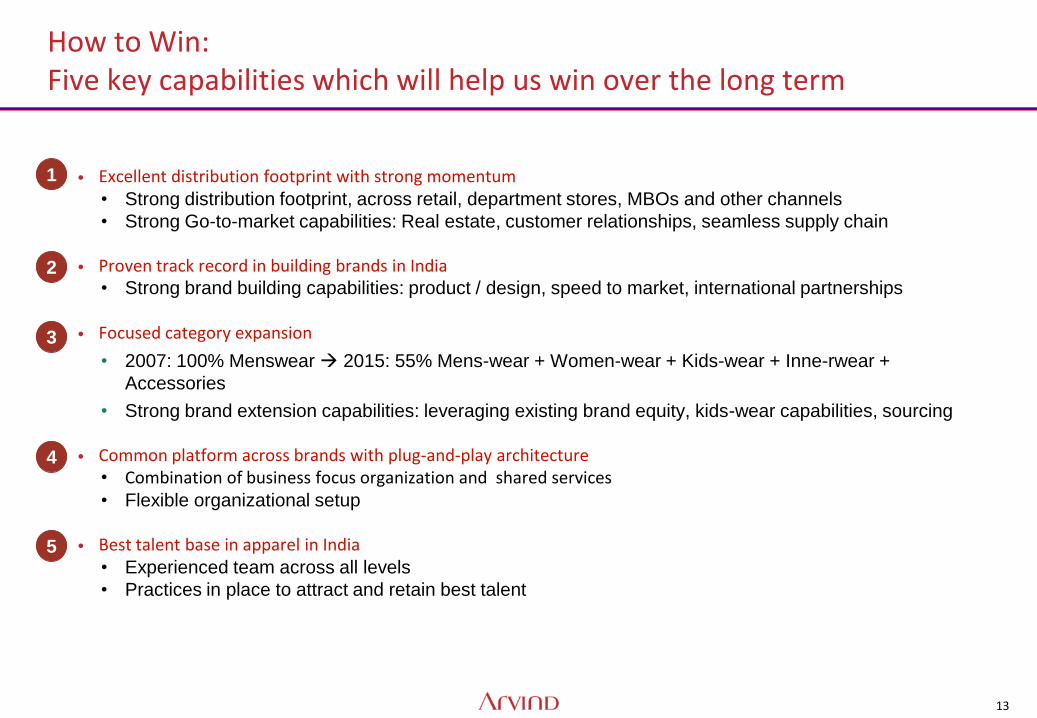
How to Win: Five key capabilities which will help us win over the long term
• Excellent distribution footprint with strong momentum • Strong distribution footprint, across retail, department stores, MBOs and other channels
• Strong Go-to-market capabilities: Real estate, customer relationships, seamless supply chain
• Proven track record in building brands in India • Strong brand building capabilities: product / design, speed to market, international partnerships
• Focused category expansion
• 2007: 100% Menswear 2015: 55% Mens-wear + Women-wear + Kids-wear + Inne-rwear +
Accessories
• Strong brand extension capabilities: leveraging existing brand equity, kids-wear capabilities, sourcing
• Common platform across brands with plug-and-play architecture • Combination of business focus organization and shared services • Flexible organizational setup
• Best talent base in apparel in India
• Experienced team across all levels
• Practices in place to attract and retain best talent
1
2
3
4
5
14
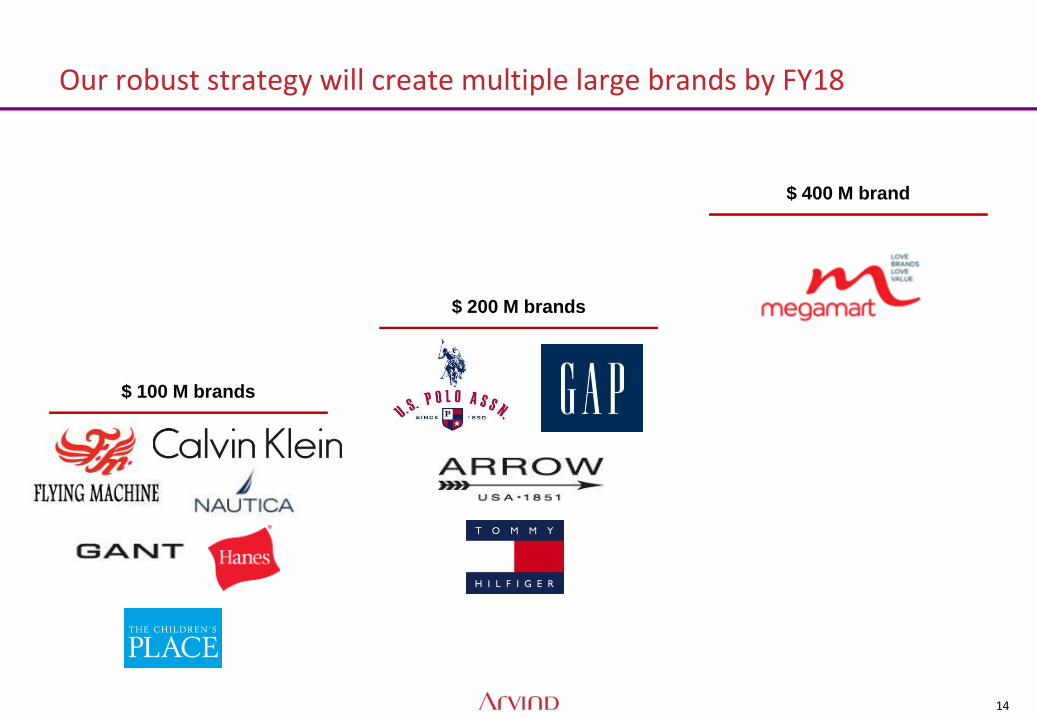
Our robust strategy will create multiple large brands by FY18
$ 100 M brands
$ 200 M brands
$ 400 M brand
15
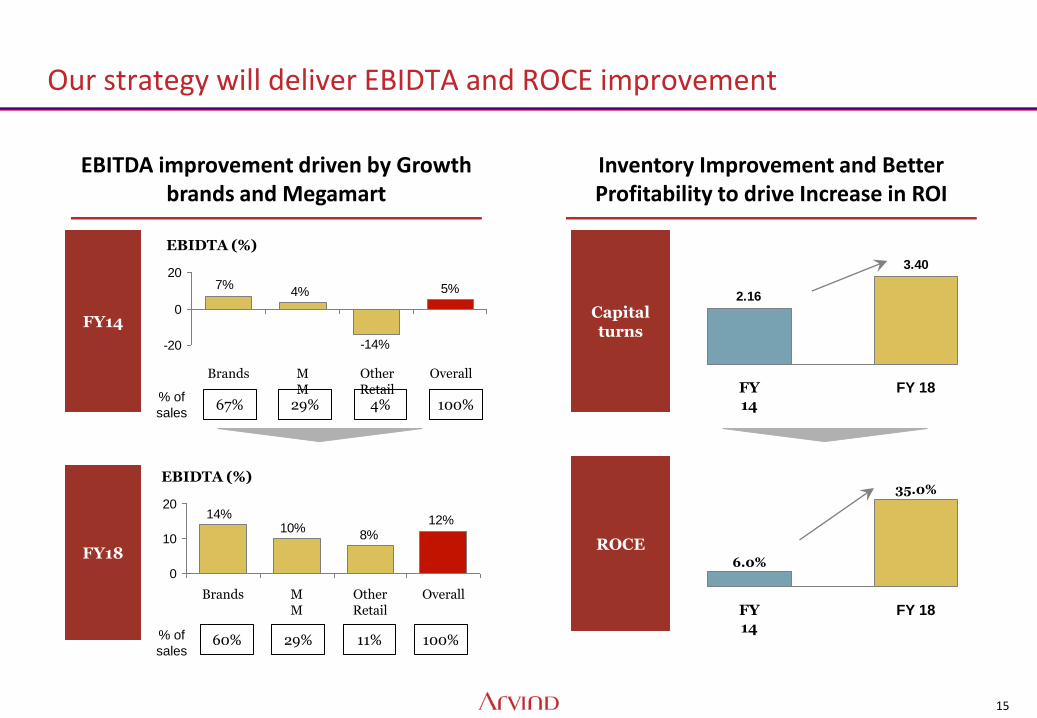
Our strategy will deliver EBIDTA and ROCE improvement
EBITDA improvement driven by Growth brands and Megamart
Inventory Improvement and Better Profitability to drive Increase in ROI
3.40
2.16
FY 18 FY 14
6.0%
35.0%
FY 14
FY 18
Capital turns
ROCE
7% 5%
-14%
4%
-20
0
20
MM
Overall
EBIDTA (%)
Brands Other Retail
29% 4% 100% 67%
12%8%
10%14%
0
10
20
Brands Other Retail
MM
Overall
EBIDTA (%)
29% 11% 100% 60%
FY14
FY18
% of
sales
% of
sales
16
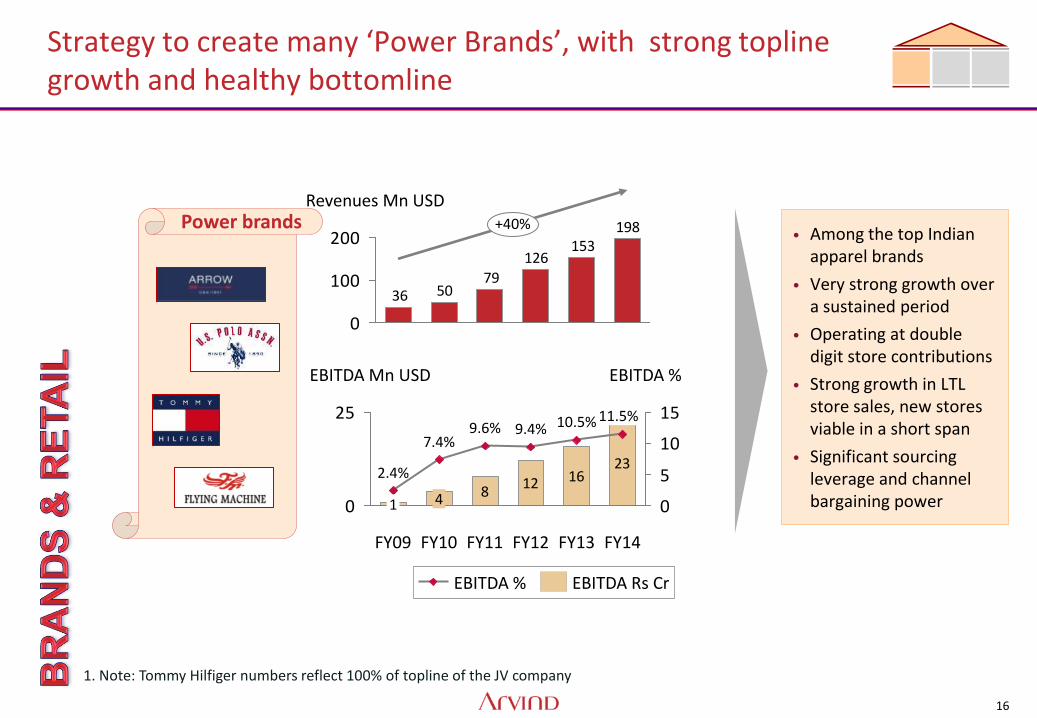
Strategy to create many ‘Power Brands’, with strong topline growth and healthy bottomline
• Among the top Indian apparel brands
• Very strong growth over a sustained period
• Operating at double digit store contributions
• Strong growth in LTL store sales, new stores viable in a short span
• Significant sourcing leverage and channel bargaining power
12 1623
0
25
0
5
10
15
2.4%
EBITDA % EBITDA Mn USD
FY14
11.5%
FY13
10.5%
FY12
9.4%
FY11
8
9.6%
FY10
4
7.4%
FY09
1
198153
126
795036
0
100
200+40%
Revenues Mn USD
EBITDA Rs Cr EBITDA %
Power brands
1. Note: Tommy Hilfiger numbers reflect 100% of topline of the JV company
17
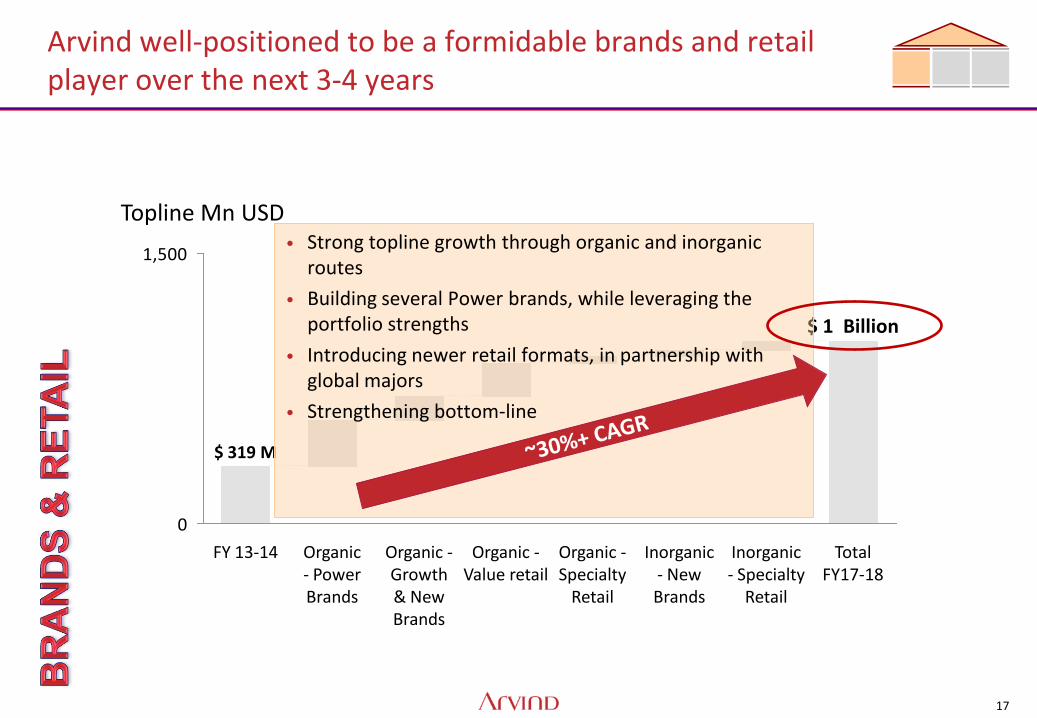
0
1,500
Total FY17-18
$ 1 Billion
Inorganic - Specialty
Retail
Inorganic - New Brands
Organic - Specialty
Retail
Organic - Value retail
Organic - Growth & New Brands
Organic - Power Brands
FY 13-14
$ 319 M
Topline Mn USD • Strong topline growth through organic and inorganic
routes
• Building several Power brands, while leveraging the portfolio strengths
• Introducing newer retail formats, in partnership with global majors
• Strengthening bottom-line
Arvind well-positioned to be a formidable brands and retail player over the next 3-4 years
18
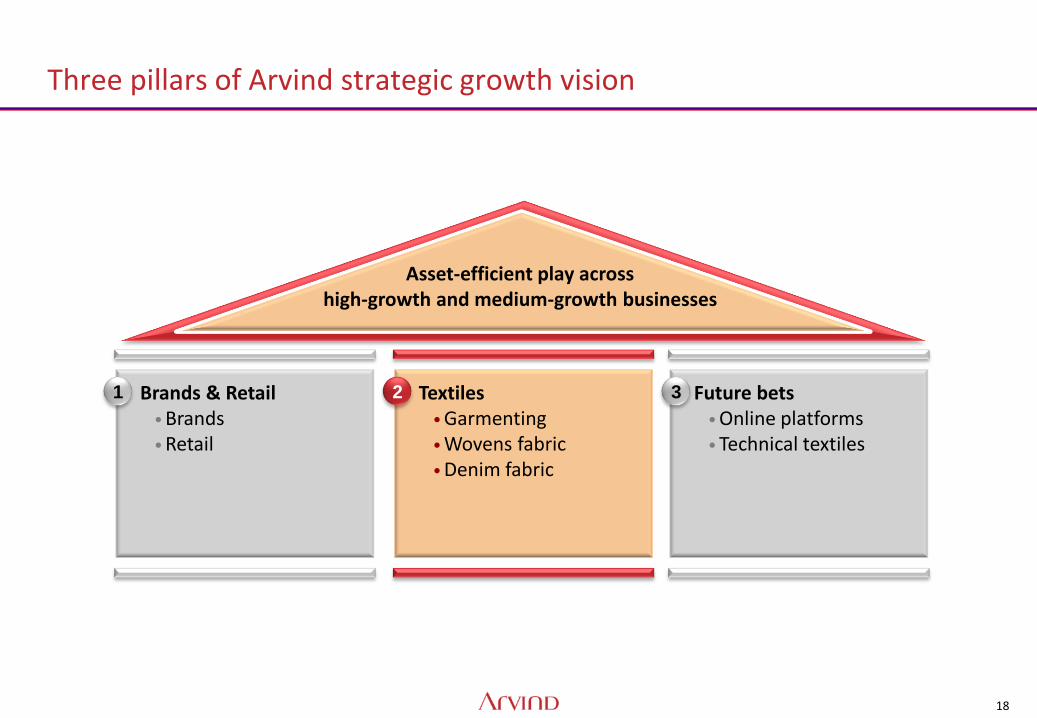
Future bets • Online platforms • Technical textiles
Textiles • Garmenting • Wovens fabric • Denim fabric
Brands & Retail • Brands • Retail
Three pillars of Arvind strategic growth vision
1 2 3
Asset-efficient play across high-growth and medium-growth businesses
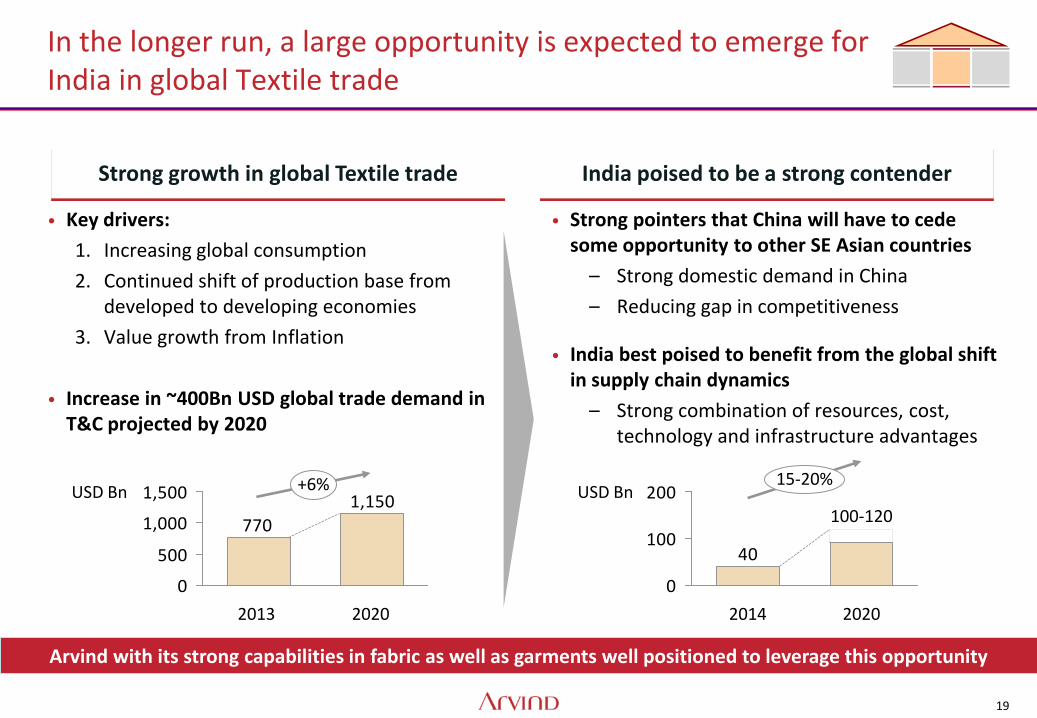
19
• Key drivers:
1. Increasing global consumption
2. Continued shift of production base from developed to developing economies
3. Value growth from Inflation
• Increase in ~400Bn USD global trade demand in T&C projected by 2020
In the longer run, a large opportunity is expected to emerge for India in global Textile trade
1,150
770
0
500
1,000
1,500USD Bn +6%
2020 2013
Strong growth in global Textile trade India poised to be a strong contender
• Strong pointers that China will have to cede some opportunity to other SE Asian countries
– Strong domestic demand in China
– Reducing gap in competitiveness
• India best poised to benefit from the global shift in supply chain dynamics
– Strong combination of resources, cost, technology and infrastructure advantages
Arvind with its strong capabilities in fabric as well as garments well positioned to leverage this opportunity
40
0
100
200USD Bn
2020
15-20%
100-120
2014

20
Arvind is looking to develop a de-risked and capital efficient textiles business model through a vertically integrated offering
More robust business model
• More customer stickiness
• Better pricing power
• Better visibility
• Better market access
• Address issue of scalability/growth
Capital efficient growth model
• Lower capital intensity
• Better end-to-end RoCE profile
• Up-gradation in the value chain
• Model can scale up substantially while yielding free cash flows!
We intend to go 25-30% vertical offering from the current ~10 % in 4-5 years
Success could also offer additional / adjacent growth opportunities in future
21
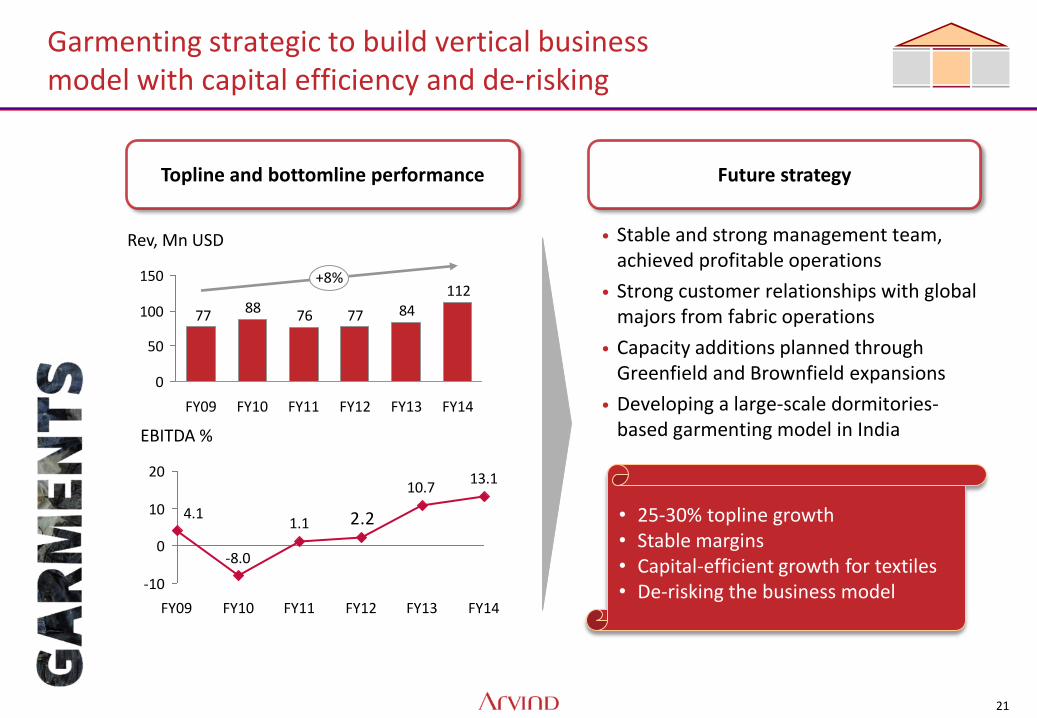
Garmenting strategic to build vertical business model with capital efficiency and de-risking
• 25-30% topline growth • Stable margins • Capital-efficient growth for textiles • De-risking the business model
Topline and bottomline performance Future strategy
• Stable and strong management team, achieved profitable operations
• Strong customer relationships with global majors from fabric operations
• Capacity additions planned through Greenfield and Brownfield expansions
• Developing a large-scale dormitories-based garmenting model in India
1128477768877
0
50
100
150
FY13 FY12 FY11 FY10 FY09 FY14
Rev, Mn USD
+8%
13.110.7
1.1
-8.0
4.1 2.2
-10
0
10
20
FY11 FY10
EBITDA %
FY14 FY09 FY13 FY12
22
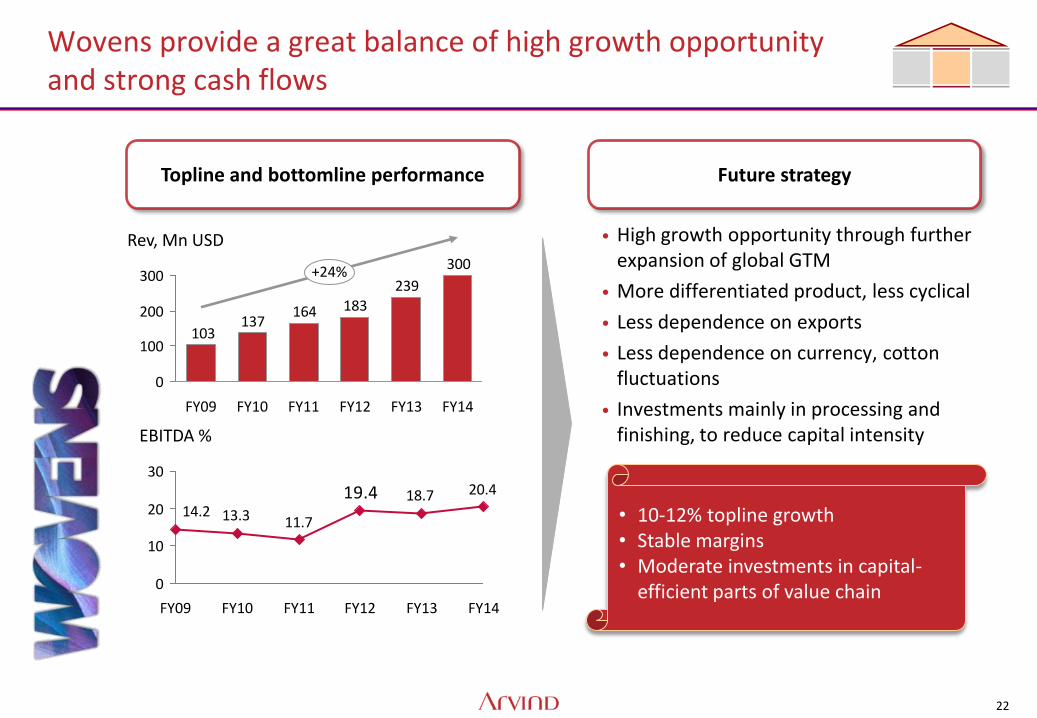
• 10-12% topline growth • Stable margins • Moderate investments in capital-
efficient parts of value chain
Wovens provide a great balance of high growth opportunity and strong cash flows
Topline and bottomline performance Future strategy
• High growth opportunity through further expansion of global GTM
• More differentiated product, less cyclical
• Less dependence on exports
• Less dependence on currency, cotton fluctuations
• Investments mainly in processing and finishing, to reduce capital intensity
300
239183164
137103
0
100
200
300
FY12 FY09
Rev, Mn USD
+24%
FY13 FY14 FY11 FY10
20.418.7
11.713.314.219.4
0
10
20
30
EBITDA %
FY09 FY10 FY12 FY11 FY13 FY14

23
Denim business stable, with robust cash flows and moderate growth plans
• 4-6% topline growth • Stable margins • Cautious investments in capital-
efficient parts of value chain, coupled with garmenting expansion
Topline and bottomline performance Future strategy
• Operate in differentiated segments, with 20-30% price premium
• High utilization levels while industry operates at much lower utilization, lean cost and asset management
• Moderate growth, de-risked through vertical garmenting expansion
315257267
226175
141
0
100
200
300
400
FY13 FY12 FY11 FY10 FY09
Rev, Mn USD
+17%
FY14
18.019.223.425.1
17.9
0
10
20
30
FY12
EBITDA %
FY10 FY09
11.8
FY11 FY14 FY13
24
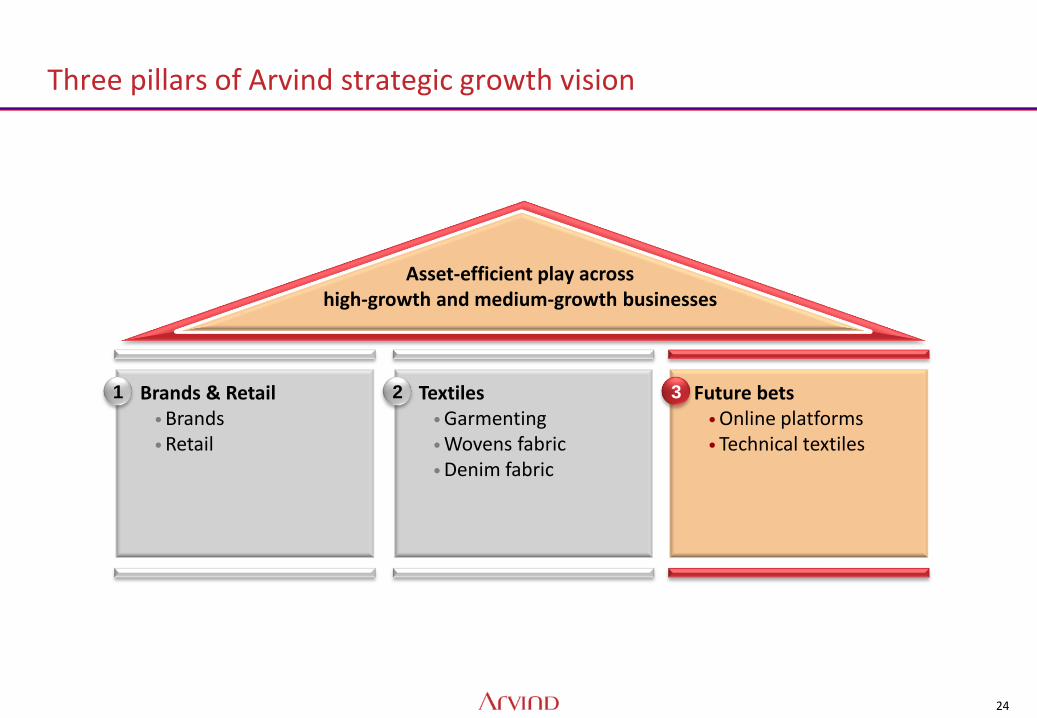
Textiles • Garmenting • Wovens fabric • Denim fabric
Brands & Retail • Brands • Retail
Future bets • Online platforms • Technical textiles
Three pillars of Arvind strategic growth vision
Asset-efficient play across high-growth and medium-growth businesses
1 2 3
25
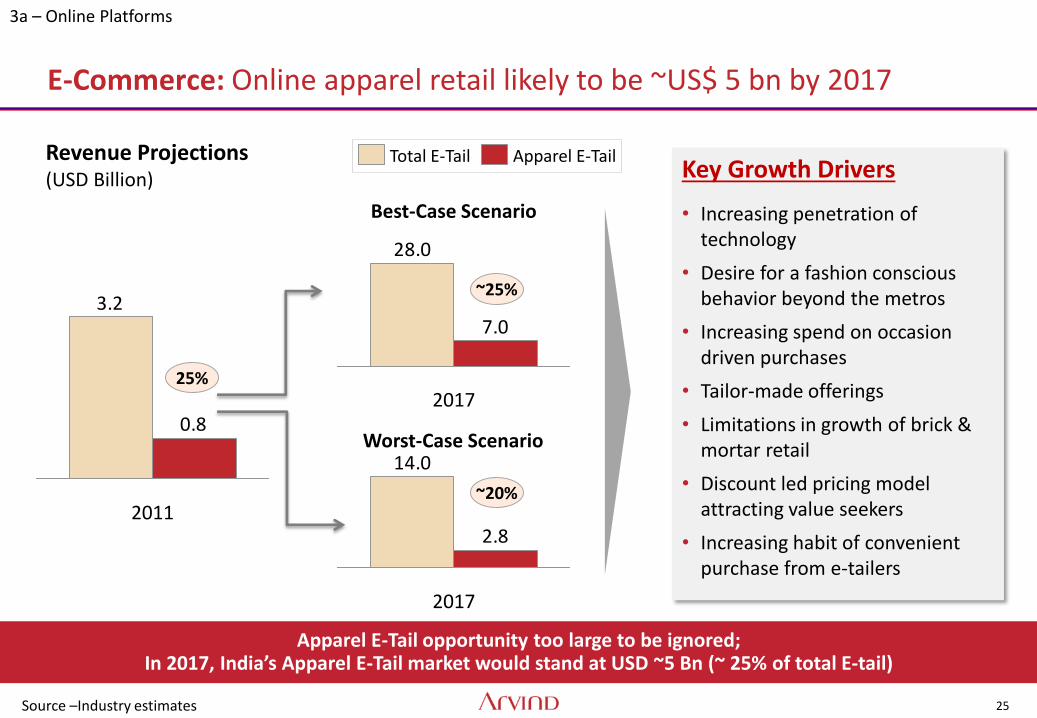
Apparel E-Tail opportunity too large to be ignored; In 2017, India’s Apparel E-Tail market would stand at USD ~5 Bn (~ 25% of total E-tail)
Source –Industry estimates
E-Commerce: Online apparel retail likely to be ~US$ 5 bn by 2017
Key Growth Drivers
• Increasing penetration of technology
• Desire for a fashion conscious behavior beyond the metros
• Increasing spend on occasion driven purchases
• Tailor-made offerings
• Limitations in growth of brick & mortar retail
• Discount led pricing model attracting value seekers
• Increasing habit of convenient purchase from e-tailers
Revenue Projections (USD Billion)
Best-Case Scenario
Worst-Case Scenario
3.2
0.8
2011
Apparel E-Tail Total E-Tail
28.0
7.0
2017
14.0
2.8
2017
25%
~20%
~25%
3a – Online Platforms
26
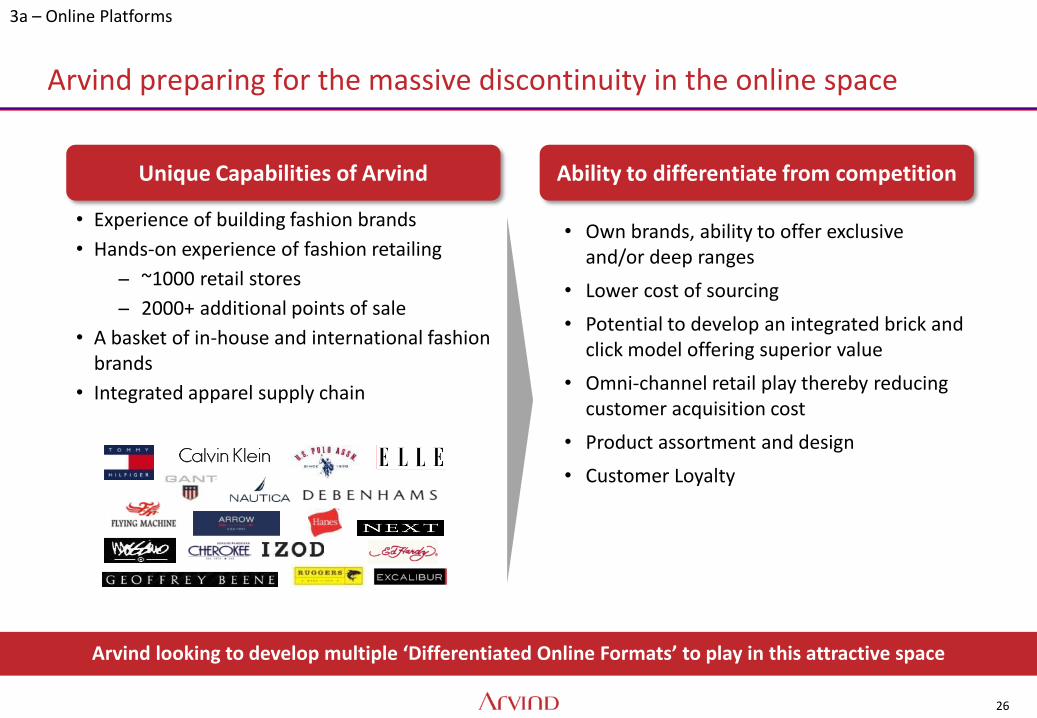
Arvind preparing for the massive discontinuity in the online space
• Experience of building fashion brands
• Hands-on experience of fashion retailing
~1000 retail stores
2000+ additional points of sale
• A basket of in-house and international fashion brands
• Integrated apparel supply chain
• Own brands, ability to offer exclusive and/or deep ranges
• Lower cost of sourcing
• Potential to develop an integrated brick and click model offering superior value
• Omni-channel retail play thereby reducing customer acquisition cost
• Product assortment and design
• Customer Loyalty
Unique Capabilities of Arvind Ability to differentiate from competition
Arvind looking to develop multiple ‘Differentiated Online Formats’ to play in this attractive space
3a – Online Platforms
27
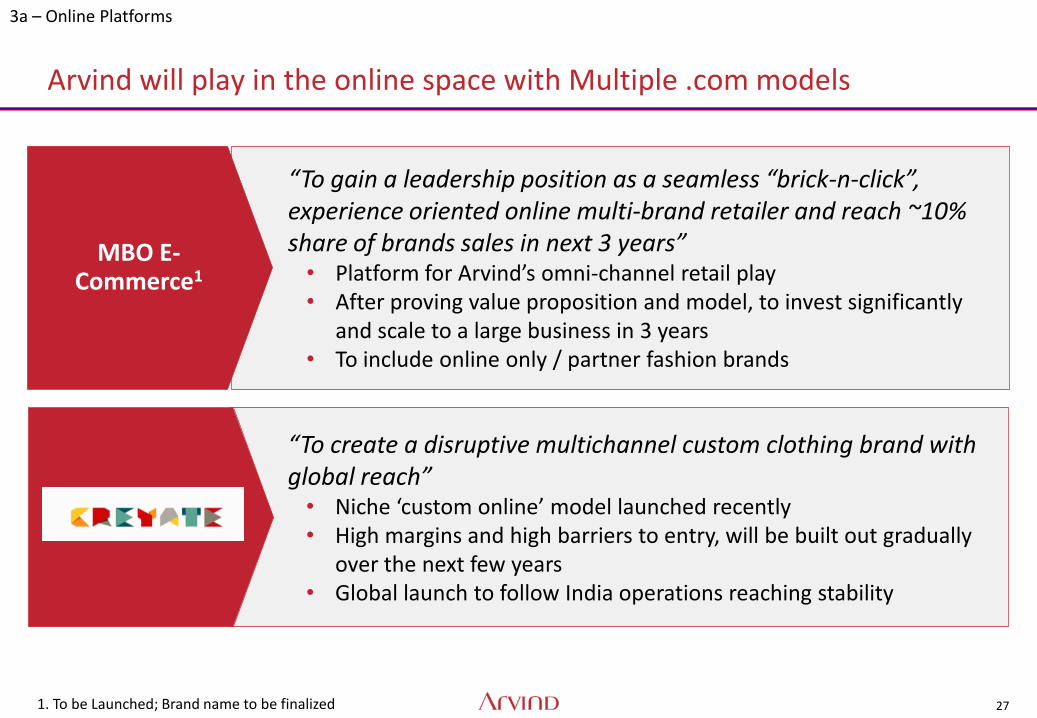
“To create a disruptive multichannel custom clothing brand with global reach” • Niche ‘custom online’ model launched recently • High margins and high barriers to entry, will be built out gradually
over the next few years • Global launch to follow India operations reaching stability
Arvind will play in the online space with Multiple .com models
“To gain a leadership position as a seamless “brick-n-click”, experience oriented online multi-brand retailer and reach ~10% share of brands sales in next 3 years” • Platform for Arvind’s omni-channel retail play • After proving value proposition and model, to invest significantly
and scale to a large business in 3 years • To include online only / partner fashion brands
MBO E-Commerce1
1. To be Launched; Brand name to be finalized
3a – Online Platforms
28
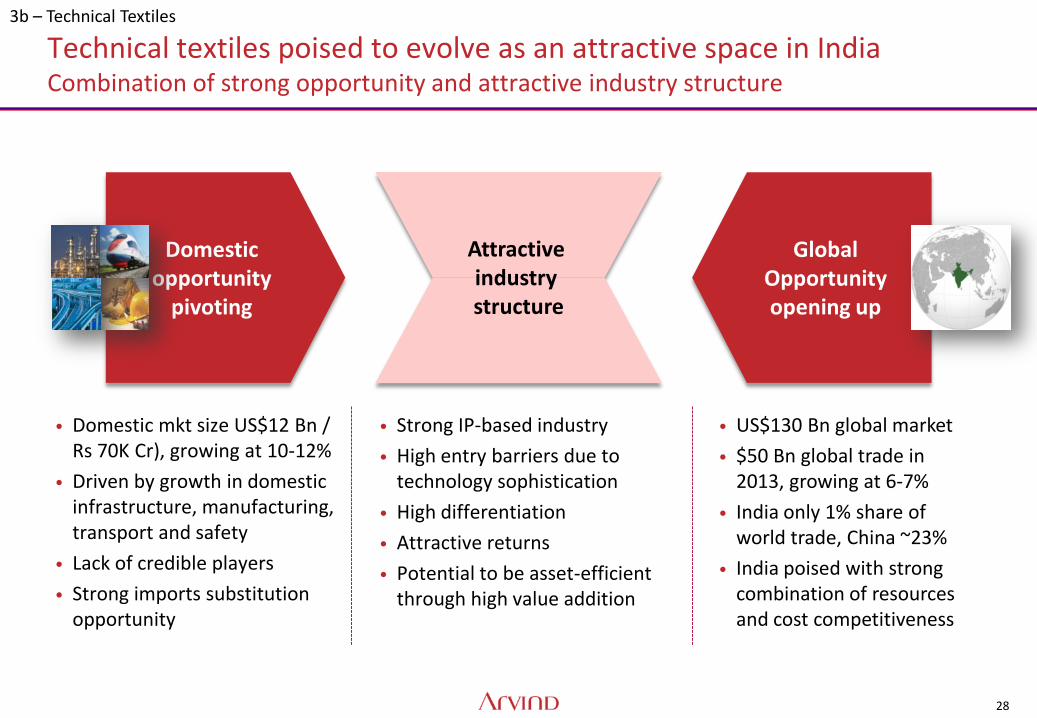
• Domestic mkt size US$12 Bn / Rs 70K Cr), growing at 10-12%
• Driven by growth in domestic infrastructure, manufacturing, transport and safety
• Lack of credible players
• Strong imports substitution opportunity
• Strong IP-based industry
• High entry barriers due to technology sophistication
• High differentiation
• Attractive returns
• Potential to be asset-efficient through high value addition
• US$130 Bn global market
• $50 Bn global trade in 2013, growing at 6-7%
• India only 1% share of world trade, China ~23%
• India poised with strong combination of resources and cost competitiveness
Domestic opportunity
pivoting
Global Opportunity opening up
Attractive industry structure
Technical textiles poised to evolve as an attractive space in India Combination of strong opportunity and attractive industry structure
3b – Technical Textiles
29
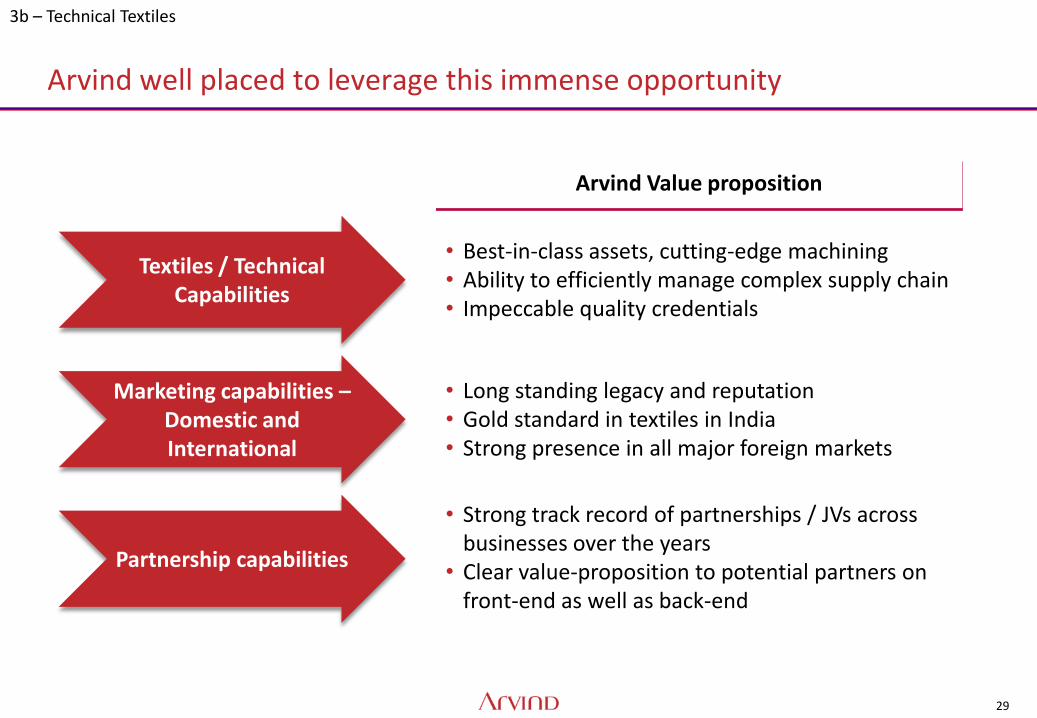
Arvind well placed to leverage this immense opportunity
Textiles / Technical Capabilities
Marketing capabilities – Domestic and International
Partnership capabilities
• Best-in-class assets, cutting-edge machining • Ability to efficiently manage complex supply chain • Impeccable quality credentials
Arvind Value proposition
• Long standing legacy and reputation • Gold standard in textiles in India • Strong presence in all major foreign markets
• Strong track record of partnerships / JVs across businesses over the years
• Clear value-proposition to potential partners on front-end as well as back-end
3b – Technical Textiles
30
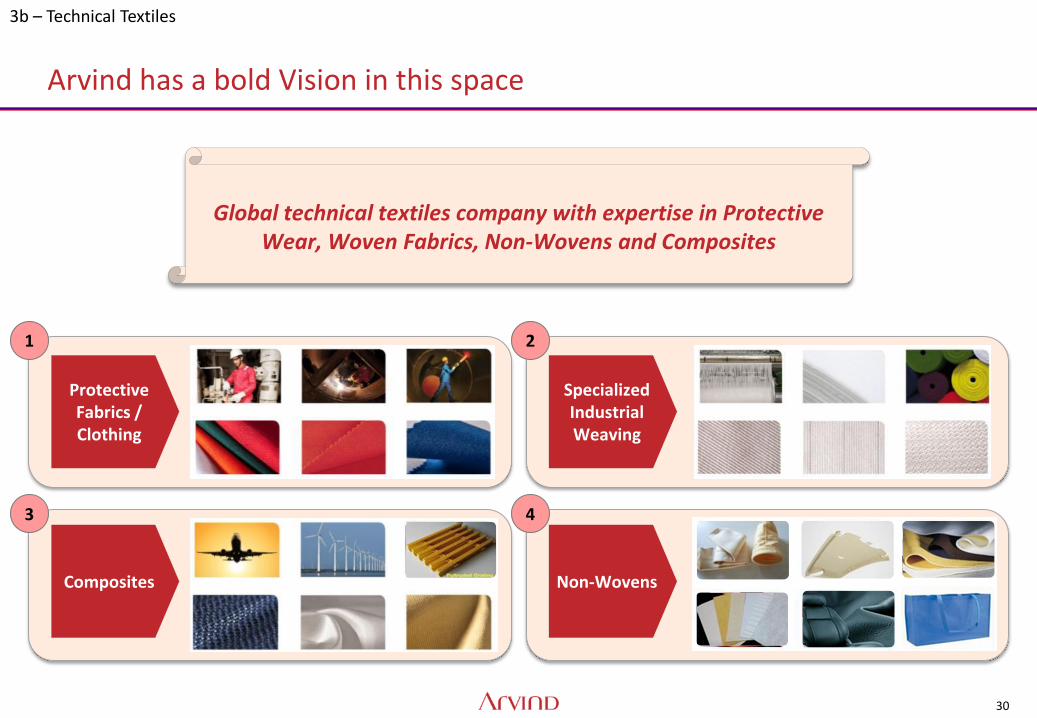
Arvind has a bold Vision in this space
Global technical textiles company with expertise in Protective Wear, Woven Fabrics, Non-Wovens and Composites
1 2
3 4
Composites
Protective Fabrics / Clothing
Specialized Industrial Weaving
Non-Wovens
3b – Technical Textiles
31
Agenda
• Snapshot and Overall Growth Vision
• Division-wise Roadmap
• Summary and Conclusion: Overall Value Creation Path
32
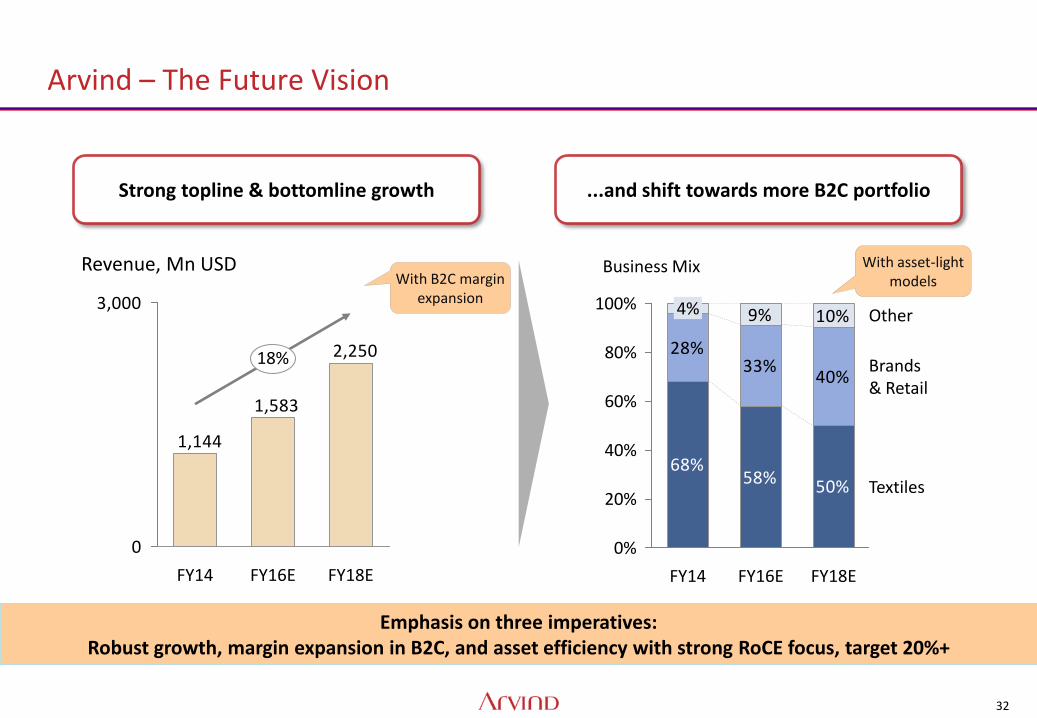
Arvind – The Future Vision
2,250
1,583
1,144
0
3,000
Revenue, Mn USD
18%
FY18E FY16E FY14
With B2C margin expansion
68%58% 50%
28%33%
40%
9% 10%
0%
100%
60%
40%
20%
80%
Textiles
Brands & Retail
Other
Business Mix
FY18E FY16E FY14
4%
...and shift towards more B2C portfolio Strong topline & bottomline growth
With asset-light models
Emphasis on three imperatives: Robust growth, margin expansion in B2C, and asset efficiency with strong RoCE focus, target 20%+
33
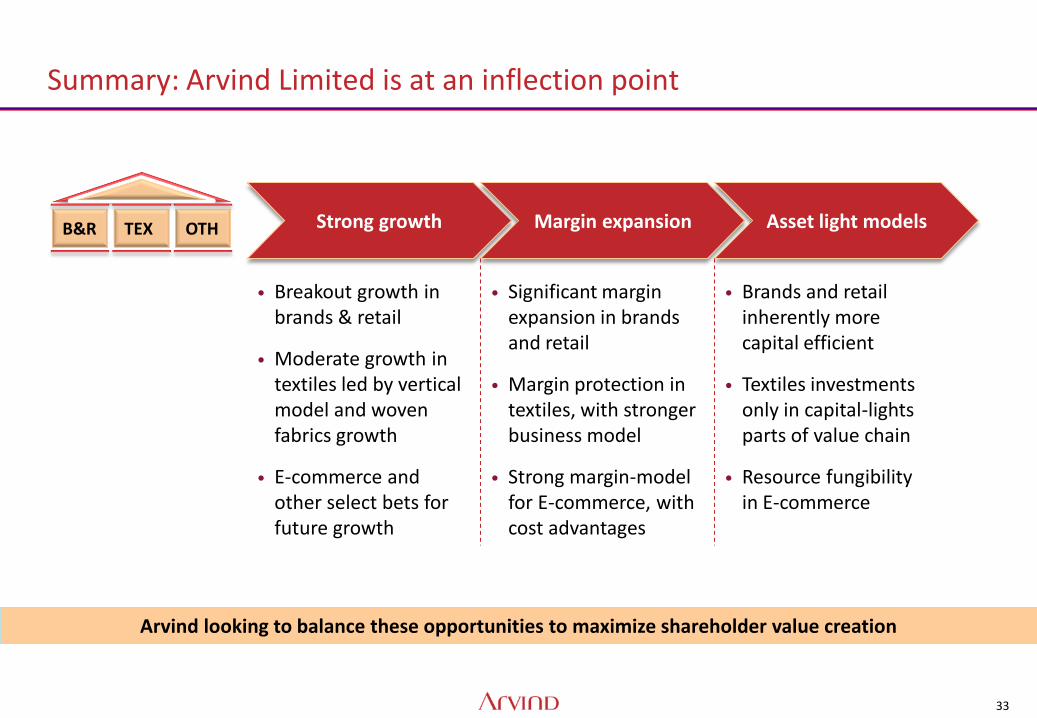
Summary: Arvind Limited is at an inflection point
Strong growth Margin expansion Asset light models
• Breakout growth in brands & retail
• Moderate growth in textiles led by vertical model and woven fabrics growth
• E-commerce and other select bets for future growth
• Significant margin expansion in brands and retail
• Margin protection in textiles, with stronger business model
• Strong margin-model for E-commerce, with cost advantages
• Brands and retail inherently more capital efficient
• Textiles investments only in capital-lights parts of value chain
• Resource fungibility in E-commerce
TEX B&R OTH
Arvind looking to balance these opportunities to maximize shareholder value creation
Thank You!
Top Related