


Languages
Pages
Legal

Studying the interaction of hydrophobically modified ethoxylated urethane (HEUR) polymers with sodium dodecylsulphate (SDS) in
concentrated polymer solutions
Mervat S. Ibrahima,b, Jordane Valenconya, Stephen Kingc, Martin Murrayd, Agnieszka
Szczygield, Bruce D. Alexandera, and Peter C. Griffithsa,*
a Faculty of Engineering and Science, University of Greenwich, Medway Campus,
Chatham Maritime, Kent ME4 4TB, UK
b Pharmaceutics Department, Faculty of Pharmacy, Modern Science and Arts
University,26 July Mehwar Road intersection with Wahat Road, Cairo, Egypt
c Science and Technology Facilities Council, ISIS Facility, Rutherford Appleton Laboratory,
Didcot, Oxfordshire OX11 OQX, UK
d AkzoNobel, Wexham Road, Slough, Berkshire, SL2 5DS, UK
Telephone: +44(0) 208 331 9927
Email: [email protected]
Supplemental Section
1
Surface tension measurements for HEUR, SDS, and HEUR/SDS blends
Figure S.1 (a) presents the surface tension data for the SDS, and C6-L-(EO100-L)9-C6/SDS
mixture, for Cpolymer = 0.5 and 1 wt%. In a typical γ-ln C curve for non-hydrophobically
modified polymer/surfactant blends, the surface tension generally shows two break points,
CAC1 (critical aggregation concentration) and CAC2. CAC1 corresponds to the onset of
cooperative binding of the surfactant to the polymer and usually lies below the CMC of
pure surfactant. CAC2 corresponds to the onset of formation of free non-bound surfactant
micelles and is higher than CMC of pure surfactant (35).
The HEUR/surfactant data are rather different. As may be seen in Figure S.1 (a), for
HEUR (1 wt%)/SDS blend there are indeed two break points observed; CAC1 = 0.3 wt%
and CAC2 = 7 wt% SDS. These two points are shifted to the lower values when the
polymer concentration is reduced viz for Cpolymer = 0.5 wt%, CAC1 = 0.15 wt% and CAC2 = 4
wt%. Further, both CAC1 values are greater than the CMC of pure SDS. These
observations indicate that the HEUR/surfactant interaction is an anti-cooperative one, with
(monomeric) binding of discrete surfactant molecules to the polymer hydrophobic
aggregates before interacting cooperatively (micellar binding) with the backbone at higher
surfactant concentrations. Thus, the feature representing CAC1 is shifted to values greater
than the CMC of pure SDS, when the hydrophobes are present, because of the reduced
apparent activity of the surfactant.
Figure S.1. (a)Surface tension ( γ) as a function of SDS concentration in the absence (triangles) and presence of 0.5 (circles) and 1 (circles) wt% C 6-L-(EO100-L)9-C6, (b) Surface tension (γ) of 1 wt% C6-L-(EO100-L)9-C6 (circles), C10-L-(EO200-L)4-C10 (squares), and C18-L-(EO200-L)7-C18 (triangles) as a function of SDS concentration. Measurements were carried out at 25 °C, pH 9, and ionic strength 100 mM. The solid lines are guides for the eye .2
50.0
70.0
50.0
40.0
a b
Hulden measured the surface tension for HEUR-19-18 and HEUR-19-15 (recall the first
number in the code is the molecular weight of the polymer and second number is the C-
chain length) as a function of SDS concentration (2). CAC1 and CAC2 reported are 5 mM
and 63 mM for the two polymers. Hulden CMC values are lower than the values reported
for the three polymers studied here (10.4 mM). This can be explained by the different
architectures of the polymers used in this study, where the polymers used here have more
urethane linkers distributed along the backbone increasing the hydrophobic nature, of the
polymers, compared to those used by Hulden. Further, the polymers used in Hulden’s
study possess hexamethylene diisocyanate (HDI), present at the ends, and two distributed
along the hydrophilic backbone at equal distances from each other. This observation
reinforces the hypothesis that the urethane linkers present along the backbone as well as
the hydrophobic aggregates interact with the SDS monomer, hence CAC1 concentration
shifted to higher SDS concentration.
Dai et al. reported the CAC1 and CAC2 for a range of C16 HEUR polymers with various
molecular weights (18-100 kg mol-1) with SDS measured by isothermal titration calorimetry.
The CAC1 and CAC2 are reported to be independent of the molecular weight of the
polymer (36). Hulden illustrated the independence of C-chain length on CAC1 and CAC2,
by measuring the surface tension of HEUR-19-18 and HEUR-19-15 as a function of SDS
concentration (2). Here, the surface tension data demonstrates also, very little
dependence on the polymer structure over this relatively narrow range explored (factors of
2 in the number of urethane linkers and end groups at this fixed polymer concentration),
Error: Reference source not found S.1 (b).
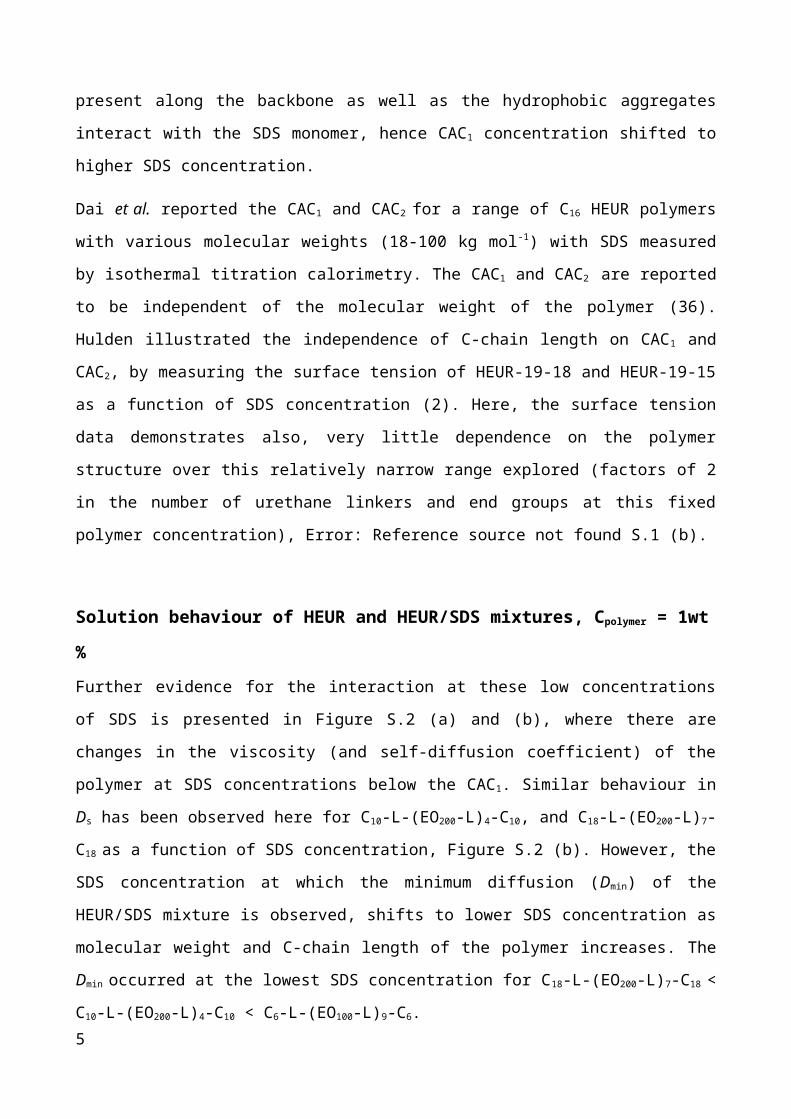
Solution behaviour of HEUR and HEUR/SDS mixtures, Cpolymer = 1wt% Further evidence for the interaction at these low concentrations of SDS is presented in
Figure S.2 (a) and (b), where there are changes in the viscosity (and self-diffusion
coefficient) of the polymer at SDS concentrations below the CAC1. Similar behaviour in Ds
has been observed here for C10-L-(EO200-L)4-C10, and C18-L-(EO200-L)7-C18 as a function of
SDS concentration, Figure S.2 (b). However, the SDS concentration at which the minimum
diffusion (Dmin) of the HEUR/SDS mixture is observed, shifts to lower SDS concentration as
molecular weight and C-chain length of the polymer increases. The Dmin occurred at the
lowest SDS concentration for C18-L-(EO200-L)7-C18 < C10-L-(EO200-L)4-C10 < C6-L-(EO100-L)9-
C6.
3
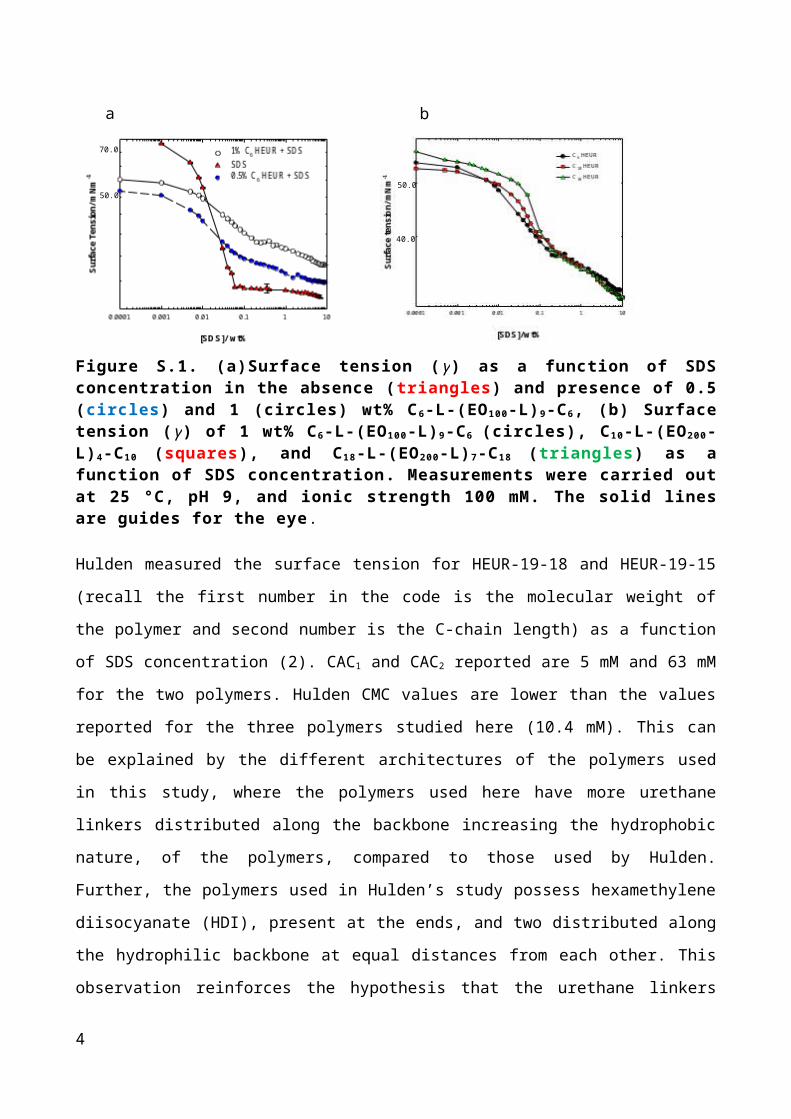
Figure S.2. (a) viscosity (white circles) at shear rate 0.1 s -1 and self-diffusion coefficient (blue circles) of aqueous solutions of 1 wt% C 6-L-(EO100-L)9-C6/SDS mixtures as a function of SDS concentration (b) self-diffusion coefficient of 1 wt% C 6-L-(EO100-L)9-C6 (circles), C10-L-(EO200-L)4-C10 (squares), and C18-L-(EO200-L)7-C18 (triangles) as a function of SDS concentration. Measurements were carried out at 25 °C, pH 9, and ionic strength 100 mM. The solid lines are guides for the eye.
The viscosity and self-diffusion coefficients (Ds) of the three polymers have been
measured as a function of polymer concentration, below the overlap concentration, the Ds
is sensitive to molecular weight and is mirrored by viscosity changes but this order is
broken for systems above the overlap concentration, Figure S.3 (a) and (b),respectively.
Figure S.3. (a) viscosity (b) self-diffusion cofficient of C 6-L-(EO100-L)9-C6
(circles), C10-L-(EO200-L)4-C10 (squares), and C18-L-(EO200-L)7-C18 (triangles) at shear rate 0.1 s -1 as a function of polymer concentration. Measurements were carried out at 25 °C, pH 9, and ionic strength 100 mM. The solid lines are guides for the eye.
4
a b
a b
The viscosity and diffusion of the polymer show analogues behaviour to the concentrated
regime with shifting of the Vmax and Dmin to lower SDS concentration. This complex
behaviour reflects the balance of intra- and inter-molecular polymer association that is
changed by the addition of SDS. The larger changes in viscosity at lower SDS
concentration are due to the monomeric, anti-cooperative binding of SDS onto the polymer
hydrophobic aggregates. The SDS monomeric binding is hypothesised to facilitate the
adoption of a more extended conformation of the polymer by turning loops into bridges.
However, at high SDS concentration, the HEUR hydrophobes are solubilised in the SDS
micelles and the sparse network structure is lost.
The effect of SDS on Dmin as a function of the polymer architecture has not been reported
previously, but Hulden reported the shift of the SDS concentration at which a viscosity
maximum Vmax of the HEUR/SDS mixture is observed to lower SDS concentration as the
molecular weight or C-chain length of the polymer is increased (2).
The diffusion minimum shift to lower SDS concentration in the three polymers comparison
can be understood in terms of the number of hydrophobes available for SDS to interact
with at a fixed concentration. C18-L-(EO200-L)7-C18 has the fewest number of hydrophobes
followed by C10-L-(EO200-L)4-C10 and C6-L-(EO100-L)9-C6, therefore, it is expected to note the
diffusion increase (network breakage) in C18-L-(EO200-L)7-C18 before C10-L-(EO200-L)4-C10
and C6-L-(EO100-L)9-C6. Hulden varied the concentration of the polymer to get the same
viscosity at 0 wt% SDS, but that does not consider the number of hydrophobes available
for the SDS to interact with (2). Alami et al. reported that at Vmax for PEOM-22-12/SDS
mixture the mixed hydrophobic aggregates have two polymeric end-groups per aggregate
and Dmin has 4 hydrophobes per aggregate. The number of polymer end-groups was
extracted from quenching fluorescence experiment (25). Therefore, it may be concluded
that the number of the polymer hydrophobices available has an influence on the SDS
concentration at which the Vmax or Dmin is observed.
Analysis of HEUR/SDS hydrophobic aggregates The ANS intensity increases with the polymer concentration with an unusual discontinuity
around 0.1 wt% for the C6-L-(EO100-L)9-C6 . Broadly similar observations are made for C18-
L-(E0200-L) 7-C18 with discontinuities been observed at higher polymer concentrations,
Figure S.4.
5
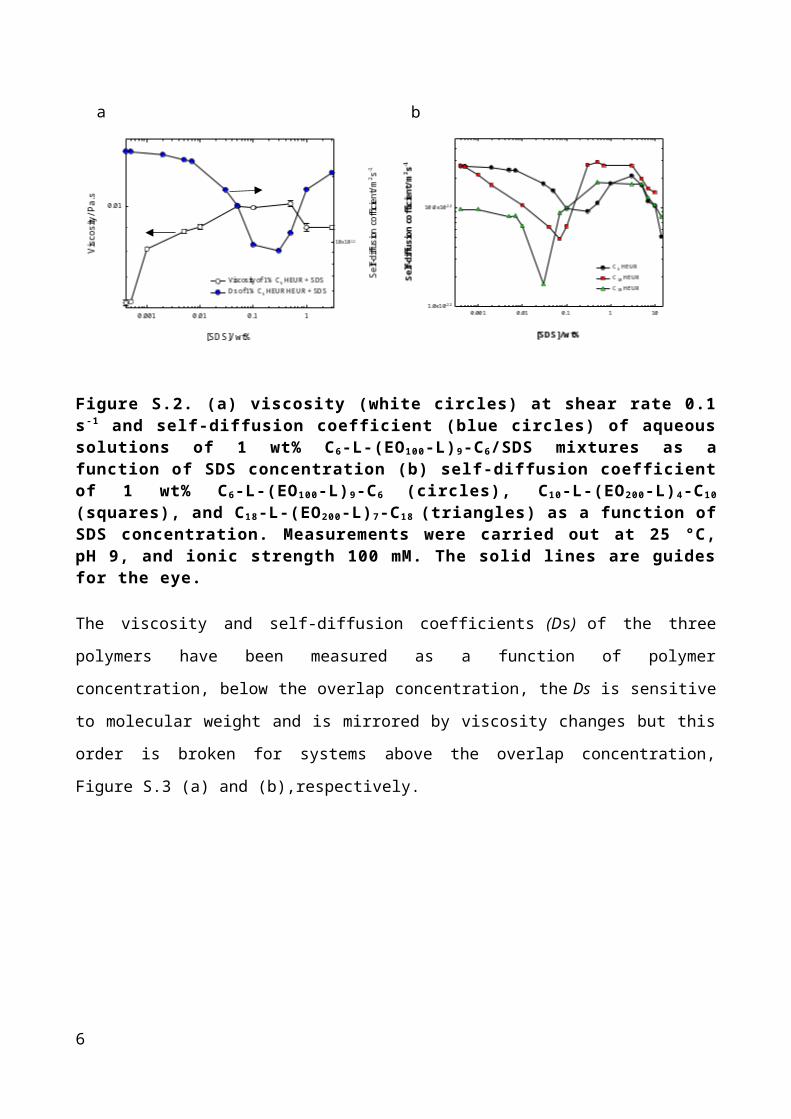
Figure S.4. ANS intensity of C 6-L-(EO100-L)9-C6 (circles), C10-L-(EO200-L)4-C10
(squares), and C18-L-(EO200-L)7-C18 (triangles) as a function of polymer concentration, and SDS (diamonds) as a function of SDS concentration. Measurements were carried out at 25 °C, pH 9, and ionic strength 100 mM. The solid lines are guides for the eye.
6
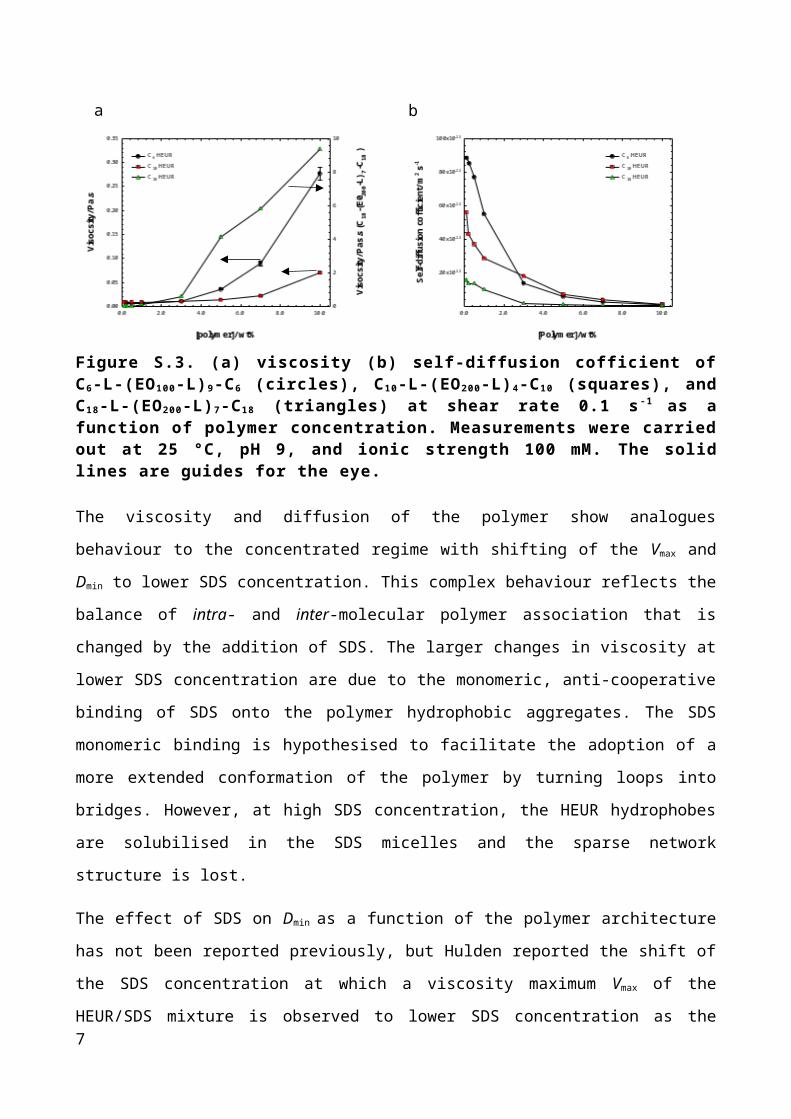
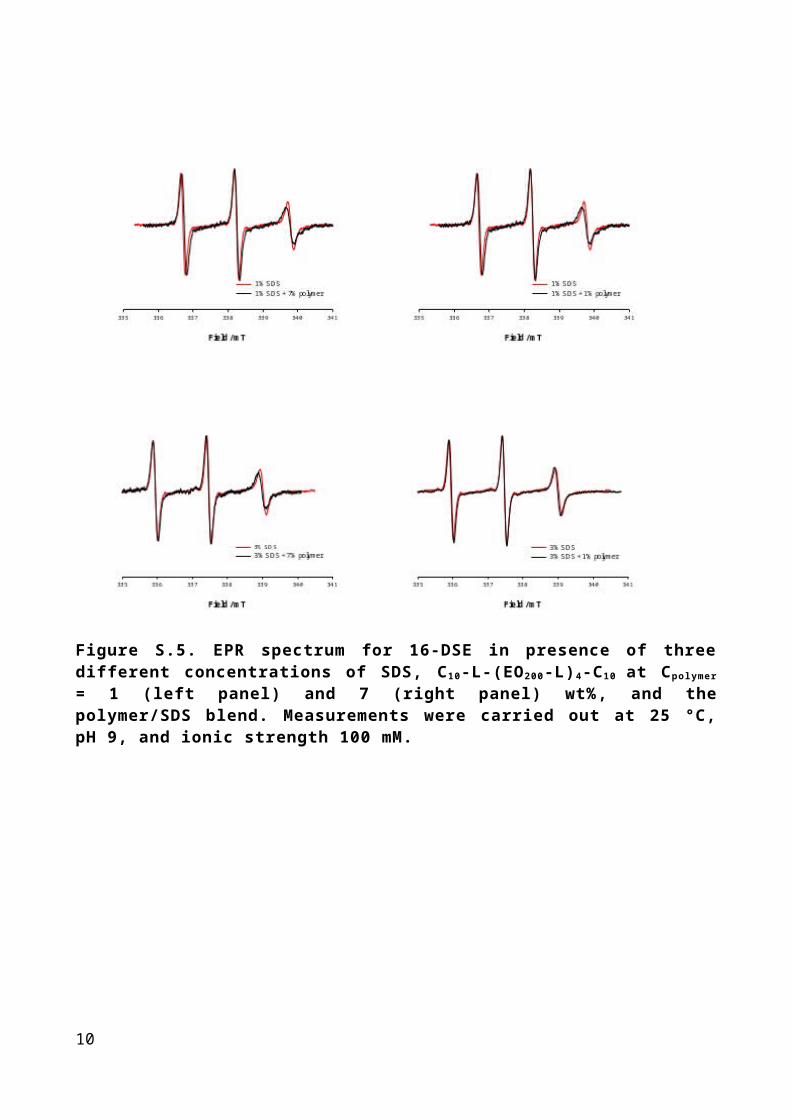
Figure S.5. EPR spectrum for 16-DSE in presence of three different concentrations of SDS, C10-L-(EO200-L)4-C10 at Cpolymer = 1 (left panel) and 7 (right panel) wt%, and the polymer/SDS blend. Measurements were carried out at 25 °C, pH 9, and ionic strength 100 mM.
7
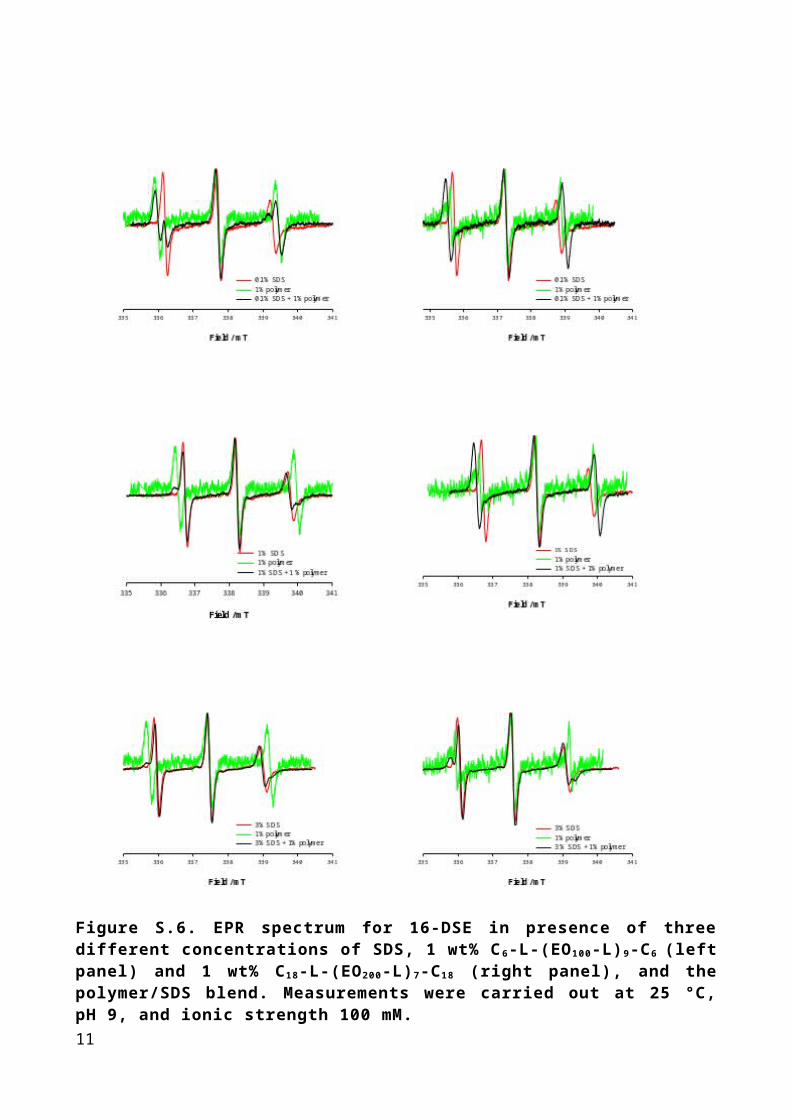
Figure S.6. EPR spectrum for 16-DSE in presence of three different concentrations of SDS, 1 wt% C6-L-(EO100-L)9-C6 (left panel) and 1 wt% C18-L-(EO200-L)7-C18 (right panel), and the polymer/SDS blend. Measurements were carried out at 25 °C, pH 9, and ionic strength 100 mM.
8
cba
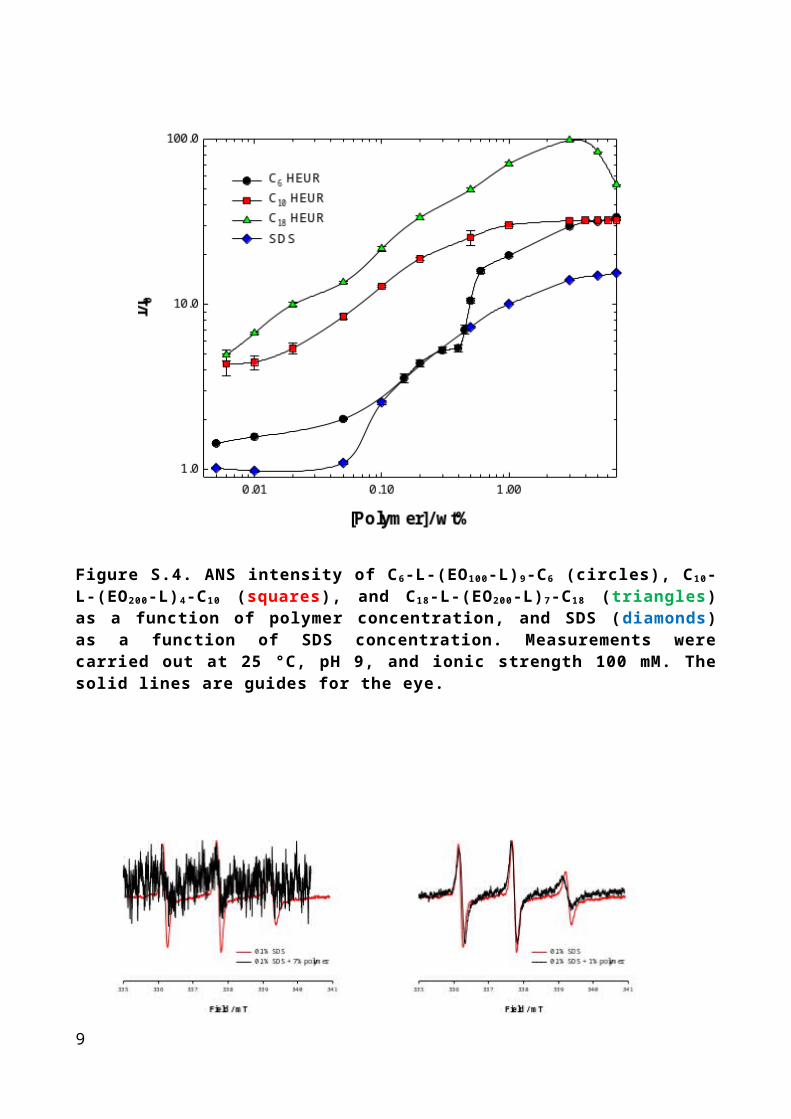
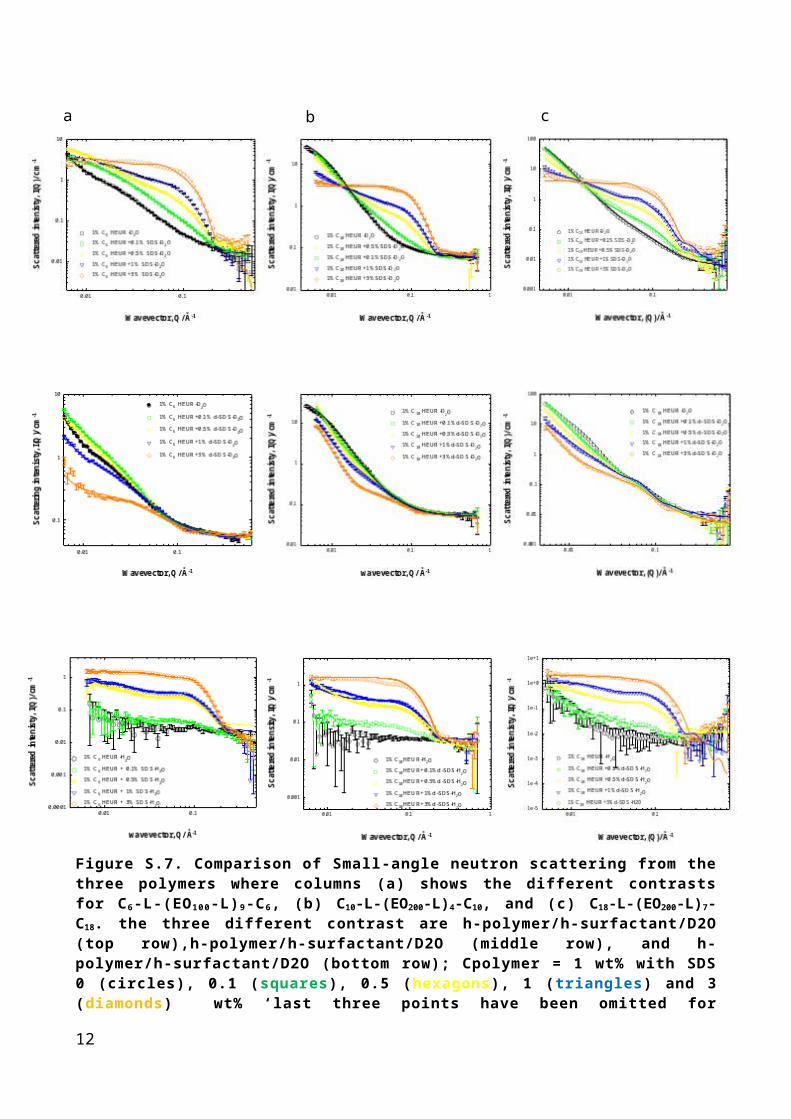
Figure S.7. Comparison of Small-angle neutron scattering from the three polymers where columns (a) shows the different contrasts for C 6-L-(EO100-L)9-C6, (b) C10-L-(EO200-L)4-C10, and (c) C18-L-(EO200-L)7-C18. the three different contrast are h-polymer/h-surfactant/D2O (top row),h-polymer/h-surfactant/D2O (middle row), and h-polymer/h-surfactant/D2O (bottom row); Cpolymer = 1 wt% with SDS 0 (circles), 0.1 (squares), 0.5 (hexagons), 1 (triangles) and 3 (diamonds) wt% ‘last three points have been omitted for clarity’. Measurements were carried out at 25 °C, pH 9, and ionic strength 100 mM. The solid lines are fits for sphere and gel model.
Scattering key parameter for the polymer from sphere and network model
Overall scattering parameters
Fit
parameters/
Units
7 % HEUR +
0 % SDS
7 % HEUR +
0.1 % SDS
7 % HEUR +
0.5 % SDS
7 % HEUR +
1 % SDS
7 % HEUR +
3 % SDS
Intensity of
radius term3.4 x 10-6 5.1 x 10⁻⁶ 2.4 x 10⁻⁶ 1.8 x 10⁻⁶ 4.1 x 10⁻⁵
Radius (Å) 74 ± 5 69 ± 5 56 ± 2 21 ± 1 20 ± 1
9
C n.d. n.d. n.d. 10 10
I1 2.6 2.6 2.6 2.6 0.8
ξ (Å) 33 ± 1 30 ± 1 32 ± 1 27 ± 1 21 ± 1
I2 2680 2600 2600 2600 2000
A (Å) 320 ± 5 330 ± 5 320 ± 5 330 ± 5 334 ± 5
Table S.1. SANS key parameters from the sphere and network model for h-C10-L-(EO200-L)4-C10/h-SDS/D2O at Cpolymer = 7 wt%.
Fit
parameters/
Units
7 % HEUR +
0 % SDS
7 % HEUR +
0.1 % SDS
7 % HEUR +
0.5 % SDS
7 % HEUR +
1 % SDS
7 % HEUR +
3 % SDS
Intensity of
radius term1.2 x 10-6 5.3 x 10⁻⁶ 4.5 x 10⁻⁶ 2.4 x 10⁻⁶ 7.9 x 10⁻⁵
Radius (Å) (10-70) 70 ± 5 38 ± 2 25 ± 1 20 ± 1
C n.d. n.d. n.d. 10 10
I1 8.9 3.8 4 4.3 2
ξ (Å) 66 ± 2 66 ± 2 66 ± 2 45 ± 2 45 ± 2
10
I2 1106 200 230 400 250
A (Å) 217 ± 5 224 ± 5 217 ± 5 200 ± 5 200 ± 5
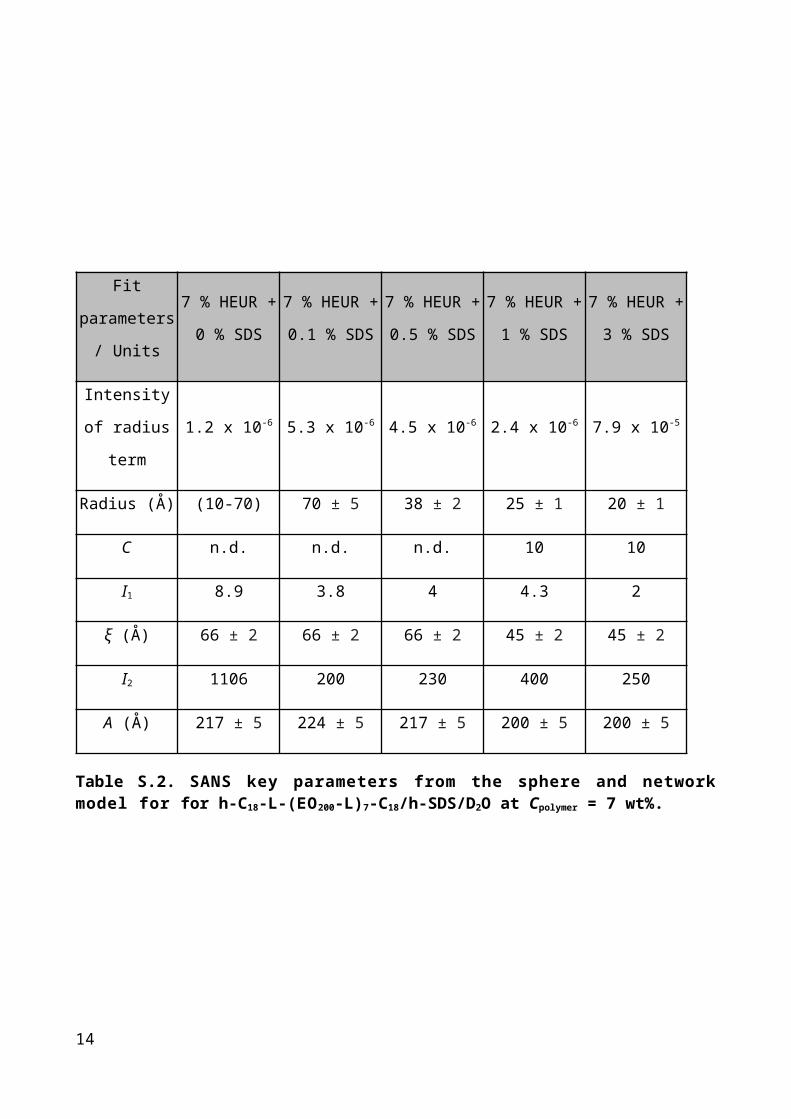
Table S.2. SANS key parameters from the sphere and network model for for h-C18-L-(EO200-L)7-C18/h-SDS/D2O at Cpolymer = 7 wt%.
Fit parameters/
Units
1 % HEUR + 0 % SDS
1 % HEUR + 0.1 % SDS
1 % HEUR + 0.5 % SDS
1 % HEUR + 1 % SDS
1 % HEUR + 3 % SDS
Intensity of
radius term5.2 x 10-8 2.0 x 10⁻⁷ 7.3 x 10⁻⁶ 9.4x 10⁻⁵ 4.6 x 10⁻⁵
Radius (Å) (10-70) (10-30) 20 ± 2 20 ± 1 20 ± 1
C n.d. n.d. n.d. 10 10
I1 1.78 4.4 4.9 3 2.3
ξ (Å) 75 ± 2 79 ± 2 80 ± 2 50 ± 2 40 ± 2
I2 247 247 247 n.d. n.d.
11
A (Å) 455 ± 10 455 ± 10 455 ± 10 n.d. n.d.
Table S.3. SANS key parameters from the sphere and network model for C6-L-(EO100-L)9-C6/SDS/D2O Cpolymer = 1wt%.
Fit
parameters/
Units
1 % HEUR +
0 % SDS
1 % HEUR +
0.1 % SDS
1 % HEUR +
0.5 % SDS
1 % HEUR +
1 % SDS
1 % HEUR +
3 % SDS
Intensity of
radius term7.9 x 10-8 9.9 x 10⁻⁷ 8.5 x 10⁻⁶ 2.7 x 10⁻⁵ 5.3 x 10⁻⁵
Radius (Å) 20 ± 2 20 ± 2 20 ± 2 20 ± 1 20 ± 1
C n.d. n.d. n.d. 10 10
I1 1.7 1.7 1.7 1.7 2.5
ξ (Å) 73 ± 2 50 ± 2 50 ± 2 40 ± 2 38 ± 2
I2 34 34 20 5.72 n.d.
A (Å) 120 ± 2 120 ± 2 100 ± 2 100 ± 2 n.d.
12
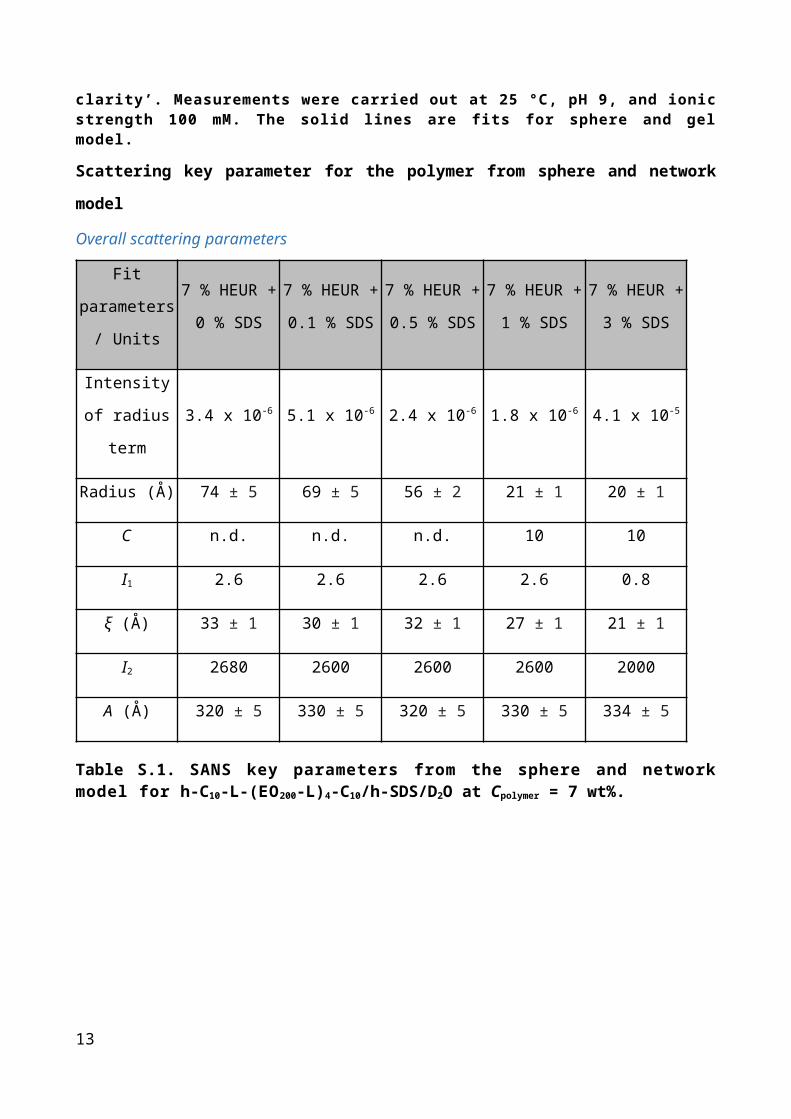
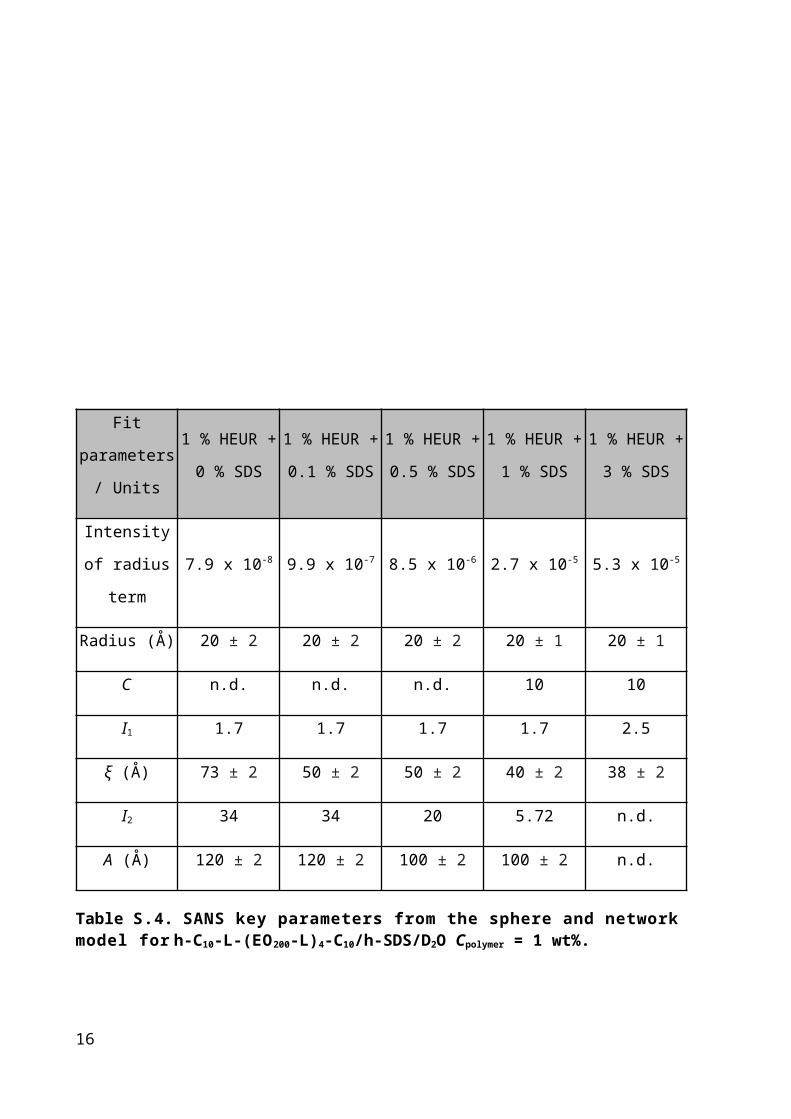
Table S.4. SANS key parameters from the sphere and network model for h-C10-L-(EO200-L)4-C10/h-SDS/D2O Cpolymer = 1 wt%.
Fit
parameters/
Units
1 % HEUR +
0 % SDS
1 % HEUR +
0.1 % SDS
1 % HEUR +
0.5 % SDS
1 % HEUR +
1 % SDS
1 % HEUR +
3 % SDS
Intensity of
radius term9.3 x 10-6 2.0 x 10⁻⁶ 1.3 x 10⁻⁵ 1.9 x 10⁻⁵ 5.9 x 10⁻⁵
Radius (Å) 20 ± 1 20 ± 1 21 ± 1 20 ± 1 20 ± 1
C n.d. n.d. n.d. 10 10
I1 0.6 1.3 1.5 1.5 1.5
ξ (Å) 53 ± 2 42 ± 2 42 ± 2 35 ± 2 30 ± 2
I2 153 93 24 9.7 n.d.
A (Å) 160 ± 2 160 ± 2 120 ± 2 87 ± 2 n.d.
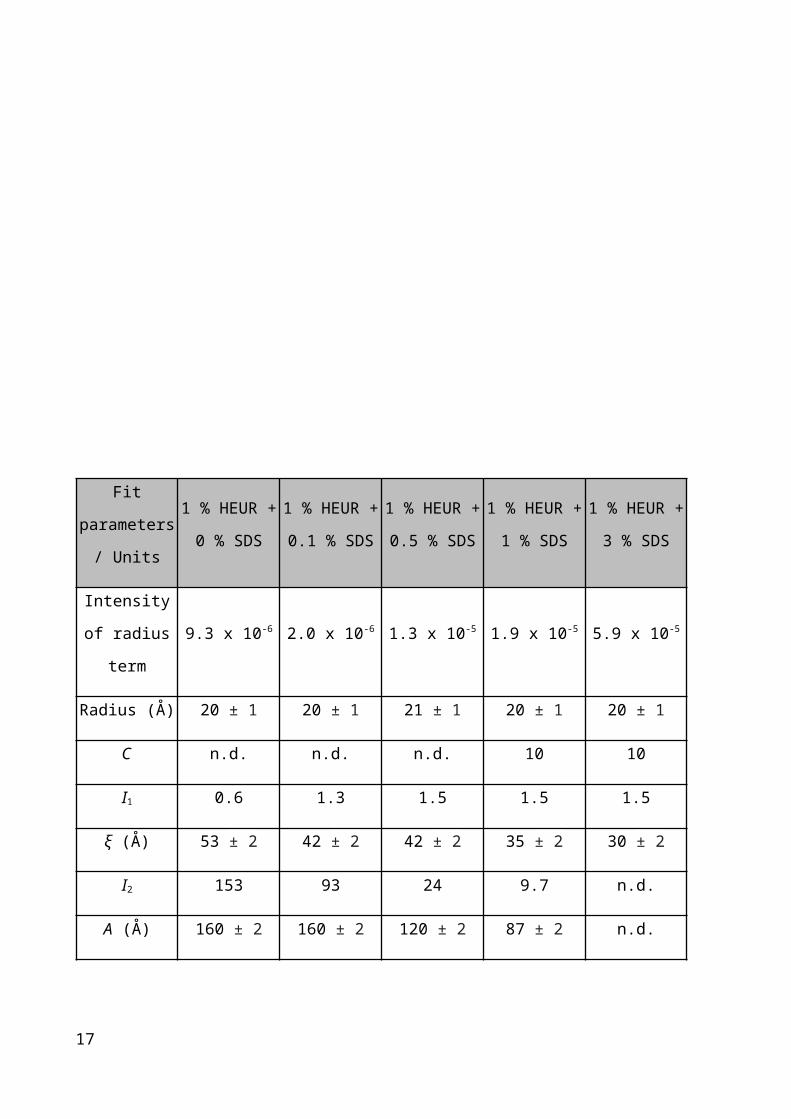
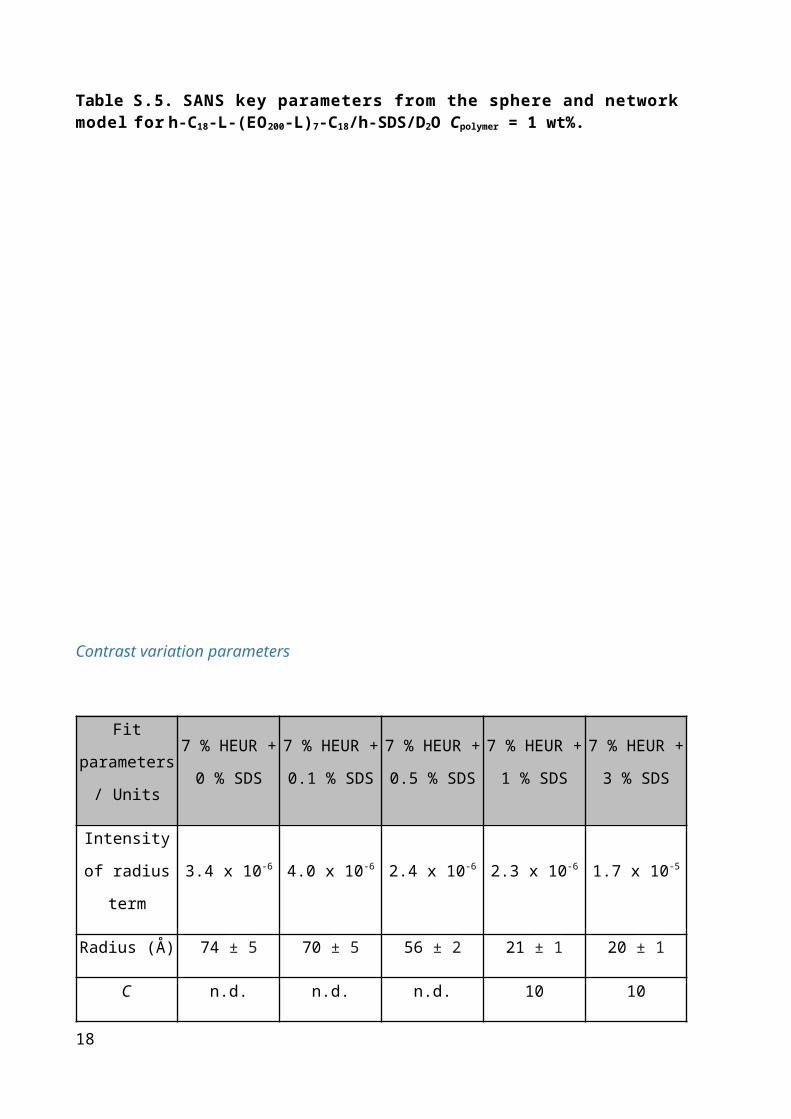
Table S.5. SANS key parameters from the sphere and network model for h-C18-L-(EO200-L)7-C18/h-SDS/D2O Cpolymer = 1 wt%.
13
Contrast variation parameters
Fit
parameters/
Units
7 % HEUR +
0 % SDS
7 % HEUR +
0.1 % SDS
7 % HEUR +
0.5 % SDS
7 % HEUR +
1 % SDS
7 % HEUR +
3 % SDS
Intensity of
radius term3.4 x 10-6 4.0 x 10⁻⁶ 2.4 x 10⁻⁶ 2.3 x 10⁻⁶ 1.7 x 10⁻⁵
Radius (Å) 74 ± 5 70 ± 5 56 ± 2 21 ± 1 20 ± 1
C n.d. n.d. n.d. 10 10
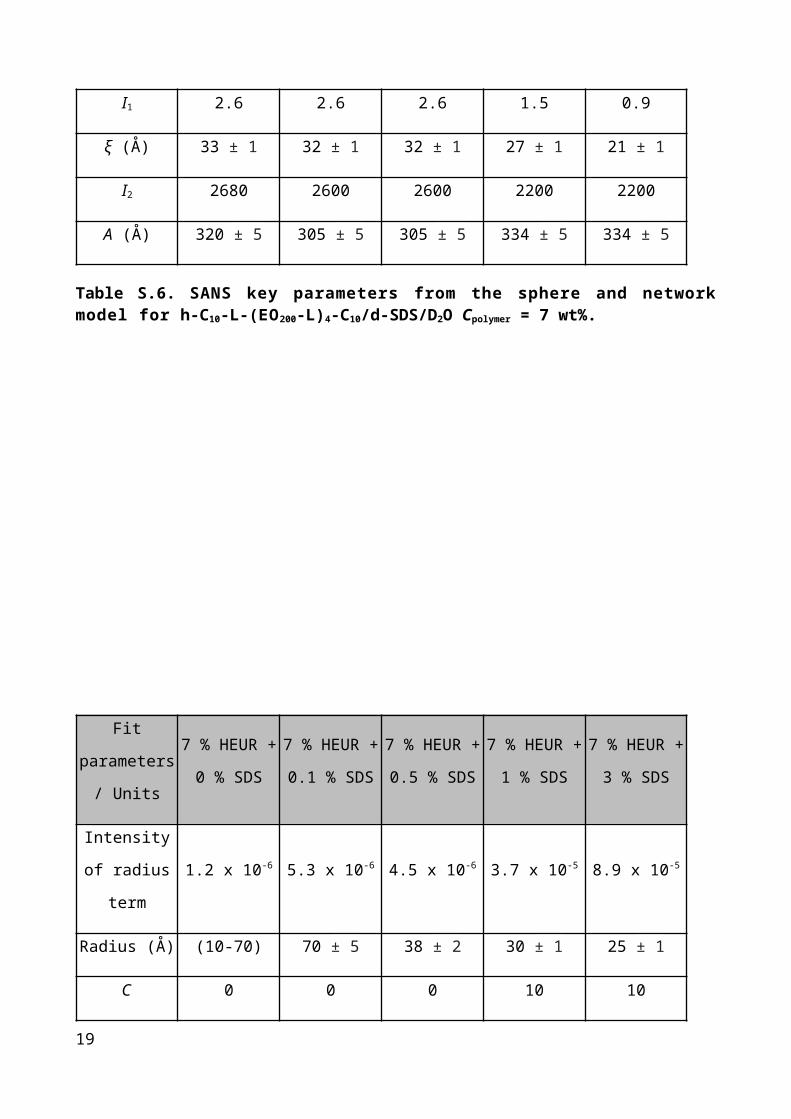
I1 2.6 2.6 2.6 1.5 0.9
ξ (Å) 33 ± 1 32 ± 1 32 ± 1 27 ± 1 21 ± 1
I2 2680 2600 2600 2200 2200
A (Å) 320 ± 5 305 ± 5 305 ± 5 334 ± 5 334 ± 5
Table S.6. SANS key parameters from the sphere and network model for h-C10-L-(EO200-L)4-C10/d-SDS/D2O Cpolymer = 7 wt%.
14

Fit
parameters/
Units
7 % HEUR +
0 % SDS
7 % HEUR +
0.1 % SDS
7 % HEUR +
0.5 % SDS
7 % HEUR +
1 % SDS
7 % HEUR +
3 % SDS
Intensity of
radius term1.2 x 10-6 5.3 x 10⁻⁶ 4.5 x 10⁻⁶ 3.7 x 10⁻⁵ 8.9 x 10⁻⁵
Radius (Å) (10-70) 70 ± 5 38 ± 2 30 ± 1 25 ± 1
C 0 0 0 10 10
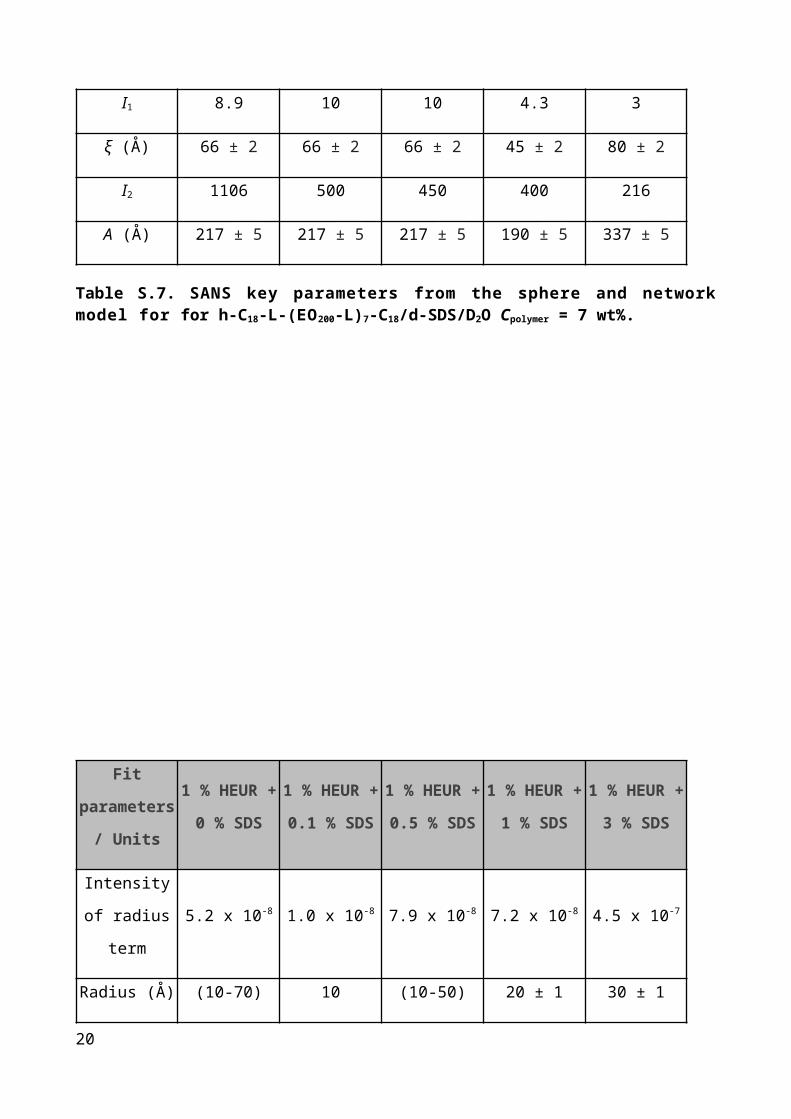
I1 8.9 10 10 4.3 3
ξ (Å) 66 ± 2 66 ± 2 66 ± 2 45 ± 2 80 ± 2
I2 1106 500 450 400 216
A (Å) 217 ± 5 217 ± 5 217 ± 5 190 ± 5 337 ± 5
Table S.7. SANS key parameters from the sphere and network model for for h-C18-L-(EO200-L)7-C18/d-SDS/D2O Cpolymer = 7 wt%.
15
Fit parameters/
Units
1 % HEUR + 0 % SDS
1 % HEUR + 0.1 % SDS
1 % HEUR + 0.5 % SDS
1 % HEUR + 1 % SDS
1 % HEUR + 3 % SDS
Intensity of
radius term5.2 x 10-8 1.0 x 10⁻⁸ 7.9 x 10⁻⁸ 7.2 x 10⁻⁸ 4.5 x 10⁻⁷
Radius (Å) (10-70) 10 (10-50) 20 ± 1 30 ± 1
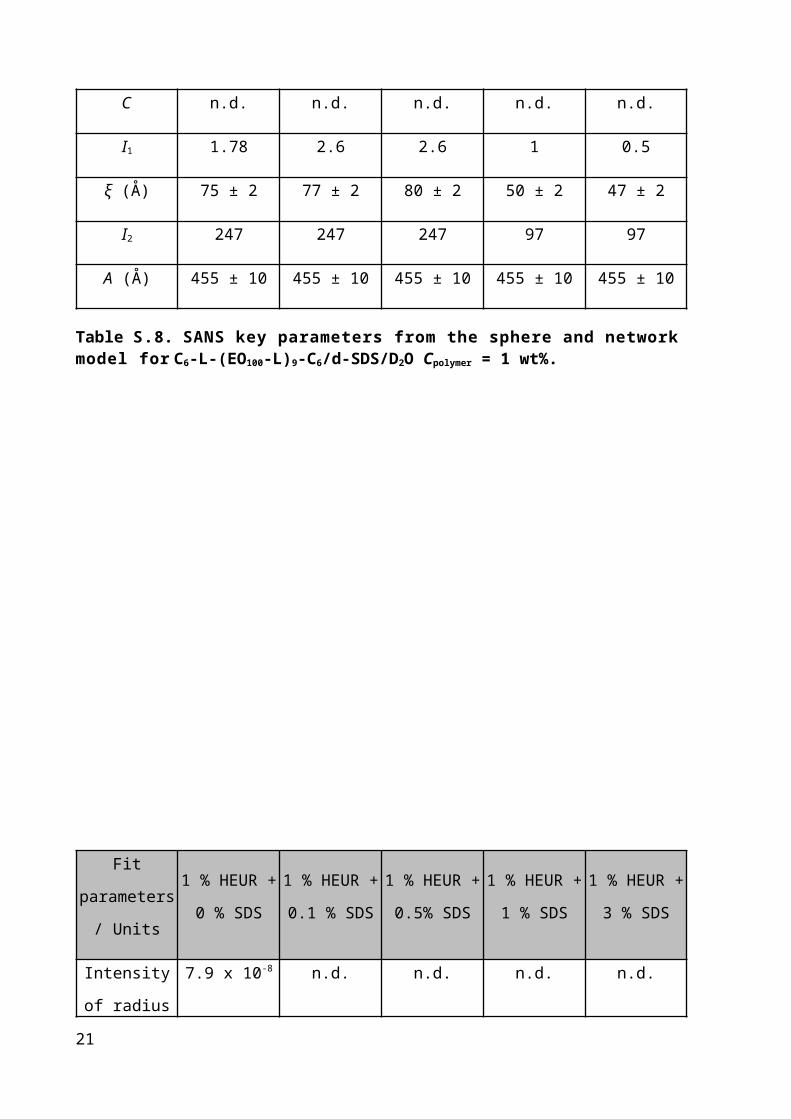
C n.d. n.d. n.d. n.d. n.d.
I1 1.78 2.6 2.6 1 0.5
ξ (Å) 75 ± 2 77 ± 2 80 ± 2 50 ± 2 47 ± 2
I2 247 247 247 97 97
A (Å) 455 ± 10 455 ± 10 455 ± 10 455 ± 10 455 ± 10
Table S.8. SANS key parameters from the sphere and network model for C6-L-(EO100-L)9-C6/d-SDS/D2O Cpolymer = 1 wt%.
16
Fit
parameters/
Units
1 % HEUR +
0 % SDS
1 % HEUR +
0.1 % SDS
1 % HEUR +
0.5% SDS
1 % HEUR +
1 % SDS
1 % HEUR +
3 % SDS
Intensity of
radius term7.9 x 10-8 n.d. n.d. n.d. n.d.
Radius (Å) 20 ± 2 n.d. n.d. n.d. n.d.
C n.d. n.d. n.d. 10 10
I1 1.7 1.0 1.7 0.5 0.5
ξ (Å) 73 ± 2 50 ± 2 50 ± 2 36 ± 2 30 ± 2
I2 34 34 20 5 186
A (Å) 120 ± 2 120 ± 2 100 ± 2 165 ± 2 300 ± 2
Table S.9. SANS key parameters from the sphere and network model for h-C10-L-(EO200-L)4-C10/d-SDS/D2O Cpolymer = 1 wt%.
17
Fit
parameters/
Units
1 % HEUR +
0 % SDS
1 % HEUR +
0.1 % SDS
1 % HEUR +
0.5 % SDS
1 % HEUR +
1 % SDS
1 % HEUR +
3 % SDS
Intensity of
radius term9.3 x 10-7 2.6 x 10⁻⁸ 2.6 x 10⁻⁸ 8.3 x 10⁻⁷ 4.6 x 10⁻⁶
Radius (Å) 20 ± 1 20 ± 1 20 ± 1 30 ± 1 30 ± 1
C 0 0 0 10 10
I1 0.6 0.6 0.64 0.17 0.34
ξ (Å) 53 ± 2 44 ± 2 40 ± 2 26 ± 2 34 ± 2
I2 93 70 21 3.4 39
A (Å) 123 ± 2 123 ± 2 120 ± 2 58 ± 2 230 ± 2
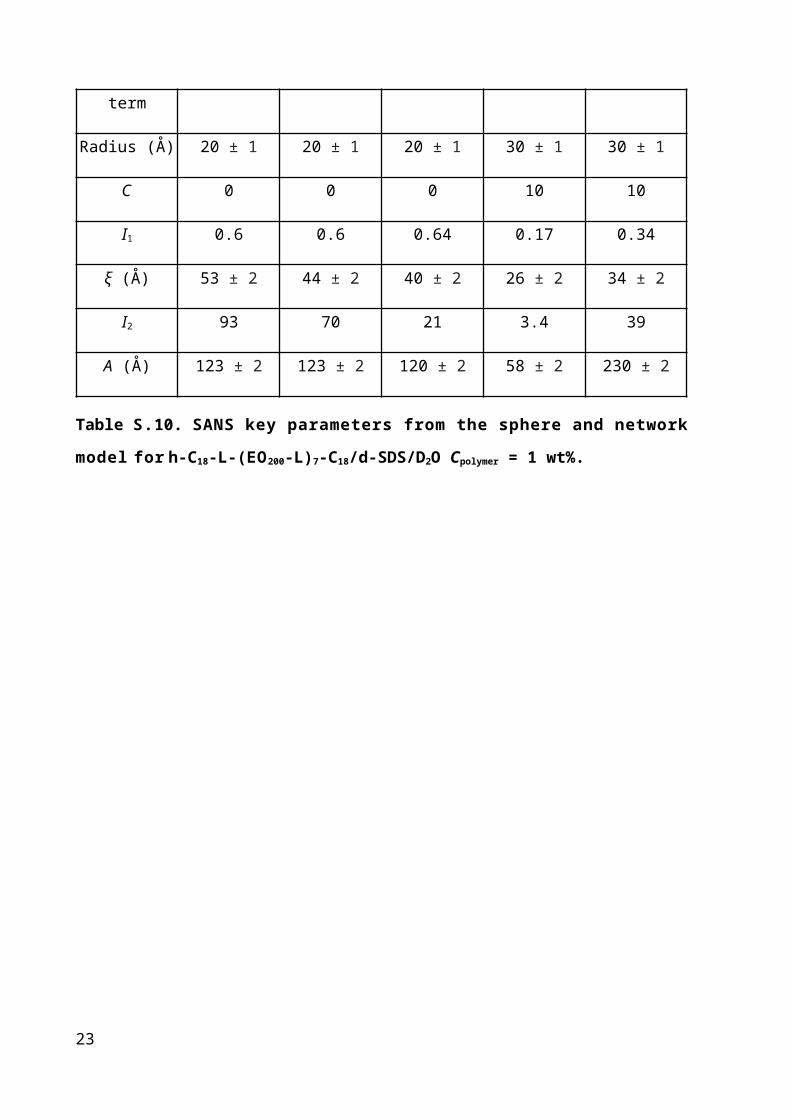
Table S.10. SANS key parameters from the sphere and network model for h-C18-L-(EO200-L)7-C18/d-SDS/D2O Cpolymer = 1 wt%.
18
Contrast match parameters
Fit parameters/ Units7 % HEUR + 0.5 %
SDS
7 % HEUR + 1 %
SDS
7 % HEUR + 3 %
SDS
Intensity of radius
term1.5 x 10-6 3.9 x 10⁻⁶ 2.2 x 10⁻⁵
Radius (Å) 23 ± 1 22 ± 1 20 ± 0.5
C n.d. 10 10
I1 0.08 0.08 0.1
ξ (Å) 13 ± 1 13 ± 1 6 ± 1
I2 23 20 25
A (Å) 300 ± 5 299 ± 5 299 ± 5
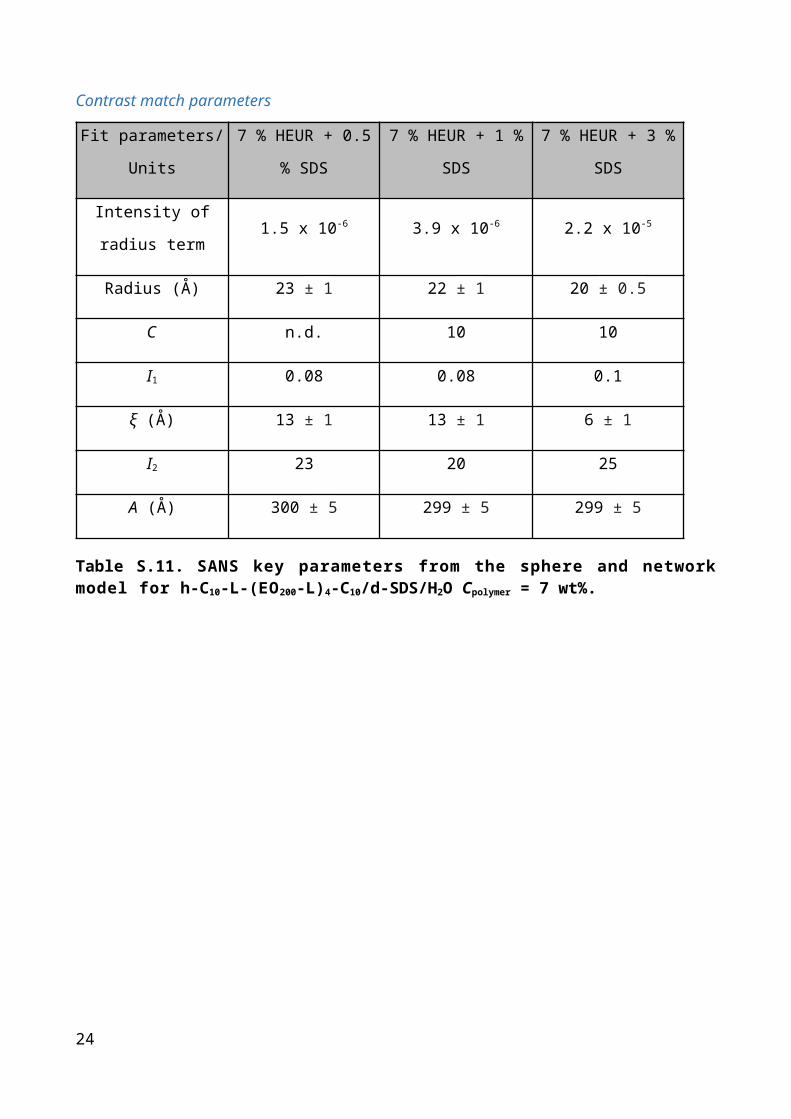
Table S.11. SANS key parameters from the sphere and network model for h-C10-L-(EO200-L)4-C10/d-SDS/H2O Cpolymer = 7 wt%.
19
Fit parameters/ Units 7 % HEUR + 1 % SDS 7 % HEUR + 3 % SDS
Intensity of radius 9.8 x 10⁻⁶ 2.8 x 10⁻⁵
Radius (Å) 25 ± 1 20 ± 1
C 10 10
I1 n.d. n.d.
ξ (Å) n.d. n.d.
I2 n.d. 1
A (Å) n.d. 200 ± 5
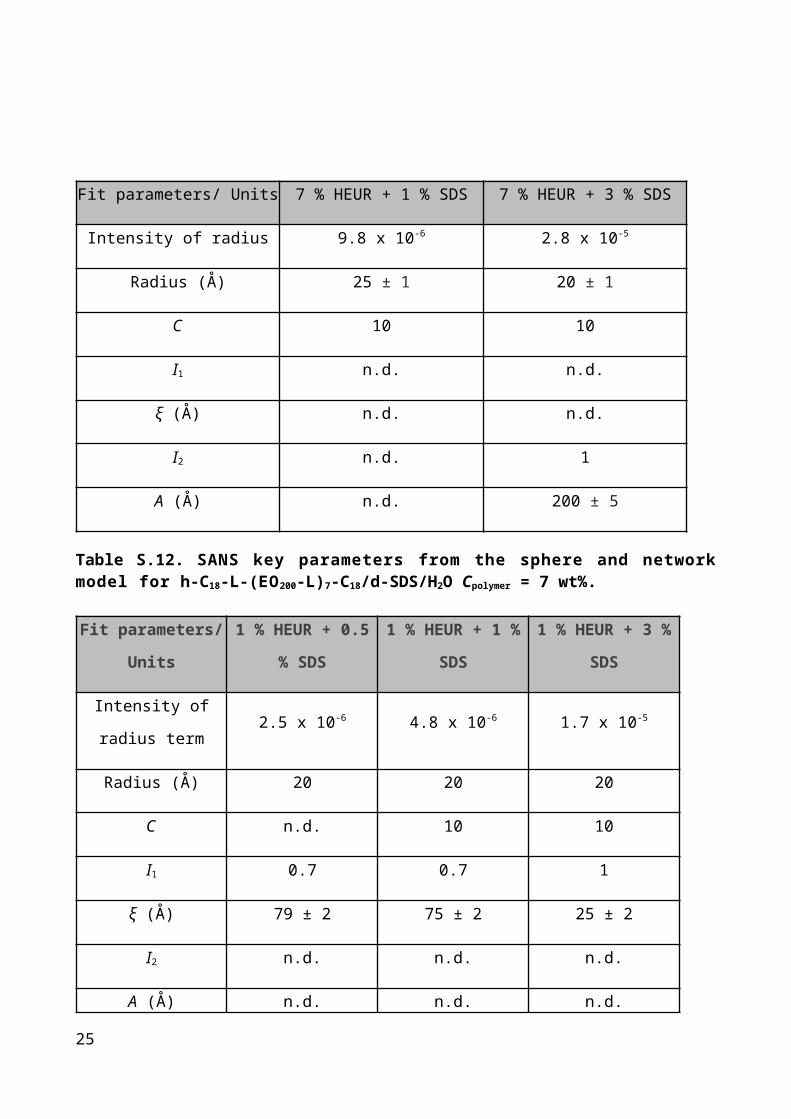
Table S.12. SANS key parameters from the sphere and network model for h-C18-L-(EO200-L)7-C18/d-SDS/H2O Cpolymer = 7 wt%.
Fit parameters/ Units
1 % HEUR + 0.5 % SDS
1 % HEUR + 1 % SDS
1 % HEUR + 3 % SDS
Intensity of radius
term2.5 x 10-6 4.8 x 10⁻⁶ 1.7 x 10⁻⁵
Radius (Å) 20 20 20
C n.d. 10 10
I1 0.7 0.7 1
ξ (Å) 79 ± 2 75 ± 2 25 ± 2
I2 n.d. n.d. n.d.
A (Å) n.d. n.d. n.d.
Table S.13. SANS key parameters from the sphere and network model for C6-L-(EO100-L)9-C6/d-SDS/H2O Cpolymer = 1wt%.
20
Fit parameters/ Units1 % HEUR + 0.5 %
SDS
1 % HEUR + 1 %
SDS
1 % HEUR + 3 %
SDS
Intensity of radius
term1.09 x 10-6 1.6 x 10⁻⁶ 6.0 x 10⁻⁶
Radius (Å) 18 17 18
C 0 10 10
I1 0.6 0.6 1.38
ξ (Å) 50 ± 2 38 ± 2 35 ± 2
I2 1.2 0.9 n.d.
A (Å) 100 ± 5 100 ± 5 n.d.
Table S.14. SANS key parameters from the sphere and network model for h-C10-L-(EO200-L)4-C10/d-SDS/H2O Cpolymer = 1 wt%.
Fit parameters/ Units1 % HEUR + 0.5 %
SDS
1 % HEUR + 1 %
SDS
1 % HEUR + 3 %
SDS
Intensity of radius
term1.9 x 10-6 2.6 x 10⁻⁶ 6.6 x 10⁻⁵
Radius (Å) 20 ± 1 20 ± 1 18
C n.d. 10 10
I1 n.d. n.d. 2.1
ξ (Å) n.d. n.d. 39 ± 2
I2 2.7 1.3 n.d.
A (Å) 120 ± 2 55 ± 2 n.d.
Table S.15. SANS key parameters from the sphere and network model for h-C18-L-(EO200-L)7-C18 /d-SDS/H2O Cpolymer = 1 wt%.
21

References
1. Karlson L. Hydrophobically modified polymers rheology and molecular associations.
Ph.D. Thesis, University of Lund. 2002.
2. Huldun, M. Hydrophobically modified urethane-ethoxylate (HEUR) associative
thickeners 1. Rheology of aqueous solutions and interactions with surfactants.
Colloids Surfaces A Physicochem. 1994;82:263–277.
3. Annable T, Buscall R, Ettelaie R, Whittlestone D. The rheology of solutions of
associating polymers : Comparison of experimental behavior with transient network
theory. J Rheol. 1992;37:695-726.
4. Annable T, Buscall R, Ettelaie R. Network formation and its consequences for the
physical behaviour of associating polymers in solution. Colloids Surfaces A
Physicochem Eng Asp. 1996;11:97-116.
5. Paeng KW, Kim B, Kim E, Sohn D. Aggregation processes of hydrophobically
modified polethylene oxide. Bull Korean Chem Soc. 2000; 21: 623-627.
6. Yekta A, Xu B, Duhamel J, Adiwidjaja H, Winnik MA. Fluorescence studies of
associating polymers in water-determination of the chain-end aggregation number
and a model for the association process. Macromolecules. 1995;28(4):956–966.
7. Gourier C, Beaudoin E, Duval M, Sarazin D, Maitre S, Francois J. A light scattering
study of the association of hydrophobically alpha- and alpha, omega-end-capped
poly(ethylene oxide) in water. J Colloid Interface Sci. 2000;230(1):41–52.
8. Lafleche F, Durand D, Nicolai T. Association of adhesive spheres formed by
hydrophobically end-capped PEO. 1. Influence of the presence of single end-capped
PEO. Macromolecules. 2003;36(4):1331–1340.
9. Persson K, Bales BL. EPR study of an associative polymer in solution: determination
of aggregation number and interactions with surfactants. J Chem Soc Faraday
Trans. 1995;91(17):2863-2870.
10. Abrahmsen-Alami S, Alami E, Francois J. The lyotropic cubic phase of model
associative polymers : Small-angle X-Ray scattering (SAXS), differential scanning
calorimetry (DSC), and turbidity measurements. J Colloid Interface Sci.
2000;179(179):20–33.
22
11. Francois J, Maitre S, Rawiso M, Sarazin D, Beinert G, Isel F. Neutron and X-ray
scattering studies of model hydrophobically end-capped poly(ethylene oxide)
aqueous solutions at rest and under shear. Colloids Surfaces A Physicochem Eng
Asp. 1996;112(1-2):251-265.
12. Beaudoin E, Lapp A, Hiorns RC, Grassl B, François J. Neutron scattering of
hydrophobically modified poly(ethylene oxide) in aqueous solutions in the presence
of latex particles. Polymer. 2002;43(9):2677–2689.
13. Raspaud E, Lairez D, Adam M, Carton JP. Triblock copolymers in a selective
solvent. 1. Aggregation process in dilute solution. Macromolecules.
1994;27(11):2956–2964.
14. Xu B, Yekta A, Li L, Masoumi Z, Winnik MA. The functionality of associative polymer
networks: The association behavior of hydrophobically modified urethane-ethoxylate
(HEUR) associative polymers in aqueous solution. Colloids Surfaces A
Physicochem Eng Asp. 1996;112(2-3):239–250.
15. Richey B, Kirk AB, Eisenhart EK, Fitzwater S, Hook J. Interactions of associative
thickeners with paint components as studied by the use of a fluorescently labeled
model thickener. J Coatings Technology. 1991;63(798):31–40.
16. Brown W, Fundin J, Graca Miguel M. Poly(ethylene oxide)-sodium dodecyl sulfate
interactions studied using static and dynamic light scattering. Macromolecules.
1992;25(26):7192–7198.
17. Smitter LM, Guedez JF, Muller AJ, Saez AE. Interactions between poly(ethylene
oxide) and sodium dodecyl sulfate in elongational flows. J Colloid Interface Sci.
2001;236(2):343–353.
18. Jones MN. The interaction of sodium dodecyl sulfate with polyethylene oxide. J
Colloid Interface Sci. 1967;23(1):36–42.
19. Francois J, Dayantis J, Sabbadin J. Hydrodynamical behaviour of the poly(ethylene
oxide) -sodium dodecylsulphate complex. Eur Polym J. 1985;21(2):165–174.
20. Kaczmarski JP, Glass JE. Synthesis and solution properties of hydrophobically-
modified ethoxylated urethanes with variable oxyethylene spacer lengthst.
Macromolecules. 1993;26(19):5149–5156.
21. Lundberg DJ, Brown RG, Glass JE, Eley RR. Synthesis, characterization, and 23
solution rheology of model hydrophobically-modified, water-soluble ethoxylated
urethanes. Langmuir. 1994;10(9):3027–3034.
22. Regalado EJJ, Vallejo CCR, Textle HM, Guerrero R, Munoz JFE. Influence of
hydrophobe, surfactant and salt concentrations in hydrophobically modified alkali-
soluble polymers obtained by solution polymerization. J Mex Chem Soc.
2012;56(2):1387-1396.
23. Volpert E, Selb J, Candau F. Associating behaviour of polyacrylamides
hydrophobically modified with dihexylacrylamide. Polymer. 1998;39(5):1025–1033.
24. Thuresson K, So O, Hansson P, Wang G. Binding of SDS to
ethyl(hydroxyethyl)cellulose. Effect of hydrophobic modification of the polymer. J
Phys Chem. 1996:100(12):4909–4918.
25. Alami E, Almgren M, Brown W. Interaction of hydrophobically end-capped
poly(ethylene oxide) with nonionic surfactants in aqueous solution. Fluorescence
and light scattering studies. Macromolecules. 1996;29(14):5026–5035.
26. Persson K, Griffiths PC, Stilbs P. Self-diffusion coefficient distributions in solutions
containing hydrophobically modified water-soluble polymers and surfactants.
Polymer. 1996;37(2):253–261.
27. Najafi F, Pishvaei M. Synthesis and characterization of nonionic urethane based
linker. Prog Color Color Coat. 2011;4:71–77.
28. Barmar M, Barikani M, Kaffashi B. Synthesis of ethoxylated urethane and
modification with cetyl alcohol as thickener. Iran Polym J. 2001;10(5):331–335.
29. Abrahmsen-Alami S, Stilbs P. NMR self-diffusion of associative polymers in aqueous
solution : The influence of the hydrocarbon end-chain length on the polymer
transport dynamics in single- and two-component mixtures. J Colloid Interface Sci.
1997;189(1):137–143.
30. Claridge. High-Resolution NMR Techniques in Organic Chemistry. Second.
Oxford,UK: ELSVIERE; 2009.
31. Hawe A, Sutter M, Jiskoot W. Extrinsic fluorescent dyes as tools for protein
characterization. Pharm Res. 2008;25(7):1487–1499.
32. Heenan RK, King SM, Turner DS, Treadgold JR. SANS2d at the ISIS second target
24
station. 17th Meet Int Collab Adv Neutron Sources. 2005;1–6. Available from:
http://www.isis.stfc.ac.uk/instruments/sans2d/publications/sans2d-at-isis10323.pdf,
(acessed January 2017).
33. Suzuki S, Uneyama T, Watanabe H. Concentration dependence of nonlinear
rheological properties of hydrophobically modified ethoxylated urethane aqueous
solutions. Macromolecules. 2013;46(9):3497–3504.
34. Saffer EM, Lackey MA, Griffin DM, Kishore S, Tew GN, Bhatia SR. SANS study of
highly resilient poly(ethylene glycol) hydrogels. Soft Matter. 2014;10(12):1905-1916.
35. Rosen M. Surfactants and interfacial phenomena. Second edition. New York, Wiley:
USA; 1989.
36. Dai S, Tam KC, Wyn-Jones E, Jenkins RD. Isothermal titration calorimetric and
electromotive force studies on binding interactions of hydrophobic ethoxylated
urethane and sodium dodecyl sulfate of different molecular masses. J Phys Chem B.
2004;108(16):4979–4988.
37. Liao D, Dai S, Tam KC. Rheological properties of hydrophobic ethoxylated urethane
(HEUR) in the presence of methylated β-cyclodextrin. Polymer. 2004;45(25):8339–
48.
38. Liao DS, Dai S, Tam KC. Influence of anionic surfactant on the rheological
properties of hydrophobically modified polyethylene-oxide/cyclodextrin inclusion
complexes. J Rheol. 2009;53(2):293–308.
39. Dai S, Tam KC, Wyn-Jones E, Jenkins RD. Isothermal titration calorimetric and
electromotive force studies on binding interactions of hydrophobic ethoxylated
urethane and sodium dodecyl sulfate of different molecular masses. J Phys Chem B.
2004;108(16):4979–4988.
25
Top Related