


Languages
Pages
Legal


Argo Global Listed Infrastructure LimitedABN 23 604 986 914
Appendix 4EPreliminary Final Report
for the year ended 30 June 2018(previous corresponding period being
the year ended 30 June 2017)

ARGO GLOBAL LISTED INFRASTRUCTURE LIMITED ABN 23 604 986 914
RESULTS FOR ANNOUNCEMENT TO THE MARKETYEAR ENDED 30 JUNE 2018
(Comparative figures being the period ended 30 June 2017)
2018$A’000
2017$A’000
Revenue from operating activities up 80.2% to 27,658 15,350
Profit for the year up 108.4% to 16,242 7,794
Dividends
Interim unfranked dividend paid 23 March 2018 1.25 centsFinal fully franked dividend payable 28 September 2018 2.50 centsTotal 3.75 cents
The Company’s Dividend Reinvestment Plan will operate for the final dividend. Shares issued under the DRP will be allocated based on the volume weighted average ex-dividend market price of the shares traded on the record date and the three business days following the record date.
The DRP Terms and Conditions can be accessed at the Company’s website at www.argoinfrastructure.com.au.
The record date for determining entitlements to the final dividend 10 September 2018The election date for determining participation in the Dividend Reinvestment Plan 11 September 2018
Previous corresponding periodInterim unfranked dividend paid 24 March 2017 1.0 centFinal unfranked dividend paid 29 September 2017 2.5 centsTotal 3.5 cents
Net Tangible Asset (NTA) BackingJune2018
June2017
NTA per share 1 $2.16 $2.06NTA after unrealised tax provision 2 $2.13 $2.04
1. This figure allows for all costs incurred, including company tax and any tax payable on gains realised from portfolio sales.2. Under ASX Listing Rules, the Company is also required to calculate the NTA per share after providing for estimated tax on
unealised gains/losses in the portfolio (tax that may arise should the entire portfolio be disposed of on the above date).
ARGO GLOBAL LISTED INFRASTRUCTURE LIMITED ACN 604 986 914
ASX/Media Release 27 August 2018
AGLI declares first fully franked dividend Argo Global Listed Infrastructure Limited (AGLI) today announces a significant increase in full year profit to a record $16.2 million. The Board has declared a fully franked final dividend of 2.5 cents per share, increasing the dividends for the full year by 7% on the previous year. AGLI is a listed investment company with over $300 million of assets invested across a portfolio of global listed infrastructure companies. Cohen & Steers, AGLI’s specialist New York-based portfolio manager, delivered a strong portfolio performance of +9.3%, well above the benchmark FTSE Global Core Infrastructure 50/50 Index.
Summary of financial results
30 June 2018 30 June 2017
Profit* $16.2 million $7.8 million Final dividend per share (fully franked in 2018) 2.5 cents 2.5 cents
Annual dividends per share 3.75 cents 3.5 cents Net tangible asset backing (NTA) per share, after costs and tax $2.16 $2.06
* under Australian Accounting Standards, AGLI’s operating income and realised profits and losses are added to, or reduced by, changes in the market value of the Company’s assets. This can lead to large variations in reported profit from one period to the next.
Overview It was another strong year for global share markets, and listed infrastructure also produced good returns, although consistent with the sector’s defensive nature, they did lag those recorded by the broader equity indices.
Markets were strongest in the first half of the financial year, with many indices hitting record highs, driven by synchronised economic growth in most regions of the world and tax cuts in the US. Since January 2018 though, markets have become more volatile as investors consider whether too much economic growth could see interest rates rising more quickly than expected. In addition, there have been increasing global trade tensions between the US and its major trading partners, including China.
Over that six-month period, AGLI has performed well, exceeding the returns of broader equity markets both in Australia and globally, providing the intended benefits of investor diversification into global listed infrastructure. As AGLI is unhedged, the decline in the Australian dollar assisted this performance, as did the investment outperformance recorded by the portfolio manager. For the six months to 31 July 2018, AGLI’s portfolio returned +9.7% compared to the global listed infrastructure index return of +9.1% and the ASX200 Accumulation Index return of +6.2%.
Most areas of global infrastructure finished the financial year positively. Railway operators, especially the large companies in North America such as Union Pacific (AGLI’s 5th largest holding) were particularly strong due to volume growth from increasing economic activity.
Communications tower companies once again outperformed, due to the ongoing and seemingly relentless growth in demand for the transmission of wireless data to an ever-increasing number of devices. Two of AGLI’s top five holdings are communications tower companies.
The weakest area of infrastructure was marine ports, which suffered as concerns mounted that US protectionist policies could damage international trade volumes.
Investment Performance The performance table below shows that although the infrastructure sector lagged the strong performance of broader equity markets for the year to 30 June 2018, AGLI’s portfolio added significant value above the benchmark index.
Accumulated performance (per annum) 1 year 2 years Since
inception* NTA return (after all costs and tax) +6.7% +5.0% +4.7% Portfolio return (before costs and tax) +9.3% +7.3% +6.9% Infrastructure sector benchmark index (A$)** +6.7% +6.5% +7.4% Share price return -0.6% +1.1% -2.0% Australian equities - S&P ASX200 Accum. Index +13.0% +13.5% +8.1%
* Inception date was 3 July 2015 ** Benchmark is the FTSE Global Core Infrastructure 50/50 Index (in A$)
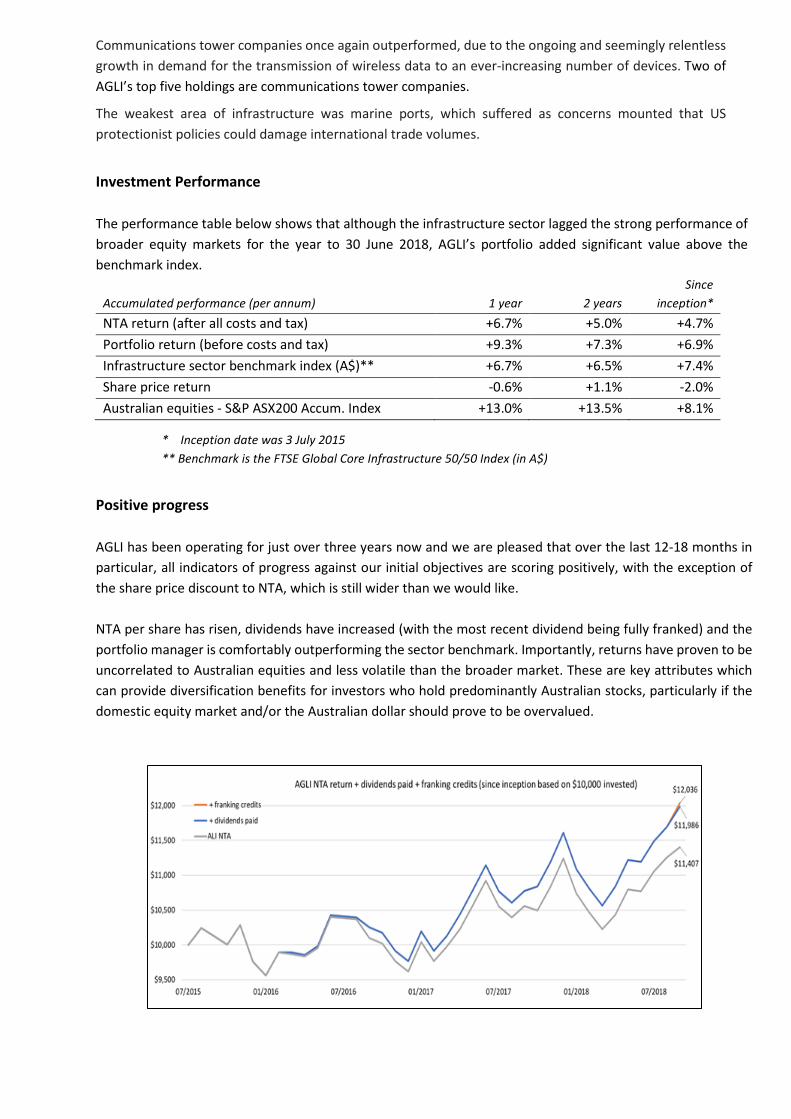
Positive progress AGLI has been operating for just over three years now and we are pleased that over the last 12-18 months in particular, all indicators of progress against our initial objectives are scoring positively, with the exception of the share price discount to NTA, which is still wider than we would like. NTA per share has risen, dividends have increased (with the most recent dividend being fully franked) and the portfolio manager is comfortably outperforming the sector benchmark. Importantly, returns have proven to be uncorrelated to Australian equities and less volatile than the broader market. These are key attributes which can provide diversification benefits for investors who hold predominantly Australian stocks, particularly if the domestic equity market and/or the Australian dollar should prove to be overvalued.

With regard to the share price discount to NTA, several initiatives are being taken to reduce the gap:
- The on-market buy-back started operating in April 2018 and has purchased just over 1.7 million shares at around a 15% discount to NTA and cancelled them, which improves the NTA value of the remaining shares
- Shares required for participants in the Dividend Reinvestment Plan are being bought on-market by the Company, rather than issuing new shares at a discount to NTA
- Marketing and communications activities to promote awareness and understanding of AGLI continue to increase and will be supplemented by the Manager’s recent recruitment of a marketing executive
We believe these additional measures will encourage new shareholders at what is an attractive entry point for those investors looking to diversify their portfolios.
Directorate AGLI’s inaugural Chairman, Mr. Ian Martin AM, retired on 30 June 2018 at the same time he retired from Argo Investments Ltd after 14 years on that Board. Mr. Russell Higgins AO succeeded Mr. Martin as Chairman of both AGLI and Argo with effect from 1 July 2018. Mr. Higgins is a very experienced Director of ASX-listed companies and has served on Argo’s Board since 2011.
Outlook The landscape continues to look favourable for global economies and the infrastructure sector, despite some risk of interest rates rising more quickly than expected. Markets are pricing optimistic outcomes into share prices and the infrastructure sector is also trading at valuations above historical averages. However private (unlisted) infrastructure funds, which face competition for scarce assets to directly invest in, are increasingly turning to the listed sector to find value. The global listed infrastructure sector is much more diverse than in Australia, generally cheaper, and as it is less mature, has greater growth prospects including in emerging markets where population growth and improving standards of living require huge infrastructure investment. Currently just over half of AGLI’s portfolio is invested in companies based in the United States. The US economy is growing strongly and we see this continuing to benefit railways, communications towers and midstream energy (including pipelines) in particular. We firmly believe that AGLI can bring important diversification benefits to Australian equity investors from an asset class, geographic and currency perspective. The long-life, essential service nature of infrastructure assets helps the sector to perform steadily and often outperform in more uncertain times. The portfolio has around 60 quality global listed infrastructure companies and Cohen & Steers is actively managing the portfolio to add value above the benchmark index returns. Media contact: Jason Beddow Managing Director 02 8274 4702
1Argo Global Listed Infrastructure Limited – ABN 23 604 986 914
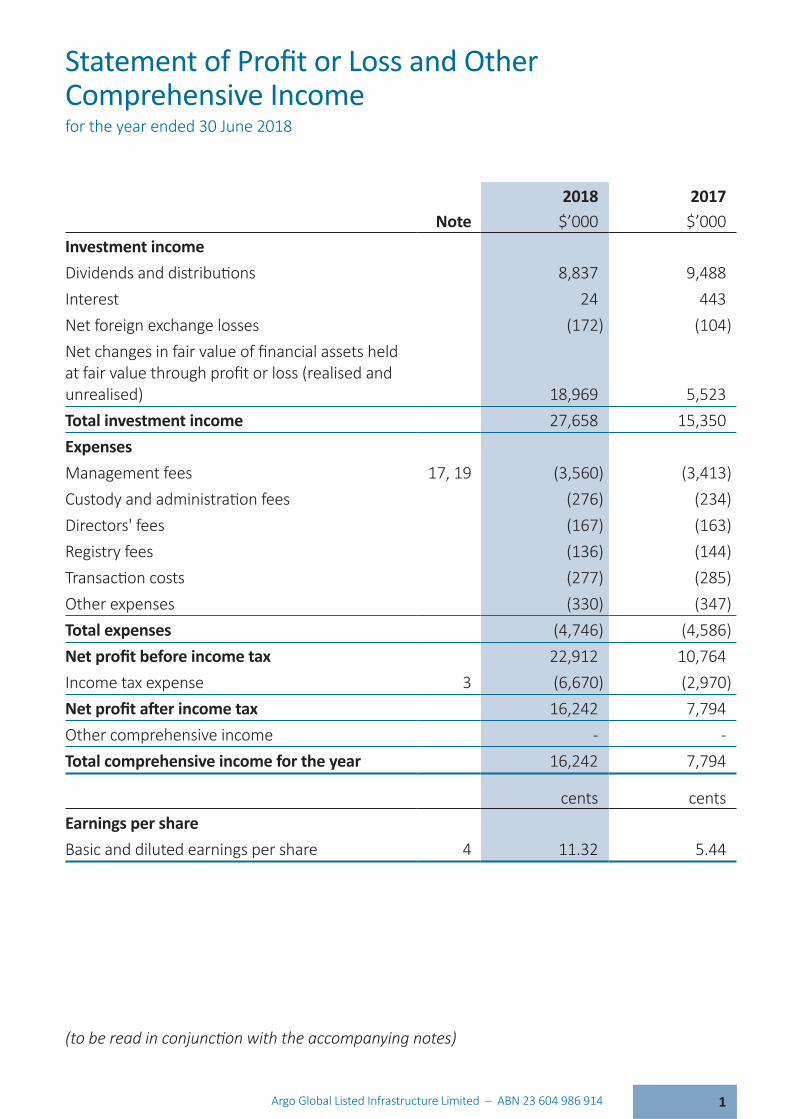
for the year ended 30 June 2018
2018 2017 Note $’000 $’000Investment income
8,837 9,488Interest 24 443Net foreign exchange losses (172) (104)
unrealised) 18,969 5,523Total investment income 27,658 15,350ExpensesManagement fees 17, 19 (3,560) (3,413)
(276) (234)Directors' fees (167) (163)Registry fees (136) (144)
(277) (285)Other expenses (330) (347)Total expenses (4,746) (4,586)
22,912 10,764Income tax expense 3 (6,670) (2,970)
16,242 7,794Other comprehensive income - -
16,242 7,794
cents centsEarnings per shareBasic and diluted earnings per share 4 11.32 5.44
2 Argo Global Listed Infrastructure Limited – ABN 23 604 986 914
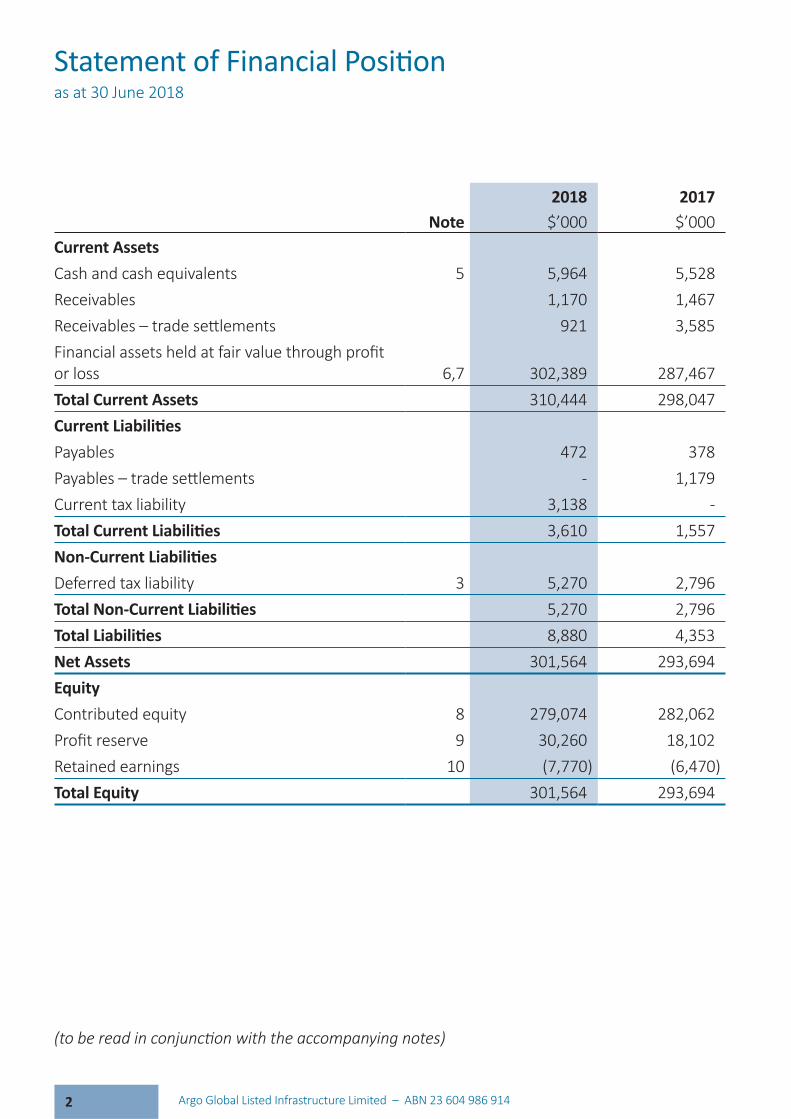
as at 30 June 2018
2018 2017Note $’000 $’000
Current AssetsCash and cash equivalents 5 5,964 5,528Receivables 1,170 1,467
921 3,585
or loss 6,7 302,389 287,467Total Current Assets 310,444 298,047
Payables 472 378- 1,179
Current tax liability 3,138 -3,610 1,557
Deferred tax liability 3 5,270 2,7965,270 2,7968,880 4,353
Net Assets 301,564 293,694
Contributed equity 8 279,074 282,0629 30,260 18,102
Retained earnings 10 (7,770) (6,470)301,564 293,694

3Argo Global Listed Infrastructure Limited – ABN 23 604 986 914
for the year ended 30 June 2018
reserve earnings TotalNote $’000 $’000 $’000 $’000
Balance as at 1 July 2017 282,062 18,102 (6,470) 293,694Total comprehensive income for the year - - 16,242 16,242
the year 9,10 - 17,542 (17,542) -Dividends paid 11 - (5,384) - (5,384)Buy-back of shares 8 (2,988) (2,988)Balance as at 30 June 2018 279,074 30,260 (7,770) 301,564
for the year ending 30 June 2017
reserve earnings TotalNote $’000 $’000 $’000 $’000
Balance as at 1 July 2016 281,151 8,371 478 290,000Total comprehensive income for the year - - 7,794 7,794
9,10 - 14,742 (14,742) -Dividends paid 11 - (5,011) - (5,011)Dividend reinvestment plan 8 210 - - 210Shares issued on exercise
8 718 - - 718Cost of shares issued net of tax 8 (17) - - (17)Balance as at 30 June 2017 282,062 18,102 (6,470) 293,694

4 Argo Global Listed Infrastructure Limited – ABN 23 604 986 914
for the year ended 30 June 2018
2018 2017Note $’000 $’000
160,376 150,564
(154,688) (146,884)Net foreign exchange loss (156) (96)Interest received 84 498
7,951 8,455GST recovered 390 343Management fees paid (3,560) (3,393)Custody fees paid (256) (234)Other expenses paid (1,281) (1,320)Income tax paid (36) (10)
13 8,824 7,923
- 701Dividend paid – net of Dividend Reinvestment Plan (5,384) (4,801)Buy-back of shares (2,988) -
(8,372) (4,100)Net increase in cash and cash equivalents 452 3,823Cash and cash equivalents at the beginning of the year 5,528 1,713
cash and cash equivalents (16) (8)5 5,964 5,528

5Argo Global Listed Infrastructure Limited – ABN 23 604 986 914
Page1 ................................................................................................................6
...........................................................................63 Income tax .............................................................................................................................124 Earnings per share .................................................................................................................145 Cash and cash equivalents ....................................................................................................14
.....................................................14 ...........................................................................................15
8 Contributed equity ................................................................................................................16 .........................................................................................................................16
10 Retained earnings ..................................................................................................................1711 Dividends ...............................................................................................................................1712 Capital management .............................................................................................................18
.....................................18 ............................................................................................................19
15 Financial risk management ...................................................................................................1916 Fair value measurement........................................................................................................2517 Management fees .................................................................................................................28
.........................................................................................................28 ....................................................................................................29
..................................................................29 ........................................................................29
for the year ended 30 June 2018

6 Argo Global Listed Infrastructure Limited – ABN 23 604 986 914
1. GENERAL INFORMATION
the year ended 30 June 2018.
2. SUMMARY OF SIGNIFICANT ACCOUNTING POLICIES
(a)
the
or loss, that have been measured at fair value. All amounts are presented in Australian
(b) Financial instruments(i)
be sold. These are investments in exchange traded debt and equity instruments and unit trusts.
(ii)
becomes party to the contractual agreement (trade date) and recognises changes in . Investments are
for the year ended 30 June 2018

7Argo Global Listed Infrastructure Limited – ABN 23 604 986 914
(iii) Measurement
Other Comprehensive Income.
measured at fair value. Realised and unrealised gains and losses arising from
This includes cash and cash equivalents, receivables including receivables for trade
(iv) Fair value measurement principles
date.
disclosed in Notes 6 and 7.
(v)
Notes to the Financial Statements

8 Argo Global Listed Infrastructure Limited – ABN 23 604 986 914
(c)
(d)
purchased that have been contracted for but not yet delivered by the end of the year.
business days.
(e)
short-term nature of most receivables their nominal amounts approximate their fair value.
(f)
30 days of being recognised as payables. Given the short-term nature of most payables their nominal amounts approximate their fair value.
(g) Investment income
premiums or discounts.
Other income is brought to account on an accruals basis.
Notes to the Financial Statements

9Argo Global Listed Infrastructure Limited – ABN 23 604 986 914
(h) Expenses
Comprehensive Income on an accrual basis.
(i) Income tax
30 June 2018. From 1 July 2018 the Company's income tax rate is expected to reduce to
expense comprises current and deferred tax.
tax liability is the expected tax payable on the taxable income for the year, using tax rates
respect of previous years.
Deferred tax is measured at the tax rates that are expected to be applied to the
A deferred tax asset is recognised to the extent that it is probable that future taxable
exceeds its tax base.
Notes to the Financial Statements
10 Argo Global Listed Infrastructure Limited – ABN 23 604 986 914
(i)
(ii)
and Other Comprehensive Income.
Non-monetary items that are measured at fair value in a foreign currency are
or loss.
(k)
(l)
Company may be required to pay GST on management and other fees, charges, costs
tax credits and reduced input tax credits in respect of the GST incurred.
(m) Earnings per share
outstanding during the period.
Notes to the Financial Statements

11Argo Global Listed Infrastructure Limited – ABN 23 604 986 914
(n) Share capital
the proceeds.
On 28 August 2017 the Company announced an on-market share buy-back for capital management purposes. Details of the Company's share buy-back is provided in Note 8.
(o)
(p)
(q)
Note 16(b).
(r)
AASB 9 (and applicable amendments)AASB 9 addresses the measurement and of assets It has also introduced revised rules around hedge
and impairment. The standard is not applicable 1 July 2018.
Notes to the Financial Statements

12 Argo Global Listed Infrastructure Limited – ABN 23 604 986 914
or loss.
AASB 15 AASB 16
3. INCOME TAX2018 2017
$’000 $’000(a)
22,912 10,764
6,873 3,229(14) (29)
Change in tax rate - deferred tax liability (221) (262)Other 32 32
Income tax expense 6,670 2,970(b)
Current income tax 4,196 866Deferred income tax 2,474 2,104
6,670 2,970(c)
Increase in deferred tax assets (share issue costs) - (7)
Notes to the Financial Statements

13Argo Global Listed Infrastructure Limited – ABN 23 604 986 914
2018 2017$’000 $’000
(d)
205 243Unrealised gains on investments 5,527 3,445
5,732 3,688
Foreign tax credits receivable (58) (90)(404) (802)(462) (892)
5,270 2,796Movements:Balance at the beginning of the year 2,796 699Charged to equity - (7)
2,474 2,104Balance at the end of the year 5,270 2,796
(e)
for tax payable and franked dividends receivable, in 3,242 83
Impact on the franking account of the dividend declared but not recognised as a liability at the end of
(1,345) -1,897 83
5,001 218
The Company’s ability to pay franked dividends is dependent upon receipt of franked dividends and the Company paying tax.
Notes to the Financial Statements

14 Argo Global Listed Infrastructure Limited – ABN 23 604 986 914
4. EARNINGS PER SHARE2018 2017
number number
share 143,440 143,289
$’000 $’000
diluted earnings per share 16,242 7,794
cents centsBasic and diluted earnings per share 11.32 5.44
for the year.
the Company.
5. CASH AND CASH EQUIVALENTS2018 2017
$’000 $’000Cash at bank 5,964 5,528
6. FINANCIAL ASSETS HELD AT FAIR VALUE THROUGH PROFIT OR LOSS
2018 2017$’000 $’000
268,656 249,440Unit trusts 33,733 27,357
- 10,667302,389 287,464
- 3- 3
Total 302,389 287,467
Notes to the Financial Statements
15Argo Global Listed Infrastructure Limited – ABN 23 604 986 914
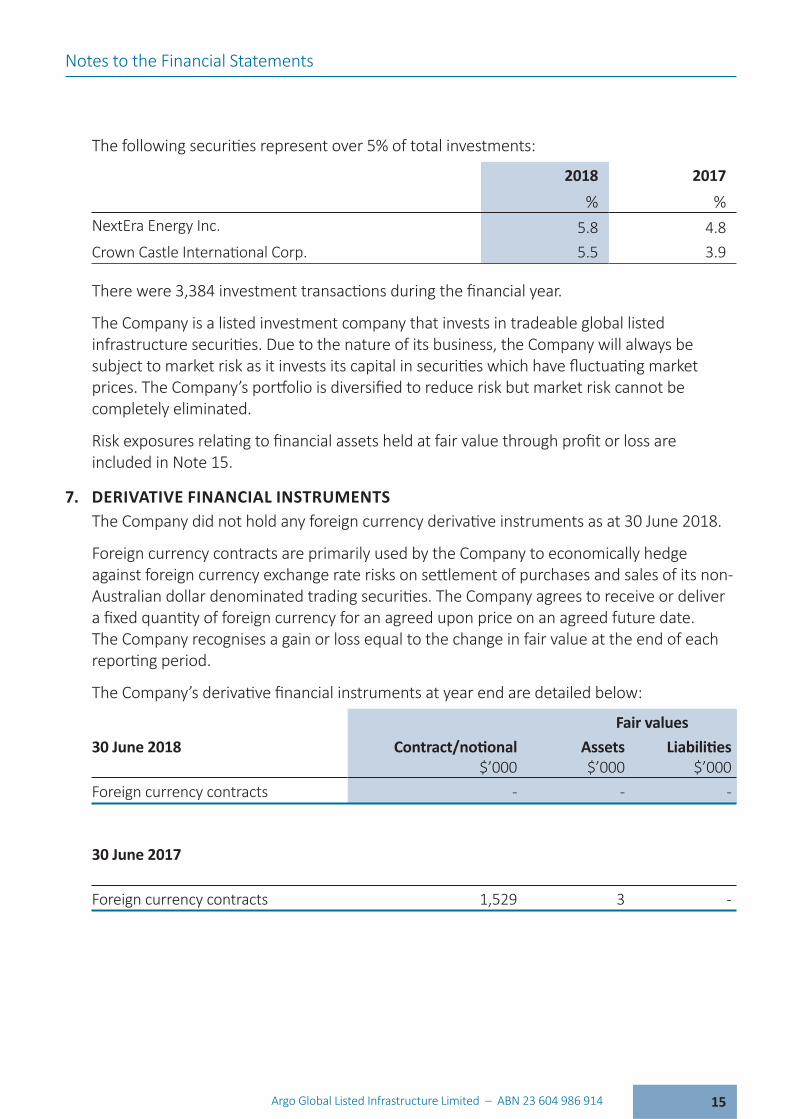
2018 2017
NextEra Energy Inc. 5.8 4.85.5 3.9
The Company is a listed investment company that invests in tradeable global listed
completely eliminated.
included in Note 15.
7. DERIVATIVE FINANCIAL INSTRUMENTS
Foreign currency contracts are primarily used by the Company to economically hedge
The Company recognises a gain or loss equal to the change in fair value at the end of each
30 June 2018 Fair values
$’000Assets$’000 $’000
Foreign currency contracts - - -
30 June 2017
Foreign currency contracts 1,529 3 -
Notes to the Financial Statements
16 Argo Global Listed Infrastructure Limited – ABN 23 604 986 914
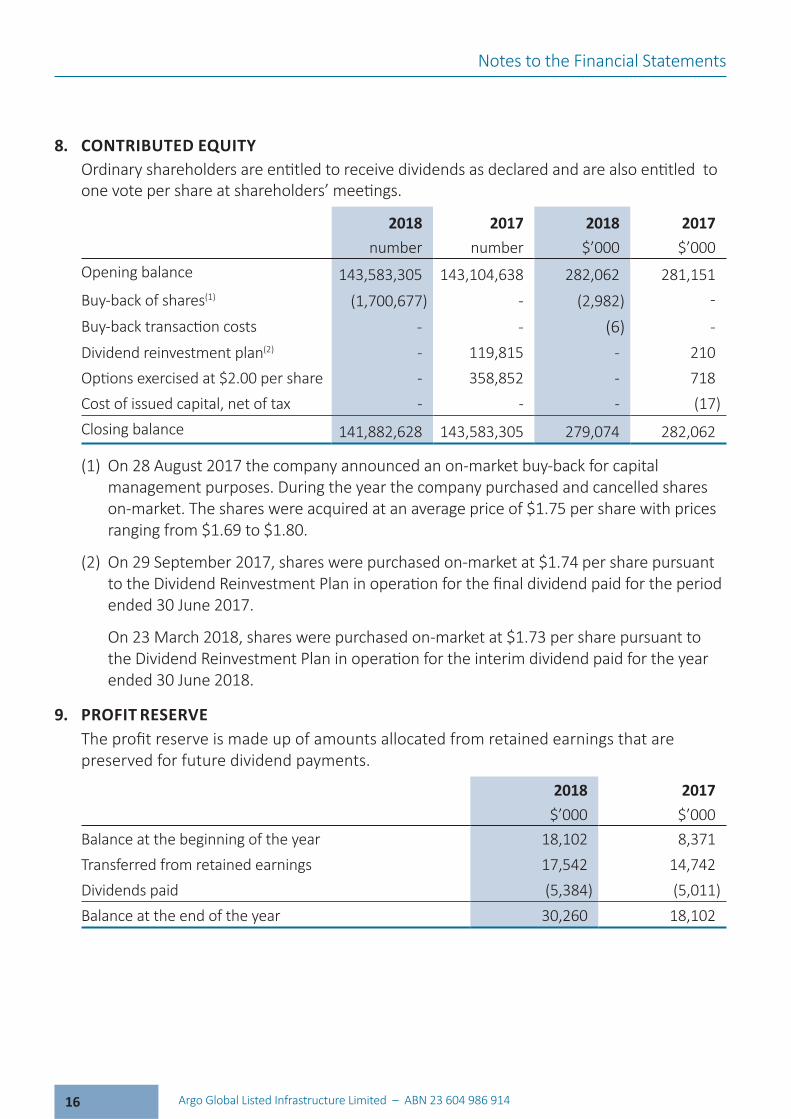
8. CONTRIBUTED EQUITY
2018 2017 2018 2017number number $’000 $’000
Opening balance 143,583,305 143,104,638 282,062 281,151Buy-back of shares(1) (1,700,677) - (2,982)
- - (6) -Dividend reinvestment plan(2) - 119,815 - 210
- 358,852 - 718Cost of issued capital, net of tax - - - (17)Closing balance 141,882,628 143,583,305 279,074 282,062
(1) On 28 August 2017 the company announced an on-market buy-back for capital management purposes. During the year the company purchased and cancelled shares
ranging from $1.69 to $1.80.
(2)
ended 30 June 2017.
ended 30 June 2018.
9. PROFIT RESERVE
preserved for future dividend payments.
2018 2017$’000 $’000
Balance at the beginning of the year 18,102 8,371Transferred from retained earnings 17,542 14,742Dividends paid (5,384) (5,011)Balance at the end of the year 30,260 18,102
Notes to the Financial Statements

17Argo Global Listed Infrastructure Limited – ABN 23 604 986 914
10. RETAINED EARNINGS2018 2017
$’000 $’000Balance at the beginning of the year (6,470) 478
16,242 7,794(17,542) (14,742)
Balance at the end of the year (7,770) (6,470)
11. DIVIDENDS2018 2017
$’000 $’000(a)
Final dividend for the year ended 30 June 2017 of 2.5 cents unfranked, paid 29 September 2017 (2017: 2.5 cents unfranked) 3,590 3,578Interim dividend for the year ended 30 June 2018 of 1.25 cents unfranked, paid 23 March 2018 (2017: 1.0 cent unfranked) 1,794 1,433
5,384 5,011(b)
year:Final dividend for the year ended 30 June 2018
September 2018 (2017: 2.5 cents unfranked). 3,547 3,590
Notes to the Financial Statements
18 Argo Global Listed Infrastructure Limited – ABN 23 604 986 914
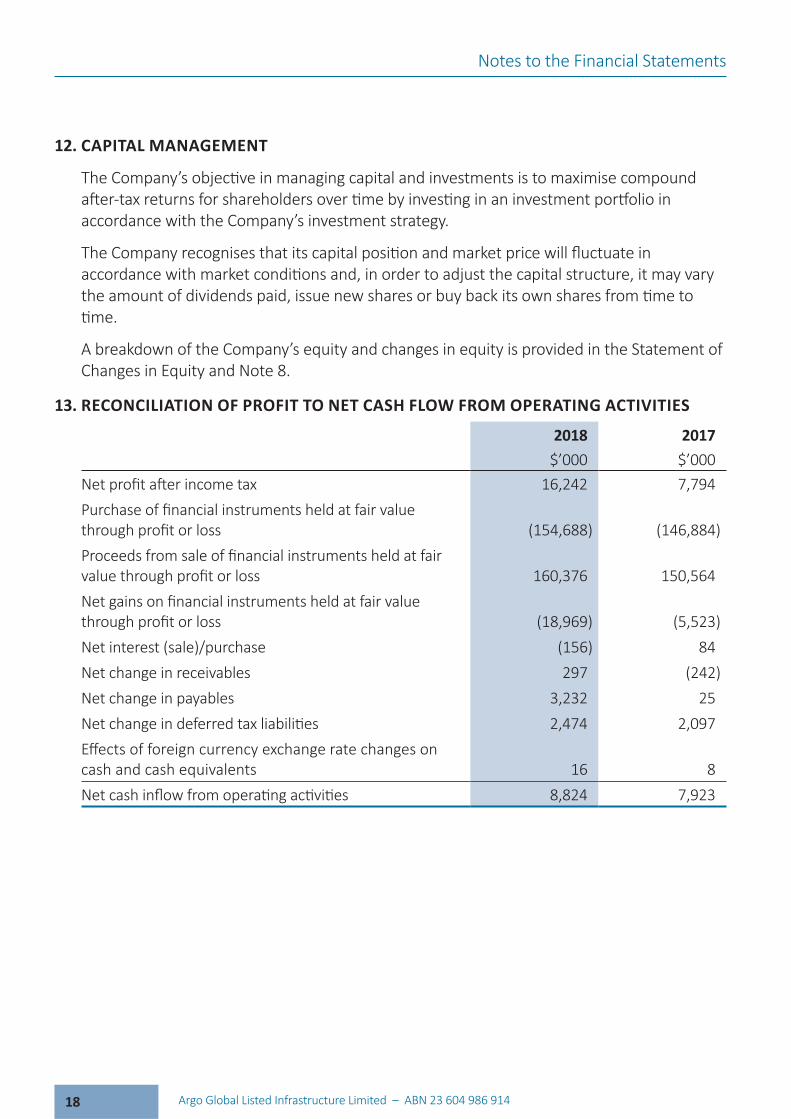
12. CAPITAL MANAGEMENT
Changes in Equity and Note 8.
13. RECONCILIATION OF PROFIT TO NET CASH FLOW FROM OPERATING ACTIVITIES
2018 2017$’000 $’000
16,242 7,794
(154,688) (146,884)
160,376 150,564
(18,969) (5,523)Net interest (sale)/purchase (156) 84Net change in receivables 297 (242)Net change in payables 3,232 25
2,474 2,097
cash and cash equivalents 16 88,824 7,923
Notes to the Financial Statements

19Argo Global Listed Infrastructure Limited – ABN 23 604 986 914
14. SEGMENT INFORMATION
2018 2018 2017 2017A$’000 A$’000
United States of America 172,652 57.1 147,390 51.3Canada 28,608 9.5 28,623 9.9Japan 21,138 7.0 19,344 6.7Italy 11,648 3.9 17,356 6.1Australia 9,906 3.3 14,472 5.0Other countries 58,437 19.2 60,282 21.0Total 302,389 100.0 287,467 100.0
15. FINANCIAL RISK MANAGEMENT
risk, foreign exchange risk and interest rate risk), credit risk and liquidity risk.
the Company’s investment strategy and seeks to maximise the returns derived for the
instruments to alter certain risk exposures.
agreement approved by the Board of Directors.
Notes to the Financial Statements
20 Argo Global Listed Infrastructure Limited – ABN 23 604 986 914
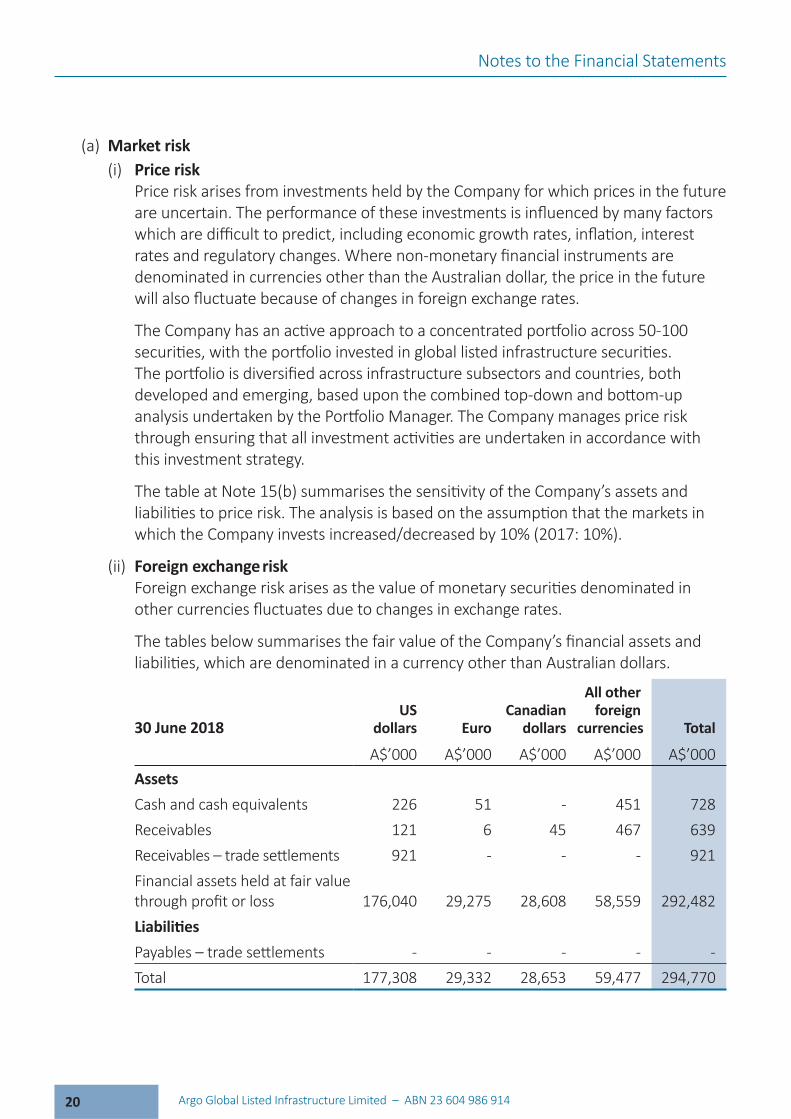
(a) Market risk(i) Price risk
denominated in currencies other than the Australian dollar, the price in the future
this investment strategy.
(ii) Foreign exchange risk
30 June 2018US
Euro
All other
currencies Total
A$’000 A$’000 A$’000 A$’000 A$’000AssetsCash and cash equivalents 226 51 - 451 728Receivables 121 6 45 467 639
921 - - - 921Financial assets held at fair value
176,040 29,275 28,608 58,559 292,482
- - - - -Total 177,308 29,332 28,653 59,477 294,770
Notes to the Financial Statements
21Argo Global Listed Infrastructure Limited – ABN 23 604 986 914
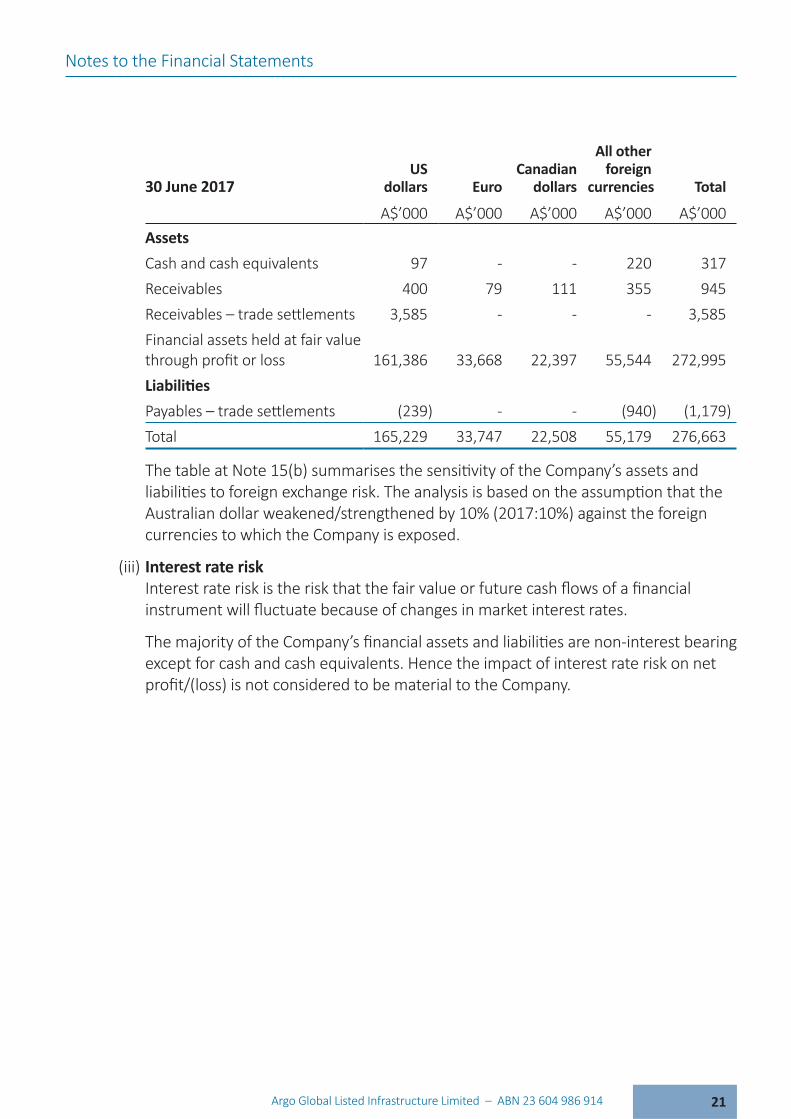
30 June 2017US
Euro
All other
currencies Total
A$’000 A$’000 A$’000 A$’000 A$’000AssetsCash and cash equivalents 97 - - 220 317Receivables 400 79 111 355 945
3,585 - - - 3,585Financial assets held at fair value
161,386 33,668 22,397 55,544 272,995
(239) - - (940) (1,179)Total 165,229 33,747 22,508 55,179 276,663
(iii) Interest rate risk
except for cash and cash equivalents. Hence the impact of interest rate risk on net
Notes to the Financial Statements
22 Argo Global Listed Infrastructure Limited – ABN 23 604 986 914
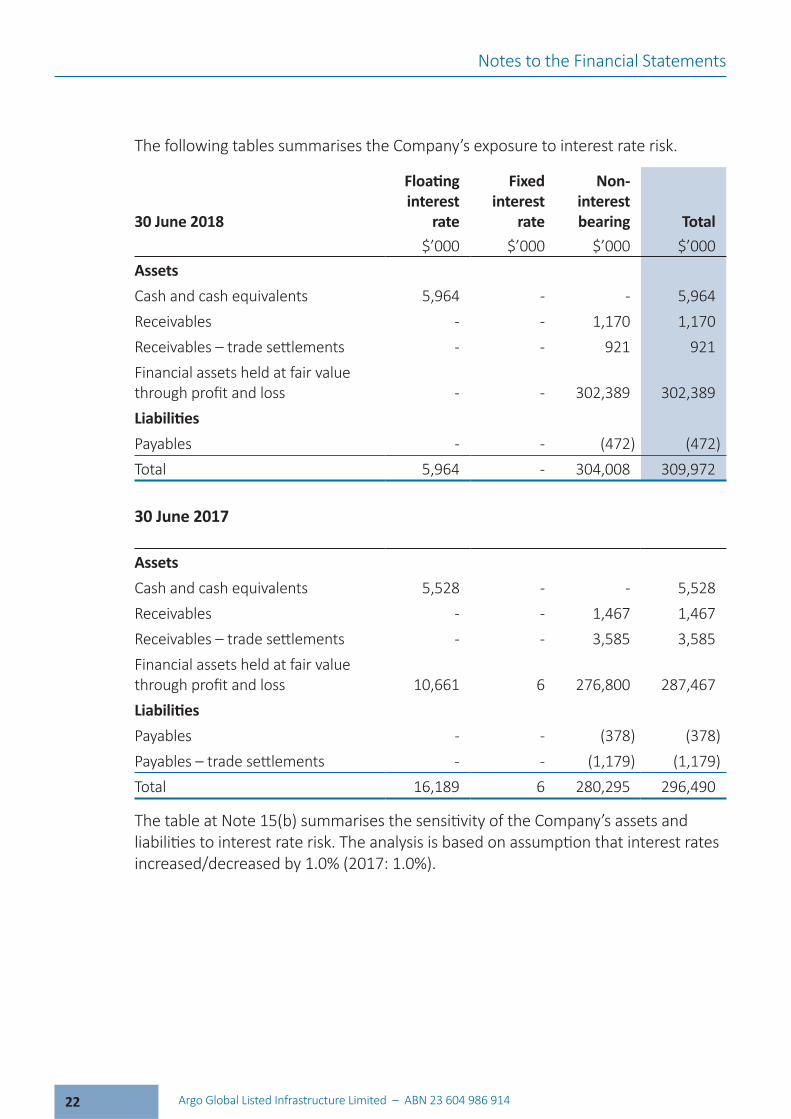
30 June 2018interest
rateinterest
rate
Non-interest
Total$’000 $’000 $’000 $’000
AssetsCash and cash equivalents 5,964 - - 5,964Receivables - - 1,170 1,170
- - 921 921Financial assets held at fair value
- - 302,389 302,389
Payables - - (472) (472)Total 5,964 - 304,008 309,972
30 June 2017
AssetsCash and cash equivalents 5,528 - - 5,528Receivables - - 1,467 1,467
- - 3,585 3,585Financial assets held at fair value
10,661 6 276,800 287,467
Payables - - (378) (378)- - (1,179) (1,179)
Total 16,189 6 280,295 296,490
Notes to the Financial Statements
23Argo Global Listed Infrastructure Limited – ABN 23 604 986 914
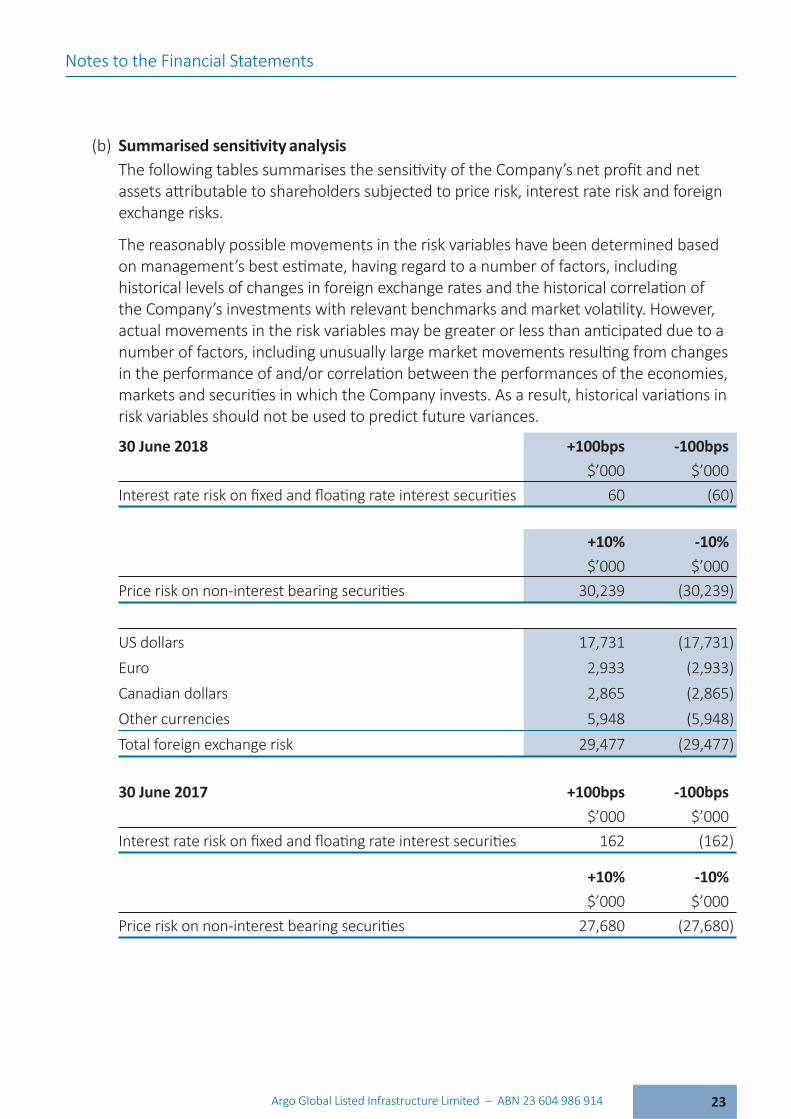
(b)
exchange risks.
The reasonably possible movements in the risk variables have been determined based
risk variables should not be used to predict future variances.
30 June 2018$’000 $’000
60 (60)
+10% -10%$’000 $’000
30,239 (30,239)
US dollars 17,731 (17,731)Euro 2,933 (2,933)Canadian dollars 2,865 (2,865)Other currencies 5,948 (5,948)Total foreign exchange risk 29,477 (29,477)
30 June 2017$’000 $’000
162 (162)
+10% -10%$’000 $’000
27,680 (27,680)
Notes to the Financial Statements

24 Argo Global Listed Infrastructure Limited – ABN 23 604 986 914
30 June 2017 +10% -10%$’000 $’000
US dollars 16,523 (16,523)Euro 3,375 (3,375)Canadian dollars 2,251 (2,251)Other currencies 5,518 (5,518)Total foreign exchange risk 27,667 (27,667)
(c)
these assets are impaired nor past their due date. The maximum exposure to credit
(d)
are materially disadvantageous.
(i)
contractual maturity date.
30 June 2018Less than1 month
1-6months
6-12months
Over 12months Total
$’000 $’000 $’000 $’000 $’000 $’000Payables 472 - - - - 472
Notes to the Financial Statements

25Argo Global Listed Infrastructure Limited – ABN 23 604 986 914
30 June 2017Less than1 month
1-6months
6-12months
Over 12months Total
$’000 $’000 $’000 $’000 $’000 $’000Payables 378 - - - - 378Due to brokers 1,179 - - - - 1,179Total 1,557 - - - - 1,557
(ii)
instruments.
30 June 2018Less than1 month
1-6months
6-12months
Over 12months Total
$’000 $’000 $’000 $’000 $’000 $’000Foreign currency contracts - - - - - -
30 June 2017
Foreign currency contracts 3 - - - - 3
16. FAIR VALUE MEASUREMENT
(unobservable inputs).(a)
investments.
Notes to the Financial Statements

26 Argo Global Listed Infrastructure Limited – ABN 23 604 986 914
readily and regularly available from an exchange, dealer, broker, industry group, pricing service, or regulatory agency, and those prices represent actual and regularly occurring
(b)
Some of the inputs to these models may not be market observable and are therefore
counterparty risk.
Notes to the Financial Statements

27Argo Global Listed Infrastructure Limited – ABN 23 604 986 914
(c)
measured at fair value according to the fair value hierarchy.
30 June 2018 Level 1 Level 2 Level 3 Total$’000 $’000 $’000 $’000
Financial assets Financial assets designated at fair value
268,656 - - 268,656
Unit trusts 33,733 - - 33,733Total 302,389 - - 302,389
30 June 2017
Financial assets Financial assets designated at fair value
249,440 - - 249,440
Unit trusts 27,357 - - 27,357- 10,667 - 10,667
Financial assets held for trading:- 3 - 3
Total 276,797 10,670 - 287,467
The Company’s policy is to recognise transfers into and transfers out of fair value
(i)
ended 30 June 2018.
(ii)
(iii)
the carrying amounts of receivables and payables are assumed to approximate fair value.
Notes to the Financial Statements

28 Argo Global Listed Infrastructure Limited – ABN 23 604 986 914
17. MANAGEMENT FEES
annual rates:
The management fee is calculated at month end and paid monthly in arrears. There is
Payments made to the Manager are provided in Note 19.
18. AUDITOR’S REMUNERATION
Shareholders approved the appointment of Ernst and Young as auditor of the Company at
(a)
2018 2017$ $
(i) Audit Services- 89,760
(ii) Non-audit services
services 7,293 14,586Total 7,293 104,346
(b)
2018$
(i) Audit Services62,315
(ii) Non-audit services
services 11,000Total 73,315
Notes to the Financial Statements

29Argo Global Listed Infrastructure Limited – ABN 23 604 986 914
19. RELATED PARTY TRANSACTIONS
and providing the services of the Managing Director, Company Secretary, Chief Financial
ASCO for the year ended to 30 June 2018 (30 June 2017: $3,412,835). Management fees of
Argo holds 12,500,100 shares in the Company (2017: Held 12,500,100 shares and
Directors:
2018 2017$ $
152,100 149,20014,451 14,174
166,551 163,374
20. CONTINGENT ASSETS, LIABILITIES AND COMMITMENTS
30 June 2018.
21. EVENTS OCCURRING AFTER THE REPORTING PERIOD
Notes to the Financial Statements
Audit of AccountsThe accounts for the year ended 30 June 2018 are in the process of being audited.
Top Related