


Languages
Pages
Legal


1
2Q082Q08
2
Agenda
Global View
Usiminas
Investments
Mining & Logistics
Financials
Corporate Governance and Social Responsability

3
Agenda
Global View
Usiminas
Investments
Mining & Logistics
Financials
Corporate Governance and Social Responsability
4
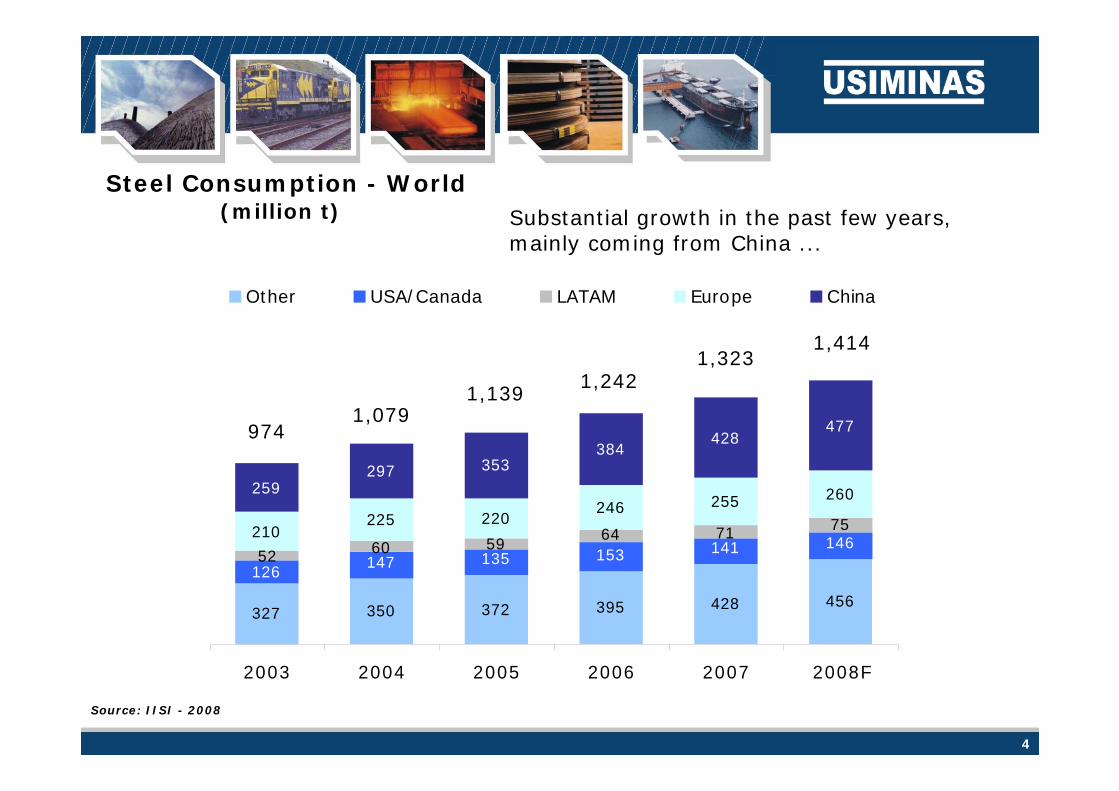
327 350 372 395 428 456
147 135 153 141 146210
225 220246 255 260259
297 353384
428477
126
757164596052
2003 2004 2005 2006 2007 2008F
Other USA/Canada LATAM Europe China
Steel Consumption - World(million t)
Source: IISI - 2008
Substantial growth in the past few years,mainly coming from China ...
9741,079
1,1391,242
1,3231,414
5
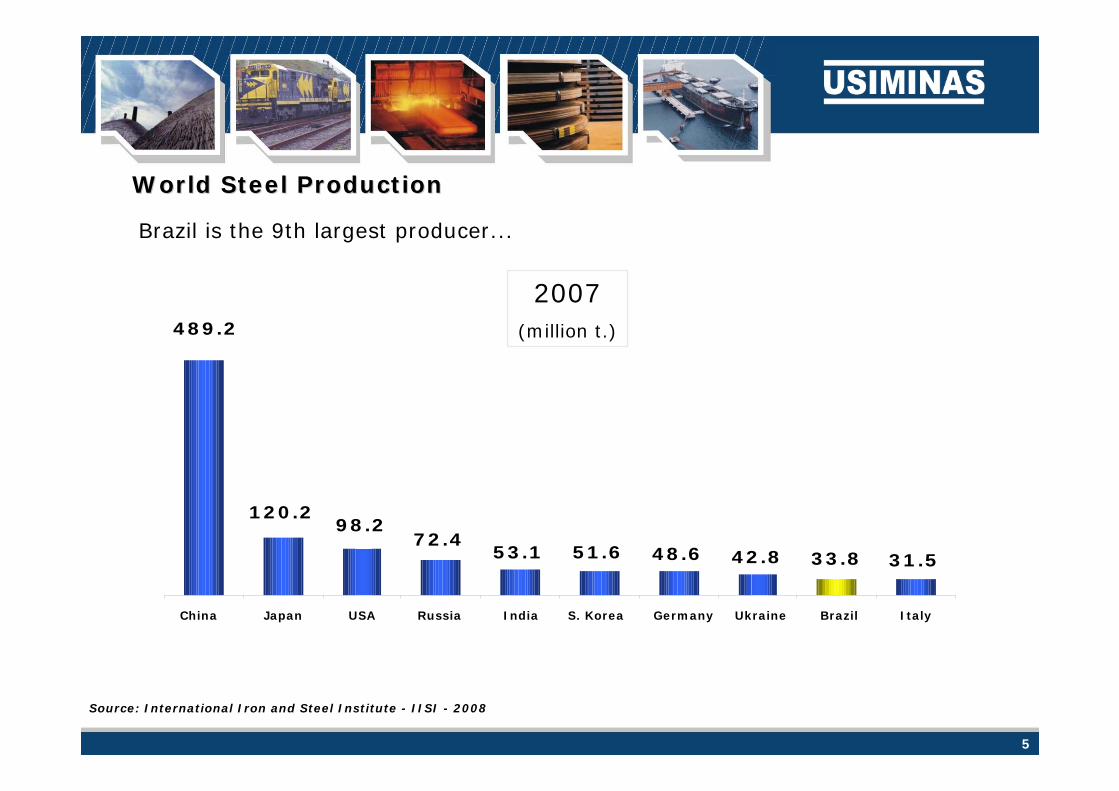
31.533.842.848.651.653.172.4
98.2120.2
489.2
World Steel ProductionWorld Steel Production
Brazil is the 9th largest producer...
Source: International Iron and Steel Institute - IISI - 2008
2007(million t.)
China Japan USA Russia India S. Korea Germany Ukraine Brazil Italy

6
416 449462 517 528 558 567 602 615 627 650 655
779
595
Brazil
Mexico India
Austra
lia CISUSA In
teg
China
South
Kor
ea (I
nteg
)Can
ada
Easte
rn E
urop
eW
ester
n Eur
ope
Japa
nUSA M
ini
Globa
l Ave
rage
Source: WSD, May 2008
Brazil has the lowest production cost in the world
Cost competitivenessCost competitiveness
Production Cost USD / ton(Slabs – May 2008)

7
Agenda
Global View
Usiminas
Investments
Mining & Logistics
Financials
Corporate Governance and Social Responsability

8
Usiminas System is the 36th largest producer in the world and 1st flat steel
producer in Latin America
Brazilian Steel ProductionBrazilian Steel Production
Top Brazilian Steel
Producers - 2007(33.8 million ton = Brazil’s crude
steel production)
Gerdau 21.5%
ArcelorMittal 30.3%
Usiminas 25.7%
Others6.7%
CSN 15.8%
Major Producers 2007(crude steel production - million t.)
20,2
20,5
22,8
22,9
26,5
28,6
32,8
33,8
34,5
116,4
8,735 - USIMINAS
10 - Wuhan
9 - US Steel
8 - Tangshan
7 - Jiangsu Shagang
6 - Tata Steel
5 - Baosteel
4 - Posco
3 - JFE
2 - Nippon Steel
1 - Arcelor Mittal
Source: IBS - 2008 and Metal Bulletin - 2008
9
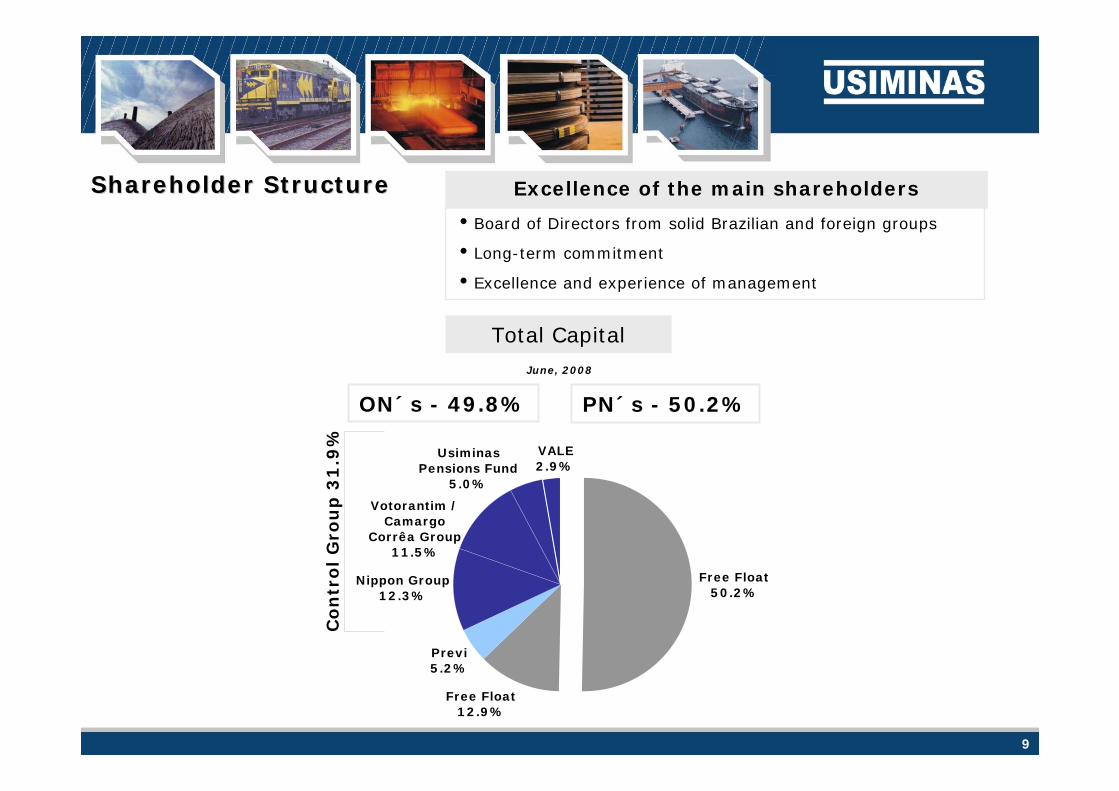
iBoard of Directors from solid Brazilian and foreign groups
iLong-term commitment
iExcellence and experience of management
Excellence of the main shareholdersShareholder StructureShareholder Structure
Free Float50.2%
Previ5.2%
Free Float12.9%
Votorantim / Camargo
Corrêa Group11.5%
Usiminas Pensions Fund
5.0%
VALE2.9%
Nippon Group12.3%
Co
ntr
ol
Gro
up
31
.9%
Total CapitalJune, 2008
PN´s - 50.2%ON´s - 49.8%

10
Usiminas is strategically locatedUsiminas is strategically locatedClose to major domestic marketsIron Ore Mine2 portsRailroad (MRS)
BrazilBrazil
(Minas Gerais)
(São Paulo) (Rio de Janeiro)
(Espírito Santo)
Praia MoleTerminal
IngáTerminal
CubatãoTerminal
São Paulo
BeloHorizonte
MRSJ. BonifJ. Bonifááciocio
PlantPlant
IntInt. C. CââmaramaraPlantPlant
Iron OreIron OreMinesMines
SantanaSantanaParaParaííso so PlantPlant

11
Operating Profit Margins %
High quality, value-added products (from slabs to coated products)
Among the lowest cost producers in the world
Source: Integer Research
Cost competitivenessCost competitiveness
2005 2006 2Q 2007
43,040,8 39,4
35,233,4
0
10
20
30
40
50
China SteelTata SteelUsiminas
Novolipetsk CSN
37,134,6
28,7 28,2 27,5
0
10
20
30
40
50
MagnitogorskTata Steel
UsiminasNovolipetskCSN
40,037,5
31,7 30,9 29,9
0
10
20
30
40
50
JSW SteelCSN
Novolipetsk UsiminasEzz
12
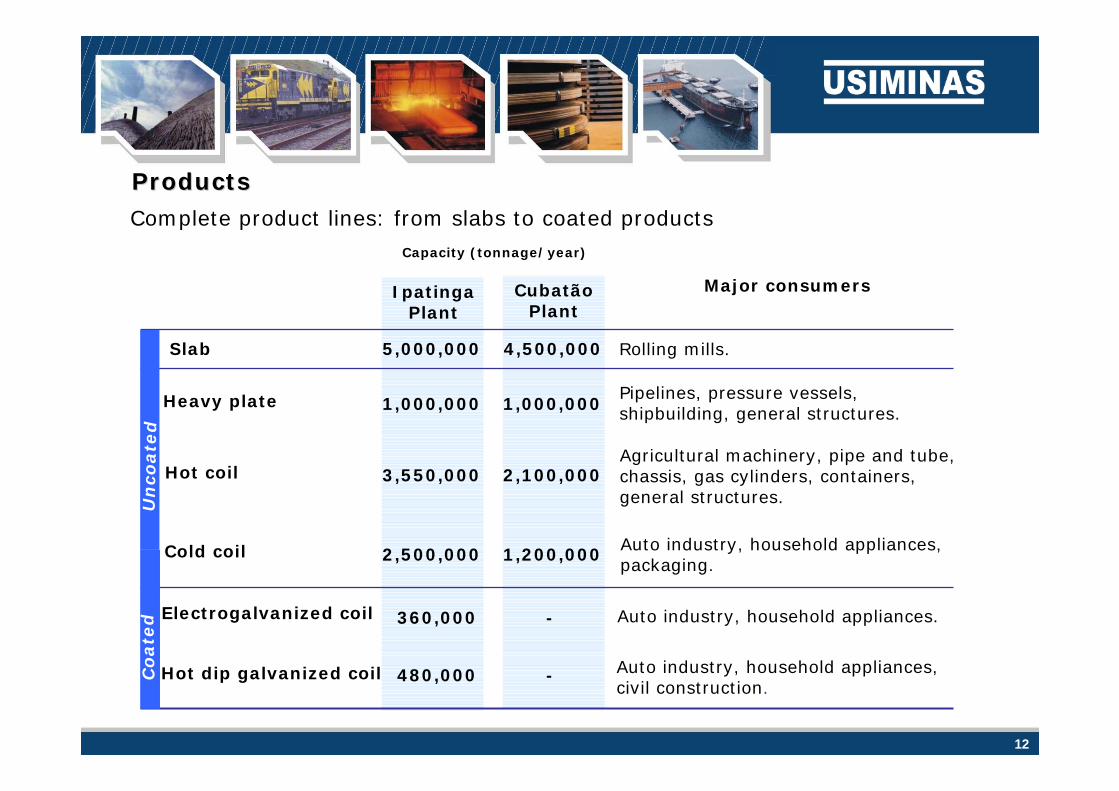
Major consumers
Heavy plate 1,000,000 1,000,000
Hot coil 3,550,000 2,100,000
Cold coil 2,500,000 1,200,000
-
-
Capacity (tonnage/year)
360,000
480,000
Slab 5,000,000 4,500,000
Electrogalvanized coil
Hot dip galvanized coil
Pipelines, pressure vessels,shipbuilding, general structures.
Agricultural machinery, pipe and tube,chassis, gas cylinders, containers,general structures.
Auto industry, household appliances, packaging.
Auto industry, household appliances.
Auto industry, household appliances,civil construction.
Rolling mills.
IpatingaPlant
CubatãoPlant
Products Products Complete product lines: from slabs to coated products
Un
coate
dC
oate
d

13
SalesSales
(million ton. )(million ton. )
Domestic market is a priority
As of June, 2008
84%
77%
67%
72% 69% 70%
67%
16%
23%
33%
28%31%30%
33%
2002 2003 2004 2005 2006 2007 1H08
7,722 7,7108,062
7,3487,945
Domestic Market Foreign Market
7,990
3,803

14
SalesSales
Domestic Market(Volume: 3.194 million t. - 1H08)
Combination of market leadershipand diversified customer base
reduces market risk
Spain14%
Argentina21%
USA14%
Indonesia2%
Bolivia3%
Mexico6%
Taiwan5%
South Korea7%
Chile11%
Germany6%
Others11%
Distributors23%
Autoparts18%
Auto Industry
13%
Civil Construction
6%
Household Appliances
2%
Industrial Equipment
9%
Elect-Equipment
4%
Packaging1%
Pipelines7%
Others10%
Small Diam. Tubes7%
International Market(Volume: 0.609 million t. - 1H08)
Diversified geographic sales
As of June, 2008

15
USIMINAS15%
Others17%
ArcelorMittal14%
CSN / Inal11%
Gerdau8%
Armco4%
Benafer4% Pires do Rio /
Cibraço4%
Tuper4%
Frefer4%
Tyco Metal4%
Zamprogna7%
Mangels4%
Steel Steel Distribution SectorDistribution Sector
Source: INDA - June, 2008

16
Market ShareMarket ShareDomestic Market (%) - 1H08Domestic Market (%) - 1H08Combination of market leadership and diversified customer base reduces market risk
* Flat Steel market: Usiminas System, CSN, Acesita and Arcelor Brasil.
49% Market share *
89%
29%
68%
66%
61%
10%
42%
47%
52%
60%
0,0% 20,0% 40,0% 60,0% 80,0% 100,0%
Distributors
Packaging
Civil Construction
Shipbuilding
Elect. Equipment
Household Appliances
Pipelines
Small Diam. Tubes
Autoparts
Auto Industry
TOTAL
OthersIpatinga and Cubatão Plants
48%
53%
40%
58%
39%
86%
33%
71%
100%
34%
12%
Flat Steel
As of June, 2008

17
BrazilBrazil’’s outlook - 2008s outlook - 2008
i Flat steel demand is expected to exceed 10%
Vehicle production may reach 3.400 million (Anfavea)
Industrial segment should outperform, growth to exceed 10%
Civil Construction growing activities
Source: IBS / Usiminas / Anfavea
8,576 8,90810,109
9,229 9,902
11,66912,922
2002 2003 2004 2005 2006 2007 2008E
+18%
1,793 1,8282,210
2,528 2,6112,973
3,400
2002 2003 2004 2005 2006 2007 2008E
+14%
Vehicle Production (1,000 vehicles)Flat Steel Demand (1,000 t.)
+11%
+14%

18
Investments & TechnologyInvestments & Technology
Commitment to the best technology
Partnership with Nippon Steel assures access to state-of-the-art technologyin steel production, including high value-added products
6th Technology Transfer Agreement with Nippon Steel, valid until 2009
425 received patents, of which 23 are international
150 researchers
Usiminas sells US$ 2 for each US$ 1of acquired technology.

19
Agenda
Global View
Usiminas
Investments
Mining & Logistics
Financials
Corporate Governance and Social Responsability

20
Production capacity5 million tons/yr
Start of works1st Half 2009
Start up 2.5 million t/yr in 20112.5 million t/yr in 2012
Coke plant2.0 million t/yr
Power plant250 MW
TOTALTOTAL Investments Investments: US$ 5.7: US$ 5.7 billion billion * ** Does not include investment in thermoelectric powerplant of approximately US$ 400 million
NewNew Slab Plant Slab Plant (Santana do Para (Santana do Paraííso)so)

21
LINE VOLUMEthsd tons
START UPFORECAST
PROJECT AMOUNT
UNIGAL II(Galvanized) 550 1st Half 2011 US$ 460 million
Heavy Plates 500 2nd Half 2010 US$ 500 million
Hot Rolled Coils 150 1st Half 2011 US$ 130 million
Other US$ 1.0 billion
Total Investments
Technology updating, cost savings and environmental control, with highlight for Coke
Plant 3 (+750kt/yr) and thermolectric powerplant (60 MW) in 2008
US$ 2.1 billion
Investments to serve “high value-added markets”
Investments
Intendente CIntendente Cââmaramara Plant (Ipatinga) Plant (Ipatinga)

22
LINE VOLUMEthsd tons
START UPFORECAST PROJECT VALUE
Hot Strip Mill 2,300 / 4,800 1st Half 2011 US$ 1.0 billion
BF1 Revamping 3.5 thsd/day => 4.5 thsd/day Concluded US$ 170 million
Continuous Casting Machine +350 / ano Concluded US$ 140 million
Other US$ 1.1 billion
Total Investments
Technology updating, cost savings and environmental control
US$ 2.4 billion
JosJoséé Bonif Bonifááciocio Plant (Cubat Plant (Cubatãão)o)
Investments
23
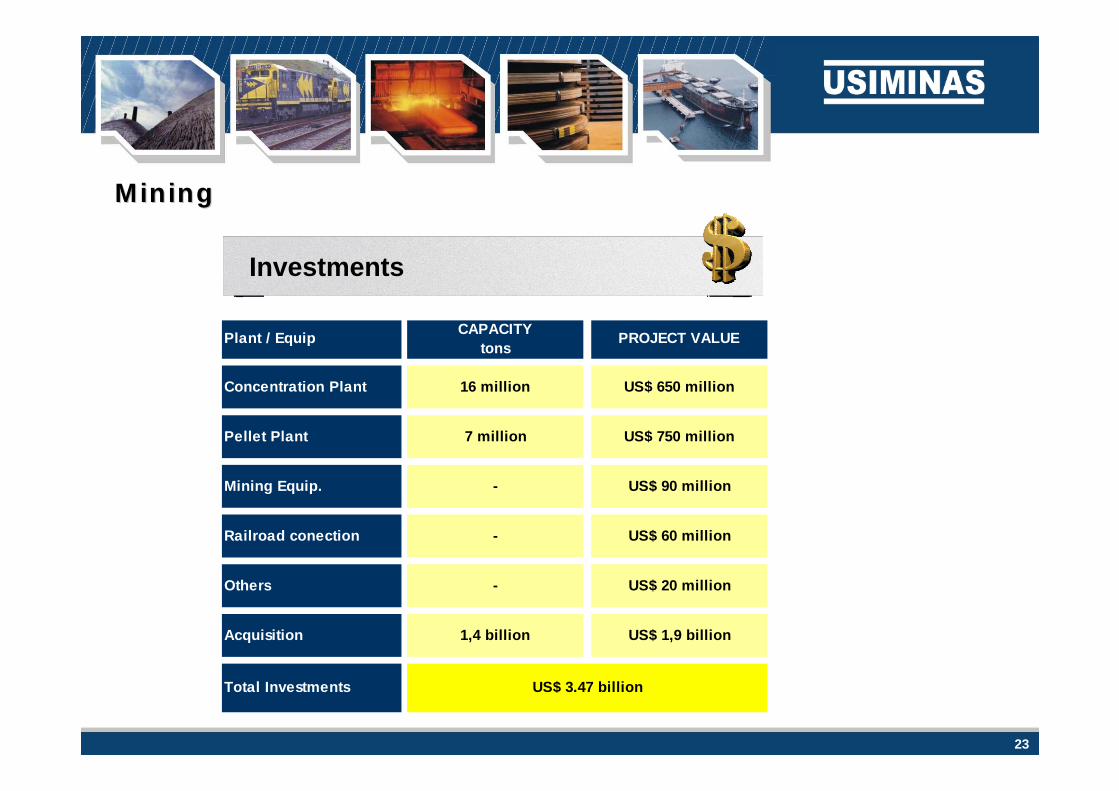
Plant / Equip CAPACITYtons
PROJECT VALUE
Concentration Plant 16 million US$ 650 million
Pellet Plant 7 million US$ 750 million
Mining Equip. - US$ 90 million
Railroad conection - US$ 60 million
Others - US$ 20 million
Acquisition 1,4 billion US$ 1,9 billion
Total Investments US$ 3.47 billion
MiningMining
Investments

24
Usiminas 2013Usiminas 2013Technical configurationTechnical configuration of the of the plants after plants after the theinvestment programinvestment program
Current After Current After
Slabs 5.00 5.00 4.50 4.80 ( 1)
Hvy Plate 1.00 1.50 1.00 1.00
Hot Strip 3.60 3.80 2.10 4.40 / 6.10 ( 2 )
Cold Strip 2.50 2.50 1.20 1.20
EG 0.36 0.36 - -
HDG 0.48 1.03 - -
Intendente Câmara Plant
million tons
José Bonifácio Plant Santana do Paraíso
New Plant
-
-
5.00
-
-
-
Source: Usiminas
(1) Concluded - May/2008(2) Additional expansion - up to 6.10 million tons/year

25
Agenda
Global View
Usiminas
Investments
Mining & Logistics
Financials
Corporate Governance and Social Responsability

26
J. Mendes is the last sizeable mining asset available in the Quadrilátero Ferrífero,a major iron ore province in Brazil
The acquired company is comprised of four mining sites with total expectedresources of 2.7 to 3.0 Bt and expected reserves of 1.1 to 1.8 Bt
Expected mine useful life of at least 25 years
Expected iron content between 46 and 48%
Current production level at roughly 5 MMt/year
J. Mendes brief overviewJ. Mendes brief overview
Somisa Global/Camargos J Mendes Pau de Vinho

27
0
10
20
30
2008 2009 2010 2011 2012 2013 2014
Pellet Feed
Sinter Feed
Lump
Mining AssetsMining Assets
Source: Usiminas
5.2 5.88.8 9.0
10.5
27.729.2
13.0
2.2
14.0

28
Mining AssetsMining Assets
AlthoughAlthough Ipatinga and Santana do Para Ipatinga and Santana do Paraííso doso do not have not havelogistics accesslogistics access to to be supplied by its be supplied by its mines mines on on ““SerraSerraAzulAzul””, Usiminas, Usiminas will have will have the the benefit benefit of of full full ““hedgehedge””against ironagainst iron ore ore price fluctuations price fluctuations
Mining29.2 MM t/yr
J. Bonifácio Plant10.3 MM t/yr
Dom. Mkt. Sales2.2 MM t/yr
Exports16.7 MM t/yr
Supply
IntendIntend. C. Cââmaramara Plant Plant8.0 MM t/8.0 MM t/yryr
Santana do ParaSantana do Paraíísoso8.0 MM t/8.0 MM t/yryr
JosJoséé Bonf Bonfáácio Plantcio Plant2.0 MM t/2.0 MM t/yryr
Hedge Hedge
Source: Usiminas
29
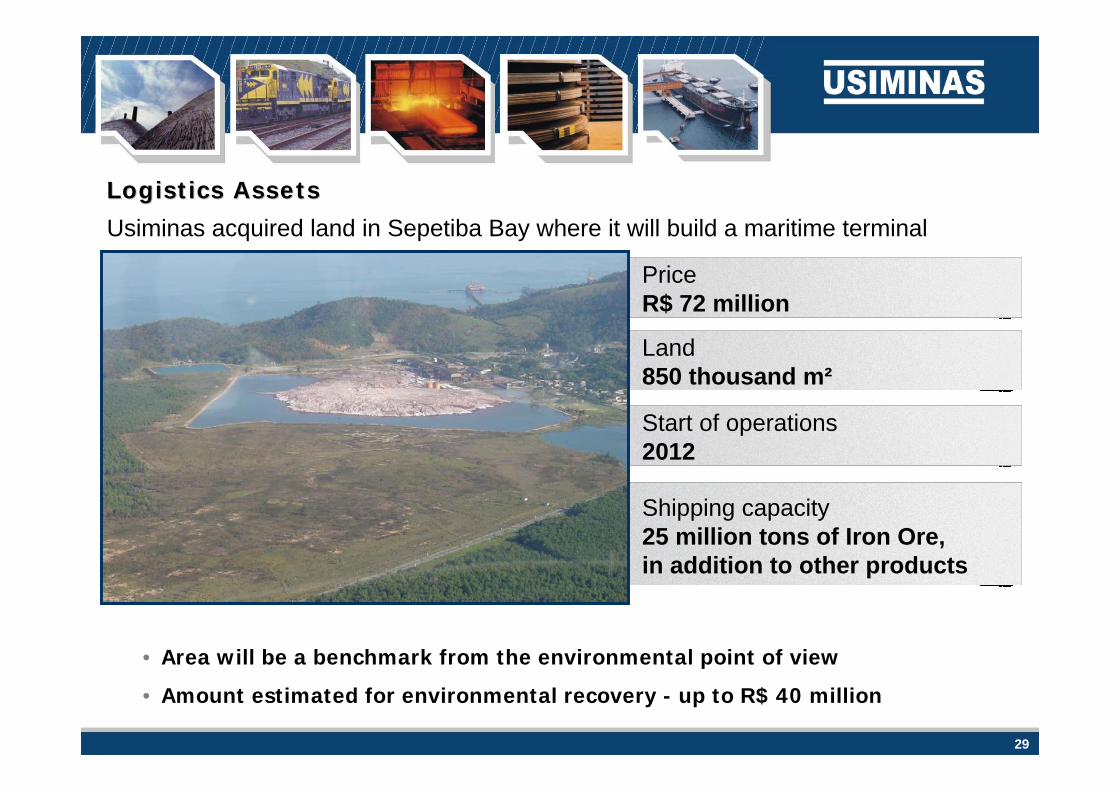
Start of operations 2012
Logistics AssetsLogistics Assets
• Area will be a benchmark from the environmental point of view
• Amount estimated for environmental recovery - up to R$ 40 million
PriceR$ 72 million
Land850 thousand m²
Shipping capacity25 million tons of Iron Ore, in addition to other products
Usiminas acquired land in Sepetiba Bay where it will build a maritime terminal

30
Agenda
Global View
Usiminas
Investments
Mining & Logistics
Financials
Corporate Governance and Social Responsability
31
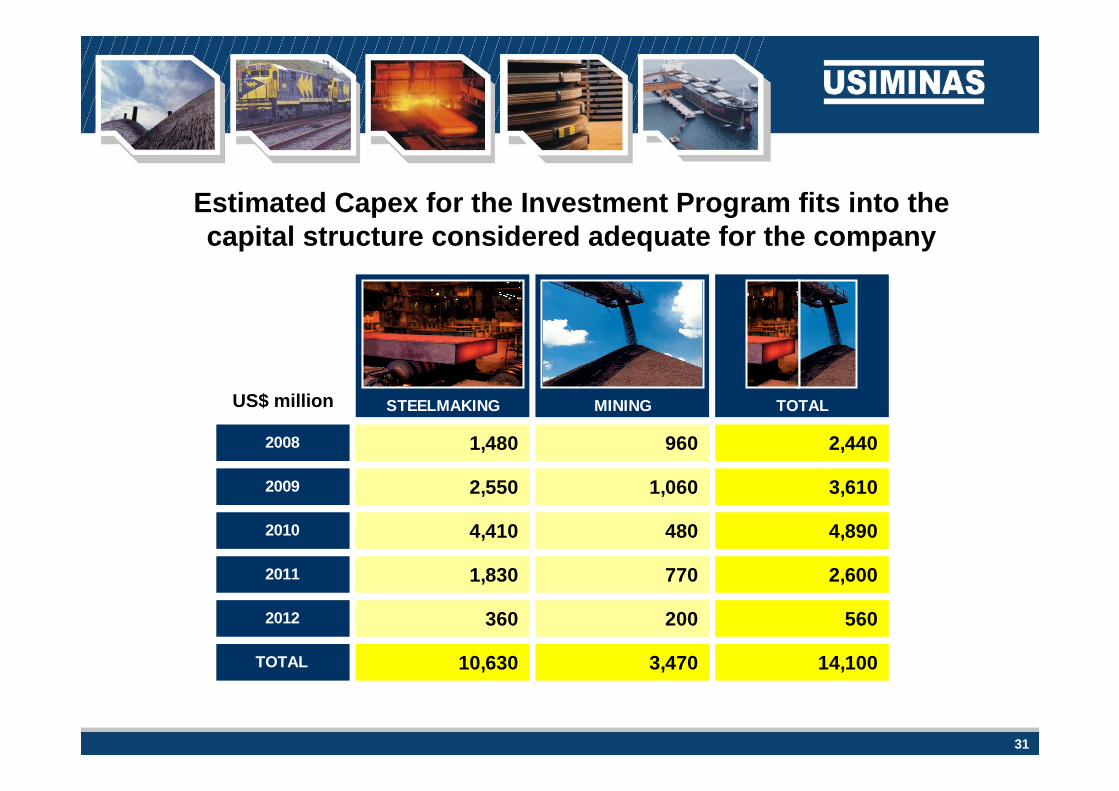
STEELMAKING MINING TOTAL
2008 1,480 960 2,440
2009 2,550 1,060 3,610
2010 4,410 480 4,890
2011 1,830 770 2,600
2012 360 200 560
TOTAL 10,630 3,470 14,100
Estimated Capex for the Investment Program fits into thecapital structure considered adequate for the company
US$ million

32
530734 657 831 999
1,9222,269
2,010
2,581
1.1811.602
31%35% 32% 35% 35%
46%42%
35% 36% 35% 37%
19991,81
20001,83
20012,35
20022,92
20033,07
20042,93
20052,44
20062,18
20071,95
1H071,75
1H081,74
Ebitda Ebitda Margin
AVG.R$/US$
ConsolidatedConsolidated Ebitda Ebitda
Investment return and market conditions have allowed consistent cash generation
US$ Million
As of June, 2008

33
83
2,841
238 434 358 284 473 460138 216 9
40986
Cash 2008 2009 2010 2011 2012 2013 2014 2015 2016 2017 2018 2019on
Debt has an adequate maturity profile
SwapCDI5%
Long83%
US$ 2,659 M
Short17%
US$ 529 M
Foreign65%
Local35%
TERM CURRENCY
“Stand by Facility” - US$ 300 million
Note: Principal Values
US$ Million
Consolidated Debt MaturityConsolidated Debt Maturity
As of June, 2008

34
346(537)
355860
1,317
2,3342,491 0,1-0,20,20,40,72,3
3,1
0
1.000
2.000
3.000
4.000
20023,53
20032,89
20042,65
20052,34
20062,14
20071,77
1H081,59
Net Debt Net Debt / Ebitda
R$/US$
Total Net DebtTotal Net Debt
And have made it possible to considerably reduce debtUS$ Million
As of June, 2008
35
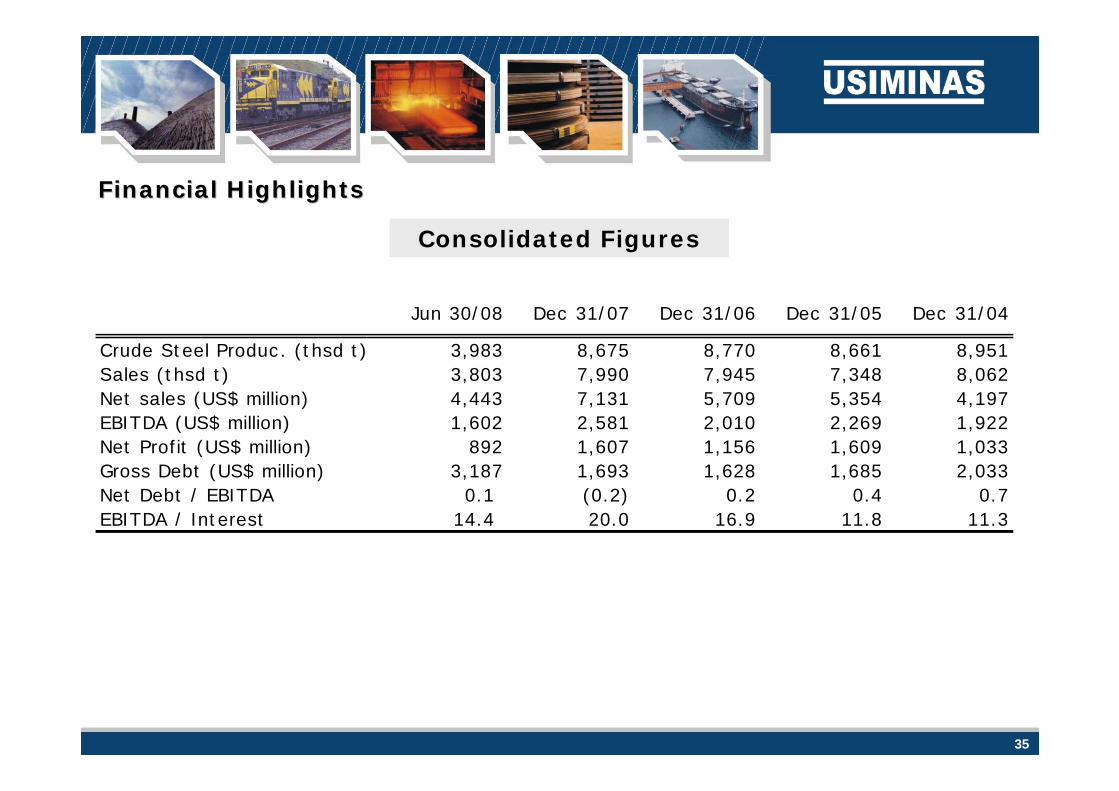
Consolidated Figures
Financial HighlightsFinancial Highlights
Jun 30/08 Dec 31/07 Dec 31/06 Dec 31/05 Dec 31/04
Crude Steel Produc. (thsd t) 3,983 8,675 8,770 8,661 8,951Sales (thsd t) 3,803 7,990 7,945 7,348 8,062Net sales (US$ million) 4,443 7,131 5,709 5,354 4,197EBITDA (US$ million) 1,602 2,581 2,010 2,269 1,922Net Profit (US$ million) 892 1,607 1,156 1,609 1,033Gross Debt (US$ million) 3,187 1,693 1,628 1,685 2,033Net Debt / EBITDA 0.1 (0.2) 0.2 0.4 0.7EBITDA / Interest 14.4 20.0 16.9 11.8 11.3

36
Agenda
Global View
Usiminas
Investments
Mining & Logistics
Financials
Corporate Governance and Social Responsability

37
Investments in Social ResponsibilityInvestments in Social Responsibility
Environmental Protection
Community
- More than R$ 2 billion invested in Ipatinga and Cubatão plantssince 1992.
- Usiminas and Cosipa were the 2nd and 3rd steel companies in theworld to be certified with ISO 14001.
- Fresh water recirculation rate above 93%.
- Green belt in Ipatinga area is 10 times aboverecommended level (World Health Organization).
- More than R$ 139 million invested in cultural activities in thelast fifteen years (tax incentives), involving 3 thousandartists and 200 thousand spectators.
- Construction of its 2nd hospital, one of three in Brazilaccredited by ONA (National Accreditation Organization),through USIMINAS Foundation, which is self sustaining. Bothhospitals provide healthcare to a region with 600 thousandinhabitants.
- Investment in education through São Francisco Xavier School,maintained by USIMINAS foundation, teaching more than 3thousand children and young people.
- The city of Ipatinga holds a “high standard of humandevelopment”, as defined by the UN - United Nations.

38
www.usiminas.com.br/ri
Investor Relations:Bruno Seno Fusaro (Head of IR) Matheus Perdigão Rosa Luciana Valadares dos [email protected] [email protected] [email protected].: + 55-31-3499-8772 Tel.: + 55-31-3499-8056 Tel.: + 55-31-3499-8619Fax: + 55-31-3499-9357
Gilson Rodrigues Bentes Diogo Dias Gonçalves Cosipa (São Paulo Office) [email protected] [email protected] Tel.: + 55-31-3499-8710 Tel.: + 55-11-5070-8980
Declarations relative to business perspectives of the Company, operating andfinancial results and projections, and references to the growth of the Company,constitute mere forecasts and were based on Management’s expectations inrelation to future performance. These expectations are highly dependent onmarket behavior, of Brazil’s economic situation, on the industry and oninternational markets, and are therefore subject to change.
ADRLevel I
Top Related