


Languages
Pages
Legal

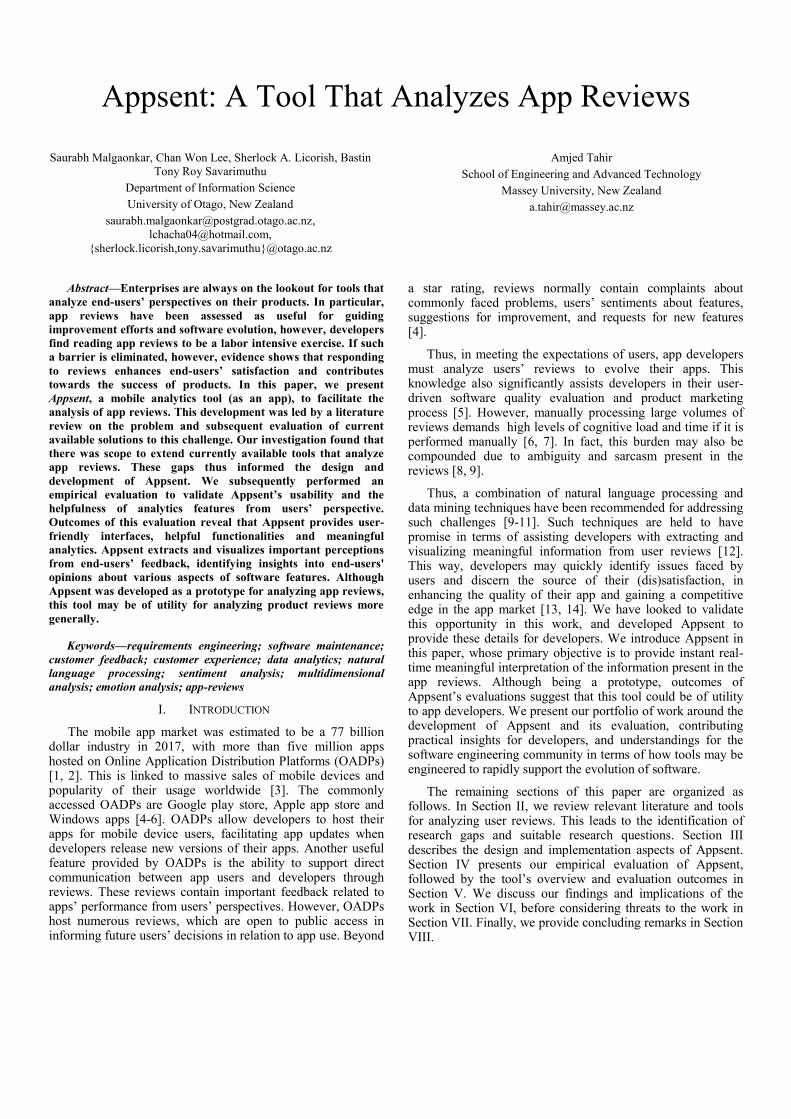
Appsent: A Tool That Analyzes App Reviews
Saurabh Malgaonkar, Chan Won Lee, Sherlock A. Licorish, Bastin
Tony Roy Savarimuthu
Department of Information Science
University of Otago, New Zealand
{sherlock.licorish,tony.savarimuthu}@otago.ac.nz
Amjed Tahir
School of Engineering and Advanced Technology
Massey University, New Zealand
Abstract—Enterprises are always on the lookout for tools that
analyze end-users’ perspectives on their products. In particular,
app reviews have been assessed as useful for guiding
improvement efforts and software evolution, however, developers
find reading app reviews to be a labor intensive exercise. If such
a barrier is eliminated, however, evidence shows that responding
to reviews enhances end-users’ satisfaction and contributes
towards the success of products. In this paper, we present
Appsent, a mobile analytics tool (as an app), to facilitate the
analysis of app reviews. This development was led by a literature
review on the problem and subsequent evaluation of current
available solutions to this challenge. Our investigation found that
there was scope to extend currently available tools that analyze
app reviews. These gaps thus informed the design and
development of Appsent. We subsequently performed an
empirical evaluation to validate Appsent’s usability and the
helpfulness of analytics features from users’ perspective.
Outcomes of this evaluation reveal that Appsent provides user-
friendly interfaces, helpful functionalities and meaningful
analytics. Appsent extracts and visualizes important perceptions
from end-users’ feedback, identifying insights into end-users'
opinions about various aspects of software features. Although
Appsent was developed as a prototype for analyzing app reviews,
this tool may be of utility for analyzing product reviews more
generally.
Keywords—requirements engineering; software maintenance;
customer feedback; customer experience; data analytics; natural
language processing; sentiment analysis; multidimensional
analysis; emotion analysis; app-reviews
I. INTRODUCTION
The mobile app market was estimated to be a 77 billion dollar industry in 2017, with more than five million apps hosted on Online Application Distribution Platforms (OADPs) [1, 2]. This is linked to massive sales of mobile devices and popularity of their usage worldwide [3]. The commonly accessed OADPs are Google play store, Apple app store and Windows apps [4-6]. OADPs allow developers to host their apps for mobile device users, facilitating app updates when developers release new versions of their apps. Another useful feature provided by OADPs is the ability to support direct communication between app users and developers through reviews. These reviews contain important feedback related to apps’ performance from users’ perspectives. However, OADPs host numerous reviews, which are open to public access in informing future users’ decisions in relation to app use. Beyond
a star rating, reviews normally contain complaints about commonly faced problems, users’ sentiments about features, suggestions for improvement, and requests for new features [4].
Thus, in meeting the expectations of users, app developers must analyze users’ reviews to evolve their apps. This knowledge also significantly assists developers in their user-driven software quality evaluation and product marketing process [5]. However, manually processing large volumes of reviews demands high levels of cognitive load and time if it is performed manually [6, 7]. In fact, this burden may also be compounded due to ambiguity and sarcasm present in the reviews [8, 9].
Thus, a combination of natural language processing and data mining techniques have been recommended for addressing such challenges [9-11]. Such techniques are held to have promise in terms of assisting developers with extracting and visualizing meaningful information from user reviews [12]. This way, developers may quickly identify issues faced by users and discern the source of their (dis)satisfaction, in enhancing the quality of their app and gaining a competitive edge in the app market [13, 14]. We have looked to validate this opportunity in this work, and developed Appsent to provide these details for developers. We introduce Appsent in this paper, whose primary objective is to provide instant real-time meaningful interpretation of the information present in the app reviews. Although being a prototype, outcomes of Appsent’s evaluations suggest that this tool could be of utility to app developers. We present our portfolio of work around the development of Appsent and its evaluation, contributing practical insights for developers, and understandings for the software engineering community in terms of how tools may be engineered to rapidly support the evolution of software.
The remaining sections of this paper are organized as follows. In Section II, we review relevant literature and tools for analyzing user reviews. This leads to the identification of research gaps and suitable research questions. Section III describes the design and implementation aspects of Appsent. Section IV presents our empirical evaluation of Appsent, followed by the tool’s overview and evaluation outcomes in Section V. We discuss our findings and implications of the work in Section VI, before considering threats to the work in Section VII. Finally, we provide concluding remarks in Section VIII.
II. BACKGROUND AND RESEARCH QUESTIONS
Text mining as a discipline is held to offer an efficient
solution to the problem of processing large volumes of textual
information to extract knowledge [15]. The text mining
process is data-driven, and assists significantly in identifying
the hidden patterns or trends in unstructured text [16]. Central
to the meaningful interpretation of textual information is the
ability to identify the polarity of users. The primary objective
of polarity analysis is to discover the attitude of the user
towards specific things or events [17]. Polarity can be
evaluated via sentiment (e.g., positive or negative) or emotion
(e.g., happy or fear). The polarity of a sample of text may be
uncovered by using learning- or lexicon-based methods [18].
Learning methods build a feature classification model by
utilizing machine learning techniques or probabilistic models,
whereas lexicon methods use well-built dictionaries to
determine the meaning of textual entities.
Another critical stage of text mining is topic or feature
identification and extraction. Part-of-speech (POS) tagging
and n-gram analysis are commonly used for extracting
features or topics of interest in textual data [19]. For instance,
Licorish et al. [6] employed these approaches to identify the
most frequently mentioned features in enhancement requests
logged by the Android community. In another study, Iacob et
al. [19] were successful in discovering associations among
features through the use of these approaches and Latent
Dirichlet Allocation (LDA) models. A more advanced study
by Lee et al. [20] has deployed POS tagging, n-gram analysis
and Social Network Analysis (SNA) techniques to identify
features and explore associations among features that were
mentioned in reviews. This latter study places emphasis on the
importance of discovering the relations between features in
understanding the complexities of defects and improvement
pointers that are identified by users in reviews. The
abovementioned studies automatically process reviews to
provide a high-level view of the information of interest to
users. Beyond understanding features that capture users’
interests, such provisions enable developers to identify the
complex relationships between app features, and significantly
assists in co-relating users’ problems. We anticipated that
tools built to assist developers with extracting and visualizing
meaningful information from user reviews should identify
users' opinions about software features (e.g., positive views
around specific features), identify the features of particular
interest (e.g., broken features), and discover the associations
among the features (e.g., which group of features affects each
other).
Browsing for such products on the app stores and wider
internet it is observed that software enterprises have used the
methods identified above to develop tools that fulfill the task
of analyzing the performance of apps released on OADPs.
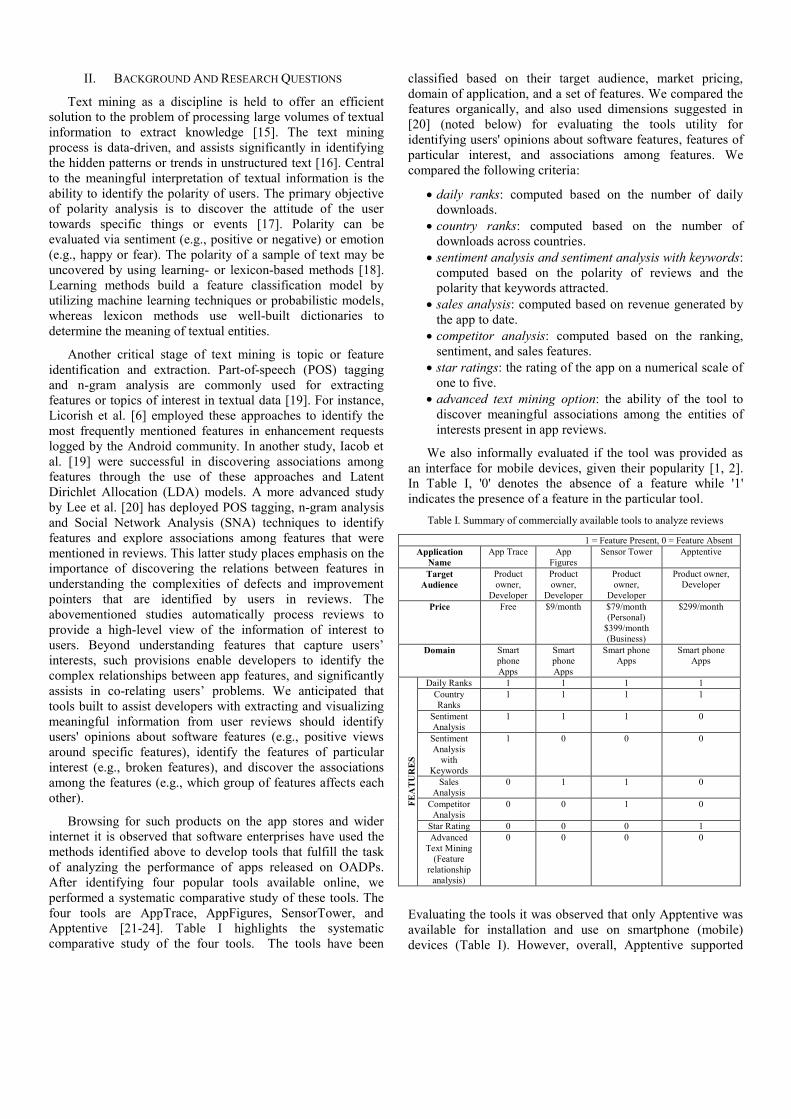
After identifying four popular tools available online, we
performed a systematic comparative study of these tools. The
four tools are AppTrace, AppFigures, SensorTower, and
Apptentive [21-24]. Table I highlights the systematic
comparative study of the four tools. The tools have been
classified based on their target audience, market pricing,
domain of application, and a set of features. We compared the
features organically, and also used dimensions suggested in
[20] (noted below) for evaluating the tools utility for
identifying users' opinions about software features, features of
particular interest, and associations among features. We
compared the following criteria:
daily ranks: computed based on the number of daily
downloads.
country ranks: computed based on the number of
downloads across countries.
sentiment analysis and sentiment analysis with keywords:
computed based on the polarity of reviews and the
polarity that keywords attracted.
sales analysis: computed based on revenue generated by
the app to date.
competitor analysis: computed based on the ranking,
sentiment, and sales features.
star ratings: the rating of the app on a numerical scale of
one to five.
advanced text mining option: the ability of the tool to
discover meaningful associations among the entities of
interests present in app reviews.
We also informally evaluated if the tool was provided as
an interface for mobile devices, given their popularity [1, 2].
In Table I, '0' denotes the absence of a feature while '1'
indicates the presence of a feature in the particular tool.
Table I. Summary of commercially available tools to analyze reviews
1 = Feature Present, 0 = Feature Absent
Application
Name
App Trace App
Figures
Sensor Tower Apptentive
Target
Audience
Product
owner,
Developer
Product
owner,
Developer
Product
owner,
Developer
Product owner,
Developer
Price Free $9/month $79/month
(Personal)
$399/month
(Business)
$299/month
Domain Smart
phone
Apps
Smart
phone
Apps
Smart phone
Apps
Smart phone
Apps
FE
AT
UR
ES
Daily Ranks 1 1 1 1
Country
Ranks
1 1 1 1
Sentiment
Analysis
1 1 1 0
Sentiment
Analysis
with
Keywords
1 0 0 0
Sales
Analysis
0 1 1 0
Competitor
Analysis
0 0 1 0
Star Rating 0 0 0 1
Advanced
Text Mining
(Feature
relationship
analysis)
0 0 0 0
Evaluating the tools it was observed that only Apptentive was
available for installation and use on smartphone (mobile)
devices (Table I). However, overall, Apptentive supported
fewer features than the other tools. By running the tools, we
found that the sentiment analysis feature of AppTrace did not
return readable visualizations at times (i.e., too much
dimensions were evident). AppFigures required manual
intervention for analyzing reviews, and SensorTower could
not fully distinguish the sentiment for some reviews, requiring
manual intervention. Overall, it was observed that these tools
are still being evolved and they do not provide mechanisms
for identifying associations among features, which is assessed
as critical for identifying complex relationships among defects
[20].
Therefore, we believe that having a tool that analyzes user
reviews will allow developers to quickly identify issues faced
by users and discern the source of their (dis)satisfaction, in
enhancing the quality of their app and gaining a competitive
edge in the apps market. However, examining previous works
and tools available for analyzing reviews to inform
developers, Table I shows that while tools available provide
various functions to support reviews analysis, they lack
various features that may be deemed pertinent to developers
[20]. We thus proposed to provide a prototype app to bridge
this gap. To guide this effort we formulated the following
three research questions:
RQ1. How can we design and develop a mobile app for
analyzing reviews that is deemed highly usable?
Upon the creation of the mobile app, we investigate the utility
provided by the functionalities offered by the app. Thus, the
second question we investigated is:
RQ2. Does the newly developed app provide
functionalities that are helpful?
Any analytics tool that is developed should unearth insights
from data and present it to the users. In this work, we
investigate the ability of the tool to provide insights at
different levels (e.g., based on sentiments and emotions
expressed by users). Towards examining the nature of insights
provided by the app, we pose the last question.
RQ3. Does the developed app provide suitable
interpretative analytics on multiple levels?
III. APPSENT DESIGN AND IMPLEMENTATION
We provide details around the techniques and principles
that were used to design and implement our app, Appsent, in
this section towards answering RQ1.
A. Appsent Design
App reviews contain unstructured textual information that
needs to be pre-processed for relevance [25]. This process
involves the removal of blank spaces, unwanted characters,
and stopwords. We performed this process, before aggregating
similar words (i.e., stemming). Stopwords were identified
through WordNet and Stanford NLP API was used for
stemming based on Porter’s algorithm [26, 27]. This process
refined reviews making them suitable for further analysis. We
next performed natural language processing through the use of
POS tagging [28]. For this phase we used the Stanford API to
extract the nouns and verbs in reviews; which map to features
and issues respectively [29]. The extracted features and issues
were tallied to quantify the frequency of each feature or issue.
Sentiment analysis identifies the positive, negative or neutral
tone of a statement made by users. To detect the sentiments in
reviews we employed a sentiment analysis method that has
been inspired by the sentiment treebank technique [30]. In
exploring emotions in reviews we used WordNet’s lexicon-
based method to identify six emotions, namely happy, sad,
surprise, fear, anger and disgust [31]. In checking the
associations among features we performed co-occurrence
analysis as proposed by Lee et al. [20]. This analysis captures
the relationship between features and associated problems
through feature-feature and feature-issue analyses. Appsent
implements the same strategy and performs co-occurrence
analysis by considering the sentiment, emotion, and the rating
(1-5) factors.
After finalizing the functional aspects of Appsent, it was
necessary to design a user-friendly graphical user interface
(GUI). We considered both users’ interaction with the app and
the provision of meaningful visualizations of results on mobile
device screens. In informing our design we adapted
Shneiderman's rules [32]. These rules are provided in Table II,
covering the creation of shortcuts of the most frequently
visited features of the app to designing the app for enjoyment.
Of particular interest to us was also the provision of
informative responses, memory optimization, eliminating
unwanted details, quick load of the application, and the
provision of highly immersive and appealing interfaces (refer
to Table II).
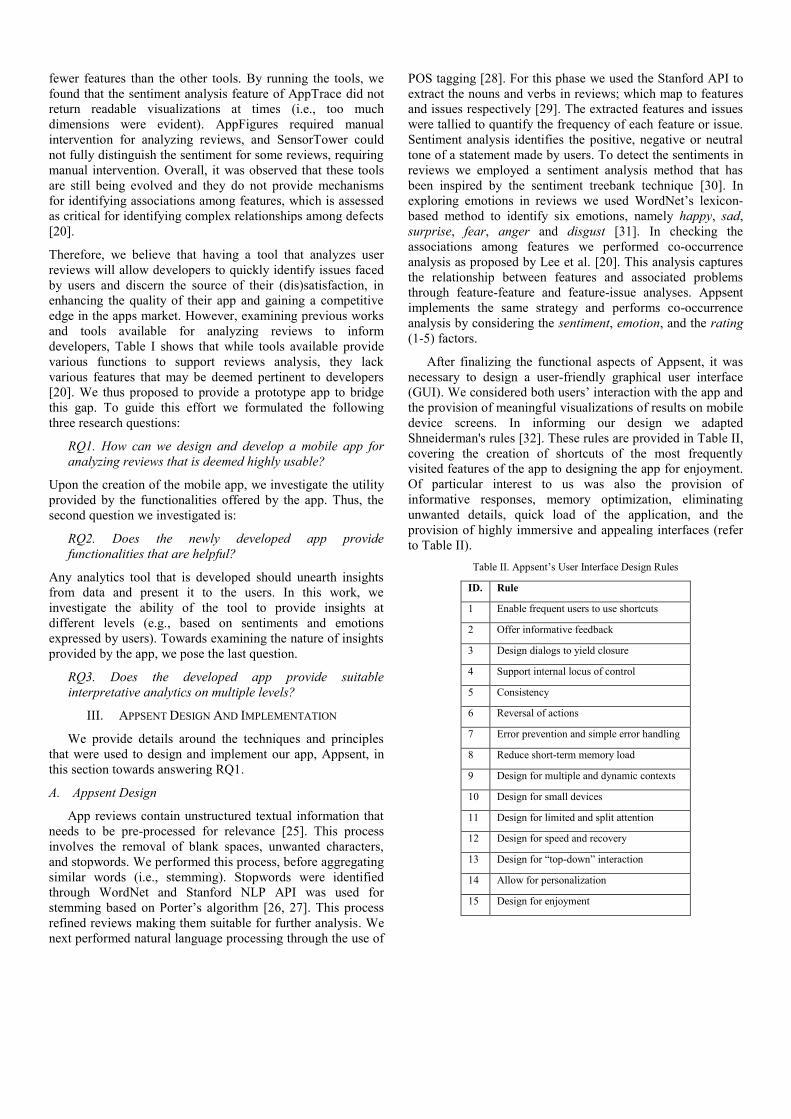
Table II. Appsent’s User Interface Design Rules
ID. Rule
1 Enable frequent users to use shortcuts
2 Offer informative feedback
3 Design dialogs to yield closure
4 Support internal locus of control
5 Consistency
6 Reversal of actions
7 Error prevention and simple error handling
8 Reduce short-term memory load
9 Design for multiple and dynamic contexts
10 Design for small devices
11 Design for limited and split attention
12 Design for speed and recovery
13 Design for “top-down” interaction
14 Allow for personalization
15 Design for enjoyment
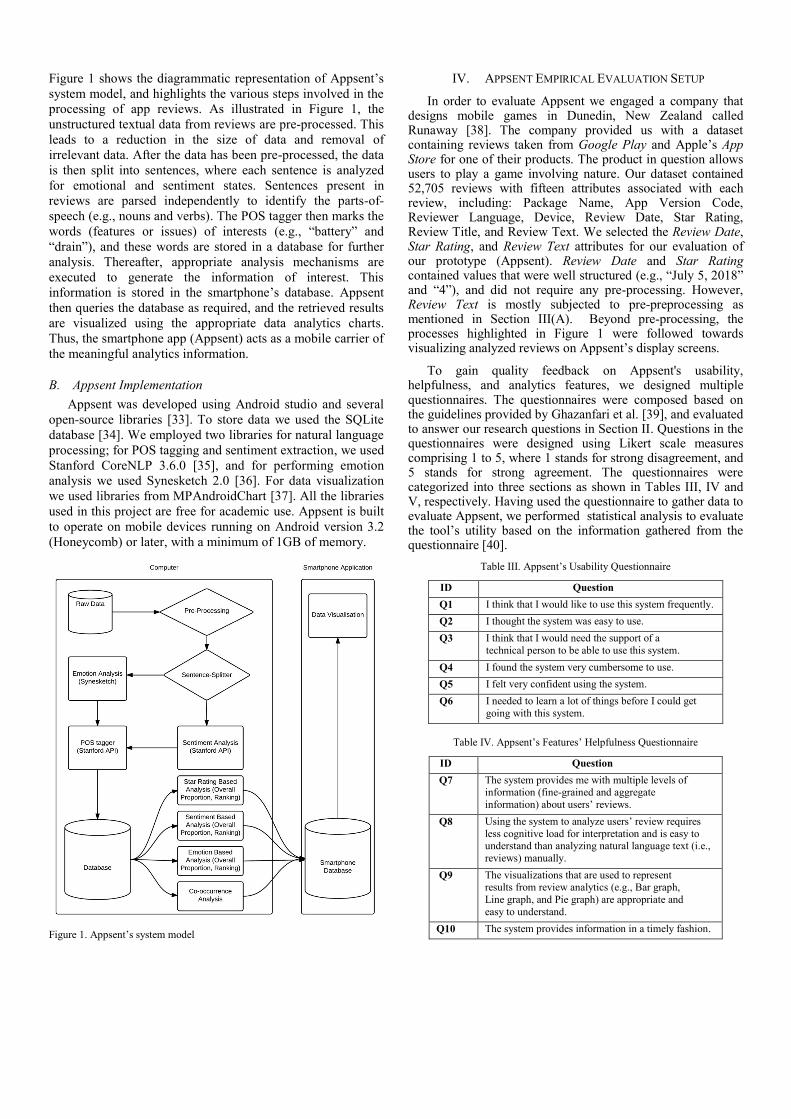
Figure 1 shows the diagrammatic representation of Appsent’s
system model, and highlights the various steps involved in the
processing of app reviews. As illustrated in Figure 1, the
unstructured textual data from reviews are pre-processed. This
leads to a reduction in the size of data and removal of
irrelevant data. After the data has been pre-processed, the data
is then split into sentences, where each sentence is analyzed
for emotional and sentiment states. Sentences present in
reviews are parsed independently to identify the parts-of-
speech (e.g., nouns and verbs). The POS tagger then marks the
words (features or issues) of interests (e.g., “battery” and
“drain”), and these words are stored in a database for further
analysis. Thereafter, appropriate analysis mechanisms are
executed to generate the information of interest. This
information is stored in the smartphone’s database. Appsent
then queries the database as required, and the retrieved results
are visualized using the appropriate data analytics charts.
Thus, the smartphone app (Appsent) acts as a mobile carrier of
the meaningful analytics information.
B. Appsent Implementation
Appsent was developed using Android studio and several
open-source libraries [33]. To store data we used the SQLite
database [34]. We employed two libraries for natural language
processing; for POS tagging and sentiment extraction, we used
Stanford CoreNLP 3.6.0 [35], and for performing emotion
analysis we used Synesketch 2.0 [36]. For data visualization
we used libraries from MPAndroidChart [37]. All the libraries
used in this project are free for academic use. Appsent is built
to operate on mobile devices running on Android version 3.2
(Honeycomb) or later, with a minimum of 1GB of memory.
Figure 1. Appsent’s system model
IV. APPSENT EMPIRICAL EVALUATION SETUP
In order to evaluate Appsent we engaged a company that designs mobile games in Dunedin, New Zealand called Runaway [38]. The company provided us with a dataset containing reviews taken from Google Play and Apple’s App Store for one of their products. The product in question allows users to play a game involving nature. Our dataset contained 52,705 reviews with fifteen attributes associated with each review, including: Package Name, App Version Code, Reviewer Language, Device, Review Date, Star Rating, Review Title, and Review Text. We selected the Review Date, Star Rating, and Review Text attributes for our evaluation of our prototype (Appsent). Review Date and Star Rating contained values that were well structured (e.g., “July 5, 2018” and “4”), and did not require any pre-processing. However, Review Text is mostly subjected to pre-preprocessing as mentioned in Section III(A). Beyond pre-processing, the processes highlighted in Figure 1 were followed towards visualizing analyzed reviews on Appsent’s display screens.
To gain quality feedback on Appsent's usability, helpfulness, and analytics features, we designed multiple questionnaires. The questionnaires were composed based on the guidelines provided by Ghazanfari et al. [39], and evaluated to answer our research questions in Section II. Questions in the questionnaires were designed using Likert scale measures comprising 1 to 5, where 1 stands for strong disagreement, and 5 stands for strong agreement. The questionnaires were categorized into three sections as shown in Tables III, IV and V, respectively. Having used the questionnaire to gather data to evaluate Appsent, we performed statistical analysis to evaluate the tool’s utility based on the information gathered from the questionnaire [40].
Table III. Appsent’s Usability Questionnaire
ID Question
Q1 I think that I would like to use this system frequently.
Q2 I thought the system was easy to use.
Q3 I think that I would need the support of a
technical person to be able to use this system.
Q4 I found the system very cumbersome to use.
Q5 I felt very confident using the system.
Q6 I needed to learn a lot of things before I could get
going with this system.
Table IV. Appsent’s Features’ Helpfulness Questionnaire
ID Question
Q7 The system provides me with multiple levels of information (fine-grained and aggregate
information) about users’ reviews.
Q8 Using the system to analyze users’ review requires
less cognitive load for interpretation and is easy to understand than analyzing natural language text (i.e.,
reviews) manually.
Q9 The visualizations that are used to represent results from review analytics (e.g., Bar graph,
Line graph, and Pie graph) are appropriate and
easy to understand.
Q10 The system provides information in a timely fashion.
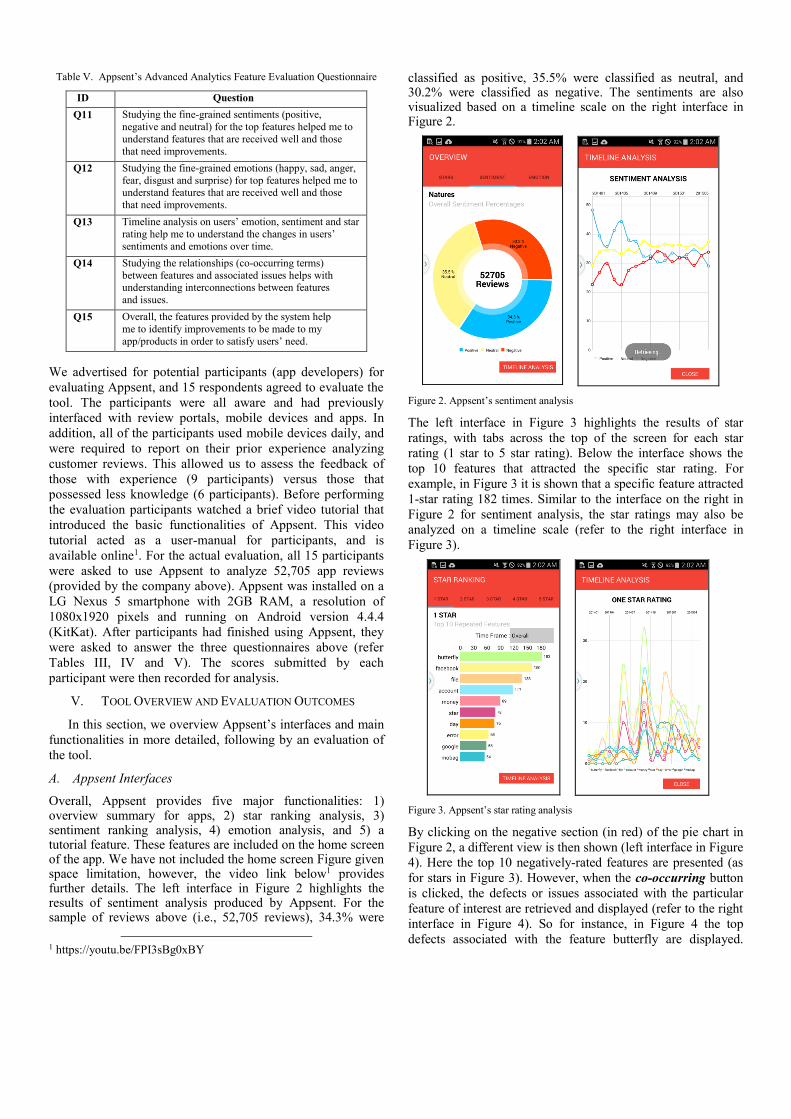
Table V. Appsent’s Advanced Analytics Feature Evaluation Questionnaire
ID Question
Q11 Studying the fine-grained sentiments (positive,
negative and neutral) for the top features helped me to
understand features that are received well and those
that need improvements.
Q12 Studying the fine-grained emotions (happy, sad, anger,
fear, disgust and surprise) for top features helped me to understand features that are received well and those
that need improvements.
Q13 Timeline analysis on users’ emotion, sentiment and star
rating help me to understand the changes in users’
sentiments and emotions over time.
Q14 Studying the relationships (co-occurring terms)
between features and associated issues helps with understanding interconnections between features
and issues.
Q15 Overall, the features provided by the system help
me to identify improvements to be made to my
app/products in order to satisfy users’ need.
We advertised for potential participants (app developers) for
evaluating Appsent, and 15 respondents agreed to evaluate the
tool. The participants were all aware and had previously
interfaced with review portals, mobile devices and apps. In
addition, all of the participants used mobile devices daily, and
were required to report on their prior experience analyzing
customer reviews. This allowed us to assess the feedback of
those with experience (9 participants) versus those that
possessed less knowledge (6 participants). Before performing
the evaluation participants watched a brief video tutorial that
introduced the basic functionalities of Appsent. This video
tutorial acted as a user-manual for participants, and is
available online1. For the actual evaluation, all 15 participants
were asked to use Appsent to analyze 52,705 app reviews
(provided by the company above). Appsent was installed on a
LG Nexus 5 smartphone with 2GB RAM, a resolution of
1080x1920 pixels and running on Android version 4.4.4
(KitKat). After participants had finished using Appsent, they
were asked to answer the three questionnaires above (refer
Tables III, IV and V). The scores submitted by each
participant were then recorded for analysis.
V. TOOL OVERVIEW AND EVALUATION OUTCOMES
In this section, we overview Appsent’s interfaces and main
functionalities in more detailed, following by an evaluation of
the tool.
A. Appsent Interfaces
Overall, Appsent provides five major functionalities: 1) overview summary for apps, 2) star ranking analysis, 3) sentiment ranking analysis, 4) emotion analysis, and 5) a tutorial feature. These features are included on the home screen of the app. We have not included the home screen Figure given space limitation, however, the video link below1 provides further details. The left interface in Figure 2 highlights the results of sentiment analysis produced by Appsent. For the sample of reviews above (i.e., 52,705 reviews), 34.3% were
1 https://youtu.be/FPI3sBg0xBY
classified as positive, 35.5% were classified as neutral, and 30.2% were classified as negative. The sentiments are also visualized based on a timeline scale on the right interface in Figure 2.
Figure 2. Appsent’s sentiment analysis
The left interface in Figure 3 highlights the results of star
ratings, with tabs across the top of the screen for each star
rating (1 star to 5 star rating). Below the interface shows the
top 10 features that attracted the specific star rating. For
example, in Figure 3 it is shown that a specific feature attracted
1-star rating 182 times. Similar to the interface on the right in
Figure 2 for sentiment analysis, the star ratings may also be
analyzed on a timeline scale (refer to the right interface in
Figure 3).
Figure 3. Appsent’s star rating analysis
By clicking on the negative section (in red) of the pie chart in
Figure 2, a different view is then shown (left interface in Figure
4). Here the top 10 negatively-rated features are presented (as
for stars in Figure 3). However, when the co-occurring button
is clicked, the defects or issues associated with the particular
feature of interest are retrieved and displayed (refer to the right
interface in Figure 4). So for instance, in Figure 4 the top
defects associated with the feature butterfly are displayed.
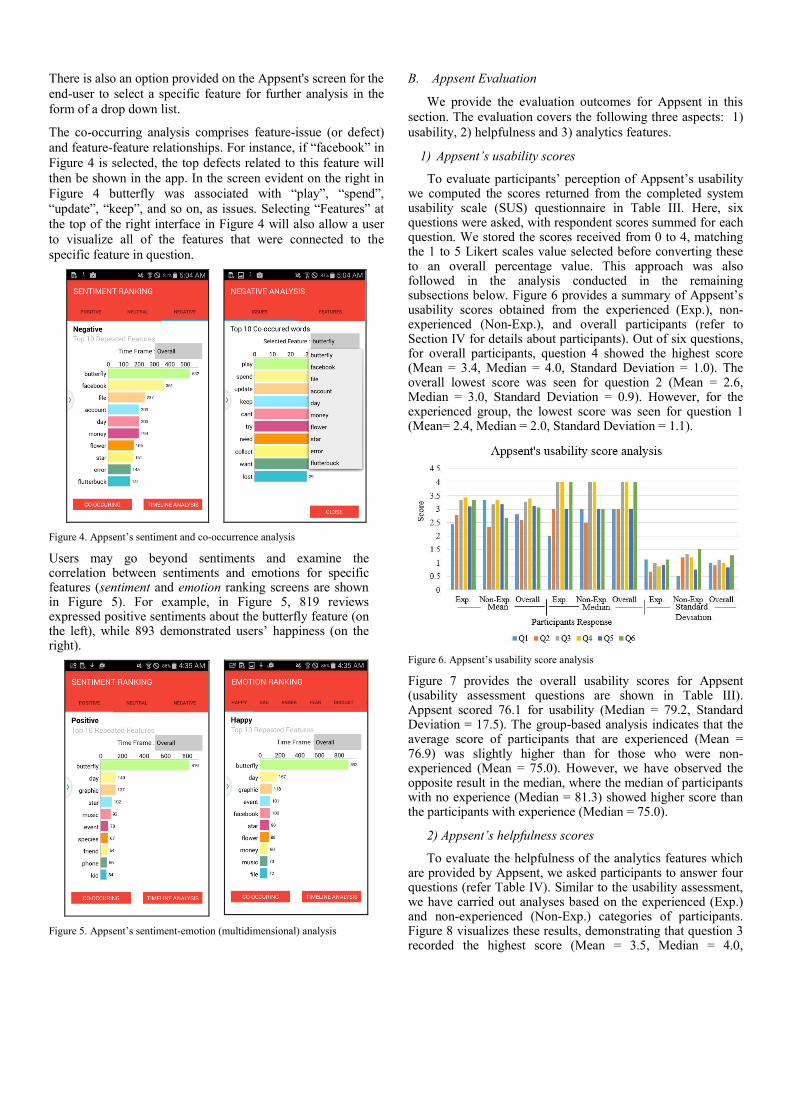
There is also an option provided on the Appsent's screen for the
end-user to select a specific feature for further analysis in the
form of a drop down list.
The co-occurring analysis comprises feature-issue (or defect)
and feature-feature relationships. For instance, if “facebook” in
Figure 4 is selected, the top defects related to this feature will
then be shown in the app. In the screen evident on the right in
Figure 4 butterfly was associated with “play”, “spend”,
“update”, “keep”, and so on, as issues. Selecting “Features” at
the top of the right interface in Figure 4 will also allow a user
to visualize all of the features that were connected to the
specific feature in question.
Figure 4. Appsent’s sentiment and co-occurrence analysis
Users may go beyond sentiments and examine the correlation between sentiments and emotions for specific features (sentiment and emotion ranking screens are shown in Figure 5). For example, in Figure 5, 819 reviews expressed positive sentiments about the butterfly feature (on the left), while 893 demonstrated users’ happiness (on the right).
Figure 5. Appsent’s sentiment-emotion (multidimensional) analysis
B. Appsent Evaluation
We provide the evaluation outcomes for Appsent in this
section. The evaluation covers the following three aspects: 1)
usability, 2) helpfulness and 3) analytics features.
1) Appsent’s usability scores
To evaluate participants’ perception of Appsent’s usability we computed the scores returned from the completed system usability scale (SUS) questionnaire in Table III. Here, six questions were asked, with respondent scores summed for each question. We stored the scores received from 0 to 4, matching the 1 to 5 Likert scales value selected before converting these to an overall percentage value. This approach was also followed in the analysis conducted in the remaining subsections below. Figure 6 provides a summary of Appsent’s usability scores obtained from the experienced (Exp.), non-experienced (Non-Exp.), and overall participants (refer to Section IV for details about participants). Out of six questions, for overall participants, question 4 showed the highest score (Mean = 3.4, Median = 4.0, Standard Deviation = 1.0). The overall lowest score was seen for question 2 (Mean = 2.6, Median = 3.0, Standard Deviation = 0.9). However, for the experienced group, the lowest score was seen for question 1 (Mean= 2.4, Median = 2.0, Standard Deviation = 1.1).
Figure 6. Appsent’s usability score analysis
Figure 7 provides the overall usability scores for Appsent (usability assessment questions are shown in Table III). Appsent scored 76.1 for usability (Median = 79.2, Standard Deviation = 17.5). The group-based analysis indicates that the average score of participants that are experienced (Mean = 76.9) was slightly higher than for those who were non-experienced (Mean = 75.0). However, we have observed the opposite result in the median, where the median of participants with no experience (Median = 81.3) showed higher score than the participants with experience (Median = 75.0).
2) Appsent’s helpfulness scores
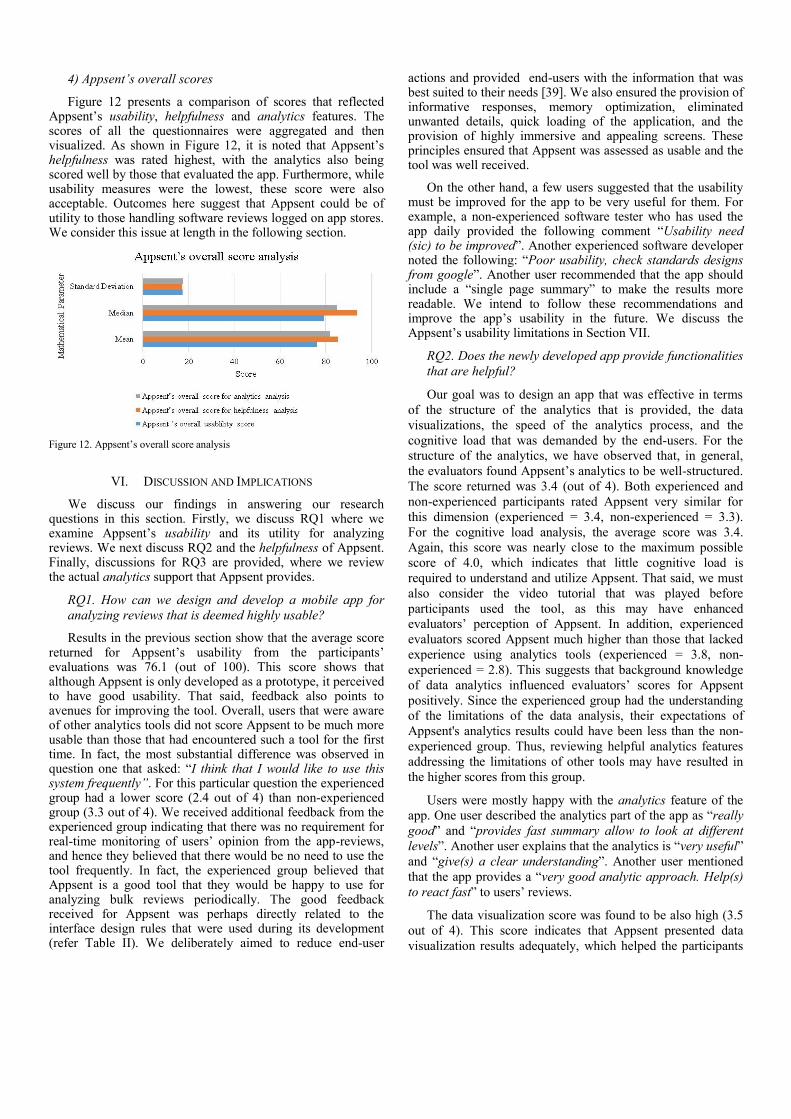
To evaluate the helpfulness of the analytics features which are provided by Appsent, we asked participants to answer four questions (refer Table IV). Similar to the usability assessment, we have carried out analyses based on the experienced (Exp.) and non-experienced (Non-Exp.) categories of participants. Figure 8 visualizes these results, demonstrating that question 3 recorded the highest score (Mean = 3.5, Median = 4.0,
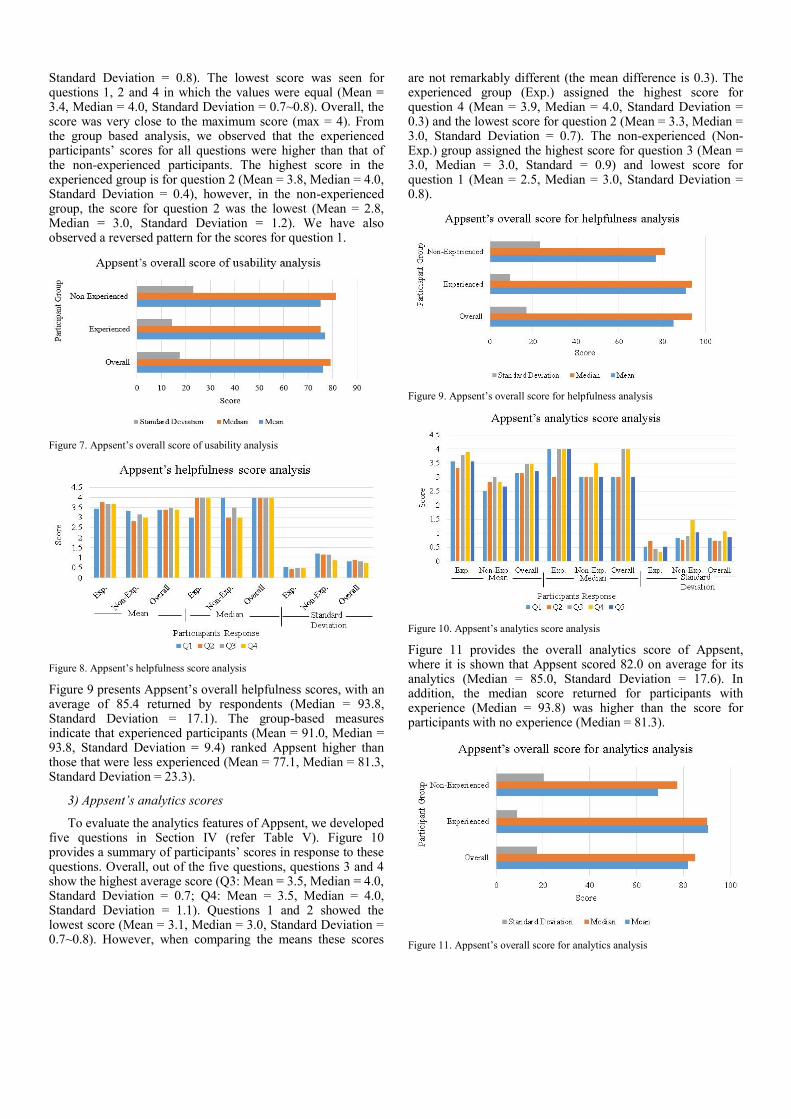
Standard Deviation = 0.8). The lowest score was seen for questions 1, 2 and 4 in which the values were equal (Mean = 3.4, Median = 4.0, Standard Deviation = 0.7~0.8). Overall, the score was very close to the maximum score (max = 4). From the group based analysis, we observed that the experienced participants’ scores for all questions were higher than that of the non-experienced participants. The highest score in the experienced group is for question 2 (Mean = 3.8, Median = 4.0, Standard Deviation = 0.4), however, in the non-experienced group, the score for question 2 was the lowest (Mean = 2.8, Median = 3.0, Standard Deviation = 1.2). We have also observed a reversed pattern for the scores for question 1.
Figure 7. Appsent’s overall score of usability analysis
Figure 8. Appsent’s helpfulness score analysis
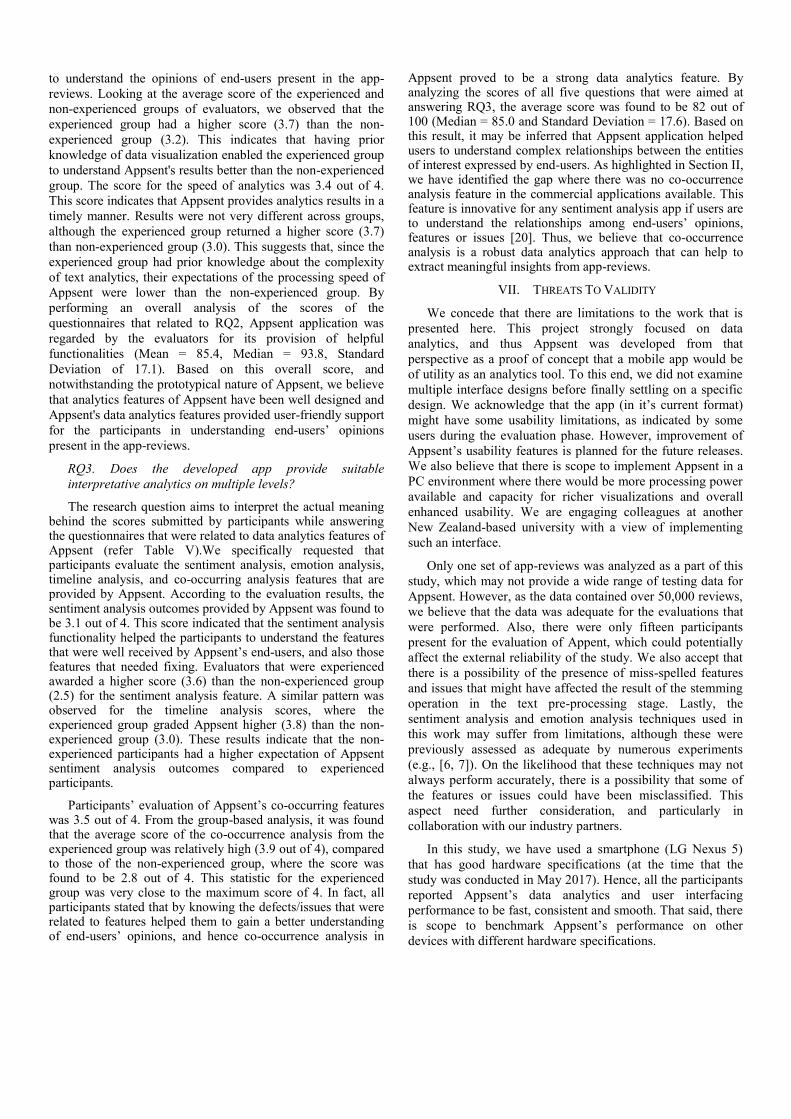
Figure 9 presents Appsent’s overall helpfulness scores, with an average of 85.4 returned by respondents (Median = 93.8, Standard Deviation = 17.1). The group-based measures indicate that experienced participants (Mean = 91.0, Median = 93.8, Standard Deviation = 9.4) ranked Appsent higher than those that were less experienced (Mean = 77.1, Median = 81.3, Standard Deviation = 23.3).
3) Appsent’s analytics scores
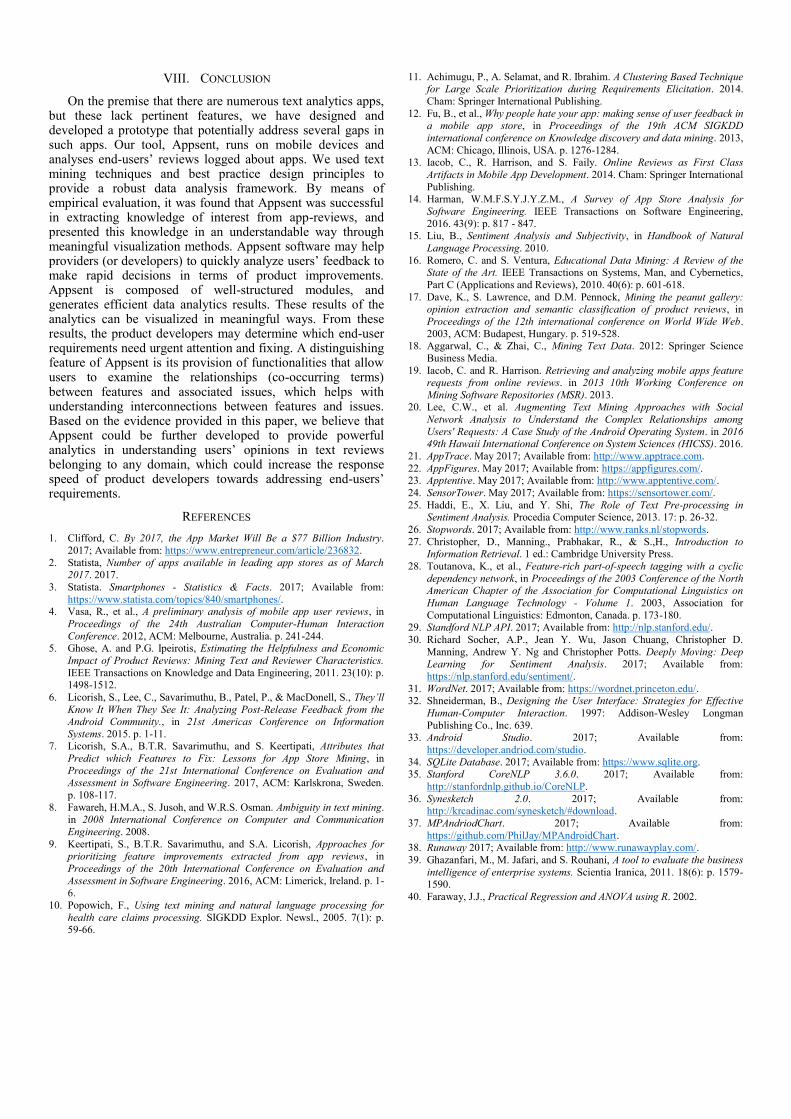
To evaluate the analytics features of Appsent, we developed five questions in Section IV (refer Table V). Figure 10 provides a summary of participants’ scores in response to these questions. Overall, out of the five questions, questions 3 and 4 show the highest average score (Q3: Mean = 3.5, Median = 4.0, Standard Deviation = 0.7; Q4: Mean = 3.5, Median = 4.0, Standard Deviation = 1.1). Questions 1 and 2 showed the lowest score (Mean = 3.1, Median = 3.0, Standard Deviation = 0.7~0.8). However, when comparing the means these scores
are not remarkably different (the mean difference is 0.3). The experienced group (Exp.) assigned the highest score for question 4 (Mean = 3.9, Median = 4.0, Standard Deviation = 0.3) and the lowest score for question 2 (Mean = 3.3, Median = 3.0, Standard Deviation = 0.7). The non-experienced (Non-Exp.) group assigned the highest score for question 3 (Mean = 3.0, Median = 3.0, Standard = 0.9) and lowest score for question 1 (Mean = 2.5, Median = 3.0, Standard Deviation = 0.8).
Figure 9. Appsent’s overall score for helpfulness analysis
Figure 10. Appsent’s analytics score analysis
Figure 11 provides the overall analytics score of Appsent, where it is shown that Appsent scored 82.0 on average for its analytics (Median = 85.0, Standard Deviation = 17.6). In addition, the median score returned for participants with experience (Median = 93.8) was higher than the score for participants with no experience (Median = 81.3).
Figure 11. Appsent’s overall score for analytics analysis
4) Appsent’s overall scores
Figure 12 presents a comparison of scores that reflected Appsent’s usability, helpfulness and analytics features. The scores of all the questionnaires were aggregated and then visualized. As shown in Figure 12, it is noted that Appsent’s helpfulness was rated highest, with the analytics also being scored well by those that evaluated the app. Furthermore, while usability measures were the lowest, these score were also acceptable. Outcomes here suggest that Appsent could be of utility to those handling software reviews logged on app stores. We consider this issue at length in the following section.
Figure 12. Appsent’s overall score analysis
VI. DISCUSSION AND IMPLICATIONS
We discuss our findings in answering our research questions in this section. Firstly, we discuss RQ1 where we examine Appsent’s usability and its utility for analyzing reviews. We next discuss RQ2 and the helpfulness of Appsent. Finally, discussions for RQ3 are provided, where we review the actual analytics support that Appsent provides.
RQ1. How can we design and develop a mobile app for
analyzing reviews that is deemed highly usable?
Results in the previous section show that the average score returned for Appsent’s usability from the participants’ evaluations was 76.1 (out of 100). This score shows that although Appsent is only developed as a prototype, it perceived to have good usability. That said, feedback also points to avenues for improving the tool. Overall, users that were aware of other analytics tools did not score Appsent to be much more usable than those that had encountered such a tool for the first time. In fact, the most substantial difference was observed in question one that asked: “I think that I would like to use this system frequently”. For this particular question the experienced group had a lower score (2.4 out of 4) than non-experienced group (3.3 out of 4). We received additional feedback from the experienced group indicating that there was no requirement for real-time monitoring of users’ opinion from the app-reviews, and hence they believed that there would be no need to use the tool frequently. In fact, the experienced group believed that Appsent is a good tool that they would be happy to use for analyzing bulk reviews periodically. The good feedback received for Appsent was perhaps directly related to the interface design rules that were used during its development (refer Table II). We deliberately aimed to reduce end-user
actions and provided end-users with the information that was best suited to their needs [39]. We also ensured the provision of informative responses, memory optimization, eliminated unwanted details, quick loading of the application, and the provision of highly immersive and appealing screens. These principles ensured that Appsent was assessed as usable and the tool was well received.
On the other hand, a few users suggested that the usability must be improved for the app to be very useful for them. For example, a non-experienced software tester who has used the app daily provided the following comment “Usability need (sic) to be improved”. Another experienced software developer noted the following: “Poor usability, check standards designs from google”. Another user recommended that the app should include a “single page summary” to make the results more readable. We intend to follow these recommendations and improve the app’s usability in the future. We discuss the Appsent’s usability limitations in Section VII.
RQ2. Does the newly developed app provide functionalities
that are helpful?
Our goal was to design an app that was effective in terms
of the structure of the analytics that is provided, the data
visualizations, the speed of the analytics process, and the
cognitive load that was demanded by the end-users. For the
structure of the analytics, we have observed that, in general,
the evaluators found Appsent’s analytics to be well-structured.
The score returned was 3.4 (out of 4). Both experienced and
non-experienced participants rated Appsent very similar for
this dimension (experienced = 3.4, non-experienced = 3.3).
For the cognitive load analysis, the average score was 3.4.
Again, this score was nearly close to the maximum possible
score of 4.0, which indicates that little cognitive load is
required to understand and utilize Appsent. That said, we must
also consider the video tutorial that was played before
participants used the tool, as this may have enhanced
evaluators’ perception of Appsent. In addition, experienced
evaluators scored Appsent much higher than those that lacked
experience using analytics tools (experienced = 3.8, non-
experienced = 2.8). This suggests that background knowledge
of data analytics influenced evaluators’ scores for Appsent
positively. Since the experienced group had the understanding
of the limitations of the data analysis, their expectations of
Appsent's analytics results could have been less than the non-
experienced group. Thus, reviewing helpful analytics features
addressing the limitations of other tools may have resulted in
the higher scores from this group.
Users were mostly happy with the analytics feature of the
app. One user described the analytics part of the app as “really
good” and “provides fast summary allow to look at different
levels”. Another user explains that the analytics is “very useful”
and “give(s) a clear understanding”. Another user mentioned
that the app provides a “very good analytic approach. Help(s)
to react fast” to users’ reviews.
The data visualization score was found to be also high (3.5
out of 4). This score indicates that Appsent presented data
visualization results adequately, which helped the participants
to understand the opinions of end-users present in the app-
reviews. Looking at the average score of the experienced and
non-experienced groups of evaluators, we observed that the
experienced group had a higher score (3.7) than the non-
experienced group (3.2). This indicates that having prior
knowledge of data visualization enabled the experienced group
to understand Appsent's results better than the non-experienced
group. The score for the speed of analytics was 3.4 out of 4.
This score indicates that Appsent provides analytics results in a
timely manner. Results were not very different across groups,
although the experienced group returned a higher score (3.7)
than non-experienced group (3.0). This suggests that, since the
experienced group had prior knowledge about the complexity
of text analytics, their expectations of the processing speed of
Appsent were lower than the non-experienced group. By
performing an overall analysis of the scores of the
questionnaires that related to RQ2, Appsent application was
regarded by the evaluators for its provision of helpful
functionalities (Mean = 85.4, Median = 93.8, Standard
Deviation of 17.1). Based on this overall score, and
notwithstanding the prototypical nature of Appsent, we believe
that analytics features of Appsent have been well designed and
Appsent's data analytics features provided user-friendly support
for the participants in understanding end-users’ opinions
present in the app-reviews.
RQ3. Does the developed app provide suitable
interpretative analytics on multiple levels?
The research question aims to interpret the actual meaning behind the scores submitted by participants while answering the questionnaires that were related to data analytics features of Appsent (refer Table V).We specifically requested that participants evaluate the sentiment analysis, emotion analysis, timeline analysis, and co-occurring analysis features that are provided by Appsent. According to the evaluation results, the sentiment analysis outcomes provided by Appsent was found to be 3.1 out of 4. This score indicated that the sentiment analysis functionality helped the participants to understand the features that were well received by Appsent’s end-users, and also those features that needed fixing. Evaluators that were experienced awarded a higher score (3.6) than the non-experienced group (2.5) for the sentiment analysis feature. A similar pattern was observed for the timeline analysis scores, where the experienced group graded Appsent higher (3.8) than the non-experienced group (3.0). These results indicate that the non-experienced participants had a higher expectation of Appsent sentiment analysis outcomes compared to experienced participants.
Participants’ evaluation of Appsent’s co-occurring features was 3.5 out of 4. From the group-based analysis, it was found that the average score of the co-occurrence analysis from the experienced group was relatively high (3.9 out of 4), compared to those of the non-experienced group, where the score was found to be 2.8 out of 4. This statistic for the experienced group was very close to the maximum score of 4. In fact, all participants stated that by knowing the defects/issues that were related to features helped them to gain a better understanding of end-users’ opinions, and hence co-occurrence analysis in
Appsent proved to be a strong data analytics feature. By analyzing the scores of all five questions that were aimed at answering RQ3, the average score was found to be 82 out of 100 (Median = 85.0 and Standard Deviation = 17.6). Based on this result, it may be inferred that Appsent application helped users to understand complex relationships between the entities of interest expressed by end-users. As highlighted in Section II, we have identified the gap where there was no co-occurrence analysis feature in the commercial applications available. This feature is innovative for any sentiment analysis app if users are to understand the relationships among end-users’ opinions, features or issues [20]. Thus, we believe that co-occurrence analysis is a robust data analytics approach that can help to extract meaningful insights from app-reviews.
VII. THREATS TO VALIDITY
We concede that there are limitations to the work that is
presented here. This project strongly focused on data
analytics, and thus Appsent was developed from that
perspective as a proof of concept that a mobile app would be
of utility as an analytics tool. To this end, we did not examine
multiple interface designs before finally settling on a specific
design. We acknowledge that the app (in it’s current format)
might have some usability limitations, as indicated by some
users during the evaluation phase. However, improvement of
Appsent’s usability features is planned for the future releases.
We also believe that there is scope to implement Appsent in a
PC environment where there would be more processing power
available and capacity for richer visualizations and overall
enhanced usability. We are engaging colleagues at another
New Zealand-based university with a view of implementing
such an interface.
Only one set of app-reviews was analyzed as a part of this
study, which may not provide a wide range of testing data for
Appsent. However, as the data contained over 50,000 reviews,
we believe that the data was adequate for the evaluations that
were performed. Also, there were only fifteen participants
present for the evaluation of Appent, which could potentially
affect the external reliability of the study. We also accept that
there is a possibility of the presence of miss-spelled features
and issues that might have affected the result of the stemming
operation in the text pre-processing stage. Lastly, the
sentiment analysis and emotion analysis techniques used in
this work may suffer from limitations, although these were
previously assessed as adequate by numerous experiments
(e.g., [6, 7]). On the likelihood that these techniques may not
always perform accurately, there is a possibility that some of
the features or issues could have been misclassified. This
aspect need further consideration, and particularly in
collaboration with our industry partners.
In this study, we have used a smartphone (LG Nexus 5)
that has good hardware specifications (at the time that the
study was conducted in May 2017). Hence, all the participants
reported Appsent’s data analytics and user interfacing
performance to be fast, consistent and smooth. That said, there
is scope to benchmark Appsent’s performance on other
devices with different hardware specifications.
VIII. CONCLUSION
On the premise that there are numerous text analytics apps, but these lack pertinent features, we have designed and developed a prototype that potentially address several gaps in such apps. Our tool, Appsent, runs on mobile devices and analyses end-users’ reviews logged about apps. We used text mining techniques and best practice design principles to provide a robust data analysis framework. By means of empirical evaluation, it was found that Appsent was successful in extracting knowledge of interest from app-reviews, and presented this knowledge in an understandable way through meaningful visualization methods. Appsent software may help providers (or developers) to quickly analyze users’ feedback to make rapid decisions in terms of product improvements. Appsent is composed of well-structured modules, and generates efficient data analytics results. These results of the analytics can be visualized in meaningful ways. From these results, the product developers may determine which end-user requirements need urgent attention and fixing. A distinguishing feature of Appsent is its provision of functionalities that allow users to examine the relationships (co-occurring terms) between features and associated issues, which helps with understanding interconnections between features and issues. Based on the evidence provided in this paper, we believe that Appsent could be further developed to provide powerful analytics in understanding users’ opinions in text reviews belonging to any domain, which could increase the response speed of product developers towards addressing end-users’ requirements.
REFERENCES
1. Clifford, C. By 2017, the App Market Will Be a $77 Billion Industry.
2017; Available from: https://www.entrepreneur.com/article/236832.
2. Statista, Number of apps available in leading app stores as of March 2017. 2017.
3. Statista. Smartphones - Statistics & Facts. 2017; Available from:
https://www.statista.com/topics/840/smartphones/. 4. Vasa, R., et al., A preliminary analysis of mobile app user reviews, in
Proceedings of the 24th Australian Computer-Human Interaction
Conference. 2012, ACM: Melbourne, Australia. p. 241-244. 5. Ghose, A. and P.G. Ipeirotis, Estimating the Helpfulness and Economic
Impact of Product Reviews: Mining Text and Reviewer Characteristics.
IEEE Transactions on Knowledge and Data Engineering, 2011. 23(10): p. 1498-1512.
6. Licorish, S., Lee, C., Savarimuthu, B., Patel, P., & MacDonell, S., They’ll
Know It When They See It: Analyzing Post-Release Feedback from the Android Community., in 21st Americas Conference on Information
Systems. 2015. p. 1-11. 7. Licorish, S.A., B.T.R. Savarimuthu, and S. Keertipati, Attributes that
Predict which Features to Fix: Lessons for App Store Mining, in
Proceedings of the 21st International Conference on Evaluation and Assessment in Software Engineering. 2017, ACM: Karlskrona, Sweden.
p. 108-117.
8. Fawareh, H.M.A., S. Jusoh, and W.R.S. Osman. Ambiguity in text mining. in 2008 International Conference on Computer and Communication
Engineering. 2008.
9. Keertipati, S., B.T.R. Savarimuthu, and S.A. Licorish, Approaches for prioritizing feature improvements extracted from app reviews, in
Proceedings of the 20th International Conference on Evaluation and
Assessment in Software Engineering. 2016, ACM: Limerick, Ireland. p. 1-6.
10. Popowich, F., Using text mining and natural language processing for
health care claims processing. SIGKDD Explor. Newsl., 2005. 7(1): p. 59-66.
11. Achimugu, P., A. Selamat, and R. Ibrahim. A Clustering Based Technique for Large Scale Prioritization during Requirements Elicitation. 2014.
Cham: Springer International Publishing.
12. Fu, B., et al., Why people hate your app: making sense of user feedback in a mobile app store, in Proceedings of the 19th ACM SIGKDD
international conference on Knowledge discovery and data mining. 2013,
ACM: Chicago, Illinois, USA. p. 1276-1284. 13. Iacob, C., R. Harrison, and S. Faily. Online Reviews as First Class
Artifacts in Mobile App Development. 2014. Cham: Springer International
Publishing. 14. Harman, W.M.F.S.Y.J.Y.Z.M., A Survey of App Store Analysis for
Software Engineering. IEEE Transactions on Software Engineering,
2016. 43(9): p. 817 - 847. 15. Liu, B., Sentiment Analysis and Subjectivity, in Handbook of Natural
Language Processing. 2010.
16. Romero, C. and S. Ventura, Educational Data Mining: A Review of the State of the Art. IEEE Transactions on Systems, Man, and Cybernetics,
Part C (Applications and Reviews), 2010. 40(6): p. 601-618.
17. Dave, K., S. Lawrence, and D.M. Pennock, Mining the peanut gallery: opinion extraction and semantic classification of product reviews, in
Proceedings of the 12th international conference on World Wide Web.
2003, ACM: Budapest, Hungary. p. 519-528. 18. Aggarwal, C., & Zhai, C., Mining Text Data. 2012: Springer Science
Business Media.
19. Iacob, C. and R. Harrison. Retrieving and analyzing mobile apps feature requests from online reviews. in 2013 10th Working Conference on
Mining Software Repositories (MSR). 2013. 20. Lee, C.W., et al. Augmenting Text Mining Approaches with Social
Network Analysis to Understand the Complex Relationships among
Users' Requests: A Case Study of the Android Operating System. in 2016 49th Hawaii International Conference on System Sciences (HICSS). 2016.
21. AppTrace. May 2017; Available from: http://www.apptrace.com.
22. AppFigures. May 2017; Available from: https://appfigures.com/. 23. Apptentive. May 2017; Available from: http://www.apptentive.com/.
24. SensorTower. May 2017; Available from: https://sensortower.com/.
25. Haddi, E., X. Liu, and Y. Shi, The Role of Text Pre-processing in Sentiment Analysis. Procedia Computer Science, 2013. 17: p. 26-32.
26. Stopwords. 2017; Available from: http://www.ranks.nl/stopwords.
27. Christopher, D., Manning., Prabhakar, R., & S.,H., Introduction to Information Retrieval. 1 ed.: Cambridge University Press.
28. Toutanova, K., et al., Feature-rich part-of-speech tagging with a cyclic
dependency network, in Proceedings of the 2003 Conference of the North American Chapter of the Association for Computational Linguistics on
Human Language Technology - Volume 1. 2003, Association for
Computational Linguistics: Edmonton, Canada. p. 173-180. 29. Standford NLP API. 2017; Available from: http://nlp.stanford.edu/.
30. Richard Socher, A.P., Jean Y. Wu, Jason Chuang, Christopher D.
Manning, Andrew Y. Ng and Christopher Potts. Deeply Moving: Deep Learning for Sentiment Analysis. 2017; Available from:
https://nlp.stanford.edu/sentiment/.
31. WordNet. 2017; Available from: https://wordnet.princeton.edu/. 32. Shneiderman, B., Designing the User Interface: Strategies for Effective
Human-Computer Interaction. 1997: Addison-Wesley Longman
Publishing Co., Inc. 639. 33. Android Studio. 2017; Available from:
https://developer.andriod.com/studio.
34. SQLite Database. 2017; Available from: https://www.sqlite.org. 35. Stanford CoreNLP 3.6.0. 2017; Available from:
http://stanfordnlp.github.io/CoreNLP.
36. Synesketch 2.0. 2017; Available from: http://krcadinac.com/synesketch/#download.
37. MPAndriodChart. 2017; Available from:
https://github.com/PhilJay/MPAndroidChart. 38. Runaway 2017; Available from: http://www.runawayplay.com/.
39. Ghazanfari, M., M. Jafari, and S. Rouhani, A tool to evaluate the business
intelligence of enterprise systems. Scientia Iranica, 2011. 18(6): p. 1579-1590.
40. Faraway, J.J., Practical Regression and ANOVA using R. 2002.
Top Related