


Languages
Pages
Legal


1
Staff Paper 2016
Applying Behavioural Economics in Irish Policy
October 2016
Karl Purcell
Irish Government Economic & Evaluation Service
Department of Public Expenditure and Reform
This paper has been prepared by IGEES staff in the Department of Public Expenditure & Reform. The views presented in this paper are those of the author alone and do not represent the official views of the Department of Public Expenditure and Reform or the Minister for Public Expenditure and Reform. The paper was prepared in the context of an on-going budget negotiation process and reflects the data available to the author at a given point in time.
2
Executive Summary
In 2014, DPER published a paper setting out the potential for Behavioural Economics in Ireland. Many
Departments have begun Behavioural Economic projects since then, and DPER continues to drive the
development of Behavioural Economics in Irish policy. This report provides examples of applications
of Behavioural Economics across a number of Government Departments as shown in Figure 1.1 below.
The DPER IGEES Unit is working with the Department of Social Protection and the Department of
Health on Randomised Control Trials (RCTs) as well as continuing to support other Departments
seeking to apply Behavioural Economics in their policy areas. The DPER IGEES Unit will continue to
progress the use Behavioural Economics in Ireland and is developing toolkits that will help guide
Departments through the initial phases of conducting a behavioural change project.
Of the 13 examples summarised in this paper some of the projects are tested using randomised control
trials, while others use behavioural findings or insights to inform delivery.
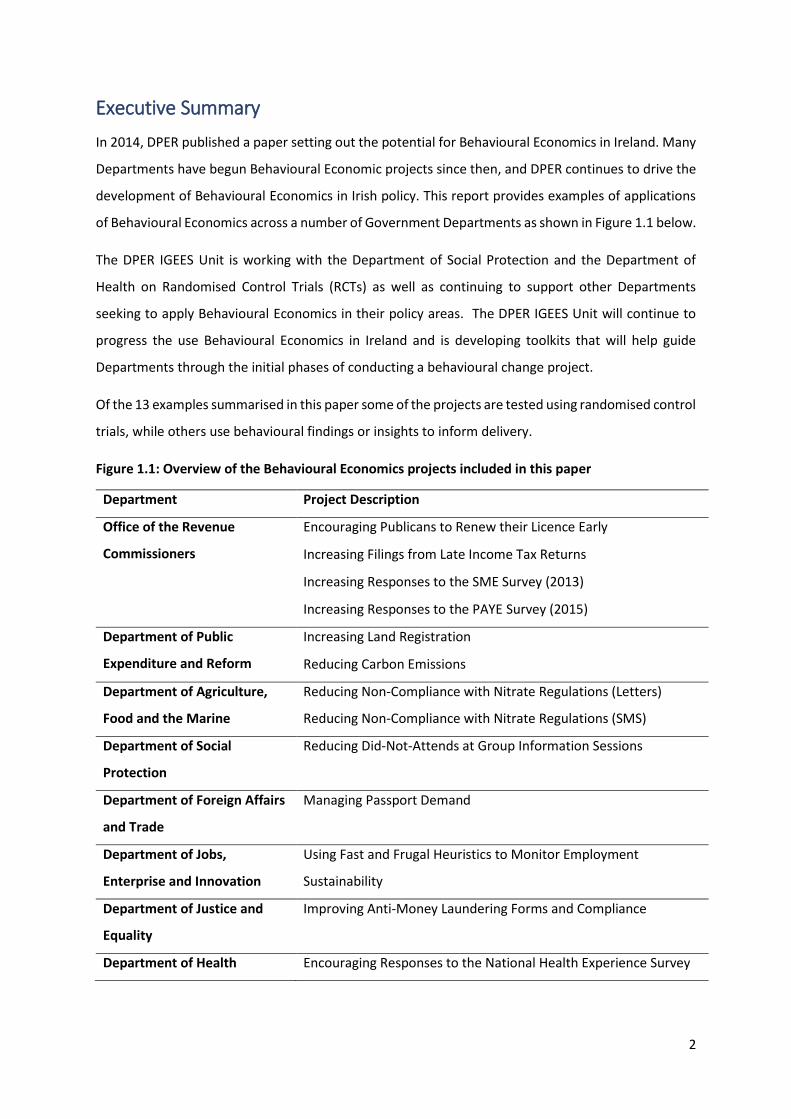
Figure 1.1: Overview of the Behavioural Economics projects included in this paper
Department Project Description
Office of the Revenue
Commissioners
Encouraging Publicans to Renew their Licence Early
Increasing Filings from Late Income Tax Returns
Increasing Responses to the SME Survey (2013)
Increasing Responses to the PAYE Survey (2015)
Department of Public
Expenditure and Reform
Increasing Land Registration
Reducing Carbon Emissions
Department of Agriculture,
Food and the Marine
Reducing Non-Compliance with Nitrate Regulations (Letters)
Reducing Non-Compliance with Nitrate Regulations (SMS)
Department of Social
Protection
Reducing Did-Not-Attends at Group Information Sessions
Department of Foreign Affairs
and Trade
Managing Passport Demand
Department of Jobs,
Enterprise and Innovation
Using Fast and Frugal Heuristics to Monitor Employment
Sustainability
Department of Justice and
Equality
Improving Anti-Money Laundering Forms and Compliance
Department of Health Encouraging Responses to the National Health Experience Survey
3
1. Introduction
In 2014, DPER published a paper setting out the potential for Behavioural Economics in Ireland. It set
out theoretical underpinnings, provided examples from Ireland and abroad, and set out how
Behavioural Economics can improve policy design, implementation, and improve operations.1 Many
Departments have begun Behavioural Economic projects since then and DPER continues to drive the
development of Behavioural Economics in Irish policy.
Section 2 of this report provides a summary of Behavioural Economic projects across a number of
Departments. A detailed overview of the application of Behavioural Economics will then be given for
two example projects, a trial run by the DPER IGEES Unit with the Department of Social Protection to
improve attendance at Group Information Sessions for jobseekers, and a trial carried out by the Office
of the Revenue Commissioners to increase responses to the 2013 survey of SME Taxpayers. Short
summaries will then be provided for 11 other Behavioural Economics projects which have been carried
out by a number of different Departments. Of the 13 examples summarised in this paper some of the
projects use randomised control trials, while others use behavioural findings or insights to inform
delivery.
While this report contains 13 example applications of Behavioural Economics across Government
Departments, it is important to note that detailed research is also being carried out by the ESRI on
behalf of the Central Bank of Ireland, Commission for Communications Regulation, Commission for
Energy Regulation, and the Competition and Consumer Protection Commission. The work of the PRICE
Lab2 in the ESRI has been investigating consumers’ ability to deal with complex products and the lab’s
research is likely to impact on regulatory policy in the future.
IGEES members across a number of Departments have been active in incorporating behavioural
insights and trialling in policy development and operations. IGEES is well-placed to act as a catalyst to
assist in the mainstreaming of Behavioural Economics given the intrinsic link to evidence-informed
policy making and the role of behavioural insights in improving efficiency and effectiveness.
1 Watts, L. (2014), Behavioural Economics, Comprehensive Review of Expenditure 2014, Available from: http://igees.gov.ie/wp-content/uploads/2013/10/Behavioural-Economics-1.pdf 2 PRICE stands for Programme of Research Investigating Consumer Evaluations

4
What is Behavioural Economics?
Behavioural Economics examines why people’s actions deviate from the predictions of standard
economic theory. Through a better understanding of people’s decision making, Behavioural
Economics provides for the better design, implementation, and targeting of public policy.
Behavioural Economics provides the opportunity to further a culture of evidence-informed policy
making in Ireland through testing and trialling; providing opportunities for innovation.
A key feature in Behavioural Economics is its empirical approach. Where possible, an intervention
is designed and tested (trialled) using counterfactual methods, preferably a randomised control
trial, to establish if the intervention is effective and to what degree. By testing the application of
behavioural insights, policymakers can robustly quantify the impact of the intervention and identify
ways to modify interventions to enhance their impact. The empirical approach of Behavioural
Economics is at the heart of the principles of evaluation embedded within IGEES.

5
2. Applications of Behavioural Economics in Irish Policy Making
Section 2 provides an overview of the application of Behavioural Economics across 8 Government
Departments. Detailed summaries are given for 2 example projects, a trial run by the DPER IGEES Unit
with the Department of Social Protection to improve attendance at Group Information Sessions for
jobseekers, and a trial carried out by the Office of the Revenue Commissioners to increase responses
to the 2013 survey of SME Taxpayers. Short summaries are then provided for 11 other Behavioural
Economics projects which have been carried out by a number of different Departments.
Department of Social Protection
Increasing Attendance at Group Information Sessions
Conducted by: The DPER IGEES Unit, the Statistics and Business Intelligence Unit, Dublin North
Division Intreo Offices, and West Division Intreo Offices
Background
Missed appointments are costly and inefficient. They create the need for follow-up with clients by
front line staff who could be working to deliver much needed services, lead to frustrating re-work, and
incur additional costs when letters are reissued. Perhaps more importantly, clients who miss their
appointments do not benefit from the service they were scheduled to receive. This may result in worse
outcomes for the client.
Group Information Sessions are the first point in a process of activation and engagement with
jobseekers in the Intreo Centres of the Department of Social Protection (DSP). In December 2015, the
Divisional Manager for Dublin North Intreo Centres approached the DPER IGEES Unit to investigate
and address the problem of high rates of did-not-attends (DNAs) among job seeking clients. Dublin
North Division had started to plan a behavioural change intervention to tackle the problem and
enlisted the assistance of the DPER IGEES Unit after learning of its availability to support its project.
On foot of a design being agreed for the behavioural insight trial between Dublin North and IGEES,
additional Intreo offices were enlisted from the west of Ireland. This was to ensure that any findings
from this project would generalise to the rest of the country and to speed up the data collection
process. DNA rates were relatively high in both the Dublin North and the West Division Centres, with
some Centres having DNA rates as high as 52 percent3.
3 Department of Social Protection, Intreo Office Administrative Data.
6
At Group Information Sessions, presentations are given to jobseekers after a client receives a decision
regarding their entitlement to a jobseekers payment. Group Information Sessions provide jobseekers
with information about the services they can avail of to help them find employment, find suitable
educational courses or opportunities for work experience. Attendance at these sessions is mandatory.
The first stage of interaction between Intreo and the client is critical and the letter of notification to
attend a Group Information Session is the first communication to the client to start them on their
journey back into the workforce. The sooner that engagement starts, the earlier their potential
participation in the active workforce.
The Dublin North Division invited the DPER IGEES Unit, along with the Statistics and Business
Intelligence Unit from DSP, to meet with representatives from each of the Intreo offices in the Dublin
North Division to discuss potential solutions to reduce the number of DNAs by applying principles from
Behavioural Economics. After reviewing the invite letter that was issued to clients for Group
Information Sessions, both groups agreed that a re-design of the letter should be evaluated. An RCT
was conducted to assess the effectiveness of the re-designed letters in reducing DNAs.
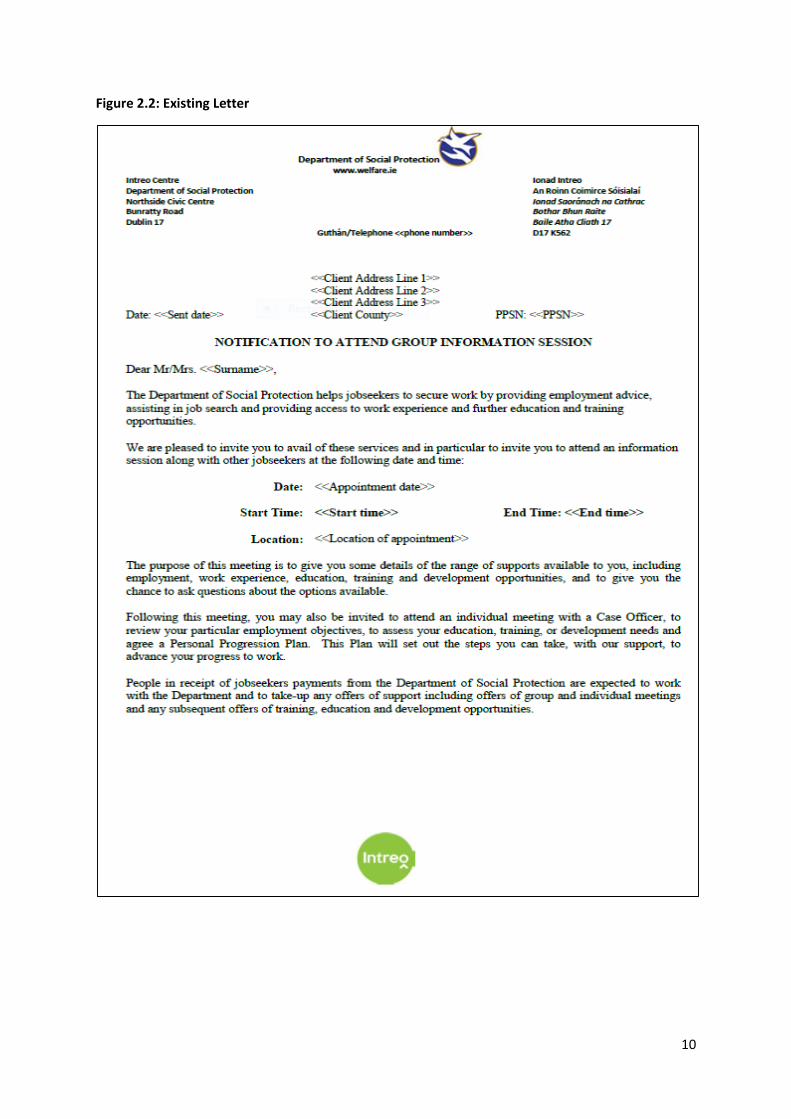
It was decided to trial two newly designed treatment letters against the original letter (control). The
two revised (treatment) letters and the original can be seen in Figure 2.2. Figure 2.1 highlights the
changes made to the letters and the evidence from the Behavioural Economics literature which
informed those changes.
Results and Learnings
While the results from this trial and the major learnings from this project will be published separately
at the start of 2017, it is important to recognise the efforts that have been made to design, resource,
and trial this behavioural change project. As Group Information Sessions are scheduled weekly, and
letters are only sent once the session has been scheduled, it was necessary to randomly assign
jobseekers to receive one of the letters each week. While invite letters for Group Information Sessions
are usually issued automatically to jobseekers, it was not possible to randomly assign jobseekers using
the existing invite system. This required staff in each of the Intreo Offices to follow a randomisation
procedure and manually create each batch of letters using mail merge. The DPER IGEES Unit would
like to acknowledge the considerable effort undertaken by these staff members to make this trial a
possibility.

7
This experience also proved valuable as a learning opportunity highlighting two points for
consideration:
1. When a Department is considering undertaking a behavioural change project involving an RCT,
the randomisation procedure’s compatibility with the operations of the relevant policy area
should be considered. Trials where all participants can be randomised at the one time, rather
than on a continual basis, will be easier to implement. A guide to choosing initial behaviour
change projects will be published on the IGEES website shortly.
2. Many IT systems are built to robustly perform a specific function. Often, it can be challenging
to make changes to these systems, and while automating processes can often help to improve
efficiency, it may limit the scope for testing changes to processes in the future. This
emphasises the importance of trialling before deciding on a final process or operation, as it
can be difficult to make changes once the system has been fully implemented. It should be
considered in the future whether Government websites and IT services should be specifically
designed to allow for testing of new communications/processes.
8
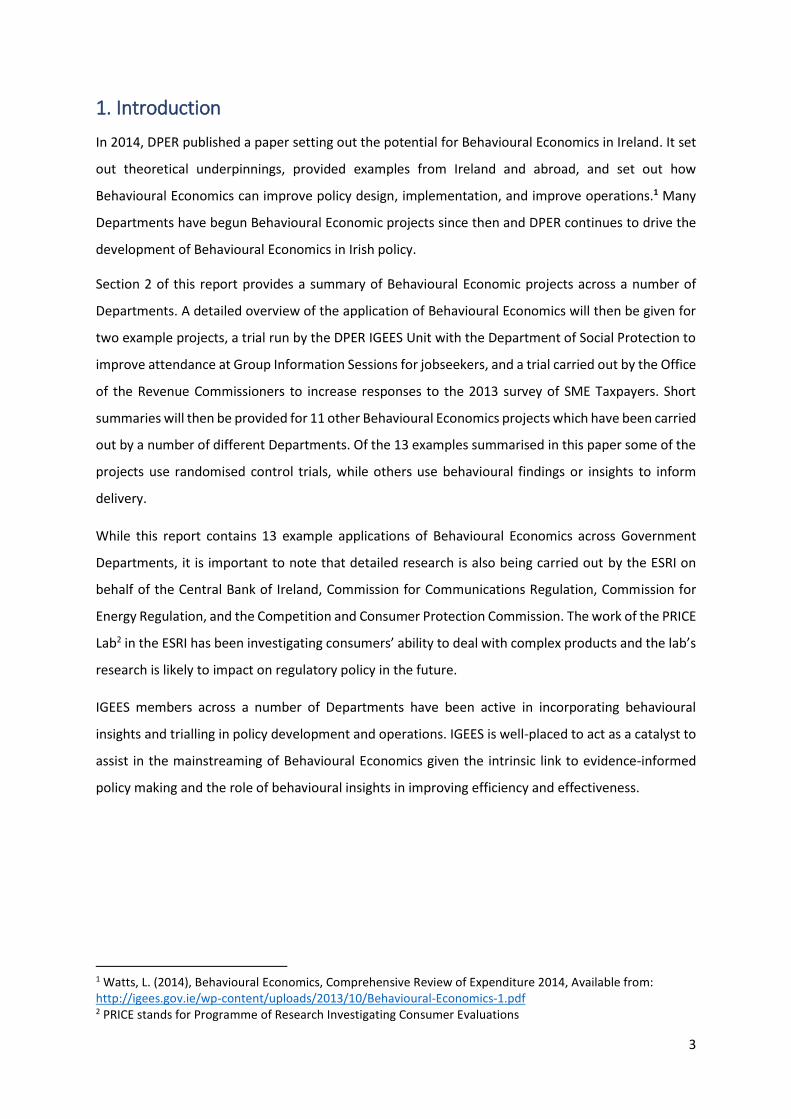
Figure 2.1: This table shows how Behavioural Insights based on existing evidence were applied to
the redesign of the letters.
Behavioural Design
Element
Message Formulation and Evidence Present in
Letter(s)
Personalisation Design: The client is addressed by their first name in the
opening line of the letter.
Evidence: Research has shown that people are more likely to
respond to communications utilising their first name.
2,3
Reciprocity Design: The client is told that the case officer has “booked
you a place in an Intreo jobseekers Information Session”.
Evidence: Previous studies have shown that people are more
likely to enact a behaviour when someone has already done
something for them.
2,3
Salience Design: By placing important pieces of information in boxes,
bolding important messages, and using simple pictures, the
client’s attention is drawn to important messages.
Evidence: People’s attention span is limited. Highlighting key
features using pictures and bolding can draw people’s
attention to important information quickly.
2,3
Simplification Design: The language within the letter has been simplified to
make the letter easier to read. Additionally, pictures have
been added to communicate key messages.
Evidence: Simplification is somewhat related to the fact that
people have a limited attention span or limited “cognitive
capacity”. Research has shown that the easier it is for people
to understand and process information, the more likely they
are to enact a behaviour. The use of pictures also helps to
convey information quickly and easily.
2,3

9
Timely
Prompt/Channelling
Effects
Design: The client is prompted at the end of the letter to
make contact if they cannot attend their scheduled
appointment. The phone number to call is provided directly
beside this prompt.
Evidence: It is likely that the client will be in a place where
he/she can make a phone call when reading the letter. By
placing the phone number beside the prompt, it makes it
easier for the client to enact the behaviour immediately.
2,3
Rule of Thirds Design: The layout of the third letter follows the rule of
thirds which states that if you divide the page into 9 equal
sections (3x3), the 3 parts of the document where the lines
intersect represent the sections which people’s eyes first
scan.
Evidence: By placing important information on the sections
of the page where people first look, it is more likely that they
will read the key information.
3
Observer Effect Design: The client is told “if you do not [contact us] we must
record this as a missed appointment which could affect your
payment”.
Evidence: Previous research by the BIT in the UK has shown
that this message was the most effective at reducing “did-
not-attends” in local hospitals. This is likely because people’s
behaviour changes when they feel like they are being
observed.
3
Experiential
Avoidance
Design: The word “group” has been removed from the letter.
Evidence: The use of the word group may make some people
feel uncomfortable by making them feel that they will be
forced to interact in group activities at the session. Research
has shown that people are likely to avoid situations that may
make them feel uncomfortable.
2,3
The data collection for this project is now complete. The data are currently being analysed and the
results of the intervention will be published in early 2017. In addition to the results of the trial, an
additional paper will be published highlighting learnings from the implementation of this trial, as well
as a technical paper detailing the analytical process.
10
Figure 2.2: Existing Letter

11
Figure 2.2 Existing Letter (Cont.)

12
Figure 2.2: Treatment Letter 1
Reciprocity:
“I have done this
for you, now please
do this for me” Personalisation:
Use of first name
personalises the
letter
Salience +
Simplification
Improving
readability
Salience:
Making benefits
clear
Social Norms
Timely Prompt:
Client likely near a
phone when reading
letter
Salience:
Making
consequences
salient to client

13
Figure 2.2: Treatment Letter 2
Personalisation:
Use of first name
personalises letter
Reciprocity:
“I have done this for you, now
please do this for me”
Appointment details
simplified, made salient,
and accessible
Rule of thirds:
Key Information has
been placed in the
areas where people’s
eyes check first
Social Norm
Salience and Accessibility:
The key benefits of attending have been
outlined clearly and are easy to read
clearly and quickly
Timely Prompt:
Client likely near a
phone when reading
letter
Observer Effect:
The BIT (UK) found this message to
be most effective in reducing “did-
not-attends” at the hospitals they
studied
14
The Office of the Revenue Commissioners
Using Personalised Post-it® Notes to Improve Survey Responses
Conducted by: The Office of the Revenue Commissioners
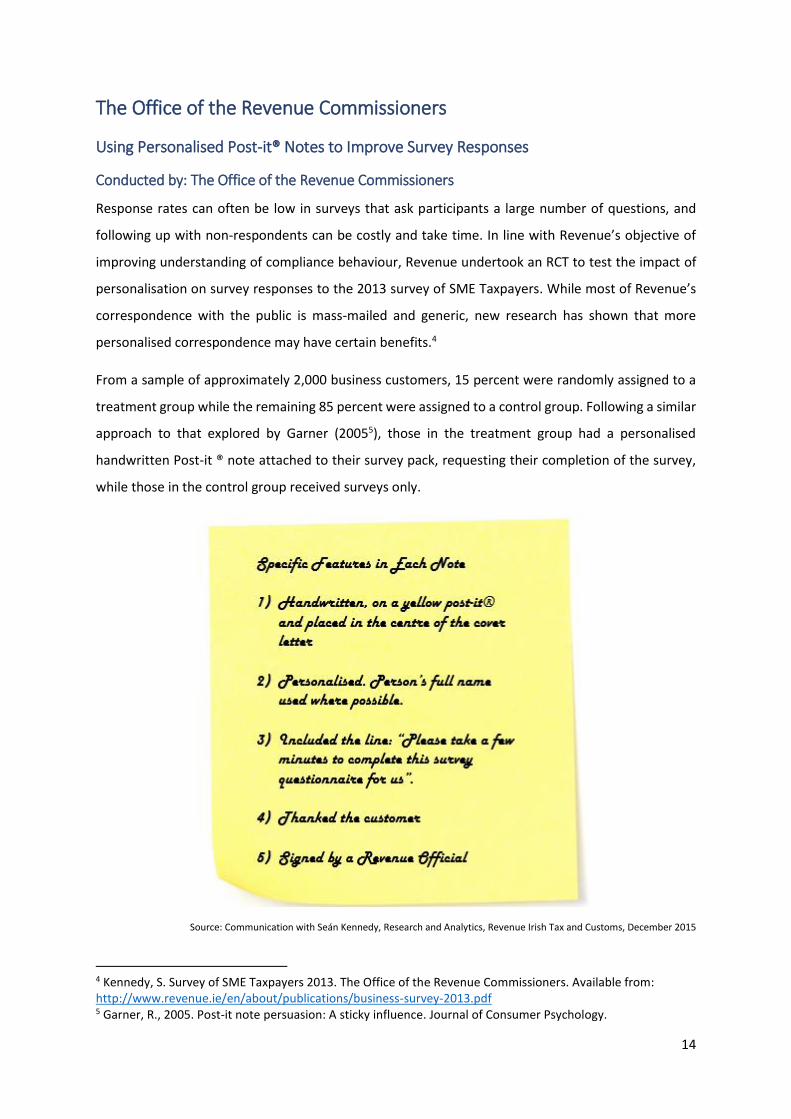
Response rates can often be low in surveys that ask participants a large number of questions, and
following up with non-respondents can be costly and take time. In line with Revenue’s objective of
improving understanding of compliance behaviour, Revenue undertook an RCT to test the impact of
personalisation on survey responses to the 2013 survey of SME Taxpayers. While most of Revenue’s
correspondence with the public is mass-mailed and generic, new research has shown that more
personalised correspondence may have certain benefits.4
From a sample of approximately 2,000 business customers, 15 percent were randomly assigned to a
treatment group while the remaining 85 percent were assigned to a control group. Following a similar
approach to that explored by Garner (20055), those in the treatment group had a personalised
handwritten Post-it ® note attached to their survey pack, requesting their completion of the survey,
while those in the control group received surveys only.
Source: Communication with Seán Kennedy, Research and Analytics, Revenue Irish Tax and Customs, December 2015
4 Kennedy, S. Survey of SME Taxpayers 2013. The Office of the Revenue Commissioners. Available from: http://www.revenue.ie/en/about/publications/business-survey-2013.pdf 5 Garner, R., 2005. Post-it note persuasion: A sticky influence. Journal of Consumer Psychology.
15
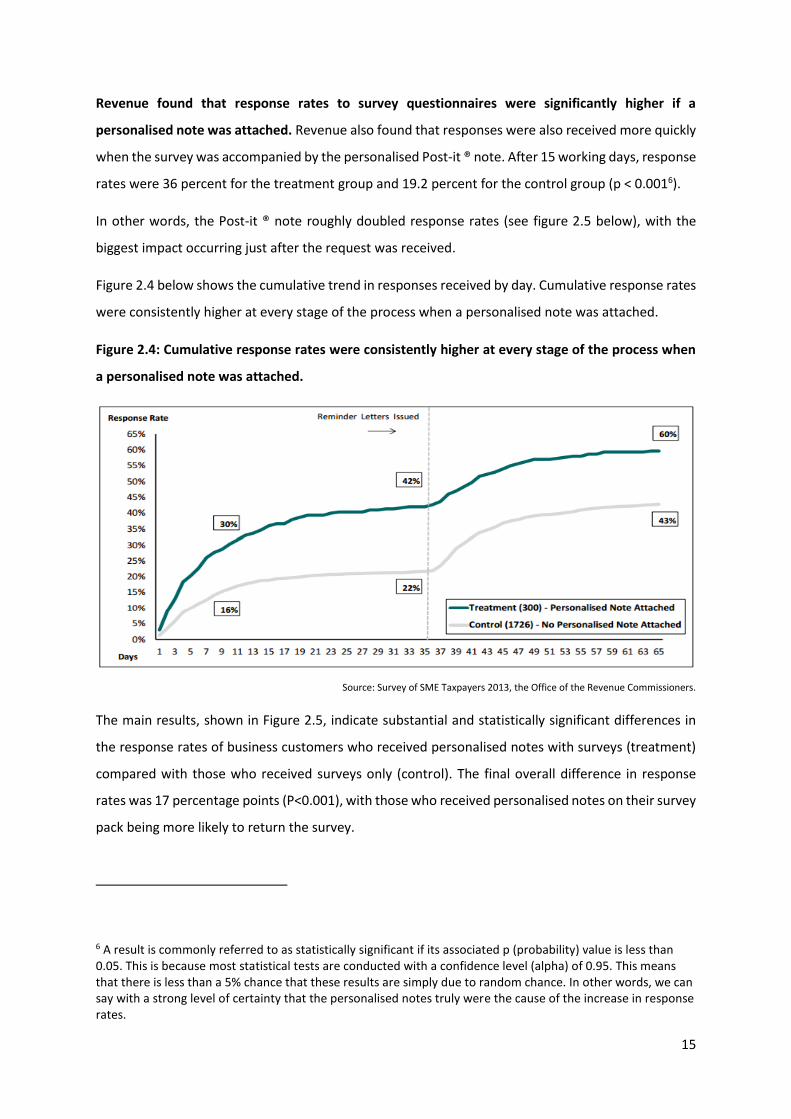
Revenue found that response rates to survey questionnaires were significantly higher if a
personalised note was attached. Revenue also found that responses were also received more quickly
when the survey was accompanied by the personalised Post-it ® note. After 15 working days, response
rates were 36 percent for the treatment group and 19.2 percent for the control group (p < 0.0016).
In other words, the Post-it ® note roughly doubled response rates (see figure 2.5 below), with the
biggest impact occurring just after the request was received.
Figure 2.4 below shows the cumulative trend in responses received by day. Cumulative response rates
were consistently higher at every stage of the process when a personalised note was attached.
Figure 2.4: Cumulative response rates were consistently higher at every stage of the process when
a personalised note was attached.
Source: Survey of SME Taxpayers 2013, the Office of the Revenue Commissioners.
The main results, shown in Figure 2.5, indicate substantial and statistically significant differences in
the response rates of business customers who received personalised notes with surveys (treatment)
compared with those who received surveys only (control). The final overall difference in response
rates was 17 percentage points (P<0.001), with those who received personalised notes on their survey
pack being more likely to return the survey.
6 A result is commonly referred to as statistically significant if its associated p (probability) value is less than 0.05. This is because most statistical tests are conducted with a confidence level (alpha) of 0.95. This means that there is less than a 5% chance that these results are simply due to random chance. In other words, we can say with a strong level of certainty that the personalised notes truly were the cause of the increase in response rates.

16
Figure 2.5 Survey Response Rate
Source: Produced using data from the Annual SME Survey 2013 by the Revenue Commissioners
Revenue also undertook two additional experiments in the reminder letter which was sent to non-
respondents 35 days after the original survey pack was sent. Revenue sent out three distinct batches
of reminder letters to those who did not respond to the first request to complete the survey. Revenue
tested the effect of personalisation (“Dear Mr O’Connor”7) and social norms (“Most businesses in your
area have completed and returned this survey8”) against a standard (control) reminder letter.
However, the results from these experiments showed no statistically significant differences in the
response rates. This may be because the non-responding cohort was systematically different in terms
of its average propensity to respond9.
7 This example is only illustrative and is not the actual personalisation used by Revenue as part of this trial. 8 This example is only illustrative and is not the actual social norm message used by Revenue as part of this trial. 9 Kennedy, S. Survey of SME Taxpayers 2013. The Office of the Revenue Commissioners. Available from: http://www.revenue.ie/en/about/publications/business-survey-2013.pdf
17
Department of Public Expenditure and Reform
Applying Behavioural Economics to Tackle Climate Change Emissions
Conducted by: Climate Change Expenditure Evaluation Unit with assistance from DPER IGEES
Unit
Ireland’s EU target for 2020 is to reduce greenhouse gas emissions from the non-Emissions Trading
Scheme (non-ETS) sector by 20% on 2005 levels. The non-ETS sector covers emissions from agriculture,
transport, residential, commercial, non-energy intensive industry and waste sectors. New obligations
for Ireland to reduce greenhouse gas emissions for the years 2021-2030 are currently being negotiated
at EU level.
The most recent Environmental Protection Agency (EPA) projection estimate is that by 2020 non-ETS
emissions will be 6% below 2005 levels (in a with-measures scenario) compared to the 20% reduction
target for 2020. Emission trends from agriculture and transport are key determinants in meeting
targets, however emissions from both sectors are projected to increase in the period to 2020
according to the EPA10.
The Climate Change Expenditure Evaluation Unit (CCEEU) in DPER has been developing a series of
papers, with the assistance of the DPER IGEES Unit, identifying opportunities for applying Behavioural
Economics to the transport, energy, and agriculture sectors which may assist in reducing emissions.
The papers examine the possible behavioural biases that are making it difficult to encourage more
environmentally sustainable behaviours in each of the three areas.
The CCEEU is undertaking a preliminary examination of innovative ideas emerging in the field of
Behavioural Economics which may assist Government Departments in the design of policies, measures
or regulations, having regard to the climate change and energy agenda, and Ireland’s associated
targets. The CCEEU has reviewed, for example, how messaging can be used to draw attention to the
connection that exists between the consumption of fossil fuels in transport and climate change.
Examples of this includey making the impacts of climate change more salient to consumers at the
point of consumption (petrol pumps) and prompting people to employ more eco-friendly driving
behaviours. The papers also highlight a number of potential applications of Behavioural Economics to
encourage people to switch to more sustainable modes of transportation to support a reduction of
emissions in the transport sector.
10 EPA - Greenhouse Gas Emission Projections to 2020 – An update: (2016). Available from: http://www.epa.ie/pubs/reports/air/airemissions/2020_GHG_Projections_2016_Bulletin.pdf

18
Improving Land Registration at the Property Registration Authority
Conducted by: Members of the Graduate Development Programme with assistance from DPER
IGEES Unit and the Property Registration Authority of Ireland
As part of the 2016 Civil Service Graduate Development Programme for new Administrative Officers
in the Civil Service, participants were asked to complete a project that would provide Departments or
Government agencies with an actionable implementation plan to solve a problem faced by the
Department/agency. A project to apply Behavioural Economics to improve land registration at the
Property Registration Authority of Ireland (PRAI) was undertaken and completed by a group taking
part in the Graduate Development Programme, with assistance from the DPER IGEES Unit.
While the Irish land registry is largely completed, with 93 percent of land in Ireland currently
registered, the PRAI, as part of its Strategic Plan, have set the goal of completing the Land Registry to
register all land in Ireland. Completing the land register at current levels of registration, would take a
further 30-35 years and would delay the benefits that could arise from introducing e-conveyancing
and hinder property law reform.
The benefits for the land owner to register with the PRAI include protection against fraud; allows the
landowner to raise finance using their property as collateral; and makes future sales of the property
more efficient. However, there are also a number of barriers to registration:
some property owners may not be aware of the land registration process and the benefits it
can provide;
there is no legal obligation to register land unless a conveyance on sale is involved; and
there can be costs involved and the registration process can take between 6 and 12 months.
Registering land has, up to now, required a prompt (e.g. a compulsion brought on by a bank’s
conditions, conveyance of sale, etc.).
A number of behavioural biases were identified that might deter registration. These biases are
presented below in figure 2.6.

19
Figure 2.6: Behavioural biases impacting people’s decision to register their land with the PRAI
Behavioural Bias Description Implications
Present Bias Immediate effects are often given
too much weight while future
impacts are often undervalued11.
People delay registration as the costs of
registration are borne immediately, while the
benefits are realised in the future.
Procrastination Procrastination, is the
(temporary) behavioural
avoidance of an undesirable
activity12.
People may delay property registration as they
perceive it to be a lengthy and complex process,
especially since there is often no penalty for
delaying this process.
Mental
Accounting
People perceive money
differently depending on its origin
and intended use13.
Convincing people to part with money that they do
not associate with the land they hold may prove
difficult.
Perceived
Complexity and
Uncertainty
People’s perception of the
complexity of a process influences
their decision more than the
actual complexity involved.
Given the necessity for a solicitor to navigate the
registration process, people’s perception of the
process is that it is complex, when in fact most
applications do not require further revisions.
Loss
Aversion/Status
Quo Bias
People dislike losses more than
they value gains of an equal
amount. Where there is a risk of
loss, people are averse to making
a decision which changes their
circumstances14.
Though the vast majority of title is good title,
owners may hold the belief that in some way they
will incur difficulties in processing their application
or that a worst case scenario (where title is not
granted to them or is contested) might materialise.
11 O’Donoghue, T., Rabin, M. (1999). Doing it now or later. American Economic Review, 89(1), pp 103-124. 12 Behavioural Insights Team (2015), Applying Behavioural Insights to Encourage Earlier Engagement from Borrowers in Mortgage Arrears, pp16-17. Available online from http://housingrights.org.uk/news/behavioural-insights-team-report 13 Samson,A. (2016) Mini Encyclopedia of Behavioural Economics. Available from: https://www.behavioraleconomics.com/mini-encyclopedia-of-be/mental-accounting/ 14 Kahneman, D., Knetsch, J.L. and Thaler, R.H., (1991). The endowment effect, loss aversion, and status quo bias. Journal of Economic Perspectives.
20
The project group provided a number of recommendations to the PRAI that could be trialled to
increase property registration. These recommendations included:
Using a targeted communication plan on a focused set of land holders. This approach should
include short letters using plain English. All communications should have action points and
should be aided by personalisation;
Launching a general awareness campaign which would give the PRAI an opportunity to
encourage people to be part of the “norm” by registering land using messages like “93 percent
of people have registered their land with the PRAI”;
Creating a simple webpage dedicated to first time registrations outlining in plain English the
steps for first time registration;
Moving all first time registrations online to simplify the procedure and ensure errors on the
application form are reduced; and
Changing the fees structure to offer a strong incentive to encourage first time registrations. A
time bound offer may be particularly effective.
The report has been supplied to the PRAI who are considering its recommendations.

21
Department of Justice and Equality
As part of their commitment to drive evidence based policy making through the use of Behavioural
Economics, Department of Justice and Equality (DJE) have included Behavioural Economics in their
Communications Strategy for 2016 to 2018, ’Communicating Change’15. This will include the
“establishment of [a] Behavioural Economics Initiative” to “promote the importance of staff
engagement, and the sharing of information, knowledge and expertise”.
Increasing Compliance with Anti-Money Laundering Regulations
Conducted by: The DJE IGEES Unit with input from the DPER IGEES Unit
In 2010, the DJE introduced legislation, the Criminal Justice (Money Laundering and Terrorist
Financing) Act 2010 as amended by the Criminal Justice Act 2013, stating that certain businesses
dealing with the administrative aspects of forming a company must comply with additional
background checks and provide additional information about their operations in an effort to combat
money laundering.
The IGEES Unit within DJE have recently undertaken a behaviourally informed initiative to increase
compliance with anti-money laundering regulations by improving the design of the forms used to
collect information from firms.
Due to the small number of firms involved (~150) and how the form is currently hosted on the DJE’s
website, it was not feasible to test the effectiveness of the improvements to the forms through an
RCT. The project is considered a behaviourally informed initiative because the project was designed
explicitly on previously existing behavioural evidence.
Companies that fall under the remit of the legislation are obliged to fill out two forms. Companies
must complete a “Fit and Proper” form and a “Company Application” form. Members of staff from the
Anti-Money Laundering Unit (AMLU) had highlighted that a significant number of forms were returned
incomplete and/or late. Staff from the AMLU highlighted a number of areas on the forms that seemed
to be the most problematic for companies.
The IGEES Unit in DJE reviewed the forms and made a number of changes based on comments from
staff members, a review of previously submitted forms, and Behavioural Economics’ principles. Figure
2.7 shows how principles from Behavioural Economics informed the redesign of the forms.
15 Communicating Change: Communications Strategy 2016-2018. (2016) Department of Justice and Equality. Available from: http://www.justice.ie/en/JELR/Communicating-Change-Communications-Strategy-2016-2018.pdf/Files/Communicating-Change-Communications-Strategy-2016-2018.pdf
22
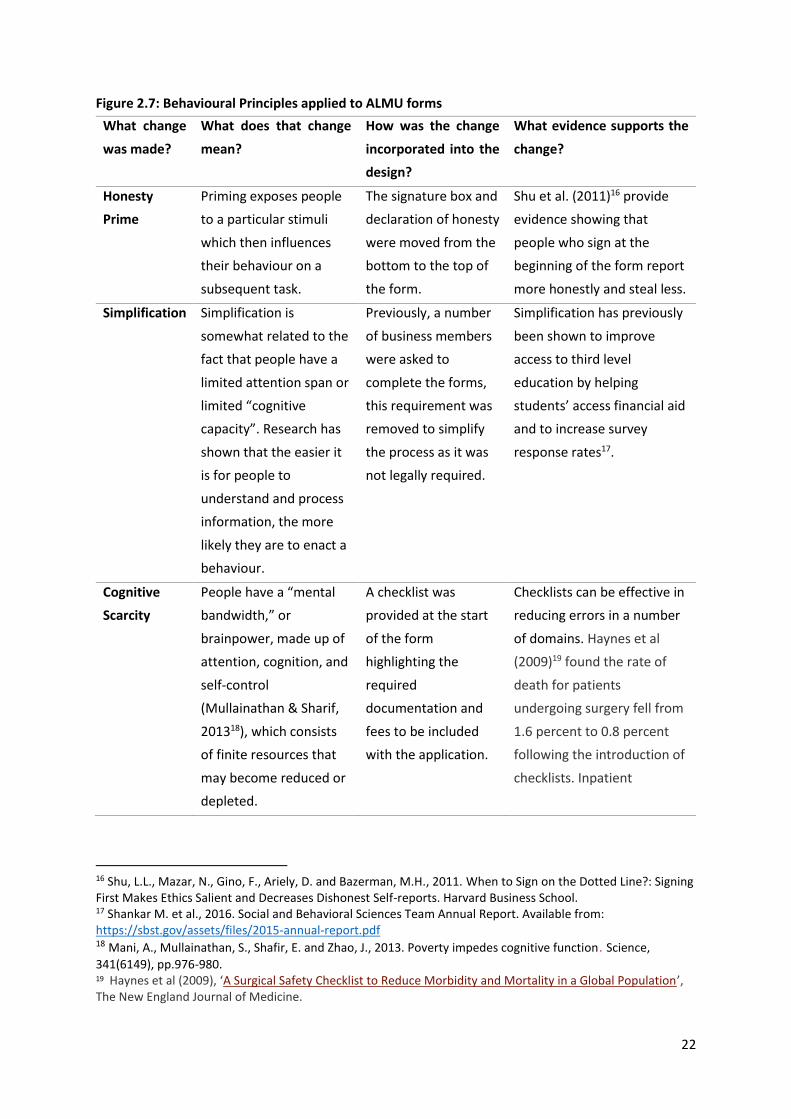
Figure 2.7: Behavioural Principles applied to ALMU forms
What change
was made?
What does that change
mean?
How was the change
incorporated into the
design?
What evidence supports the
change?
Honesty
Prime
Priming exposes people
to a particular stimuli
which then influences
their behaviour on a
subsequent task.
The signature box and
declaration of honesty
were moved from the
bottom to the top of
the form.
Shu et al. (2011)16 provide
evidence showing that
people who sign at the
beginning of the form report
more honestly and steal less.
Simplification
Simplification is
somewhat related to the
fact that people have a
limited attention span or
limited “cognitive
capacity”. Research has
shown that the easier it
is for people to
understand and process
information, the more
likely they are to enact a
behaviour.
Previously, a number
of business members
were asked to
complete the forms,
this requirement was
removed to simplify
the process as it was
not legally required.
Simplification has previously
been shown to improve
access to third level
education by helping
students’ access financial aid
and to increase survey
response rates17.
Cognitive
Scarcity
People have a “mental
bandwidth,” or
brainpower, made up of
attention, cognition, and
self-control
(Mullainathan & Sharif,
201318), which consists
of finite resources that
may become reduced or
depleted.
A checklist was
provided at the start
of the form
highlighting the
required
documentation and
fees to be included
with the application.
Checklists can be effective in
reducing errors in a number
of domains. Haynes et al
(2009)19 found the rate of
death for patients
undergoing surgery fell from
1.6 percent to 0.8 percent
following the introduction of
checklists. Inpatient
16 Shu, L.L., Mazar, N., Gino, F., Ariely, D. and Bazerman, M.H., 2011. When to Sign on the Dotted Line?: Signing First Makes Ethics Salient and Decreases Dishonest Self-reports. Harvard Business School. 17 Shankar M. et al., 2016. Social and Behavioral Sciences Team Annual Report. Available from: https://sbst.gov/assets/files/2015-annual-report.pdf 18 Mani, A., Mullainathan, S., Shafir, E. and Zhao, J., 2013. Poverty impedes cognitive function. Science,
341(6149), pp.976-980. 19 Haynes et al (2009), ‘A Surgical Safety Checklist to Reduce Morbidity and Mortality in a Global Population’, The New England Journal of Medicine.
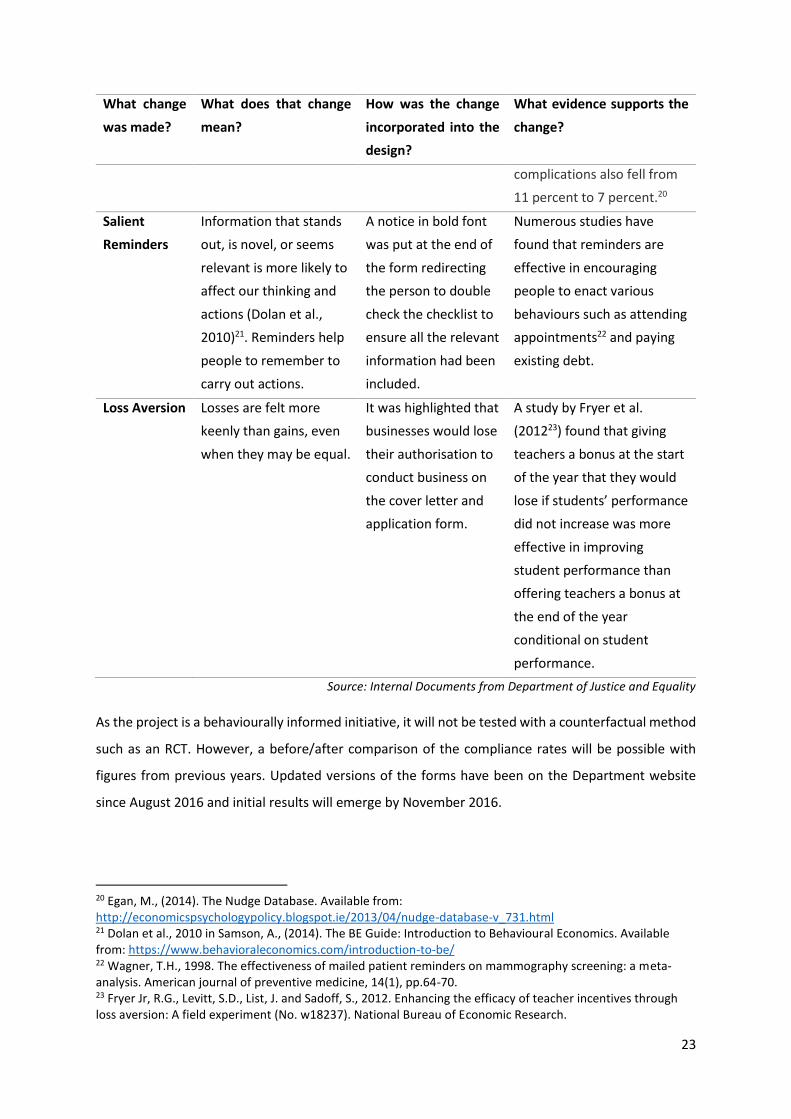
23
What change
was made?
What does that change
mean?
How was the change
incorporated into the
design?
What evidence supports the
change?
complications also fell from
11 percent to 7 percent.20
Salient
Reminders
Information that stands
out, is novel, or seems
relevant is more likely to
affect our thinking and
actions (Dolan et al.,
2010)21. Reminders help
people to remember to
carry out actions.
A notice in bold font
was put at the end of
the form redirecting
the person to double
check the checklist to
ensure all the relevant
information had been
included.
Numerous studies have
found that reminders are
effective in encouraging
people to enact various
behaviours such as attending
appointments22 and paying
existing debt.
Loss Aversion Losses are felt more
keenly than gains, even
when they may be equal.
It was highlighted that
businesses would lose
their authorisation to
conduct business on
the cover letter and
application form.
A study by Fryer et al.
(201223) found that giving
teachers a bonus at the start
of the year that they would
lose if students’ performance
did not increase was more
effective in improving
student performance than
offering teachers a bonus at
the end of the year
conditional on student
performance.
Source: Internal Documents from Department of Justice and Equality
As the project is a behaviourally informed initiative, it will not be tested with a counterfactual method
such as an RCT. However, a before/after comparison of the compliance rates will be possible with
figures from previous years. Updated versions of the forms have been on the Department website
since August 2016 and initial results will emerge by November 2016.
20 Egan, M., (2014). The Nudge Database. Available from: http://economicspsychologypolicy.blogspot.ie/2013/04/nudge-database-v_731.html 21 Dolan et al., 2010 in Samson, A., (2014). The BE Guide: Introduction to Behavioural Economics. Available from: https://www.behavioraleconomics.com/introduction-to-be/ 22 Wagner, T.H., 1998. The effectiveness of mailed patient reminders on mammography screening: a meta-analysis. American journal of preventive medicine, 14(1), pp.64-70. 23 Fryer Jr, R.G., Levitt, S.D., List, J. and Sadoff, S., 2012. Enhancing the efficacy of teacher incentives through loss aversion: A field experiment (No. w18237). National Bureau of Economic Research.
24
Department of Health
Using Behavioural Insights to Encourage Responses to the First National Patient
Experience Survey (NPES)
Conducted by the DoH Research Services Unit and the DPER IGGES Unit on behalf of the National
Patient Experience Programme
The National Patient Experience Survey Programme (NPES) is a joint partnership programme between
the Department of Health (DoH), the Health Information and Quality Authority (HIQA) and the Health
Service Executive (HSE). It has been established to put in place a model, develop a methodology, and
implement a national patient experience survey programme. The first NPES will take place in 2017 to
learn more about patient experiences in acute care hospitals.
Response rates can often be low in surveys that ask participants a large number of questions, and
especially in surveys which ask respondents about personal details, such as their health status.24
Following up with non-respondents to encourage them to complete surveys can be costly and time
consuming. The NPES Programme has decided to trial an intervention to increase survey responses to
the NPES.
The DPER IGEES Unit is working with the Research Services Unit in the DoH to design an intervention
that will be trialled with an RCT to identify methods for increasing response rates to the NPES. These
methods can be included and improved upon in future versions of the survey under the NPE
Programme.
Designing the Intervention
A work programme to undertake the trial has been designed by the Research Services Unit in the DoH
with input from the DPER IGEES Unit, see figure 2.8. As well as providing an advisory role throughout
the process the DPER IGEES Unit will have a significant input into identifying the behavioural design
principles and elements to be considered; designing a set of behaviourally informed candidate invites;
and developing a guidance note for staff involved in the invitation process on risks to randomisation
and how to minimise risks.
24 Edwards, P., Roberts, I., Clarke, M., DiGuiseppi, C., Pratap, S., Wentz, R. and Kwan, I., 2002. Increasing response rates to postal questionnaires: systematic review. Bmj, 324(7347), p.1183.
25
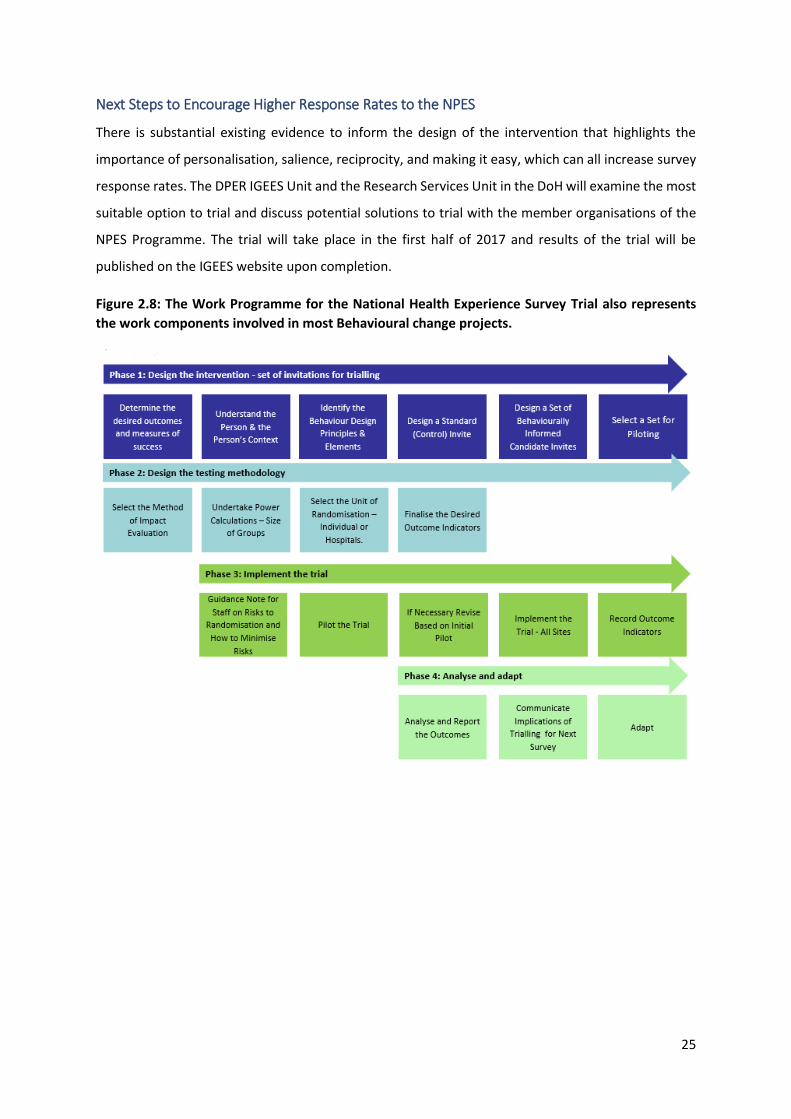
Next Steps to Encourage Higher Response Rates to the NPES
There is substantial existing evidence to inform the design of the intervention that highlights the
importance of personalisation, salience, reciprocity, and making it easy, which can all increase survey
response rates. The DPER IGEES Unit and the Research Services Unit in the DoH will examine the most
suitable option to trial and discuss potential solutions to trial with the member organisations of the
NPES Programme. The trial will take place in the first half of 2017 and results of the trial will be
published on the IGEES website upon completion.
Figure 2.8: The Work Programme for the National Health Experience Survey Trial also represents
the work components involved in most Behavioural change projects.

26
Department of Foreign Affairs and Trade
Managing Demand at the Passport Service
Conducted by: The DPER IGEES Unit, the Passport Service, and the Department of Foreign Affairs
and Trade Evaluation & Audit Unit.
The DPER IGEES Unit has been working with the Passport Service and the Department of Foreign
Affairs and Trade (D/FAT) to tackle problems related to seasonal trends and sudden increases in
demand for passports.
Many Public Services are subject to seasonal demand. Hospital services often experience surges in
demand in the winter months when temperatures drop. Unemployment services regularly see
increases in demand after the summer period when seasonal workers who work in the tourism
industries become seasonally unemployed. Seasonal demand can create problems for delivering
efficient Public Services as different levels of staff are required at different periods during the year. It
is especially troublesome when it is difficult to predict the level of increase in demand in busy periods.
While “peaky” seasonal demand can create problems in delivering Public Services generally, it is a
particularly pronounced problem for the Passport Service. The combination of a rigid renewal cycle
and the strong seasonal nature of passport demand create large peaks of demand for passports each
year. The change in demand from the quietest period to the busiest period each year is quite large
making it difficult to ensure an optimal level of staffing.
For example, if the Passport Service was to hire too few temporary staff to deal with peak levels of
demand, citizens may experience long delays in their passport application/renewal process. This can
be especially problematic when citizens are renewing passports ahead of an upcoming
holiday/business trip. Alternatively, if the Passport Service hires too many staff, it may waste public
resources. There are three potential solutions to this problem:
A) Generate accurate predictions of passport demand far enough in the future to give sufficient
time to hire additional temporary staff or;
B) Change people’s behaviour to renew/apply for passports during less busy periods of the year
to smooth demand so that an efficient constant level of staffing can be maintained; or
C) A combination of both measures.
This project is an excellent example of the strengths and limitations of behaviourally informed
interventions. Behavioural Economics can provide insights into the reasons why people may delay
renewing their passports and offer solutions to encourage some of those people to renew at quieter

27
times of the year. However, it is unlikely that this problem could be solved entirely by the use of
Behavioural Economics alone. It is likely that a combination of accurate forecasting, behaviourally
informed communications, incentives, and administrative measures would be required to tackle this
problem.
Changing Passport Applicants’ Behaviour
As explained above, the combination of a rigid renewal cycle and the strong seasonal nature of
passport demand create large peaks of demand for passports each year.
Due to international restrictions, the maximum period of validity for a passport is 10 years. All
applicants between the ages of the age of 3 and 17 may only be granted a passport with maximum
period of validity of 5 years. All applicants aged 3 or under may only be granted with a passport with
a maximum validity of 3 years. However, it should be noted that 3 year passports will be phased out
in the next few years. This creates a rigid renewal cycle where people only renew their passport every
3, 5 or 10 years. Additionally, the date of renewal for a passport is the date the passport was issued
plus 3, 5 or 10 years.
For example, if you renew/apply for a passport on July 1 2016 and are issued a passport on July 10
2016, your passport will be due for renewal on July 9 2026. This means that the cycle of strong seasonal
demand in the summer months is perpetuated into the future as large amounts of passports come up
for renewal during peak travel times. The problem is further compounded by the fact that people
whose passport expires during quieter months like December, are likely to wait until the summer
months to apply for a passport when they need it to travel abroad for holidays. These people now
receive a passport with a renewal date during the peak travel season in 10 years’ time adding to the
demand for passports during an already likely busy period.
There is a clear need to identify possible solutions to help shift the demand for passports from peak
summer months to less busy periods of the year. As part of the DPER IGEES Unit’s work with the
Passport Service, the Unit looked at some of the potential behavioural biases that may cause people
to defer their renewal to later than the validity of their passport and identified some potential
solutions to encourage people to renew their passport at different times of the year.
Loss Aversion, Status Quo Bias and Present Bias
Loss aversion refers to the observed phenomenon that people prefer to avoid losses than acquiring
gains. People are prone to avoid changing their behaviour if that change could potentially lead to a
loss, even if there are potential significant gains available to them by changing their behaviour. This is
commonly referred to as “status quo” bias. It is likely that people may be reluctant to renew their

28
passport before its expiration date, even if there are benefits for the State and the individual, as
passport holders feel as though they are losing value from their passport by renewing early.
A possible solution to these problems may be to enter applicants who renew at non-peak periods into
a lottery for a prize. Lotteries can be an effective and low cost method of encouraging a desired
behaviour, as people overestimate their chances of winning.
To tackle the problem of repeated peak periods of demand due to the rigidity of renewal criteria,
passport renewal dates could be changed to not renew exactly every ten years, but instead renew
based on some other criteria not linked to seasonal trends. The DPER IGEES Unit plan to continue
working with the Passport Service to identify possible criteria on which to base renewal.
Complexity, Present Bias and Procrastination
Further complicating the problem, present bias explains that people place stronger importance on
immediate consequences compared to those in the future. People may not renew their passport
before its expiry date as the immediate costs of applying in terms of hassle, and financial cost, may
outweigh the potential future costs of having to pay for an expedited passport or missing a holiday.
Samuelson & Zeckhauser (200925) highlight that people are more likely to put off making decisions or
taking action as the complexity of the task increases. The current process of applying for a passport,
while simplified considerably in recent years, may be perceived to be complex as there are a number
of unconnected steps, such as having your identity verified in a local Garda station, involved in
applying for/renewing a passport.
The Passport Service are currently focusing on developing a new website which will allow for online
applications. The DPER IGEES Unit intends to work closely with the Passport Service on the design of
the site advising methods for reducing the impact of behavioural barriers on people’s applications.
Social Norms and Expectations
Other people’s behaviour influences our behaviour. People often act as others do and our
expectations are informed by the results of other people’s actions. Social norms play a large part in
decision making and can strongly influence people’s expectations and perception. The majority of
people wait until the peak travel season to apply for/renew their passport. There is a clear social norm
relating to passports, in that people tend to wait until the last minute to apply for their passport. In
addition, people expect the Passport Service to provide passports in a short amount of time when
they need them. This expectation has likely been formed by a combination of the existing social norm,
25 Samuelson, W., & Zeckhauser, R. J. (1988). Status quo bias in decision making. Journal of Risk and Uncertainty, 1, 7-59.

29
the unintended consequences of the branding of Passport Express, and messaging on the Passport
Service’s website that emphasises quick turnaround times despite smaller notes highlighting that the
process can take up to six weeks.
Challenging existing norms around passport applications is likely to be a difficult task. It may be
worthwhile to trial different messaging on the Passport Service’s website highlighting the cost of
processing large amounts of applications during the summer months to the taxpayer. A targeted
information campaign may also help to tackle this perception.
Cognitive Scarcity
People have a “mental bandwidth,” or brainpower, made up of attention, cognition, and self-control
(Mullainathan & Shafir, 201326), which consists of finite resources that may become reduced or
depleted. More simply put, people often have a lot on their minds and may not regularly check their
passport if they do not travel often, making it difficult for them to know when their passport expires.
It is possible that a simple reminder, sent to the passport holder in advance of their expiry date, may
increase the likelihood that the person will renew their passport before it expires.
The Passport Service currently offers an email based passport reminder service, however the service
is currently only available on an opt-in basis and currently sends reminders six months before the
expiration date of the passport. In developing the new Passport Service website, the Passport Service
plans to change the default to opt-out for this reminder to increase the number of people eligible to
receive a reminder. This change will be implemented in phase 2 of the online application process
which is currently scheduled to take place in Quarter 4 of 2018.
Next Steps in Managing Passport Demand
The DPER IGEES Unit is, at the time of writing, still working with the Passport Service to manage
demand and the details of any interventions may be published at a later date.
26 Mani, A., Mullainathan, S., Shafir, E. and Zhao, J., 2013. Poverty impedes cognitive function. science, 341(6149), pp.976-980.
30
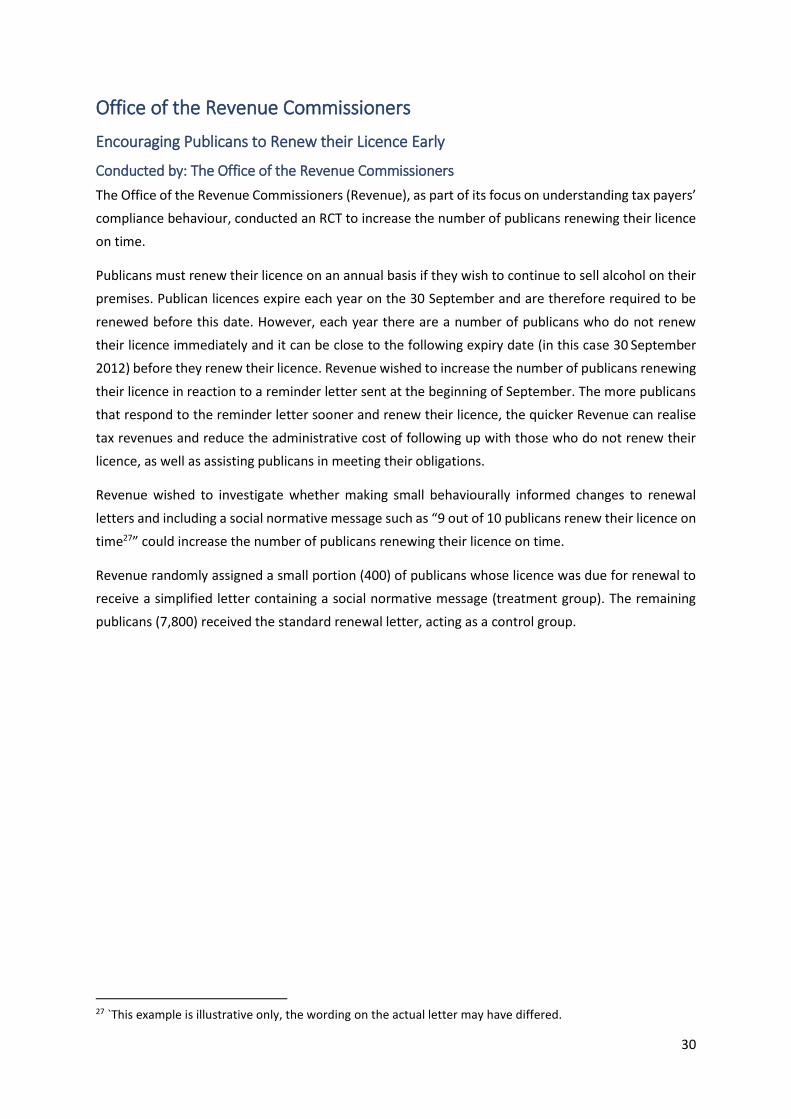
Office of the Revenue Commissioners
Encouraging Publicans to Renew their Licence Early
Conducted by: The Office of the Revenue Commissioners
The Office of the Revenue Commissioners (Revenue), as part of its focus on understanding tax payers’
compliance behaviour, conducted an RCT to increase the number of publicans renewing their licence
on time.
Publicans must renew their licence on an annual basis if they wish to continue to sell alcohol on their
premises. Publican licences expire each year on the 30 September and are therefore required to be
renewed before this date. However, each year there are a number of publicans who do not renew
their licence immediately and it can be close to the following expiry date (in this case 30 September
2012) before they renew their licence. Revenue wished to increase the number of publicans renewing
their licence in reaction to a reminder letter sent at the beginning of September. The more publicans
that respond to the reminder letter sooner and renew their licence, the quicker Revenue can realise
tax revenues and reduce the administrative cost of following up with those who do not renew their
licence, as well as assisting publicans in meeting their obligations.
Revenue wished to investigate whether making small behaviourally informed changes to renewal
letters and including a social normative message such as “9 out of 10 publicans renew their licence on
time27” could increase the number of publicans renewing their licence on time.
Revenue randomly assigned a small portion (400) of publicans whose licence was due for renewal to
receive a simplified letter containing a social normative message (treatment group). The remaining
publicans (7,800) received the standard renewal letter, acting as a control group.
27 `This example is illustrative only, the wording on the actual letter may have differed.
31
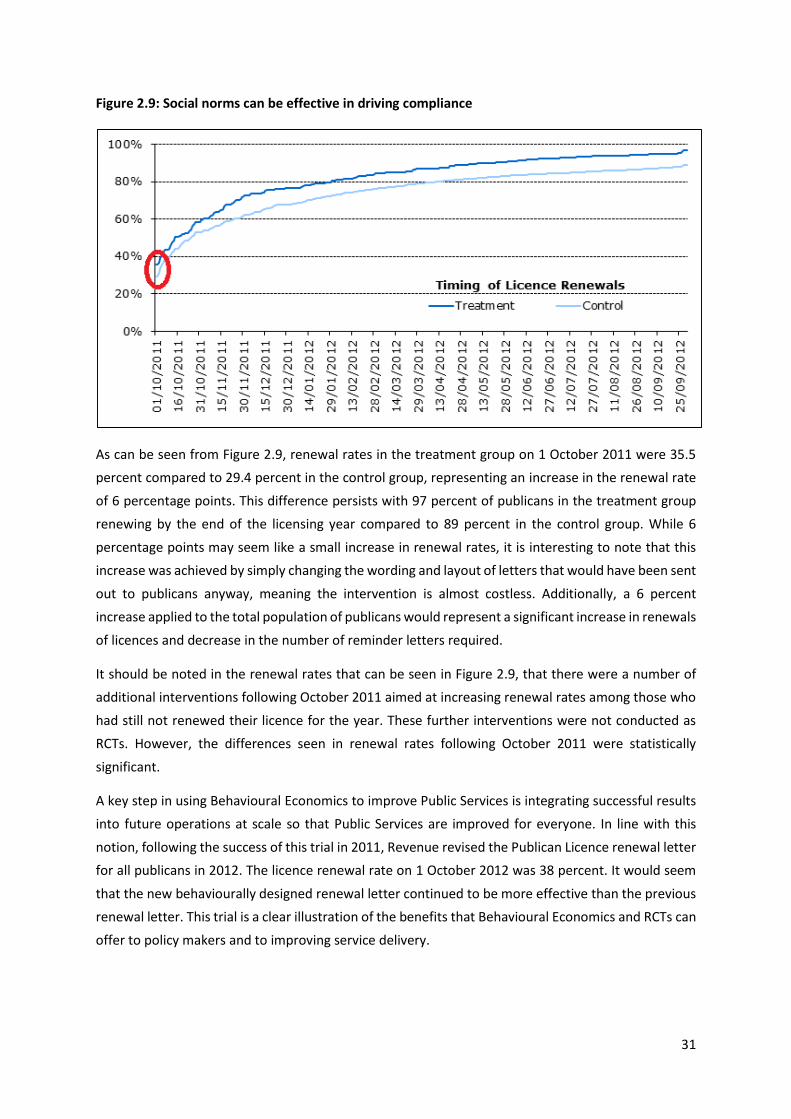
Figure 2.9: Social norms can be effective in driving compliance
As can be seen from Figure 2.9, renewal rates in the treatment group on 1 October 2011 were 35.5
percent compared to 29.4 percent in the control group, representing an increase in the renewal rate
of 6 percentage points. This difference persists with 97 percent of publicans in the treatment group
renewing by the end of the licensing year compared to 89 percent in the control group. While 6
percentage points may seem like a small increase in renewal rates, it is interesting to note that this
increase was achieved by simply changing the wording and layout of letters that would have been sent
out to publicans anyway, meaning the intervention is almost costless. Additionally, a 6 percent
increase applied to the total population of publicans would represent a significant increase in renewals
of licences and decrease in the number of reminder letters required.
It should be noted in the renewal rates that can be seen in Figure 2.9, that there were a number of
additional interventions following October 2011 aimed at increasing renewal rates among those who
had still not renewed their licence for the year. These further interventions were not conducted as
RCTs. However, the differences seen in renewal rates following October 2011 were statistically
significant.
A key step in using Behavioural Economics to improve Public Services is integrating successful results
into future operations at scale so that Public Services are improved for everyone. In line with this
notion, following the success of this trial in 2011, Revenue revised the Publican Licence renewal letter
for all publicans in 2012. The licence renewal rate on 1 October 2012 was 38 percent. It would seem
that the new behaviourally designed renewal letter continued to be more effective than the previous
renewal letter. This trial is a clear illustration of the benefits that Behavioural Economics and RCTs can
offer to policy makers and to improving service delivery.

32
Using Personalisation to Improve Response Rates
Conducted by: The Office of the Revenue Commissioners
Building upon previous successes in improving survey response rates by applying Behavioural
Economics, Revenue carried out an RCT to investigate the effects of personalisation on survey
response rates as part of the PAYE Survey 2015.
Five-hundred respondents were randomly selected to receive a personalised salutation (for example,
‘Dear Mr. Smith’) in their cover letter, which accompanied the survey pack. The remaining 4,500
taxpayers received the standard salutation, ‘Dear Customer’.
Figure 2.10 below shows the postal response rates by day starting 1 September. According to the
results, there was no statistically significant difference observed in response rates between the two
groups. The response rate was almost identical over the period.
The most striking impact on response rates was the reminder letter issued on the 30 September, which
dramatically increased response rates. This may have been caused, at least in part, by a number of
important changes made to the letter following the relatively low initial response rate. These included
drafting a more straightforward letter and issuing the letter on better quality headed paper.
Figure 2.10: Reponses Rates to Annual PAYE Survey 2015 with & without Personalised Salutation.
Source: PAYE Annual Survey 2015
The finding differs sharply from the aforementioned personalisation RCT in Revenue’s previous SME
Survey (2013), which sampled small- and medium-sized enterprises (SMEs) rather than PAYE

33
taxpayers.28 In that case, after the first 15 days, the response rate was 36 percent in the personalised
treatment group compared with 19.2 percent in the control group. However, compared to
personalising the name on the covering letter only, the SME survey RCT involved multiple elements of
personalisation including attaching a signed handwritten yellow Post-it ® note to survey packs,
thanking the survey participant and requesting completion. The combined findings indicate that
personalisation may only be effective at increasing engagement when multiple elements of
personalisation are applied simultaneously.29
This trial is also a good illustration of the need for testing solutions before applying them at scale.
Seemingly small details such as the fact that a personalised message is written on a Post-it ® note
rather than simply personalising a letter, or the context in which an intervention is applied (in this case
to PAYE customers compared to SMEs), can be crucial to the success of an intervention.
28 It is possible that there are significant differences between SME and PAYE survey respondents which make SME survey respondents more likely to respond and more likely to be influenced by personalisation. For example, SMEs may have a different relationship with Revenue than PAYE customers given that SME customers may have more frequent and detailed dealings with Revenue. 29 A secondary finding is that, based on the appreciable rise in response rates following the reminder letter issue, it may be that more straightforward language and an improved quality of headed paper are impacting on response rates. However, these results were not obtained in a RCT trial setting, and are suggestive rather than conclusive.
34
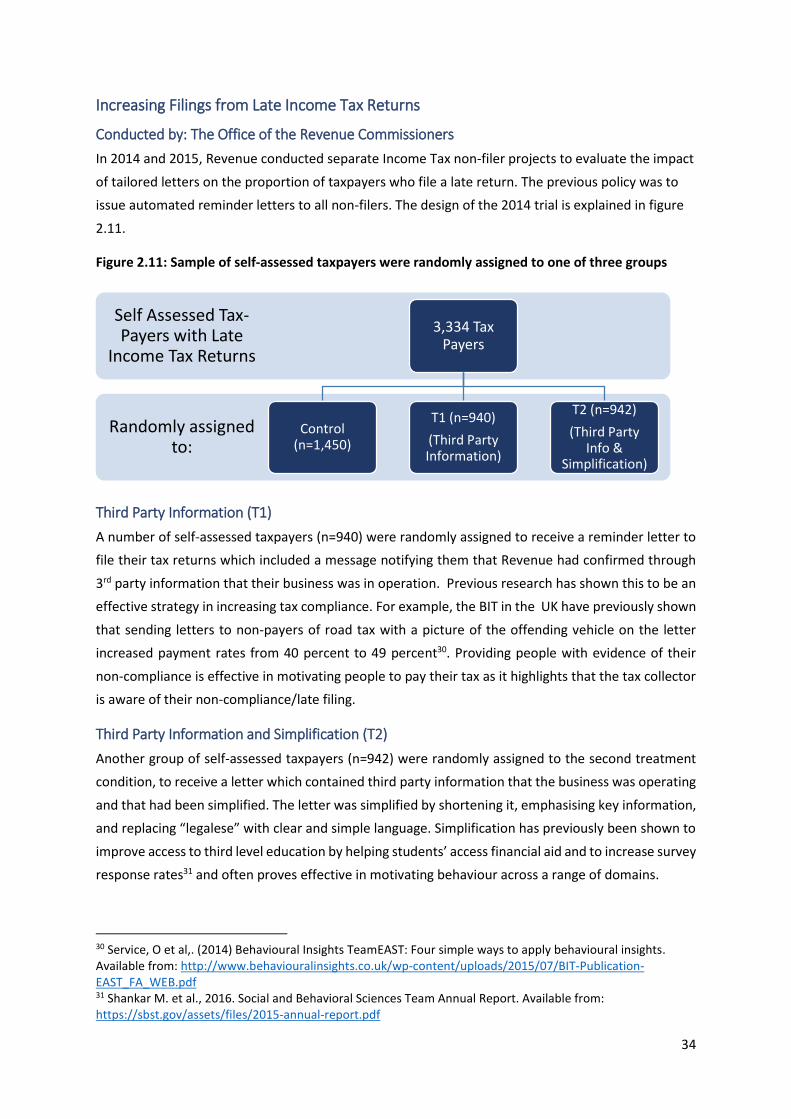
Increasing Filings from Late Income Tax Returns
Conducted by: The Office of the Revenue Commissioners
In 2014 and 2015, Revenue conducted separate Income Tax non-filer projects to evaluate the impact
of tailored letters on the proportion of taxpayers who file a late return. The previous policy was to
issue automated reminder letters to all non-filers. The design of the 2014 trial is explained in figure
2.11.
Figure 2.11: Sample of self-assessed taxpayers were randomly assigned to one of three groups
Third Party Information (T1)
A number of self-assessed taxpayers (n=940) were randomly assigned to receive a reminder letter to
file their tax returns which included a message notifying them that Revenue had confirmed through
3rd party information that their business was in operation. Previous research has shown this to be an
effective strategy in increasing tax compliance. For example, the BIT in the UK have previously shown
that sending letters to non-payers of road tax with a picture of the offending vehicle on the letter
increased payment rates from 40 percent to 49 percent30. Providing people with evidence of their
non-compliance is effective in motivating people to pay their tax as it highlights that the tax collector
is aware of their non-compliance/late filing.
Third Party Information and Simplification (T2)
Another group of self-assessed taxpayers (n=942) were randomly assigned to the second treatment
condition, to receive a letter which contained third party information that the business was operating
and that had been simplified. The letter was simplified by shortening it, emphasising key information,
and replacing “legalese” with clear and simple language. Simplification has previously been shown to
improve access to third level education by helping students’ access financial aid and to increase survey
response rates31 and often proves effective in motivating behaviour across a range of domains.
30 Service, O et al,. (2014) Behavioural Insights TeamEAST: Four simple ways to apply behavioural insights. Available from: http://www.behaviouralinsights.co.uk/wp-content/uploads/2015/07/BIT-Publication-EAST_FA_WEB.pdf 31 Shankar M. et al., 2016. Social and Behavioral Sciences Team Annual Report. Available from: https://sbst.gov/assets/files/2015-annual-report.pdf
Randomly assigned to:
Self Assessed Tax-Payers with Late
Income Tax Returns
3,334 Tax Payers
Control (n=1,450)
T1 (n=940)
(Third Party Information)
T2 (n=942)
(Third Party Info &
Simplification)
35
Results
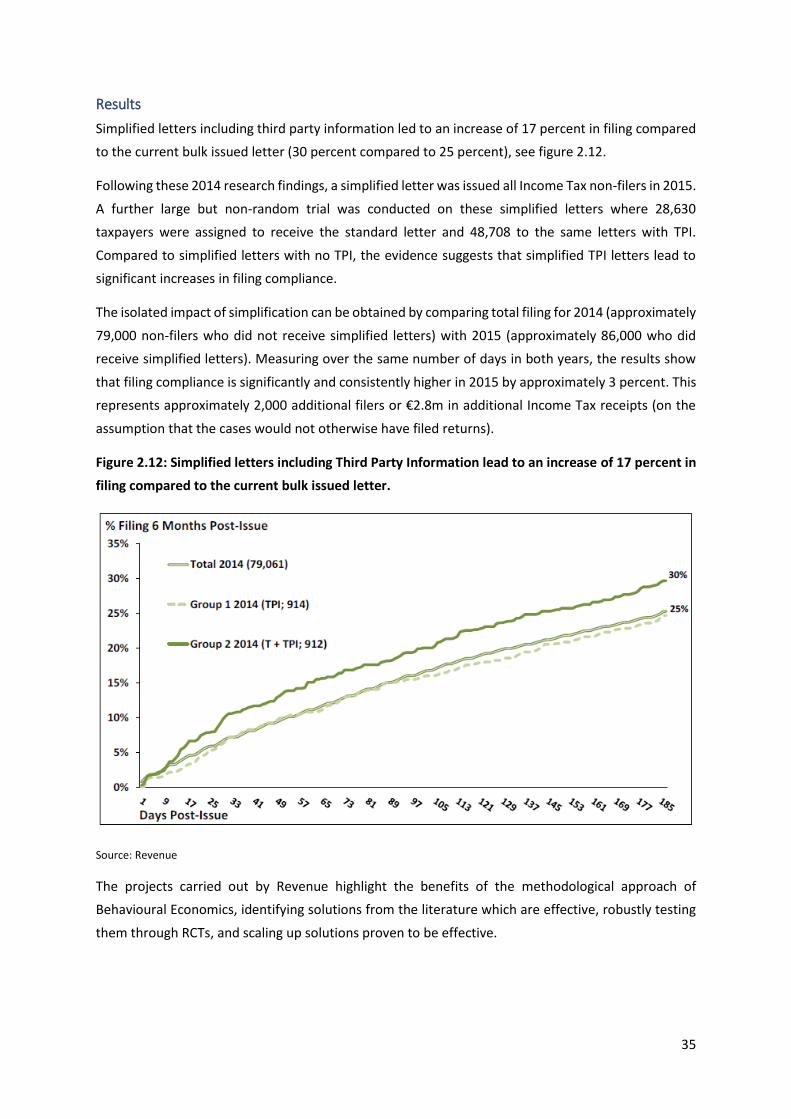
Simplified letters including third party information led to an increase of 17 percent in filing compared
to the current bulk issued letter (30 percent compared to 25 percent), see figure 2.12.
Following these 2014 research findings, a simplified letter was issued all Income Tax non-filers in 2015.
A further large but non-random trial was conducted on these simplified letters where 28,630
taxpayers were assigned to receive the standard letter and 48,708 to the same letters with TPI.
Compared to simplified letters with no TPI, the evidence suggests that simplified TPI letters lead to
significant increases in filing compliance.
The isolated impact of simplification can be obtained by comparing total filing for 2014 (approximately
79,000 non-filers who did not receive simplified letters) with 2015 (approximately 86,000 who did
receive simplified letters). Measuring over the same number of days in both years, the results show
that filing compliance is significantly and consistently higher in 2015 by approximately 3 percent. This
represents approximately 2,000 additional filers or €2.8m in additional Income Tax receipts (on the
assumption that the cases would not otherwise have filed returns).
Figure 2.12: Simplified letters including Third Party Information lead to an increase of 17 percent in
filing compared to the current bulk issued letter.
Source: Revenue
The projects carried out by Revenue highlight the benefits of the methodological approach of
Behavioural Economics, identifying solutions from the literature which are effective, robustly testing
them through RCTs, and scaling up solutions proven to be effective.

36
Department of Agriculture, Food and the Marine
Encouraging Farmers to Meet Nitrate Emission Regulations
Conducted by: The Department of Agriculture, Food and the Marine and the ESRI
The Department of Agriculture, Food and the Marine (DAFM) is working with the ESRI to develop a
behaviour change initiative to encourage farmers to meet nitrate regulation stocking rate limits and
therefore avoid costly EU fines and penalties32.
Irish farmers are subject to regulations detailing the amount of nitrogen from livestock manure they
may apply as fertilizer. Under the Nitrates Regulations (S.I. 31 of 2014) farmers must not apply more
than 170kgs of nitrogen from livestock manure per hectare per year.33 Farmers are subject to fines
from the EU and may put their payments from the Single Payment Scheme, Disadvantaged Area
Scheme, REPS, AEOS, and other co-funded scheme payments at risk by not complying with nitrate
regulations.34
Despite there being a clear financial incentive for farmers to ensure that they comply with these
regulations, non-compliance rates have not fallen. There are a number of behavioural biases, shown
in figure 2.13, which may be influencing the relatively high rate of non-compliance.
32 Department of Agriculture, Food and the Marine, (2011). SMR 4 Nitrates Record Template. Available from: http://www.agriculture.gov.ie/media/migration/farmingschemesandpayments/goodfarmingpracticesregulations/crosscompliance/nitratesrecord/NitratesRecordsTemplate051012.pdf 33 Department of Agriculture, Food and the Marine, (2014). Nitrates Information. Available from: http://www.agriculture.gov.ie/ruralenvironment/environmentalobligations/nitrates/ 34 Department of Agriculture, Food and the Marine, (2014). Explanatory Handbook for Good Agricultural Practice for the Protection of Waters Regulations 2014. Available from: http://www.agriculture.gov.ie/media/migration/ruralenvironment/environment/nitrates/NitratesExplanatoryHandbook14Mar2014.pdf

37
Figure 2.13: Behavioural Biases impacting Farmers Decision to take action to comply with Nitrate
Regulations
Bias Description Implications
Hyperbolic
Discounting/Present
Bias
People dislike losses that
occur instantly more than
losses that happen in the
future.
The loss of income, as it does not happen
immediately, may not sufficiently motivate
farmers to comply with the regulations.
Complexity &
Procrastination
As decisions become more
complex, people are more
likely to procrastinate.
If complying with regulations is difficult,
farmers may procrastinate, especially if the
consequences are not felt immediately.
Optimism Bias People tend to
overestimate the likelihood
of positive events.
Farmers may overestimate the likelihood
they will meet the regulated emission
levels.
Salience Events that are easier to
remember seem more
important in decision
making.
If farmers do not remember/strongly
remember the consequences of their
previous breach of the regulation, they may
be less likely to meet them the next year.
Social Norms People often act as they
perceive others act.
If farmers believe that other farmers
routinely breach the regulations, they may
be more likely to breach regulations
themselves.
In an effort to increase compliance levels the DAFM and the ESRI are conducting an RCT testing the
effectiveness of simplified reminder letters with modified messaging. Farmers will receive one of four
letters as outlined in figure 2.14.
Figure 2.14: There are four experimental conditions: a control group; and three experimental groups
Group Treatment
Control Standard letter as drafted
T1 Simplified letter, with detailed information supplied on the reverse (or on a
separate sheet)
T2 Simplified letter, plus localised (by county) social norm message
T3 Simplified letter, plus localised social norm, plus action box

38
The letters (T1, T2, and T3) have been designed to tackle a number of the behavioural biases laid out
in figure 2.13. By simplifying the letter and adding detailed information explaining what to do next,
the first treatment letter attempts to reduce complexity and the likelihood of procrastination. The
second treatment letter highlights the fact that the majority of farmers in the recipients area are
compliant with the regulations, utilising social norms to increase the likelihood that the farmer will
comply too. The final treatment letter includes all of the above as well as a clear action box on the
letter that should draw the reader’s attention and increase the likelihood of compliance by making
implementable solutions clear to the farmer to tackle procrastination.
The letters trial has been planned and results should be available in 2017.
39
Using SMS Reminders to Encourage Farmers to Apply for Nitrate Derogations
Conducted by: The Department of Agriculture, Food and the Marine and the ESRI
The DAFM is also conducting a separate trial with the ESRI to investigate the effectiveness of changing
the wording in text messages already sent to farmers.
Text messages (SMS) are already sent to both farmers with derogation (170-250 kg/ha) and non-
derogation (150-170 kg/ha) herds to encourage them to (re-)apply for the Nitrates Derogation or take
other action to remain compliant with the limits. The Nitrates Derogation allows farmers to apply a
higher amount of livestock manure than that provided for in the Nitrates Regulations (where the limit
is 170kg of nitrate per hectare per year from livestock manure) subject to certain conditions.
Successful applicants will be able to apply livestock manure in excess of 170kg/ha in accordance with
their fertiliser plan and up to a maximum of 250kg/ha per year, without incurring penalties or fines.
The aim of this RCT is to investigate whether changing the wording of existing text messages, informed
by previous findings in the Behavioural Economics literature, can increase the proportion of farmers
(re-)applying for Nitrate Derogations, decreasing the number of farmers subject to penalties or fines.
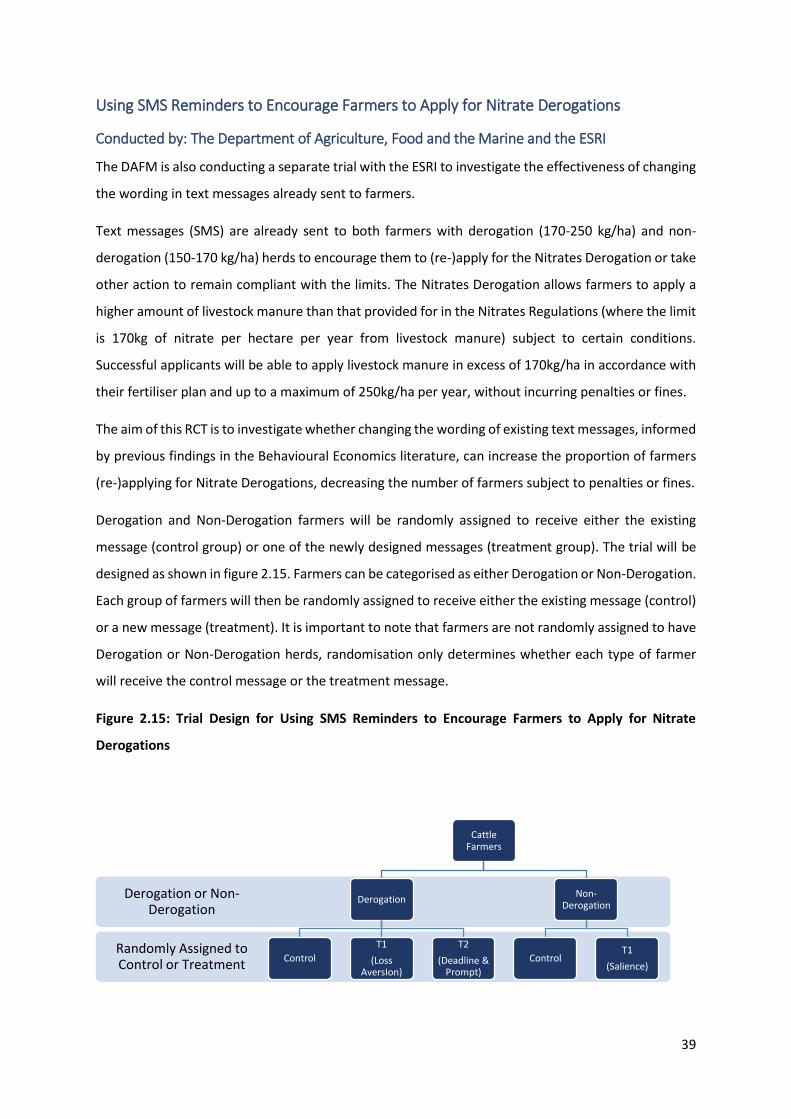
Derogation and Non-Derogation farmers will be randomly assigned to receive either the existing
message (control group) or one of the newly designed messages (treatment group). The trial will be
designed as shown in figure 2.15. Farmers can be categorised as either Derogation or Non-Derogation.
Each group of farmers will then be randomly assigned to receive either the existing message (control)
or a new message (treatment). It is important to note that farmers are not randomly assigned to have
Derogation or Non-Derogation herds, randomisation only determines whether each type of farmer
will receive the control message or the treatment message.
Figure 2.15: Trial Design for Using SMS Reminders to Encourage Farmers to Apply for Nitrate
Derogations
Randomly Assigned to Control or Treatment
Derogation or Non-Derogation
Cattle Farmers
Derogation
Control
T1
(Loss AversIon)
T2
(Deadline & Prompt)
Non-Derogation
ControlT1
(Salience)

40
Texts to Derogation Farmers
As can be seen from figure 2.15, derogation farmers will be randomly assigned to receive the original
(control) text message or one of two newly drafted messages (T1 or T2).
Loss Aversion (T1)
The first treatment message (T1) is designed to motivate farmers to (re-)apply for their derogation by
framing the choice to not (re-)apply as a loss, “don’t lose your Derogation in 2016 by forgetting to re-
apply”. Research has shown that losses loom larger than gains and are more likely to take action to
avoid a loss than to take action to acquire a ‘gain’.
Deadline and Prompt (T2)
The second treatment message (T2) combines the use of loss aversion in the first message with
deadlines and prompts. The message has been designed based on findings which show that
emphasising deadlines and prompting people to take action motivates people to act. For example,
Ideas42 have shown that sending reminders to students about upcoming deadlines to apply for
financial aid can increase the number of students registering for financial aid35. As can be seen in
figure 2.16, the message includes text stating “XX days to deadline. Act now.” clearly highlighting the
need for farmers to take action now to avoid losing their derogation.
Texts to Non-Derogation Farmers
Figure 2.17 shows the original (control) and modified (treatment) messages that farmers will be
randomly assigned to receive.
Salience (T1)
The treatment message for non-derogation farmers focuses on making the chance of incurring
penalties more salient by including text stating “Avoid possible penalty: consider applying for 2016
Derogation at www.agfood.ie”. The original message requires “famers to infer that there is a risk of
penalty, by combining the key piece of information in the text (their NPH) with their own knowledge
of the NPH limits.” 36 By explicitly stating the risk of penalties, it makes it easier for the recipients to
understand the need to apply for the derogation.
Next Steps
This trial is currently underway and results may be available later in 2017.
35 Ideas42, (2016). Nudging for Success Using behavioral science to improve the postsecondary student journey. Available from: http://www.ideas42.org/wp-content/uploads/2015/12/Nudging-for-Success-ideas42-FINAL.pdf 36 ESRI, Internal Briefing Documents to DAFM (2015).

41
Figure 2.16 Texts to Derogation Farmers
Original Message (Control) Loss Frame (T1) Deadline & Prompt (T2)
Figure 2.17 Texts to Non-Derogation Farmers
Original Message (Control) Salience Frame (T1)
42
Department of Jobs, Enterprise, and Innovation
Scoping the Application of Behavioural Economics to Enterprise Policy
Conducted by: Department of Jobs, Enterprise, and Innovation
The Department of Jobs, Enterprise, and Innovation (DJEI) have been applying Behavioural Economics
to a number of employment and enterprise policies in recent years. To date, these applications have
been behaviourally informed projects, meaning that Behavioural Economics has informed the design
of policy but the policy change has not been explicitly tested using a counterfactual method such as
an RCT. The Strategic Policy Division in DJEI is progressing a project to determine if there is scope to
further apply behavioural science learnings to enterprise policy, specifically to firm-level interventions
to improve their productivity/innovation, or general competitiveness.
The Action Plan for Jobs (2013) included the roll-out of a new scheme to incentivise businesses to
recruit persons who were long-term unemployed. The design of that scheme, JobsPlus, took into
account findings from the Behavioural Economics literature on framing effects, complexity, salience,
and time inconsistency bias to maximise take-up of the scheme. JobsPlus is a scheme designed to
encourage employers and businesses to employ people who have been out of work for long periods.
This incentive replaced the Revenue Job Assist and Employer Job (PRSI) Exemption Scheme from 1 July
2013, in an effort to simplify the process for employers and employees availing of incentives to help
the long-term unemployed find sustainable employment.
In 2015, the Government agreed and published a new national enterprise policy that sets out its longer
term ambition for enterprise growth and job creation over the decade to 2025. In preparing the plan,
Enterprise 2025, DJEI applied the concept of 'fast and frugal37' heuristics from behavioural science to
propose a new approach to the assessment of the sustainability (or unsustainability) of employment
across sectors of the economy. In 2016, DJEI began including such heuristics in its quarterly Dashboard
Statistics, the compilation of up-to-date data from DJEI, CSO and other external sources relating to
early indicators of change that impact on enterprise policy. These heuristics serve as ‘early-warning’
indicators to prompt further, deeper analysis if required.
37 Please see figure 2.18 for an example of applying fast and frugal heuristics.

43
Figure 2.18: Fast and Frugal Heuristics: Using Rules of Thumb to Make Effective Decisions Quickly
There are numerous examples within the Behavioural Economics literature where the use of heuristics (rules of thumb) can lead people to make sub-optimal decisions as defined by the standard model of economic rationality. For example, the availability heuristic may lead investors to judge the quality of an investment based on information that was recently in the news, ignoring other relevant facts (Tversky & Kahneman, 1974). Gigerenzer (199938) proposes that the use of carefully chosen heuristics can be “ecologically rational” meaning that they can help to make effective decisions quickly when only limited information/time is available. Gigerenzer uses the example of a doctor trying to assess the risk level of a patient in an emergency department having a heart attack, to emphasise his point. The doctor must make a decision quickly and accurately, and may not have time to calculate the risk of the patient using all of the patients’ health related characteristics. Instead, the doctor may rely on answering a number of questions which have been shown to be the main predictors of the patient’s risk to serious complications as a result of a heart attack, as shown below.
This simplified strategy has been shown to be more effective in classifying heart attack patients according to risk status than other complicated statistical measures (Breiman et al., 199339). This example highlights that while heuristics can lead people to make sub-optimal decisions, they also provide opportunities for simplifying decision frameworks when applied sensibly. A similar strategy has been adopted by the DJEI using key metrics to assess the sustainability (or unsustainability) of employment across sectors of the economy and highlights how Behavioural Economics can be used to create ‘early-warning’ indicators and help guide internal decision making, as well as improving operations and policy-making at a higher level.
38 Gigerenzer, G. and Todd, P.M., 1999. Fast and frugal heuristics: The adaptive toolbox. In Simple heuristics that make us smart (pp. 3-34). Oxford University Press. 39 Breiman et al., 1993 in Gigerenzer, G. and Todd, P.M., 1999. Fast and frugal heuristics: The adaptive toolbox. In Simple heuristics that make us smart (pp. 3-34). Oxford University Press.

44
3. Next Steps
This report contains 13 example applications of Behavioural Economics across a number of
Government Departments. Further work has been carried out by other Government bodies and by
independent research institutes, for example the work of the PRICE Lab in the ESRI. A number of
Departments have also expressed plans to continue the application of Behavioural Economics in their
policy areas and have set out commitments in their work programmes to do so. Behavioural
Economics is gaining traction in Irish policy making as a vehicle to innovate and improve outcomes,
efficiency, and value for money.
The DPER IGEES Unit will continue to drive the use of Behavioural Economics in Ireland and is
developing toolkits that will help guide Departments through the initial phases of conducting a
behavioural change project.
Top Related