Languages
Pages
Legal


ANNEX 4A
Water Quality Method Statement
CONTENTS
4A1 INTRODUCTION 1
4A1.1 BACKGROUND 1
4A1.2 PURPOSE OF THE METHOD STATEMENT 3
4A1.3 INTERPRETATION OF THE REQUIREMENTS: KEY ISSUES AND CONSTRAINTS 3
4A1.4 MODEL SELECTION 3
4A1.5 GRID REFINEMENT 4
4A1.6 COASTLINE & BATHYMETRY 5
4A1.7 BOUNDARY CONDITIONS 7
4A1.8 AMBIENT ENVIRONMENTAL CONDITIONS - WATER TEMPERATURE, SOLAR
RADIATION AND WIND 7
4A1.9 VECTOR INFORMATION 7
4A1.10 UNCERTAINTIES IN ASSESSMENT METHODOLOGIES 8
4A2 WATER SENSITIVE RECEIVERS 9
4A3 CONSTRUCTION PHASE 11
4A3.1 CALCULATION METHOD 11
4A3.2 WORKING TIME 13
4A3.3 OVERVIEW OF DREDGING PLANT - GRAB DREDGERS 13
4A3.4 CONSTRUCTION SCENARIO – GRAB DREDGING FOR SUBMARINE OUTFALL 15
4A3.5 SEDIMENT INPUT PARAMETERS 16
4A4 OPERATION PHASE 17
4A4.1 OPERATION SCENARIO 17
4A5 EMERGENCY DISCHARGE 20
4A5.1 EMERGENCY SITUATIONS 22
4A5.2 MITIGATION MEASURES 22
4A5.3 MODEL EMERGENCY SCENARIOS 25
4A6 CUMULATIVE IMPACTS 29
4A7 MODEL SCENARIOS 30

ENVIRONMENTAL RESOURCES MANAGEMENT B&V
0227541_ANNEX 4A_WQMS_20160616.DOC 09 AUGUST 2016
ANNEX 4A - 1
4A1 INTRODUCTION
4A1.1 BACKGROUND
The Drainage Services Department (DSD) is undertaking a project named
“Outlying Islands Sewerage Stage 2 – South Lantau Sewerage Works” (PWP Item
331DS) (hereinafter referred to as the “Project”). This Project is to provide a
sewerage system that includes trunk and village sewerage, sewage pumping
stations, a sewage treatment works (STW) and associated effluent facilities,
and submarine outfall. This project is intended to provide proper collection,
treatment and disposal of the sewage arising from South Lantau, including
areas in Shui Hau, Tong Fuk, Cheung Sha, San Shek Wan, Pui O and Ham Tin.
The proposed sewerage works is located in South Lantau. The treatment
level is proposed to be secondary (biological) treatment level with
disinfection. Membrane Bio-Reactor (MBR) technique is the recommended
treatment option at the San Shek Wan STW. The extent of the sewerage
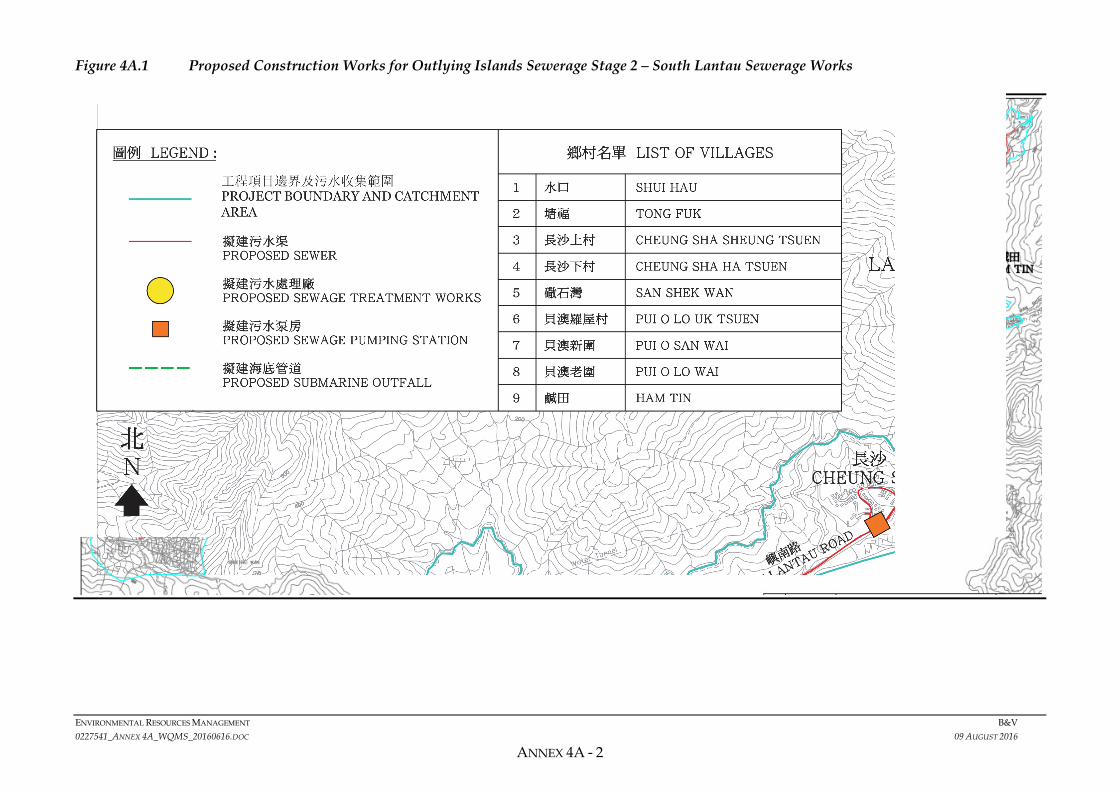
works is indicated on Figure 4A.1. The key elements of the Project are:
a) Provision of village sewerage to unsewered areas of Shui Hau, Tong Fuk,
Cheung Sha, San Shek Wan, Pui O and Ham Tin in South Lantau.
b) Construction of trunk sewer, sewage pumping stations and the associated
rising mains along South Lantau Road for collection and conveyance of
sewage from unsewered areas mentioned in item a) above to the
proposed San Shek Wan STW; and
c) Construction of a STW at San Shek Wan, associated effluent pumping
facilities and a submarine outfall.
The Project will require an Environmental Permit from the Hong Kong SAR
Government. In relation to this, DSD has prepared a Project Profile for
Application for an Environmental Impact Assessment (EIA) Study Brief which
was submitted to EPD on 6 August 2009. The EIA Study Brief (No. ESB-
209/2009) was issued by EPD on 15 September 2009.
Following the issuance of the EIA Study Brief, DSD commissioned the study
“Outlying Islands Sewerage Stage 2 – South Lantau Sewerage Works –
Investigation” (Agreement No. CE 55/2009 (DS)) for EIA and preliminary
design studies of the Project. As part of the EIA, computational
hydrodynamic and water quality modelling will be undertaken to quantify
and evaluate potential water quality impacts associated with the construction
and operation of this Project.
ENVIRONMENTAL RESOURCES MANAGEMENT B&V
0227541_ANNEX 4A_WQMS_20160616.DOC 09 AUGUST 2016
ANNEX 4A - 2
Figure 4A.1 Proposed Construction Works for Outlying Islands Sewerage Stage 2 – South Lantau Sewerage Works

ENVIRONMENTAL RESOURCES MANAGEMENT B&V
0227541_ANNEX 4A_WQMS_20160616.DOC 09 AUGUST 2016
ANNEX 4A - 3
4A1.2 PURPOSE OF THE METHOD STATEMENT
This Method Statement presents information on the approach for the water
quality modelling and assessment works for the EIA. It is important to note
that at the time of writing this Method Statement the detailed engineering
information for both construction and operation activities is yet to be
confirmed and therefore a general approach as to how the modelling works
would be carried out is presented herein, with relevant assumptions provided
as appropriate.
The methodology has been based on the following three focus areas, as
follows:
• Model Selection;
• Input Data; and
• Scenarios.
4A1.3 INTERPRETATION OF THE REQUIREMENTS: KEY ISSUES AND CONSTRAINTS
The objectives of the modelling exercise are to assess:
• Effects of construction, which comprises the study of the dispersion of
sediments released during the construction/ installation of one submarine
outfall connected to the San Shek Wan STW;
• Effects of STW operation on water quality due to the effluent discharge
from STW via the proposed submarine outfall; and
• Any cumulative impacts due to other projects or activities within the
study area.
The construction and operational effects will be studied by means of computer
modelling.
4A1.4 MODEL SELECTION
The existing Western Harbour Model (referred to as “original model”) (1) of the
Delft3D hydrodynamic (Delft3D-FLOW) and water quality (Delft3D-WAQ)
suite of models will be used to simulate potential impacts on water quality
during construction and operation of the Project.
The model will have the required spatial extent for this study, i.e. waters
extending up to the south boundary of Southern Water Control Zone
(SWCZ) – about 9.5 km away from the Project site (Figure 4A.2).
(1) ERM - Hong Kong, Ltd (2006) EIA Study for Liquefied Natural Gas (LNG) Receiving Terminal and Associated
Facilities. For CAPCO.

ENVIRONMENTAL RESOURCES MANAGEMENT B&V
0227541_ANNEX 4A_WQMS_20160616.DOC 09 AUGUST 2016
ANNEX 4A - 4
In order to assess the immediate dilution of the effluent discharge into Pui O
Wan at point of discharge, near field simulation of dilution in the mixing zone
will be modelled. The near-field simulation will be conducted using
CORMIX model.
Figure 4A.2 Geographical Extent of the Model and Area of Interest
4A1.5 GRID REFINEMENT
The grid size of the original model near South Lantau is in the order of about
150 m. Local grid refinement of the water quality and hydrodynamic model
grids would be carried out to provide improved resolution (less than 75 m) in
the key area of interest. The refinement of the model grids has been
implemented by means of nesting to the Western Harbour Model in this Study
(Figure 4A.3). The refined model domain extends from the southern coast of
the Lantau Island to the boundary of the Southern Water Control Zone
(WCZ). The grid size ranges from about 40 m x 40 m in the immediate
vicinity of the South Lantau coastline to about 140 m x 140 m near the
Southern WCZ open boundary. The refined model grid is hereinafter called
the “refined model”. The hydrodynamic model grid will subsequently be
adopted without further horizontal aggregation in the water quality models.
Since parts of the new model used in this study will be refined to compute
flow behaviour with a higher resolution in the vicinity of the South Lantau
coastline, we will show that the refined model is consistent with the original
model, computed water levels, depth-averaged current speed and directions
will be compared at two selected locations in the refined model.

ENVIRONMENTAL RESOURCES MANAGEMENT B&V
0227541_ANNEX 4A_WQMS_20160616.DOC 09 AUGUST 2016
ANNEX 4A - 5
Comparisons will be made between the two models for the wet and dry
seasons for model calibration and validation.
Figure 4A.3 Model Grid of the Refined Model and the Original Model
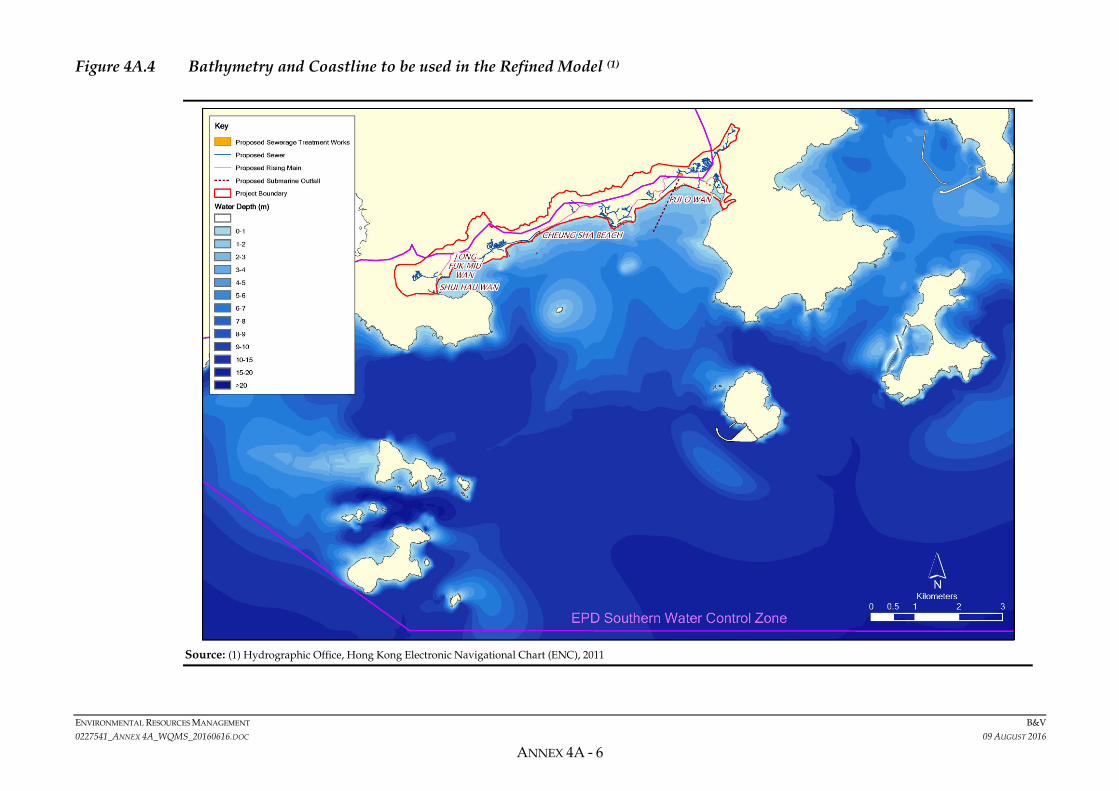
4A1.6 COASTLINE & BATHYMETRY
Bathymetry and coastline information will be updated to represent any
constructed structures in the water as indicated in Figure 4A.4. It may be
noted with reference to the construction method and scale of works (refer
Section 4A3), the proposed submarine outfall will not be represented as a
structure above the seabed in the model.
Original Model Grid
Refined Model Grid
ENVIRONMENTAL RESOURCES MANAGEMENT B&V
0227541_ANNEX 4A_WQMS_20160616.DOC 09 AUGUST 2016
ANNEX 4A - 6
Figure 4A.4 Bathymetry and Coastline to be used in the Refined Model (1)
Source: (1) Hydrographic Office, Hong Kong Electronic Navigational Chart (ENC), 2011

ENVIRONMENTAL RESOURCES MANAGEMENT B&V
0227541_ANNEX 4A_WQMS_20160616.DOC 09 AUGUST 2016
ANNEX 4A - 7
4A1.7 BOUNDARY CONDITIONS
The refined model was linked to the original model. Water levels and three-
dimensional velocities generated by the WHM were defined at the open
boundaries of the detailed model. For the interested parameters, depth-
averaged values were derived and the averages of the whole 15-days spring-
neap cycle were calculated. These averages were then used as the boundary
conditions for the new model.
4A1.8 AMBIENT ENVIRONMENTAL CONDITIONS - WATER TEMPERATURE, SOLAR
RADIATION AND WIND
The ambient environmental conditions are closely linked to the processes of
water quality changes. Meteorological forcing including wind speed, solar
surface radiation and water temperature for the dry and wet seasons need to
be defined in the hydrodynamic and water quality computations of the
detailed model. The data for meteorological forcing were based on the past
records from Hong Kong Observatory.
The wind conditions applied in the water quality simulation were 5 m/s NE
for dry season and 5m/s SW for the wet season, which was identical to the
hydrodynamic model. The same average wind speed and direction were
adopted in the original model. On the other hand, monthly averaged values
of solar surface radiation and water temperature were used in the model.
The monthly averaged solar radiation was calculated based on the hourly data
recorded at this station. The average values of solar radiation adopted were
132 W/m2 in the dry season and 237 W/m2 in the wet season.
The ambient water temperature was determined based on the EPD routine
monitoring data collected within the Southern WCZ. The average water
temperature values used in the water quality model were 16 °C in the dry
season and 29 °C in the wet season.
It is assumed that wind speed, solar radiation and water temperature are
constant over the entire domain of the model.
4A1.9 VECTOR INFORMATION
The current patterns under the baseline situation will be generated as an
output of the baseline hydrodynamic modelling. They will be presented as
vectors showing the current direction and velocities.
ENVIRONMENTAL RESOURCES MANAGEMENT B&V
0227541_ANNEX 4A_WQMS_20160616.DOC 09 AUGUST 2016
ANNEX 4A - 8
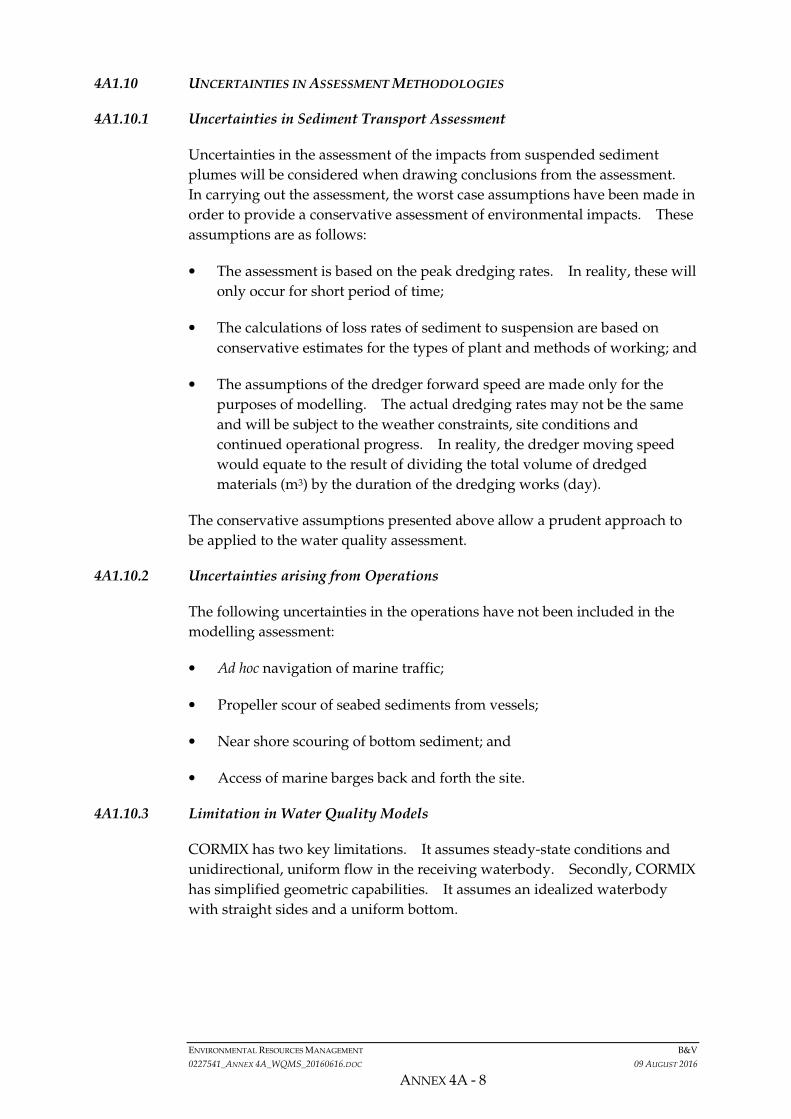
4A1.10 UNCERTAINTIES IN ASSESSMENT METHODOLOGIES
4A1.10.1 Uncertainties in Sediment Transport Assessment
Uncertainties in the assessment of the impacts from suspended sediment
plumes will be considered when drawing conclusions from the assessment.
In carrying out the assessment, the worst case assumptions have been made in
order to provide a conservative assessment of environmental impacts. These
assumptions are as follows:
• The assessment is based on the peak dredging rates. In reality, these will
only occur for short period of time;
• The calculations of loss rates of sediment to suspension are based on
conservative estimates for the types of plant and methods of working; and
• The assumptions of the dredger forward speed are made only for the
purposes of modelling. The actual dredging rates may not be the same
and will be subject to the weather constraints, site conditions and
continued operational progress. In reality, the dredger moving speed
would equate to the result of dividing the total volume of dredged
materials (m3) by the duration of the dredging works (day).
The conservative assumptions presented above allow a prudent approach to
be applied to the water quality assessment.
4A1.10.2 Uncertainties arising from Operations
The following uncertainties in the operations have not been included in the
modelling assessment:
• Ad hoc navigation of marine traffic;
• Propeller scour of seabed sediments from vessels;
• Near shore scouring of bottom sediment; and
• Access of marine barges back and forth the site.
4A1.10.3 Limitation in Water Quality Models
CORMIX has two key limitations. It assumes steady-state conditions and
unidirectional, uniform flow in the receiving waterbody. Secondly, CORMIX
has simplified geometric capabilities. It assumes an idealized waterbody
with straight sides and a uniform bottom.
ENVIRONMENTAL RESOURCES MANAGEMENT B&V
0227541_ANNEX 4A_WQMS_20160616.DOC 09 AUGUST 2016
ANNEX 4A - 9
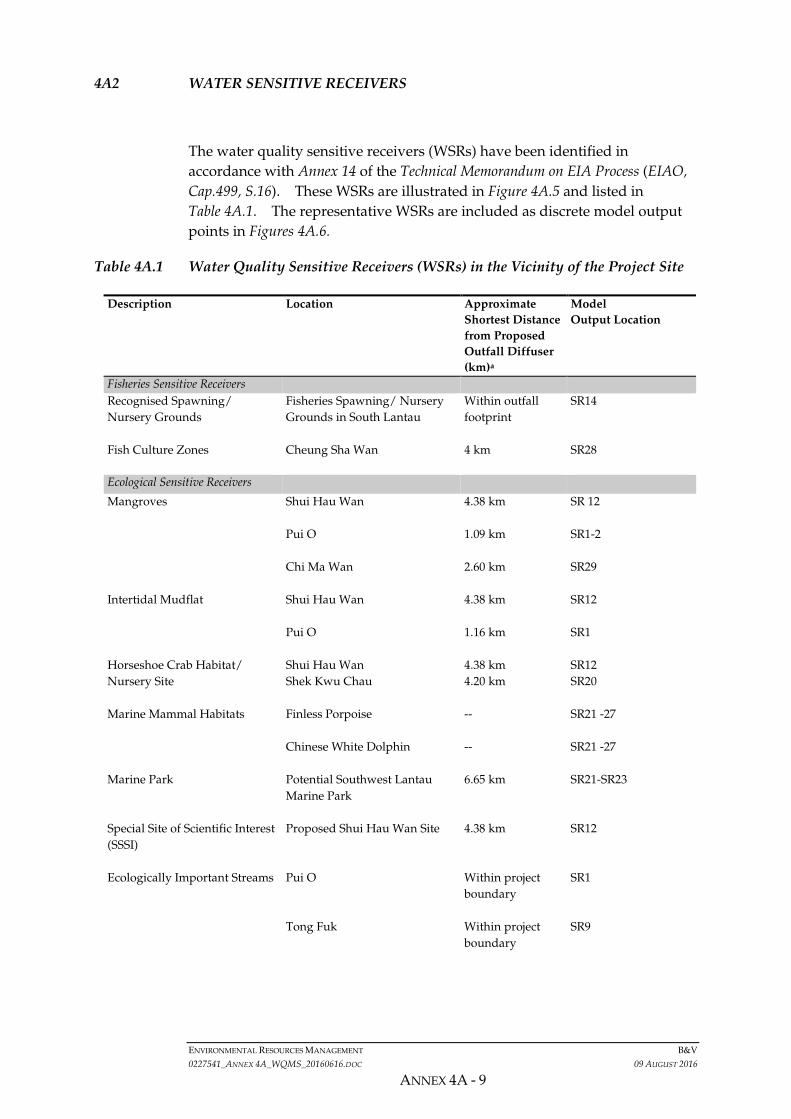
4A2 WATER SENSITIVE RECEIVERS
The water quality sensitive receivers (WSRs) have been identified in
accordance with Annex 14 of the Technical Memorandum on EIA Process (EIAO,
Cap.499, S.16). These WSRs are illustrated in Figure 4A.5 and listed in
Table 4A.1. The representative WSRs are included as discrete model output
points in Figures 4A.6.
Table 4A.1 Water Quality Sensitive Receivers (WSRs) in the Vicinity of the Project Site
Description Location Approximate
Shortest Distance
from Proposed
Outfall Diffuser
(km)a
Model
Output Location
Fisheries Sensitive Receivers
Recognised Spawning/
Nursery Grounds
Fisheries Spawning/ Nursery
Grounds in South Lantau
Within outfall
footprint
SR14
Fish Culture Zones Cheung Sha Wan 4 km
SR28
Ecological Sensitive Receivers
Mangroves Shui Hau Wan 4.38 km
SR 12
Pui O 1.09 km
SR1-2
Chi Ma Wan 2.60 km
SR29
Intertidal Mudflat Shui Hau Wan 4.38 km
SR12
Pui O 1.16 km
SR1
Horseshoe Crab Habitat/
Nursery Site
Shui Hau Wan
Shek Kwu Chau
4.38 km
4.20 km
SR12
SR20
Marine Mammal Habitats Finless Porpoise --
SR21 -27
Chinese White Dolphin --
SR21 -27
Marine Park Potential Southwest Lantau
Marine Park
6.65 km SR21-SR23
Special Site of Scientific Interest
(SSSI)
Proposed Shui Hau Wan Site 4.38 km SR12
Ecologically Important Streams Pui O Within project
boundary
SR1
Tong Fuk Within project
boundary
SR9

ENVIRONMENTAL RESOURCES MANAGEMENT B&V
0227541_ANNEX 4A_WQMS_20160616.DOC 09 AUGUST 2016
ANNEX 4A - 10
Description Location Approximate
Shortest Distance
from Proposed
Outfall Diffuser
(km)a
Model
Output Location
Coral Communities b Pui O Wan
Siu A Chau,
Shek Kwu Chau
Cheung Chau
Hei Ling Chau
Chi Ma Wan
1.00 km
0.74 km
0.43 km
4.00 km
5.4 km
6.5 km
6.30 km
2.85 km
SR3
SR4
SR5
SR21
SR30
SR32 & SR34
SR35
SR31
Water Quality Sensitive Receivers
Gazetted Bathing Beaches Tong Fuk 3.22 km SR8
Upper Cheung Sha 2.63 km SR7
Lower Cheung Sha 0.97 km SR6
Pui O 1.02 km SR2
Secondary Contact Recreational
Zones
Southern Lantau and Chi Ma
Wan Coastlines
Within outfall
footprint
SR10, SR13, SR15-SR17
Coastal Protection Areas Tong Fuk Miu Wan 4.95 km SR 11
Shui Hau Wan 4.38 km SR 12
Tong Fuk 2.75 km SR8
Upper Cheung Sha 1.46 km SR7
Lower Cheung Sha 0.97 km SR6
Pui O 0.99 km SR1-2
Seawater Intakes Pumping Station at
Tai Kwai Wan
6.45 km SR19
Note:
a. Measured “as the crow flies”, i.e. directly without taking into account land mass or other structures. The
presence of such masses would naturally affect any direct / indirect impact to these receivers; however, for
conservatism they have been removed
b. Source: AECOM (2010), Engineering Investigation and Environmental Studies For Integrated Waste Management
Facilities Phase I – Feasibility Study, for EPD,
http://www.epd.gov.hk/eia/register/report/eiareport/eia_1932011/EIA/EIA_PDF/Figures/FIGURE%205
b.1.pdf

!(
!(
!( !(
!(
!(
!(
!.!.
!.!.
!.
!.
!.
!.
!.!.
!.
_̂
!(
_̂k
")#
#
#
#
#
Pui O
Tong FukChi Ma Wan
Shui Hau Wan
SS6
ST1
SM20
SM17
SM13SM12
Figure no.
Prepared
Date
Checked
Scale
OUTLYING ISLANDS SEWERAGE STAGE 2SOUTH LANTAU SEWERAGE WORKS -
INVESTIGATION
THE GOVERNMENT OF THEHONG KONG
SPECIAL ADMINISTRATIVE REGIONDRAINAGE SERVICES DEPARTMENT
香香香香香香香香香香香香
博 威 工 程 顧 問 有 限 公 司
Title
BLACK & V EAT CH HONG KONG L IMITE D
Water Quality Sensitive Receivers in the Vicinity of the Project Site
Figure 4A.5
Key
# EPD Routine Marine Water Monitoring Station
") EPD Routine Sediment Monitoring Stations
k Proposed SSSI
_̂ Horseshoe Crab
!( Seawater Intake
!. Coral Communities
!( Proposed Site of Pumping Station
!( Proposed Sewage Treatment Works
Proposed Sewer Alignment
Submarine Outfall
Gazetted Bathing Beaches
SSSI
Freshwater and Brackish Wetland
Ecologically Important Streams
Location of Major Stream
Mangroves
Project Boundary
Coastal Protection Area
Intertidal Mudflat
Fish Culture Zone
Recognised Spawning/ Nursery Grounds
Potential Marine Park
Secondary Contact Recreational Zones
´0 2 41
Kilometres
File: T:\GIS\CONTRACT\0227541\Mxd\0227541_surrounding environment_v5.mxdDate: 4/10/2016

ENVIRONMENTAL RESOURCES MANAGEMENT B&V
0227541_ANNEX 4A_WQMS_20160616.DOC 09 AUGUST 2016
ANNEX 4A - 11
4A3 CONSTRUCTION PHASE
For the construction phase the WAQ model will be used to directly simulate
the following parameters:
• suspended sediments (SS); and
• sediment deposition.
It is assumed that the worst-case construction phase impacts will be at the
commencement of dredging, when there is no depression formed to trap
sediments disturbed during dredging works.
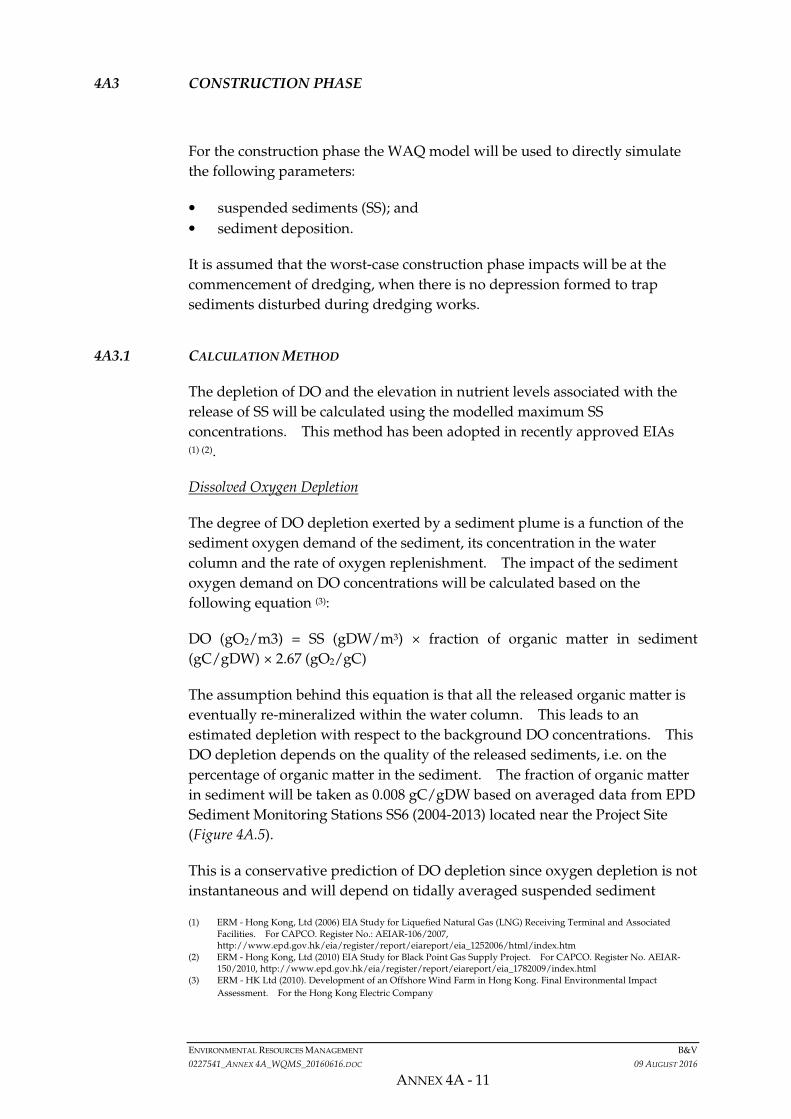
4A3.1 CALCULATION METHOD
The depletion of DO and the elevation in nutrient levels associated with the
release of SS will be calculated using the modelled maximum SS
concentrations. This method has been adopted in recently approved EIAs
(1) (2).
Dissolved Oxygen Depletion
The degree of DO depletion exerted by a sediment plume is a function of the
sediment oxygen demand of the sediment, its concentration in the water
column and the rate of oxygen replenishment. The impact of the sediment
oxygen demand on DO concentrations will be calculated based on the
following equation (3):
DO (gO2/m3) = SS (gDW/m3) × fraction of organic matter in sediment
(gC/gDW) × 2.67 (gO2/gC)
The assumption behind this equation is that all the released organic matter is
eventually re-mineralized within the water column. This leads to an
estimated depletion with respect to the background DO concentrations. This
DO depletion depends on the quality of the released sediments, i.e. on the
percentage of organic matter in the sediment. The fraction of organic matter
in sediment will be taken as 0.008 gC/gDW based on averaged data from EPD
Sediment Monitoring Stations SS6 (2004-2013) located near the Project Site
(Figure 4A.5).
This is a conservative prediction of DO depletion since oxygen depletion is not
instantaneous and will depend on tidally averaged suspended sediment
(1) ERM - Hong Kong, Ltd (2006) EIA Study for Liquefied Natural Gas (LNG) Receiving Terminal and Associated Facilities. For CAPCO. Register No.: AEIAR-106/2007, http://www.epd.gov.hk/eia/register/report/eiareport/eia_1252006/html/index.htm
(2) ERM - Hong Kong, Ltd (2010) EIA Study for Black Point Gas Supply Project. For CAPCO. Register No. AEIAR-150/2010, http://www.epd.gov.hk/eia/register/report/eiareport/eia_1782009/index.html
(3) ERM - HK Ltd (2010). Development of an Offshore Wind Farm in Hong Kong. Final Environmental Impact
Assessment. For the Hong Kong Electric Company

ENVIRONMENTAL RESOURCES MANAGEMENT B&V
0227541_ANNEX 4A_WQMS_20160616.DOC 09 AUGUST 2016
ANNEX 4A - 12
concentrations. It is worth noting that the above equation does not account
for re-aeration which would tend to reduce impacts of the SS on DO
concentrations in the water column. The proposed analysis, which is on the
conservative side, will not, therefore, underestimate the DO depletion.
Further, it should be noted that, for sediment in suspension to exert any
oxygen demand in the water column will take time and, in the meantime, the
sediment will be transported and mixed or dispersed with oxygenated water.
As a result, the oxygen demand and the impact on DO concentrations will
diminish as the suspended sediment concentrations decrease.
Nutrients
An assessment of nutrient release during dredging will be carried out based
on the predicted SS elevation and the testing results of EPD sediment
monitoring station. In the calculation it is assumed that all TIN and
unionised ammonia (UIA) concentrations in the sediments are released to the
water. This is a highly conservative assumption and will result in the
overestimation of the potential impacts.
Ammonia nitrogen is the sum of ionised ammonia (NH4-N) and unionised
ammonia (UIA). Under normal conditions of Hong Kong waters, more than
90% of the ammonia nitrogen would be in the ionised form. For the purpose
of assessment, a correction (as a function of temperature, pH, and salinity) has
been applied based on the EPD monitoring data, i.e. temperature of 24°C,
salinity of 28 ppt and pH of 8 which represent the typical conditions of Hong
Kong waters. From this it is derived that UIA constitutes 5% of ammonia
nitrogen. In view that the mineralisation of the organic nitrogen will also
contribute to ammonia, the calculation of NH3-N is based on average TKN
(Total Kjeldahl Nitrogen, which is a measurement of both ammonia nitrogen
and organic nitrogen) concentrations (mg/kg) in the sediment at EPD station
SS6 (2004-2013). Note that it is a highly conservative approach since it is
assumed that 100% of organic nitrogen will be mineralised to ammonia but
this is unlikely to occur in reality.
The maximum SS concentration at each WSR is multiplied by 5% of TKN concentration in the sediment to predict the maximum UIA elevations.
UIA = Max SS × TKN × 5%
Where (1) it is assumed that 100% of organic nitrogen in TKN will be mineralised to ammonia;
(2) TKN concentration in the sediment is 321×10-6 kg/kg.
The maximum predicted SS concentration at each WSR is multiplied by the average concentration of TIN in sediment (mg/kg) in the SWCZ based on EPD Sediment Monitoring Stations to give the maximum TIN increase (mg/L) in water column. TIN is composed of ammonia nitrogen, nitrate nitrogen and nitrite nitrogen. In accordance with sediment test results of TKN (100% of organic nitrogen in TKN is assumed to be mineralised to ammonia as conservative method) from the nearest EPD station SS6 (2004-2013) and the

ENVIRONMENTAL RESOURCES MANAGEMENT B&V
0227541_ANNEX 4A_WQMS_20160616.DOC 09 AUGUST 2016
ANNEX 4A - 13
sediment survey results (nitrate and nitrite nitrogen) from the other approved
EIA (1), the calculations of TIN elevation are shown below.
TIN = Max SS × (TKN + nitrate nitrogen + nitrite nitrogen)
Where (1) it is assumed 100% of organic nitrogen in TKN will be mineralised to ammonia and TKN concentration in the sediment is 321×10-6 kg/kg;
(2) total nitrate and nitrite nitrogen in the sediment (1) is 1×10⁻⁶ kg/kg.
4A3.2 WORKING TIME
It is understood that the entire effluent outfall pipe from the proposed San
Shek Wan STW will be installed via an underground cavity by directional
drilling. For the outfall portion extending from the coastline, it will be
installed by directional drilling under the seabed (at a depth of approximately
-65 mPD). As such, installation of this portion of the outfall pipe is not
anticipated to affect water quality. Dredging is limited to an area of the
seabed at the discharge point of the outfall (about 39m x 33m at the end of the
outfall pipe) for the installation of the above-seabed portion (i.e. diffusers) of
the outfall.
The works programme for dredging activities for the proposed submarine
outfall in Pui O Wan is based on the assumption of a 12 working hour day
with 7 working days per week, using grab dredgers.
4A3.3 OVERVIEW OF DREDGING PLANT - GRAB DREDGERS
Grab dredgers may release sediment into suspension by the following
mechanisms:
• Impact of the grab on the seabed as it is lowered;
• Washing of sediment off the outside of the grab as it is raised through the
water column and when it is lowered again after being emptied;
• Leakage of water from the grab as it is hauled above the water surface;
• Spillage of sediment from over-full grabs;
• Loss from grabs which cannot be fully closed due to the presence of
debris;
• Release by splashing when loading barges by careless, inaccurate
methods; and
(1) ERM (2009). Development of a 100MW Offshore Wind Farm in Hong Kong. The Hong Kong Electric Co. Ltd.

ENVIRONMENTAL RESOURCES MANAGEMENT B&V
0227541_ANNEX 4A_WQMS_20160616.DOC 09 AUGUST 2016
ANNEX 4A - 14
• Disturbance of the seabed as the closed grab is removed.
In the transport of dredging materials, sediment may be lost through leakage
from barges. However, dumping permits in Hong Kong include
requirements that barges used for the transport of dredging materials have
bottom-doors that are properly maintained and have tight-fitting seals in
order to prevent leakage. Given this requirement, sediment release during
transport is not proposed for modelling and its impact on water quality will
not be addressed under this Study.
Sediment is also lost to the water column when discharging material at
disposal sites. The amount that is lost depends on a large number of factors
including material characteristics, the speed and manner in which it is
discharged from the vessel, and the characteristics of the disposal sites. It is
considered that potential water quality issues associated with disposal at the
intended government disposal site(s) have already been assessed by CEDD
and permitted by EPD, hence and the environmental acceptability of such
disposal operations is demonstrated. Therefore modelling of impacts at
disposal sites does not need to be addressed and reference to relevant studies
will be provided in the EIA for this Project where appropriate.
Loss rates have been taken from previously accepted EIAs in Hong Kong (1)(2)(3)
and have been based on a review of worldwide data on loss rates from
dredging operations undertaken as part of assessing the impacts of dredging
areas of Kellett Bank for mooring buoys(4). The assessment concluded that
for 8 m3 (minimum) grab dredgers working in areas with significant amounts
of debris on the seabed (such as in the vicinity of existing mooring buoys) that
the loss rates would be 25 kg m-3 dredged, while the grab dredger bucket size
in areas where debris is less likely to hinder operations could be 12 or 16 m3,
with a loss rate of 17 kg m-3. It is assumed there is little debris based on the
fact the area is away from marine works and heavy marine traffic / industry.
The value of 17 kg m-3, for dredgers with grab size of 12 or 16 m3, will
therefore be used for this Study.
Generally, a split-bottom barge could have a capacity of 900 m³. A bulk
factor of 1.3 would normally be applied, giving a dredging rate of about 700
m³ per barge. The hopper dry density for an 800 to 1,000 m3 capacity barge is
around 0.75 to 1.24 ton m-3. Assuming 12 working hours per day for the
proposed construction activities, with allowance on the demobilisation of
(1) ERM - Hong Kong, Ltd (2006) EIA Study for Liquefied Natural Gas (LNG) Receiving Terminal and Associated Facilities.
For CAPCO. Register No.: AEIAR-106/2007,
http://www.epd.gov.hk/eia/register/report/eiareport/eia_1252006/html/index.htm
(2) ERM (2005). Detailed Site Selection Study for a Contaminated Mud Disposal Facility within the Airport East/East of Sha
Chau Area. EIA and Final Site Selection Report. For CEDD. Approved on 1 September 2005. Register No.: AEIAR-
089/2005, http://www.epd.gov.hk/eia/register/report/eiareport/eia_1062005/index.htm
(3) ERM (2000). Construction of an International Theme Park in Penny’s Bay of North Lantau together with its Essential
Associated Infrastructures – Final EIA Report. For CEDD. Approved on 28 April 2000. Register No.: AEIAR-032/2000
http://www.epd.gov.hk/eia/register/report/eiareport/eia_0412000/index.html
(4) ERM (1997). EIA: Dredging an Area of Kellett Bank for Reprovisioning of Six Government Mooring Bays. Working Paper on
Design Scenarios. For CEDD.
ENVIRONMENTAL RESOURCES MANAGEMENT B&V
0227541_ANNEX 4A_WQMS_20160616.DOC 09 AUGUST 2016
ANNEX 4A - 15
filled barge and remobilisation of empty barges, approximately 5 barges could
be filled per day, giving a daily dredging rate of approximately 3,500 m3.
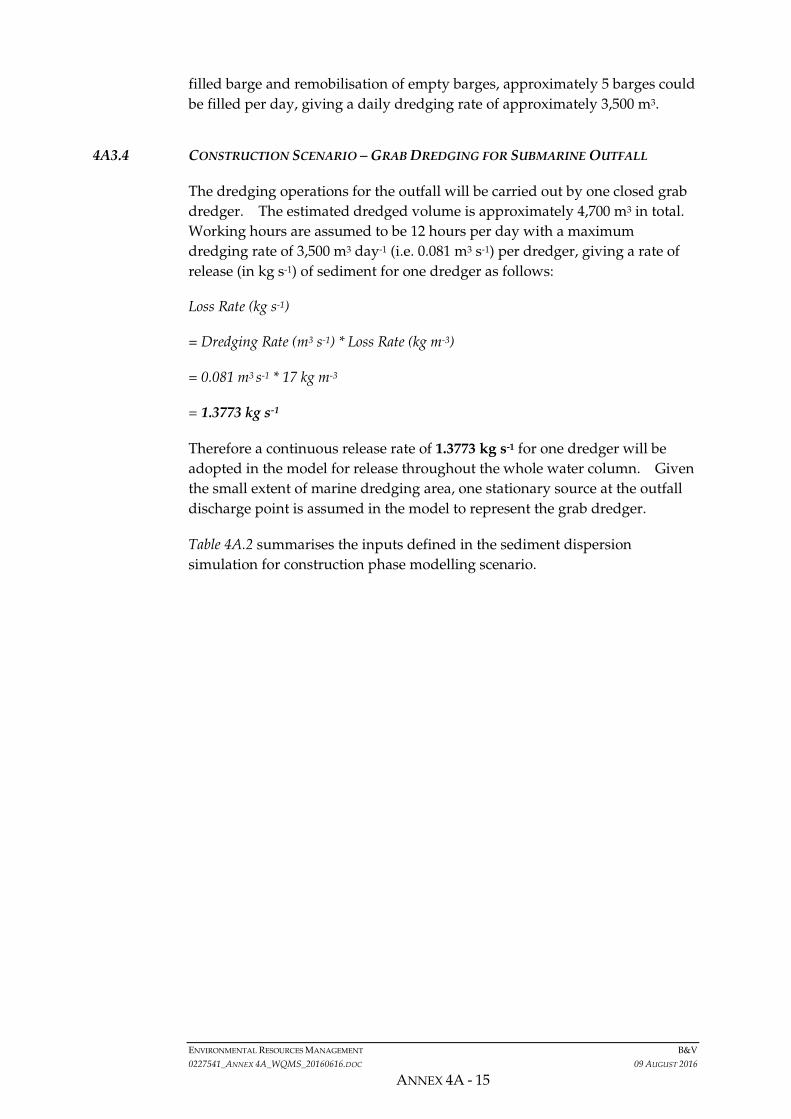
4A3.4 CONSTRUCTION SCENARIO – GRAB DREDGING FOR SUBMARINE OUTFALL
The dredging operations for the outfall will be carried out by one closed grab
dredger. The estimated dredged volume is approximately 4,700 m3 in total.
Working hours are assumed to be 12 hours per day with a maximum
dredging rate of 3,500 m3 day-1 (i.e. 0.081 m3 s-1) per dredger, giving a rate of
release (in kg s-1) of sediment for one dredger as follows:
Loss Rate (kg s-1)
= Dredging Rate (m3 s-1) * Loss Rate (kg m-3)
= 0.081 m3 s-1 * 17 kg m-3
= 1.3773 kg s-1
Therefore a continuous release rate of 1.3773 kg s-1 for one dredger will be
adopted in the model for release throughout the whole water column. Given
the small extent of marine dredging area, one stationary source at the outfall
discharge point is assumed in the model to represent the grab dredger.
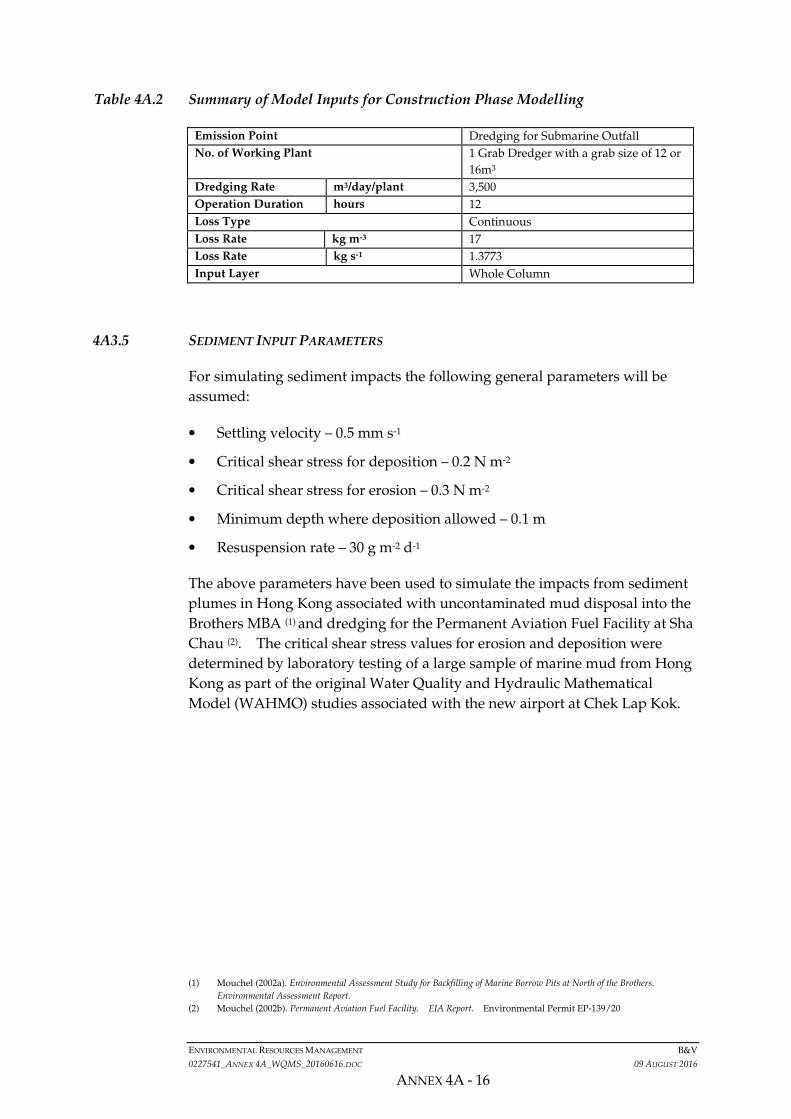
Table 4A.2 summarises the inputs defined in the sediment dispersion
simulation for construction phase modelling scenario.
ENVIRONMENTAL RESOURCES MANAGEMENT B&V
0227541_ANNEX 4A_WQMS_20160616.DOC 09 AUGUST 2016
ANNEX 4A - 16
Table 4A.2 Summary of Model Inputs for Construction Phase Modelling
Emission Point Dredging for Submarine Outfall
No. of Working Plant 1 Grab Dredger with a grab size of 12 or
16m3
Dredging Rate m3/day/plant 3,500
Operation Duration hours 12
Loss Type Continuous
Loss Rate kg m-3 17
Loss Rate kg s-1 1.3773
Input Layer Whole Column
4A3.5 SEDIMENT INPUT PARAMETERS
For simulating sediment impacts the following general parameters will be
assumed:
• Settling velocity – 0.5 mm s-1
• Critical shear stress for deposition – 0.2 N m-2
• Critical shear stress for erosion – 0.3 N m-2
• Minimum depth where deposition allowed – 0.1 m
• Resuspension rate – 30 g m-2 d-1
The above parameters have been used to simulate the impacts from sediment
plumes in Hong Kong associated with uncontaminated mud disposal into the
Brothers MBA (1) and dredging for the Permanent Aviation Fuel Facility at Sha
Chau (2). The critical shear stress values for erosion and deposition were
determined by laboratory testing of a large sample of marine mud from Hong
Kong as part of the original Water Quality and Hydraulic Mathematical
Model (WAHMO) studies associated with the new airport at Chek Lap Kok.
(1) Mouchel (2002a). Environmental Assessment Study for Backfilling of Marine Borrow Pits at North of the Brothers.
Environmental Assessment Report.
(2) Mouchel (2002b). Permanent Aviation Fuel Facility. EIA Report. Environmental Permit EP-139/20

ENVIRONMENTAL RESOURCES MANAGEMENT B&V
0227541_ANNEX 4A_WQMS_20160616.DOC 09 AUGUST 2016
ANNEX 4A - 17
4A4 OPERATION PHASE
4A4.1 OPERATION SCENARIO
For the study of operational effects, the approach requires several steps:
1) Running near-field models (i.e. CORMIX) for the operational discharges
to characterise the initial mixing of the effluent discharge. The results
from the CORMIX analysis will also provide information of the near field
dispersion and dilution of the effluent plumes.
2) Adapting the hydrodynamic model for the new conditions, i.e. to include
the discharges from San Shek Wan STW.
3) Running the hydrodynamic model for the specified conditions (wet/dry
season) covering a spring-neap cycle.
4) Running the water quality model. A “full water quality model”
approach is proposed in which nutrients will be simulated explicitly.
The objective of the water quality modelling is to quantitatively assess the
concentrations of key water quality variables (e.g. SS, E. coli, NH3-N, etc.)
as a result of effluent discharge from the submarine outfall in the far field.
The general water quality is the result of transport phenomena and
transformation and retention processes. The operation of the project may
locally affect the transport patterns. Transformation and retention processes
are not affected. Consequently, validation of the Delft3D-WAQ model is not
required.
4A4.1.1 Effluent Discharge
The latest project information suggests that the treatment capacity, i.e.
Average Dry Weather Flow (ADWF) of the proposed San Shek Wan STW is
about 5,800 m3/day. The Peak Wet Weather Flow (PWWF) is 14,500 m3/day.
The ADWF and PWWF will be simulated in the operation phase modelling
scenarios using CORMIX and Delft3D-WAQ models.
The proposed effluent standards upon commissioning of the STW are
summarised in Table 4A.3. The effluent standards proposed for the STW are
30 mg/L, 30 mg/L, 20 mg/L and 1000 cfu/100mL for TN, TSS, BOD, and
E. coli respectively.
Table 4A.3 Proposed Effluent Discharge Standards of STW upon Commissioning and
Effluent Discharge Standards Adopted in Water Quality Modelling
Parameters (1) Proposed Effluent Discharge Standards for STW (2)
ENVIRONMENTAL RESOURCES MANAGEMENT B&V
0227541_ANNEX 4A_WQMS_20160616.DOC 09 AUGUST 2016
ANNEX 4A - 18
Parameters (1) Proposed Effluent Discharge Standards for STW (2)
Flow rate (m3/day) 5,800 (ADWF); 14,500 (PWWF)
Total Nitrogen (TN) 30
BOD 20
TSS 30
E. coli (cfu/100ml) 1,000
Note:
(1) All units in mg/L unless otherwise stated.
(2) Proposed water discharge standards are upper limits of effluent concentration for the STW design.
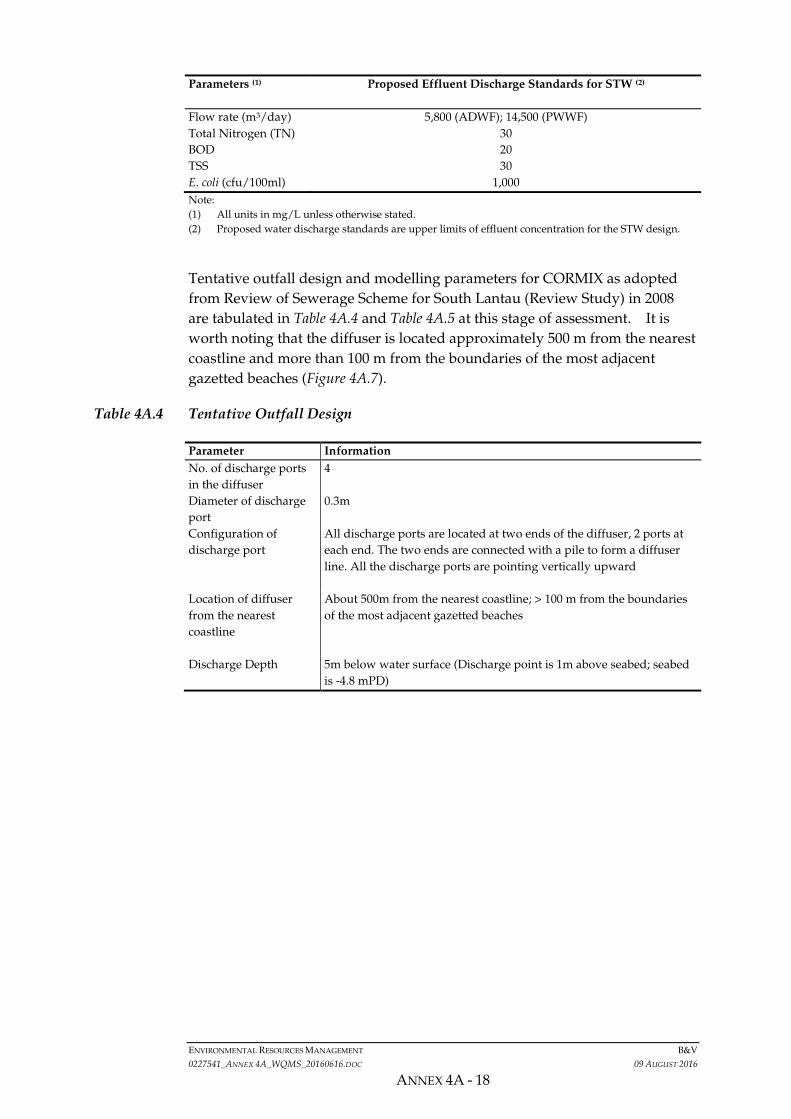
Tentative outfall design and modelling parameters for CORMIX as adopted
from Review of Sewerage Scheme for South Lantau (Review Study) in 2008
are tabulated in Table 4A.4 and Table 4A.5 at this stage of assessment. It is
worth noting that the diffuser is located approximately 500 m from the nearest
coastline and more than 100 m from the boundaries of the most adjacent
gazetted beaches (Figure 4A.7).
Table 4A.4 Tentative Outfall Design
Parameter Information
No. of discharge ports
in the diffuser
4
Diameter of discharge
port
0.3m
Configuration of
discharge port
All discharge ports are located at two ends of the diffuser, 2 ports at
each end. The two ends are connected with a pile to form a diffuser
line. All the discharge ports are pointing vertically upward
Location of diffuser
from the nearest
coastline
About 500m from the nearest coastline; > 100 m from the boundaries
of the most adjacent gazetted beaches
Discharge Depth 5m below water surface (Discharge point is 1m above seabed; seabed
is -4.8 mPD)

")")
")
!(
")
Figure no.
Checked
OUTLYING ISLANDS SEWERAGE STAGE 2SOUTH LANTAU SEWERAGE WORKS -
INVESTIGATION
THE GOVERNMENT OF THEHONG KONG
SPECIAL ADMINISTRATIVE REGIONDRAINAGE SERVICES DEPARTMENT
香香香香香香香香香香香香
Title
B LA C K & V E AT C H H O N G K O N G L I M I TE D
File: T:\GIS\CONTRACT\0227541\Mxd\0227541_Distance_Outfall_Diffuser_to_PO_LCS.mxdDate: 7/4/2016
Measured Distance from the Outfall Diffuser to Pui O & Lower Cheung Sha Beach Boundaries
Figure 4A.7
Prepared
Date Scale
0 0.5 10.25Kilometers´
Key
Project Boundary
Cheung Sha Lower Beach
Pui O Beach
") pumping station
!( sewage treatment works
Proposed Sewer
Proposed Submarine Outfall
Proposed Rising Main
Proposed Emergency Bypass
Lantau Island
1024
m
1364m
!(
ENVIRONMENTAL RESOURCES MANAGEMENT B&V
0227541_ANNEX 4A_WQMS_20160616.DOC 09 AUGUST 2016
ANNEX 4A - 19
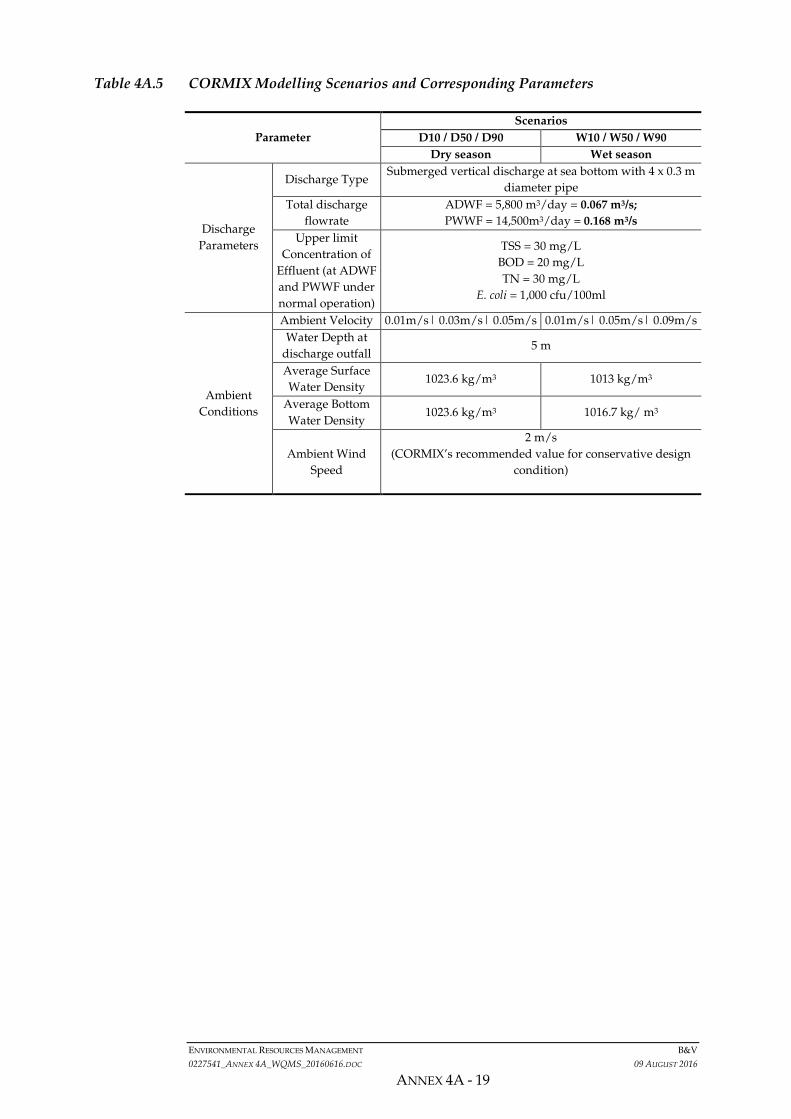
Table 4A.5 CORMIX Modelling Scenarios and Corresponding Parameters
Parameter
Scenarios
D10 / D50 / D90 W10 / W50 / W90
Dry season Wet season
Discharge
Parameters
Discharge Type Submerged vertical discharge at sea bottom with 4 x 0.3 m
diameter pipe
Total discharge
flowrate
ADWF = 5,800 m3/day = 0.067 m3/s;
PWWF = 14,500m3/day = 0.168 m3/s
Upper limit
Concentration of
Effluent (at ADWF
and PWWF under
normal operation)
TSS = 30 mg/L
BOD = 20 mg/L
TN = 30 mg/L
E. coli = 1,000 cfu/100ml
Ambient
Conditions
Ambient Velocity 0.01m/s| 0.03m/s| 0.05m/s 0.01m/s| 0.05m/s| 0.09m/s
Water Depth at
discharge outfall 5 m
Average Surface
Water Density 1023.6 kg/m3 1013 kg/m3
Average Bottom
Water Density 1023.6 kg/m3 1016.7 kg/ m3
Ambient Wind
Speed
2 m/s
(CORMIX’s recommended value for conservative design
condition)
ENVIRONMENTAL RESOURCES MANAGEMENT B&V
0227541_ANNEX 4A_WQMS_20160616.DOC 09 AUGUST 2016
ANNEX 4A - 20
4A5 EMERGENCY DISCHARGE
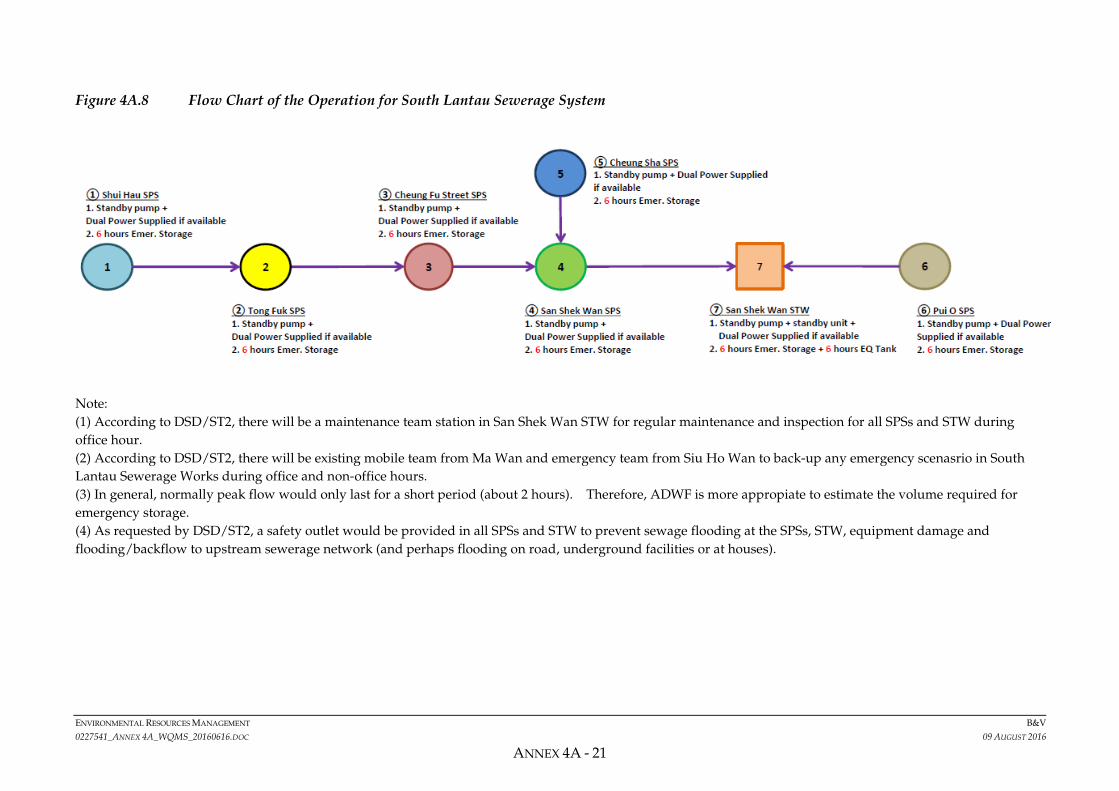
The latest scheme indicates there are six trunk sewage pumping stations
(SPSs) in Shui Hau, Tong Fuk, Cheung Fu Street, Cheung Sha, San Shek Wan
and Pui O; and one STW in San Shek Wan. The work flow for the operation
of South Lantau sewerage system is shown in Figure 4A.8.
ENVIRONMENTAL RESOURCES MANAGEMENT B&V
0227541_ANNEX 4A_WQMS_20160616.DOC 09 AUGUST 2016
ANNEX 4A - 21
Figure 4A.8 Flow Chart of the Operation for South Lantau Sewerage System
Note:
(1) According to DSD/ST2, there will be a maintenance team station in San Shek Wan STW for regular maintenance and inspection for all SPSs and STW during
office hour.
(2) According to DSD/ST2, there will be existing mobile team from Ma Wan and emergency team from Siu Ho Wan to back-up any emergency scenasrio in South
Lantau Sewerage Works during office and non-office hours.
(3) In general, normally peak flow would only last for a short period (about 2 hours). Therefore, ADWF is more appropiate to estimate the volume required for
emergency storage.
(4) As requested by DSD/ST2, a safety outlet would be provided in all SPSs and STW to prevent sewage flooding at the SPSs, STW, equipment damage and
flooding/backflow to upstream sewerage network (and perhaps flooding on road, underground facilities or at houses).
ENVIRONMENTAL RESOURCES MANAGEMENT B&V
0227541_ANNEX 4A_WQMS_20160616.DOC 09 AUGUST 2016
ANNEX 4A - 22
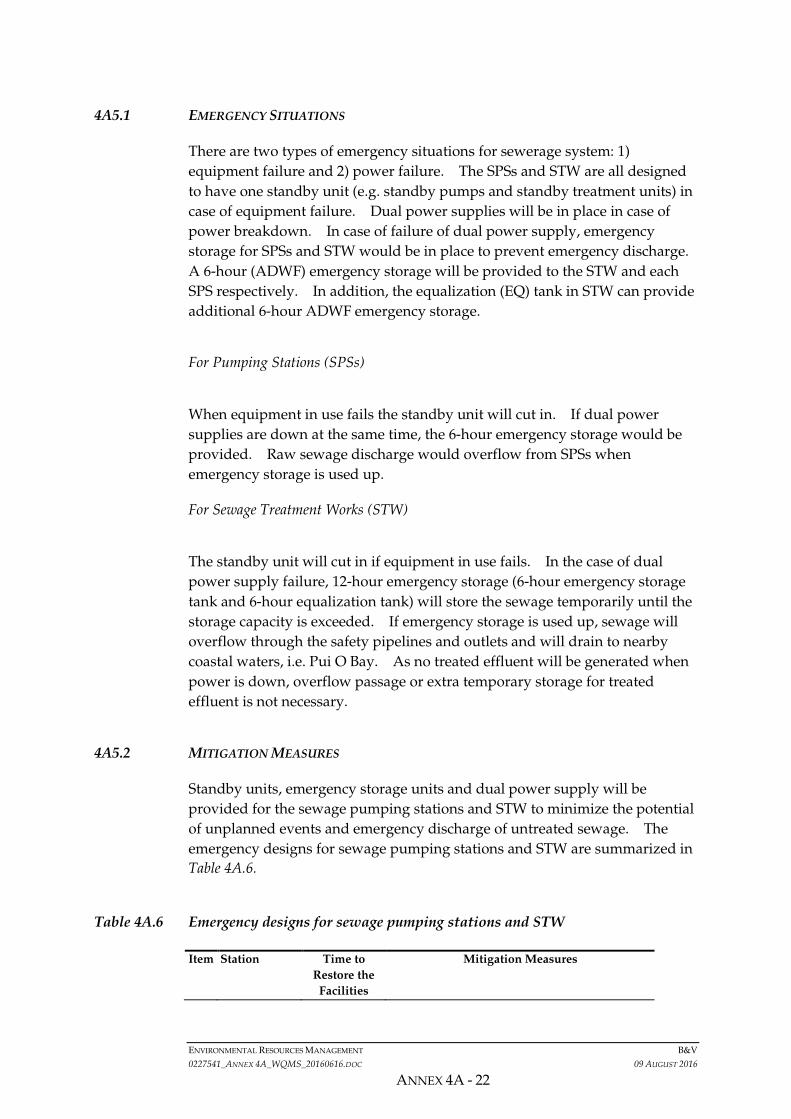
4A5.1 EMERGENCY SITUATIONS
There are two types of emergency situations for sewerage system: 1)
equipment failure and 2) power failure. The SPSs and STW are all designed
to have one standby unit (e.g. standby pumps and standby treatment units) in
case of equipment failure. Dual power supplies will be in place in case of
power breakdown. In case of failure of dual power supply, emergency
storage for SPSs and STW would be in place to prevent emergency discharge.
A 6-hour (ADWF) emergency storage will be provided to the STW and each
SPS respectively. In addition, the equalization (EQ) tank in STW can provide
additional 6-hour ADWF emergency storage.
For Pumping Stations (SPSs)
When equipment in use fails the standby unit will cut in. If dual power
supplies are down at the same time, the 6-hour emergency storage would be
provided. Raw sewage discharge would overflow from SPSs when
emergency storage is used up.
For Sewage Treatment Works (STW)
The standby unit will cut in if equipment in use fails. In the case of dual
power supply failure, 12-hour emergency storage (6-hour emergency storage
tank and 6-hour equalization tank) will store the sewage temporarily until the
storage capacity is exceeded. If emergency storage is used up, sewage will
overflow through the safety pipelines and outlets and will drain to nearby
coastal waters, i.e. Pui O Bay. As no treated effluent will be generated when
power is down, overflow passage or extra temporary storage for treated
effluent is not necessary.
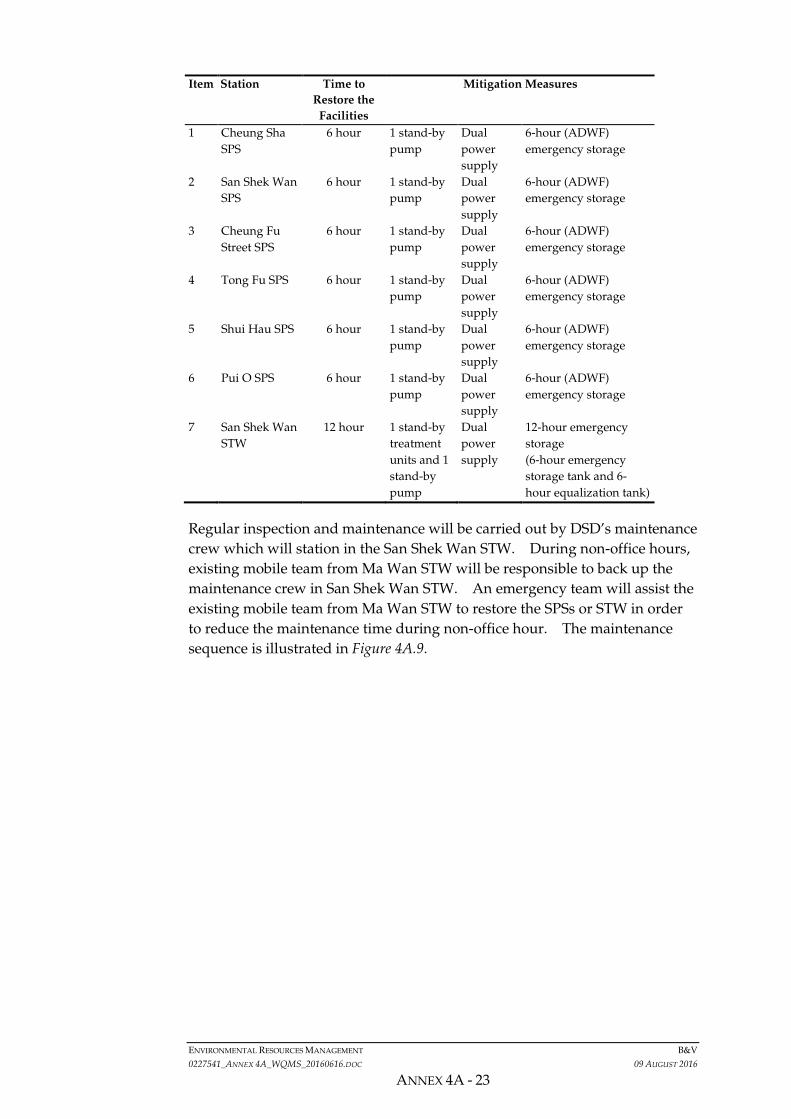
4A5.2 MITIGATION MEASURES
Standby units, emergency storage units and dual power supply will be
provided for the sewage pumping stations and STW to minimize the potential
of unplanned events and emergency discharge of untreated sewage. The
emergency designs for sewage pumping stations and STW are summarized in
Table 4A.6.
Table 4A.6 Emergency designs for sewage pumping stations and STW
Item Pumping Station Time to
Restore the
Facilities
Mitigation Measures
ENVIRONMENTAL RESOURCES MANAGEMENT B&V
0227541_ANNEX 4A_WQMS_20160616.DOC 09 AUGUST 2016
ANNEX 4A - 23
Item Pumping Station Time to
Restore the
Facilities
Mitigation Measures
1 Cheung Sha
SPS
6 hour 1 stand-by
pump
Dual
power
supply
6-hour (ADWF)
emergency storage
2 San Shek Wan
SPS
6 hour 1 stand-by
pump
Dual
power
supply
6-hour (ADWF)
emergency storage
3 Cheung Fu
Street SPS
6 hour 1 stand-by
pump
Dual
power
supply
6-hour (ADWF)
emergency storage
4 Tong Fu SPS 6 hour 1 stand-by
pump
Dual
power
supply
6-hour (ADWF)
emergency storage
5 Shui Hau SPS 6 hour 1 stand-by
pump
Dual
power
supply
6-hour (ADWF)
emergency storage
6 Pui O SPS 6 hour 1 stand-by
pump
Dual
power
supply
6-hour (ADWF)
emergency storage
7 San Shek Wan
STW
12 hour 1 stand-by
treatment
units and 1
stand-by
pump
Dual
power
supply
12-hour emergency
storage
(6-hour emergency
storage tank and 6-
hour equalization tank)
Regular inspection and maintenance will be carried out by DSD’s maintenance
crew which will station in the San Shek Wan STW. During non-office hours,
existing mobile team from Ma Wan STW will be responsible to back up the
maintenance crew in San Shek Wan STW. An emergency team will assist the
existing mobile team from Ma Wan STW to restore the SPSs or STW in order
to reduce the maintenance time during non-office hour. The maintenance
sequence is illustrated in Figure 4A.9.

ENVIRONMENTAL RESOURCES MANAGEMENT B&V
0227541_ANNEX 4A_WQMS_20160616.DOC 09 AUGUST 2016
ANNEX 4A - 24
Figure 4A.9 Maintenance Sequence under Emergency Situation
Note:
(1) Regular Team/Mobile Team provides 24 hours maintenance service.
(2) The actual gathering time for Regular Team/Mobile Team should be less than the proposed gathering time (ie 1 hour). For more conservative estimation, 1 hour
gathering time is assumed for regular team or mobile team to prepare.
(3) Under the worst case scenario, the function of wet well and chamber inside SPSs can also serve as an emergency tank. The wet well will be designed to store
addition 2 hours ADWF. As a result, the total time for emergency storage is not less than 6 hours.

ENVIRONMENTAL RESOURCES MANAGEMENT B&V
0227541_ANNEX 4A_WQMS_20160616.DOC 09 AUGUST 2016
ANNEX 4A - 25
Given the designed emergency storage together with the standby unit and
dual power supplies, the likelihood of raw sewage discharge from SPSs and
STW is extremely low. Nevertheless, a Emergency Response Plan will be
developed to deal with the occurrence of emergency discharge from the STW
and SPSs. The Emergency Response Plan should include the following:
• Locations of the sensitive receivers in vicinity of the emergency discharge;
• A list of relevant governmental bodies to inform of and to ask for
assistance in the event of emergency discharge, including key contact
persons and telephone numbers;
• Reporting procedures are required in the event of emergency discharge;
and
• Responsibilities and procedures for clean-up of the affected water
body/sensitive receivers after the emergency discharge.
4A5.3 MODEL EMERGENCY SCENARIOS
The model will account for emergency situations where there is raw sewage
overflow and affect the potential sensitive receivers in the coastal areas.
There are two emergency discharge scenarios to be examined.
Emergency Scenario 1 - Emergency Discharge from All 6 SPSs
If all the mitigation measures such as standby equipment and dual power
supply fail together at the same time, raw sewage is designed to route to 6-
hour emergency storage facility to avoid direct discharge to the surrounding
environment.
Although the likelihood of raw sewage discharge from SPSs and STW during
emergency is rather low, EPD suggested including raw sewage overflow from
all 6 SPSs in the model runs as Emergency Scenario 1 to investigate the extent
of potential impacts, in particular the gazetted beaches in the study area. It is
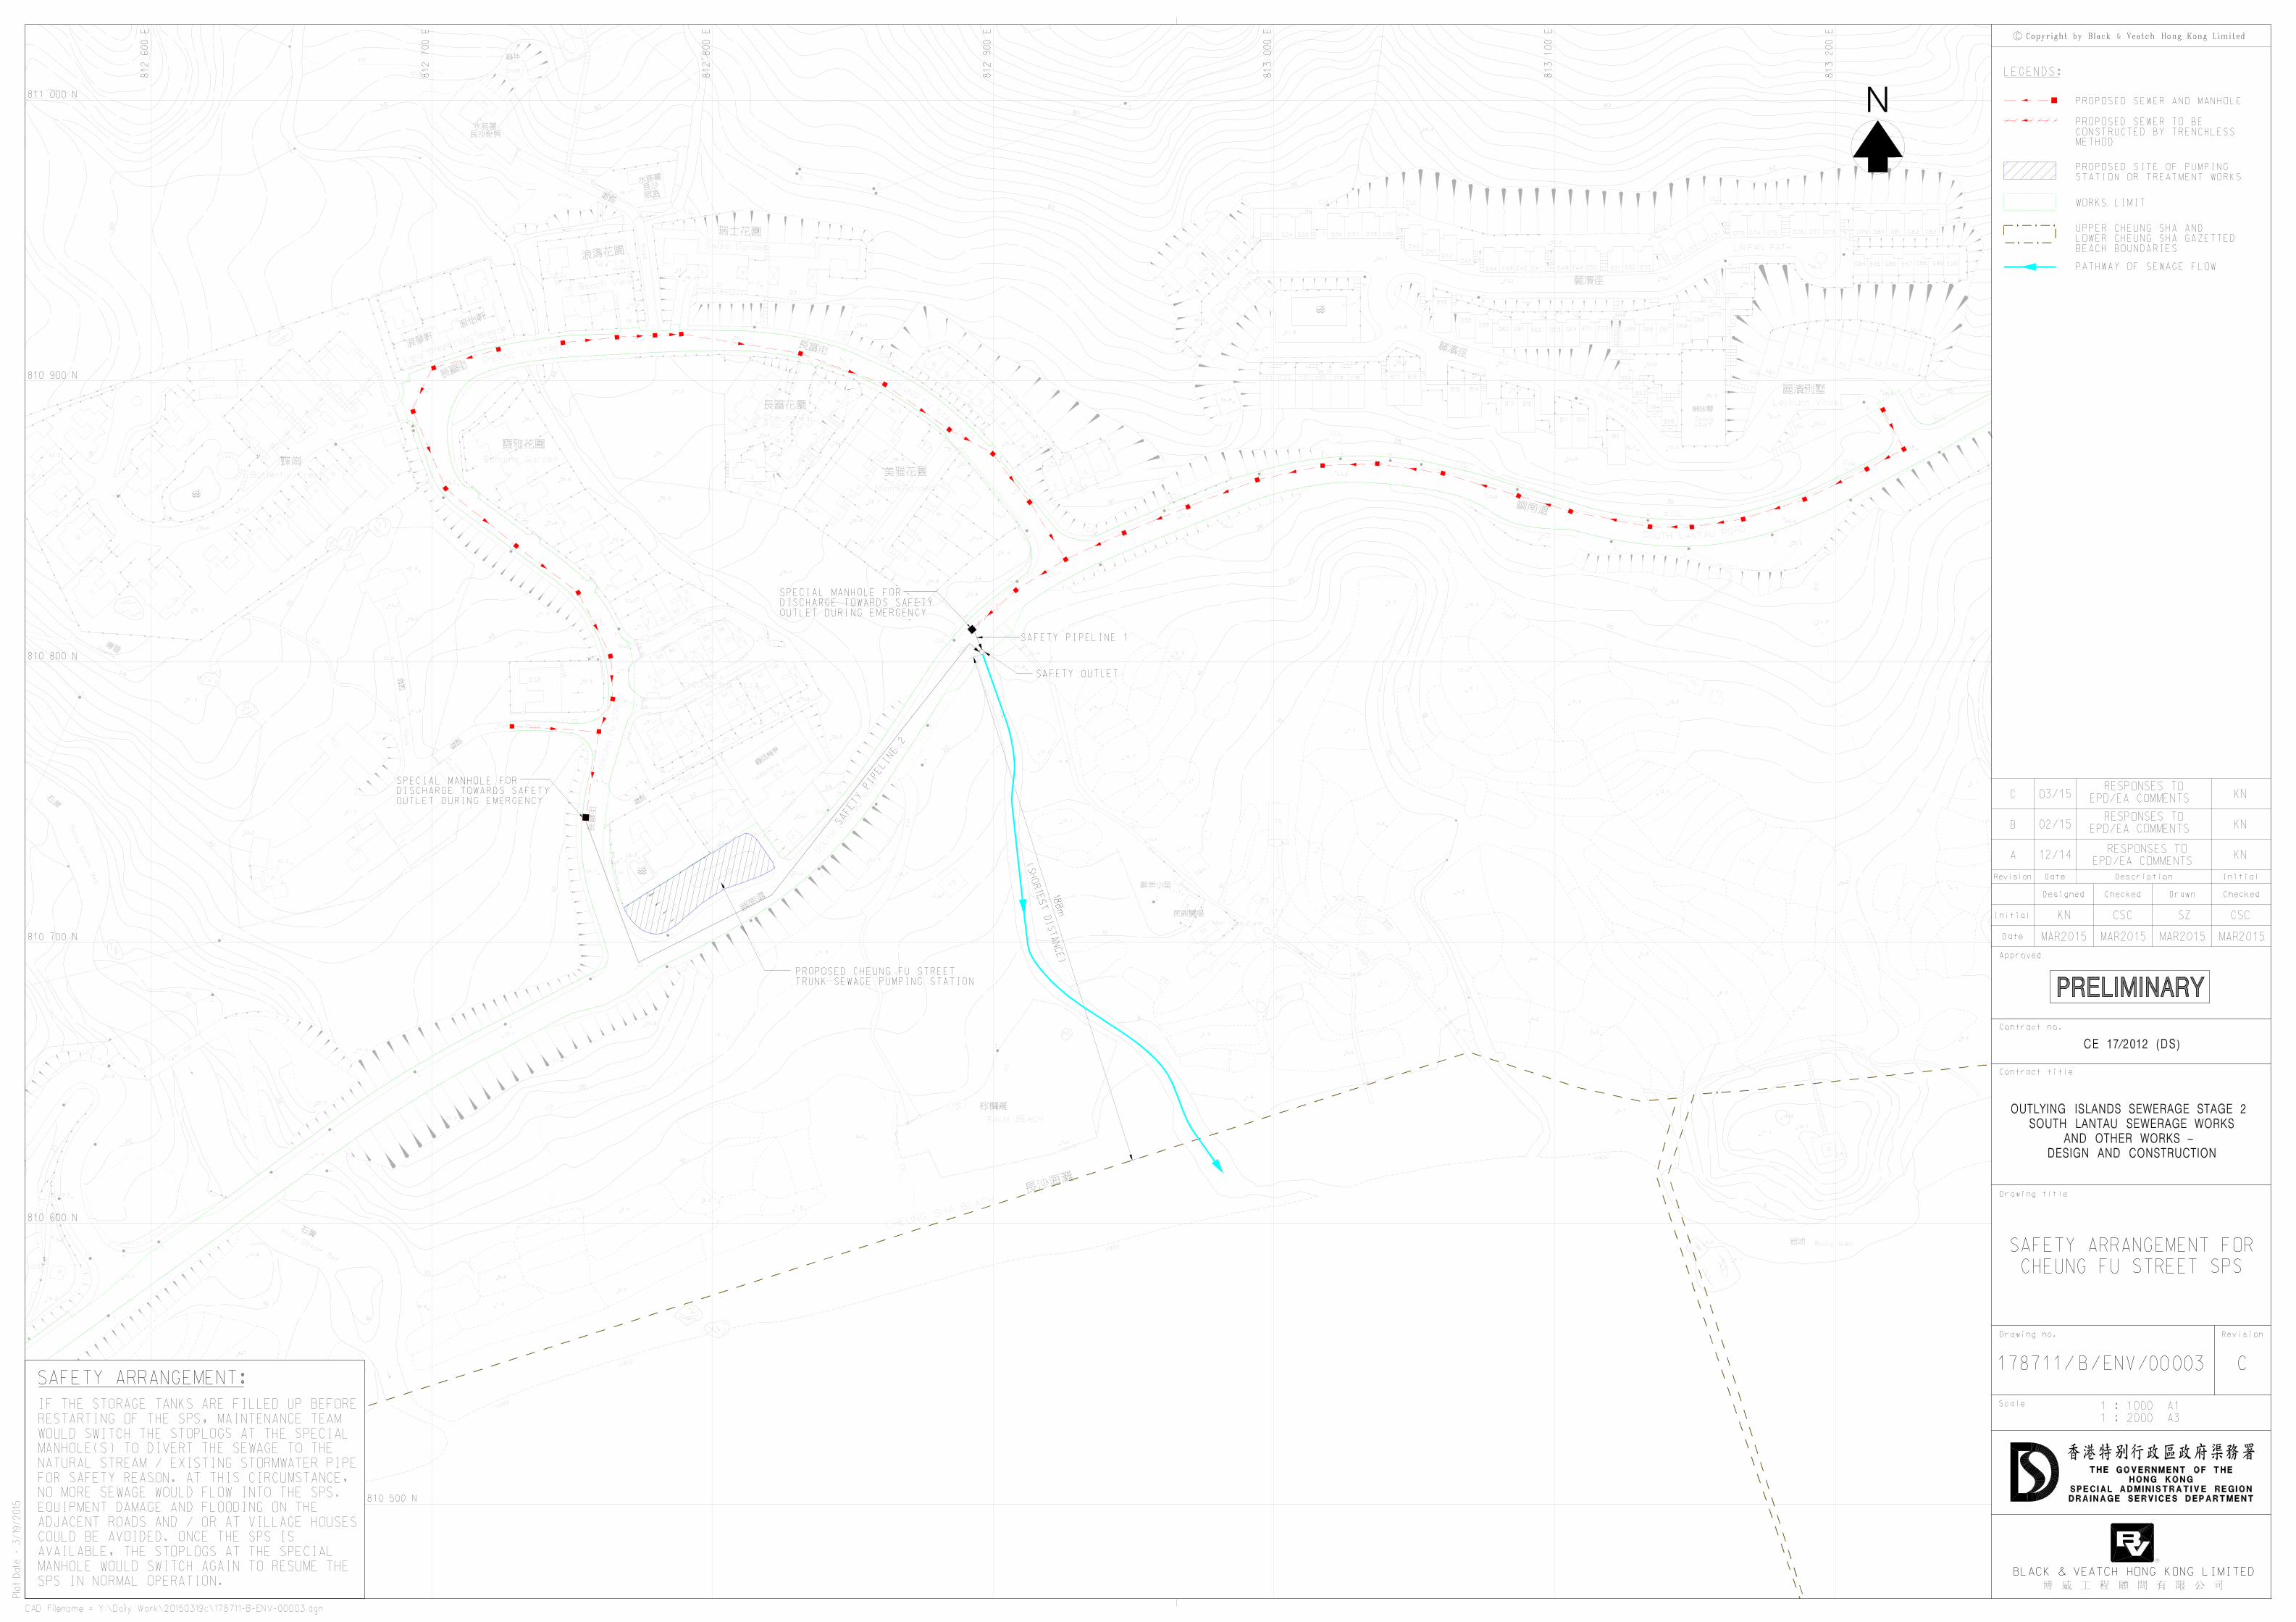
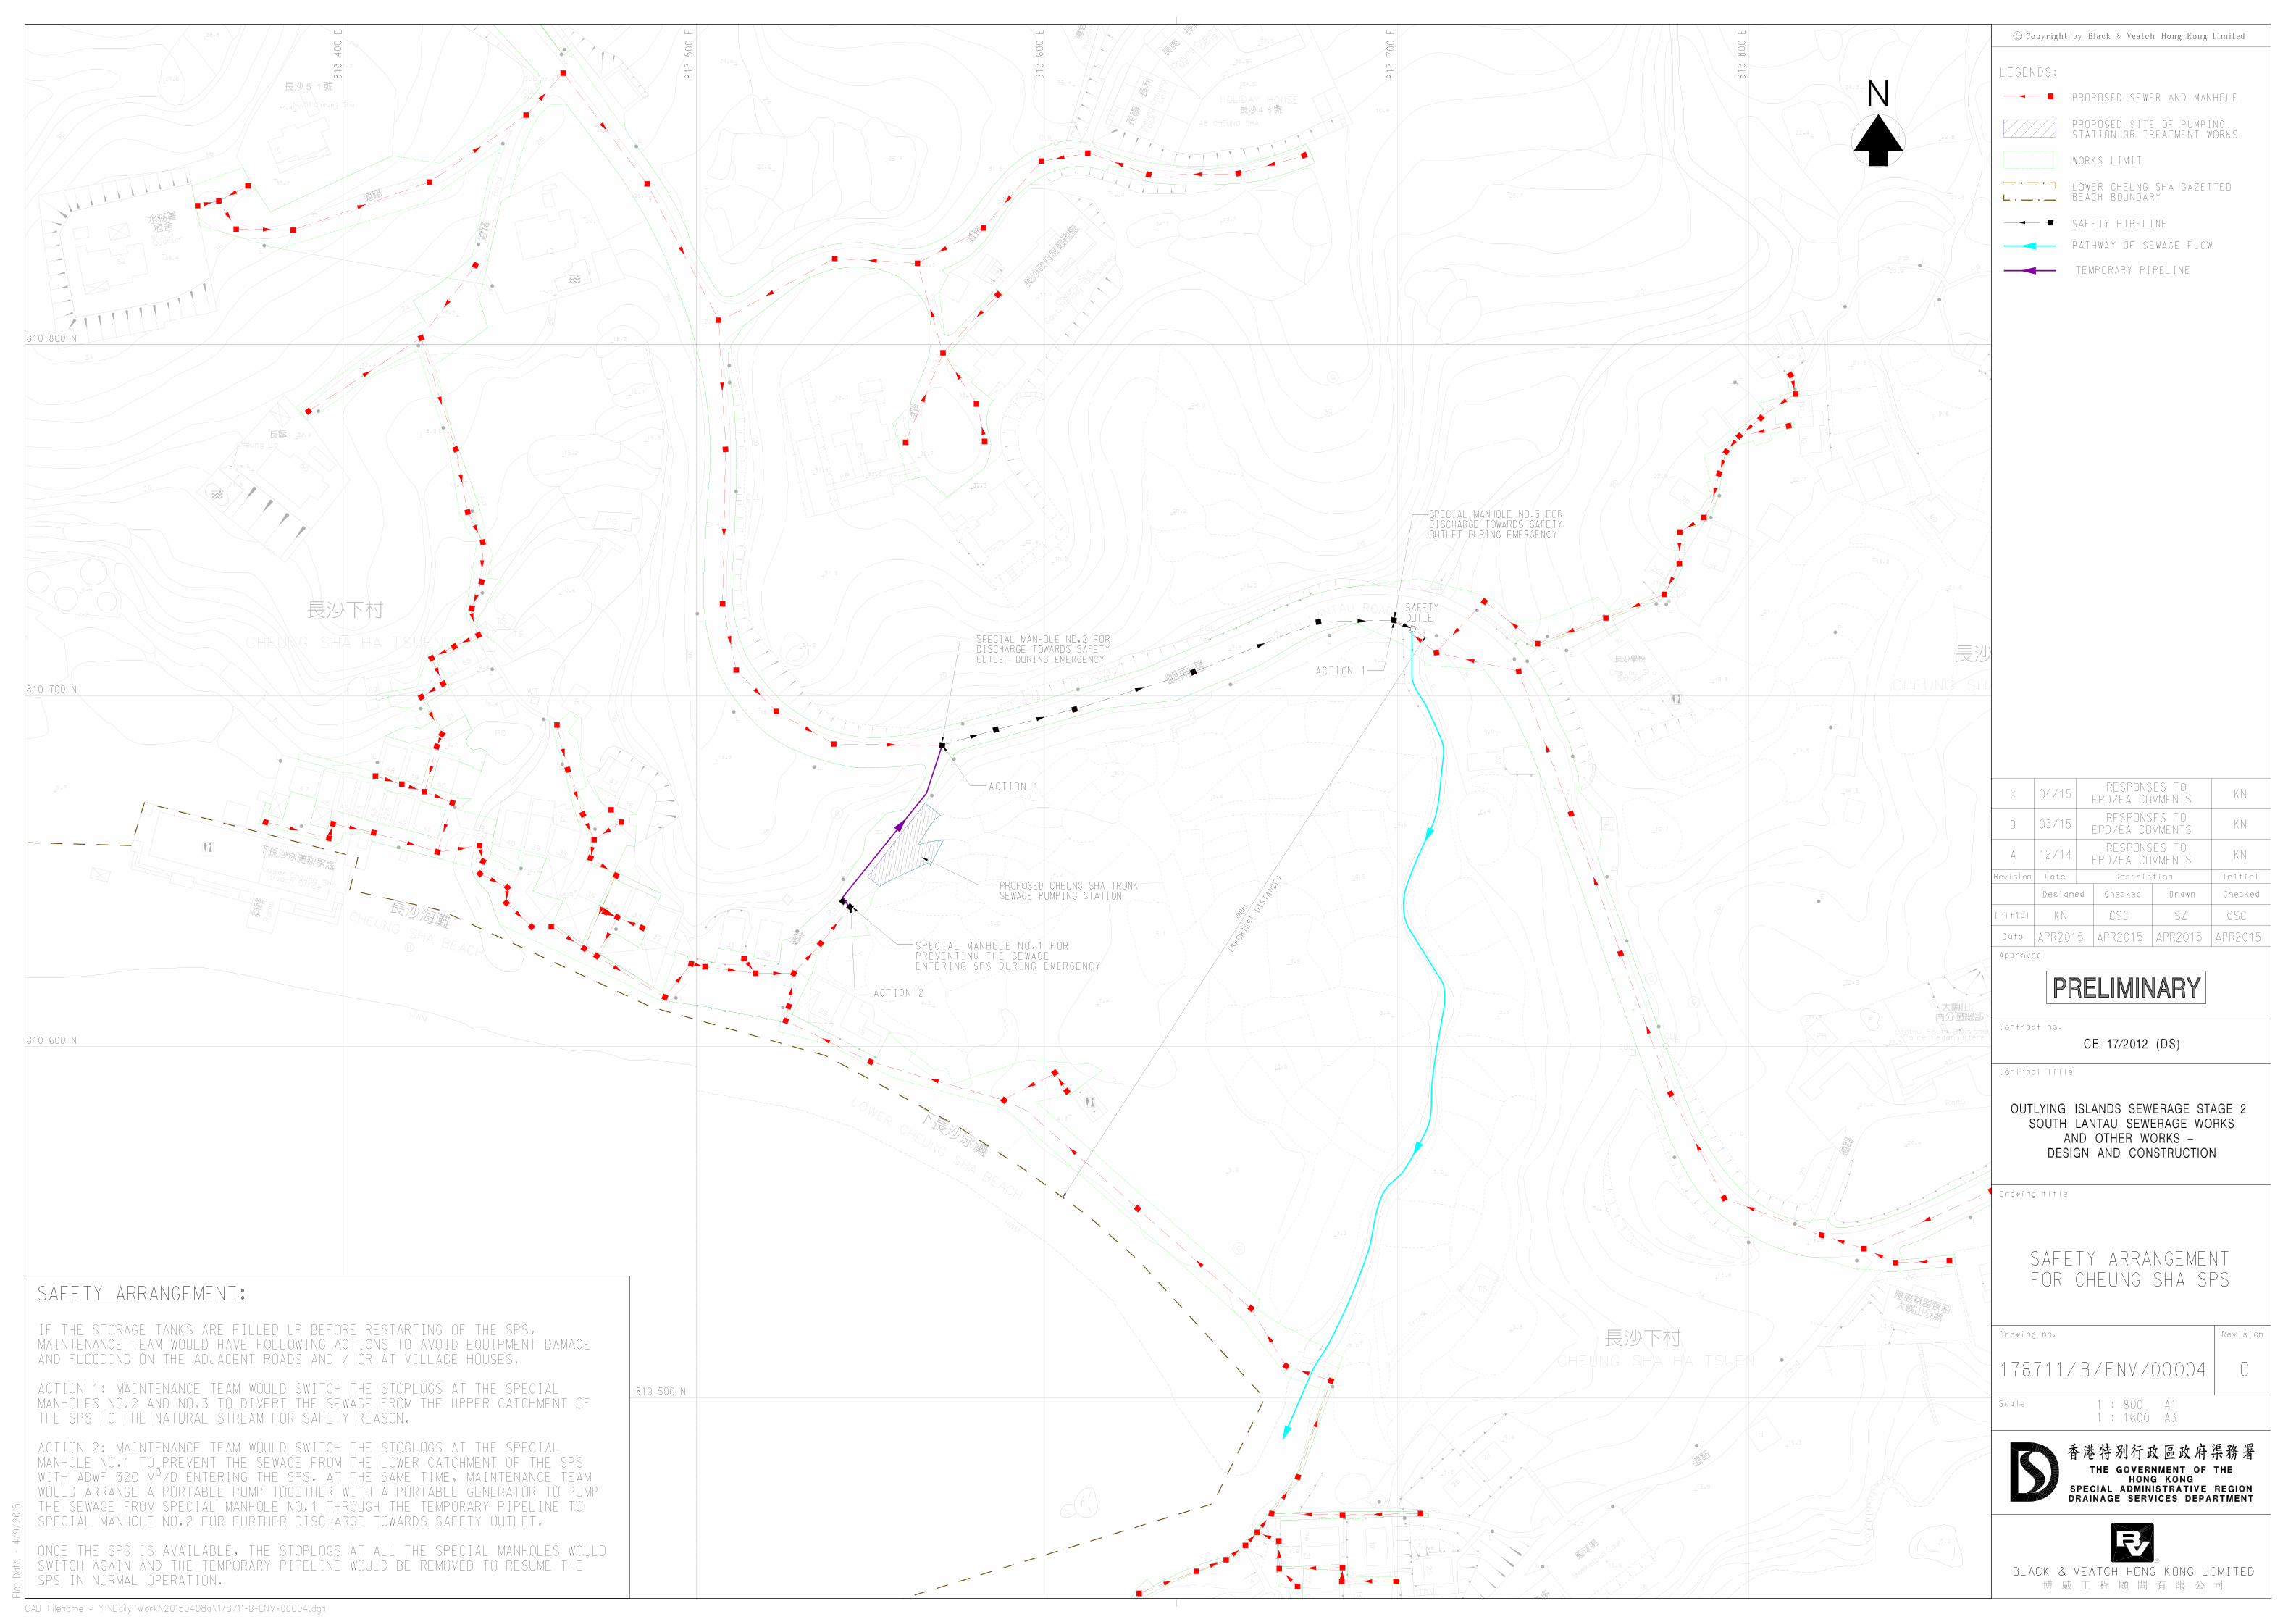
assumed that raw sewage will overflow from the SPSs for 2 hours and
discharge into streams through safety pipelines and outlets as shown in
Appendix 4A.1. The streams would dilute and direct the discharged raw
sewage into coastal water. Average Dry Weather Flow at each SPS and
estimated loads shown in Table 4A.8 are adopted for modelling.
Emergency Scenario 2 - Emergency Discharge from STW and Pui O SPS
In the event of emergency situations during operation phase of the Project, the
12-hour and 6-hour emergency storage are designed for the STW and Pui O
Trunk SPS respectively. The emergency storage in Pui O SPS will store the
flow from eastern side of the STW (i.e. Pui O villages) and the emergency

ENVIRONMENTAL RESOURCES MANAGEMENT B&V
0227541_ANNEX 4A_WQMS_20160616.DOC 09 AUGUST 2016
ANNEX 4A - 26
storage in the STW will serve for the flow from western side of the Project
Catchment Area (i.e. San Shek Wan SPS) in case of emergency.
Consequently, when there is power failure at the STW while other pumping
stations are working well, the sewage from western side of the Project
Catchment Area would be expected to reach the STW and all of it would be
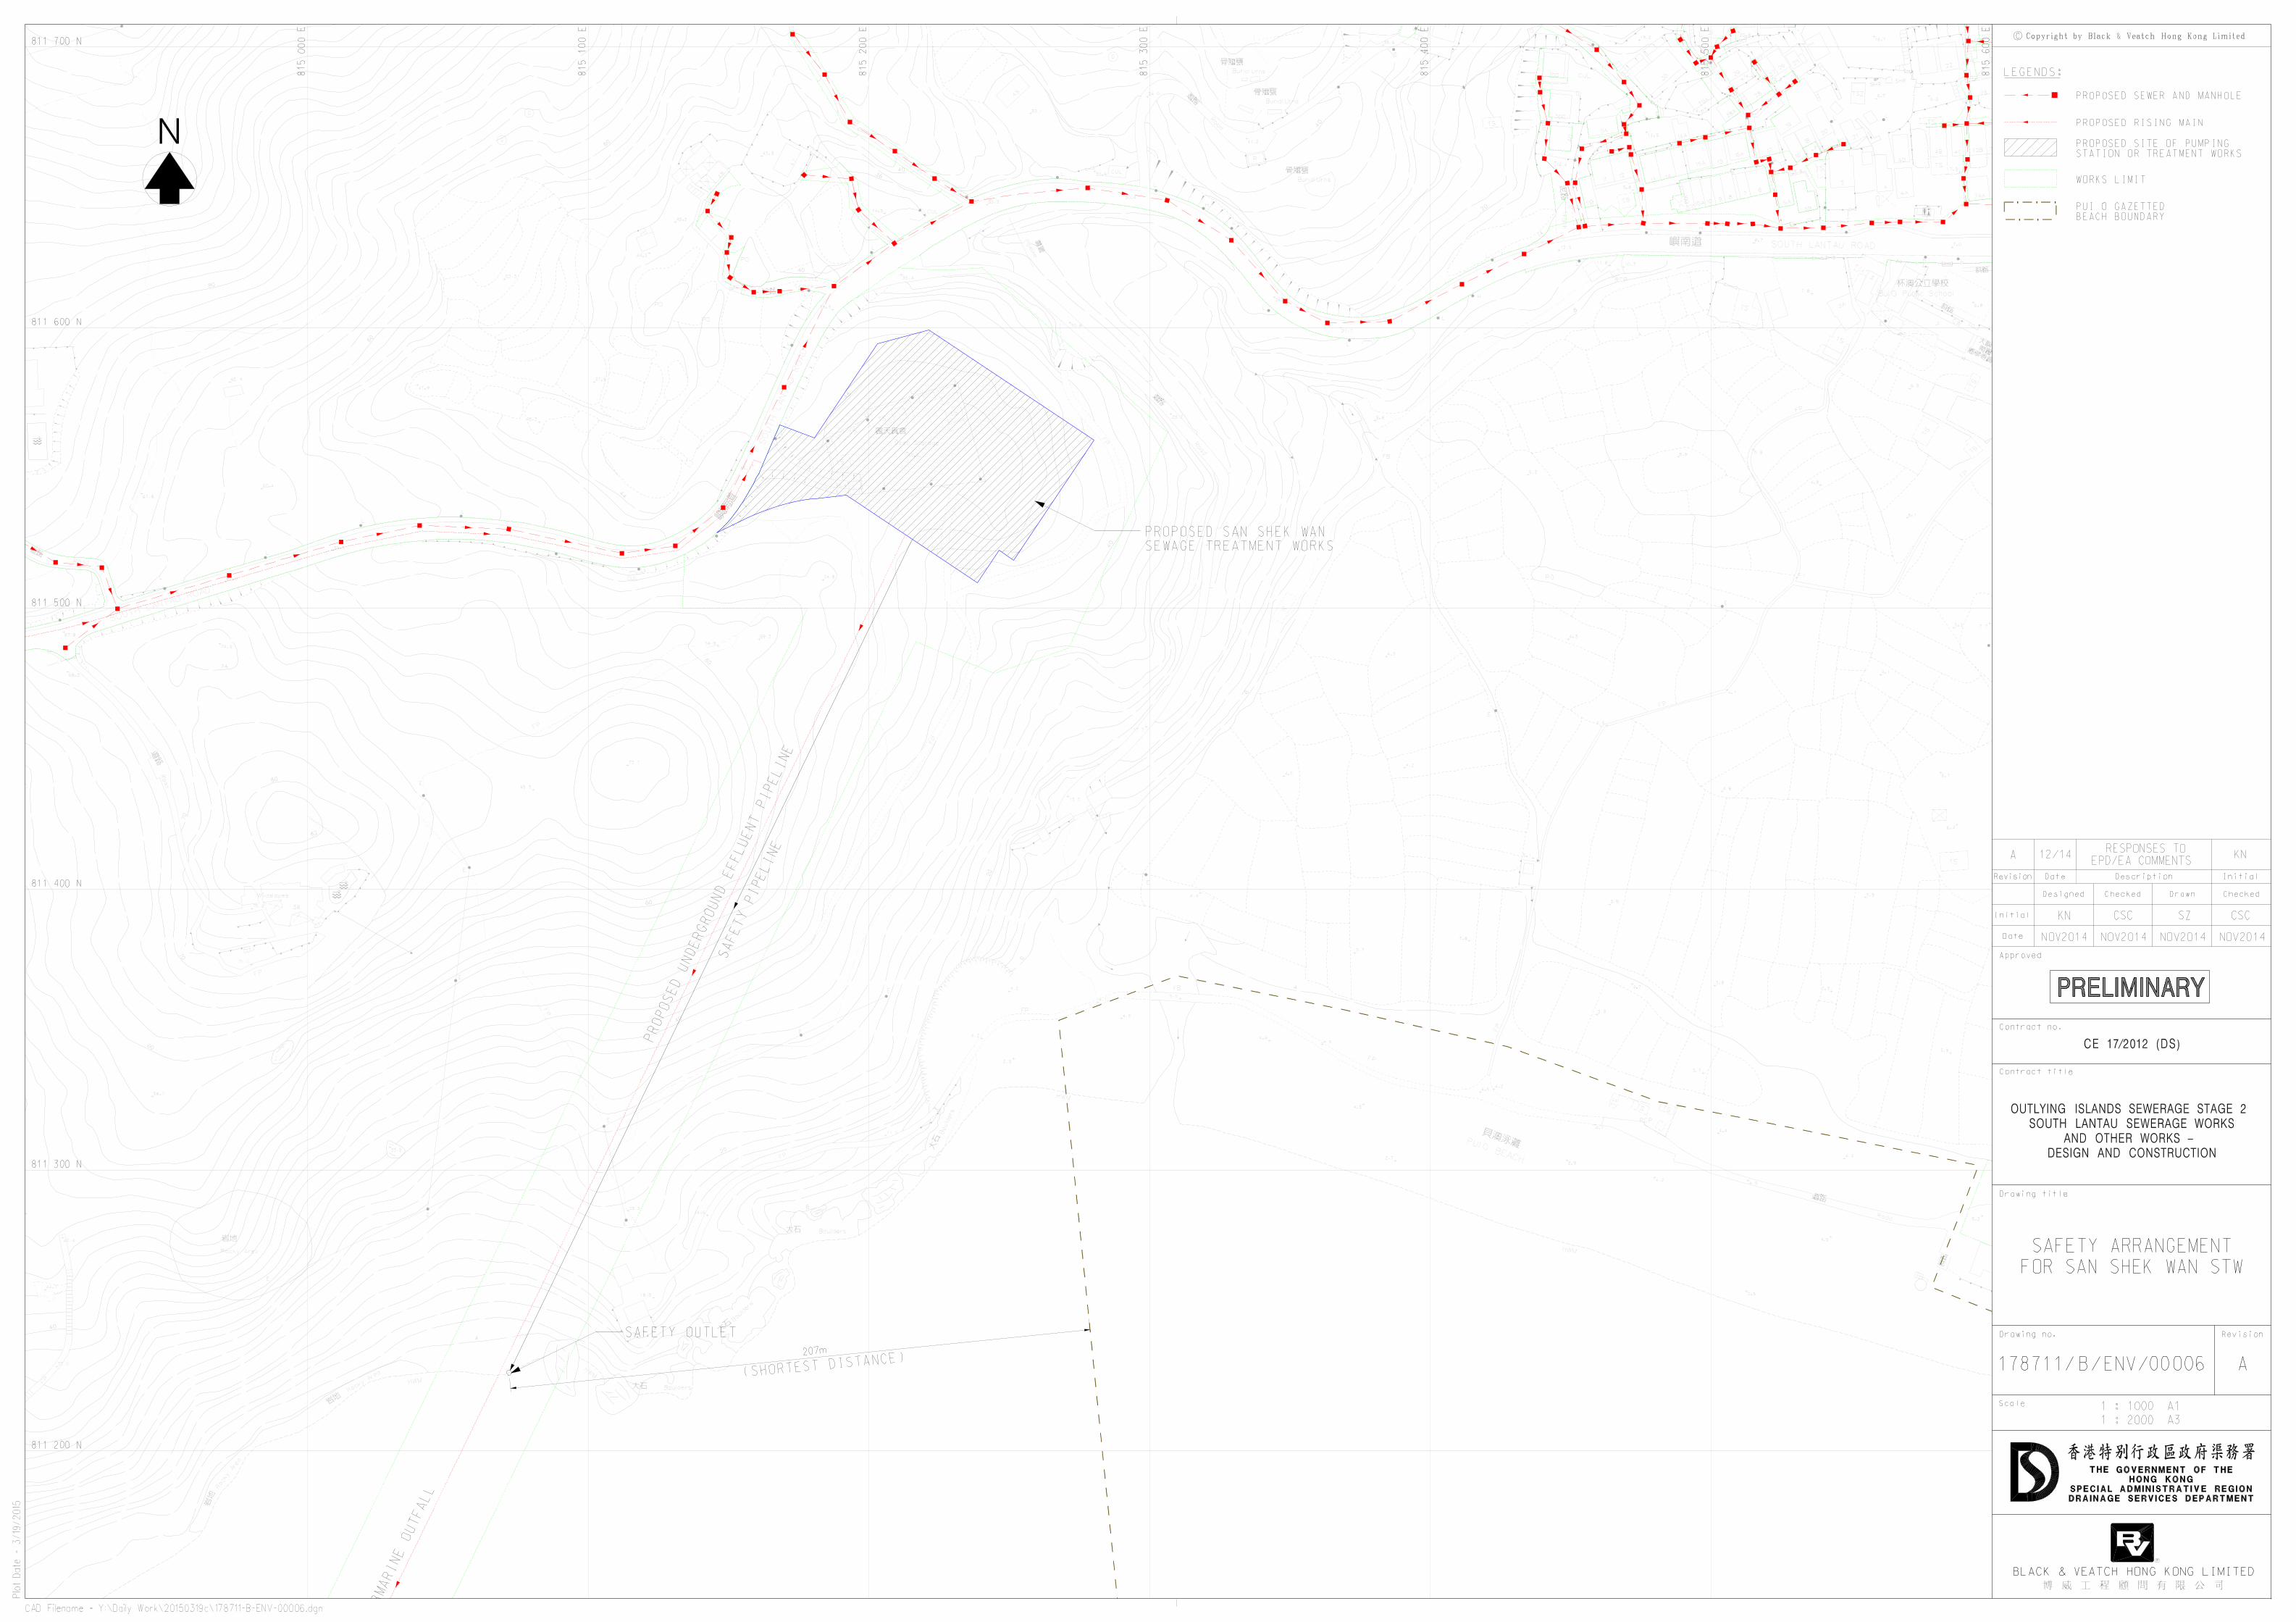
released untreated from the STW into nearby Pui O Bay (when emergency
storage capacity is exceeded) through the safety pipeline and outlet. The
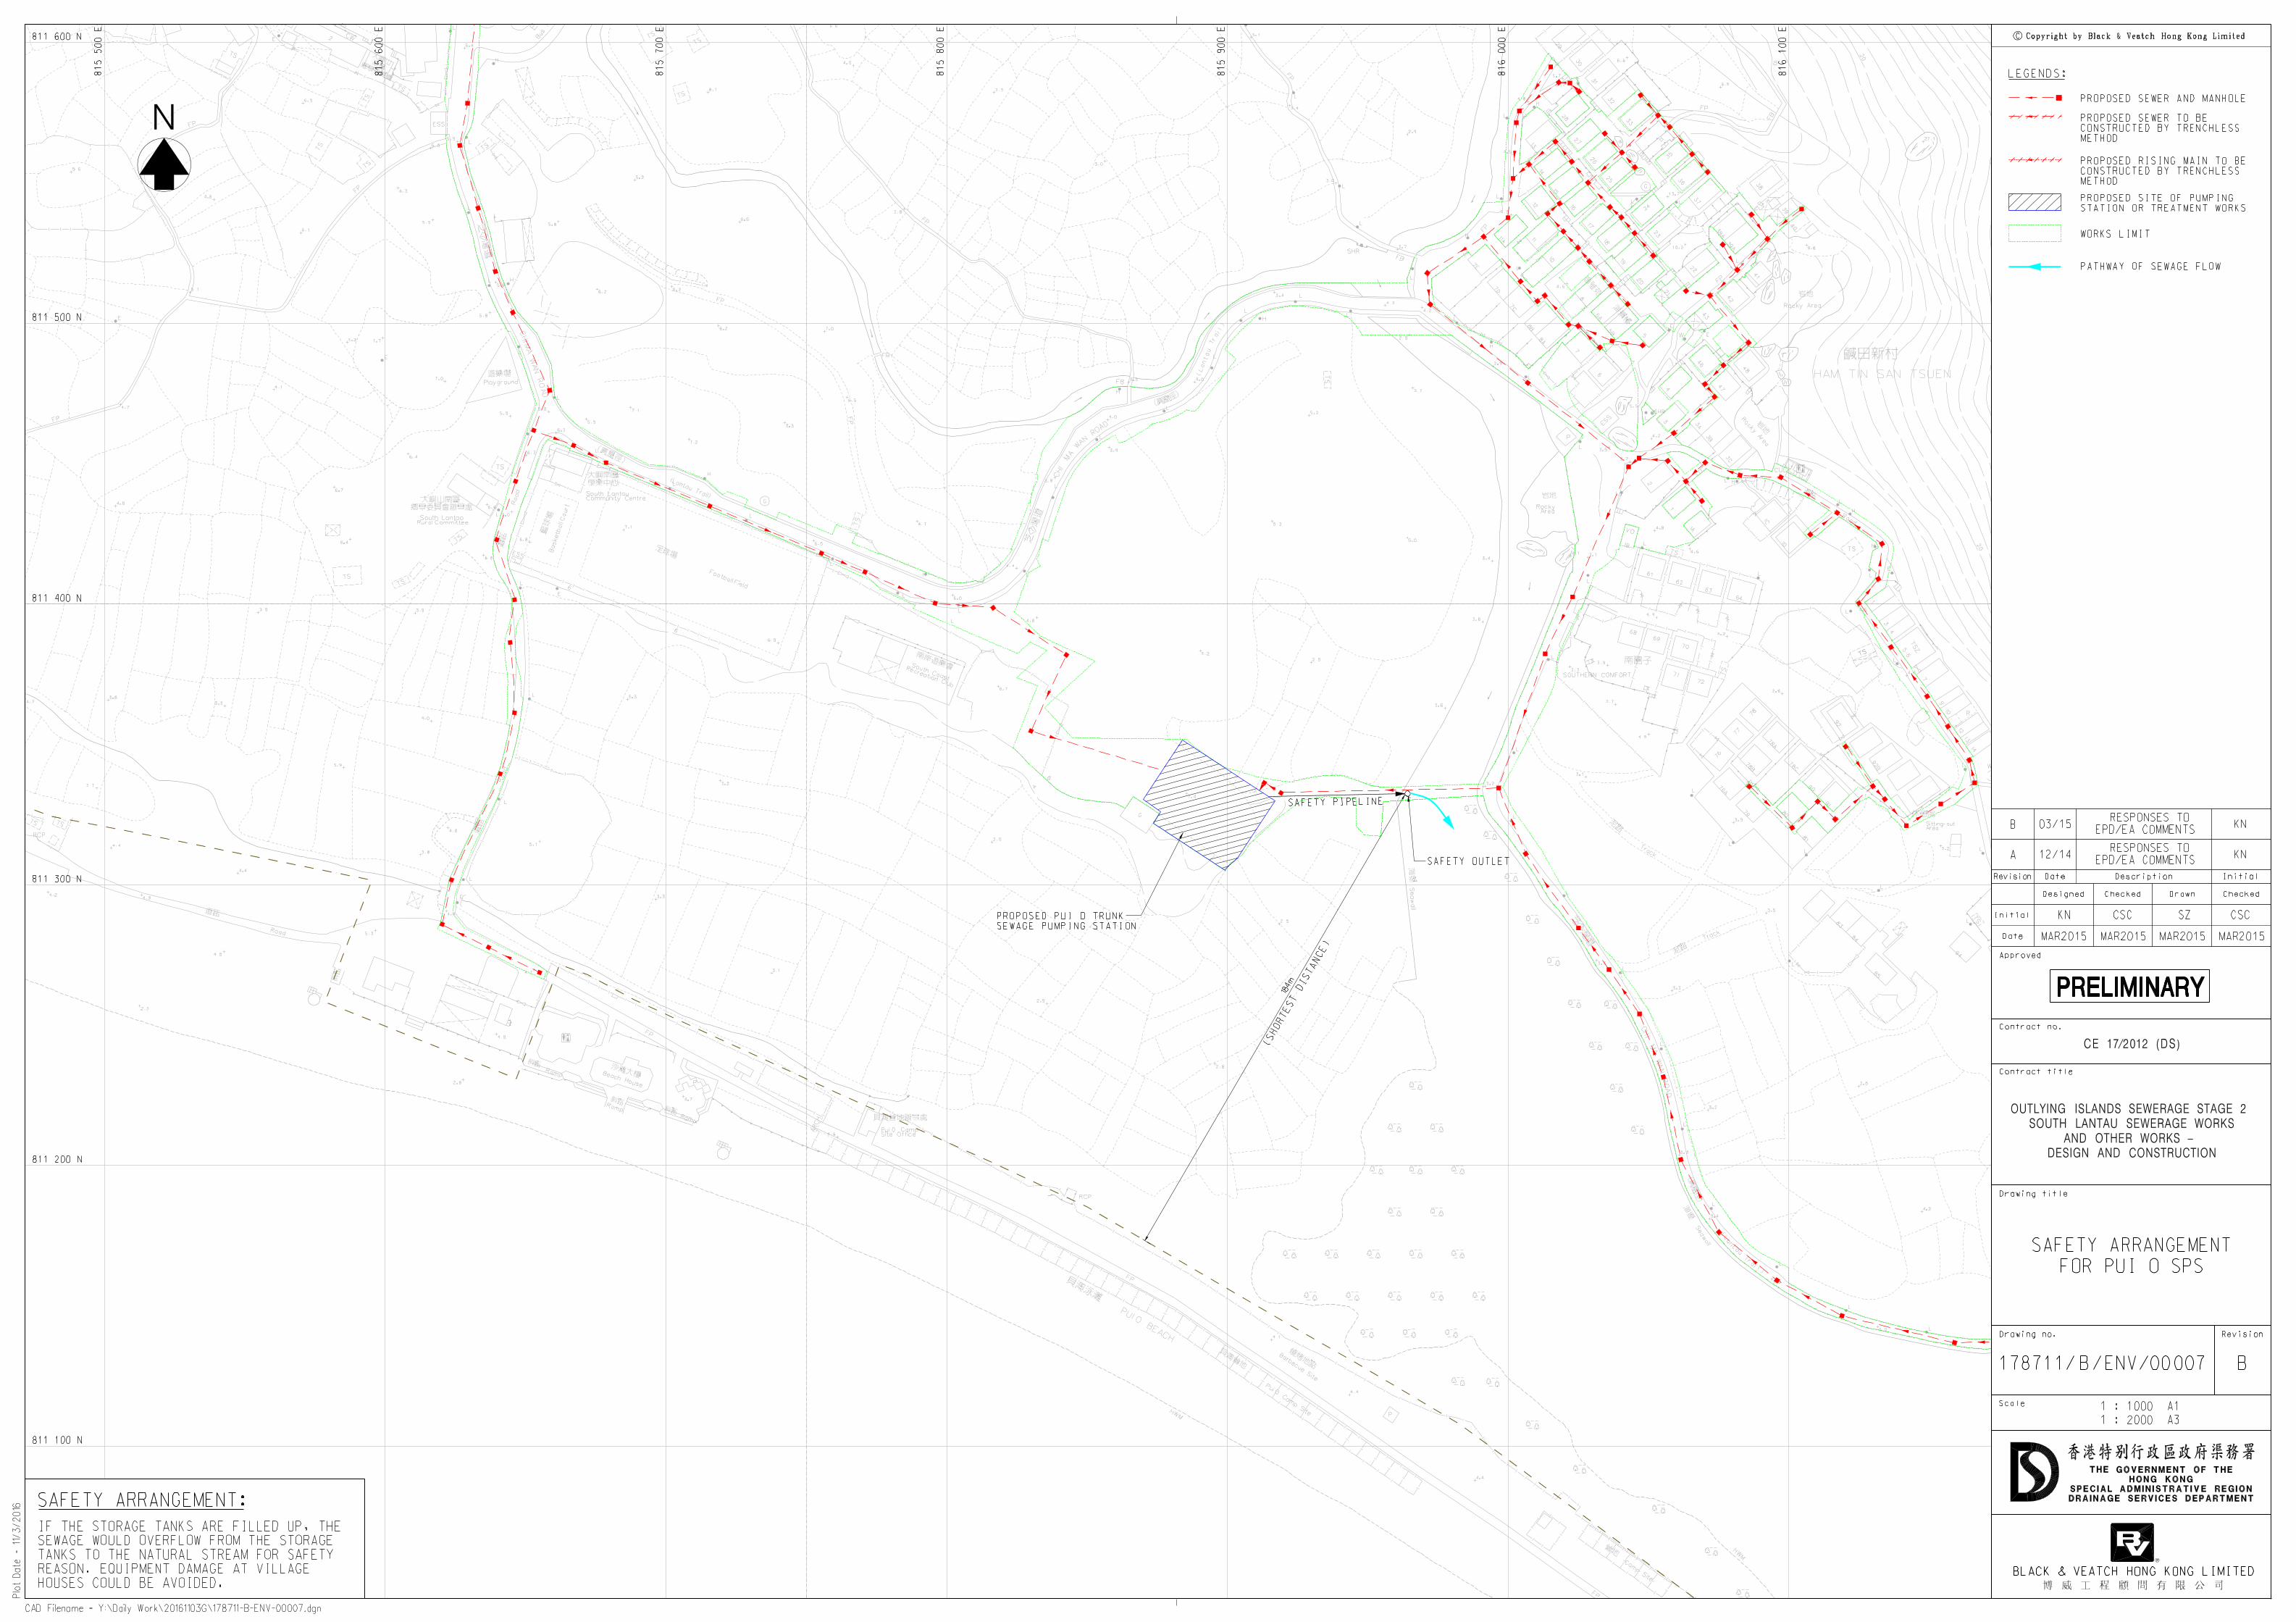
sewage from the eastern side of the STW will overflow into Pui O stream from
Pui O SPS (when emergency storage capacity is exceeded) through safety
pipeline and outlet. The discharge locations from STW and Pui O SPS are
shown in Appendix 4A.1.
As per request of EPD, the flow of untreated effluent was considered in the
three-dimensional hydrodynamic and water quality model at the nearest
coastline as continuous pollutant loads as Emergency Scenario 2 although the
likelihood is rather low. Average Dry Weather Flow at the STW and
estimated loads as shown in Table 4A.8 are adopted for modelling. 2 hours of
raw sewage overflow were considered in the model.
If all the 6 SPSs are down altogether, no sewage is expected to be pumped to
STW. The emergency storage in the STW and Pui O SPS would be sufficient
for holding the untreated sewage already at the STW and overflow bypass
will not occur. Therefore the scenario of the emergency discharge from the
STW and all the 6 pumping stations altogether is not considered for
modelling.
In general, water quality modelling will be carried out for two emergency
scenarios shown in Table 4A.7 to simulate the impact due to the emergency
discharge of sewage from SPSs and STW.
Table 4A.7 Modelling Scenarios for Emergency Discharge of Raw Sewage
Scenario Discharge Point Discharge
Period
(hours)
Assumed Concentration
in Untreated Sewage
07 (wet) Emergency discharge at all 6 pumping
stations (release time: 09:00 – 11:00 of 7
Jul in model)
2 See Table 4A.8
08 (Dry) Emergency discharge at all 6 pumping
stations (release time: 17:00 – 19:00 of 22
Feb in model)
2 See Table 4A.8
09 (Wet) Emergency discharge at STW and Pui O
SPS (release time: 09:00 – 11:00 of 7 Jul
in model)
2 See Table 4A.8
10 (Dry) Emergency discharge at STW and Pui O
SPS (release time: 17:00 – 19:00 of 22 Feb
in model)
2 See Table 4A.8
Under the low ambient flow condition, the discharged pollutants would
accumulate within a more localized area and result in more localized yet

ENVIRONMENTAL RESOURCES MANAGEMENT B&V
0227541_ANNEX 4A_WQMS_20160616.DOC 09 AUGUST 2016
ANNEX 4A - 27
intense impacts on nearby waters than discharge during high ambient flow
condition. During the selected release time (Table 4A.7), the ambient is in
low flow condition. Hence emergency discharges during the low ambient
flow conditions (i.e. neap tide) would be considered as the worst case
scenarios.
ENVIRONMENTAL RESOURCES MANAGEMENT B&V
0227541_ANNEX 4A_WQMS_20160616.DOC 09 AUGUST 2016
ANNEX 4A - 28
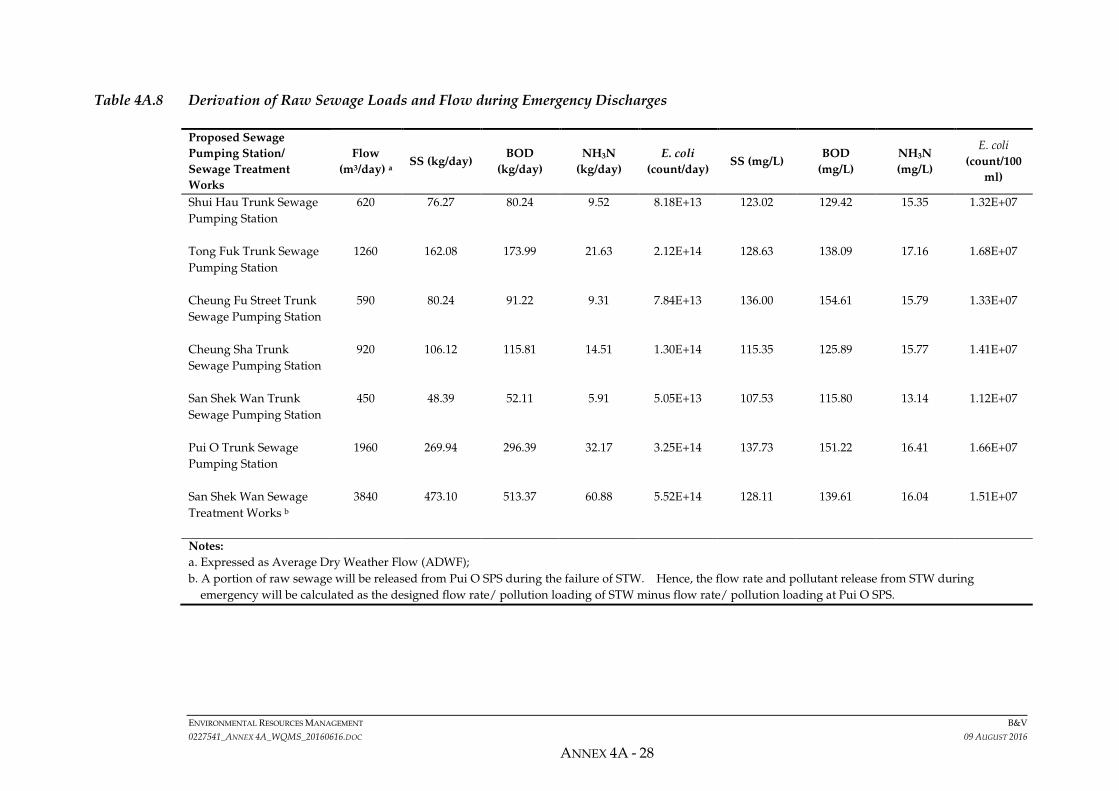
Table 4A.8 Derivation of Raw Sewage Loads and Flow during Emergency Discharges
Proposed Sewage
Pumping Station/
Sewage Treatment
Works
Flow
(m3/day) a SS (kg/day)
BOD
(kg/day)
NH3N
(kg/day)
E. coli
(count/day) SS (mg/L)
BOD
(mg/L)
NH3N
(mg/L)
E. coli
(count/100
ml)
Shui Hau Trunk Sewage
Pumping Station
620 76.27 80.24 9.52 8.18E+13 123.02 129.42 15.35 1.32E+07
Tong Fuk Trunk Sewage
Pumping Station
1260 162.08 173.99 21.63 2.12E+14 128.63 138.09 17.16 1.68E+07
Cheung Fu Street Trunk
Sewage Pumping Station
590 80.24 91.22 9.31 7.84E+13 136.00 154.61 15.79 1.33E+07
Cheung Sha Trunk
Sewage Pumping Station
920 106.12 115.81 14.51 1.30E+14 115.35 125.89 15.77 1.41E+07
San Shek Wan Trunk
Sewage Pumping Station
450 48.39 52.11 5.91 5.05E+13 107.53 115.80 13.14 1.12E+07
Pui O Trunk Sewage
Pumping Station
1960 269.94 296.39 32.17 3.25E+14 137.73 151.22 16.41 1.66E+07
San Shek Wan Sewage
Treatment Works b
3840 473.10 513.37 60.88 5.52E+14 128.11 139.61 16.04 1.51E+07
Notes:
a. Expressed as Average Dry Weather Flow (ADWF);
b. A portion of raw sewage will be released from Pui O SPS during the failure of STW. Hence, the flow rate and pollutant release from STW during
emergency will be calculated as the designed flow rate/ pollution loading of STW minus flow rate/ pollution loading at Pui O SPS.

ENVIRONMENTAL RESOURCES MANAGEMENT B&V
0227541_ANNEX 4A_WQMS_20160616.DOC 09 AUGUST 2016
ANNEX 4A - 29
4A6 CUMULATIVE IMPACTS
According to publicly available sources, the identified potential concurrent
projects are the marine dumping activities near South Cheung Chau and the
proposed Integrated Waste Management Facilities (IWMF) potentially at Shek
Kwu Chau (2017 - 2022). These projects are at least 5 km from the proposed
submarine outfall and the water quality impacts from the construction of
IWMF were predicted to be localized near Shek Kwu Chau with reference to
EIA Study for Development of the Integrated Waste Management Facilities Phase 1.
Given the information above, these projects are not considered to be located in
sufficient proximity to cause cumulative effects.
ENVIRONMENTAL RESOURCES MANAGEMENT B&V
0227541_ANNEX 4A_WQMS_20160616.DOC 09 AUGUST 2016
ANNEX 4A - 30
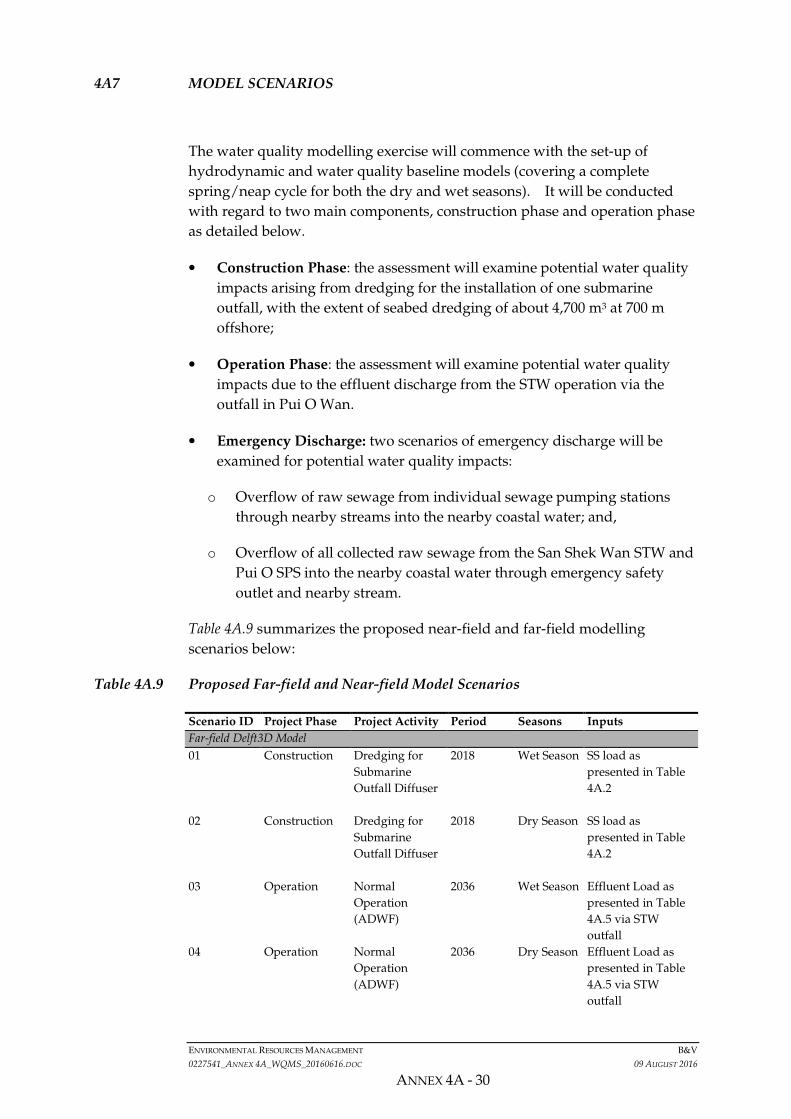
4A7 MODEL SCENARIOS
The water quality modelling exercise will commence with the set-up of
hydrodynamic and water quality baseline models (covering a complete
spring/neap cycle for both the dry and wet seasons). It will be conducted
with regard to two main components, construction phase and operation phase
as detailed below.
• Construction Phase: the assessment will examine potential water quality
impacts arising from dredging for the installation of one submarine
outfall, with the extent of seabed dredging of about 4,700 m3 at 700 m
offshore;
• Operation Phase: the assessment will examine potential water quality
impacts due to the effluent discharge from the STW operation via the
outfall in Pui O Wan.
• Emergency Discharge: two scenarios of emergency discharge will be
examined for potential water quality impacts:
o Overflow of raw sewage from individual sewage pumping stations
through nearby streams into the nearby coastal water; and,
o Overflow of all collected raw sewage from the San Shek Wan STW and
Pui O SPS into the nearby coastal water through emergency safety
outlet and nearby stream.
Table 4A.9 summarizes the proposed near-field and far-field modelling
scenarios below:
Table 4A.9 Proposed Far-field and Near-field Model Scenarios
Scenario ID Project Phase Project Activity Period Seasons Inputs
Far-field Delft3D Model
01 Construction Dredging for
Submarine
Outfall Diffuser
2018 Wet Season
SS load as
presented in Table
4A.2
02 Construction Dredging for
Submarine
Outfall Diffuser
2018 Dry Season SS load as
presented in Table
4A.2
03 Operation Normal
Operation
(ADWF)
2036 Wet Season
Effluent Load as
presented in Table
4A.5 via STW
outfall
04 Operation Normal
Operation
(ADWF)
2036 Dry Season Effluent Load as
presented in Table
4A.5 via STW
outfall

ENVIRONMENTAL RESOURCES MANAGEMENT B&V
0227541_ANNEX 4A_WQMS_20160616.DOC 09 AUGUST 2016
ANNEX 4A - 31
Scenario ID Project Phase Project Activity Period Seasons Inputs
05 Operation Normal
Operation
(PWWF)
2036 Wet Season
Effluent Load as
presented in Table
4A.5 via STW
outfall
06 Operation Normal
Operation
(PWWF)
2036 Dry Season Effluent Load as
presented in Table
4A.5 via STW
outfall
07 Operation Emergency
Scenario 1
2036 Wet Season Raw sewage
discharges as
presented in Table
4A.8 from all 6
pumping stations
via safety pipelines
and safety outlet
08 Operation Emergency
Scenario 1
2036 Dry Season Raw sewage
discharges as
presented in Table
4A.8 from all 6
pumping stations
via safety pipelines
and safety outlet
09 Operation Emergency
Scenario 2
2036 Wet Season Raw sewage
discharge as
presented in Table
4A.8 from STW and
Pui O SPS via safety
pipelines and safety
outlet
10 Operation Emergency
Scenario 2
2036 Dry Season Raw sewage
discharge as
presented in Table
4A.8 from STW and
Pui O SPS via safety
pipelines and safety
outlet
Near-field CORMIX Model
AD10 Operation Normal
Operation
(ADWF)
2036 Dry Season 10th Percentile of
Ambient Current
Velocity
AD50 Operation Normal
Operation
(ADWF)
2036 Dry Season 50th Percentile of
Ambient Current
Velocity
AD90 Operation Normal
Operation
(ADWF)
2036 Dry Season 90th Percentile of
Ambient Current
Velocity

ENVIRONMENTAL RESOURCES MANAGEMENT B&V
0227541_ANNEX 4A_WQMS_20160616.DOC 09 AUGUST 2016
ANNEX 4A - 32
Scenario ID Project Phase Project Activity Period Seasons Inputs
AW10 Operation Normal
Operation
(ADWF)
2036 Wet Season 10th Percentile of
Ambient Current
Velocity
AW50 Operation Normal
Operation
(ADWF)
2036 Wet Season 50th Percentile of
Ambient Current
Velocity
AW90 Operation Normal
Operation
(ADWF)
2036 Wet Season 90th Percentile of
Ambient Current
Velocity
PD10 Operation Normal
Operation
(PWWF)
2036 Dry Season 10th Percentile of
Ambient Current
Velocity
PD50 Operation Normal
Operation
(PWWF)
2036 Dry Season 50th Percentile of
Ambient Current
Velocity
PD90 Operation Normal
Operation
(PWWF)
2036 Dry Season 90th Percentile of
Ambient Current
Velocity
PW10 Operation Normal
Operation
(PWWF)
2036 Wet Season 10th Percentile of
Ambient Current
Velocity
PW50 Operation Normal
Operation
(PWWF)
2036 Wet Season 50th Percentile of
Ambient Current
Velocity
PW90 Operation Normal
Operation
(PWWF)
2036 Wet Season 90th Percentile of
Ambient Current
Velocity

APPENDIX 4A.1
SAFETY ARRANGEMENT