


Languages
Pages
Legal


ANNEX 3C. CHARACTERIZATION FORM FOR DEFINING THE COSTS AND BENEFITS OF DOMESTIC WASTEWATER MANAGEMENT
STUDY SITE: Chaguanas, Trinidad
CEP Technical Report: 91

Valuing Wastewater Management 1 ANNEX 3: Characterization Form Results
Annex 3C. Characterization Form for Defining the Costs and Benefits of
Domestic Wastewater Management – Chaguanas, Trinidad
=======================================================================
STUDY SITE: Chaguanas, Trinidad
=======================================================================
RESPONDENT INFORMATION
This report was completed by:
Name: Erin Gray and Lauretta Burke, World Resources Institute (WRI); Roger Karim, WASA
Organization: WRI and WASA
Date: August 12, 2015
=======================================================================
Contents I. DEFINE THE STUDY AREA ..................................................................................................................... 2
II. POPULATION ........................................................................................................................................ 5
III. ECONOMIC ACTIVITIES ..................................................................................................................... 6
IV. KEY ECOSYSTEMS.............................................................................................................................. 8
V. CURRENT WASTEWATER MANAGEMENT SITUATION ...................................................................... 13
VI. WATER QUALITY ............................................................................................................................. 18
VII. ECOSYSTEM IMPACTS..................................................................................................................... 20
VIII. HUMAN HEALTH IMPACTS ............................................................................................................. 23
IX. FUTURE WASTEWATER MANAGEMENT SCENARIO(S) .................................................................. 25
X. CHANGES TO ECOSYSTEM AND HUMAN HEALTH UNDER IMPROVED WASTEWATER
MANAGEMENT SCENARIOS ....................................................................................................................... 33
XI. OTHER INFORMATION ................................................................................................................... 34
XII. REFERENCES .................................................................................................................................... 35
=======================================================================

Valuing Wastewater Management 2 ANNEX 3: Characterization Form Results
I. DEFINE THE STUDY AREA
Objective: Define and map the study area including key geographic and land use data to identify
wastewater pollution and other water pollution pathways and populations of interest.
Possible data sources: National environmental, water, and/or marine agencies; non-profit organizations
(NGOs); academic institutes with marine/environmental centers that conduct research within the study
site.
1. Please define the study area by providing a detailed description.
The study area should include the sewage catchment name(s) and geographic area, the populated area to be
served by improved wastewater treatment, the area downstream which is expected to be influenced by the change
in wastewater management (including receiving water bodies (e.g., rivers, lakes, oceans) and water catchments1),
and the upstream catchment (which might be contributing pollutants to the water body of focus).
The study area for Chaguanas encapsulates the Borough of Chaguanas (including the Chaguanas
sewerage catchment) and the potential growth boundary as Chaguanas develops from a borough to a
city. The study area includes the Cunupia, Guayamare watersheds and a section of the Caparo
watershed - these watersheds are upstream of the southern portion of the Caroni Swamp. As a result,
the southern portion of the Caroni Swamp is also included in the study area. The Chaguanas sewerage
catchment is roughly 3,000 – 5,000 hectares and includes approximately 9-12 sewerage catchments
(WASA 2015).
There are three reports from WASA that discuss wastewater in Chaguanas. These reports are valuable
for providing some additional context, but may not reflect current knowledge. Thus, the first paragraph
of this section best represents the overview of the study area. The three reports include:
1) WASA 2008: A report by WASA’s Wastewater Unit from 2008 entitled, “Wastewater services in
Chaguanas and Environs,” prepared by WASA’s Wastewater Unit
2) GENIVAR 2009: A report drafted by GENIVAR for WASA entitled, “WASA Water and wastewater
master plan and policy development: Wastewater alternatives Report for Trinidad – Draft” that
appears to be from 2009. We have received section 4.12 and 6.6.9 of this report from WASA.
3) WASA (Chapter 3.3.9): Chapter 3.3.9 of a report by WASA from an unknown year, “Detailed designs
and tender documents for construction contracts for the rehabilitation, expansion, and integration
of wastewater treatment facilities.”
The WASA 2008 report defines current and future wastewater infrastructure scenarios for an area called
“the Chaguanas Catchment.” This area is defined as covering 2,955 hectares, with 86% of that area
being developed (2,529 ha). The boundaries of the study area include:
Warrenville to the north
Felicity to the west
1 See glossary for definition of water bodies and water catchments
Valuing Wastewater Management 3 ANNEX 3: Characterization Form Results
Cunupia to the east
Edinburgh to the south
This report states there are 12 separate wastewater systems (or catchments) existing in the area that
serve the following developments:
1. Boodram Development
2. Centre City Mall
3. Homeland Gardens
4. Mid Center Mall
5. Orchard Gardens
6. Point Pleasant
7. Charlieville
8. Edinburgh 500
9. Penco Lands
10. Chaguanas Senior Comprehensive School
11. Lange Park
The WASA chapter 3.3.9 states that the Chaguanas sewerage catchment occupies an area of 4,773
hectares which corresponds to the area of the Borough of Chaguanas. The report states there are 9
sewerage catchments existing within the area including:
1. Boodram Development
2. Centre City Mall
3. Homeland Gardens
4. Mid Centre Mall
5. Orchard Gardens
6. Point Pleasant
7. Ramsaran Park
8. Saint Anthony’s Park
9. Simon Development
2. Can you put it on a map? (with GIS; Google Earth; or participatory mapping)
If possible, indicate on a map the information provided in Question 1. This can be done in GIS, using Google Earth, and/or
working with stakeholders using a participatory mapping approach to highlight on a hard copy map the response to Question 1.
A map provide to WRI by WASA (“Chag-Edin Catchment” – figure 1) provides an overview of the
Chaguanas region sewage collection system. This map (including both the North and South sections)
represents the wastewater treatment catchments, but based on input from WASA (2015), we believe
the Cunupia, Guayamare, and Caparo watersheds should also be included in the study area, as their
respective river/streams run through Chaguanas and into the Caroni Swamp. WASA (2015) notes that
we may need to examine this closer to determine how these two watersheds fall into the Chaguanas
catchment since other factors need to be considered including proximity to water courses, geotechnical

Valuing Wastewater Management 4 ANNEX 3: Characterization Form Results
considerations, population density, population growth, and economic criteria. Figure 2 reflects this
broader definition of the study area, including these catchments.
Figure 1 - Map showing contour line that divides Northern and Southern sections of the Chaguanas region sewage collection. (WASA, 2008)
Figure 2 - Chaguanas study site with satellite imagery and watersheds, streams and key features
Cunupia Gauge
Valuing Wastewater Management 5 ANNEX 3: Characterization Form Results
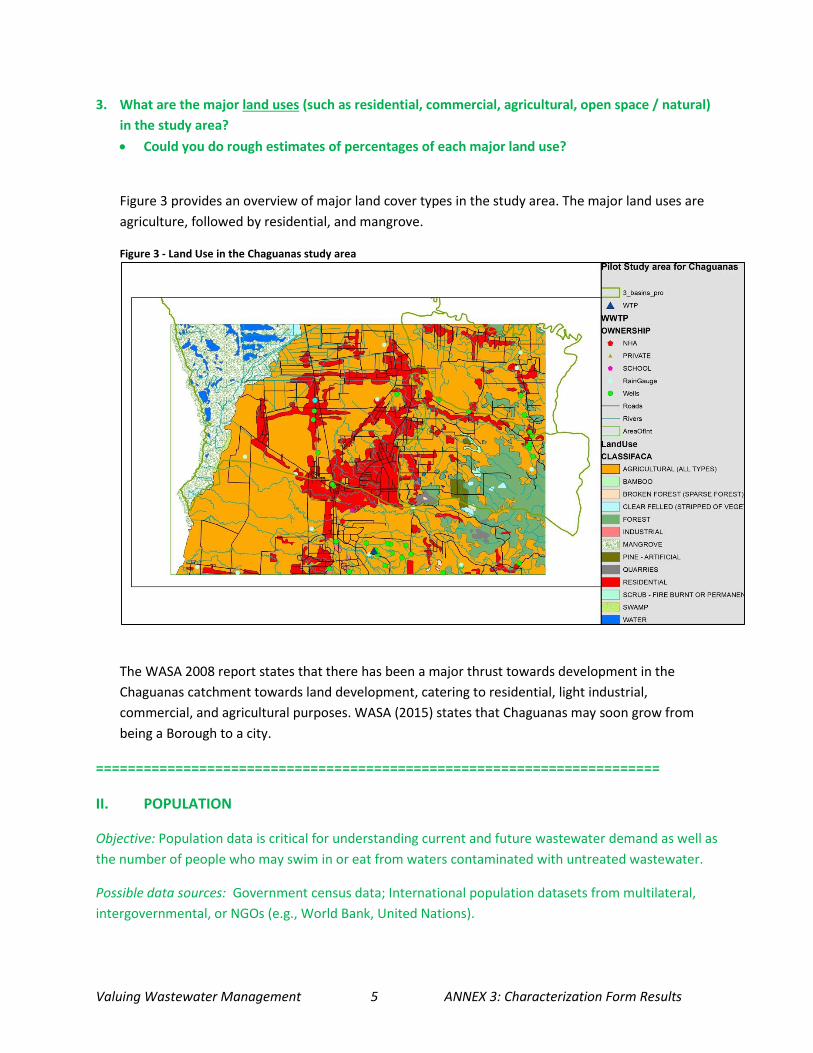
3. What are the major land uses (such as residential, commercial, agricultural, open space / natural)
in the study area?
Could you do rough estimates of percentages of each major land use?
Figure 3 provides an overview of major land cover types in the study area. The major land uses are
agriculture, followed by residential, and mangrove.
Figure 3 - Land Use in the Chaguanas study area
The WASA 2008 report states that there has been a major thrust towards development in the
Chaguanas catchment towards land development, catering to residential, light industrial,
commercial, and agricultural purposes. WASA (2015) states that Chaguanas may soon grow from
being a Borough to a city.
=======================================================================
II. POPULATION
Objective: Population data is critical for understanding current and future wastewater demand as well as
the number of people who may swim in or eat from waters contaminated with untreated wastewater.
Possible data sources: Government census data; International population datasets from multilateral,
intergovernmental, or NGOs (e.g., World Bank, United Nations).

Valuing Wastewater Management 6 ANNEX 3: Characterization Form Results
1. How many people live in the study area? (Approximate if necessary)
See #3.
2. Can you disaggregate this by neighborhood / area / housing development / smaller administrative
unit?
No.
3. How many households are in the study area? (Approximate if necessary.)
According to the 2011 Census (CSO 2012), there were 24,644 households in the Borough of Chaguanas
in 2011, with an average household size of 3.4. The population living downstream of the Borough and/or
in the southern portion of the Caroni swamp is uncertain.
4. What is the population projection for the study area over the next 20, 30, and/or 50 years (for
each period if data are available)?
Table 1: Summary population and household data by WASA report for the Borough of Chaguanas
REPORT CURRENT POPULATION PROJECTED POPULATION
WASA 2008 98,396 (as of 2007) 132,930 (for 2037)
GENIVAR 2009 85,502 (as of 2010) 89,025 (for 2035)
WASA 3.3.9 84,000 (as of 2012) 123,600 (for 2040)
CSO 2011 Census2 83,516 (as of 2011) 151,277 (for 2041)
The Central Statistical Office found that the annual population growth rate for the Borough of
Chaguanas between 2000 and 2011 was 2%. The population then that could be predicted for 2041
based on a population of 83,516 from the Central Statistical Office (CSO) for 2011 would be 151,277.
=======================================================================
III. ECONOMIC ACTIVITIES
Objective: Economic data are important for understanding the economic activities that are important for
the local economy that rely on ecosystems (especially those potentially impacted by water pollution).
2 Corresponds to the Borough of Chaguanas from CSO 2011.

Valuing Wastewater Management 7 ANNEX 3: Characterization Form Results
Possible data sources: Government census data; International population datasets from multilateral,
intergovernmental, or NGOs (e.g., World Bank, United Nations).
1. Are the following sectors important for the local economy (ideally for the study area)? Can you
estimate the relative contribution from each sector to the local economy? If quantitative data are
not available, please rate the sector’s importance based on the following scale:
Importance Scale:
- Not important: The sector is not relevant as it does not contribute much to local GDP
(e.g., through jobs or financial contribution)
- Moderate importance: The sector is important, but is not the main contributor to local
GDP.
- Very important: The sector contributes substantially to local GDP.
- Critical: The sector contributes the largest amount of any sector to local GDP
According to Wikipedia (2015), “[Chaguanas] originally grew in size due to its proximity to the Woodford
Lodge sugar refinery and the Central Trinidad town of Couva. It remained a minor town until the 1980s
when it began to grow rapidly as it drew people for its bargain shopping and moderately-priced housing.
However, its rapid growth has seen property values increase dramatically. Chaguanas became a borough
in 1990; prior to that it was part of the County of Caroni.
Tourism? (Note types of tourism): Moderately important. Caroni swamp is a designated Ramsar
site and is a popular ecotourism destination for birdwatching and boat tours. The site is a
roosting ground for the national bird, the Scarlet Ibis. Thus – the site is important both
economically and culturally. It is unclear, however, the importance for the local economy of the
Borough of Chaguanas.
Agriculture? (Note types of agriculture): Somewhat important – while agriculture appears to be
a predominant land use in the area, we are not sure of the importance to the local economy.
The Chaguanas Spatial Development Plan (Ministry of Local Government 2013) states, “the loss
of relatively good agricultural lands has led to the economy being based on mainly commercial
activity and to a lesser extent light industrial activity. There is a dependence on these sectors to
generate jobs. The economy needs to be more diversified and good agricultural lands need to be
protected through zoning regulations.”
Fisheries? (Note major fish species): Moderately to very important – Caroni Swamp is a popular
fishing site, especially for oysters. It is unclear, however, the importance for the local economy
in the Borough of Chaguanas.
Industry? (Note what industry/ies): Moderately important – According to Wikipedia, ABEL or
Alstons Building Enterprises Limited is a member of the ANSA McAl Group of Companies and is
situated in Longdenville. It is the largest manufacturer of clay building blocks and Metpro steel
and aluminum windows and doors and Astralite and Spectra uPVC windows and doors in the

Valuing Wastewater Management 8 ANNEX 3: Characterization Form Results
English-speaking Caribbean. Also, the dissolution of the state-owned sugar company, Caroni
(1975) Limited, had a profound effect on Chaguanas, since this company was a major employer.
Commercial: Very Important. According to Wikipedia (2015), “Chaguanas developed as a market
town and still attracts bargain shoppers. Much of Chaguanas' development has centered around
the Chaguanas Main Road where numerous shopping plazas have been constructed. The
Chaguanas Main Road (east of the Chaguanas flyover) continued to develop, primarily through
small and medium size businesses, to fulfill the expanding population centers. Retail
development expanded with the construction of three malls in the downtown in the 1980s
(Centre City, Mid Centre and Ramsaran Plaza, later to become Centre Pointe Mall). Centre City
Mall has been significantly renovated and there are future plans to expand further to become
the largest mall in the Caribbean. It will feature two major buildings, one near to the Uriah
Butler Highway and another close to the center of Chaguanas, joined by an enclosed walkover
above the Mulchan Seuchan Link Road. More recently, construction of Price Plaza in Endeavour
expanded upscale retail opportunities. Price Plaza includes a warehouse-style store PriceSmart,
TGI Friday's and Ruby Tuesday restaurants, a food court, SuperPharm, as well as many other
retail outlets. MovieTowne is situated nearby the Price Plaza and continuing further expansion.
Adjoining to the Movietowne complex are other restaurants and bars, e.g. Woodforde Cafe,
Wild Olive Restaurant, and Hollywood Grill. A new shopping complex is planned to be built in
2013-15 in the Brentwood planned housing and commercial development.”
Financial: Moderately important. According to Wikipedia (2015), “Chaguanas has also
developed into a financial center. The Unit Trust Corporation (UTC), First Citizens Bank (FCB),
Sagicor, Republic Bank of Trinidad and Tobago, Scotiabank, RBTT, and the Bank of Baroda all
have major corporate offices in Chaguanas.”
=======================================================================
IV. KEY ECOSYSTEMS
Objective: To understand potential benefits to ecosystem health from wastewater management
improvements, it is necessary to a) identify key ecosystems in the study sites, b) their economic
contribution in terms of key goods and services they provide, c) their contribution to key economic
sectors. This will help to characterize the dependence of these sectors on healthy ecosystems, and as a
result, the value of these ecosystems to the study population and the nation.
Possible data sources: Government environmental/water/natural resource agencies or ministries;
Academic institutes and environmental NGOs conducting research or working towards the protection or
conservation of ecosystems; Peer-reviewed and grey literature on key ecosystem both within and
outside of the study area; Government reports including environmental impact statements, water
quality permits, or benefit-cost analyses;

Valuing Wastewater Management 9 ANNEX 3: Characterization Form Results
1. What are the key ecosystems in the study area (e.g., coral reefs, mangroves, seagrass beds,
beaches, forests, wetlands), especially downstream from population, sewage discharge, or treated
wastewater discharge? Key ecosystems are those which are important to the local economy or
those which provide important cultural services.
An important ecosystem in the study area is the Caroni Swamp. Juman, Bacon, and Gerald (2002)
provide an overview of the Caroni River Basin (CRB). The CRB covers a total of about 883.4 km2,
equivalent to 22% of the land surface area of the island (Juman et al). The CRB includes the Caroni
Swamp, which is a Ramsar site as of 2005 and is the largest mangrove area in Trinidad. The swamp
consists of 5,611 ha of mangrove and herbaceous marsh, interrupted by numerous channels and
lagoons. The swamp comprises eight mangrove species. It is situated on the eastern coast of the Gulf of
Paria, a semi-enclosed sea bordered on the north by the Caribbean Sea and the southeast by the
Atlantic Ocean and lying between Trinidad and Venezuela. It is shallow, with an average depth of about
25 m and a maximum depth of 300 m in a trench to the north. Figure 5 provides an overview of the CRB
and IMA water quality sampling locations.
Figure 4 - IMA water quality sampling stations in Caroni Swamp and Caroni River Basin Catchments (IMA)
Beyond the Caroni Swamp, there are also important riverine ecosystems within the study area.
However, little information is available on characteristics of these water bodies.
Valuing Wastewater Management 10 ANNEX 3: Characterization Form Results
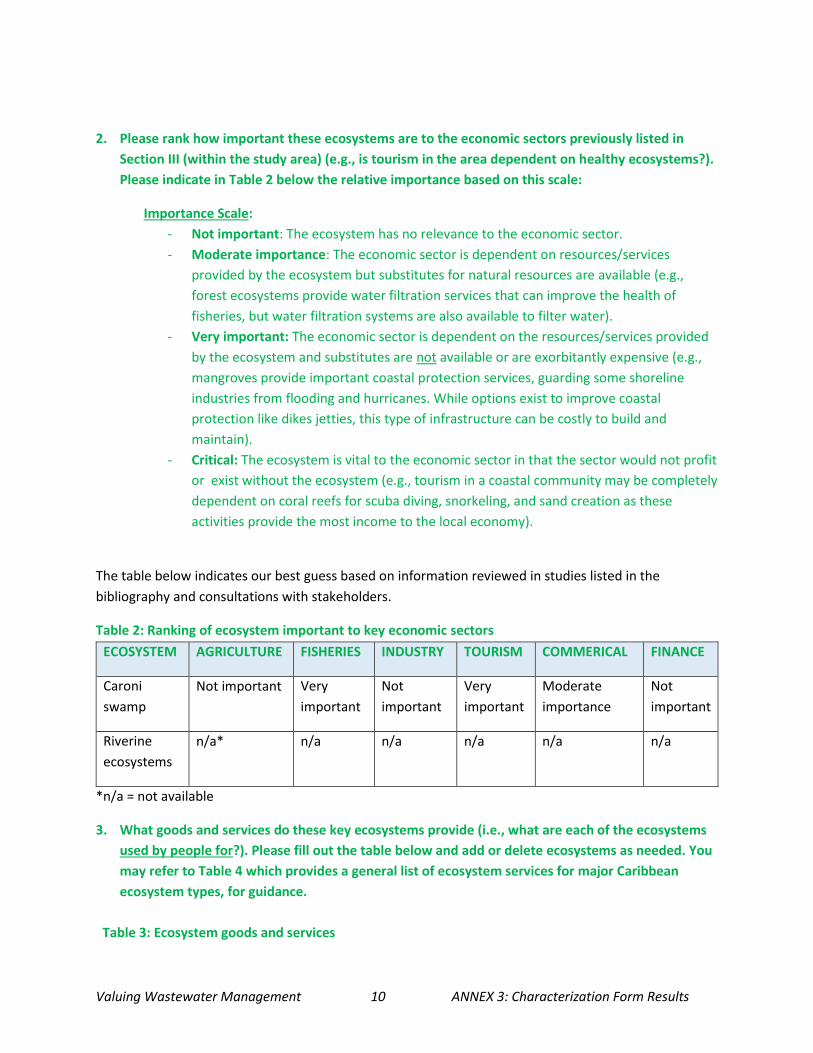
2. Please rank how important these ecosystems are to the economic sectors previously listed in
Section III (within the study area) (e.g., is tourism in the area dependent on healthy ecosystems?).
Please indicate in Table 2 below the relative importance based on this scale:
Importance Scale:
- Not important: The ecosystem has no relevance to the economic sector.
- Moderate importance: The economic sector is dependent on resources/services
provided by the ecosystem but substitutes for natural resources are available (e.g.,
forest ecosystems provide water filtration services that can improve the health of
fisheries, but water filtration systems are also available to filter water).
- Very important: The economic sector is dependent on the resources/services provided
by the ecosystem and substitutes are not available or are exorbitantly expensive (e.g.,
mangroves provide important coastal protection services, guarding some shoreline
industries from flooding and hurricanes. While options exist to improve coastal
protection like dikes jetties, this type of infrastructure can be costly to build and
maintain).
- Critical: The ecosystem is vital to the economic sector in that the sector would not profit
or exist without the ecosystem (e.g., tourism in a coastal community may be completely
dependent on coral reefs for scuba diving, snorkeling, and sand creation as these
activities provide the most income to the local economy).
The table below indicates our best guess based on information reviewed in studies listed in the
bibliography and consultations with stakeholders.
Table 2: Ranking of ecosystem important to key economic sectors
ECOSYSTEM AGRICULTURE FISHERIES INDUSTRY TOURISM COMMERICAL FINANCE
Caroni
swamp
Not important Very
important
Not
important
Very
important
Moderate
importance
Not
important
Riverine
ecosystems
n/a* n/a n/a n/a n/a n/a
*n/a = not available
3. What goods and services do these key ecosystems provide (i.e., what are each of the ecosystems
used by people for?). Please fill out the table below and add or delete ecosystems as needed. You
may refer to Table 4 which provides a general list of ecosystem services for major Caribbean
ecosystem types, for guidance.
Table 3: Ecosystem goods and services

Valuing Wastewater Management 11 ANNEX 3: Characterization Form Results
Ecosystem Goods and Services CARONI SWAMP
Food X
Raw materials X
Medicinal resources
Genetic resources
Other…
Flood/storm/erosion regulation X
Climate regulation X
Other…
Tourism and recreation X
History, culture, traditions X
Science, knowledge, education X
Other…
Primary production X
Nutrient cycling X
Species/ecosystem protection X
Other…

Valuing Wastewater Management 12 ANNEX 3: Characterization Form Results
Table 4: Examples of coastal ecosystem goods and services
Source: WRI Coastal Capital Guidebook (Waite et al. 2013)
4. Are there any existing estimates of the economic values of these uses of ecosystems for this study
area or nearby (e.g., through peer-reviewed or grey literature)? If so, please list these values,
describe the methodology used to develop them, and provide a citation.
There is a study by Rambial (1980) that estimates the recreational and fishing value for the Caroni
Swamp from Rambial (1980). The study found that the economic benefits of the Caroni Swamp were
estimated to be TT$2020 per hectare across the 5000 hectare reserve based on estimated recreational
and fishing resources in 1974 by Rambial (1980).
Additionally, it appears that an additional study was recently conducted by Mackoon, entitled, “An
Economic Valuation of the Recreational Resources at the Caroni Swamp Bird Sanctuary.” This study will
estimate the domestic access value of the recreational resources at the Caroni Swamp Bird Sanctuary.
The major economic activity is recreation which occurs in the form of guided boat tours. An Individual
Travel Cost Model (ITCM) was used to estimate the domestic access value of this direct use of the
Swamp. Results are not yet available, however.
5. Do you have statistics on visitation / tourism (both foreign and national) to key ecosystems
and/or statistics on visitation/tourism for the country for eco-tourism? For example, do you have
Valuing Wastewater Management 13 ANNEX 3: Characterization Form Results
data on the number of tourists (including cruise ship passengers, national and international
tourists, and others) that visit the key ecosystems identified above?
No data is available on visitation to the Caroni Swamp. However, daily boat tours are conducted within
the swamp.
=======================================================================
V. CURRENT WASTEWATER MANAGEMENT SITUATION
Objective: To understand how wastewater is currently treated within the study site to allow comparison
against future wastewater management alternatives in terms of population served, untreated
wastewater, pollution removal effectiveness for key pollutants, and capital and recurring costs.
Possible data sources: Wastewater authorities; Consultants or engineers that work with the wastewater
authority; Environmental/water/natural resource agencies or ministries that issue wastewater permits;
Wastewater experts; Historical costs; National price books.
1. On-site wastewater treatment coverage:
Please estimate the percentage of the total domestic wastewater sector within the study that
uses each type of on-site system below. For example: 30% of the total population uses on-site
treatment. Of this 30%, 10% uses septic system, 10% uses pit latrines, and 10% uses soakaway
systems).
o Septic systems
o Pit latrines
o Soakaway systems
o Other?
A report by the CSO (2000) states that within the Chaguanas municipality, ~15% of people are connected
to a sewerage system, ~65% use septic tanks or soak-away systems, almost ~20% use pit latrines, and
0.23% have no treatment whatsoever. WASA recently confirmed this estimate in July, 2015 (2015).
What percentage of on-site systems (septic systems, pit latrines, soakaway systems, etc.) are
properly maintained (i.e., regularly pumped out, drain fields not clogged, etc.)?
Not clear – although stakeholders at both the introductory Environmental Management Authority (EMA)
and World Resources Institute (WRI) wastewater workshop in October 2014 (EMA and WRI 2014) and
the follow-up workshop in July 2015 (EMA and WRI 2015) indicated that there is some untreated
wastewater from on-site systems leaking into local water bodies. Additionally, the Chaguanas Spatial
Development Plan (Ministry of Local Government 2013) identified untreated wastewater as a hazard for
the local area.
2. Wastewater collection system (i.e., sewerage):
Please describe the coverage of the current sewage collection system in terms of length of
pipelines and the ultimate treatment point.

Valuing Wastewater Management 14 ANNEX 3: Characterization Form Results
Information not available.
Please estimate the percentage of the total population and commercial and industrial
establishments within the study that are connected to a centralized sewerage system.
According to the WASA 2008 report, only 14% of the total population in the study area has access to
centralized sewerage facilities. Additionally, stakeholders at the follow-up WRI/EMA workshop in July
2015 indicated that industrial wastewater discharge into WASA’s network is a concern – if industrial
sources discharge into WASA’s sewerage network they are not required to meet Water Pollution Rule
standards, and can overburden the sewerage system.
3. Wastewater treatment plants:
Please describe the number and type of wastewater treatment plants (WWTP) currently in
place in the study area.
Currently, there are 14-15 package wastewater treatment plants and up to three may be constructed in
the near term (WASA 2015). These systems serve the following developments:
Charlieville
Orchard Gardens
Centre City Mall
Centre Pointe Mall
Mid Centre Mall
Edinburgh 500
Penco Lands
Chaguanas Senior Comprehensive School
Lange Park
Boodram Development
Homeland Gardens
Point Pleasant
The Orchard Gardens plant is currently dysfunctional and is discharging untreated wastewater directly
into its receiving water bodies (WASA 2015). WASA plans to address this plant immediately. A large
number of the remaining package plants are operated by private operators and are in a dire state of
disrepair, with raw sewage discharging directly into the receiving streams.
There are four major wastewater treatment plants in the study area: Edinburgh 500, Penco, Lange Park,
and Charlieville plants. WASA states these are operating satisfactorily (2015). The Environmental
Management Authority (EMA) has provided WRI with recent Certificate of Environmental Clearance
(CEC) for WASA from 2009 for the Chaguanas area and environs for the activity, “the establishment,
modification, expansion and decommissioning or abandonment (inclusive of associated works) of
pipeline distribution systems for the delivery of potable, process water and sewage.” In 2013, a CEC was
issued to WASA for the decommissioning and demolition of the existing Homeland Gardens and Pointe
Pleasant WWTPs and the establishment of a new WWTP at the corner of Mahogany Drive and Teak

Valuing Wastewater Management 15 ANNEX 3: Characterization Form Results
Drive in Chaguanas. Certificates of Environmental Clearance are issued by EMA (under the
Environmental Management Act, Section 35) and certify the environmental acceptability of a proposed
activity, provided that all conditions in the CEC are met. The status of these activities, however, are
unknown.
Environmental Impact Statements are not available for any of these plants.
For each WWTP, please fill in Table 5 to the best extent possible. Please see Annex 2 for a
glossary of wastewater terminology. Please copy and paste this table as needed if more than
one treatment plant exists within the study site:
Information is not available for any of the four main WWTPs nor the package plants. WASA (2015) states
that as most plants were constructed before the establishment of the Water Pollution Rules in 2001,
water quality monitoring is not required for these plants.
Table 5: Wastewater Treatment Plant information for current situation
Data need Data
Design
Location
Design capacity - Nominal design capacity for dry and wet weather
flows.
Treatment technology (e.g., waste stabilization pond; oxidation
lagoon)
Effluent limits
Sludge treatment and disposal
Discharge location (receiving water body). If coastal, identify the
outfall locations.
Ease of operation (description of the no. of staff needed to
operate; the technical complexity of operation; and overall ease
of operating and maintaining the infrastructure)
Performance
Current flows (annual average flow, monthly average peak flow)

Valuing Wastewater Management 16 ANNEX 3: Characterization Form Results
Annual energy usage (kW hours, total cost)
Occurrence of bypassing at the treatment plant for the period
2010-2014 due to high flows, equipment failures, or power
outages (list date, cause and estimated bypassed volume for each
event).
Occurrence of overflows in the collection system due to heavy
rain, equipment failures, or blockages (average per year)
Annual average discharged concentrations and loads of:
BOD5 (mg/l, kilograms per year)
Dissolved oxygen (mg/l)
Total Nitrogen (mg/l, kilograms per year)
Ammonia Nitrogen (mg/l, kilograms per year)
Total Phosphorus (mg/l, kilograms per year)
Total Suspended Solids (mg/l, kilograms per year)
Faecal coliforms (units as reported)
Enterococci (units as reported)
4. What is the estimated annual percentage of total wastewater generated that is untreated and
released into water bodies? What is the estimated annual volume?
Data is not available on untreated wastewater volume delivered to receiving water bodies. However,
WASA (2015) noted several sources of untreated wastewater, including:
a. Unauthorized/unplanned developments
b. Grey water: Grey water is not treated from the 86% of the population using on-site
treatment
c. Dysfunctional package WWTPs
d. Population pressure: the population is expected to exceed the capacity of the current plants
5. If there is untreated sewage, where does this go? If possible, please also note on a map the
receiving water bodies and ecosystems that receive the untreated sewage – either directly, or via
an outfall.
Valuing Wastewater Management 17 ANNEX 3: Characterization Form Results
It is thought that untreated sewage travels to the southern portion of the Caroni swamp.
6. Is there an interest in improving, upgrading, or expanding the current wastewater management
system in the area? If so, please describe who is interested and why.
Yes –evidenced by the studies conducted by WASA and GENIVAR, the Chaguanas Spatial Development
Plan, and the CEC application submitted by WASA.
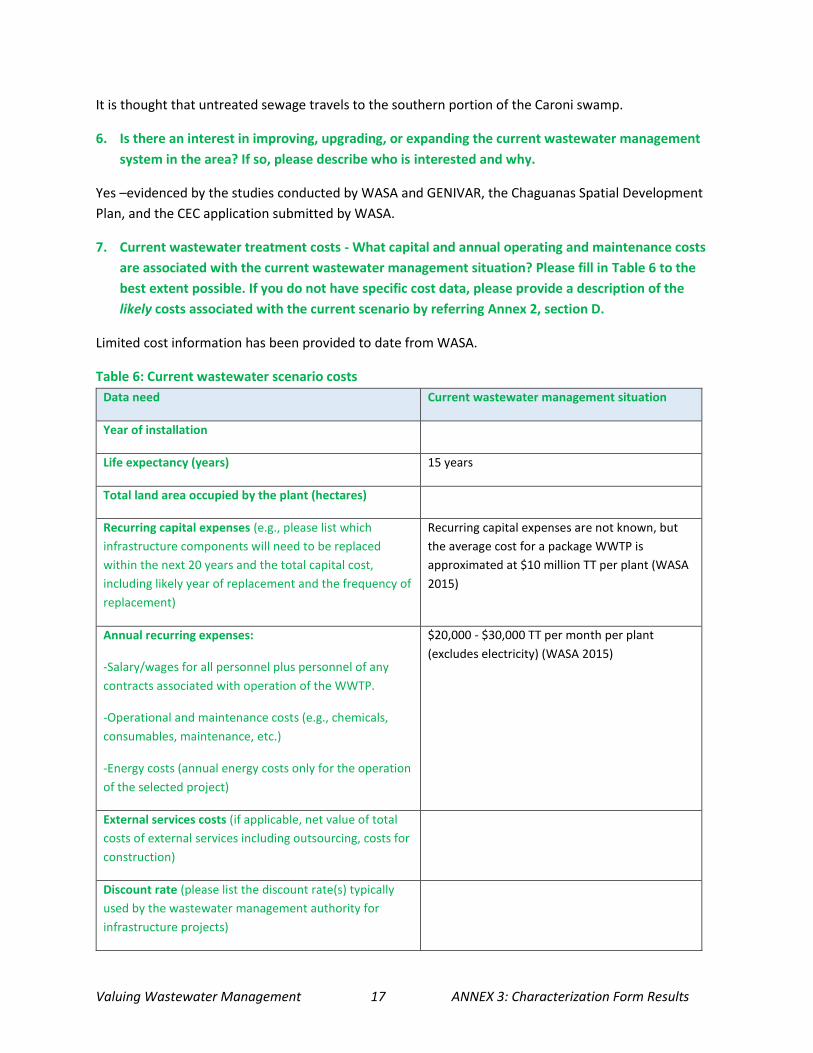
7. Current wastewater treatment costs - What capital and annual operating and maintenance costs
are associated with the current wastewater management situation? Please fill in Table 6 to the
best extent possible. If you do not have specific cost data, please provide a description of the
likely costs associated with the current scenario by referring Annex 2, section D.
Limited cost information has been provided to date from WASA.
Table 6: Current wastewater scenario costs
Data need Current wastewater management situation
Year of installation
Life expectancy (years) 15 years
Total land area occupied by the plant (hectares)
Recurring capital expenses (e.g., please list which
infrastructure components will need to be replaced
within the next 20 years and the total capital cost,
including likely year of replacement and the frequency of
replacement)
Recurring capital expenses are not known, but
the average cost for a package WWTP is
approximated at $10 million TT per plant (WASA
2015)
Annual recurring expenses:
-Salary/wages for all personnel plus personnel of any
contracts associated with operation of the WWTP.
-Operational and maintenance costs (e.g., chemicals,
consumables, maintenance, etc.)
-Energy costs (annual energy costs only for the operation
of the selected project)
$20,000 - $30,000 TT per month per plant
(excludes electricity) (WASA 2015)
External services costs (if applicable, net value of total
costs of external services including outsourcing, costs for
construction)
Discount rate (please list the discount rate(s) typically
used by the wastewater management authority for
infrastructure projects)
Valuing Wastewater Management 18 ANNEX 3: Characterization Form Results
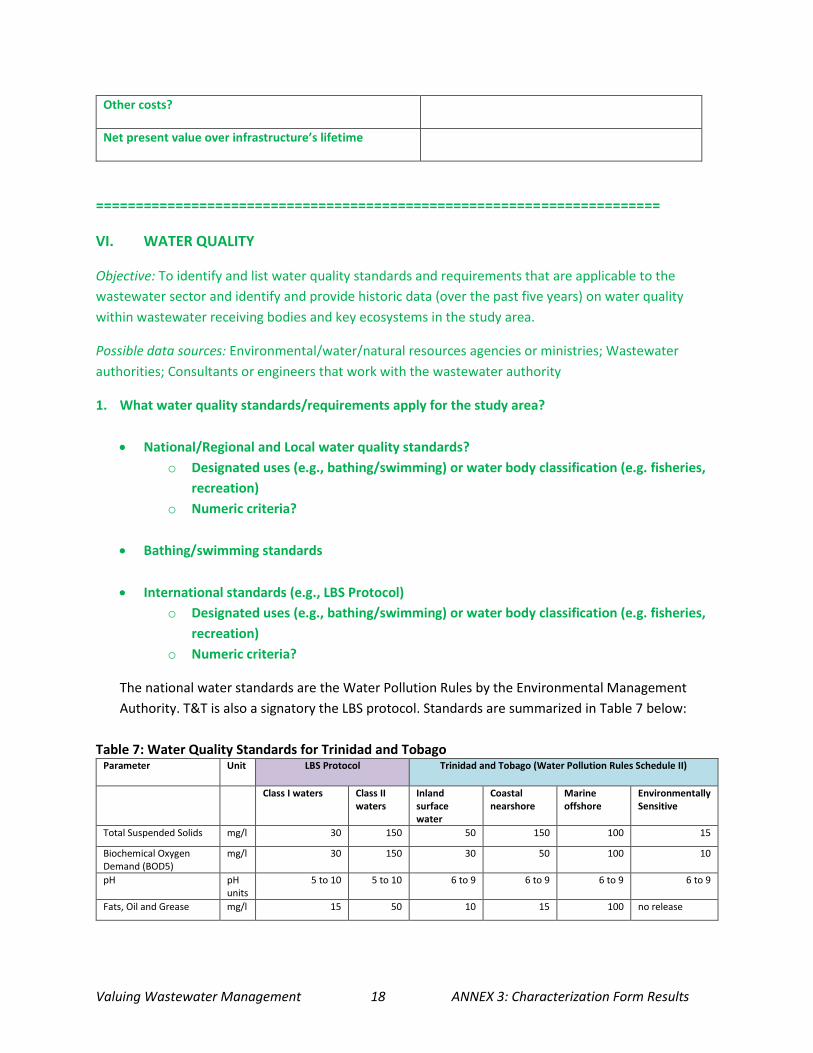
Other costs?
Net present value over infrastructure’s lifetime
=======================================================================
VI. WATER QUALITY
Objective: To identify and list water quality standards and requirements that are applicable to the
wastewater sector and identify and provide historic data (over the past five years) on water quality
within wastewater receiving bodies and key ecosystems in the study area.
Possible data sources: Environmental/water/natural resources agencies or ministries; Wastewater
authorities; Consultants or engineers that work with the wastewater authority
1. What water quality standards/requirements apply for the study area?
National/Regional and Local water quality standards?
o Designated uses (e.g., bathing/swimming) or water body classification (e.g. fisheries,
recreation)
o Numeric criteria?
Bathing/swimming standards
International standards (e.g., LBS Protocol)
o Designated uses (e.g., bathing/swimming) or water body classification (e.g. fisheries,
recreation)
o Numeric criteria?
The national water standards are the Water Pollution Rules by the Environmental Management
Authority. T&T is also a signatory the LBS protocol. Standards are summarized in Table 7 below:
Table 7: Water Quality Standards for Trinidad and Tobago Parameter Unit LBS Protocol Trinidad and Tobago (Water Pollution Rules Schedule II)
Class I waters Class II waters
Inland surface water
Coastal nearshore
Marine offshore
Environmentally Sensitive
Total Suspended Solids mg/l 30 150 50 150 100 15
Biochemical Oxygen Demand (BOD5)
mg/l 30 150 30 50 100 10
pH pH units
5 to 10 5 to 10 6 to 9 6 to 9 6 to 9 6 to 9
Fats, Oil and Grease mg/l 15 50 10 15 100 no release
Valuing Wastewater Management 19 ANNEX 3: Characterization Form Results
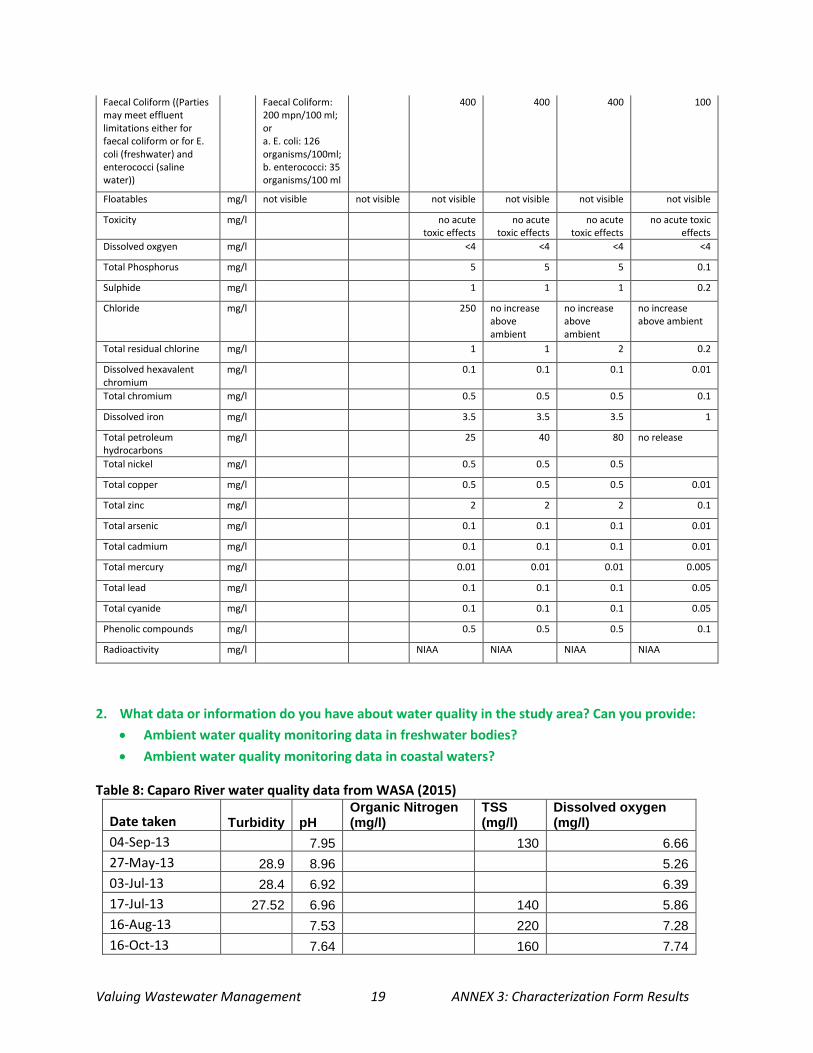
Faecal Coliform ((Parties may meet effluent limitations either for faecal coliform or for E. coli (freshwater) and enterococci (saline water))
Faecal Coliform: 200 mpn/100 ml; or a. E. coli: 126 organisms/100ml; b. enterococci: 35 organisms/100 ml
400 400 400 100
Floatables mg/l not visible not visible not visible not visible not visible not visible
Toxicity mg/l no acute toxic effects
no acute toxic effects
no acute toxic effects
no acute toxic effects
Dissolved oxgyen mg/l <4 <4 <4 <4
Total Phosphorus mg/l 5 5 5 0.1
Sulphide mg/l 1 1 1 0.2
Chloride mg/l 250 no increase above ambient
no increase above ambient
no increase above ambient
Total residual chlorine mg/l 1 1 2 0.2
Dissolved hexavalent chromium
mg/l 0.1 0.1 0.1 0.01
Total chromium mg/l 0.5 0.5 0.5 0.1
Dissolved iron mg/l 3.5 3.5 3.5 1
Total petroleum hydrocarbons
mg/l 25 40 80 no release
Total nickel mg/l 0.5 0.5 0.5
Total copper mg/l 0.5 0.5 0.5 0.01
Total zinc mg/l 2 2 2 0.1
Total arsenic mg/l 0.1 0.1 0.1 0.01
Total cadmium mg/l 0.1 0.1 0.1 0.01
Total mercury mg/l 0.01 0.01 0.01 0.005
Total lead mg/l 0.1 0.1 0.1 0.05
Total cyanide mg/l 0.1 0.1 0.1 0.05
Phenolic compounds mg/l 0.5 0.5 0.5 0.1
Radioactivity mg/l NIAA NIAA NIAA NIAA
2. What data or information do you have about water quality in the study area? Can you provide:
Ambient water quality monitoring data in freshwater bodies?
Ambient water quality monitoring data in coastal waters?
Table 8: Caparo River water quality data from WASA (2015)
Date taken Turbidity pH Organic Nitrogen (mg/l)
TSS (mg/l)
Dissolved oxygen (mg/l)
04-Sep-13 7.95 130 6.66
27-May-13 28.9 8.96 5.26
03-Jul-13 28.4 6.92 6.39
17-Jul-13 27.52 6.96 140 5.86
16-Aug-13 7.53 220 7.28
16-Oct-13 7.64 160 7.74
Valuing Wastewater Management 20 ANNEX 3: Characterization Form Results
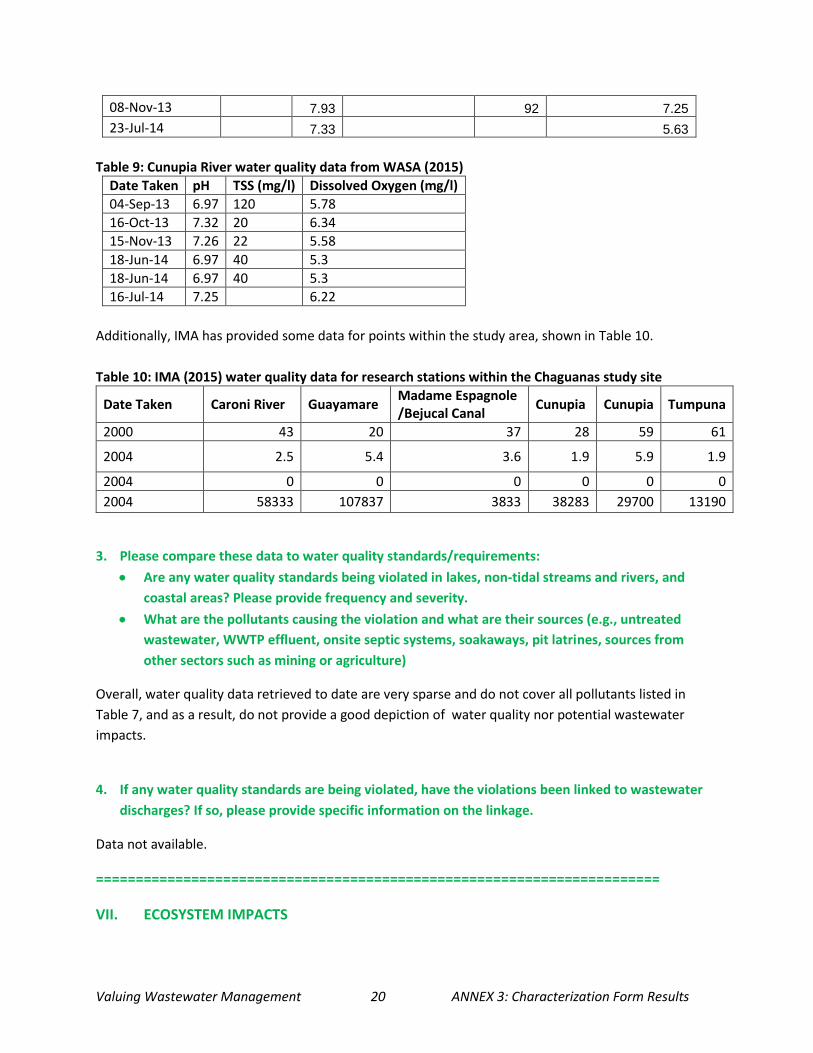
08-Nov-13 7.93 92 7.25
23-Jul-14 7.33 5.63
Table 9: Cunupia River water quality data from WASA (2015)
Date Taken pH TSS (mg/l) Dissolved Oxygen (mg/l)
04-Sep-13 6.97 120 5.78
16-Oct-13 7.32 20 6.34
15-Nov-13 7.26 22 5.58
18-Jun-14 6.97 40 5.3
18-Jun-14 6.97 40 5.3
16-Jul-14 7.25 6.22
Additionally, IMA has provided some data for points within the study area, shown in Table 10.
Table 10: IMA (2015) water quality data for research stations within the Chaguanas study site
Date Taken Caroni River Guayamare Madame Espagnole /Bejucal Canal
Cunupia Cunupia Tumpuna
2000 43 20 37 28 59 61
2004 2.5 5.4 3.6 1.9 5.9 1.9
2004 0 0 0 0 0 0
2004 58333 107837 3833 38283 29700 13190
3. Please compare these data to water quality standards/requirements:
Are any water quality standards being violated in lakes, non-tidal streams and rivers, and
coastal areas? Please provide frequency and severity.
What are the pollutants causing the violation and what are their sources (e.g., untreated
wastewater, WWTP effluent, onsite septic systems, soakaways, pit latrines, sources from
other sectors such as mining or agriculture)
Overall, water quality data retrieved to date are very sparse and do not cover all pollutants listed in
Table 7, and as a result, do not provide a good depiction of water quality nor potential wastewater
impacts.
4. If any water quality standards are being violated, have the violations been linked to wastewater
discharges? If so, please provide specific information on the linkage.
Data not available.
=======================================================================
VII. ECOSYSTEM IMPACTS

Valuing Wastewater Management 21 ANNEX 3: Characterization Form Results
Objective: To understand if there is a demonstrated link between wastewater pollution and ecosystem
health.
Possible data sources: Environmental/water/natural resources agencies or ministries; Wastewater
authorities; Consultants/engineers working with the wastewater authority; Environmental impact
statements; Environmental/marine NGOs and government agencies; Academic and grey literature.
1. Within the study area, are any of the following causing ecological impacts, such as algal blooms or
damage to coral reefs:
Discharge of untreated or partially treated sewage? Not sure
Discharge of treated wastewater effluent? Not sure
Irregular release of wastewater from a WWT system due to overflow, rainwater events, or
power failure, etc.? Not sure
Juman and Ramsewak (2013) state that the Caroni Swamp receives water polluted with sewage,
wastewater from industry and agriculture run-off, but the study does not say where the wastewater and
sewage is coming from exactly.
2. Have any studies been conducted within the study site or your country or region that link
wastewater pollution to ecosystem health? If so, what are the findings?
No.
3. Is there evidence of the following in any of the key ecosystems present in the study area: (e.g.,
freshwater, wetlands, mangroves, beaches, coral reefs, forests, wetlands):
Is it unsightly due to pollution? Are there algal blooms or obvious evidence of pollution?
Is there odor due to pollution?
Are there impacts to fish or other aquatic life (e.g., fish kills, overgrowth of algae on coral
reefs)?
Are you seeing a change in ecosystem health and/or growth?
Juman and Ramsewak (2013) conducted a study on land cover changes in the Caroni Swamp between
1942 and 2007 using remote sensing technology, geographic information systems, and extensive field
surveys. The report found that freshwater marsh and agriculture increased from 1942 to 1957, but
declined after this period as freshwater was diverted away from the wetland and salt water intruded
further inland. The study also found that, “Although mangrove forest was cleared for built development,
its coverage has consistently increased in the Swamp from 1957, with the exception of 2003 when there
was a decrease by less than 100 ha. This is in contrast to most areas in the tropics where mangrove
coverage continue to decline. In this case, the mangrove trees are outcompeting/shading marsh
vegetation, causing shift in the wetland communities. In the Caroni Ramsar Site, the natural wetland

Valuing Wastewater Management 22 ANNEX 3: Characterization Form Results
communities generally increased from 1942 to 2003, but declined in 2007, as built development more
than doubled.”
The Ministry of Food Production reported two pollution incidents to Water Resources Agency in March
and June 2014 within the Caparo River in the vicinity of Petersfield (WRA 2015). The area is currently
under cultivation as former Caroni lands. Farmers reported fish kills in the two incidents at the same
location. Water quality analysis showed high nutrient concentrations and a heavy foam presence was
observed during the field investigation. The suspected pollution source is discharge from a commercial
laundromat located upstream.
4. Beyond wastewater, are there any other sources of water pollution contributing to these
problems? If so, please indicate the relative contribution to total water pollution using the
following scale:
No contribution – Minor contribution – Moderate contribution – Significant contribution
Runoff from croplands?
Runoff from livestock?
Runoff from aquaculture?
Industrial discharge?
Cruise ships/yachts?
Others?
Do you have a sense of the relative contribution from wastewater to overall pollution of key
ecosystems compared to these other sources? If so, please describe.
Local stakeholders have indicated that agricultural and industrial pollution are two other major
contributors to water pollution. Industrial polluters also frequently discharge into the WASA sewerage
network and as a result, do not have to meet Water Pollution Rule standards for their effluent (EMA and
WRI 2015).
5. Are there any economic or cultural uses of the key ecosystems that are in decline due to
wastewater discharge issues (from untreated or improperly treated wastewater)? Please refer to
Annex 2, section B for examples of Caribbean coastal ecosystems and impacts that have been
documented from exposure to untreated or improperly treated wastewater.
Not sure – no data available.
6. Do tourists have any awareness of water quality issues and do they modify activities / visitation?
Are you able to quantify or describe the change in visitation (e.g., reduced annual snorkeling rates
or reduced number of visitors to recreational beaches)?
The Trinidad and Tobago Ministry of Tourism (2015) has provided tourism data for Trinidad as a whole
(so not specifically for the study site). This information helps to shed light, however, on the contribution
of the tourism sector to the national economy.

Valuing Wastewater Management 23 ANNEX 3: Characterization Form Results
Table 11 provides arrival data by mode of transportation.
Table 11: Tourism arrival data for Trinidad (Ministry of Tourism 2015) 2010 2011 2012 2013 2014
Air arrivals 386,262
Cruise arrivals 40,605 15,654 17,745 12,770 13,085
Yacht arrivals 1,060 1,030
For accommodations in Trinidad, there are 152 establishments including 21 apartments, 34 bed and
breakfasts, 34 guest homes, 5 host homes, 53 hotels, and 5 villas. In total there are 3,788 rooms. The
average expenditure per visitor has increased from $6,527 TT to $8,199 TT. Direct employment in
Trinidad and Tobago from tourism is equal to 27,200 jobs and the total contribution to GDP from travel
and tourism for both Trinidad and Tobago has increased from $10.5 million TT in 2010 to $12.6 million
TT in 2014.
=======================================================================
VIII. HUMAN HEALTH IMPACTS
Objective: To understand if there is a link between wastewater pollution and key human health illnesses
including gastroenteritis, ear and eye infections, and other illnesses (as listed in Annex 2, section C); and
to estimate the impacts on the local economy due to human health impacts (e.g., from hospitalization,
medication, time taken off work, and death).
Possible data sources: Health agencies or ministries; Hospitals or doctor’s offices; national
statistics/census data; international statistics from multilateral, intergovernmental or NGOs (e.g., World
Bank or World Health Organization); peer-reviewed or grey-literature.
1. Please describe any known human health impacts, such as gastrointestinal illness, respiratory
illness, ear infections, eye infections, or skin rashes/lesions that are occurring in the study site
that relate to wastewater. Please see Annex 2, section C for a list of human illnesses related to
swimming in, drinking from, or eating seafood from water contaminated with wastewater.
Are health data recorded on any of these key illnesses? If so, who collects this data? What can
you say about the average frequency and duration of occurrence for each type of illness (e.g.,
50 cases per year; 1 case per resident person per year)?
Do reported incidences of these illnesses result in doctors’ visits, hospitalization, or death? Do
you have statistical data on illnesses and hospital data?
Valuing Wastewater Management 24 ANNEX 3: Characterization Form Results
What activities seem to be contributing (e.g., swimming; eating contaminated seafood)?
How specific can you be about location?
Is wastewater pollution the main cause of these health issues? If not, what are the main
causes of these diseases?
In 2013, a study by Lahkan et al. was conducted on acute gastroenteritis and food-borne pathogens in
T&T. The study states, “During 2000-2005, there were seven large outbreaks of [Acute GastroEnteritis]
AGE with over 20,000 cases reported per year but less than 70 cases were of known aetiology (11). The
national surveillance system for AGE in T&T is based on both syndromic cases of AGE and its laboratory
confirmed pathogens collected using standard data collection forms—weekly syndromic and monthly
laboratory data-collection forms (11)—based on the Caribbean Public Health Agency (CARPHA), formerly
known as the Caribbean Epidemiology Centre (CAREC).[….] The reason why these illnesses are not well
understood lies in the fact that most affected people are not captured by the National Surveillance Unit
(NSU).
For acute gastroenteritis - the annual incidence rate was 0.6748 episodes per person-year, with 0.7083
episodes per person-year in males and 0.6321 episodes per person-year in females. The major reasons
cited for cases of acute gastroenteritis were food consumption (35.1%), drinking water (17.1%), contact
with another sick person (9.9%), contact with an animal (9.9%), and bacterial infection (<1%). Thus – it is
unclear the percentage of average cases that might be due to wastewater pollution.
Foodborne pathogens found in the study were salmonella, Shigella, rotavirus, and norovirus – all of
which have a link to wastewater.
There is currently no specific data for the study site, but do have data for T&T on gastroenteritis,
diarrhea, and food-borne illnesses for T&T. Lahkan et al. found that the common duration for diarrhea
was 3 days (with a range of 1-10 days). Time spent away due to diarrhea can involve the following costs:
medication and medical costs, costs for a caretaker, loss of leisure activity, loss of income, and loss of
days from school.
For acute gastroenteritis, the mean duration of illness was 2.3 days.
For acute gastroenteritis - the annual incidence rate was 0.6748 episodes per person-year, with 0.7083
episodes per person-year in males and 0.6321 episodes per person-year in females.
2. Have any studies been conducted within the study site or your country or region that link
wastewater pollution to human health?
Lahkan et al. (2013) – see above.
3. Do any of these studies estimate a dose-response relationship between a given wastewater
pollutant and a human health illness (e.g., gastroenteritis)? (See the BCA methods section for
more detail.)
No.
Valuing Wastewater Management 25 ANNEX 3: Characterization Form Results
4. Beyond wastewater, are there any other sources of water pollution contributing to these
problems? (If so, please note how large of a contribution.)
Runoff from agriculture?
Runoff from livestock?
Runoff from aquaculture?
Industrial discharge?
Cruise ships/yachts?
Others?
Stakeholders indicate that agricultural runoff and industrial pollution are likely sources of water
pollution in the study area (EMA and WRI 2014, 2015). No data are available, however, to support this.
5. Do you have a sense of the relative contribution from wastewater to overall health impacts
compared to these other sources? If so, please describe.
=======================================================================
IX. FUTURE WASTEWATER MANAGEMENT SCENARIO(S)
Objective: To identify and define at least one future wastewater management scenario to compare
against the current infrastructure situation in terms of population served, untreated wastewater,
pollution removal efficiency for key pollutants, and capital and recurring costs.
Possible data sources: Wastewater authorities; Wastewater consultants or engineers that work with the
wastewater authority; Environmental/water/natural resource agencies or ministries that issue
wastewater permits.
1. What option or options are under consideration for improving wastewater management in the
pilot area? Please provide a description and fill in for each major wastewater treatment plant or
infrastructure element. Please add columns as necessary if more than two alternatives are being
considered.
Based on recent guidance from WASA (2015) and the WASA 2008, GENIVAR 2009, and WASA Chapter
3.3.9 reports, there appear to be two future wastewater management scenarios that are being
considered:
1) Regionalized treatment at two main wastewater treatment plants: the existing Edinburgh 500
WWTP and a proposed Chaguanas WWTP in the northern area.
2) Regionalized treatment at one main wastewater treatment plant that will replace all existing
treatment plants.

Valuing Wastewater Management 26 ANNEX 3: Characterization Form Results
1) Regionalized treatment at two wastewater treatment plants: Edingburgh 500 and Chaguanas
WWTP
For the purpose of this report, we focus on the WASA 2008 report, as this was initially recommended to
us by WASA. The report identified the following as being included in this future wastewater
management scenario: developments located south of the contour will have their wastewater treated at
the Edinburgh 500 WWTP while the wastewater for developments located north of the contour will be
directed to a new WWTP, referred to as the Chaguanas Regional WWTP. The total construction period
would be roughly two years.
The ultimate average wastewater flow anticipated for the catchment area is 66,000 m³/d; this is broken
down as follows: Edinburgh 500 WWTP: 12,000 m³/d; Chaguanas Regional WWTP: 54,000 m³/d.
Edinburgh 500 WWTP - The plant currently uses an activated sludge-extended aeration process,
using aerated lagoons. The plant was constructed in the late 1980’s and has a design capacity of
3000 m³/d. The Plant is bordered by housing developments and the Caparo River. In 2004, the
Firm MacViro Consultants Ltd undertook a condition assessment of the Edinburgh 500 WWTP
and prepared detailed designs and Tender Documents to refurbish and expand the WWTP to a
design flow of 12,000 m³/d. The total flow from the existing and planned developments is
estimated to be 9,334 m³/d. The ultimate flow from the Edinburgh area is anticipated to fall
below the design flow of 12,000 m3/d planned for the expanded WWTP, thereby allowing some
spare capacity for servicing other developments and un-sewered areas near-by. The ultimate
population that will have access in the Edinburgh area is 28,730 persons.
Chaguanas Regional Wastewater Treatment Plant - A 14.1 ha site on the northwestern corner
of the catchment Caroni lands has been identified as potentially available to locate the
Chaguanas Regional Wastewater Treatment Plant. The spacious location allows for modular
expansion of the WWTP as growth takes place in the catchment area. It also ensures that the
closest neighbors will have the minimum 20-metre setback to cater for odors and noise from the
new facility. It is located at a low point in the catchment, which is ideal, since it will facilitate a
gravity feed system from the majority of the area to the new treatment facility. The ultimate
average design flow to be sent to the new Chaguanas Regional WWTP is anticipated to be
54,000 m³/d; this translates into approximately 104,200 persons having access to a centralized
wastewater system. Ten plants can be decommissioned with the construction of this new
facility. The new plant borders developments that have been earmarked for agricultural and
light industrial growth; which may present the potential to reuse the effluent and sludge
generated from the process in these adjacent developments. The effluent could also be
exported for reuse. The effluent generated from the Plant can also be used to supplement the
base flow in a tributary of the Cunupia River particularly during the dry-season; this will have a
positive impact for downstream users in the agriculture and farming industry.
Valuing Wastewater Management 27 ANNEX 3: Characterization Form Results
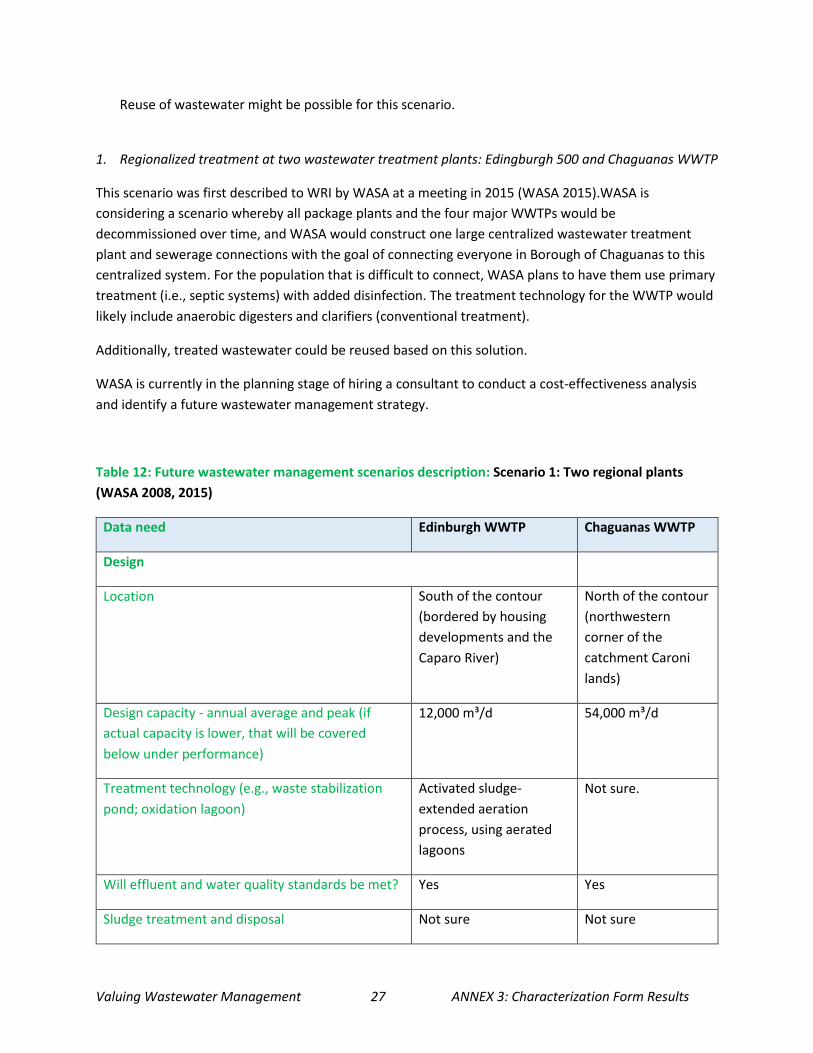
Reuse of wastewater might be possible for this scenario.
1. Regionalized treatment at two wastewater treatment plants: Edingburgh 500 and Chaguanas WWTP
This scenario was first described to WRI by WASA at a meeting in 2015 (WASA 2015).WASA is
considering a scenario whereby all package plants and the four major WWTPs would be
decommissioned over time, and WASA would construct one large centralized wastewater treatment
plant and sewerage connections with the goal of connecting everyone in Borough of Chaguanas to this
centralized system. For the population that is difficult to connect, WASA plans to have them use primary
treatment (i.e., septic systems) with added disinfection. The treatment technology for the WWTP would
likely include anaerobic digesters and clarifiers (conventional treatment).
Additionally, treated wastewater could be reused based on this solution.
WASA is currently in the planning stage of hiring a consultant to conduct a cost-effectiveness analysis
and identify a future wastewater management strategy.
Table 12: Future wastewater management scenarios description: Scenario 1: Two regional plants
(WASA 2008, 2015)
Data need Edinburgh WWTP Chaguanas WWTP
Design
Location South of the contour
(bordered by housing
developments and the
Caparo River)
North of the contour
(northwestern
corner of the
catchment Caroni
lands)
Design capacity - annual average and peak (if
actual capacity is lower, that will be covered
below under performance)
12,000 m³/d 54,000 m³/d
Treatment technology (e.g., waste stabilization
pond; oxidation lagoon)
Activated sludge-
extended aeration
process, using aerated
lagoons
Not sure.
Will effluent and water quality standards be met? Yes Yes
Sludge treatment and disposal Not sure Not sure

Valuing Wastewater Management 28 ANNEX 3: Characterization Form Results
Discharge location (receiving water body). If
coastal, is there an outfall(s)?
Not sure Not sure
Ease of operation (description of the no. of staff
needed to operate; the technical complexity of
operation; and overall ease of operating and
maintaining the infrastructure)
Performance
Flows (annual average, peak)
Annual energy usage (kW hours, total cost)
Occurrence of bypassing at the treatment plant
for the period 2010-2014 due to high flows,
equipment failures, or power outages (list date,
cause and estimated bypassed volume for each
event).
Occurrence of overflows in the collection system
due to heavy rain, equipment failures, or
blockages (average per year)
Annual average discharged concentrations and
loads of:
BOD5 (mg/l, kilograms per year)
Dissolved oxygen (mg/l)
Total Nitrogen (mg/l, kilograms per year)
Ammonia Nitrogen (mg/l, kilograms per
year)
Total Phosphorus (mg/l, kilograms per
year)
Total Suspended Solids (mg/l, kilograms
per year)
Faecal coliforms (units as reported)
Enterococci (units as reported)

Valuing Wastewater Management 29 ANNEX 3: Characterization Form Results
Table 13: Future wastewater management scenarios description: Scenario 2: one regional plant
(WASA 2015)
Data need Regional WWTP
Design
Location
Design capacity - annual average and peak (if actual capacity is
lower, that will be covered below under performance)
Treatment technology (e.g., waste stabilization pond; oxidation
lagoon)
Anaerobic digesters and clarifiers
Will effluent and water quality standards be met? Yes
Sludge treatment and disposal
Discharge location (receiving water body). If coastal, is there an
outfall(s)?
Ease of operation (description of the no. of staff needed to
operate; the technical complexity of operation; and overall ease
of operating and maintaining the infrastructure)
Performance
Flows (annual average, peak)
Annual energy usage (kW hours, total cost)
Occurrence of bypassing at the treatment plant for the period
2010-2014 due to high flows, equipment failures, or power
outages (list date, cause and and estimated bypassed volume for
each event).
Occurrence of overflows in the collection system due to heavy
rain, equipment failures, or blockages (average per year)
Annual average discharged concentrations and loads of:
BOD5 (mg/l, kilograms per year)
Dissolved oxygen (mg/l)
Valuing Wastewater Management 30 ANNEX 3: Characterization Form Results
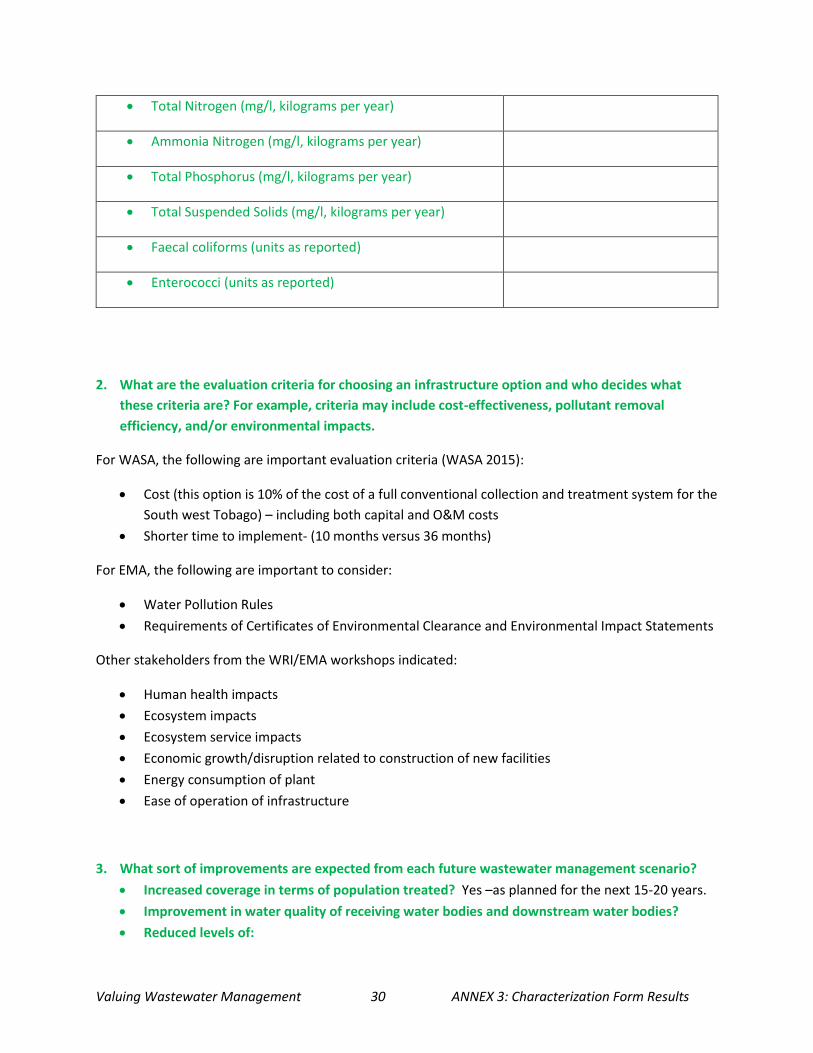
Total Nitrogen (mg/l, kilograms per year)
Ammonia Nitrogen (mg/l, kilograms per year)
Total Phosphorus (mg/l, kilograms per year)
Total Suspended Solids (mg/l, kilograms per year)
Faecal coliforms (units as reported)
Enterococci (units as reported)
2. What are the evaluation criteria for choosing an infrastructure option and who decides what
these criteria are? For example, criteria may include cost-effectiveness, pollutant removal
efficiency, and/or environmental impacts.
For WASA, the following are important evaluation criteria (WASA 2015):
Cost (this option is 10% of the cost of a full conventional collection and treatment system for the
South west Tobago) – including both capital and O&M costs
Shorter time to implement- (10 months versus 36 months)
For EMA, the following are important to consider:
Water Pollution Rules
Requirements of Certificates of Environmental Clearance and Environmental Impact Statements
Other stakeholders from the WRI/EMA workshops indicated:
Human health impacts
Ecosystem impacts
Ecosystem service impacts
Economic growth/disruption related to construction of new facilities
Energy consumption of plant
Ease of operation of infrastructure
3. What sort of improvements are expected from each future wastewater management scenario?
Increased coverage in terms of population treated? Yes –as planned for the next 15-20 years.
Improvement in water quality of receiving water bodies and downstream water bodies?
Reduced levels of:
Valuing Wastewater Management 31 ANNEX 3: Characterization Form Results
o BOD5
o Dissolved oxygen
o Total nitrogen
o Ammonia nitrogen
o Total phosphorus
o Total suspended solids
o Faecal coliforms
o Enterococci
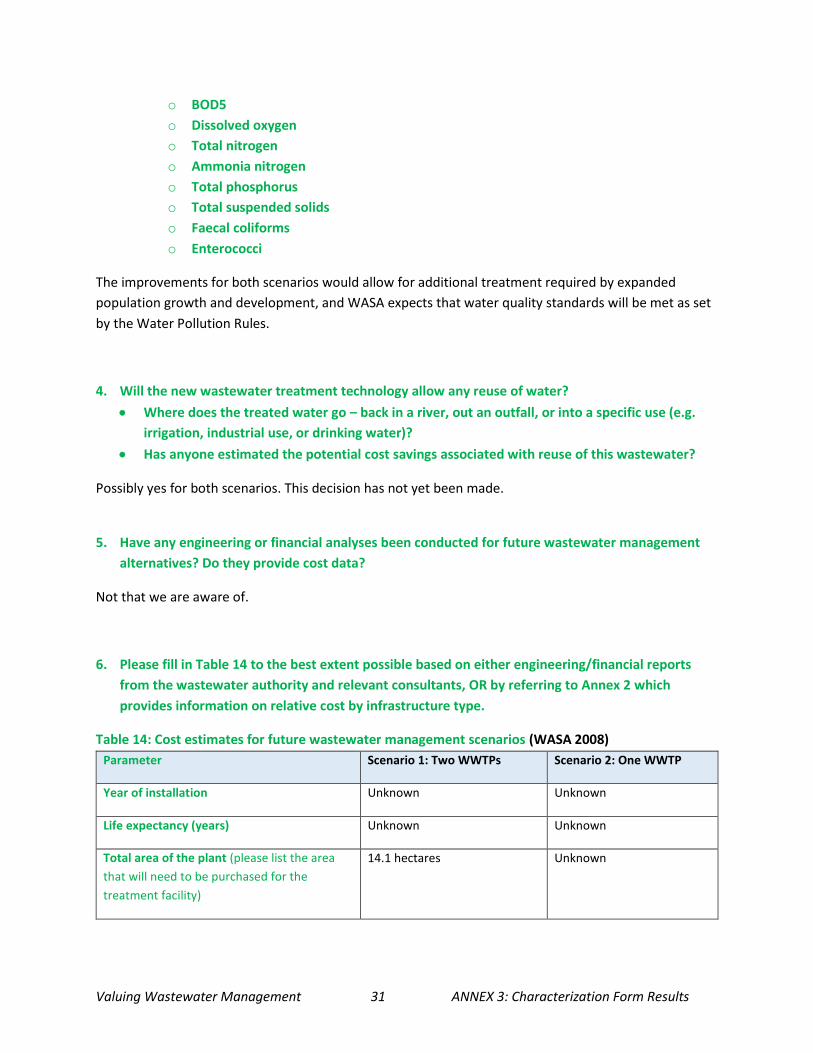
The improvements for both scenarios would allow for additional treatment required by expanded
population growth and development, and WASA expects that water quality standards will be met as set
by the Water Pollution Rules.
4. Will the new wastewater treatment technology allow any reuse of water?
Where does the treated water go – back in a river, out an outfall, or into a specific use (e.g.
irrigation, industrial use, or drinking water)?
Has anyone estimated the potential cost savings associated with reuse of this wastewater?
Possibly yes for both scenarios. This decision has not yet been made.
5. Have any engineering or financial analyses been conducted for future wastewater management
alternatives? Do they provide cost data?
Not that we are aware of.
6. Please fill in Table 14 to the best extent possible based on either engineering/financial reports
from the wastewater authority and relevant consultants, OR by referring to Annex 2 which
provides information on relative cost by infrastructure type.
Table 14: Cost estimates for future wastewater management scenarios (WASA 2008)
Parameter Scenario 1: Two WWTPs Scenario 2: One WWTP
Year of installation Unknown Unknown
Life expectancy (years) Unknown Unknown
Total area of the plant (please list the area
that will need to be purchased for the
treatment facility)
14.1 hectares Unknown

Valuing Wastewater Management 32 ANNEX 3: Characterization Form Results
Capital/Investment expenses (This includes
one-time construction, planning, and design
costs, costs for new development, and cost
for replacement and renovation of existing
assets – including external or consulting
services)
PHASE 1 COSTS: (TT$164.2
million)
Land acquisition – TT$2 million
Expand Edinburgh 500 – TT$25.8 million
Chaguanas Regional Phase 1 - TT$106.7 million
Trunk sewers to existing Chaguanas collection areas - TT$15.7 million
Environmental impact assessment - TT$2 million
Lange Park and Orchard Gardens WWTPs - TT$12 million
PHASE 2 COSTS: (TT$866.4
million)
Expand Chaguanas WWTP - TT$191.8 million
Trunk sewers Cunupia - TT$25.3 million
Collection piping, Chaguanas - TT$261.3 million
Collection piping, Cunupia - TT$388 million
Unknown
Recurring capital expenses (e.g., please list
which infrastructure components will need to
be replaced sooner than the life expectancy
of the treatment facility and the recurring
capital cost, including likely year of
replacement and the frequency of
replacement)
Unknown Unknown
Annual recurring expenses:
-Salary/wages for all personnel
Unknown Unknown

Valuing Wastewater Management 33 ANNEX 3: Characterization Form Results
-Land rental value for land purchased (i.e., the
value of land purchased to install the
wastewater infrastructure)
-Operational and maintenance costs (e.g.,
chemicals, consumables, maintenance, etc.)
-Energy costs (annual energy costs only for
the operation of the selected project)
Discount rate (please list the discount rate(s)
typically used by the wastewater
management authority for infrastructure
projects)
Phase 1 Engineering and
Contingency costs - TT$57.47
million
Phase 2 Engineering and
contingency costs - TT$303.24
million
Unknown
Other costs Unknown Unknown
Net present value over infrastructure’s
lifetime
Unknown Unknown
TT$1,391.31 million Unknown
=======================================================================
X. CHANGES TO ECOSYSTEM AND HUMAN HEALTH UNDER IMPROVED WASTEWATER
MANAGEMENT SCENARIOS
Objectives: To quantify and/or describe how ecosystems and the goods and services they provide will
change under each future wastewater management scenario, and the potential impacts on the local
economy in terms of costs;
To quantify and/or describe how human health will be impacted under each future wastewater
management scenario in terms of numbers of reported illnesses and costs.
Possible data sources: Peer-reviewed and grey literature; Government documents including
environmental impact statements.
1. Have any evaluations, studies, or environmental impact statements been conducted that estimate
the impact on key ecosystems and human health under each new wastewater management
scenario compared to the current wastewater management situation? Do you know of any

Valuing Wastewater Management 34 ANNEX 3: Characterization Form Results
experts that are currently studying potential impacts? If so, please describe these findings,
including how likely management under each scenario is to:
Reduce the annual loading of pollutants on receiving water bodies?
Reduce odor?
Reduce the incidence of harmful algal blooms and/or nutrient over-enrichment?
Reduce human health risk and/or the number of cases for illnesses previously identified?
Improve ecosystem health conditions for the key ecosystems identified previously?
Improve the provision of key ecosystem goods and services identified previously (e.g., increased
likelihood of tourist visits, increased productivity of fisheries due to improved coral reef and
mangrove health)
No.
2. Can you establish a quantitative relationship between an improvement in water quality due to the
future wastewater management alternative and a change in provision of ecosystem services for
each key ecosystem? If so, please list your assumptions and quantitatively describe these changes
(e.g., by reducing the amount of untreated wastewater entering the coral reef ecosystem, total
nitrogen levels will decrease by 30% surrounding the reef which will improve coral reef health
such that fisheries production increased by 20%).
No.
3. Can you monetize or value the change in ecosystem service provision (e.g., what is the economic
value of reduced coral reef degradation in terms of fisheries improvement – this is often
quantified by estimating the market value of fish sold in a marketplace)?
No.
=======================================================================
XI. OTHER INFORMATION
1. Please list any additional data or information you think would be useful to the study that might
not have been discussed previously in this characterization form.
=======================================================================

Valuing Wastewater Management 35 ANNEX 3: Characterization Form Results
XII. REFERENCES
Central Statistical Office, 2011. Trinidad and Tobago 2011 population and housing census demographic
report. Ministry of Planning and Sustainable Development. Government of Trinidad and Tobago.
Central Statistical Office, 2000. Chapter 3: Human Settlement. Retrieved from
http://cso.planning.gov.tt/sites/default/files/content/documents/Chapter%203%20-
%20Human%20Settlement%201881%20-%202000.pdf on April 14, 2015.
EMA and WRI Follow-up Workshops, 2015. “Resource valuation studies for wastewater management in
Trinidad and Tobago.” July 2015. Port of Spain, Trinidad and Southwest Tobago.
EMA and WRI Introductory Workshops, 2014. “Resource valuation studies for wastewater management
in Trinidad and Tobago.” October 2014. Port of Spain, Trinidad and Southwest Tobago.
GENIVAR, 2009 (est). WASA water and wastewater master plan and policy development: Wastewater
alternatives report for Trinidad (Draft).
Institute of Marine Affairs (2015). Personal communications between IMA and WRI in July 2015.
Juman, R., Ramsewak, D., R., 2013. Land cover changes in the Caroni Swamp Ramsar Site, Trinidad (1942—
2007): implications for management. Journal of Coastal Conservation. Planning and Management. Vol. 17
(1): 133—141.
Juman, R., Bacon, P., Gerald, L., 2002. The Caroni River Basin, Trinidad. Final Draft report provided to WRI
in May 2015.
Lahkan, C., Badrie, N., Ramsubhag, A., Sundaraneedi, K., Indar, L., 2013. Burden and impact of acute
gastroenteritis and foodborne pathogens in Trinidad and Tobago. Journal of Health and Population
Nutrition. 2013 Dec. 3 Issue 4: Suppl 1: S30-S42.
Mackoon, Paul. An Economic Valuation of the Recreational Resources at the Caroni Swamp Bird
Sanctuary. Retrievd from http://caroniswamprdi.org/research/paul.pdf on April 13, 2015.
Ministry of Local Government, 2013. Chaguanas Spatial Development Plan. Retrieved from
http://www.localgov.gov.tt/~/media/Resource%20Library/Spatial%20Development%20Plans%20Per%2
0Corporation/Chaguanas%20Borough%20Corporation%20Spatial%20Development%20Plan.ashx on
April 14, 2015.
Ministry of Tourism, 2015. Personal communication between the Ministry of Tourism and Vidjaya
Ramkhalawan, EMA in August, 2015.
Rambial, B.S., 1980. The social and economic importance of the Caroni mangrove swamp forest. Paper
presented at the 11th Commonwealth Forestry Conference, Trinidad and Tobago, September.

Valuing Wastewater Management 36 ANNEX 3: Characterization Form Results
WASA (Unknown). Detailed designs and tender documents for construction contracts for the
rehabilitation, expansion, and integration of wastewater treatment facilities. Chapter 3.3.9 Chaguanas
Sewerage Catchment.
WASA 2015. Personal communication between Carl Santana and Roger Karim from WASA, and Erin Gray
and Lauretta Burke from WRI, between July and August 2015.
WASA, 2009. The Development of a Water and Wastewater Master Plan and Policy for Trinidad and
Tobago. Demand for Wastewater Services – Trinidad. Final – Revision 1. June 2009.
WASA, 2008. Wastewater services in Chaguanas and environs. WASA Wastewater Unit.
Water Resources Agency, 2015. Personal communications between WRA and WRI in July 2015.
Wikipedia, 2015. Chaguanas. Retrieved from http://en.wikipedia.org/wiki/Chaguanas on April 14, 2015.
Top Related