


Languages
Pages
Legal


Analysemethoden und Kodierungsprinzipien
28.11.2005
http://www.uni-oldenburg.de/sinnesphysiologie/15241.html

Vorläufiges(!) Vorlesungsprogramm
17.10.05 Motivation24.10.05 Passive Eigenschaften von Neuronen31.10.05 Räumliche Struktur von Neuronen07.11.05 Aktive Eigenschaften von Neuronen14.11.05 Das Hodgkin-Huxley Modell21.11.05 Kodierung sensorischer Reize + Modellsimulation28.11.05 Analysemethoden und Kodierungsprinzipien05.12.05 Variabilität neuronaler Antworten12.12.05 Synaptische Übertragung08.01.06 Entstehung rezeptiver Felder16.01.06 Zwei Modelle retinaler Verarbeitung23.01.06 Populations- und Ensemble-Kodierung30.01.06 Künstliche Neuronale Netze06.02.06 Lernen in natürlichen und künstlichen Netzwerken
Themen:
Analysemethoden:Stimulus-Response KurvenRezeptive FelderTuningkurvenRasterplotPeri-Stimulus-Time-Histogram
Verschiedene KodierungsprinzipienBeispiel: Mechanoperzeption des Blutegels

Hausaufgabe
Wie sieht die Übertragungsfunktion zwischen physikalischem Stimulus und der Spikefrequenz aus?
Welche Fälle muss man betrachten?
Was sind die Schwierigkeiten bei der Bestimmung der Übertragungsfunktion?

Kodierung sensorischer Reize
Reichert 1990
physikalischerReiz
analoge Spannungs-
antwort
digitale Spannungs-
impulse
Kodierung
Um-kodierung
Auch eher eineSigmoidfunktion!

Das Nervensystem des Blutegels
21 sehr ähnliche Körpersegmente
In jedem Ganglion ca. 400 individuell bekannte Neurone
Überschaubare Neuronennetze steuern Verhalten
Weisblatt & Kristan 1985

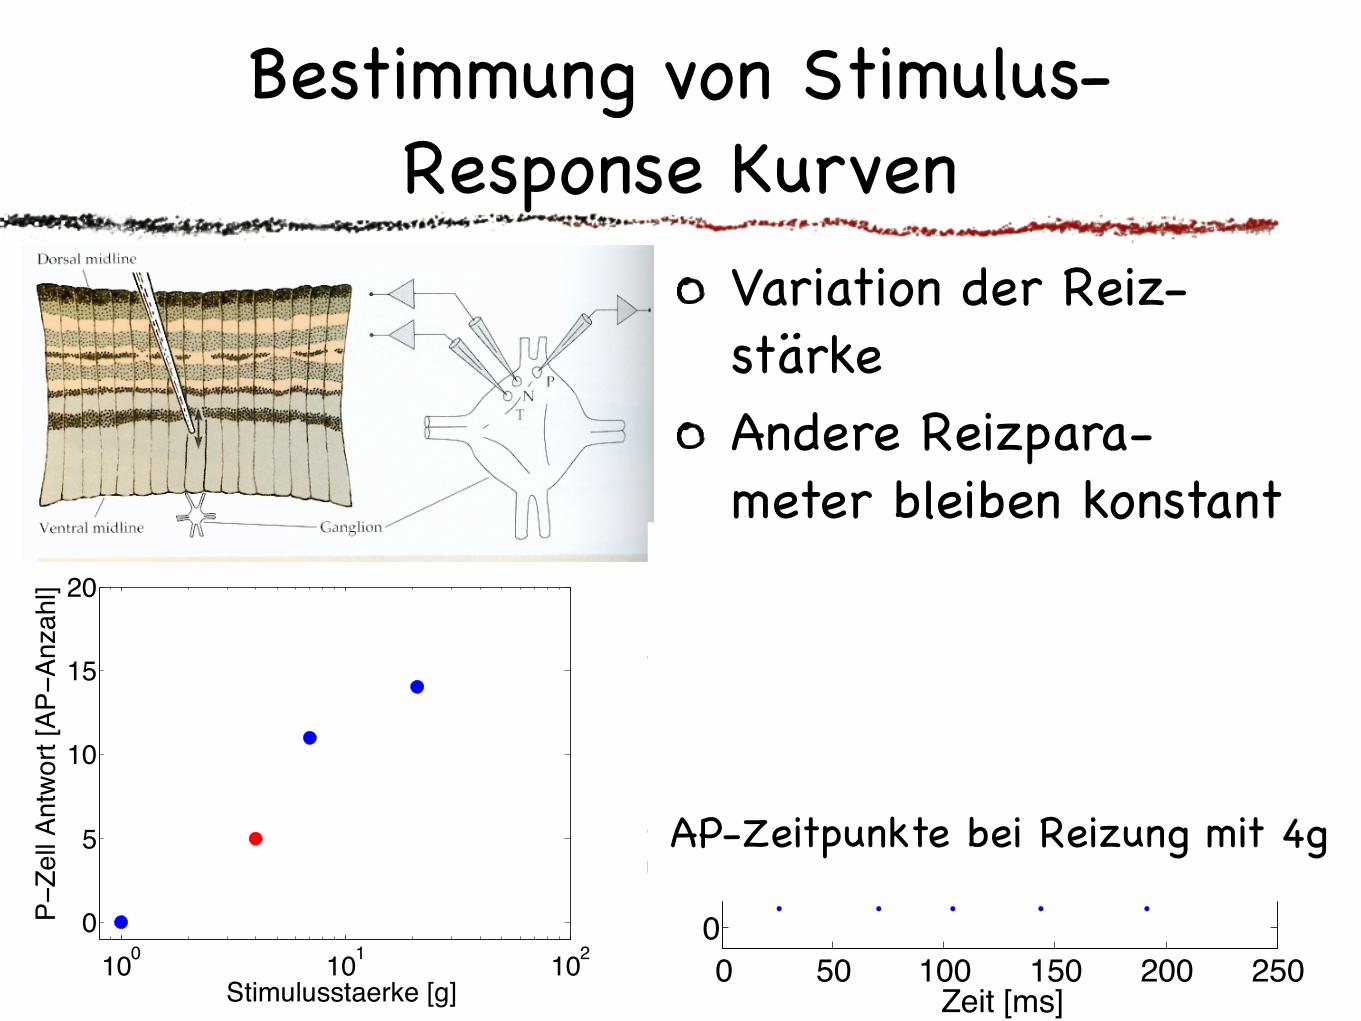
Bestimmung von Stimulus-Response Kurven
Variation der Reiz-stärkeAndere Reizpara-meter bleiben konstantWiederholte gleiche Reizung Mittelwert und Standardabweichung der AP-Anzahl für jede Reizstärke
1g
7g
21g10
010
110
2
0
5
10
15
20
Stimulusstaerke [g]
P!
Zell
Antw
ort
[A
P!
Anzahl]
Nichollset al. 2001
Bestimmung von Stimulus-Response Kurven
Variation der Reiz-stärkeAndere Reizpara-meter bleiben konstantWiederholte gleiche Reizung Mittelwert und Standardabweichung der AP-Anzahl für jede Reizstärke
0 50 100 150 200 250
0
5
10
15
20
Zeit [ms]
Reiz
pra
esenta
tionen
AP-Zeitpunkte bei Reizung mit 4g
100
101
102
0
5
10
15
20
Stimulusstaerke [g]
P!
Zell
Antw
ort
[A
P!
An
zahl]

Achtung! Variabilität!
Wiederholte gleiche Reizung führt zu unterschiedlichen Antworten!
0 50 100 150 200 250
0
5
10
15
20
Zeit [ms]
Reiz
pra
esenta
tionen
100
101
102
0
5
10
15
20
Stimulusstaerke [g]
P!
Zell
Antw
ort
[A
P!
An
zahl]
Raste
rplot

Bestimmung von Stimulus-Response Kurven
Variation der Reiz-stärkeAndere Reizpara-meter bleiben konstantWiederholte gleiche Reizung Mittelwert und Standardabweichung der AP-Anzahl für jede Reizstärke
TOUCH REPRESENTATION BY LEECH SENSORY NEURONS 2589
a greater extent and produce other behavioral responses.] Byusing the same set of stimuli in a different group of fiveanimals, we found that the mean tension response increaseswith stimulus intensity in a manner similar to P-cell activa-tion but quite different from that of T-cell activation. TheT-cell spike count saturated at stimulus intensities ú1 mN;at this intensity, the behavioral response was only 25% ofthe response produced by the 37-mN stimulus. In agreementwith a previous study with a different approach (Kristan1982), this result suggests that P cells provide the majorinput for controlling the magnitude of the local bend re-sponse.However, it is still possible that the T cells provide spatial
FIG. 6. Mechanosensory neuron and behavioral tuning to stimulus inten- information, but their influence is gated by the P cells ( i.e.,sity. Stimuli of different intensities were delivered at S Å 45!. Normalized the information is not manifest in the behavior unless the Presponses (mean { SE; 5 animals) are plotted vs. stimulus intensity. Re-
cells are sufficiently active) . To test this possibility, wesponses of the T and P cells were measured by the normalized spike count,attempted to bias the tension response (measured at 45!)and the behavioral response was measured by normalized peak body wall
tension. evoked by a mechanical stimulus (S Å 45!; 22 mN) withsimultaneous intracellular stimulation of the TV cell (ú20Hz, 1-s trains) . If the T cells provide spatial information,extent to which their tuning curves overlap. In another study,the evoked tension should be diminished by TV stimulationwe characterized the local bend response as a function ofcaused by an effective shift in the bend direction to a morestimulus location (Lewis and Kristan 1998a). The RMSventral location (toward the preferred location of the TVdifference between stimulus location and the direction of thecell) . If the T cells provide nonspecific amplification to theevoked bend (i.e., behavioral error) was 8% and is shownlocal bend response, the tension response should increase.in Fig. 5B for comparison. With the stimulus encoding byWe found that TV stimulation had no effect on the tensionthe sensory neurons more than twice as accurate as the be-response measured at 45! (P ú 0.05, 2 animals, 8 trials) ,havior, it is clear that a neural code for stimulus locationindicating that the T cells play no detectable role in thisinvolving only the spike count contains more than enoughresponse. In similar experiments, intracellular P-cell stimula-information to account for the behavior.tion produced a significant and predictable effect on thebehavior (Lewis and Kristan 1998b). From these and previ-Relative importance of T and P cellsous results, we conclude that the P cells are the major carriersof spatial information to the local bend network.Because both T and P cells independently encode stimulus
location with an accuracy greater than the behavioral accu-racy, we tested whether the encoded information from each Varying encoding timecell type is actually used by the local bend networks.The thresholds and specific modalities differ for each of In Fig. 5 we showed that the decoding error with P-cell
spike trains wasÇ3%. These estimates were made for spikesthese cell types; T cells have a low threshold and are mostsensitive to the velocity of indentation of the body wall by occurring for an entire 700-ms interval after stimulus onset.
The latency for a behavioral response (muscle tension) ismechanical stimulation (Carlton and McVean 1995),whereas P cells have a higher threshold and respond best to typically Ç200 ms. How much information is available at
this short latency? To address this question, we calculatedchanges in the magnitude of body wall indentation. To testthe relative contributions of T and P cells to local bending, the mean decoding error for different encoding times (i.e.,
time since stimulus onset) . An encoding time of 700 mswe quantified the behavioral output and response of the sen-sory cells to mechanical stimuli of different intensities. We corresponds with the control condition (Fig. 5) . We mea-
sured the tuning curves and spike count variability again butlimited our studies to one stimulation site and one body walltension measurement site (45! for both) . At this stimulus only considered spikes that occurred in the time window
corresponding to a particular encoding time. For all encodinglocation, one P cell (right PD) and two T cells ( the right TDand TL) are activated to ú70% of their maximum level, and times tested, the tuning curves, normalized to maximum re-
sponse, were not significantly different from the controla third T cell ( the left TD) is activated to Ç25% of itsmaximum (see Fig. 5A) . The remaining cells are not acti- (Pú 0.05). In addition, the variability in the normalized
spike count for the different integration times was not sig-vated.Figure 6 shows the normalized spike count of the PD and nificantly different from control (P ú 0.05). This means
that the tuning curves in all cases differ only by a scalingTD (mean { SE, 5 animals) . For stimulus intensities ú1mN, the TD-cell spike count does not change significantly. factor ( i.e., the total number of spikes; see Fig. 7A) ; for
longer encoding times, more spikes are available to contrib-The PD-cell spike count increases substantially over the rangeof 1–37 mN (Fig. 6) . [A third type of mechanosensory ute information.
Again, with the tuning curves and the variability of theneuron, the high-threshold N (nociceptive) cell, never pro-duced more than one spike for the largest stimulus intensity responses, we estimated the decoding error for different encod-
ing times (Fig. 7B). At 100 ms, the error decreases belowshown here. We did not investigate stimulus intensitiesgreater than these because the N cells would be activated to that found in the behavior, and interestingly counting spikes
J131-8/ 9k2e$$no30 10-26-98 22:35:29 neupa LP-Neurophys
Lewis & Kristan 1998

J. E. LEWIS AND W. B. KRISTAN2586
stimulus location around the body perimeter. Figure 2 showstuning curves of normalized spike count versus stimuluslocation for the right T and P cells. These curves representthe averages over six different animals. Both T and P cellsexhibit broad and overlapping tuning curves, with peaksdistributed around the body perimeter. By using the commonconvention, we refer to the stimulus location that producesthe maximum response for a given cell as that cell’s pre-ferred location. The preferred locations serve to identify thedifferent cells; TD and PD are activated most by dorsal stim-uli, TV and PV by ventral stimuli, and TL by lateral stimuli.The shapes of these tuning curves, along with the periodic
nature of the dependent variable (i.e., stimulus location, S ,on the body perimeter varies between 0180 and /180!) ,suggest that a cosine function might be an appropriate sum-
FIG. 1. Typical mechanosensory spike trains. Intracellular recordings mary of the data from both cell types. We fit the means forfrom the T and P mechanosensory neurons during a 500-ms mechanical each cell from each individual animal to the cosine functionstimulus to the body wall (22 mN). The T cell exhibits rapidly adapting
in Eq. 2responses at both stimulus onset and offset, whereas the P cell shows acomparatively tonic response.
f(S) Å Rmax
1 0 A{cos (S 0 So) 0 A} (2)
in the population of sensory neurons. Theunissen and Miller deriveThis formulation was used previously (e.g., Miller et al.
an expression that describes the transinformation, T , as a function1991) and is convenient because Rmax is the maximum re-of the RMS error, e (see Eq. 1 following, and Eq. 11 in Theunissen
and Miller 1991)
T Å log2 !!2p
e " 0 1
2 ln (2)(1)
The wind-sensitive interneurons in the cricket cercal system de-scribed by Theunissen and Miller are completely analogous to themechanosensory neurons described in this study. Here we use Eq.1 to provide a quantitative measure of the information content inthe population responses of the sensory neurons and thus providean additional interpretation of the encoding error.
R E S U L T S
A mechanical stimulus that elicits the local bend behavioractivates two types of mechanosensory neurons, T cells andP cells (Kristan et al. 1982). In a single segment there aresix T cells and four P cells. Figure 1 shows typical spiketrains produced by the mechanical stimulus used in ourstudy. The T cell adapted rapidly and fired at the onset andoffset of the stimulus. Recently, Carlton and McVean (1995)proposed that the T cells encode the velocity of skin indenta-tion. The T-cell firing dynamics are similar to those shownby rapidly adapting (RA) afferents in humans (Vallbo andJohansson 1984; Wheat et al. 1995). The P-cell spike trainshowed a slowly adapting (SA) response to a mechanicalstimulus, which is similar to responses of the human SAafferents (Vallbo and Johansson 1984; Wheat et al. 1995).To quantify the responses of the T and P neurons, we simplycounted the number of spikes occurring in the 700-ms periodafter onset of a 500-ms stimulus (unless otherwise noted).In doing this, we ignore the temporal pattern of the neuralresponses.
Spatial tuning: response as a function of stimulus locationFIG. 2. Mechanosensory neuron tuning curves to stimulus location.
Mean normalized spike count is plotted for different stimulus locations forTo assess the ability of the T and P cells to encode the
the (A) 3 types of T cells and (B) 2 types of P cells (mean { SE, 6location of a mechanical stimulus on the skin, we first char- animals) . The mean spike counts at the tuning curve peaks were 15.1 (T
cells) and 7.2 (P cells) .acterized their average response properties as a function of
J131-8/ 9k2e$$no30 10-26-98 22:35:29 neupa LP-Neurophys
Variation der Reiz-position Andere Reizpara-meter bleiben konstantWiederholte gleiche Reizung Mittelwert und Standardabweichung der AP-Anzahl für jede Position
Bestimmung rezeptiver Felder

Allgemeines Verfahren:Bestimmung von Tuningkurven
Variation einer Reiz-eigenschaft Andere Reizpara-meter bleiben konstantWiederholte gleiche Reizung Mittelwert und Standardabweichung der AP-Anzahl für jede Eigenschaft
nachHubel &Wiesel

Sensorische Reize können viele Dimensionen haben. Z.B. im visuellen System
Vieldimensionale Parameterräume
Position Räumliche StrukturHelligkeit Zeitliche StrukturKontrast BewegungsrichtungWellenlänge Bewegungsgeschwindigkeit...
Programm
Arbeitsweise von Sensorzellen - Kodierung sensorischer Reize durch elektrische Signale
Stimulus-Response Kurven
Wie modelliert man Sensorzellen?
Integrate and Fire Modell
Neuronenmodelle im Vergleich
Programm
Arbeitsweise von Sensorzellen - Kodierung sensorischer Reize durch elektrische Signale
Stimulus-Response Kurven
Wie modelliert man Sensorzellen?
Integrate and Fire Modell
Neuronenmodelle im Vergleich
Programm
Arbeitsweise von Sensorzellen - Kodierung sensorischer Reize durch elektrische Signale
Stimulus-Response Kurven
Wie modelliert man Sensorzellen?
Integrate and Fire Modell
Neuronenmodelle im Vergleich
Programm
Arbeitsweise von Sensorzellen - Kodierung sensorischer Reize durch elektrische Signale
Stimulus-Response Kurven
Wie modelliert man Sensorzellen?
Integrate and Fire Modell
Neuronenmodelle im Vergleich
Kombination der variierten Parameter: Mehrdimensionale Tuningkurven
Programm
Arbeitsweise von Sensorzellen - Kodierung sensorischer Reize durch elektrische Signale
Stimulus-Response Kurven
Wie modelliert man Sensorzellen?
Integrate and Fire Modell
Neuronenmodelle im Vergleich
Programm
Arbeitsweise von Sensorzellen - Kodierung sensorischer Reize durch elektrische Signale
Stimulus-Response Kurven
Wie modelliert man Sensorzellen?
Integrate and Fire Modell
Neuronenmodelle im Vergleich
Programm
Arbeitsweise von Sensorzellen - Kodierung sensorischer Reize durch elektrische Signale
Stimulus-Response Kurven
Wie modelliert man Sensorzellen?
Integrate and Fire Modell
Neuronenmodelle im Vergleich
Programm
Arbeitsweise von Sensorzellen - Kodierung sensorischer Reize durch elektrische Signale
Stimulus-Response Kurven
Wie modelliert man Sensorzellen?
Integrate and Fire Modell
Neuronenmodelle im Vergleich
Programm
Arbeitsweise von Sensorzellen - Kodierung sensorischer Reize durch elektrische Signale
Stimulus-Response Kurven
Wie modelliert man Sensorzellen?
Integrate and Fire Modell
Neuronenmodelle im Vergleich
Programm
Arbeitsweise von Sensorzellen - Kodierung sensorischer Reize durch elektrische Signale
Stimulus-Response Kurven
Wie modelliert man Sensorzellen?
Integrate and Fire Modell
Neuronenmodelle im Vergleich

Achtung! Stolpersteine!
1. Antworten sind variabel2. Antworten hängen evtl. nicht nur
vom Reiz ab3. Antworten können mehrere
relevante Zeitskalen haben
Warum ist das Bild zu einfach, dass Stimulus-Response-Kurven, Rezeptive Felder und Tuningkurven neuronale Antworten komplett beschreiben?
Spikeraten sind nicht die einzige Kodierungsart!

Variabilität tritt nicht nur bei sensorischen Reizen, sondern auch bei Strom-injektion auf.Allerdings in geringerem Umfang.
7.5 8 8.5 9 9.5 10
0
0.2
0.4
0.6
0.8
1
Time (s)
Stim
ulu
s (
nA
)
Stimulus1 in nA
7.5 8 8.5 9 9.5 10!40
!20
0
20
40
Time (s)
Sig
na
l (m
V)
Signal1 in mV
7.5 8 8.5 9 9.5 10
0
0.2
0.4
0.6
0.8
1
Time (s)
Stim
ulu
s (
nA
)
Stimulus1 in nA
7.5 8 8.5 9 9.5 10!60
!40
!20
0
20
40
Time (s)
Sig
nal (m
V)
Signal1 in mV
7.5 8 8.5 9 9.5 10
0
0.2
0.4
0.6
0.8
1
Time (s)
Stim
ulu
s (
nA
)
Stimulus1 in nA
7.5 8 8.5 9 9.5 10!40
!20
0
20
40
Time (s)
Sig
nal (m
V)
Signal1 in mV
Um etwas über Zellantworten aussagen zu können, braucht man mehrere Reizpräsentationen und statistische Auswertung.
1. Variabilität!

2. Fehlende Stationarität!
Zellantworten sagen nicht nur etwas über den Reiz aus, sondern auch über den Zu-stand der Zelle, des Netzwerks und der Ableitqualität.Dynamische Änderungen der Antwort können auf interessante Effekte hinweisen (z.B. LTP)
0 10 20 30 40
0
5
10
15
Versuchsdurchlaeufe
Spik
es in 0
.5 s
ec
1 nA
0.5 nA
Meiste statistische Analysen sind strenggenommen nur unter stationären Bedingungen zulässig!

3. Mehrere Zeitskalen!
Manche Zellen antworten selbst auf einfache Reize mit komplexen AP-MusternDie Antwort kann aus mehreren “Events” bestehenDie Antwort kann deutlich länger dauern als der StimulusBesonders kompliziert bei zeitlichen Reizänderungen
Beispiel:Antwort einer retinalenGanglienzelle (ON/OFF)auf einen 200ms langenLichtblitz
Spikeraten können auf verschiedenen Zeitskalen betrachtet werden und zu unterschiedlichen Ergebinssen führen.

Methode Rasterplot
Rasterplots stellen die AP-Zeitpunkte für wiederholte Reizpräsentationen darRasterplots helfen
Variabilität und Stationarität abzuschätzenRelevante Zeitskala zu findenZeitliche Feinstruktur zu sehenZellen zu vergleichen

Methode PSTH(Peri-Stimulus-Time-Histogram)
PSTHs stellen die Zeitstruktur der Spike-Antworten auf wiederholte Reizpräsentationen relativ zum Reizbeginn darEinfachster Fall instantane Feuerrate: Alle Antworten in einem Zeitschritt aufsummieren und auf spikes/s normieren Feuerrate in einem Zeitfenster: Alle Antworten in N Zeitschritten aufsummieren und normieren
0 100 200 300 400 5000
2
4
6
8
10
time [ms]
tria
l n
um
be
r
0 100 200 300 400 5000
100
200
300
400
500
600
time [ms]
avera
ge r
ate
(spik
es/s
ec)
PSTH, 1ms window

Methode PSTH(Peri-Stimulus-Time-Histogram)
PSTHs stellen die Zeitstruktur der Spike-Antworten auf wiederholte Reizpräsentationen relativ zum Reizbeginn darEinfachster Fall instantane Feuerrate: Alle Antworten in einem Zeitschritt aufsummieren und auf spikes/s normieren Feuerrate in einem Zeitfenster: Alle Antworten in N Zeitschritten aufsummieren und normieren
0 100 200 300 400 5000
2
4
6
8
10
time [ms]
tria
l n
um
be
r
0 100 200 300 400 5000
50
100
150
200
250
time [ms]
avera
ge r
ate
(spik
es/s
ec)
PSTH, 10ms window

Methode PSTH(Peri-Stimulus-Time-Histogram)
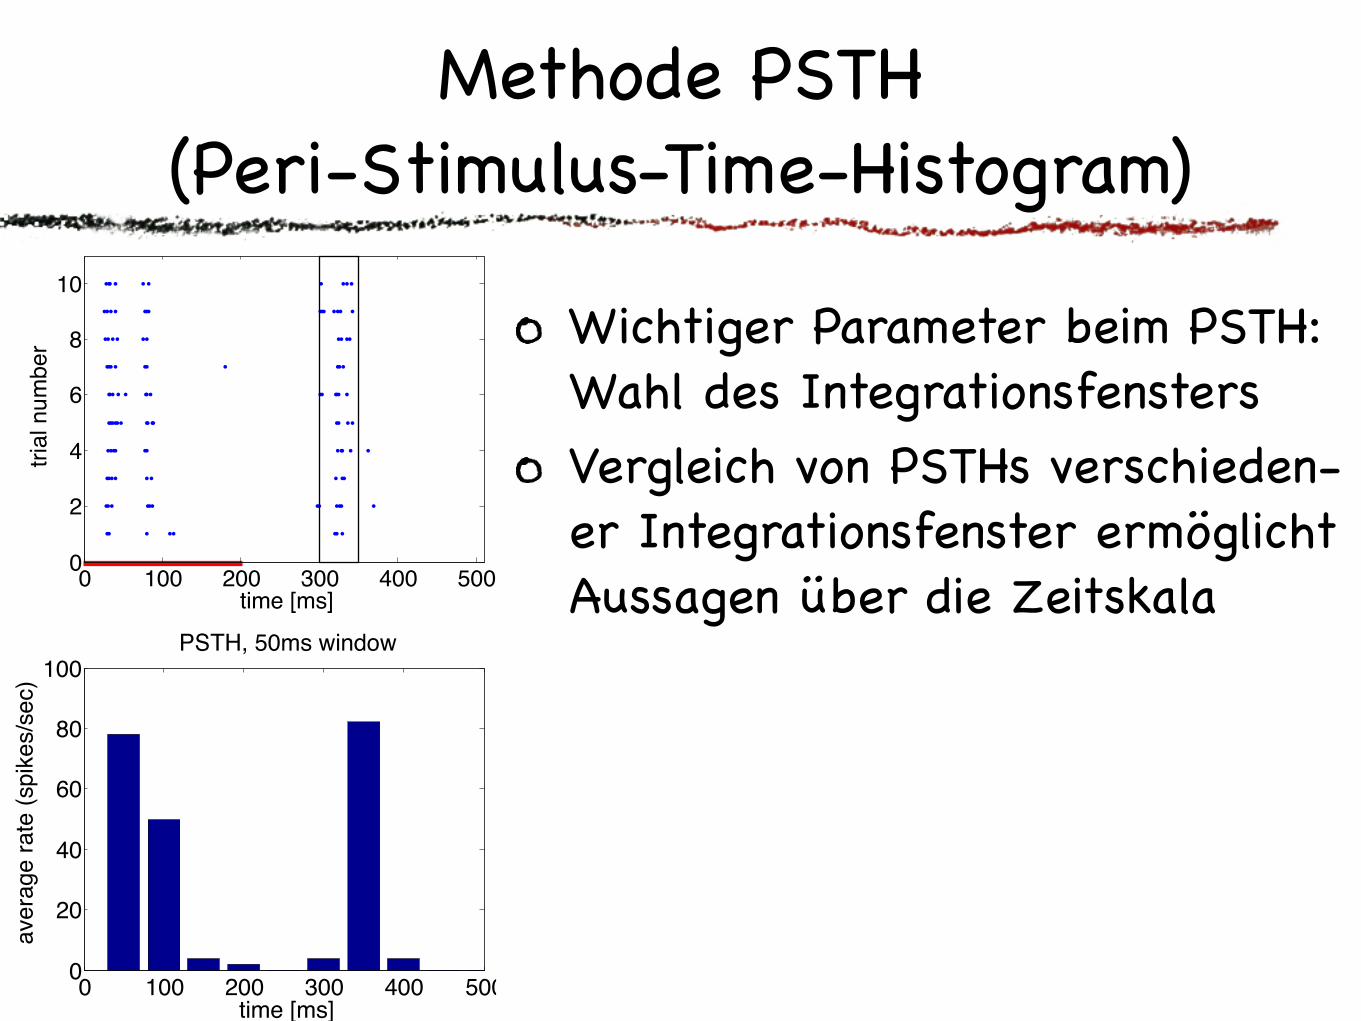
Wichtiger Parameter beim PSTH: Wahl des IntegrationsfenstersVergleich von PSTHs verschieden-er Integrationsfenster ermöglicht Aussagen über die Zeitskala“Geschmacksache”: sliding average versus Fenster an Fenster“Detailkram”: Behandlung von Rändern“Verfeinerung”: z.B. Gaussfilter
0 100 200 300 400 5000
2
4
6
8
10
time [ms]
tria
l n
um
be
r
0 100 200 300 400 5000
50
100
150
200
250
time [ms]
avera
ge r
ate
(spik
es/s
ec)
PSTH, 10ms window
Methode PSTH(Peri-Stimulus-Time-Histogram)
Wichtiger Parameter beim PSTH: Wahl des IntegrationsfenstersVergleich von PSTHs verschieden-er Integrationsfenster ermöglicht Aussagen über die Zeitskala“Geschmacksache”: sliding average versus Fenster an Fenster“Detailkram”: Behandlung von Rändern“Verfeinerung”: z.B. Gaussfilter
0 100 200 300 400 5000
2
4
6
8
10
time [ms]
tria
l n
um
be
r
0 100 200 300 400 5000
20
40
60
80
100
time [ms]
avera
ge r
ate
(spik
es/s
ec)
PSTH, 50ms window

Methode PSTH(Peri-Stimulus-Time-Histogram)
Wichtiger Parameter beim PSTH: Wahl des IntegrationsfenstersVergleich von PSTHs verschieden-er Integrationsfenster ermöglicht Aussagen über die Zeitskala“Geschmacksache”: sliding average versus Fenster an Fenster“Detailkram”: Behandlung von Rändern“Verfeinerung”: z.B. Gaussfilter
0 100 200 300 400 5000
2
4
6
8
10
time [ms]
tria
l n
um
be
r
0 100 200 300 400 5000
50
100
150
200
250
300
time [ms]
avera
ge r
ate
(spik
es/s
ec)
PSTH, 10ms window
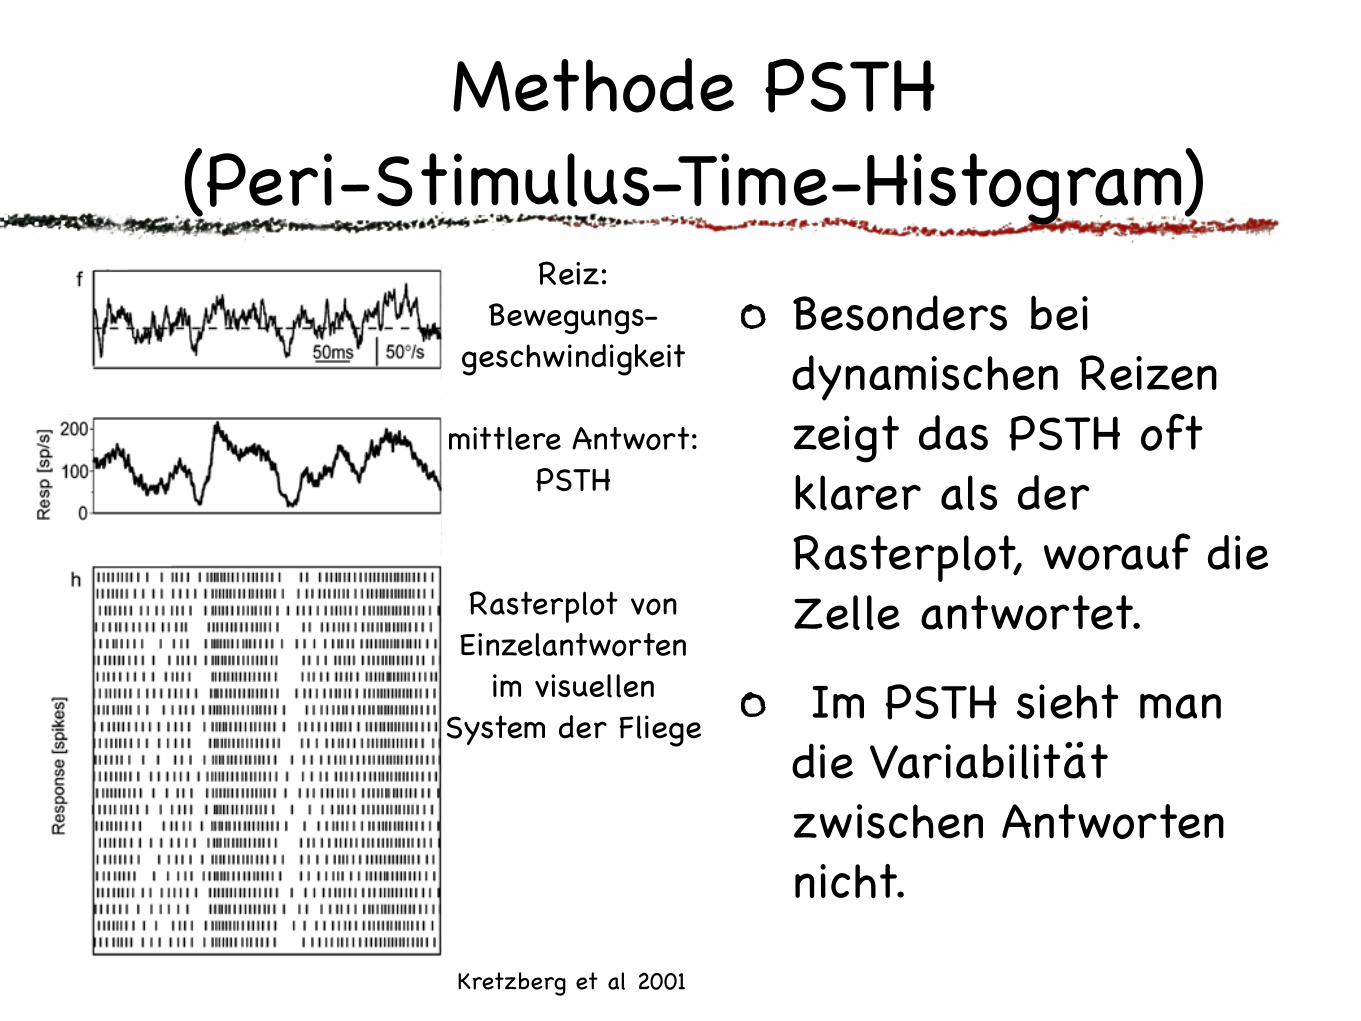
Besonders bei dynamischen Reizen zeigt das PSTH oft klarer als der Rasterplot, worauf die Zelle antwortet.
Im PSTH sieht man die Variabilität zwischen Antworten nicht.
154 Kretzberg, Warzecha and Egelhaaf
Figure 1. Graded and spiking response mode: A: (a) Sketch of a neuron that responds with graded membrane potential fluctuations evenin its output region and (b)–(d) example for responses of a fly HS-cell responding with graded potentials to a dynamically changing motionstimulus. (b) Stimulus velocity, (c) average membrane potential, (d) examples of individual responses. B: (e) Sketch of a spiking neuron and(f)–(g) responses of the spiking H1-cell of the fly to the same motion stimulus as in A. (f) Stimulus velocity, (g) PSTH of spike response,(h) individual spike responses (each vertical line represents the occurrence of a spike). H1- and HS-cell have opposite preferred directions.To allow better comparison of the responses, the graded responses of the HS-cell are shown inverted. Depending on the motion stimulus thegraded responses of the HS-cell sometimes are superimposed by active processes, but in this example only graded responses were recorded. Forexperimental methods, see Warzecha et al. (1998).
encoding stimuli because it contains neurons of eithermode with similar synaptic input organization (Fig. 1and Hausen, 1981, 1984; Egelhaaf and Warzecha,1999). Information transmission by graded responses
might be expected to be superior to that by spike re-sponses because a continuous signal has potentially agreater capacity to transmit information than the bi-nary signals of a spiking neuron. Nevertheless, most
Methode PSTH(Peri-Stimulus-Time-Histogram)
Reiz:Bewegungs-
geschwindigkeit
mittlere Antwort:PSTH
Rasterplot vonEinzelantworten
im visuellen System der Fliege
Kretzberg et al 2001

Ratenkodierung ist nicht alles!
Alle bisher vorgestellten Methoden gehen von einem Ratenkode aus, “je mehr spikes in einer gegebenen Zeit, desto stärker war der Reiz”
Welche anderen Möglichkeiten gibt es?

Mehr Zellen:Mehr mögliche Ratenkodes
a. rate - time average
c. rate - population average
b. rate - identical stimulation average
d. population vector
*1*2*3*4 *1*2*3*4
9 12
e. weighted rate
Greschner 2005

Kodierung durch Spike-Zeitpunkte
Greschner 2005
1st
2nd
3rd
3rd
4th
2nd
3rd
1st
a. external latency
b. relative latency
c. phase-based
e. temporal pattern
d. temporal pattern - synchrony
Hausaufgabe:Wie wirkt sich Variabilität neuronaler Antworten auf die verschiedenen Kodierungsarten aus?

Wie kodieren Blutegel den Ort einer Berührung?
An jeder Stelle des Körpers überlappen sich die rezeptiven Felder von zwei P-Zellen.
P1 P2 P3 P4
P1
P2 P3
P4

Wie kodieren Blutegel den Ort einer Berührung?
Rate und Latenz hängen vom Ort der Berührung ab.
P1 P2 P3 P4
P2
P3

Wie kodieren Blutegel den Ort einer Berührung?
Vier Kodierungsarten zeigen eine signifikante Abhängigkeit der Antworten vom Berührungsort.
Thomson & Kristan 2005
absolute Latenz
relative Latenz
Rate einer Zelle
relative Rate
stärkste Abhängigkeit

Ein idealer Beobachter kann den Ort einer Berührung am besten aus der relativen Latenz der P-Zell-Antworten schliessen.
Um zu wissen, was der Egel tut, muss man die nachgeschalteten Zellantworten kennen.
latencybehaviorspike count
Wie kodieren Blutegel den Ort einer Berührung?

Nicht nur bei Blutegeln...
Antworten bestehen aus komplexen AP-Mustern, die länger als der Reiz dauern
Die AP-Gesamtzahl hängt nichtlinear von der Helligkeit ab
Auf feineren Zeitskalen gibt es ebenfalls nichtlineare Effekte der Rate
Die Latenz des ersten APs nimmt mit wachsender Helligkeit ab
Rei
zhel
ligke
it /
Antworten einer retinalen Ganglienzelle auf Lichtblitze
verschiedener Stärke

Themen (revisited)
Analysemethoden:Stimulus-Response KurvenRezeptive FelderTuningkurvenRasterplotPSTH
KodierungsprinzipienBeispiel: Mechanoperzeption des Blutegels
gleich
es V
erfa
hren
{ Reizstärke
Reizort
Reizeigenschaft
Sigmoid
Gauss
Gauss
Gängigste Darstellung von Rohdaten
AP-Raten relativ zum Reiz auf verschiedenen Zeitskalen
AP-Raten vs AP-ZeitenEinzelzelle vs Ensembles
... und auch ein bisschen Retina:
Alles ist komplizierter als man denkt!
Top Related