


Languages
Pages
Legal

UUnniivveerrssiittyy ooff PPrreettoorriiaa eettdd –– VVaann ddeerr MMeerrwwee,, TT ((22000066))
ALIGNMENT OF THE SUPPLY AND DEMAND WITHIN A SUPPLY CHAIN: A QUALITATIVE STUDY
by
THEO VAN DER MERWE
Submitted in fulfilment of the requirements for the degree of Magister Commercii in
Business Management in the Facility of Economic and Management Sciences
UNIVERSITY OF PRETORIA
STUDY LEADER: PROF. G.H. NIEMAN
October 2005
UUnniivveerrssiittyy ooff PPrreettoorriiaa eettdd –– VVaann ddeerr MMeerrwwee,, TT ((22000066))
ii
CONFIDENTIALITY STATEMENT
This report is confidential and to be used by the shareholders of Kraft Foods.
It is intended for use by the persons to whom it is transmitted. Any reproduction or
divulgence of any of its contents, without the prior written consent of the company, is
prohibited.
DECLARATION
It is hereby declared by Theo van der Merwe that this dissertation has been
linguistically groomed by Kjell Ruth, Managing Director of Kraft Foods South Africa.

UUnniivveerrssiittyy ooff PPrreettoorriiaa eettdd –– VVaann ddeerr MMeerrwwee,, TT ((22000066))
iii
ACKNOWLEDGEMENTS
There are many people who contributed directly to this endeavour and have been a
source of constant support. These are:
• Kjell Ruth, Managing Director of Kraft Foods South Africa who approved the
dissertation research project.
• Abrie de Swardt, Supply Chain Director of Kraft Foods South Africa who
supported the project and research proposals.
• Professor G.H Nieman for his guidance and support.
• Willem Cilliers who inspired me to devote my career to the challenging world
of supply chain management during my final years at university.
• My family and friends, especially my wife Riëtte and daughter Shanelle for
their support and understanding during this project.
I dedicate this dissertation to my wife, Riëtte van der Merwe, who is a constant
source of inspiration and who supports me in my passion for constant business
improvement.
“Live as if you were to die tomorrow.
Learn as if you were to live forever.”
~ Metszche
UUnniivveerrssiittyy ooff PPrreettoorriiaa eettdd –– VVaann ddeerr MMeerrwwee,, TT ((22000066))
iv
ABSTRACT
The dissertation "Alignment of supply and demand within a supply chain: a qualitative
study” determines the causes of the misalignment between the supply and demand
within a supply chain, with specific focus on Kraft Foods South Africa. The costs of a
mismatch between supply and demand are growing in many industries. Companies
have tried various approaches, however these approaches, while useful, have failed
to address a number of the drivers of supply-demand mismatch.
The literature study starts with an overview of supply chain management. The study
covers the various concepts of supply chain management, the importance of supply
chain performance, the challenges of managing supply chains, demand
management, supply management, as well as the relationship between supply and
demand. The literature study continues to cover the various concepts related to the
alignment of supply and demand within a supply chain. The study covers the effects
of the misalignment between supply and demand within a supply chain, traditional
approaches to align supply and demand and the transformation to a more responsive
organisation. The various approaches to decrease the supply and demand lead time
gap are also discussed. The literature study concludes with an overview of the supply
chain of Kraft Foods South Africa, as well as the global Kraft Foods organisation. The
review covers the challenges, the sustainable growth plan, the organisational set-up,
sources and product range, geographical layout, people, functions and technology
involved in Kraft’s supply chain. The review concludes with an overview of the current
alignment between supply and demand within Kraft Foods South Africa’s supply
chain.
Chapter five discusses the details of the research design and methodology that was
followed in conducting the research. Chapter six indicates the findings of the
structured interviews with the key players in Kraft Foods South Africa’s supply chain.
Chapter seven makes certain recommendations for the supply chain of Kraft Foods
South Africa that will assist in improving the alignment between supply and demand.
UUnniivveerrssiittyy ooff PPrreettoorriiaa eettdd –– VVaann ddeerr MMeerrwwee,, TT ((22000066))
v
TABLE OF CONTENTS
CONFIDENTIALITY STATEMENT ………………………………………………………...ii DECLARATION ……………………………………………………………………………...ii ACKNOWLEDGEMENTS ………………………………………………………………….iii ABSTRACT ………………………………………………………………………………….iv TABLE OF CONTENTS ……………………………………………………………………..v CHAPTER 1: OBJECTIVES AND SCOPE OF THE STUDY........................................ 1 1.1 BACKGROUND TO THE STUDY....................................................................... 1
1.1.1. Supply and demand alignment ................................................................. 1 1.1.2. Kraft Foods South Africa........................................................................... 2 1.1.3. Kraft Foods South Africa’s supply chain department................................ 3 1.1.4. Kraft Foods South Africa’s supply chain alignment .................................. 3
1.2 RESEARCH PROBLEM...................................................................................... 4 1.3 RESEARCH OBJECTIVES................................................................................. 4 1.4 RESEARCH METHODOLOGY........................................................................... 5
1.4.1 Literature review ........................................................................................... 5 1.4.2 Structured in-depth interviews ...................................................................... 5
1.5 BENEFITS OF THE STUDY................................................................................ 6 1.6 OUTLINE OF THE DISSERTATION................................................................... 7 1.7 GENERAL............................................................................................................ 8 CHAPTER 2: SUPPLY CHAIN MANAGEMENT........................................................... 9 2.1 INTRODUCTION ................................................................................................. 9 2.2 UNDERSTANDING, PREDICTION AND CONTROL......................................... 9 2.3 NEW NATURE OF COMPETITION .................................................................. 11 2.4 FOCUS OF SUPPLY CHAIN MANAGEMENT................................................. 12 2.5 IMPORTANCE OF SUPPLY CHAIN PERFORMANCE................................... 13 2.6 MEASURING PERFORMANCE ....................................................................... 15
2.6.1 Measuring time ........................................................................................... 15 2.6.2 Measuring cost ........................................................................................... 17 2.6.3 Measuring efficiency................................................................................... 18 2.6.4 Measuring effectiveness............................................................................. 19 2.6.5 Difference between efficiency and effectiveness ....................................... 20
2.7 CHALLENGES OF MANAGING SUPPLY CHAINS ........................................ 21 2.7.1 Managing complexity in supply chains ....................................................... 21 2.7.2 Managing variability in supply chains ......................................................... 23
2.8 INTERRELATIONSHIP BETWEEN PEOPLE, PROCESSES AND TOOLS... 26 2.9 MANAGING INVENTORY................................................................................. 27
UUnniivveerrssiittyy ooff PPrreettoorriiaa eettdd –– VVaann ddeerr MMeerrwwee,, TT ((22000066))
vi
2.9.1 Importance of inventory management........................................................ 27 2.9.2 Classifications of inventory ......................................................................... 27 2.9.3 Inventory management of perishable items ............................................... 28 2.9.4 Managing excess inventories ..................................................................... 29
2.10 MANAGING SUPPLY CHAIN STRATEGIES WITH PARETO........................ 30 2.11 PULL VERSUS PUSH SUPPLY CHAINS ........................................................ 35 2.12 MASTERING DEMAND .................................................................................... 39
2.12.1 Knowing the customer ............................................................................ 39 2.12.2 Analyzing the product ............................................................................. 42
2.12.2.1 Implications of product attributes on the supply chain .................... 42 2.12.2.2 Implications of product demand variability on the supply chain ...... 43 2.12.2.3 Pareto product groups ..................................................................... 45 2.12.2.4. Implications of product life cycle on the supply chain ..................... 46 2.12.2.5 Implications of product life cycles on forecast error ........................ 47
2.12.3 Shaping demand..................................................................................... 49 2.12.4 Stabilizing demand.................................................................................. 52
2.13 DEMAND MANAGEMENT................................................................................ 56 2.13.1 Components of demand ......................................................................... 56 2.13.2 Purpose and rules of forecasting ............................................................ 57 2.13.3 Understanding forecasting error ............................................................. 58 2.13.4 Forecast collaboration............................................................................. 62 2.13.5 Forecast process performance management......................................... 64 2.13.6 Relationship between forecast error and response lead time ................ 66 2.13.7 Types of forecasting................................................................................ 67 2.13.8 Constrained versus unconstrained forecast ........................................... 68 2.13.9 Forecast models versus forecast judgment............................................ 69 2.13.10 Forecasting software versus forecasting processes............................... 71 2.13.11 One-plan mentality.................................................................................. 71 2.13.12 Evangelical forecasting ........................................................................... 72 2.13.13 Legal aspects of forecasting ................................................................... 73 2.13.14 Demand planning versus demand management.................................... 74
2.14 SUPPLY MANAGEMENT ................................................................................. 76 2.14.1 Streamlining replenishment .................................................................... 76 2.14.2 Replenishment process .......................................................................... 77 2.14.3 Determining replenishment order quantity.............................................. 77 2.14.4 Correlation between customer service level and inventory levels.......... 79 2.14.5 Limitations of material requirements planning ........................................ 80 2.14.6 Master production schedule- to freeze or not to freeze.......................... 82
2.15 SUPPLY CHAIN EXCEPTIONS........................................................................ 84 2.16 RELATIONSHIP BETWEEN SUPPLY AND DEMAND ................................... 86 2.17 CONCLUSION................................................................................................... 86 CHAPTER 3: SUPPLY AND DEMAND ALIGNMENT ................................................ 90 3.1 INTRODUCTION ............................................................................................... 90 3.2 MISALIGNMENT BETWEEN SUPPLY AND DEMAND .................................. 91
UUnniivveerrssiittyy ooff PPrreettoorriiaa eettdd –– VVaann ddeerr MMeerrwwee,, TT ((22000066))
vii
3.2.1 The effects of the misalignment between supply and demand in a supply chain .................................................................................................................... 91
3.2.1.1 Supply chain volatility increases cost.................................................. 91 3.2.1.2 Supply chain volatility creates complexity........................................... 92
3.2.2 Traditional approaches to resolve mismatches between supply and demand .................................................................................................................. 93
3.3 TRANSFORMING TO A RESPONSIVE ORGANIZATION.............................. 96 3.3.1 Changing from functions to processes ....................................................... 97
3.3.1.1 Organizational structure ...................................................................... 97 3.3.1.2 Conflicting objectives......................................................................... 100 3.3.1.3 Aligning objectives............................................................................. 103 3.3.1.4 Misaligned incentives ........................................................................ 103 3.3.1.5 Aligning incentives............................................................................. 103
3.3.2 Change from profit to performance .......................................................... 106 3.3.3 Changing from products to customers ..................................................... 107
3.3.3.1 Making the customer part of the supply chain .................................. 107 3.3.3.2 Flexible manufacturing and logistics ................................................. 108
3.3.4 Changing from inventory to information ................................................... 108 3.3.5 Changing from transactions to relationships ............................................ 109 3.3.6 Changing from Economies of Scale to Economies of Scope................... 110
3.3.6.1 Supplier integration .............................................................................. 111 3.4 LEAD TIME GAP............................................................................................. 111 3.5 RATIONALE FOR SUPPLY CHAIN TIME COMPRESSION ......................... 113
3.5.1 Strategic lead time reduction .................................................................... 114 3.5.2 Supply chain time compression approaches............................................ 115
3.5.2.1 Taking a holistic view ........................................................................ 115 3.5.2.2.1 Supply chain integration............................................................... 116 3.5.2.2.2 Supplier programmes................................................................... 116 3.5.2.1.3 Just-in-time supply programmes.................................................. 117 3.5.2.1.4 Retail customer replenishment programmes............................... 118 3.5.2.1.5 The problem with supply chain programmes............................... 120
3.5.2.2 Use of technologies........................................................................... 122 3.5.2.3 Cut out unnecessary steps................................................................ 123
3.5.2.3.1 Elimination of waste ..................................................................... 123 3.5.2.3.2 Reduce waste by pooling risk ..................................................... 125 3.5.2.3.3 Increasing velocity........................................................................ 127
3.5.2.4 Source with service in mind, as well as cost..................................... 128 3.5.2.4.1 Winning through collaboration ..................................................... 129 3.5.2.4.2 Design products with the supply chain in mind............................ 130 3.5.2.4.3 Designing for supply .................................................................... 130 3.5.2.4.4 Customization .............................................................................. 132
3.5.2.5 Reduce forecast time and increase accuracy................................... 133 3.5.2.6 Redesign production processes........................................................ 133 3.5.2.7 Theory of constraints......................................................................... 134 3.5.2.8 Unbalanced capacity......................................................................... 136 3.5.2.9 Supply chain throughput efficiency ................................................... 137 3.5.2.10 Process throughput reduction ....................................................... 137 3.5.2.11 Postponement ............................................................................... 138
UUnniivveerrssiittyy ooff PPrreettoorriiaa eettdd –– VVaann ddeerr MMeerrwwee,, TT ((22000066))
viii
3.5.2.12 Rethink distribution options ........................................................... 142 3.6 IMPROVING VISIBILITY OF DEMAND.......................................................... 143
3.6.1 Causes of induced demand volatility ........................................................ 144 3.6.1.1 Terms of trade ................................................................................... 144 3.6.1.2 Promotions and pricing ..................................................................... 145 3.6.1.3 Specific company policies ................................................................. 145 3.6.1.4 Distribution channel structure............................................................ 146
3.6.2 Importance of supply chain communication ............................................. 147 3.6.3 Increasing pipeline visibility ...................................................................... 148 3.6.4 Managing the different demand streams.................................................. 150
3.6.4.1 Customer-supplied forecasts ............................................................ 153 3.6.4.2 Point –of-sale data streams .............................................................. 153 3.6.4.3 Customer warehouse movement data.............................................. 154 3.6.4.4 Customer order data ......................................................................... 155 3.6.4.5 Factory shipment data....................................................................... 156
3.7 CONCLUSION................................................................................................. 157 CHAPTER 4: THE SUPPLY CHAIN OF KRAFT FOODS SOUTH AFRICA ............ 161 4.1 INTRODUCTION ............................................................................................. 161 4.2 FOCUS OF KRAFT FOODS INC.................................................................... 166 4.3 THE CHALLENGES OF KRAFT..................................................................... 166 4.4 THE SUSTAINABLE GROWTH PLAN OF KRAFT ....................................... 167 4.5 KRAFT FOODS SOUTH AFRICA’S SUPPLY CHAIN ORGANIZATION...... 170 4.6 ROLE PLAYERS IN KRAFT FOODS SOUTH AFRICA’S SUPPLY CHAIN. 170 4.7 SOURCES AND PRODUCT RANGE IN KRAFT’S SUPPLY CHAIN............ 172 4.8 GEOGRAPHICAL LAYOUT OF KRAFT’S SUPPLY CHAIN ........................ 173 4.9 PEOPLE IN KRAFT FOODS SOUTH AFRICA’S SUPPLY CHAIN .............. 175 4.10 FUNCTIONAL INVOLVEMENT IN THE PLANNING PROCESSES.............. 179 4.11 TECHNOLOGY INVOLVED IN KRAFT’S SUPPLY CHAIN .......................... 180 4.12 SUPPLY AND DEMAND ALIGNMENT IN KRAFT’S SUPPLY CHAIN ........ 181 CHAPTER 5: RESEARCH DESIGN AND METHODOLOGY ................................... 183 5.1 INTRODUCTION ............................................................................................. 183 5.2 THE PURPOSE IF STUDYING RESEARCH METHODS .............................. 183 5.3 RESEARCH DESIGN...................................................................................... 185
5.3.1 Degree of research question crystallization ............................................. 186 5.3.2 Method of data collection.......................................................................... 186 5.3.3 Researcher control of variables................................................................ 187 5.3.4 The purpose of the study.......................................................................... 187 5.3.5 The time dimension .................................................................................. 188 5.3.6 The topical scope...................................................................................... 188 5.3.7 The research environment........................................................................ 189 5.3.8 Participants’ perceptions........................................................................... 189
UUnniivveerrssiittyy ooff PPrreettoorriiaa eettdd –– VVaann ddeerr MMeerrwwee,, TT ((22000066))
ix
5.4 RESEARCH DESIGN AND METHODOLOGY............................................... 190 5.5 SECONDARY VERSUS PRIMARY RESEARCH DATA................................ 191
5.5.1 Purpose..................................................................................................... 194 5.5.2 Scope........................................................................................................ 194 5.5.3 Authority.................................................................................................... 194 5.5.4 Audience................................................................................................... 195 5.5.5 Format....................................................................................................... 195
5.6 CRITERIA FOR A GOOD LITERATURE REVIEW ........................................ 195 5.7 EXPERIENCE SURVEY.................................................................................. 196 5.8 ACTIONS THAT GUARANTEE GOOD RESEARCH .................................... 197
5.8.1 Purpose clearly defined ............................................................................ 197 5.8.2 Research process detailed ....................................................................... 198 5.8.3 Research design thoroughly planned....................................................... 198 5.8.4 High ethical standards applied ................................................................. 198 5.8.5 Limitations frankly revealed ...................................................................... 198 5.8.6 Adequate analysis for decision- maker’s needs....................................... 199 5.8.7 Findings presented clearly........................................................................ 199 5.8.8 Conclusions justified ................................................................................. 200 5.8.9 Researcher’s experience reflected........................................................... 200
5.9 INVESTIGATIVE QUESTIONS ....................................................................... 201 5.10 DEDUCTION VERSUS INDUCTION .............................................................. 202 5.11 SURVEYS........................................................................................................ 202
5.11.1 Personal interviewing............................................................................ 202 5.11.1.1 Gathering personal interview data................................................. 203 5.11.1.2 Recording personal interviews ...................................................... 204
5.12 FINDINGS, SUMMARY, CONCLUSIONS AND RECOMMENDATIONS...... 204 5.13 REDUCING INTERVIEW SUBJECTIVITY...................................................... 205
5.13.1 Relativity................................................................................................ 205 5.13.2 Point of view.......................................................................................... 206 5.13.3 Context.................................................................................................. 206
5.14 CREDIBILITY OF QUALITATIVE RESEARCH.............................................. 206 5.15 LIMITATIONS OF THE RESEARCH .............................................................. 207 5.16 CONCLUSION................................................................................................. 208 CHAPTER 6: RESEARCH FINDINGS....................................................................... 211 6.1 INTRODUCTION ............................................................................................. 211 6.2 OUTCOME OF STRUCTURED INTERVIEWS............................................... 214
6.2.1 Demand management .............................................................................. 215 6.2.1.1 Focus of demand forecast................................................................. 215 6.2.1.2 Supply chain trigger: order versus forecast ...................................... 217 6.2.1.3 Involvement of customer and suppliers in planning.......................... 218 6.2.1.4 Causes of demand variability ............................................................ 220 6.2.1.5 Demand forecasting versus demand management.......................... 223
UUnniivveerrssiittyy ooff PPrreettoorriiaa eettdd –– VVaann ddeerr MMeerrwwee,, TT ((22000066))
x
6.2.1.6 Information that increases forecast accuracy ................................... 226 6.2.1.7 Costs and implications of misalignment between supply and demand 228 6.2.1.8 Alignment of departmental objectives and incentives....................... 230 6.2.1.9 Frozen forecast ................................................................................. 233 6.2.1.10 Supply chain complexity ................................................................ 234 6.2.1.11 Differentiation of service levels between products and customers237 6.2.1.12 Different forecast targets ............................................................... 239 6.2.1.13 Reduction of the demand lead-time gap ....................................... 239 6.2.1.14 Demand and supply alignment within a supply chain ................... 241
6.2.1 Supply management................................................................................. 243 6.2.2.1 Differentiation of service levels between products and customers... 243 6.2.2.2 Supply chain trigger: order versus forecast ...................................... 243 6.2.2.3 Reduction of supply lead time ........................................................... 243 6.2.2.4 Frozen production lead time.............................................................. 245 6.2.2.5 Alignment of departmental objectives and incentives....................... 246 6.2.2.6 Supply chain complexity.................................................................... 248 6.2.2.7 Streamlining customer and product portfolio .................................... 249 6.2.2.8 Supply chain bottlenecks .................................................................. 250 6.2.2.9 Reaction of supply to demand changes............................................ 252 6.2.2.10 Opportunities to pool risk............................................................... 253 6.2.2.11 Product or production design changes.......................................... 255 6.2.2.12 Demand and supply alignment within a supply chain ................... 259
6.3 CONCLUSION................................................................................................. 259 CHAPTER 7: SUMMARY, CONCLUSION AND RECOMMENDATIONS ................ 264 7.1 INTRODUCTION ............................................................................................. 264 7.2 LITERATURE RESEARCH REVIEW AND RESEARCH DESIGN................ 264 7.3 RESEARCH OBJECTIVES REVISITED......................................................... 270 7.4 RECOMMENDATIONS ................................................................................... 272
7.4.1 Decrease complexity in the supply chain ................................................. 272 7.4.2 Decrease variability in the supply chain ................................................... 273 7.4.3 Move from demand planning to demand management ........................... 273 7.4.4 Changing the supply chain trigger from forecasts to actual consumer demand ................................................................................................................ 274 7.4.5 Unfrozen forecast horizon ........................................................................ 274 7.4.6 Aligning objectives and incentives of all participants in the supply chain. 274 7.4.7 Create one plan ........................................................................................ 275 7.4.8 Reduce the supply chain lead time gap ................................................... 275
7.5 LIMITATIONS OF THE RESEARCH .............................................................. 276 7.6 BENEFITS OF THE STUDY AND FUTURE RESEARCH ............................. 277 BIBLIOGRAPHY......................................................................................................... 278
ANNEXURE A.......................................................................................................... 290
LIST OF TABLES …………………………………………………………………………...xi LIST OF FIGURES …………………………………………………………………………xii
UUnniivveerrssiittyy ooff PPrreettoorriiaa eettdd –– VVaann ddeerr MMeerrwwee,, TT ((22000066))
xi
LIST OF TABLES
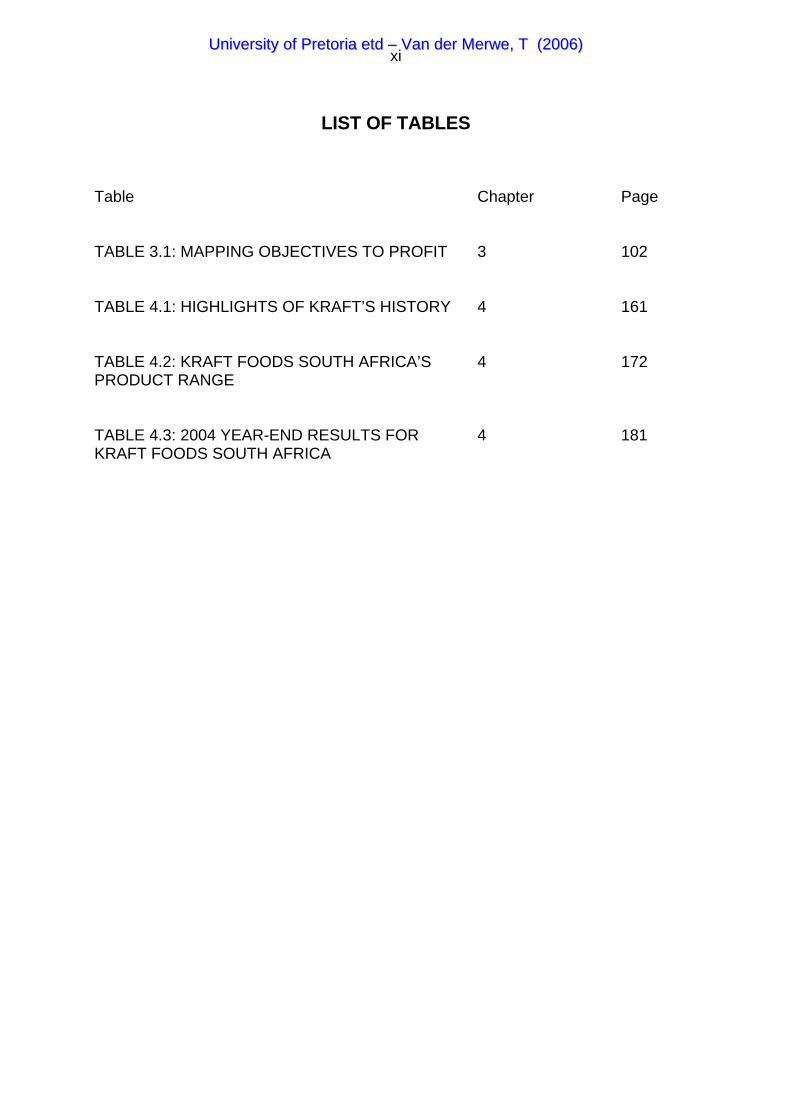
Table Chapter Page TABLE 3.1: MAPPING OBJECTIVES TO PROFIT 3 102 TABLE 4.1: HIGHLIGHTS OF KRAFT’S HISTORY 4 161 TABLE 4.2: KRAFT FOODS SOUTH AFRICA’S 4 172 PRODUCT RANGE TABLE 4.3: 2004 YEAR-END RESULTS FOR 4 181 KRAFT FOODS SOUTH AFRICA
UUnniivveerrssiittyy ooff PPrreettoorriiaa eettdd –– VVaann ddeerr MMeerrwwee,, TT ((22000066))
xii
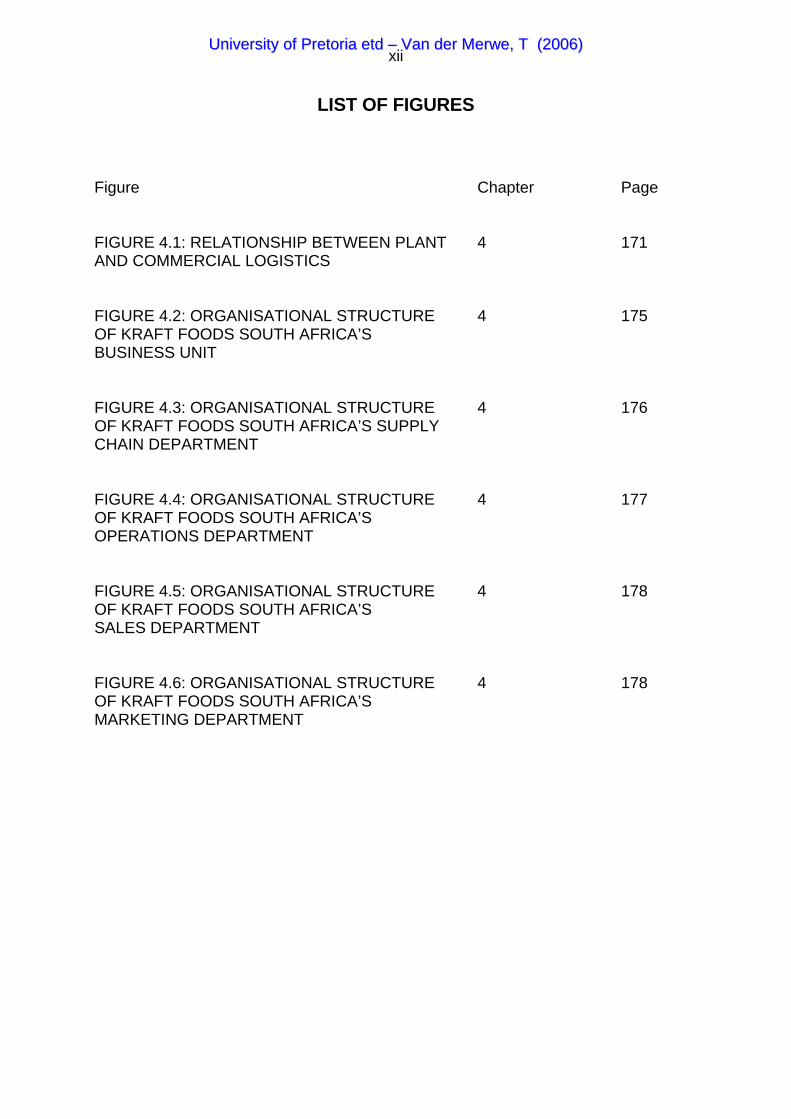
LIST OF FIGURES Figure Chapter Page FIGURE 4.1: RELATIONSHIP BETWEEN PLANT 4 171 AND COMMERCIAL LOGISTICS FIGURE 4.2: ORGANISATIONAL STRUCTURE 4 175 OF KRAFT FOODS SOUTH AFRICA’S BUSINESS UNIT FIGURE 4.3: ORGANISATIONAL STRUCTURE 4 176 OF KRAFT FOODS SOUTH AFRICA’S SUPPLY CHAIN DEPARTMENT FIGURE 4.4: ORGANISATIONAL STRUCTURE 4 177 OF KRAFT FOODS SOUTH AFRICA’S OPERATIONS DEPARTMENT FIGURE 4.5: ORGANISATIONAL STRUCTURE 4 178 OF KRAFT FOODS SOUTH AFRICA’S SALES DEPARTMENT FIGURE 4.6: ORGANISATIONAL STRUCTURE 4 178 OF KRAFT FOODS SOUTH AFRICA’S MARKETING DEPARTMENT
UUnniivveerrssiittyy ooff PPrreettoorriiaa eettdd –– VVaann ddeerr MMeerrwwee,, TT ((22000066))
1
CHAPTER 1: OBJECTIVES AND SCOPE OF THE STUDY
1.1 Background to the s tudy
1.1.1. Supply and demand alignment
Traditionally most companies have viewed themselves as entities that exist
independently from others, and indeed need to compete with them, in order to
survive. The challenge of supply chain management lies in the integration and co-
ordination of the flow of materials from a multitude of suppliers, often offshore, and
similarly managing the distribution of the finished product by way of multiple
intermediaries (Christopher, 1998:15).
True supply chain integration not only requires internal realignment in terms of
managing processes on a cross functional basis, it also requires that the company’s
processes align with those of its upstream and downstream partners (Gattorna, 2000:
281).
The costs of a mismatch between supply and demand, measured as the combination
of inventory carrying costs, markdown costs and stockout costs, are growing in many
industries. Companies have tried to reduce these costs through better demand
forecasting, improved production and inventory planning, increased production
capacity and reduced set-up and transportation lead times. Companies have also
tried to manage the demand process through pricing policies intended to smooth the
arrival pattern of customers. These approaches, while useful, have failed to address
a number of the drivers of supply-demand mismatch (Gattorna, 1998:172).
Leaders in supply chain management know that the management of the supply chain
represents only half of the business equation. While much attention has been paid to
finding new and better ways to reduce inventory levels and increase stock turns, little
attention is being paid to understanding, creating and managing demand more
effectively. The reality is that superb supply and demand chain management is the
challenge confronting supply chain practitioners, and will be the basis of competitive
success or failure for many businesses (Gattorna, 1998:41).
UUnniivveerrssiittyy ooff PPrreettoorriiaa eettdd –– VVaann ddeerr MMeerrwwee,, TT ((22000066))
2
A key part of understanding and retaining customers is to draw them into the
company’s orbit, through integrating the supply and demand chain. This means
moving the supply chain from supplying customers indiscriminately according to their
forecast demand, to supplying customers with precision according to their actual
demand and their stated requirements. In this way businesses line up their supply
chains to match and mirror the demand requirements of their customers (Gattorna,
1998:41).
.
The benefits of reducing the supply-demand mismatch are enormous. Fewer
mismatches between supply and demand can lead to a significant increase in profits,
better customer service and therefore additional sales (Gattorna, 1998:172).
1.1.2. Kraft Foods South Africa
Royal Baking Powder (Pty) Limited, a well- established company in South Africa, was
owned by Standard Foods in the USA “(Templeton, 2004).
After several mergers during the 1980s and 1990s with various companies, including
Beechnut Lifesavers and Nabisco, the company name Royal Beechnut was changed
to Nabisco South Africa in 1996 (Templeton, 2004).
During the early part of 2002, Kraft Foods International announced the purchase of
Nabisco International and later in 2002; Kraft Foods International purchased the
remaining shares of Nabisco South Africa. Kraft Foods South Africa was then fully
owned by Kraft Foods Inc. (Templeton, 2004).
On 1 November 2002, the company name changed from Nabisco South Africa to
Kraft Foods South Africa (Templeton 2004).
The name- change to Kraft Foods South Africa marked a new beginning as the
company was now part of Kraft Foods Inc., the largest food and beverage company
in North America and the second largest in the world (Kraft Foods Inc.2004:1).
UUnniivveerrssiittyy ooff PPrreettoorriiaa eettdd –– VVaann ddeerr MMeerrwwee,, TT ((22000066))
3
1.1.3. Kraft Foods South Africa’s supply chain department
Kraft Foods South Africa only established a supply chain department at the end of
May 2002. The demand and replenishment planning function, part of the supply
chain department was only established in April 2003. The key focus of the Demand
and Replenishment Planning function is to align the supply and demand of finished
goods while improving the customer service levels, lowering supply chain costs and
decreasing finished goods inventory levels (De Swardt, 2004).
The demand and replenishment planning department must therefore ensure that the
right finished goods are in the right place at the right time in the right quantity and the
right condition (De Swardt, 2004).
On 23 January 2004, Roger Deromedi, Chief Executive Officer, Kraft Foods Inc., also
announced a new sustainable growth plan for Kraft Foods Inc. One of the four
components of the new sustainable growth plan is the reduction of cost and an
improvement in asset utilisation. (Kraft Foods Inc, 4 March. 2004:1).
1.1.4. Kraft Foods South Africa’s supply chain alignment
Kraft Foods South Africa’s supply and demand alignment has had a few successes,
but more improvement is required.
The customer service level, measured in case fill rate, improved from 67 % in April
2003 to 88 % in December 2003. Case fill rate measures the customer order volume
with the customer delivery volume (Templeton, 2004).
The results of Kraft Foods South Africa’s December 2003 financial year-end also
reflected the lack of alignment between the supply and demand of finished goods.
Kraft Foods South Africa’s year-end result in 2003 was 76 % or ZAR 23 million more
finished goods than the 2003 operating budget. The finished goods stock cover for
Kraft Foods, measured in days’ inventory forward cover, was 17 days or 35 % more
than the 2003 operating budget (Templeton, 2004).
UUnniivveerrssiittyy ooff PPrreettoorriiaa eettdd –– VVaann ddeerr MMeerrwwee,, TT ((22000066))
4
A portion of the increase in the finished goods inventory was as a result of the low
sales forecasting accuracy. The sales forecasting accuracy measured per stock
keeping unit was 43 % lower than the 2003 operating budget (Templeton, 2004).
.
In January 2004, the research proposal was presented to Kjell Ruth, the managing
director of Kraft Foods South Africa, who approved the project.
1.2 Research problem
The supply chain of Kraft Foods South Africa is currently struggling with the classic
symptoms of a mismatch between supply and demand, low sales forecast accuracy,
high and aging inventory, as well as low customer service.
The aim of the research is to determine the following:
• To identify the causes of the misalignment between the supply and
demand within Kraft Foods South Africa’s supply chain.
• To identify potential solutions that could improve the alignment between
the supply and demand within Kraft Foods South Africa’s supply chain.
1 .3 Research object ives
The primary objective of the research is to identify the main causes of the
misalignment between the supply and demand within Kraft Foods South Africa’s
supply chain. The result of an improved match between the supply and the demand
will be a reduction in inventory, higher sales forecast accuracy and an increase in the
customer service level.
The secondary objectives of the research are as follows:
• To improve the supply and demand alignment for all partners within Kraft
Foods South Africa’s supply chain, including retail and wholesale
customers, as well as suppliers.
UUnniivveerrssiittyy ooff PPrreettoorriiaa eettdd –– VVaann ddeerr MMeerrwwee,, TT ((22000066))
5
• To identify the best practices that could add value to all Kraft units
worldwide, in order to improve their alignment between demand and
supply.
1 .4 Research methodology
The research study consists of qualitative research through a literature review, in-
depth interviews and a case study. Qualitative research determines the essential
character and meaning of a research subject. (Cooper and Schindler, 2003: 152).
1.4.1 Literature review
There is extensive literature available concerning the importance of aligning the
demand and supply side of the supply chain. Most of the literature identifies the
major benefits of an improved alignment between the supply and demand within any
supply chain. However, little research has been done on the alignment of the supply
and demand within a supply chain (Cooper and Schindler, 2003: 152-153).
The research study will identify secondary literature inside and outside Kraft Foods
South Africa. By reviewing prior research, methodologies can be identified that have
proved successful or unsuccessful. By using secondary literature, the research will
avoid duplication in instances when prior collected data can provide sufficient
information for resolving the current decision-making dilemma. (Cooper and
Schindler, 2003: 152-153).
1.4.2 Structured in-depth interviews
While published data is a valuable resource, it is seldom the case that more than a
fraction of the existing knowledge in a field is put into writing. The structured in-depth
interviews will essentially be experience surveys. A significant portion of what is
UUnniivveerrssiittyy ooff PPrreettoorriiaa eettdd –– VVaann ddeerr MMeerrwwee,, TT ((22000066))
6
known on a topic may be proprietary to a given organisation and thus unavailable to
an outside researcher. (Cooper and Schindler, 2003: 153).
The structured in-depth interviews will seek information from people experienced in
the area of the research study, tapping into their collective memories and experience.
(Cooper and Schindler, 2003: 154). The structured in-depth interviews will be
conducted with people from within Kraft Foods South Africa, other Kraft Foods units
and members of Kraft Foods South Africa’s supply chain, including suppliers and
customers. The structured in-depth interviews will not cover direct competitors of
Kraft Foods South Africa, due to the sensitive and important nature of the research
subject. The structured in-depth interviews and secondary literature review will also
be aligned. In some cases the secondary literature review will provide leads for the
structured in-depth interviews, while in others, the structured in-depth interviews will
provide leads for the secondary literature review.
From the structured interviews a case study will emerge. An in-depth analysis of the
supply and demand alignment of Kraft Foods South Africa’s supply chain will be
done. The analysis will focus on the current situation and potential areas of
improvement, based on the findings of the case study, secondary literature review
and structured in-depth interviews.
1.5 Benef i ts o f the s tudy
The research study could be beneficial to the following individuals:
• Academics may use the research study as a point of reference if they wish to
expand their research on the topic. Only the key theoretical principles will be
available to the public, due to the confidential nature of the study.
• The management team within the Centre of Excellence of Kraft Foods Inc.
could decide to apply the findings and best practices to other Kraft Foods
units.
UUnniivveerrssiittyy ooff PPrreettoorriiaa eettdd –– VVaann ddeerr MMeerrwwee,, TT ((22000066))
7
• Decision- makers, in small, medium and large companies, struggling to align
the supply and demand in their supply chains, could apply the findings and
recommendations.
1.6 Out l ine of the d isser ta t ion
The dissertation documents the thinking around the research project, the decisions
taken during the research process and the reconstruction of the logic of the research.
The outline of the dissertation adheres to the rules of scientific evidence. (Moutton,
2001:112-113, 122-123)
The structure of the dissertation is as follows:
Chapter 1: Objectives and scope of the study
Chapter 1 provides the main reasons that led to the research topic. It also provides
general information about Kraft Foods Inc. and Kraft Foods South Africa. It identifies
the research problem and provides a general overview of the research design and
methodology. Chapter 1 concludes with a general outline of the dissertation.
Chapter 2: Supply chain management
Chapter 2 contains the theoretical framework of supply chain management. It
provides an introduction of the secondary literature covered and defines the key
concepts. A detailed overview is given of all secondary literature read. The chapter
concludes with a summary of the main conclusions and findings of the secondary
literature review. The secondary literature study will provide the framework for the
structured in-depth interviews.
Chapter 3: Supply and demand alignment
Chapter 3 contains the theoretical framework of supply and demand alignment. It
provides an introduction to the secondary literature covered and defines the key
concepts. A detailed overview is given of all secondary literature read. The chapter
UUnniivveerrssiittyy ooff PPrreettoorriiaa eettdd –– VVaann ddeerr MMeerrwwee,, TT ((22000066))
8
concludes with a summary of the main conclusions and findings of the secondary
literature review. The secondary literature study will provide the framework for the
structured in-depth interviews.
Chapter 4: The supply chain of Kraft Foods
Chapter 4 contains the theoretical framework of Kraft Foods. It provides an
introduction to the secondary literature covered and defines the key concepts.
Chapter 5: Research design and methodology
Chapter 5 documents the design and methodology followed during the research. It
provides full details of the data- collection process, including gaining access to the
subjects, data- collection techniques and procedures used.
Chapter 6: Research findings
Chapter 6 documents the results of the structured in-depth interviews done in
Chapter 3. This chapter interprets the main findings of the structured in-depth
interviews.
Chapter 7: Summary, conclusions and recommendations
Chapter 7 is the most important chapter, because it presents the end- product of the
research. It draws together the results from the previous chapters and indicates how
the results and conclusions relate to the secondary literature review and theory of the
research topic. The larger relevance and value of the study is also described.
1 .7 Genera l
The Harvard method was used as a standard method of reference.
The contents of the dissertation will remain confidential and will therefore not be
made available to the general public.
UUnniivveerrssiittyy ooff PPrreettoorriiaa eettdd –– VVaann ddeerr MMeerrwwee,, TT ((22000066))
9
CHAPTER 2: SUPPLY CHAIN MANAGEMENT
2 .1 In t roduct ion
In today’s highly competitive global marketplace, the pressure on organisations to
find new ways to create and deliver value to customers grows ever stronger.
Gradually, in emerging economies, as well as mature markets, the power of the
buyer has overtaken that of the customer. The rules are different in a buyer’s market,
in particular, customer service becomes a key differentiator as the sophistication and
demands of customers continually increase. At the same time, market inventory
maturity combined with new sources of global competition, has led to an over-
capacity in many industries, resulting in an inevitable pressure on price. Price has
always been a critical competitive variable in many markets, and there is every
indication that it will become even more of an issue as the commoditisation of
markets continues. It is against this backdrop that the discipline and philosophy of
logistics and supply chain management have moved to the centre stage over the last
two decades. The concept of integration within the business and between businesses
is not new, but the acceptance of its validity by managers, is. There has been a
growing recognition that through logistics and supply chain management, the twin
goals of cost reduction and service enhancement can be achieved. Better
management of the pipeline means that customers are served more effectively and
yet the costs of providing that service can be achieved (Christopher, 1998: ix).
2.2 Understanding, pred ic t ion and contro l
The three key processes in managing systems are understanding, prediction and
control. Understanding provides the insights needed to predict how a system will
behave in response to changes to its inputs. Prediction, on the other hand, allows
one to control the system by making the best combination of adjustments. The
sequence of the three key processes should therefore be understanding, then
prediction, followed by control. Comparing predicted with actual results, deepens
UUnniivveerrssiittyy ooff PPrreettoorriiaa eettdd –– VVaann ddeerr MMeerrwwee,, TT ((22000066))
10
one’s understanding of the system, allowing one to make more accurate predictions
and improve one’s control. Together understanding, prediction and control form the
heart of any successful management process. The problem is that the priorities
between understanding, prediction and control are normally reversed in the short run,
but are also self-defeating in the long run. Control is normally the primary concern,
prediction is invoked only as needed to improve control, and understanding is viewed
as an incidental by-product rather than the prime mover of the sequence. Although
understanding is the most important management process, it is also the most
neglected. The first goal of managing a supply chain is thus to understand the
systems. To maximise the outputs of the supply chain, one needs some shared
understanding of how the settings affect the operations of the supply chain, together
with some co-ordination of the changes to get the best overall performance (Taylor,
2004:73-74).
The basic mechanics of supply chains are simple, but the behaviour of the supply
chain as a whole can be very difficult to understand, much less predicted and
controlled. Understanding is not a luxury when it comes to supply chain systems of
this level of complexity; it is a necessity (Taylor, 2004:74-75). Steven Covey indicated
that one should aim for understanding as a first priority, before attempting to
convince others (Covey, 1990:237). Supply chain leaders, for example, Wal-Mart and
Dell, did not succeed because they found a magic formula or were managed by
business geniuses. These supply chain leaders succeeded, because they
understood the core problems of the supply chains, committed themselves to long-
term solutions rather than quick fixes, and had the stamina to stick with those
solutions until they worked (Taylor, 2004:19). If anyone seeks to understand a
situation or process, they need to know that process or situation very well. If the
process or situation is not well understood, then the result of the efforts will be
simplistic rather than simple. True simplicity comes from a thorough understanding
(De Bono, 1998:283).
UUnniivveerrssiittyy ooff PPrreettoorriiaa eettdd –– VVaann ddeerr MMeerrwwee,, TT ((22000066))
11
2.3 New nature of compet i t ion
Christopher (2004:1) mentioned that the environment in which the original
frameworks and principles of marketing have been formulated has changed
significantly. Instead of a situation where demand exceeds supply, a condition which
persisted in some markets until quite late in the twentieth century, it is clear that the
reverse condition is more often the norm.
This transition from a sellers’ market to a buyers’ market meant that the conventional
focus in many companies on the classic ‘4 Ps’ of Product, Price, Promotion and
Place had to be radically reviewed. Now there is widespread recognition that
companies compete, not so much through what they do, but through how they do it.
In other words, the ways in which key business processes are managed and how
those processes are aligned with the needs of the market, can be every bit as
important as the quality of the product or its price.
Emerging from this changed competitive landscape, has come the idea that the
processes that enable demand to be fulfilled in a more responsive and reliable way,
can be critical to the achievement of market-place success. Of equal importance is
the way in which relationships are managed, both upstream and downstream of the
company. These three R’s – Responsiveness, Reliability, and Relationships –
underpin the idea of marketing logistics. Marketing logistics focuses upon the ways in
which customer service can be leveraged to gain competitive advantage. It seeks to
manage the interface between marketing and logistics activities of the organisation,
in order to align their perspective strategies within the context of the wider supply
chain.
Taylor (2004:3) mentioned that the way the supply chain is managed can make or
break a company. Some of the most spectacular business successes or failures over
the past 20 years have come from finding ways to deliver products to consumers.
The nature of the competition has shifted from the classic struggle between
companies, to the new competition of supply chain versus supply chain. As
UUnniivveerrssiittyy ooff PPrreettoorriiaa eettdd –– VVaann ddeerr MMeerrwwee,, TT ((22000066))
12
companies have grown more comfortable working with partners from other industries,
their focus has shifted to working with the best partners. Partners in supply chains
are learning to play a new competitive game of supply chain versus supply chain
(Berger & Gattorna, 2001:25). In future, companies and products will not compete,
but supply chains will (Reeder & Rowell, 2001:6).
In recent years, one of the most significant developments in the way companies
manage their operations and formulate their competitive strategies has been the
focus on time. There are clearly many ways in which companies compete and
through which they seek to gain advantage over their rivals. However, the ability to
move quickly, whether in new product development or in replenishing customers’
inventories, is increasingly recognised as a prerequisite for market-place success.
The late twentieth century saw the emergence of the time-sensitive customer. These
time-sensitive customers can be found in every type of market, whether high-tech
markets where short life cycles demand short lead times, consumer durable
manufacturing where just-in-time assembly requires just-in-time deliveries, or
everyday living where the pressures of managing a more complex, hectic lifestyle
have led us to seek convenience in, for example, banking, shopping and eating
(Christopher, 2003:67).
The nature of the competition has thus shifted from a sellers’ to a buyers’ market;
from managing marketing and logistics separately to the combination of supply and
demand in marketing logistics; from competing against companies to competing
against supply chains; and finally the progression towards time based competition.
2.4 Focus of supply cha in management
Traditionally, companies used to maintain an arms-length, even adversarial
relationship that so often typified buyer/seller relationships in the past. The focus of
supply chain management changed the relationship to one based on co-operation
and trust and the recognition that properly managed, ‘the whole can be greater than
the sum of parts’ (Christopher, 1998:18).
UUnniivveerrssiittyy ooff PPrreettoorriiaa eettdd –– VVaann ddeerr MMeerrwwee,, TT ((22000066))
13
Supply chain management can be defined as the management of upstream and
downstream relationships with suppliers and customers to deliver superior customer
value at less cost to the supply chain as a whole (Christopher, 1998, 18), (Gattorna,
1998:276). Supply chains exist to support the flow of demand, supply, and cash
(Taylor, 2004:21). Although the phrase “supply chain management” is now widely
recognised, it could be argued that it should really be termed “demand chain
management” to reflect the fact that the chain should be driven by the market, not by
the suppliers (Christopher, 1998:18). Equally the word “chain” should be replaced by
“network”, since there will normally be multiple suppliers and, indeed, suppliers to
suppliers, as well as multiple customers and customers’ customers to be included in
the total system (Christopher, 1998:18).
We are entering the era of network competition where the prizes will go to those
organisations who can better structure, co-ordinate and manage the relationship with
their partners in a network committed to better, faster and closer relationships with
their final customers (Gattorna, 1998:272). Extending this idea, it has also been
suggested by J. Aitkin, that a “chain” should more accurately be defined as a
“network” of connected and interdependent organisations mutually and co-operatively
working together to control, manage, and improve the flow of materials and
information from suppliers to end users (Christopher, 1998, 18).
2 .5 Impor tance of supply cha in per formance
There has been a growing recognition that supply chain management can achieve
the twin goals of cost reduction and service enhancement (Christopher, 1998, ix).
The quality of a company’s supply chain performance can mean the difference
between business prosperity and failure (Gattorna, 1998: xiii).
Cutting-edge supply chains are double-edged swords. Wielded with skill, they can
slice open new markets. Improperly handled, they can lead to deep, self-inflicted
wounds. For all the advantages from getting the supply chain right, getting it wrong
can be catastrophic (Taylor, 2004:8). Improperly managed supply chains can be
UUnniivveerrssiittyy ooff PPrreettoorriiaa eettdd –– VVaann ddeerr MMeerrwwee,, TT ((22000066))
14
disastrous for companies, for example, the following widely reported supply chain
failures have occurred since 2001:
• Kmart, a major discount retailer in the US, went bankrupt (Taylor, 2004:8-9).
• Nike lost $ 100 million in lost sales during the year 2000(Taylor, 2004:9-10).
• Cisco Systems wrote off $ 2.5 billion in excess inventory, owing to poor
management of its myriad outsourced contractors (Valdero, 2002).
(Christopher, 2003:69).
• Micron Technology wrote down $ 260 million of memory products inventory,
representing 32 percent of revenue (Valdero, 2002).
• In his testimony before congress in February 2001, Federal Reserve
Chairman Alan Greenspan said that the overbuilding of inventories by U.S.
businesses and their failure to anticipate downturn in demand, despite
significant investment in supply chain management technology, has greatly
exacerbated the ill- effects of this country's economic slowdown (Valdero,
2002).
Broken or bad supply chains can also have an impact on the shareholder value of
companies. The average loss of shareholder value due to ineffective supply chains
was estimated at $ 350 million (Taylor, 2004:11). 1131 supply chain problems were
studied in the United States and a loss of shareholder value of more or less $ 160
billion was discovered (Taylor, 2004:12) Research in the USA (Singhal and Hendriks,
2002:18) highlighted a direct connection between problems in the supply chain and
the share price of the business. On average, bad news from the supply chain will
reduce the share price by 7.5 percent, but this often triggers a longer-term decline
averaging an 18.5 per cent reduction in shareholder return.
Good supply chains, on the other hand, can have a positive impact on a company’s
top line, as well as the bottom line. (Taylor, 2004:6). Michael Hammer, for example,
regards the supply chain as the last untapped vein of business gold (Taylor, 2004:8).
Well- managed supply chains can add value to a company’s top and bottom line,
while poorly managed supply chains, could even have an impact on a company’s
shareholder value.
UUnniivveerrssiittyy ooff PPrreettoorriiaa eettdd –– VVaann ddeerr MMeerrwwee,, TT ((22000066))
15
2.6 Measur ing per formance
One of the keys to improving supply chain operations is having a solid set of
measures in place to monitor performance. The challenge lies in making good
choices among the dozens of measures available. Some companies try to measure
too much, overwhelming themselves with data that never quite forms a coherent
picture. Others measure too little, relying on one or two indicators that do not reflect
the full spectrum of performance. The tendency to focus too narrowly on measures is
exacerbated by management fads, such as cycle-time reduction in the 1990s and the
current obsession with inventory velocity (Taylor, 2004:173). When dealing with any
form of measurement, prevention is always the best solution. One should try to avoid
performance metrics that are nothing more than post mortem certificates (Harmon,
1992:3-4).
Just as there is no easy answer to all supply chain problems, there is no magic
measure for improving performance. Generally, the framework for understanding and
selecting supply chain measures is based on four broad categories: measures of
time, measures of cost, measures of efficiency, and measures of effectiveness
(Taylor, 2004:173).
2.6.1 Measuring time
According to Taylor (2004:137, 142, 173-174, 176-179), time is the easiest measure
to capture, because it involves nothing more than taking two readings and performing
a subtraction. The four key measures of time are process time, interval, speed and
throughput. Examples of process time are pallet transfer time, transportation time
and order processing time. Order processing can be slow and complex. Even with a
good order processing system, the sequence of events is often slow, labour-
intensive, and prone to errors. One of the goals of product companies has been to
fully automate order processing, reducing the time, cost, and mistakes associated
with order processing. Intervals are as important as process times. Times that are not
directly tied to a single process are usually referred to as intervals. Examples of cycle
time are customer order interval, cash-to-cash time and machine cycle time.
UUnniivveerrssiittyy ooff PPrreettoorriiaa eettdd –– VVaann ddeerr MMeerrwwee,, TT ((22000066))
16
Originally cycle time referred to the interval between repetitions of a periodic process,
which is not necessarily the same as the duration of the process. Contemporary
usage compounds two measures, applying the term cycle time to process duration,
as well as repetition intervals.
Another approach to measuring times is to invert them and express them as speed,
which is distance, divided by a unit of time. When speed takes on a particular
direction, it is called velocity. People that talk about inventory velocity are not really
describing the speed at which inventory is transported. Rather, they are referring to
the amount of time it takes to transform raw materials into finished goods. If one
looks for actual measurements of inventory velocity, one will come up empty-handed;
what one will actually find are reports of traditional measures such as inventory turns
or days on hand.
Variability in process time is also an important measure. Early deliveries force a
company to hold the inventory longer than necessary, and late deliveries require an
increase in inventory levels to avoid stockouts, so any deviation from the requested
delivery data requires so much more inventory. To minimise variability in one’s
supply chain, one has to minimise variability in every single process along the way.
Whole industries have grown up against time compression, from overnight delivery to
fast foods. Technology has facilitated this process – cellular telephones, fax and
satellite communications have all contributed to the continued search for the
achievements of quicker response to the demands that customers place upon
companies. Quality is now measured, not just in terms of product performance, but
also on delivery performance. Few industries have been immune to these pressures,
and managers should constantly seek ever-more innovative ways to squeeze time
out of every business process. Indeed, the main drive behind the Business Process
Re-engineering philosophy has been the search for more time- effective ways of
doing things (Christopher, 2003:67).
UUnniivveerrssiittyy ooff PPrreettoorriiaa eettdd –– VVaann ddeerr MMeerrwwee,, TT ((22000066))
17
2.6.2 Measuring cost
Taylor (2004:180-184) mentioned that measuring costs is considerably more difficult
compared to the simplicity of measuring time, and complex issues can arise when
you try to mix or combine different types of cost. The three major types of costs that
are usually measured are direct costs, indirect costs, and error costs. The other costs
that can also be considered are periodic costs and incremental costs.
Direct costs are those costs that can be directly attributed to the production of
finished goods, for example, the cost of materials and labour. The second type of
costs are indirect costs which are those costs that are necessary to run a company,
but cannot be attributed directly to the creation of a particular product, for example,
facility cost and opportunity cost. The most systematic approach to allocating indirect
costs is activity-based costing where indirect costs are allocated to products by the
way of activities and the resources they require. In effect, activity-based costing
seeks to translate indirect costs into direct costs. A third kind of cost is the expense
that can be attributed to errors in supply chain processes. These errors include
incorrect quantities, invalid product substitutions, inaccurate prices, inventory stock
outs, late shipments, and deliveries to the wrong location, damaged goods and
missing items. The most obvious error- cost is the expense of running corrective
processes, such as handling returns, expediting replacements, reworking defects,
and handling settlements. Because these corrective processes are usually ad hoc
and time intensive, they are generally more expensive than the original process,
causing the total cost of a transaction to more than double. Less obvious error- costs
include costs such as long-term consequences, for example, the loss of future
business from customers who change suppliers due to process failures, as well as
damage to the company’s reputation if these failures become frequent. These costs
are, of course, much harder to measure.
It must be remembered that every day spent in the pipeline represents a cost to the
business. Quite apart from the cost of funding the working capital employed, there is
the opportunity cost – in other words, whilst cash is locked up in the pipeline, it
cannot be put to use elsewhere in the business or, indeed, invested elsewhere. In
UUnniivveerrssiittyy ooff PPrreettoorriiaa eettdd –– VVaann ddeerr MMeerrwwee,, TT ((22000066))
18
large organisations where a day’s sales are measured in millions, the cost of even an
extra day of pipeline- time will be considerable (Christopher, 2003:69).
2.6.3 Measuring efficiency
Taylor (2004:184) states that costs, although critical to supply chain performance, fail
to capture an important aspect of supply chains: the efficiency with which a chain
utilises its resources. Christopher (1998:81) adds that the high real interest
environment has had a traumatic effect on business and has prompted a search for
dramatic improvements in asset productivity.
Efficiency is concerned with the economical use of resources and thus measures
how well you use what you have (Taylor, 2004:189-190). Taylor (2004:184-188) also
indicates that of the many assets required for supply chains, inventory usually
receives the most attention, because it inflicts such a heavy financial burden. The
most widely used measure for inventory is the inventory turnover ratio, also called
inventory turn. Another measure for the inventory is days on hand, which is the
number of days the inventory would last given the normal consumption. One
interesting approach to quantify inventory velocity is to measure the amount of time
products spend being processed in some way, including transportation, and then
divide that by the total time the products spend in the chain. Time- in- process
indicates the relative amount of time the product is actually moving through the chain,
rather than just sitting there taking up space. Several studies indicate that, despite
attempts to accelerate inventory movement, products in the pipeline still spend the
majority of their time waiting. The second type of efficiency measure deals with the
use of fixed capacity such as capacity and machinery. The most common measure is
the load, which represents the percentage of capacity that is in use at any specific
time. The third kind of efficiency measure is concerned with the use of capital, which
is particularly important, because it is the medium for acquiring other resources.
UUnniivveerrssiittyy ooff PPrreettoorriiaa eettdd –– VVaann ddeerr MMeerrwwee,, TT ((22000066))
19
2.6.4 Measuring effectiveness
Taylor (2004:189-190) states, unlike efficiency, which is concerned with the
economical use of resources, effectiveness reflects how well a process achieves its
business objectives. Efficiency measures how well you use what you have, and
effectiveness measures how well you get what you want.
The most important measure of effectiveness is concerned with customer service
levels. It does not matter how good you are at purchasing and production if you
cannot deliver products to your customers in a timely, reliable manner. Customer
service levels can be applied in two ways: Sometimes it is a measure, and other
times it is a constraint. Some companies simply measure their customer service level
and use it to monitor their performance across products, regions and time. Other
companies specify a target customer service level and use this target as a constraint
on the supply chain, improving the chain until the target level is reached.
Although customer service levels can be calculated, mandated, or exist as a result of
the way in which business is conducted, there are seven popular criteria for
establishing service levels (Kobert, 1992:78-83). These criteria are:
1. Show the ratio of on-time, complete orders shipped versus total orders
required.
2. Weighted service level is measured by giving weight to such factors as order
quantities and customer size.
3. Compare line items shipped versus line items ordered.
4. Examine orders placed with tentative required order shipment dates.
5. Consider returns and the reasons for returns.
6. Estimate the value of lost business due to delivery problems.
7. Measure the customer service levels attained versus levels attainable due to
capacity constraints. The capacity to ship orders can be constrained by factors
such as production capacity limitations on production equipment; supply
constraints forced by vendor capacities; order financing; space available to
stock product in any stage; natural and unnatural disasters; monopoly
restraints by overseas suppliers regarding strategic materials; available supply
UUnniivveerrssiittyy ooff PPrreettoorriiaa eettdd –– VVaann ddeerr MMeerrwwee,, TT ((22000066))
20
of skilled staff; export or import restrictions; customised carrier capacities;
rules, laws and regulations ranging from safety to environmental.
The other way to measure effectiveness is to measure customer satisfaction, which
can be monitored either passively or actively. Passive measures consist mostly of
counting complaints, returns, requests for adjustments and other indications of
trouble. Active measures, on the other hand, solicit feedback from customers who
might otherwise have remained silent (Taylor, 2004:191).
The ultimate measure of effectiveness, of course, is customer retention. If a company
has a growing base of loyal customers that buy its products in ever-increasing
quantities, that company is clearly doing something right (Taylor, 2004:191). There is
also evidence to suggest that retained customers are more profitable than new
customers (Christopher, 1998:45).
2.6.5 Difference between efficiency and effectiveness
Companies around the world use various concepts and tools to craft efficient and
effective operations. To implement the various concepts and tools, companies must
understand the difference between efficiency and effectiveness (Chase, Aquilano
and Jacobs, 2001:6). Efficiency means doing something at the lowest possible cost.
The goal of an efficient process is to produce a product or service by using the
smallest input of resources. On the other hand, effectiveness means doing the right
things to create the most value for the company (Chase, Aquilano and Jacobs,
2001:6).
Often maximising effectiveness and efficiency at the same time creates conflict
between the two goals. We see this trade-off between effectiveness and efficiency
every day of our lives. To use an example, at the customer service counter of a local
store or bank, being efficient means using the fewest people possible at the counter.
Being effective, though, means minimising the amount of time that customers need to
wait in line (Chase, Aquilano and Jacobs, 2001:6).
UUnniivveerrssiittyy ooff PPrreettoorriiaa eettdd –– VVaann ddeerr MMeerrwwee,, TT ((22000066))
21
2.7 Chal lenges of managing supply cha ins
The difficulty of managing supply chains comes primarily from the complexity that
creeps into their structure and the variability that characterises their flows. It is the
complexity and variability that make an easy game hard to master (Taylor, 2004:21).
The real business challenge does not lie in complexity and variability themselves, but
in the failure to recognise the havoc they cause on supply chains and making the
necessary corrections (Taylor, 2004:41).
2.7.1 Managing complexity in supply chains
According to Taylor (2004:36-38), the first challenge of supply chains is coping with
complexity. The complexity begins with the ways in which the three primary flows
relate to one another.
Supply chain flows are linked in complex ways. A single production run generates
orders to many different suppliers and these orders are usually combined with orders
for other production runs to achieve economies of scale in purchasing. The
shipments fulfilling these orders may further combine orders to reduce the cost of
transportation, but large orders may also be split across two or more shipments, and
backordered items are often sent in still later shipments. Invoices are usually multiple
shipments; payments may cover invoices, and so on. The simple groupings between
the three primary flows of orders, shipments and payments are quickly obscured by
groupings and regroupings.
Another source of complexity is the way in which the supply chains are managed,
with different groups handling each of the three basic flows. All of these groups
operate at different levels, and all too often, with deeply incompatible agenda, and no
one group is responsible for the outcome of the entire transaction.
Complexity is also created by the increase of documents associated with orders.
Examples of supply chain documents are purchase orders, sales orders, packing
lists, bills of lading and advance shipping notices.
UUnniivveerrssiittyy ooff PPrreettoorriiaa eettdd –– VVaann ddeerr MMeerrwwee,, TT ((22000066))
22
The structure of the supply chains itself is another source of complexity. Most supply
chains are never actually designed. Rather, they evolve over time through a series of
independent decisions.
Managing a global network of materials and information flows, is not only more
complex than managing a purely national logistics system, but it also involves some
specific additional considerations Christopher (1998:137-141). There are four factors
that are critically important for global supply chains (Christopher, 1998:137).
The first factor is extended lead time of supply. Although the normal assumption is
long lead times, manufacturing lead times are an artificial constraint. In many cases,
it is possible to make to order, instead of from the inventory. A buffer inventory, which
is held between the manufacturer and customer, due to the extended transit times,
should also be reviewed if it reflects inflexibility in manufacturing or poor materials
management.
The second factor is extended and unreliable transit times. Shipping, consolidation
and customs clearance all contribute to delays and variability in the lead time of
global supply chains. The consequence is that local managers tend to compensate
for the unreliability of supply, by over-ordering, double buffering, and applying
competitive pressure on manufacturing and the central organisation.
The third factor is multiple consolidation and break bulk options. The options for the
management of international freight are complex and the trade-offs will be complex
and may vary for different market channels. The result is that the inventory holding,
warehousing, customer service and freight costs balance will be different for each
option and will be determined by the characteristics of the product and the profile of
demand.
The fourth factor is multiple freight mode and cost options. Shipping companies offer
mixed sea/air services, different container sizes, scheduled and unscheduled
services. The problem with the conventionally organised international business is
UUnniivveerrssiittyy ooff PPrreettoorriiaa eettdd –– VVaann ddeerr MMeerrwwee,, TT ((22000066))
23
that, if the transport decisions are taken purely on the basis of costs, as they
frequently are, then this will lead to sub-optimal decisions in many cases.
2.7.2 Managing variability in supply chains
The second challenge of supply chains is coping with variability (Taylor, 2004:37-40).
The real-world supply chains do not ever ‘see’ average values; what they deal with
every day are the actual values that make up the averages. The more variability
there is in these values, the more difficult and expensive it is to run the supply chain.
A great deal of supply chain management and cost is devoted to coping with
variability. A few examples of how companies attempt to cope with variability are: a
finished good inventory acts as a buffer against the variability in demand; raw
material inventories offer protection against the variability of supply; redundant
sources, such as alternate suppliers and transportation options, provide protection
against variation in the availability of materials and services; quality programmes
reduce the variability in product- quality and forecasting attempts to predict variation
in demand.
Variability in the supply can amplify down the supply chain, while variability in the
demand can amplify up the supply chain. The classic example of demand
amplification is a study conducted by Procter & Gamble in the early 1990s. Small
variations in the retail sales of the Pampers brand of diapers were amplified up the
supply chains, producing large swings at the level of raw materials. The causes of
this effect, which Procter & Gamble dubbed ‘the bullwhip effect’, are now understood.
Demand amplification continues to be a serious problem in many chains. According
to Christopher (2003:90), the well-known ‘bull-whip effect’ or ‘Forrester-effect’, named
after the professor from Massachusetts Institute of Technology who first identified the
effect, is the cause of considerable hidden cost to the supply chain as a whole.
Many industries have worked hard to minimise the variability in the supply chains.
For example in the grocery industry, point-of-sale data is shared by all supply chain
partners. The result is that better decision support tools can be developed that take
UUnniivveerrssiittyy ooff PPrreettoorriiaa eettdd –– VVaann ddeerr MMeerrwwee,, TT ((22000066))
24
the actual historical sales trend from the point-of-sale data and separate normal
replenishment volume from lift factors associated with promotional activities or other
events, and they use this data to forecast the future demand more accurately
(Gattorna, 1998:96-97). In most cases, a few variables cause most of the variability.
According to the Pareto Principle or 80/20 rule, twenty per cent of the variables are
responsible for eighty per cent of the result (Goldratt, 1990:123).
Taylor (2004:81-82) indicates that the main causes of variability in the supply chain
are delays, phase shifts, distortions and economies of scale. Delays occur when any
of the components are out of phase with each other. Delays in demand, supply and
cash can vary from minutes to months. Phase shifts also cause havoc in supply
chains. Based on the most current data, each company might reach totally different
conclusions about how the chain ought to be responding to the current demand. If
any company tries to make a correction on its own, it is almost certain to throw the
other two out of balance. Even if the original signal is transmitted faithfully all the way
up the chain, the amount of the delay introduced by each component varies, both
within and across components. It takes very little variation of this sort to turn the neat
curves into wild, unpredictable swings. As puzzling as the effects of delay might be,
much more confusion is introduced if there is any distortion of the signal from one
component to the next. Distortions of incoming signals can come from any number of
sources, and they can be introduced accidentally or intentionally. Economies of scale
represent a common cause of distortion in a supply chain, for example, customers
order more than they need in order to get quantity discount and producers run larger
batches than necessary to reduce unit costs. Such decisions may save money in
immediate operations, but the distortions they cause in the signals for demand supply
and cash, extract a much higher cost than most companies realise. The one result of
demand distortion is demand amplification or the ‘bullwhip effect'. (Taylor, 2004:82)
(Chase, Aquilano and Jacobs, 2001:335).
Distributions are used to describe variability (Taylor, 2004:104,163,164). The
distribution follows a common form, called the normal distribution, which has a
mathematical formula with just two parameters: the mean, which is the formal name
for the numerical average, and the standard deviation, which is a measure of the
variability. Variability in most quantities conforms to the normal distribution, a
UUnniivveerrssiittyy ooff PPrreettoorriiaa eettdd –– VVaann ddeerr MMeerrwwee,, TT ((22000066))
25
recurring pattern that describes how far values are likely to deviate from the average.
Extreme values cannot be eliminated. The implication is that no amount of safety
stock is enough to entirely eliminate the possibility of a stockout.
Inventory can, for example, be reduced by reducing variability in the supply chain and
/or by a quicker responding supply chain states Kobert (1992:11-12.). Examples of
inventory reductions include the following:
• Use faster external and internal transportation modes.
• Improve forecasting of customer requirements and time-phased demand, and
take actions to make lead time assessments both realistic and current.
• Negotiate for price breaks for smaller ordering quantities than previously
allowed by suppliers.
Products with steady, predictable demand are the easiest to handle, because their
requirements are well known and the chain can be designed around their
requirements. If the demand varies, but does so in a predictable way, this puts more
stress on the supply chain but it is still manageable. The most difficult products to
handle are those with highly variable demand that cannot be predicted with any
consistency. This situation is most commonly encountered with innovative products,
which have little or no sales history and whose sales are driven by trends and fashion
(Taylor, 2004: 267).
To resolve the problem of variability, one should consider the total supply chain.
Trying to reduce variability at any one link in the supply chain, may just push
variability up or down the chain, often amplifying variability in the process. The only
real solution to the variability problem is for trading partners to work together to
remove variability across the chain, rather than trying to cope with variability through
point solutions such as added safety stock (Taylor, 2004:166). It is this realisation,
that the organisation no longer stands alone, that has prompted a new search for
collaborative partnering. These partnerships may be with suppliers, distributors,
retailers, specialist service providers, technology-sharing alliances, and increasingly,
with competitors. The lines between suppliers, customers and competitors are
sometimes becoming increasingly blurred (Christopher, 2003:29).
UUnniivveerrssiittyy ooff PPrreettoorriiaa eettdd –– VVaann ddeerr MMeerrwwee,, TT ((22000066))
26
2.8 In ter re la t ionship between people , processes and tools
The importance and interrelationship between people, resources and tools, must be
considered when a supply chain is evaluated or managed.
People should come first, because they are the only ones capable of improving
processes (Ptak and Schragenheim, 2000:39). Gattorna (1998:402), points out that
experience shows that the people equation is the toughest part to get right. It
requires a strong, continuing effort to secure the organisation’s buy-in and
commitment to change, empower employees to handle more responsibility and to do
what it takes to ensure that they have a sense of ownership in the new process.
Processes, on the other hand, should be carefully monitored. According to W.
Edward Deming, approximately 94 % of the problems within an organisation can be
directly linked to the process and only 6 % to people (Ptak and Schragenheim,
2000:39). Understanding how processes work is therefore essential to ensuring the
competitiveness of a company. A process that does not match the needs of the
company will punish that company every minute that it operates. A process, by
definition, is any part of an organisation that transforms an input into an output. The
aim of a process should be to add value to the original inputs (Chase, Aquilano and
Jacobs, 2001:92). The transition from volume-based growth to value-based growth
will require a much greater focus on managing the core processes of a supply chain.
Whereas the competitive model of the past relied heavily on product innovation, this
will have to be increasingly supplemented by process innovation (Christopher,
1998:30).
Software or technology should also never be regarded as the cure to a company’s
problems. Companies frequently ask for the best inventory-management or
forecasting packages rather than focussing on the more important issue, which is
improving the processes that create the inventory. Only if the necessary corrections
are made to the process, can the company consider choosing the best software that
will allow the inventory reductions to occur (Gattorna, 2000:391).
UUnniivveerrssiittyy ooff PPrreettoorriiaa eettdd –– VVaann ddeerr MMeerrwwee,, TT ((22000066))
27
An effective combination of people, processes and tools is necessary to consistently
deliver world-class results. All three must be in place to produce sustainable results
(Reeder & Rowell, 2001:6).
2.9 Managing inventory
2.9.1 Importance of inventory management
Inventory management has always been an important aspect of total supply chain
management (Gattorna, 1998:381). Not only is an inventory an important cost, the
carrying cost of the inventory has been estimated at between 25 to 40 percent of the
value of the inventory itself. The carrying cost or maintenance cost of holding the
inventory can thus be substantial (Gattorna, 1998:381). The costs related to the
inventory can range from the obvious, semi-obvious and even hidden costs like data-
processing and technical support (Schonberger, 1990:321).
The inventory is also an issue for shareholders. Capital tied up in the inventory is not
available. If the inventory is freed up, it can be translated into applications that
increase a company’s share value or dividends to shareholders (Gattorna,
1998:381). Companies must critically analyse the reduction of the inventory to ensure
the availability of a product, because the only time the inventory can add value to the
customer, is when it is available for sale (Gattorna, 1998:242).
2.9.2 Classifications of inventory
Inventory can be classified in several ways. One way to classify the inventory is
based on the stages of the production process. In this classification, there are three
types of inventory: raw material, work-in-progress or semi-finished goods and
finished goods (Gattorna, 1998:382). A second way of classifying the inventory is
based on the types of inventory in the business process (Gattorna, 1998:382). The
UUnniivveerrssiittyy ooff PPrreettoorriiaa eettdd –– VVaann ddeerr MMeerrwwee,, TT ((22000066))
28
seven types of inventory, according to the business process classification, are the
following:
• Cycle stock –the inventory necessary to meet the normal daily demand and
which is routinely replenished;
• Safety stock – the inventory that protects against uncertainty whether it be in
demand, lead time, or both;
• In-process stock/in-transit stock – the inventory created in the steps to
manufacture a finished product/inventory on route to a stocking or delivery
point by some mode of transportation;
• Seasonal stock – the inventory held to meet increased sales volume during a
particular time of war;
• Promotional stock – the inventory needed to meet the needs of marketing
campaigns or advertising;
• Speculative stock – the inventory held to protect against price increases or
limited availability; and
• Dead stock – the inventory that is no longer usable or saleable in the current
market.
Each of the stock levels must be closely monitored and managed. No matter how
safety stock is determined, the important thing to remember is that the operational
planning system will treat stock like demand, rather than a supply. Therefore, safety
stock needs to be managed and consumed like a forecast. If the safety stock is never
used, then it is not really needed (Ptak and Schragenheim, 2000:35).
2.9.3 Inventory management of perishable items
Handling perishable products, also adds complexity to a supply chain. Perishable
items refer to the physical deterioration of units of a product (Silver, Pyke and
Peterson, 1998:403-404). Perishable items can be divided into two categories, fixed
or random.
For items with a fixed lifetime, the utility of each item stays essentially constant for a
fixed period of time, and then drops considerably. An example of fixed lifetime items
UUnniivveerrssiittyy ooff PPrreettoorriiaa eettdd –– VVaann ddeerr MMeerrwwee,, TT ((22000066))
29
is blood stored in blood blanks. In items with a variable lifetime, the utility can
decrease throughout the lifetime in a fashion that may, or may not depend on the age
of the unit. Examples of variable lifetime items include fresh produce, certain volatile
chemicals and drugs. Most research suggests that a random lifetime inventory on
hand deteriorates at a constant rate. It also suggests that the inventory is depleted
according to a first-in-first-out policy. First-in-first-out is an optimal issuing policy over
a wide range of assumptions. However, where the customer makes the selection, for
example, in retail food distribution, where the expiry date is shown on every item, a
last-in-first-out policy is likely to be observed.
The supply chain of perishable items must thus ensure that the items are delivered to
consumers as soon as possible to minimise the loss of utility and value.
2.9.4 Managing excess inventories
Silver, Pyke and Peterson (1998:367), state that when studying the inventories of
many companies, it is common to find a significant percentage of the stocked items
that have recently had absolutely no sales. Any remaining stock of a dead item is by
definition, excess stock.
The reasons for excess inventory items can be grouped into two categories. First are
errors associated with replenishment, that is, having purchased or produced too
much of an item. These replenishment errors include production overruns, unjustified
quantity purchases and errors in transmission of an order request. The second
reason for excess stock, relates to the overestimation of the demand rate. These
demand forecast errors include inaccurate forecasts, deliberate changes in sales and
marketing efforts, technological obsolescence such as engineering change, and
customer cancellations.
To ensure that actions are taken against obsolescence, a company must identify the
obsolete items that have a record of non-demand, and calculate the cost of the
inactive inventory items. This will ensure that appropriate action is taken to phase
these items out of one’s supply chain (Kobert, 1992:118). Silver, Pyke and Peterson
UUnniivveerrssiittyy ooff PPrreettoorriiaa eettdd –– VVaann ddeerr MMeerrwwee,, TT ((22000066))
30
(1998:371-372) indicates that companies can make use of various options to dispose
of excess stock, which include some of the following:
• Use the product for other purposes.
• Ship the materials to another location.
• Use the stock for promotional purposes.
• Markdowns or special sales.
• Return to suppliers at a unit value lower than the initial acquisition cost.
• Auctions.
• Disposal for scrap value.
Whatever the causes of excess stock, it is important to be able to identify the items,
and decide on what remedial action to take. It would be desirable to anticipate the
decrease in usage of an item and take appropriate action to avoid being caught with
a large surplus stock. The problem of excess stock is increasing as the rate of
technological change increases, causing the life cycle of the typical product to
shorten (Silver, Pyke and Peterson, 1998:367).
2.10 Managing supply cha in s t ra teg ies w i th Pareto
The ABC classification or Pareto Principle dates back to the Italian economist
Wilfredo Pareto and his studies of the distribution of wealth in Italy. Pareto observed
that about 20 percent of the population of Italy controlled 80 percent of wealth, and,
over time, this observation led to the 80/20 rule used daily in an innumerable number
of disciplines and methodologies (Miller, 2001:184).
The Pareto, or 80/20 rule, can provide us with the basis for developing a more cost-
effective service strategy. The service issue is that neither all of our customers, nor
all of our products are equally profitable (Christopher, 1998:56). The highest service
should be given to key customers and key products (Christopher, 1998:57).
The objective of segmentation is to separate the important from the unimportant. The
purpose of classifying items into groups is to establish the appropriate degree of
control over each item. Class A items may be more clearly controlled with weekly
UUnniivveerrssiittyy ooff PPrreettoorriiaa eettdd –– VVaann ddeerr MMeerrwwee,, TT ((22000066))
31
ordering, B items may be ordered biweekly, and C items may be ordered monthly or
bimonthly (Chase, Aquilano and Jacobs, 2001:668).
Since all the items being forecasted are not equally important, it is not necessary to
spend the same amount of time on each. One should spend the available time on
items that are high volume, high revenue, long lead-time and/or marketing/business
critical. The forecaster must periodically review these products to ensure these
criteria are still being met (Johnson, 2002:8-9). Controlling the forecast is more
important than spending extraordinary effort on refining the forecast. Therefore,
modifying an existing forecast, based on actual data as it is received, is the most
effective application of skills and time (Kobert, 1992:329-330).
The Pareto Principle can also be used to differentiate the forecast policies of A, B
and C items as follows (Miller, 2001:186):
• The forecasts of “A” items should be monitored closely and adjusted as
appropriate on a regular basis. A combination of sophisticated forecasting
techniques, improved by current marketing and field sales input and top- down
versus bottom- up forecast checks can be used. “A” items should be produced
regularly and receive production priority in terms of inventory and production
capacity shortages. “A” items will also receive priority in warehouse cycling
counting.
• The forecasts of “B” items should be monitored less closely and adjusted on a
less frequent interval than forecasts for “A” items. “B” items should be
produced regularly, however, in terms of inventory and production capacity
shortages. “B” items can be skipped in production cycles to ensure adequate
capacity for “A” items. “B” items should receive a lower focus in cycle counting
activities in the warehouse.
• Forecasts for “C” items should receive occasional review and simple forecast
methods should be employed to establish forecasts for these items.
Inexpensive “C” items should be produced in occasional, relatively large lot
sizes while expensive “C” items should only be produced on a made-to-order
basis, subject to capacity availability. “C” items should receive the least priority
and frequency of checks in warehouse cycle counting procedures.
UUnniivveerrssiittyy ooff PPrreettoorriiaa eettdd –– VVaann ddeerr MMeerrwwee,, TT ((22000066))
32
A company can also achieve savings, when different policies are applied to products
based on stock value, for example order size, order frequency and size and
frequency of internal production scheduling lot sizes (Kobert, 1992:210). Some of the
advantages of applying different approaches include the following:
• Considering modes and costs of various transportation options.
• Reducing lead times.
• Determining the order approval levels.
• Conducting make versus buy analysis.
Normally A items are required to have a smaller stock-on-hand balance than smaller
replenishment quantities, coupled with more frequent ordering, or scheduling in
production (Kobert, 1992:210). C items, on the other hand, are ordered in much
larger quantities than ordinarily required and ordering and production is performed
much less frequently (Kobert, 1992:211). A company can also apply a process that
allows for automatic and routine ordering of C items (Kobert, 1992:236).
The focus should always be on “A” items, as a mere ten percent reduction in stock
levels of "A" items, would have to be offset by as much as a fifty percent increase for
all C items’ inventories. Pareto Analysis allows a company to focus its efforts, versus
the normal approach of treating all items as equal, by applying average ordering
procedures to all items (Kobert, 1992:211).
The ABC classification can also be used as the basis for classic inventory control,
whereby the highest level of service, as represented by safety stock, is provided for
the A products, a slightly lower level for the B products and lower still for C items.
Alternatively, and probably to be preferred, we might differentiate the stock- holding
by holding the A items as close as possible to the customer and the B and C items
further back up the supply chain. The savings in stock-holding costs, achieved by
consolidating the B and C items as a result of holding them at fewer locations, would
normally cover the additional cost of despatching them to the customer by a faster
means of transportation, for example overnight delivery (Christopher, 1998:58).
The suggested guidelines to control Class A items include the following (Silver, Pyke
UUnniivveerrssiittyy ooff PPrreettoorriiaa eettdd –– VVaann ddeerr MMeerrwwee,, TT ((22000066))
33
and Peterson, 1998:317-318):
• Maintain inventory records for every transaction.
• Keep top management informed through frequent reports.
• Estimate and influence demand in three ways:
o Provide manual input to forecasts, for example, ask customers to
provide advance warning of their needs.
o Determine the predictability of demand. Where the demand is known
with some predictability, there is no need for safety stock.
o Manipulate a given demand pattern. Seasonal or erratic fluctuations
can sometimes be reduced by altering price structures, negotiating with
customers, smoothing shipments, and so forth.
• Estimate and influence supply. Blanket orders and freeze periods, for
example, can be negotiated with suppliers and result in a reduction of the
average replenishment lead time, its variability, or both. The idea of a freeze
period is that the timing or size of a particular order cannot be altered within a
freeze period prior to its due date.
• Use conservative initial provisioning. Erroneous initial overstocking, due to
overestimating the usage rate, can be quite expensive.
• Review decision parameters frequently. Order points and order quantities
should be reviewed frequently, as often as monthly or bimonthly.
• Determine precise values of control quantities. The order quantities of “A”
items should be based on the most exact analysis.
• Confront shortages as opposed to setting service levels. Expediting in and out
of house, emergency airfreight shipments, and other actions are undertaken to
avoid or eliminate stock shortages. On the other hand, some customers might
be willing to wait a short time for delivery. Because “A” items are replenished
frequently, it may be satisfactory to operate with very little on-hand stock. A
backorder will ensure that the demand is satisfied with the next order.
Perhaps the best way to manage product service levels is to take into account both
the profit contribution and the individual product demand (Christopher, 1998:58-59).
The profit contribution and the individual product demand measures can be brought
together in the form of a simple matrix demand:
UUnniivveerrssiittyy ooff PPrreettoorriiaa eettdd –– VVaann ddeerr MMeerrwwee,, TT ((22000066))
34
• Quadrant1 – Seek cost reductions for high volume and low profit contribution
Stock Keeping Units: Some products might have a high volume because they
are in frequent demand. However, they are also low in profit contribution and
the priority should be to re-examine the product and logistics costs to see of
there is any improvement in scope or enhancement in profits.
• Quadrant 2 – Provide high availability for high volume and high profit
contribution Stock Keeping Units. The aim is the highest level of service with
these items by holding them as close to the customer as possible and with
high availability. Normally there would be relatively few items that could afford
to follow such a strategy.
• Quadrant 3 – Review Stock Keeping Units with low volume and low profit
contribution. Products in this category should be regularly appraised with a
view to deletion from the range. They do not make any significant contribution
to profit and they are slow movers from a sales point of view. Unless they play
a strategic role in the product portfolio of the firm, there would probably be a
strong case for eliminating them.
• Quadrant 4 – Just-in-time delivery for low volume, high profit Stock Keeping
Units. These products should be kept in a central location, as far back up the
supply chain as possible, in order to reduce the total inventory investment, and
then shipped by express transport directly to customers.
Christopher (1998:59-60) adds that the concept of service prioritisation by product
can also be extended to include customer priorities. Because the same 80/20 rule
applies to customers as it does to products, it makes sense to focus resources on
key accounts, as well as key products. “A” or key products and customers should be
protected, “B” products or “B” customers should be developed, “B” customers that
buy “B” products should be maintained, while the active status of “C” customers and
“C” products should be reviewed.
If the 80/20 principle should be applied to both products and customers, then all
businesses would have to rely on a very few customers buying a few high profit lines.
The arithmetic is quite simple: If twenty percent of customers buy twenty percent of
the products which provide eighty percent of the total profit, then only four percent of
transactions, measured order-line by order-line, contribute to sixty percent of all
UUnniivveerrssiittyy ooff PPrreettoorriiaa eettdd –– VVaann ddeerr MMeerrwwee,, TT ((22000066))
35
profits. The aim should be to offer the highest levels of service and availability to key
customers ordering key products. A company should also constantly review the less
profitable customers and the less profitable products. In between, there might be
items of critical value to the customers. A weight could be assigned on the basis of
criticality and the 80/20 ranking based on profit could be adjusted accordingly
(Christopher, 1998:60-61).
Pareto or ABC Analysis could also help a company to reduce costs (Kobert,
1992:198-199). Some examples of how Pareto Analysis can assist in reducing costs
include the following:
• Pinpoint areas where small savings in significant values of sitting stocks can
greatly reduce total ongoing costs of carrying inventories.
• Isolate procurement opportunities for large potential savings, by allowing for
time and skill- emphasis in contractual negotiations to move quickly, and, on a
priority bases, to important issues.
• Establish priority rankings for all projects that relate to inventory reductions,
such as lead-time analysis, vendor capacity planning, bottleneck analysis and
safety stock calculations.
Pareto Analysis thus allows a company to focus its efforts versus the normal
approach of treating all items as equal (Kobert, 1992:211).
2.11 Pul l versus push supply cha ins
Taylor (2004:28-29) mentions that’s orders trigger the flow of goods, but, depending
on the production strategy, they may or may not trigger their immediate production by
a supplier. In the made-to-stock strategy, a supplier makes products in advance of
the demand and holds them in the finished goods inventory, satisfying the demand
from that inventory as orders come in. In the made-to-order strategy, the supplier
does not build a product until it has an order in hand. There is also an intermediate
strategy, assemble-to-order, by which a product is partially built in advance of
demand, but final assembly is postponed until an order is received. Some companies
use a mix of these three techniques, but choose one as their primary strategy. For
UUnniivveerrssiittyy ooff PPrreettoorriiaa eettdd –– VVaann ddeerr MMeerrwwee,, TT ((22000066))
36
example, Sony uses made-to-stock, Boeing uses make-to-order and Dell uses
assemble-to-order.
The choice of production strategy has a major impact on the dynamics of a supply
chain. With the classic made-to-stock strategy, the inventory is produced in advance
and pushed down the chain toward consumers so that it will be on hand when they
need it. The made-to-stock strategy relies on demand forecasts to determine how
much inventory to build and where to hold it (Taylor, 2004:29). In most supply chains,
the majority of manufacturing and distribution activities are driven by a forecast,
rather than by a demand (Christopher, 2003:86).
With made-to-order production, the inventory is pulled down the chain by immediate
orders. Forecasts are less important with this type of production, because there is no
danger of making too much or too little inventory, though long-term forecasts are
important to setting the correct levels of manufacturing capacity (Taylor, 2004:29). An
example of a made-to-order operation is the National Bicycle Industrial Company that
produces personalised bicycles to match a customer’s size, weight and colour
preference (Chase, Aquilano and Jacobs, 2001:18-19).
Almost every repetitive manufacturer tries to produce to stock, rather than to order,
for two reasons: Firstly, production lead times are too long to provide the required
levels of customer service. Secondly, there are major peaks and valleys in demand
that do not equal the production capacity. To meet variations in the demand,
manufacturers can either produce according to the inventory in anticipation of the
demand, or produce at peak levels when it occurs (Harmon & Peterson, 1990:216).
For decades the automobile industry, for example, has operated under a push-
distribution system. With this type of system, manufacturers produce according to
long-lead time forecasts and rely on their dealers and periodic incentives to move the
inventory. Push- distribution is characterised by high levels of inventory held in a
distributed manner, thereby simultaneously driving high costs and low fill rates. Push-
distribution focuses on selling what you have, rather than making what sells. In this
type of environment, there is constant pressure to move volume through short-term
incentives that undermine pricing and brand strategies. The alternative pull-based
UUnniivveerrssiittyy ooff PPrreettoorriiaa eettdd –– VVaann ddeerr MMeerrwwee,, TT ((22000066))
37
model is built upon integrated information systems, which enable effective processes
and encourage customer input (Gattorna, 2000:606).
Just-in-Time is an example of the pull concept, where demand at the end of the
pipeline pulls products towards the market and behind those products; the flow of
components is also determined by that same demand. The pull system differs from
the traditional push system where products are manufactured or assembled in
batches, in anticipation of the demand and are positioned in the supply chain as
buffers between the various functions and entities (Christopher, 1998:179).
Some manufacturers are moving towards a make-to-order strategy, rather than
make-to-forecast, by managing the pipeline better rather than reducing customer
choice (Christopher, 1998:210). For example, some car manufacturers have
centralised the control of the finished inventory of vehicles, rather than have the
dealers carry stock. The car manufacturers also take advantage of the 80/20 rule,
which tells them that 80 per cent of the total demand will be for just 20 per cent of the
variant. The models that represent 80 per cent of the total demand are made to
forecast, whereas the other 20 per cent of the demand is not only made against firm
orders, but is given priority in the production schedule (Christopher, 1998:211).
The weak link in the build-to-stock model is inventory management, and this can be
traced back to an even weaker link, namely, the reliance upon sales forecasts. A
build-to-order model, on the other hand, begins with the order and not with the
forecasts (Chase, Aquilano and Jacobs, 2001:549).
Although supply chains can normally be classified as either push or pull chains, in
reality, every chain is a mixture of push and pull. As long as consumers have a
choice about what products they buy and when they buy them, the last link in the
chain is always a pull link. Somewhere between the push and pull chains is the push-
pull boundary, the point at which the flow of goods switches from being pulled by
consumers to being pushed by suppliers. In the case of assemble-to-order strategy,
for example, the push-pull boundary is located at the final assembly plant (Taylor,
2004:29).
UUnniivveerrssiittyy ooff PPrreettoorriiaa eettdd –– VVaann ddeerr MMeerrwwee,, TT ((22000066))
38
According to Gattorna (2000:606-610), companies implement a pull-based
distribution strategy for various reasons. The four main benefits associated with pull-
based distribution include the following:
• Reduced fulfilment costs of shipping, storing inventory and physically trading
inventory.
• Higher revenue realisation through higher customer order fill rates.
• Lower sales costs: The high inventory levels and long lead times between
ordering and production cause lower sales costs. Buffer stocks slow the
feedback between sales and production, leading to excessive inventory. The
push- based system fails to respond quickly with changes in product mix to
meet market changes.
• Improvement retention throughout the ownership cycle.
The differences between the supply and demand chains should also be considered
according to Langenwalter (2000:48). The supply chain starts with the initial supplier
and consists of the following five steps: buying raw material, making the finished
product, moving goods to the market, selling through retailers and receiving a return
from retailers or collection points. The demand chain, on the other hand, reverses the
steps of a supply chain by using a pull philosophy. This chain includes the following
five steps: receiving a return from retailers or collection points, selling the customised
product, moving to delivery based on consumption, making only those products for
which there is a known demand, and buying raw materials as necessary to support
production.
The goal of most manufacturers should be to supply customer requirements from
production, and not from stock. This goal becomes feasible when total lead times are
reduced, set-up costs become minimal, and the range of available, flexible capacity
is sufficient to meet all, but the most unusual, peak demands. Ideally, every
manufacturer should strive to achieve a make-to-order environment (Harmon &
Peterson, 1990:200).
The aim of any company should be to convert its supply chain from push to pull by
responding to customer demand. Technology is used to link the supply chain
(Hughes, Ralf and Michels, 1999:163). In future, organisations should be more
UUnniivveerrssiittyy ooff PPrreettoorriiaa eettdd –– VVaann ddeerr MMeerrwwee,, TT ((22000066))
39
demand-driven than forecast driven. The means of making the transition will be
through the achievement of agility, not just within the company, but across the supply
chain (Christopher, 1998:32).
2.12 Master ing demand
The first step in designing a supply chain is to understand the pattern of demand
one’s chain has to serve. The demand pattern is formed by the intersection of
customer requirements and product constraints. Although demand is usually taken
for granted, there are various techniques that a company can use to improve the
shape of the demand to better suit its chain, including a few techniques that actually
improve the demand by reducing it. Most of the causes of demand amplification are
standard practices in supply chain management that can easily be modified to
stabilise the flow of the demand (Taylor, 2004:259).
Leaders in supply chain management know that management of the supply chain
represents only half of the business equation. While much attention has been paid to
finding new and better ways to reduce inventory and increase stock turns, little
attention is being paid to understanding, creating and managing demand more
effectively (Gattorna, 1998:41). In the words of Terbeck, products and services
should be brought closer to consumers, how, when, and where they value them most
(Gattorna, 2000:635).
2.12.1 Knowing the customer
According to Taylor (2004:259-263), the starting point in the process of
understanding the customer, is performing a geographical analysis of demand. The
analysis can be as simple as plotting customer locations on a map, or as complex as
combining consumer profile data with population density figures stratified by income
and other characteristics.
In addition to analysing the volume and type of products that customers buy, it is also
important to examine their actual buying patterns. The analysis should focus on five
UUnniivveerrssiittyy ooff PPrreettoorriiaa eettdd –– VVaann ddeerr MMeerrwwee,, TT ((22000066))
40
major factors: the total volume of the product that customers purchase per period, the
frequency of orders, the lot sizes within each order, the variety of products included
in each order, and the customer service level required to keep customers happy. To
cite two extremes, Just-in-time production facilities may require daily deliveries of
small lots of very specific product mixes, and they may place very tight constraints on
fill rates and delivery times. At the other end of the scale, wholesale distributors may
place infrequent orders for large quantities of products, require a different mix on
each order, and have much less restrictive requirements for times of delivery. These
two kinds of customers would place a very difficult demand on a supply chain. The
just-in-time customers would be best served by high-throughput distribution centres
located close to their plants, whereas the distributors might be adequately served by
a centralised, general-purpose storage facility.
Analysing the customer service level requirements of individual customers, can help
to identify opportunities for major savings in a supply chain. Some companies take
pride in setting a high standard for customer service level and applying that standard
across the board, but providing a higher level of service than customers actually
need, could be wasted, given the tremendous expense of maintaining the high cost
of service levels. A more cost- effective approach would be to vary customer service
level according to each individual customer’s needs, eliminating the waste of over-
serving customers with low requirements, while also avoiding unacceptable service
for customers with high requirements. If a company would like to be recognised for
excellent service, it would probably want to keep its customer service level at the
upper end of the acceptable range, but if it wishes to compete primarily on price, then
the adequate range would help keep costs down.
The next step is to look for correlations between how customers buy and where they
are located. The distribution of sales across corporate customers often follows the
Pareto pattern: The top 20% of customers account for 80 % of sales, and the bottom
50 % for just 5 %. If the majority of customers require high customer service levels,
regional warehouses need to be considered in these regions.
If a single supply chain is designed that treats all customers the same, deliveries will
be constantly expedited for type ‘A’ customers, in order to get those deliveries to
UUnniivveerrssiittyy ooff PPrreettoorriiaa eettdd –– VVaann ddeerr MMeerrwwee,, TT ((22000066))
41
move faster than the bulk of the goods, and it may be found that the cost structure of
the supply chain makes it too expensive for many type B and C customers. Type ‘A’
customers can be served by small warehouses adjacent to their plants, making
precisely- timed deliveries in re-usable parts-kit containers. Type B customers, on the
other hand, can have a package carrier, such as UPS or FedEx; deliver shipments
from a central warehouse. Type C customers can be served by a conventional
network of regional distribution centres.
According to Gattorna (1998:48-51), the science of segmenting customers from a
logistics perspective does not differ significantly from traditional sales and marketing
segmentation. Different customer-unique logistics need to drive the segmentation of
customers, for example, buying relationship, ordering and billing, delivery and
support services, ordering complexity and delivery complexity.
In defining customers’ logistics requirements, organisations should also focus on
understanding their own performance, versus that of their competitors’. This will
provide greater insight into the priority of each service factor and how well these
service requirements are being met. Where a high-priority service is not being met by
the market, there will be an opportunity to differentiate. If, however, a service
requirement is being met by most of the competition, then the time will have come to
rectify this, in order to save the situation. In addition, a focus on non-priority service
requirements could be avoided.
A supply chain should be designed according to the actual and also the different
needs of its customers, which might mean different strategies for different customers.
UUnniivveerrssiittyy ooff PPrreettoorriiaa eettdd –– VVaann ddeerr MMeerrwwee,, TT ((22000066))
42
2.12.2 Analyzing the product
2.12.2.1 Implications of product attributes on the supply chain
According to Taylor (2004:264-266), the qualities of products can impose constraints
on how they are packaged, transported, and stored. The three product qualities that
must be considered are form, density and risk.
With regard to form, the major concern is whether a product is shipped in bulk or
packaged. Shipping and storing bulk material is much cheaper than handling
packages. When materials are shipped in bulk form, the state of the material is a key
consideration, because solids, liquids and gases differ greatly in the way they are
transported. The condition of packaged goods is important, as well as those shipped
in bulk, because liquids and gases generally require relatively expensive packaging,
such as tanks.
Density, expressed as the ratio of weight to volume, is also an important
consideration in the supply chain design. Low-density products are more expensive
to ship, because vehicles and containers “cube out” before they “weight out”, filling
the available volume before they reach their full hauling capacity. When low density
is the result of the way in which a product is constructed, effective density is often
increased by shipping products in a partially assembled state. A property closely
related to density is the product’s value-to-weight ratio. As this ratio increases, the
relative cost of transportation drops and more options become economically feasible.
When carbon travels in the form of coal, it usually moves by slow freight and goes no
farther than it has to. When carbon travels as diamonds, it goes by plane and circles
the globe.
Product risk could require special handling, packaging, transportation, and storage.
Higher risk products include fragile items, perishable products and hazardous
products. The risk of fragility, perishability and hazardousness increase the cost of
transportation, and high-risk products are often shipped separately from other goods
to isolate these added costs.
UUnniivveerrssiittyy ooff PPrreettoorriiaa eettdd –– VVaann ddeerr MMeerrwwee,, TT ((22000066))
43
The design of the supply chain also has to take into account whether the products
are standard or customised. In general, customisation shifts the push-pull boundary
further up the supply chain. Standard products allow the push-pull boundary to be set
right next to the customer, so these products can be ordered to stock and pushed all
the way down the chain in anticipation of demand. Fully customised products, on the
other hand, can move the push-pull boundary all the way up to suppliers, if the
choice of material depends on the design. Shifting the push-pull boundary upstream
reduces the need for the inventory, because products are pulled by immediate
demand, rather than by being pushed down the chain based on forecast. The
problem is, however, that the complexity of the fulfilment process is increased and it
requires more flexibility in both upstream and downstream facilities.
According to Christopher (2003:42), Theodore Levitt introduced the idea of the
‘augmented product’, and this concept is still in operation today. Essentially, the
notion of the augmented product is that it is not sufficient to focus on marketing effort
of the tangible product features alone. These features are quickly imitated or cloned
by competitors, and in many cases, as Levitt would argue, customers do not buy
products, they buy benefits. Instead, the marketer needs to identify other ways in
which value can be delivered to the customer, over and above the intrinsic elements
embedded in the product itself.
Product attributes must be considered when designing and managing a supply chain.
Different products require different supply chains. A well- managed supply chain
should ensure that the product features, tangible and non-tangible, are delivered to
the customer.
2.12.2.2 Implications of product demand variability on the supply chain
According to Taylor (2004:267-269), another important consideration for a supply
chain design, is the variability in demand for products over time. Products with
steady, predictable demand are the easiest to handle, because their requirements
are well known and the chain can be designed around these requirements. If the
UUnniivveerrssiittyy ooff PPrreettoorriiaa eettdd –– VVaann ddeerr MMeerrwwee,, TT ((22000066))
44
demand varies, but does so in a predictable way, more stress is put on the chain but
this will also then be predictable.
A better approach to coping with seasonable variability is to use products with
different seasons to counterbalance each other, distributing the load on a supply
chain as evenly as possible over the course of a year. The classic example is the
manufacturing plant that alternates between snow blowers and lawn mowers, taking
advantage of common components and operations to minimise the cost of semi-
annual changeovers.
The most difficult products to handle are those with highly variable demand that
cannot be predicted with any consistency. This situation is most commonly
encountered with innovative products, which have little or no sales history and whose
sales are driven by trends or fashion. Products may start with low and slow growth,
and later go through a period of rapid growth peaks and then slide into a gradual
decline. The demand for newly introduced products is highly uncertain, and the
uncertainty starts to decline only as the full market embraces the product and the
growth rate begins to slow down. It is only after the product is well into its sales
period that sales become reasonably predictable.
Until a product approaches its sales peak and begins to exhibit a stable pattern, the
supply chain for that product needs to maintain high levels of safety stock to handle
higher-than-expected sales. In addition, considerable excess capacity must be kept
in reserve, in order to increase production quickly if the actual sales for the product
escalate. A product’s overnight success might be shattered by chronic shortages,
cost overruns or quality problems. Erring in the other direction could lead to excess
inventory, idle plants and massive returns. Dealing with innovative products is one of
the toughest problems in supply chains.
According to Shapiro (2002:1), practical considerations cast doubt on the validity of
order fulfilment strategies based on the classical models. Examples of supply chain
complications include the following: individual items which may be shipped together
and which, in turn, affect delivery times: limited storage space in the company's
distribution centres which may constrain the quantities that can be ordered; vendors’
UUnniivveerrssiittyy ooff PPrreettoorriiaa eettdd –– VVaann ddeerr MMeerrwwee,, TT ((22000066))
45
availability of products may be limited, which also constrains the quantities that can
be ordered; inventories held in nearby distribution centres which may be used to
serve customers when a stockout occurs in a given distribution centre and product
demand which may fluctuate over time. Such complications reflect the realities of
modern supply chain management. In practice, managers could and should use
combinations of judgement and classical analysis in determining safety stocks for
their products.
Companies must be wary of using marketing grouping for demand patterns. Product
families are usually based on similarity of production or consumption, rather than
similarity in their demand patterns, and families often mix products with very different
supply chain requirements (Taylor, 2004:269).
Supply chains must be customised according to the demand variability of the
product.
2.12.2.3 Pareto product groups
When deciding to aggregate products for design purposes, it is important to take the
sales volumes of products into account. If a Pareto Analysis reveals that 20 % of the
product line accounts for 80 % of the sales, companies should be able to take
advantage of that fact in designing their supply chains. For example, one might be
able to handle fast movers separately, gaining some economies of scale by shipping
them only in full pallets or full truckloads. Alternatively, a company might be able to
convert the other 80 % of the product to a centralised warehousing system, allowing
them to bypass the regional distribution system. The numbers of Stock Keeping Units
that have to be tracked and queued at the regional distribution centres will decrease
to a fifth of what it would otherwise be, allowing for streamlining of operations at
distribution centres, while decreasing inventories that do not sell over rapidly (Taylor,
2004:269-270). Knowing which products to forecast and when to keep safety stock,
is a critical component of managing customer and supplier risk in the centre of the
supply chain (Bonomo, 2003:4).
UUnniivveerrssiittyy ooff PPrreettoorriiaa eettdd –– VVaann ddeerr MMeerrwwee,, TT ((22000066))
46
Pareto Analysis should be used as a powerful tool to aggregate products. The supply
chain strategies should be customised according to the product groups.
2.12.2.4. Implications of product life cycle on the supply chain
According to Gattorna and Walter (1996:29), the implications of logistics
management vary between the various stages of a product’s life cycle. In the early
stages of a product’s introduction, it is important that it be made available to the
innovator customer group that will account for its success-rate. Costs are not
unimportant but they are viewed less rigorously than would normally be the case. In
the growth stage, the channels of distribution are expanded as the demand grows. It
is also important to ensure that the availability and delivery reliability are high if
sustained growth is to be maintained. As the product reaches maturity while sales
volumes are high and competition is intense, ways and means of maintaining
margins must be investigated. Third-party distribution service companies may help
maintain cost-effectiveness. Upon reaching the decline stage, both product and
distribution service characteristics should be rationalised. The fact that typical
customers may become highly price sensitive, means that margins could be seriously
affected, unless the supply chain activity is reviewed (Gattorna and Walter, 1996:30).
Product life cycles are getting shorter. In many markets, the effect of changes in
technology and consumer demand combine to produce more volatile markets, where
a product can be obsolete almost as soon as it reaches the market. Shortening life
cycles create substantial problems for logistics management. There are situations
arising where the life cycle is shorter than the strategic lead-time. This means that
the life of a product on the market is less than the time it takes to design, procure,
manufacture and distribute the same product. Ultimately, the means of achieving
success in such markets is to accelerate movement through the supply chain and to
make the entire logistic system far more flexible and responsive to the fast-changing
markets (Gattorna, 1998:31).
Long lead times to procure a specific product impede a company’s ability to respond
to market signals. Longer material procurement lead-time reduces the amount of time
UUnniivveerrssiittyy ooff PPrreettoorriiaa eettdd –– VVaann ddeerr MMeerrwwee,, TT ((22000066))
47
available for reactive production. Because the demand for raw materials can be
forecast more accurately than the demand for finished products, holding raw
materials is often less risky than holding finished goods (Gattorna, 1998:178). In
order to react more quickly to demand changes, a company might decide to hold raw
materials, rather than finished goods.
Different demands are put upon the supply chain according to the life cycle stages
and length of the product life cycles.
2.12.2.5 Implications of product life cycles on forecast error
Planners have used the product life cycle for decades. The product life cycle
determines the profit potential of the individual product in its forecast life cycle. An
active item is usually in one of the first four phases, namely development,
introduction, growth or maturity. Seasonal and “one-of” products are treated as if they
are in the termination portion of the life cycle (Kobert, 1992:328-329).
In the development phase, the forecast calls for an inventory build-up. Forecast
errors result from a delay in start-up costs and lost opportunities when expensive
introduction costs develop sales, but delivery is stalled (Kobert, 1992:328-329). A
small amount of sales data should be used early in the life of a product to update
forecasts. The effective use of early sales data could typically reduce the forecast
error margin from between 50 and 100 percent to around ten percent. (Fisher,
1999:152).
In the introductory phase, the cost of a postponed delivery or lost order is critical. If
the product must match a very costly introductory promotion, the promotion cost may
greatly exceed the carrying cost of the inventory for an additional month or more,
especially if one uses the true variable cost of the inventory versus the total cost of
the cancelled or postponed orders (Kobert, 1992:328-329).
During the growth phase, optimistic forecasting can lead to excess inventories.
Normally stock outs are perceived to be more costly than the variable carrying cost of
UUnniivveerrssiittyy ooff PPrreettoorriiaa eettdd –– VVaann ddeerr MMeerrwwee,, TT ((22000066))
48
temporary stocks of raw materials and work-in-progress inventories. Excess stock is
absorbed when calculating net requirements for the coming periods. Procurement
and production are reduced by excess inventories during the growth phase (Kobert,
1992:329).
The maturity phase is the most difficult phase to define. Temporary upsurges in
independent demand are viewed as a true sign that the product is still in the growth
stage. Temporary steep declines are sometimes viewed as a sure sign that the
product has entered the termination phase. A major inventory error occurs when the
forecaster believes that the product is still in the growth stage, while it has actually
moved into the termination stage, which is often the case with high fashion product
lines. Often, large inventories of ‘A’ items must be written-off. ‘A’ items ought to be
frequently and accurately tracked (Kobert, 1992:329).
When dealing with new products, companies must be conservative in situations of
high uncertainty and instability. This normally applies when data contains high
forecast measurement error, high variation concerning the trend line has occurred or
is expected, instabilities have occurred or are expected, or the forecast goes outside
the range of the historical data (Armstrong, 2001:14).
Traditional forecast methods cannot be used with short-lived products, that is, with a
product life cycle of 9 to 18 months. Product life cycle forecasts allow for product life
cycle phases, marketing events and other known information to arrive at initial
forecasts. The product life cycle forecast method incorporates the impact of
seasonality, price changes and promotional events, but also updates the forecasts as
actual market data become available (Burruss & Kuettner, 2003:6).
The biggest challenge in demand forecasting is predicting the sales of a product that
breaks new ground. Innovative products go through a life cycle that is characterised
by slow sales as customers decide whether to adopt the product, and then a period
of rapid growth as the product escalates. The difficulties in forecasting innovative
products lie in predicting how soon a product will enter its growth phase, how quickly
sales will escalate, and how high they will eventually go. If a company overestimates
how well a product will be received, it could be burdened with excess production
UUnniivveerrssiittyy ooff PPrreettoorriiaa eettdd –– VVaann ddeerr MMeerrwwee,, TT ((22000066))
49
capacity and unsold inventories. If the company underestimates demand, it will be
faced with angry customers, expensive measures to accelerate production, and
opportunities for competitors to gain market share (Taylor, 2004:207).
The accuracy of forecasts could be increased by identifying the location of a product
in its life cycle and adapting different approaches to different product life cycles.
2.12.3 Shaping demand
A continuing problem for most organisations is the inaccuracy of forecasts. It seems
that no matter how sophisticated the forecasting techniques employed are, the
volatility of markets ensures that the forecast will be wrong. The evidence from most
markets is that demand volatility is increasing; often due to competitive activity,
sometimes due to unexpected responses to promotions or price changes and as a
result of intermediaries’ re-ordering policies. In situations such as these, there are
very few forecasting techniques that will be able to predict short-term changes in
demand with any accuracy (Christopher, 1998:153).
To understand the nature of the demand and to design the chain accordingly is
important, however Taylor (2004:270-272 added that it takes a somewhat reactive
point of view. It is possible to take a more proactive stance towards the demand,
actively shaping it to suit one’s purposes, rather than working within the constraints it
imposes. In fact, some of the most effective techniques for improving the demand
involve reducing it, at least in the short term.
One of the most important things a company could do to improve the shape of the
demand, is to make sure that the right customers are being served. The relentless
pursuit of revenue often blinds companies to the fact that some customers are being
served at a loss. By removing these unprofitable customers, a huge contribution to
the bottom line could be made, even if the performance of the supply chain is not
improved at all.
A tiered pricing structure, based on service levels, can also assist in eliminating
customers that decrease a company’s profits. Often, it is those customers who place
UUnniivveerrssiittyy ooff PPrreettoorriiaa eettdd –– VVaann ddeerr MMeerrwwee,, TT ((22000066))
50
the greatest demand on performance, who also demand the biggest concessions on
price. A tiered pricing structure, based on service levels, will not allow discount on
premier service. The result is that customers are allowed complete freedom of
choice: They can allow a company to make a profit, or they can inflict their business
on one of the company’s competitors.
The value of reviewing the customer profitability could thus be substantial. The
information could be used firstly, when the sales contract is negotiated and,
secondly, as the basis for sales and marketing strategy in directing effort away from
less profitable types of account, towards more profitable business. More significantly,
it could point the way to alternative strategies for managing customers with high
servicing costs. Ideally, all customers should be profitable in the medium to long term
and where customers currently are profitable, a company should seek to build and
extend further profitability (Christopher, 1998:91).
Taylor (2004:272) adds that eliminating customers that decrease a company’s profits
is only half of the solution; the other half is avoiding such customers in the future.
Marketing and sales messages must strive to attract the right kinds of customers,
and that means being clear about a company’s distinctive competence. If customers
are promised the fastest service and the best products at the lowest prices, then they
will expect delivery according to those promises, no matter what it costs. If a
company is honest about the ways in which it excels, it will be chosen for the right
reasons and both the company and the customer will benefit.
The key to getting sustained co-operation across the supply chain is to align
everyone’s incentives. The idea of being selective about customers will strike some
managers as a radical notion, but it is no more radical than being selective about
suppliers. If customers, whose needs and expectations do not match the capabilities
of the supply chain, are allowed, aligning those incentives becomes extremely
difficult. Unfortunately, the practice of selling to anyone who will buy is deeply
entrenched, so it takes careful alignment of incentives within a company to alter this
behaviour. For example, sales commissions can be based on profit, rather than on
revenue. Another idea is to reward marketing on the quality, rather than the quantity
of leads, and making the alignment of customer requirements essential to the
UUnniivveerrssiittyy ooff PPrreettoorriiaa eettdd –– VVaann ddeerr MMeerrwwee,, TT ((22000066))
51
definition of a qualified deal (Taylor, 2004:272). Gattorna (2000:460) also adds that
changing performance measures is one of the few ways in which leaders directly
affect and change people’s behaviour. People will focus their own activities to
maximise their performance and to achieve individual and workgroup goals that are
measured. In the absence of new performance measures, there is no incentive for
managers and employees to adopt the change, as it is not considered to be
important enough.
Just as serving the right customers is vital to the shaping of the demand, being
selective about the products a company sells is also critical. In the past, decisions
regarding new products were usually made without regard to supply chain
constraints. In the new supply chain-based competition, the selling of products that
are unsuitable for the supply chain is a hard decision to justify. The problem is that
these particular products cannot be moved through the supply chain cost-effectively.
The deeper problem is, that the requirements of these products, can keep the entire
chain from reaching peak performance. If a company’s goal is to compete with other
supply chains based on cost, it should re-assess some of the more innovative
products which require excess safety stock and capacity (Taylor, 2004:273).
As with culling out unprofitable customers, eliminating products that are unsuitable is
only half of the solution. The other half of the solution lies in making sure that all new
products are well suited to the supply chain. If a company’s goal includes making its
supply chain as flexible as possible and responsive to changing needs, it should seek
out innovative products that other supply chains are unable to handle cost-effectively.
Supply chain considerations should help to shape the design of new products,
allowing innovation not only in the product itself, but also in bringing the product to
the market, for example the use of postponement (Taylor, 2004:270-273). The best
way to manage product service levels, is to take into account both the profit
contribution and the individual product demand (Christopher, 1998:58).
The biggest opportunities to improve the efficiency of supply chains still lie in
innovation. Most of the money devoted to the improvement of the supply chain is
spent on automating operations with a safe investment return that is easy to
estimate. Less money is spent at the design level where there is the most opportunity
UUnniivveerrssiittyy ooff PPrreettoorriiaa eettdd –– VVaann ddeerr MMeerrwwee,, TT ((22000066))
52
for innovation. The irony is that innovation offers a far bigger potential for return. To
gain a few points of market share, companies should focus on cost reduction. To
dominate a market, companies need to increase efficiency, which is something that
cannot be matched by the competition (Taylor, 2004:273-274). Companies have to
be highly efficient to remain in business. However, efficiency alone will not be a
sustainable source of differentiation or competitive advantage. Innovation, based on
a deep understanding of consumer needs, will become the leading source of
differentiation and competitive advantage in the future (Gattorna, 200:121).
The supply chain should be actively and proactively shaped with customers and
products that do not constrain it. In some cases, the demand could be improved by
reducing the demand for products and customers that constrain the supply chain.
2.12.4 Stabilizing demand
As conventional supply chains comprise separate corporate entities with only minimal
upstream and downstream transparency of market- related information, they protect
themselves against the uncertainty of the demand by holding on to the inventory. As
a result, these supply chains carry their inventories far in excess of current
requirements, with duplication of stock for each buyer –this is known as supplier
interface. Not only is this a significant burden in terms of working capital but, even
more importantly, such chains are slow to respond to volatile demand. A further
problem with supply chains with numerous buffers between the two ends of the chain
is that small changes in the demand in the final market place are amplified and
distorted as they move back through the chain. This variability is the well known ‘bull-
whip’ or ‘Forrester effect’. (Christopher, 2003:90).
Variability is one of the most costly problems in supply chains, particularly when it
amplifies as it flows up the chain. Anything that is done to stabilise the flow of
demand across the chain, will improve the performance and result in substantial
advantage versus chains that have to cope with higher levels of variability. In addition
to focusing on customers and products that suit the supply chain, a company could
shape the demand by stabilising it (Taylor, 2004:274).
UUnniivveerrssiittyy ooff PPrreettoorriiaa eettdd –– VVaann ddeerr MMeerrwwee,, TT ((22000066))
53
The key for organisations to determine whether their current demand management
practices are ineffective is to investigate whether volatile customer demand
represents the customer’s real underlying demand, or whether the organisation is, in
fact, the primary driver of demand volatility. If the end consumer demand flows
smoothly, then the organisation should start to analyse whether the demand is
caused by its own policies and procedures (Gattorna, 2000:150).
Taylor (2004:274-276) added that the biggest source of variability in supply chains is
caused by demand lumping. Demand lumping divides a steady flow of demand up
into arbitrary chunks that appear as sudden surges in the demand. This occurs, for
example, when a retailer sells products at a constant daily rate, but does not
replenish the stock until the level hits the fixed reorder point. When the retailer
reorders, the requirements are rounded up to the next level of packaging to avoid
handling individual items, then it will be rounded up a little further if it is close to the
next quantity break in the distributor’s discount schedule. The distributor follows a
similar policy, but waits longer and buys in larger quantities in order to get better
prices. When the distributor does place an order, the quantity may be so large that it
exhausts the producer’s inventory of finished goods and triggers another production
run.
Demand lumping distorts the demand signal in two ways. Firstly, it throws off the
timing, delaying the demand signal as it moves upstream. If the producer only sees
the incoming demand signal, he will not even know that the products are selling until
a few weeks of sales have passed. Secondly, it amplifies the demand signal. When
the producer finally receives information about the demand, it comes in such a large
order that increased production will be necessary to handle the surge. But even the
smallest variation in sales will continue to amplify up the chain, producing the
infamous ‘bullwhip effect’ that has a devastating impact on upstream suppliers.
Demand lumping is usually a by-product of a company’s routine practices such as
quantity discounts, economic replenishment policies, volume packing and batch
production runs. These business practices have all been designed to take advantage
of economies of scale. The fact that these practices also create havoc in supply
UUnniivveerrssiittyy ooff PPrreettoorriiaa eettdd –– VVaann ddeerr MMeerrwwee,, TT ((22000066))
54
chain management is a highly counterintuitive but deeply important insight. It seems
that there is a fundamental tension between economies of scale and the smooth flow
of demand up the supply chain (Taylor, 2004:276). An “everyday low pricing” strategy
is one example of how a company can eliminate the forward buying of bulk orders
(Silver, Pyke and Peterson, 1998:473). The result of forward buying is that it turns
simple, predictable demand into a chaotic series of spikes that only add to the cost
(Fisher, 1997:147).
Taylor (2004:276) also adds that there are other causes of demand lumping that are
not related to economies of scale. One example is forward buying in which
customers purchase supplies before they are needed, in order to take advantage of
favourable prices. These prices may be the result of natural fluctuations in the
market, but they are usually caused by promotions granted by suppliers.
Another cause of demand lumping is hoarding, in which customers buy more than
they need, in order to protect themselves against current or expected shortages
(Silver, Pyke and Peterson, 1998:473) (Taylor, 2004:276). Hoarding can have
particularly unpleasant effects on demand, because it contains a positive feedback
loop. Hoarding increases scarcity, which further increases hoarding, and in this way
the loop will continue. In some situations in the electronics industry, this self-
amplification can escalate a relatively minor shortfall into a worldwide crisis (Taylor,
2004:276).
According to Taylor (2004:276-278), companies do not have to give up all their
established business practices in order to stabilise demand. They only need to
modify those necessary to reduce the incentive to lump demand. For example,
companies can try to base quantity discounts on total volume, rather than the size of
individual orders. Quantity discounts will still encourage customers to buy in bulk, but
the incentive to inflate each order will be eliminated. The result will most likely be a
larger number of smaller orders, which will reduce the economies of scale in order
processing. Companies can explore other ways of modifying common practices to
reduce the problem of demand lumping, for example the sell-through and turn-and-
earn systems. Instead of basing promotional prices on the quantity purchased by the
customer, companies can base promotional prices on the quantity they sell to their
UUnniivveerrssiittyy ooff PPrreettoorriiaa eettdd –– VVaann ddeerr MMeerrwwee,, TT ((22000066))
55
customers. The sell-through amount reduces the practice of forward buying and
helps to ensure that promotions actually move the product down the chain, rather
than just pushing promotions to the next link. Hoarding can also be reduced with a
turn-and–earn system, in which customers can only purchase scarce products in
proportion to their outgoing sales. This turn-and-earn system discourages customers
from inflating their orders, with the hope of increasing their allocations.
One of the most effective techniques to stabilise a demand is to use promotions.
Promotions should be run during the demand slump, raising it enough to consume
the output of a stable production schedule. Even if most of the increased demand is
due to forward buying, it is acceptable, because this stabilises the demand, rather
than distorting it.
Mastering demand, rather than just managing it, is a powerful weapon in the supply
chain-based competition. In addition to knowing the customers and understanding
how a company’s products suit their needs, one would have to be willing to make
hard choices about which customers and products are right for a particular supply
chain. The company would have to modify certain business practices that are deeply
ingrained in its corporate culture. However, mastery is never achieved instantly, and
these changes do not have to come all at once. If a company can simply shift its
thinking about the demand from a conventional, reactive stance to a more proactive
point of view, understanding that it can shape the demand to fit the competitive
advantages of the supply chain, such a company will already be ahead of most other
supply chain managers and companies.
Companies must use various strategies, policies, objectives and incentives to
stabilise the demand. A better-stabilised demand pattern will result in major cost
savings throughout the supply chain.
UUnniivveerrssiittyy ooff PPrreettoorriiaa eettdd –– VVaann ddeerr MMeerrwwee,, TT ((22000066))
56
2.13 Demand management
2.13.1 Components of demand
A strategic supply chain begins with the customer. Customer service strategy deals
with how the firm responds to the needs and expectations of its customers, in a
manner that maximises profitability. How the firm ‘senses and responds’ to its
customers is a primary determinant of its overall success. The focus on the sourcing
strategy, demand flow strategy, customer service strategy and supply chain
integration strategy will ensure that the company develops strategies that meet the
needs of the market and integrates with supply chain partners to deliver improved
shareholder value (Gattorna 2000:23).
In order to manage the demand, the various components must be considered and
understood. Taylor (2004:189, 195, 197) stated that the best guide to future sales for
a product with a known sales history is its past performance. Using the techniques of
time-series analysis, standard formulas to analyse a sales history can be applied,
information about recurring patterns can be extracted, and those patterns can be
used to project future sales. If the product’s history shows a more complex pattern, or
if a company would like to forecast sales further into the future than just the following
month, then the full model would have to be used.
Sales history should be analysed into four distinct components, i.e. the level, trend,
seasonal and random component. The level component is a single value that
represents average sales. All other components are variations around this level. The
trend component is a straight line that reflects the overall tendency for sales to
increase or decrease. The seasonal component is a curve that captures the rise and
fall in sales over the course of each year. The random component represents all
other variations in the demand, regardless of cause, and has no systematic pattern
over time. The level, trend and seasonal components are called systematic
components of demand, because they behave consistently over time and can be
predicted.
UUnniivveerrssiittyy ooff PPrreettoorriiaa eettdd –– VVaann ddeerr MMeerrwwee,, TT ((22000066))
57
In order to understand demand history, one needs to evaluate the level, trend,
seasonal and random components of the demand. By understanding the various
components of the demand, a company will be able to develop strategies that meet
the needs of the market and shareholders.
2.13.2 Purpose and rules of forecasting
The business advantage of forecasting is that it eliminates predictable variability from
the future demand stream, allowing for production to be planned much more
precisely (Taylor, 2004: 199).
The purpose of forecasting is not to be one hundred percent correct, since that can
never be achieved. The purpose is to improve the odds of being close to this figure.
More important is the fact that, if there is no formal set of forecasts to drive
operational planning activities, then everyone will develop their own set of forecasts.
Employees will use their individual, independent views of the future for planning. The
absence of formal forecasts to use as a guide will just mean that everyone will have
to develop their own set of forecasts. A formal set of forecasts gets everyone on the
same wavelength, helping to lead to co-ordinated and synchronised operations
(Lapide, 2000:16).
Given that forecasts are, at best, educated guesses about the future, the rules of
forecasts should be considered. Forecasts have three rules according to Ptak and
Schragenheim (2000:47):
• Forecasts are always wrong. Given that the future is subject to many unseen
factors, the only thing that can be counted on with certainty is that the
forecasts will change.
• Forecasts are more wrong farther into the future. Forecasts that attempt to
predict sales or other events from months to years in the future are much less
accurate than those predicting sales for the following week. Taylor (2004: 198)
added that the technical term for the most distant period for which a forecast is
generated, is called a forecast horizon. Given the way the time–series model
UUnniivveerrssiittyy ooff PPrreettoorriiaa eettdd –– VVaann ddeerr MMeerrwwee,, TT ((22000066))
58
works, the forecast horizon can be set as far in the future as one would like.
However, the accuracy of the forecast falls off dramatically as one looks
further out.
• Forecasts are more wrong when more detail is used. Whenever a small
number of samples are used to generate predictions about a larger population,
there is a risk of sampling error, that is, of picking a sample that does not
happen to represent the population as a whole. Taylor (2004:200-201) added
that one of the basic laws of statistics is that the likelihood of sampling error
goes down as the sample size goes up. In addition to aggregating demand
across products, forecasts can aggregate demand across customer type,
geographical region, and other factors. When a forecast is based on large
quantities of data, it is possible to get reliable forecasts down to the level of
weeks or even days. Bonomo (2003:6) also adds that when the demand is
aggregated for different customers and products, trends begin to emerge.
Although the concept of aggregation is very basic, aggregation plays a very
important role in a supply chain. Aggregation of product families can spot a
move to or from a particular technology. Aggregation of customer orders can
provide an early warning signal that customers are decreasing production.
Customer level aggregation can spot a trend even before it is reflected in the
customer forecasts. Aggregation has many advantages and is a powerful tool
in supply chain management. By aggregation demand, a company can identify
key trends in its demand history.
Although forecasts are always wrong, the various rules of forecasts should be
considered to make meaningful conclusions from the information, and the forecast
will at least ensure that everyone within the supply chain is on the same wavelength.
2.13.3 Understanding forecasting error
For many manufacturers, forecasting is still more of an art than a science, because it
needs to blend intelligence from a field with actual past sales to create the most
accurate forecast available (Langenwalter, 2000:67).
UUnniivveerrssiittyy ooff PPrreettoorriiaa eettdd –– VVaann ddeerr MMeerrwwee,, TT ((22000066))
59
The forecast error is the difference between the forecast value and what actually
occurred. In statistics, these forecast errors are called residuals. As long as the
forecast value is within the confidence limit, it is not really an error. However,
common usage refers to the difference between forecast and actual value as an error
(Chase, Aquilano and Jacobs, 2001:447).
Forecast errors can be classified as bias or random. Bias errors occur when a
consistent mistake is made. Sources of bias include failing to include the right
variables, using the wrong relationships among variables, employing the wrong trend
line, mistakenly shifting the seasonal demand from where it normally occurs, and the
existence of some undetected secular trend. Random errors can be defined as those
errors that cannot be explained by the forecast model being used (Chase, Aquilano
and Jacobs, 2001:447).
If one is to improve the forecast accuracy, one must have knowledge of the factors
that contribute to forecast errors. The forecast errors are usually caused by
unanticipated purchasing or production delays, forecast overrides by human input,
insensitivity of the forecast correlation factors, and unanticipated external events that
change the anticipated customer demand beyond expectations and file maintenance
errors (Kobert, 1992:321).
The first rule of forecasting is that forecasts are always wrong. No matter how well
you predict the systematic components of demand; there is always a random
component that cannot be predicted. Improving at forecasting does not mean
eliminating error altogether. Rather, the goal is to make the residual error as small as
possible, while eliminating any bias toward under-or over- predicting the demand.
Two different measures are required to meet this goal, one to monitor the magnitude
of forecasting errors and another to monitor the bias (Taylor, 2004: 250).
Forecasting experts have several good statistics for analysing the magnitude of
forecast errors, but for management purposes the best one is probably the mean
absolute percentage error. This error tells you how many percentage points your
forecast tends to be off the mark, regardless of whether they are too high or too low.
By monitoring the mean absolute percentage error over time, one can see if any
UUnniivveerrssiittyy ooff PPrreettoorriiaa eettdd –– VVaann ddeerr MMeerrwwee,, TT ((22000066))
60
progress is being made in reducing the size of forecast errors. One of the
advantages of using percentages is that the magnitude of forecast error is expressed
in standard units, cancelling out any differences due to the actual sales volumes
(Taylor, 2004: 250-251). Forecast error should be measured along several
dimensions and at different levels. Ultimately, the primary measure of forecast error
should reflect at the SKU and location, for example warehouse or factory level
(Gattorna, 1998:135).
To understand the forecast error results, one must understand the characteristics of
forecast errors. Forecast errors normally have the following characteristics (Jain,
2003: 18):
• The forecast error is lower at an aggregated level, for example, company total,
than at a disaggregated level, for example, category or stock keeping unit
level. When aggregated, the under-forecasts or positive errors are offset by
the over-forecasts or negative errors.
• The forecast error normally increases as the forecast moves further into the
future.
• The demand for all products is not equally predictable, some are easier to
forecast than others. Normally forecasts of non-matured products have larger
errors than non-promoted ones, and forecasts of new products have larger
errors than existing ones.
For monitoring the bias of forecast errors, the tracking signal is a good choice for
managers, because it expresses bias in standard units that do not depend on sales
volume. When there is no bias, the tracking signal is zero. A positive signal means
that most errors have occurred because the demand exceeded the forecast, whereas
a negative signal means that the demand fell below the forecast (Taylor, 2004: 251).
The tracking signal indicates whether the forecast average is keeping pace with any
genuine upward or downward changes in the demand (Chase, Aquilano and Jacobs,
2001:448). It is crucial to look for forecast bias when measuring forecast error. When
forecast bias is present, there is a problem with one or more data inputs, or the
process itself is problematic. Often bias is injected when an organisation attempts to
manipulate the forecast to match a functional goal, such as a sales objective or
manufacturing volume commitment. A high bias will drive increased inventories in
UUnniivveerrssiittyy ooff PPrreettoorriiaa eettdd –– VVaann ddeerr MMeerrwwee,, TT ((22000066))
61
proportion to lead times, while a low bias will hurt product availability and ultimately
also revenues (Gattorna, 1998:135).
A product that is usually over-forecasted is considered to have a positive bias.
Positive forecast bias can normally be observed with products that are in the phase
of declining demand. In any company, products are budgeted and a budget implies
certain optimism. Adjusting a forecast to a realistic level would mean that the
forecaster has acknowledged the fact that the budget will not be reached. The best
way to handle positive bias is to disconnect the financial budget from the operational
forecast used in the supply chain (Petersen, 2004:12-13). In many organisations
there is an incentive for a forecast not to represent the most likely outcome but,
instead, to serve as a self-fulfilling goal. For example, sales personnel may
deliberately provide low forecasts if they are rewarded for exceeding target levels
based on the forecast values (Silver, Pyke and Peterson, 1998:133).
A product that is usually under-forecasted is believed to have a negative bias. A
negative bias is often observed in new and growth- oriented products. The problem
with a negative bias is not that the upward trend cannot be identified, but the
incentive plan is put in place. This plan is based on overachievement, that is, for
having sales over the budget. The incentive encourages sales management to
under-estimate the sales. The solution to negative bias is to disconnect the
operational forecast from the financial budget and to provide an incentive for forecast
accuracy, instead of for overachieving (Petersen, 2004:13).
Forecasters usually set thresholds on forecast measures and they use their
forecasting systems to call attention to forecasts that go out of bounds. Using these
automated thresholds makes it easy to track the progress toward objectives for
improving the forecasting process. It is good practice to keep the mean absolute
percentage error down to single digits, but a tracking signal that is four to six points
away from zero is a cause for concern (Taylor, 2004: 252).
The breakdown of a forecasting method is not always bad. If the forecast error for a
well established product is getting larger and the forecast error is also high, it means
that the demand for the product was static, but is now increasing. One needs to add
UUnniivveerrssiittyy ooff PPrreettoorriiaa eettdd –– VVaann ddeerr MMeerrwwee,, TT ((22000066))
62
a trend component to one’s forecasting model to accommodate the increase (Taylor,
2004: 253).
The magnitude of the forecasting error should be used for risk management in
scheduling production. A product with a higher forecast error needs more safety
stock than a product with a much smaller forecast error (Taylor, 2004: 254).
Jain (2004:2), states that, with the growing competition, it is becoming more
important than ever to improve forecasts in order to cut costs and increase sales.
Under-forecasting causes a loss of sales of regular and companion products. It also
causes an increase in production, procurement and shipment costs. Production and
procurement costs rise, because of unplanned changes in the production schedule.
The shipment cost rises, because products that were under-forecasted have to be
shipped in bits and pieces to meet the unmet demand. The over-forecasted products,
on the other hand, are often transhipped from one distribution centre to another or
from one warehouse to another, to make the sales, which add to the cost. A portion
of the available inventory is sold at a discount. Whatever is not sold may have to be
destroyed. The carrying of the unwanted inventory also adds to the cost, including
the cost of investment in the inventory and warehouse charges. Under- and over-
forecasting both add substantial costs to the supply chain.
In order to improve the forecast accuracy, one must have knowledge of the factors
that contribute to forecast errors. The various measures of forecast error should be
used to understand and decrease the magnitude, bias and costs of forecast error.
2.13.4 Forecast collaboration
Collaborative, cross-functional forecasting is an essential approach for managing
inventory levels and supply and demand on a global scale. Collaborating with
external organisations, for instance, such as retailers and wholesalers, is necessary
for obtaining vital consumer-level demand data. Collaborating internally between
sales and marketing, distribution and production departments – in domestic and
UUnniivveerrssiittyy ooff PPrreettoorriiaa eettdd –– VVaann ddeerr MMeerrwwee,, TT ((22000066))
63
international locations – will enable one-number forecasts to be more accurately
derived (Gattorna, 2000:330).
Taylor (2004:210-213) mentioned that a good way to improve the reliability of
demand forecasts is to have multiple analysts generate forecasts independently and
then combine their results. The problem is to figure out how to integrate the forecasts
in a meaningful way. One solution is simply to average them all together, but it can
be risky. Just as aggregating across seasonal products with different peaks can
mask patterns that are evident in each forecast, but that do not align precisely across
forecasters. A better approach is to try to understand the reasoning behind each
forecast and somehow combine the reasoning, rather than just the numbers.
Combining forecasts to gain consensus is difficult within a single department, but the
problem becomes even more difficult when forecasts are generated by different
departments. Many departments have a stake in predicting demand, including
marketing, sales, production, distribution, finance, and personnel. Unfortunately,
these groups have different perspectives on demand, use different techniques for
predicting it and have different incentives for how high they would like the forecast to
be.
If forecasts across departments are too difficult for most companies, it should be no
surprise that fewer companies integrate forecasts with those of other companies in
the supply chain. Yet the failure to do so is one of the most destructive problems in
supply chain management, because it impairs both the efficiency and effectiveness
of the entire chain.
When one reflects on where demand ultimately comes from, a much better approach
is suggested. When a supply chain is viewed as a whole, there is only one true
source of demand: the consumers of final products. All other demands, for raw
materials, subassemblies, intermediate products, and the like, ultimately derive from
consumers’ purchases. Consumer demand is known as independent demand. All the
purchases made by companies upstream of consumers, depend in some way on
consumer’s choices, so these purchases are called dependent demand. The modern
view of forecasting is that only the independent demand should be forecasted, and
UUnniivveerrssiittyy ooff PPrreettoorriiaa eettdd –– VVaann ddeerr MMeerrwwee,, TT ((22000066))
64
that all other demands should be derived from these forecasts. Gattorna (1998:265)
adds that consumer direct channels allow household purchases to be tracked, but
original demand data that is missed on the day, can be captured as consumers
perform their own substitutions for items not on the shelf.
Taylor (2004:212-213) also added that having each company focus its forecasting
efforts on independent demand does not, in itself, eliminate redundant forecasting. It
is common for manufacturers and retailers to each make their own forecasts of
consumer demand and both types of companies justify the practice by claiming that
they have a better understanding of consumer buying habits. The most powerful
approach is for supply chain partners to collaborate in building a shared forecast,
combining their different perspectives on consumer behaviour, in order to obtain the
most reliable predictions of future sales.
Collaborative forecasting addresses the above- mentioned problems. Firstly,
duplication of effort is eliminated, often reducing the overall forecasting effort by 80
per cent or more. Secondly, there is no cascade of errors up the chain to distort the
demand. The most dramatic benefit, however, is the improvement of forecasting
accuracy that results from sharing knowledge about consumer behaviour. There are
sales patterns that manufacturers can see that distributors and retailers cannot, but
there are other aspects of consumer behaviour that can only be observed close up.
When supply chain partners combine their unique perspectives to improve their
understanding of independent demand, they can do a much better job of anticipating
the needs of the consumers who keep the chain in business.
Supply chain partners should collaborate to build a shared forecast, in order to obtain
the most reliable predictions of future sales.
2.13.5 Forecast process performance management
Most companies have no idea as to how effectively they forecast. Commonly used
metrics, such as mean absolute percentage error, show the ultimate result of the
forecasting process, but give no indication of how efficient the organisation was in
UUnniivveerrssiittyy ooff PPrreettoorriiaa eettdd –– VVaann ddeerr MMeerrwwee,, TT ((22000066))
65
achieving a specific level of forecast accuracy. Metrics, such as mean absolute
percentage error, by itself does not tell the organisation whether other methods
would have been equally or more accurate, with less management effort (Gilliland,
2003:9).
Due to personal biases, company politics, and the lack of training and tools, many
management efforts fail to improve the forecast, but even make it worse. The
traditional approach to forecast performance measurement misses a potential source
of significant process improvement, by failing to consider the “forecast value added”
by each of the participants in the forecasting process (Gilliland, 2003:9).
Measurement of individual team members is critical to counteracting structural
incentives to bias the forecast and to ensure an appropriate level of attention from
them all (Gattorna, 1998:135).
The forecast value added analysis should be applied to each step and each
participant in the process by comparing the forecast output of each step and each
participant. For example, the naïve moving average forecast should be compared
with the statistical forecast, perhaps a sophisticated triple exponential smoothing or
regression model. The statistical forecast can be compared to the sales force rollup,
the marketing override, the forecaster’s override, the consensus forecast, or the
management approved forecast. Similarly, a forecast based on point-of-sale data
could be compared to the forecast based on orders or shipments. By evaluating the
ultimate forecast performance, for example, mean absolute percentage error, at each
stage, we can identify what helps, and what is simply a waste of effort (Gilliland,
2003:9).
Eliminating the non-value adding steps and participants will help to make the
forecasting process more efficient, achieving results with fewer organisational
resources. Identifying and eliminating those steps and participants that actually make
the forecast worse, will also improve the forecast accuracy, again with fewer
organisational resources (Gilliland, 2003:9).
Looking purely at the traditional forecasting metrics as the end result of the
forecasting process, can create the wrong impression. Typical responses that create
UUnniivveerrssiittyy ooff PPrreettoorriiaa eettdd –– VVaann ddeerr MMeerrwwee,, TT ((22000066))
66
misconception are hiring more analysts, engaging more participants in the process
and implementing more sophisticated forecasting software. In fact, it is more likely
that forecast results can be improved by doing less (Gilliland, 2003:9).
Companies should realise that the aim is not to foretell the future, but rather to set up
better procedures that will allow the company to react quickly to forecast errors as
soon as their magnitude has been determined. It is at least equally as important, to
develop techniques for responding to forecast errors as it is to try to measure and
predict them (Silver, Pyke and Peterson, 1998:133-134).
In order to improve demand forecast accuracy, one should also measure the
effectiveness of the forecast process and not just the ultimate result of the
forecasting process.
2.13.6 Relationship between forecast error and response lead time
The reason why so much logistics activity is forecast-dependent is the long lead-time.
The longer the lead-time, the further ahead must be forecasted. Lead times refer to
the time taken to respond to an upward or a downward change in the demand. If
there are long replenishment lead times for raw materials or packaging suppliers, for
example, a company will be forced to try to forecast the demand over the lead time
(Christopher, 2003:75-76). Sales and marketing are thus required to forecast
requirements in line with the lead-time. Because of the rapidly changing marketplace,
companies regularly suffer from the twin difficulties of excessive slow moving stock
and an inability to serve customers with the items they really want. Companies
normally hold higher levels of safety stock to meet customer service goals
Christopher, 1998:165-166).
Forecast error increases as the amount of time in the future increases. The longer
the lead-time, the greater the opportunity for unanticipated events. One obvious way
of reducing the forecast error is to reduce the amount of time in the future being
forecast. For manufacturers, this means reducing the time required to make and ship
UUnniivveerrssiittyy ooff PPrreettoorriiaa eettdd –– VVaann ddeerr MMeerrwwee,, TT ((22000066))
67
customer orders. The ideal manufacturing lead-time for finished goods is one that is
shorter than the response time that customers require (Langenwalter, 2000:70-76).
The concept of velocity, which is the total lead-time divided by the total value added
time, is critical. A company with a velocity greater than 2 is being forced by its own
internal practices to forecast much farther into the future than it should have to. The
costs of forecasting incorrectly include high inventory, low customer service and high
administrative costs such as expediting, changing priorities in production with
suppliers and making excuses to customers for poor performance (Langenwalter,
2000:73).
Increasing visibility into customer demand effectively increases customer lead times
for the manufacturer. Many customers are willing to help their suppliers, realising that
both parties will reduce cost and therefore increase profits (Langenwalter, 2000:73-
74).
If the customer and the manufacturer can synchronise their material flow using
Repetitive, Lean, Flow and Just-in-Time approaches, the synchronised schedule
could radically reduce the actual lead time to the customer, which benefits the
customer greatly, while also eliminating the need for the manufacturer to forecast,
which in turn benefits the manufacturer (Langenwalter, 2000:76).
One way of reducing the forecast error is to reduce the lead-time and thus the
required forecast horizon. The shorter the response lead times, the higher the
forecast accuracy.
2.13.7 Types of forecasting
Forecasting can be classified into four basic types: qualitative, time series analysis,
causal relationships and simulation. Qualitative techniques are subjective or
judgemental and are based on estimates and opinions. Time- series analysis is
based on the idea that data relating to a past demand can be used to predict a future
demand. Past data might include several components of demand, such as trend,
seasonal, or cyclical influences. Causal forecasting, for example linear regression
UUnniivveerrssiittyy ooff PPrreettoorriiaa eettdd –– VVaann ddeerr MMeerrwwee,, TT ((22000066))
68
techniques, assumes that demand is related to some underlying factor or factors in
the environment. Simulation models allow the forecaster to run through a range of
assumptions about the condition of the forecast (Chase, Aquilano and Jacobs,
2001:436). Causal forecasting is a crucial part of the forecasting process, for
example, regression analysis is regarded as the key to developing an accurate
forecast (Catron, 2000:12).
Taylor (2004:199), states that in the past, when forecasting was done by hand, the
more common practice was static forecasting, by which a forecast was generated
and then used as is through the forecast horizon. A company could increase the
accuracy of its forecasts substantially by updating them continuously based on
current sales, a technique known as dynamic forecasting. Some companies, for
example, use daily sales and operational forecasts according to Catron (2000:15).
The daily operational forecast is used to balance the demand and the supply each
day of the year. If the daily operational forecast is too low, supplies may not be
adequate and an exposure to penalties exists. If the daily operational forecast is too
high, unnecessary operational action may be taken. The forecasting process is
important. A good process will ensure consistency between types of forecasts, and
will, in time, identify and reduce the uncertainties of the forecast.
2.13.8 Constrained versus unconstrained forecast
Gilliland, (2003:8-9) stated that an operational definition of demand leads directly to
the topic of what a company should be forecasting. The supply chain should be
driven by a forecast of future demand, but one has to be careful. It is important to
distinguish between unconstrained demand and the demand we actually expect to
fulfil, subject to the supply- side constraints.
The supply- side of an organisation needs transparency as far as unconstrained
customer demand is concerned. However, once constraints are identified, it is proper
to issue a shipment forecast. When a shortage is anticipated, the customers should
be contacted and, whenever possible, their demand redirected to a future date, i.e. to
a date when the demand can be filled, or to alternative products. It is a failure for
UUnniivveerrssiittyy ooff PPrreettoorriiaa eettdd –– VVaann ddeerr MMeerrwwee,, TT ((22000066))
69
sales management to accept orders, which they know in advance, cannot be filled.
Forecasting performance should not include orders that cannot be filled. The proper
organisational response to supply constraints is to redirect customer demand to
alternative products or time frames. Orders that we know in advance cannot be filled,
should not be processed. Orders are not a reliable component of performance metric
calculations.
A company should be able to distinguish between the constrained and unconstrained
demand. Where constraints for the demand exist, a company must constrain the
unconstrained forecast.
2.13.9 Forecast models versus forecast judgment
Forecasts generated from mathematically complex models do not guarantee higher
degrees of accuracy. The method used should, instead, focus on what makes sense
for the business and provide an unbiased answer for the data being looked at. In
other words, a method that relies on mathematical and business reasoning should be
used. Forecasts generated in this manner provide useful statistical baselines. After
statistical forecasts have been generated, conjecture and special information should
be added to the baseline forecasts to further enhance the forecast accuracy
(Johnson, 2002:8).
Statistical forecasting is superior to judgemental forecasts in two ways: Firstly,
statistical techniques can consider far more data than a human forecaster. Secondly,
statistical techniques do not suffer from human biases, inattention to detail and
imprecision. Perhaps the greatest advantage of statistical forecasts is that they allow
human forecasters to be much more effective by focussing their attention on only a
subset of Stock Keeping Units (Gattorna, 1998:130).
It is important to adjust or clean the data used for forecasting models. Adjustments
should be made for mistakes and changes should be made for definitions, missing
values and inflation. An up- to- date log should be kept of any adjustments to
records. The result of adjusted data is an improvement in forecast accuracy
(Armstrong, 2001:9). Data is the lifeblood of any company. The individuals who
UUnniivveerrssiittyy ooff PPrreettoorriiaa eettdd –– VVaann ddeerr MMeerrwwee,, TT ((22000066))
70
manage data should make sure they understand the need for the data to be clean
and accurate (Berger & Gattorna, 2001:162).
The forecast methods used should also be kept simple. Complex methods may
include errors that transmit through the system or mistakes that are difficult to detect.
Simple forecast methods should be used, unless a company can clearly demonstrate
that complexity should be added (Armstrong, 2001:14).
While knowledge of statistical forecasting techniques and quantitative methods is of
the many characteristics necessary to be successful in demand forecasting, it is not
at all the most important factor. More important for successful forecasting, are good
communication skills, some sense of numbers, and an in-depth understanding of the
business. For an efficient planning process, forecasters need to interact with others
to get a good understanding of what is going on and they need to articulate the basic
assumptions that underlie each set of forecasts. In essence, putting a bunch of
quantitative forecasters in a room with computers to generate forecast numbers, can
only lead to plans that are mechanically-driven by historical data, with no real basis of
what drove the demand in the past; and therefore, no sense of what might impact on
the demand in the future (Lapide, 2000:16-17).
There are a number of factors, normally not included in a statistical forecasting
model, where judgement input is clearly needed. These factors can be internal or
external to the organisation, for example competitor actions, consumer preferences,
price changes, promotions, introduction of substitute products and the pipeline filling
effect associated with the introduction of a new product (Silver, Pyke and Peterson,
1998:124).
Statistical models and judgement can add value to the forecasting process. A healthy
balance between statistical models and judgement should result in higher forecast
accuracy.
UUnniivveerrssiittyy ooff PPrreettoorriiaa eettdd –– VVaann ddeerr MMeerrwwee,, TT ((22000066))
71
2.13.10 Forecasting software versus forecasting processes
Lapide (2000:17), states that while there is no question that forecasting software
helps in producing a good set of forecasts, this is insufficient in itself. For example
software, which is no different from any other software, needs to support a business
process. Many companies are following the best practice of implementing a Sales
and Operational Planning process to ensure that proper cross-functional inputs are
brought into the process. A forecast system that is not part of a Sales and
Operational Planning process will not ensure an accurate, collaborative, and census-
driven forecast. Generally, software is never the only answer, as it always needs to
be aligned to a good business process.
According to Ptak and Schragenheim (2000:134), the answer to good forecasts
cannot merely be attributed to a more expensive forecasting system. Good useable
forecasts result from hard work, timely review, and updates from the appropriate
people using computer input, judgement, and software support. The combination of a
good forecast process with a good forecast system can deliver better results.
2.13.11 One-plan mentality
The mission of supply chain management is to create a ‘one-plan’ mentality within
the business, which seeks to replace the conventional stand-alone and separate
plans of marketing, distribution, production and procurement. Supply chain
management is therefore an integrative concept that seeks to develop a system-wide
view of the firm (Christopher, 1998:14). The same plans must be used for all
functions: sales forecasting, production planning and financial planning. Where an
integrated planning process is not followed, the results will include inventories that
will go out of balance, because the wrong products are produced and sales and profit
forecasts can become unreliable (Byron, 1999:24).
In order to develop a consensus forecast or one- number forecast, it is important that
the forecaster remains neutral and unbiased throughout the forecasting process
UUnniivveerrssiittyy ooff PPrreettoorriiaa eettdd –– VVaann ddeerr MMeerrwwee,, TT ((22000066))
72
(Fosnaught, 1999:3). The forecaster should avoid data collected by persons or
organisations that are obviously biased to particular viewpoints, perhaps because
they are rewarded for certain outcomes. To analyse crime rates, for example, victim
surveys would be preferable to police records. Biases should be identified before
analysing the data, especially when people are emotional about the outcomes
(Armstrong, 2001:6).
Although the aim is to create a ‘one-plan’ forecast, companies must recognise the
difference between operational sales forecasts, sales budgets and goals. These
planning numbers could differ throughout the fiscal year. However, when they do
differ, it is important to use the information as a signal to take corrective action, and
not to avoid conflict. Whenever warranted, operational forecasters will have to be
brave enough to change forecast numbers to reflect reality, in lieu of unrealistic goal
and budget-based numbers. While this will get them involved in a lot of organisational
frays, they will be helping their companies stay on a profitable track by following
realistic plans (Lapide, 2003:20).
Although the aim is a one-plan mentality, the forecast must be realistic and corrective
action should be implemented where necessary.
2.13.12 Evangelical forecasting
Gilliland (2003:12-13,17), states that, while an organisation’s forecast should
represent an unbiased best guess at what really is going to happen, the forecast is
more often an expression of the organisation’s targets or wishes. The most
significant forecasting mistake an organisation can make is to build plans around
what it wants to see happen, rather than what it really believes will happen.
Forecasting is thus simply an exercise to make the numbers match some
predetermined financial objective.
The main purpose of a forecast is to drive the supply chain. The financial version of
the forecast that is used for financial planning, analysis and reporting should be
derived from the supply chain forecast. Evangelical forecasting is an approach where
UUnniivveerrssiittyy ooff PPrreettoorriiaa eettdd –– VVaann ddeerr MMeerrwwee,, TT ((22000066))
73
the forecast comes from senior management. The advantages of evangelical
forecasting are that it is quite simple and the company does not need a cumbersome
consensus or sales and operational planning process to get everyone to agree upon
a forecast number. The evangelical approach can be demoralising for the forecasting
department, when all the thoughtful modelling and analyses are overwritten by
executive decree. The management targets or wishes should not be confused with
the unbiased best estimate of what the demand is really going to be. The worst
impact of evangelical forecasting, or forecast derived from financial directives rather
than by realities of the marketplace, is that the supply chain is given the wrong signal.
Another solution to evangelical forecasting, in the short term, could be to build
multiple forecasts. The operational forecast could be used to predict production
requirements based on the product demand. The evangelical forecast could be used
for the financial forecast. Although the two forecasts are separate, a company should
aspire to merge them into one as soon as possible (Wall, 2002:15). Although multiple
forecasts will not create a one-plan mentality in the short term, it will improve the use
of forecasts by reducing the forecast bias. Forecasts should be independent of
politics (Armstrong, 2001:2).
Another alternative for less biased forecasts is to use quantitative forecast methods,
rather than qualitative methods. Quantitative methods tend to be less biased, and
they make more efficient use of data (Armstrong, 2001:12).
A company should aim to have one forecast plan based on realistic expectations and
not just the financial expectations of top management. The one agreed upon and the
realistic forecast should be used to drive the supply chain.
2.13.13 Legal aspects of forecasting
Armstrong (2001:41-42) mentioned that the primary purposes of following forecasting
standards and practices, is to help forecasters to improve forecast accuracy, to better
access uncertainty, and to help decision- makers to use the forecasts properly. They
could also protect the forecast.
UUnniivveerrssiittyy ooff PPrreettoorriiaa eettdd –– VVaann ddeerr MMeerrwwee,, TT ((22000066))
74
No- one has successfully sued a forecaster for making an incorrect forecast.
However, some have successfully sued forecasters by showing that they did not
adhere to the best practice. In a British case, Esso Petroleum vs. Mardon (London,
1996 E. no. 2571), Mardon contracted Esso to own and operate a gas station. A
critical part of the negotiations was Esso’s forecast that the station would sell 200
000 gallons of gas annually by the third year. Actual sales fell well short of the
forecasted figure, and Mardon went out of business. Esso sued Mardon for unpaid
bills. Mardon then counter- sued on the basis that the forecast misrepresented the
situation. Esso had originally forecast the 200 000 gallon figure with the assumption
that the gas pumps would face the road. After a zoning hearing, Esso had to change
the station’s design so that the pumps were not visible from the road. Despite this
unfavourable change, Esso still used the original 200 000 gallon forecast in drawing
up its contract with Mardon. Mardon won and the court concluded that Esso had
misrepresented the facts in this situation.
This court case implied that if a company does not have a policy to provide forecasts,
it is unlikely to be held liable. Furthermore, the courts recognise that forecasts involve
uncertainty and making reasonable attempts to balance costs and benefits should
provide forecasters with protection against lawsuits. Finally, forecasters could be held
liable if it can be shown that they did not use reasonable practices to obtain
forecasts, or if they intentionally used poor practices to bias the forecasts.
2.13.14 Demand planning versus demand management
Gattorna (1998:139) indicates that the term demand management is not new to
supply chain practitioners. It is often used interchangeably with demand planning to
account for activities such as forecasting, production planning, inventory
management and deployment. But important differences exist between demand
planning and demand management.
In a broad sense, demand planning includes the processes that an organisation
takes to anticipate customer demand and ensure sufficient product is available - in
UUnniivveerrssiittyy ooff PPrreettoorriiaa eettdd –– VVaann ddeerr MMeerrwwee,, TT ((22000066))
75
the right place, at the right time, to the required level of service and at the lowest
possible supply chain cost. Demand planning, therefore, includes such activities as
demand forecasting, inventory management, capacity management, production
planning and scheduling and material requirements planning.
Demand-planning processes have developed rapidly over the last ten years. For
example, just-in-time (JIT) was developed to reduce the lead times through smaller
batch-size production to satisfy customer demand more effectively. Quick response
(QR) takes just-in-time further and applies the principles to the retail industry.
Efficient consumer response (ECR) was developed as an industry-wide demand-
planning vision, linking all members by integrating four key strategies: efficient store
assortments, efficient replenishment, efficient promotions and efficient new product
introductions.
All these demand planning approaches are useful in that they take time and cost out
of supply chains. However, they make one key assumption: the customer demand
and the volatility of that demand is a given input into the demand-planning process.
Demand management, by contrast, actively seeks to ensure that the customer
demand profile that is the input into the demand planning process is as smooth as
possible as a means to simplify supply chain operations. It does so by reducing or
eliminating the volatility of customer demand prior to input into the demand planning
process.
Demand management may be defined as the identification, reduction and
elimination, where possible, of the causes of customer demand volatility, with the
objective of providing a smooth demand signal to increase supply chain visibility,
planning accuracy and reducing total supply chain cost. Consequently, where
demand planning is reactive to customer demand, demand management is proactive
to customer demand.
Ineffective demand management practices manifest themselves as volatile customer
demand and can have serious effects on the business and supply chain
UUnniivveerrssiittyy ooff PPrreettoorriiaa eettdd –– VVaann ddeerr MMeerrwwee,, TT ((22000066))
76
performance. Servicing the excessive peaks and thoughts of this volatile customer
demand increases the cost and complexity of business operations.
2.14 Supply management
2.14.1 Streamlining replenishment
There has been a growing recognition of the critical role that procurement plays in
creating and sustaining competitive advantage as part of an integrated logistics
process. Leading- edge organisations now routinely include supply- side issues in the
development of their strategic plans. Not only does the cost of purchased materials
and supplies play a significant role as part of the total costs in most organisations,
but there is a major opportunity for leveraging the capabilities and competencies of
suppliers, through closer integration of the buyers’ and suppliers’ logistics processes.
Taylor (2004:167) adds that, like the customer order fulfilment process, the
replenishment process has become increasingly complex over the years, producing
corresponding increases in the time, cost and errors associated with the process.
These problems, in turn, often lead people within a company to try to beat the system
by speeding up their own orders, usually at the expense of other orders that may be
equally urgent. In addition to slowing down the replenishment process as a whole,
these expediting battles lead to extra work and may also incur surcharges for rush
orders.
The solution to the replenishment process, as in the case of the customer order
fulfilment process, is not to bypass the fulfilment system, but to improve it, and
radical change in the replenishment system may produce better results than attempts
at incremental refinement. In general, the further upstream a company can push the
demand changes, the more likely it will be to remove the time and cost from the
chain, as opposed to just pushing it around within the supply chain.
UUnniivveerrssiittyy ooff PPrreettoorriiaa eettdd –– VVaann ddeerr MMeerrwwee,, TT ((22000066))
77
2.14.2 Replenishment process
Taylor (2004: 156-159) indicates that each time a facility fulfils an order, it reduces its
inventory of finished goods. Sooner or later, the inventory has to be replenished.
Replenishment policies answer three questions: When should the inventory be
replenished, what quantity should be ordered with each replenishment cycle, and
how much inventory should be maintained on site.
There are several ways in which a company can decide when to replenish the
inventory. The monitoring of the inventory can be done using one of two forms, called
periodic review and continuous review. With a periodic review policy, the inventory is
counted at fixed intervals and an order is placed whenever the count falls below a
preset re-order point. When a continuous review policy is used, the count is
monitored at all times and an order is placed as soon as the count hits the re-order
point. Periodic review requires more inventory than continuous review.
The ability to switch from periodic to continuous review is a good example of how
information can replace the inventory, producing substantial savings. Given the
escalating cost of the inventory, it is usually cheaper to hold a stock count than to
hold the inventory (Taylor, 2004:159). Continuous inventory review can produce
substantial savings for a supply chain.
2.14.3 Determining replenishment order quantity
According to Taylor (2004: 159-160), the preceding section answered the question of
when to replenish the inventory, and the order quantity section covers the question of
what quantity should be ordered with each replenishment. The quantity hinges on the
relative cost of placing an order and receiving an order. This is referred to as the
order cost and it is independent of the quantities involved. The holding or carrying
cost is the cost of stockpiling inventory in advance of consuming it. The holding cost
includes the costs of storage and handling, the opportunity cost of capital tied up in
the inventory, the loss of value due to obsolescence or spoilage, and the cost of
insuring against risks such as fire and theft.
UUnniivveerrssiittyy ooff PPrreettoorriiaa eettdd –– VVaann ddeerr MMeerrwwee,, TT ((22000066))
78
The order cost and holding cost tend to push the order quantity in opposite
directions. Increasing order quantities reduce the order costs, because fewer orders
are required to buy a given amount of inventory, but it also pushes up holding costs
by increasing average inventory levels. On the other hand, ordering in smaller
quantities reduces holding costs at the expense of order costs. Finding some sort of
balance between the two is important, because neither cost is trivial.
The economic order quantity model tries to find a balance between the order cost
and the holding cost. This model was developed more than 80 years ago. However,
its usefulness has been questioned. It does not take into account fluctuations in
demand, incentives for buying inventory in advance of need, and the effects of
requesting multiple products on a single order. An important disadvantage of this
model is that it overlooks higher level opportunities for reducing costs, such as
simplifying the order process or eliminating orders altogether (Taylor, 2004: 160-
161).
The major reason why the economic order quantity model is used less frequently
today, is that assumptions used to calculate the economic order quantity are too
unrealistic to help plan the inventory in dynamic environments (Gattorna, 1998:385).
The assumptions for calculating the economic order quantity are the following:
• The demand rate is known, constant and continuous;
• The lead time or replenishment time is known and constant;
• The entire lot size is added to the inventory at the same time;
• No stock outs are permitted – since demand and lead times are known, stock
outs can be avoided;
• The cost structure is fixed – order/set-up costs are the same regardless of lot
size, holding cost is a linear function based on average inventory and unit
purchase cost is constant, assuming no quantity discounts;
• There is sufficient space, capacity and capital to procure the desired quantity;
and
• The item is a single product – it does not interact with any other inventory
items, thus there are no joint orders.
UUnniivveerrssiittyy ooff PPrreettoorriiaa eettdd –– VVaann ddeerr MMeerrwwee,, TT ((22000066))
79
In the absence of a more comprehensive plan, the economic order quantity model
gives a quick and reasonably good answer for the recommended replenishment
quantity (Taylor, 2004: 161).
2.14.4 Correlation between customer service level and inventory levels
According to Taylor (2004: 161-162, 164-165), the two preceding sections dealt with
the question of when to replenish the inventory and how much to buy. The next
section tackles the third question of how much inventory a facility should maintain on
site.
The standard solution is to hold the excess inventory, called safety stock, to avoid
stock outs when the demand is greater than expected or when supplies arrive late. A
company needs to maintain enough inventories to support its normal operations
called cycle stock, plus enough safety stock to protect against variations in supply
and demand.
Given that stock outs cannot be eliminated altogether, the best method to follow as
far as safety stock is concerned would be to reduce stock outs to an acceptable level.
The standard procedure is to set a target level for product availability, called the
customer service level, and then to adjust the safety stock to meet this level.
Naturally, higher customer service levels are better, but setting them too high can be
very expensive, because safety stock rises exponentially with the service level. For
example, a simple increase of half a percentage point of customer service level from
97.5 % to 98% requires holding nearly three times the safety stock. A small
improvement in customer service can be very costly given the high costs of holding
the inventory.
Taylor (2004:165) also adds that the customer order complexity is closely correlated
with the customer service level. Customer service level is the ability to fill orders for a
single product from stock, often called the item fill rate. Customers normally order
more than one product on one order. Although multi-line orders reduce the cost of
UUnniivveerrssiittyy ooff PPrreettoorriiaa eettdd –– VVaann ddeerr MMeerrwwee,, TT ((22000066))
80
order processing on both sides of the transaction, it makes it harder for suppliers to
fill orders, because the probability of filling an entire order, called the order fill rate, is
the result of the item fill rates for all the items on the order. As the number of items on
the order increases, the order fill rate decreases dramatically. The more complex the
customer order, the more inventories are required.
Companies are now using innovative techniques to achieve, simultaneously, the
conflicting goals of higher customer satisfaction and lower inventory investment.
Traditionally this was a goal thought to be impossible; however, the goal can be
attained by evaluating and improving internal processes (Gattorna, 1998:383).
2.14.5 Limitations of material requirements planning
Companies that face chaos, because of many items with a complex bill of materials,
can benefit from the control and order provided by Material Requirements Planning.
When the demand shows significant seasonality, or when the demand surges or
declines, Material Requirements Planning could be put into operation so that by
planning ahead clear benefits may be provided (Silver, Pyke and Peterson,
1998:617).
Nevertheless, Material Requirements Planning has some significant drawbacks that
should be considered (Silver, Pyke and Peterson, 1998:616-618). These major
drawbacks are the following:
• Long and fixed lead times. The lead-time given by users for each component and
part is fixed. Due to expediting and priority changes, lead times could change, as
a result of the time of year. The end of the month, in most manufacturing
companies, results in shorter than expected manufacturing lead-times, as parts
are expedited to completion to achieve monthly revenue targets (Ptak and
Schragenheim, 2000:150). The most common solution to variable lead-time is to
inflate the lead-time so that orders are rarely delivered late. This implies, of
course, that orders are often delivered early, which increases work-in-process
and finished goods inventory.
UUnniivveerrssiittyy ooff PPrreettoorriiaa eettdd –– VVaann ddeerr MMeerrwwee,, TT ((22000066))
81
• High lot sizes. Multi-item and multilevel lot sizing can normally not be handled
by Material Requirements Planning. Lot size rules normally support simple
rules such as economic order quantity.
• High safety stock. Material Requirements Planning cannot handle complex
safety stock calculations. Users may protect against costly stock outs by
unnecessarily inflating safety stock levels.
• Little incentives for improvements. Because of the significant effort required to
gather and capture input data, such as safety stock, lot sizes and lead times,
users are reluctant to make regular changes to the values.
• Inconsistent data. If the data is not accurate, the Material Requirements
Planning schedules will also not be accurate.
• A large amount of data maintenance is required for product changes. A
product is often changed in small ways once it is in production. The added
burden of accounting for design changes is often neglected.
• High data input. The data input personnel have the challenge that every
change must be recorded in Material Requirements Planning, and every
product must be added to the system.
• High data output. Handling the large amounts of data can be a significant task.
Enterprise Resources Planning systems provide information only by
exception, instead of struggling through an enormous pile of information (Ptak
and Schragenheim, 2000:151).
• Completed work not immediately recognised. Material Requirements Planning
does not recognise completed work, until an inventory transaction is made.
• Some implementations are complex, for example implementing a closed-loop
Material Requirements Planning project is a complex task.
• Material Requirements Planning is not applicable to all situations. It applies
well in situations of multiple items with complex bills of materials. However, it
does not apply well in situations with relatively simple bills of materials and
tightly linked stages of production.
• Material Requirements Planning assumes infinite capacity, which means that
internal constraints do not exist. In the most cases, there are bottlenecks or
constraints, which must be taken into account (Goldratt, 1990:70). Material
Requirements Planning also assumes that the transfer batch is equal to the
UUnniivveerrssiittyy ooff PPrreettoorriiaa eettdd –– VVaann ddeerr MMeerrwwee,, TT ((22000066))
82
process batch (Goldratt, 1990:72). A company should strive to maximise the
process batches in the bottlenecks, while at the same time using small
transfer batches everywhere, including through the bottlenecks, as small
transfer batches do not have any impact on the set-up (Goldratt, 1990:52).
One also needs to understand the difference between the backward and forward
scheduling systems. A scheduling system, like Materials Resource Planning, is called
a “push” system, in which the demand to produce and procure parts, components
and assemblies is pushed through by scheduled dates for “start in production” or
“place order with supplier”. The “begin” dates are calculated backwards from the
required receipt dates estimated for completion of the departmental production
schedule or the on-site receipt of a purchased item. By contrast, Just-in-Time is a
“pull” system, in which the authority to re-supply, by either scheduled production or
authorised procurement, comes from the needs of the forthcoming operations.
Forecasted lead times for replenishment determines the dates for initiating a
production work order or a purchase request (Kobert, 1992:161).
Material Requirements Planning can assist a company in handling complex bills of
materials. However, the limitations of this system should then also be considered.
2.14.6 Master production schedule- to freeze or not to freeze
The master production schedule normally has a long lead-time, determined by the
cumulative lead-time to purchase raw materials and to process them into
components. The longest of these cumulative lead times is the minimum planning
horizon for the master production schedule (Silver, Pyke and Peterson, 1998:541).
To prevent extreme instability of production plans, organisations often use the
concept of time fences. These fences freeze the master production schedule for the
given time periods, helping to resolve conflict between sales and manufacturing
(Silver, Pyke and Peterson, 1998:542).
UUnniivveerrssiittyy ooff PPrreettoorriiaa eettdd –– VVaann ddeerr MMeerrwwee,, TT ((22000066))
83
Throughout the network of each manufacturer and his supplier factories, production
schedule changes are perhaps the most disruptive factor (Harmon & Peterson,
1990:215).
For decades manufacturers have tried to freeze the production schedule, but not
allowing for any changes to the final assembly schedule on which all components
and material schedules are based. Most attempts to freeze the production schedule
are relatively unsuccessful, and encounter the following problems (Harmon &
Peterson, 1990:215):
• The lead times of the factory and its suppliers are too long to freeze
production schedules for all, or even a major portion of the supply chain.
Customers expect to be able to change their scheduled order receipt dates
and to place new orders with a much shorter response time.
• All of the demand is ultimately driven by the marketplace. Successful
manufacturers must be able to supply surprise surges in the demand, while
avoiding build-ups of surplus inventory when the demand slumps. Success
demands rapid response to the market, and not following an unrealistic
production schedule.
• Productions schedules, whether frozen or not, are unrealistic. Scheduled
production is impossible to achieve without available capacity, materials, and
components. When production schedules are frozen unrealistically, they
become meaningless.
Exceptional swings of market demand will always occur, and the superior
manufacturer must be prepared to take exceptional action in response. Thus, the
master production should be neither liquid nor frozen, but slushy (Harmon &
Peterson, 1990:216).
The master production plan should be dynamic and flexible since business itself
changes constantly (Harmon & Peterson, 1990:216). Examples of changes include
the following:
• New products are developed and added to the product lines. Existing products
are changed or dropped.
UUnniivveerrssiittyy ooff PPrreettoorriiaa eettdd –– VVaann ddeerr MMeerrwwee,, TT ((22000066))
84
• Product lines are added as a result of acquisitions or dropped because of
divestitures.
• Processes are altered to reflect product changes and to process
improvements.
• Processes are added and eliminated as a result of changes in make or buy
decisions.
• Sales volumes change over time.
The forecast drives the production. If the forecast is frozen to changes, production
will be wrong (Riehm and Stephen, 1999:16). By not freezing the forecast and
allowing all available information to be included, the production planner has better
data to use when scheduling production. Altering the forecast, even without being
able to change the production, provides better information for future planning (Riehm
and Stephen, 1999:17). It is better if the forecast is not frozen. If all the available
information could be utilised, or if updates could be provided as soon as
circumstances have changed, then inventories could be better managed, and
ultimately, the customer could be better served (Riehm and Stephen, 1999:18).
In order to adapt to the best up-date demand forecast, the master production
schedule should be flexible to accommodate changes.
2.15 Supply cha in except ions
Exceptions in the supply chain represent very large opportunity costs for companies.
The most common causes of exceptions germinating from suppliers include changes
to lead times, allocation of products that are facing high demand, form-fit-function
changes to parts and product obsolescence (Woermer, 2001).
Perhaps the greatest cause of supply chain exceptions is inaccurate forecasting. A
survey done by Industry Directions Inc. indicates that less than 20% of companies
forecast with an accuracy greater than 90%. Most companies surveyed had less than
90% accuracy and a significant number were not tracking forecast accuracy
(Woermer, 2001).
UUnniivveerrssiittyy ooff PPrreettoorriiaa eettdd –– VVaann ddeerr MMeerrwwee,, TT ((22000066))
85
Of the most recent and exciting developments is the emergence of supply chain
visibility applications, which track the movement of the inventory as it flows
throughout the chain, providing graphical displays of expected and actual inventory
levels at each location. Supply chain event management software allows the
business to define rules that trigger when specific events occur or fail to occur. The
event management software allows the supply chain managers to focus their
attention to managing exceptions, rather than having to personally monitor every
movement and compare it to a plan (Taylor, 2004:119-120).
The forecasting frequencies, whether daily, weekly, monthly or yearly, are not as
important as the ability to adapt and change the process, based on significant,
unplanned events that occur. There are countless alerts that may trigger the need to
adjust the forecasts for a particular product. The ability to react to these demand
change triggers in a timely manner has a dramatic impact on the quality of the
forecasts and the performance of the inventory. Early detection and quick responses
to many types of risk are therefore essential to supply chain management (Bonomo,
2003:8).
Many companies focus resources on optimizing processes when things go as
planned, but often do not have a well-defined process in place or the tools to manage
situations when things go wrong. The first step in managing these costly exceptions
is to provide a standard and repeatable process when looking outside your normal
supply chain partners to correct over-buys or under-buys (Woerner, 2001).
The increasing complexity and the pace of change have a dramatic impact on how
successfully companies operate. Achieving a competitive edge demands a fresh
approach to both strategy formulation and execution (Gattorna, 1998: 8).
The true test of an inventory management system is not merely in the planning and
forecast stage, but also in the ability to re-plan and react. The ability to re-plan and
react is the essence of management control. The “fire prevention” system will make
“fire fighting” an exception- based activity (Kobert, 1992:165-166). A company should
try to minimise supply chain exceptions, in order to reduce costs dramatically.
UUnniivveerrssiittyy ooff PPrreettoorriiaa eettdd –– VVaann ddeerr MMeerrwwee,, TT ((22000066))
86
2.16 Rela t ionship between supply and demand
The importance of integrating demand and supply planning should not be
underestimated. This integration is regarded as one of the seven principles of supply
chain management (Berger & Gattorna, 2001: xiii).
There is an interdependent relationship between supply and demand. The demand
defines the supply chain target, while the supply-side capabilities support, shape and
sustain demand (Gattorna, 1998:92).
To achieve state-of-the market supply chain management, companies need to focus
on more than just supply-side efficiencies. They also need to integrate their demand
and supply regimes to build a platform for achieving competitive advantage
(Gattorna, 1998:92).
2.17 Conclus ion
This chapter describes the importance and dynamics of supply chain management,
which are no longer a matter for the operational and functional areas of the firm.
Today supply chain management is a strategic issue, demanding top-level
management attention. Indeed, the quality of a firm’s supply chain performance can
mean the difference between business prosperity and failure (Gattorna, 1998: xiii).
The nature of the competition has also shifted from the classic struggle between
companies, to the new competition of supply chain versus supply chain (Taylor,
2004:3). Supply chain management is able to deliver superior customer value at less
cost to the supply chain as a whole, by managing the upstream and downstream
relationships between suppliers and customers (Christopher, 1998, 18), (Gattorna,
1998:276). Cutting-edge supply chains are double-edged swords. Wielded with skill,
they can slice open new markets. Improperly handled, they can lead to deep, self-
inflicted wounds. For all the advantages from getting the supply chain right, getting it
wrong could be catastrophic (Taylor, 2004:8). Supply chain leaders succeed,
UUnniivveerrssiittyy ooff PPrreettoorriiaa eettdd –– VVaann ddeerr MMeerrwwee,, TT ((22000066))
87
because they understand the core problems of the supply chains, have committed
themselves to long-term solutions rather than quick fixes, and have the stamina to
stick with those solutions until they work (Taylor, 2004:19).
Just as there is no easy answer to all supply chain problems, there is no magic
measure for improving performance. Generally, the framework for understanding and
selecting supply chain measures is based on four broad categories: measures of
time, measures of cost, measures of efficiency, and measures of effectiveness
(Taylor, 2004:173). The ultimate measure of effectiveness, of course, is customer
retention. If you have a growing base of loyal customers that buy your products in
ever-increasing quantities, you are clearly doing something right (Taylor, 2004:191).
There is also evidence to suggest that retained customers are more profitable than
new customers (Christopher, 1998:45).
The difficulty of managing supply chains comes primarily from the complexity that
creeps into their structure and the variability that characterises their flows. It is this
complexity and variability that make an easy game hard to master (Taylor, 2004:21).
Variability is one of the most costly problems in supply chains, particularly when it
amplifies as it flows up the chain. Anything that is done to stabilise the flow of
demand across the chain will improve the performance and result in substantial
advantage over chains that have to cope with higher levels of variability (Taylor,
2004:274). Variability in supply can amplify down the supply chain while variability in
demand can amplify up the supply chain (Taylor, 2004:39). The only real solution to
the variability problem is for trading partners to work together to remove variability
across the chain, rather than trying to cope with variability through point solutions
such as added safety stock (Taylor, 2004:166).
Mastering demand, rather than just managing it, is a powerful weapon in supply
chain-based competition. In addition to knowing one’s customers and understanding
how the company’s products suit their needs, one has to be willing to make hard
choices about which customers and products are right for the supply chain; practices
that are deeply ingrained in the company’s corporate culture have to be modified. A
company should shift its thinking about demand from a conventional, reactive stance
UUnniivveerrssiittyy ooff PPrreettoorriiaa eettdd –– VVaann ddeerr MMeerrwwee,, TT ((22000066))
88
to a more proactive point of view, understanding that the demand can be shaped to
fit the competitive advantages of the supply chain (Taylor, 2004:278).
One of the most important things that can be done to improve the shape of demand
is to make sure that the right customers are being served. The relentless pursuit of
revenue often blinds companies to the fact that some customers are being served at
a loss. By removing these unprofitable customers a huge contribution can be made
to the bottom line, even if the performance of the supply chain is not improved at all
(Taylor, 2004:270-271). The Pareto, or 80/20 rule, can provide the basis for
developing a more cost- effective service strategy (Christopher, 1998:56). The
highest service should be given to key customers and key products (Christopher,
1998:57). A company should also constantly review the less profitable customers
(Christopher, 1998:60-61).
The weak link in the build-to-stock model is inventory management, and this can be
traced back to an even weaker link, namely the reliance upon sales forecasts. A
build-to-order model, on the other hand, begins with the order and not the forecasts
(Chase, Aquilano and Jacobs, 2001:549). For decades manufacturers have tried to
freeze the production schedule, not allowing for any changes to the final assembly
schedule on which all components and material schedules are based. Most attempts
to freeze the production schedule are relatively unsuccessful, and encounter the
following problems (Harmon & Peterson, 1990:215): Exceptional swings of market
demand will always occur, and the superior manufacturer must be prepared to take
exceptional action in response. Thus, the master production should be neither liquid
nor frozen, but slushy (Harmon & Peterson, 1990:216). It is thus better if the forecast
is not frozen. If all the available information is utilised, if updates could be provided as
soon as circumstances change, then inventories could be better managed, and
ultimately, the customer could be better served (Riehm and Stephen, 1999:18). The
true test of an inventory management system is not merely in the planning and
forecast stage, but also in the ability to re-plan and react. The ability to re-plan and
react is the essence of management control. (Kobert, 1992:165-166).
Although supply chains can normally be classified as either push or pull chains, in
reality every chain is a mixture of push and pull. As long as consumers have a choice
UUnniivveerrssiittyy ooff PPrreettoorriiaa eettdd –– VVaann ddeerr MMeerrwwee,, TT ((22000066))
89
about what products they buy and when they buy them, the last link in the chain is
always a pull link. (Taylor, 2004:29). Although the phrase “supply chain
management” is now widely recognised, it could be argued that it should really be
termed “demand chain management” to reflect the fact that the chain should be
driven by the market, not by the suppliers (Christopher, 1998:18). The aim of any
company should be to convert its supply chain from push to pull by responding to
customer demand. Technology is used to link the supply chain (Hughes, Ralf and
Michels, 1999:163).
The key to getting sustained co-operation across the supply chain is to align
everyone’s incentives (Taylor, 2004:272). The mission of supply chain management
is to create a ‘one-plan’ mentality within the business which seeks to replace the
conventional stand-alone and separate plans of marketing, distribution, production
and procurement. Supply chain management is therefore an integrative concept that
seeks to develop a system-wide view of the firm (Christopher, 1998:14). The
importance of integrating demand and supply planning should not be
underestimated. The integration of demand and supply planning is regarded as one
of the seven principles of supply chain management (Berger & Gattorna, 2001: xiii).
UUnniivveerrssiittyy ooff PPrreettoorriiaa eettdd –– VVaann ddeerr MMeerrwwee,, TT ((22000066))
90
CHAPTER 3: SUPPLY AND DEMAND ALIGNMENT
3 .1 In t roduct ion
In many Western economies the dynamics of the market place has changed in recent
years. Markets are increasingly characterised by sophisticated and demanding
customers and consumers, within a competitive environment that is far more volatile
and less predictable than before. Under these conditions marketing’s reliance on the
classic ‘4 Ps’ of product, price, promotion and place is no longer sufficient to achieve
market leadership. Instead, winning companies are those that can speed up the rate
of innovation, bring new products and services to the market place faster, and
replenish demand in shorter lead times and with greater reliability, in other words,
these companies are more responsive. Creating a responsive organisation has to be
the main priority of management in any business, and achieving it requires a much
greater focus on the process through which the demand is met. This is the arena of
marketing logistics - the critical interface between the market place and the
organisation seeking to satisfy customer requirements (Christopher and Peck, 2003:
vix).
Matching supply and demand is the fundamental cornerstone of the logistics process.
Conventional business practice seeks to mediate demand and supply through
forecasts, in other words, the forecast is used as an attempt to predict demand and
then the finished goods inventory is created ahead of that anticipated demand.
However, because today’s market place is considerably more volatile and, as a
result, less predictable, it has become necessary to seek alternative approaches to
demand management. The way forward is to substitute information for inventory and,
in the process, to become more responsive to real demand. Becoming demand-
driven requires a supply chain that is agile in its ability to meet changed customer
requirements. New ways of working with supply chain partners are required if
customer responsiveness is to be enhanced (Christopher and Peck, 2003:85).
UUnniivveerrssiittyy ooff PPrreettoorriiaa eettdd –– VVaann ddeerr MMeerrwwee,, TT ((22000066))
91
3.2 Misa l ignment between supply and demand
3.2.1 The effects of the misalignment between supply and demand in a supply chain
Ineffective demand management practices manifest themselves as volatile customer
demand and can have serious effects on business and supply chain performance.
Servicing the excessive peaks and troughs of volatile customer demand increases
the cost and complexity of business operations (Gattorna, 1998:140-141).
3.2.1.1 Supply chain volatility increases cost
Retailers and manufacturers in many product categories have struggled to put
together a match between the supply and the demand (Gattorna, 1998:171).
The costs of a mismatch between the supply and the demand, measured as the
combination of inventory carrying costs, markdown costs and stockout costs, are
growing in many industries. Companies have tried to reduce these costs through
better demand forecasting, improved production and inventory planning, increased
production capacity and reduced set-up and transportation lead times. Companies
have also tried to manage the demand process through pricing policies intended to
smooth the arrival pattern of customers. These approaches, while useful, have failed
to address a number of drivers of supply-demand mismatch (Gattorna, 1998:172).
A firm’s ability to match supply and demand is an indication of its capacity to react to
market signals- its reactive capacity. A company reactive capacity is affected by the
company’s inventory and capacity levels. Supply-demand mismatch costs are
affected by the company’s labour costs, working capital costs and incentives for
stocking the inventory (Gattorna, 1998:172).
Firstly, the working capital cost will increase as organisations seek to minimise the
risks of running out of stock and maintain high customer service levels through
increased inventory levels. And secondly, variable costs will also rise as a result of
increased labour costs and the greater use of contract storage needed to hold the
UUnniivveerrssiittyy ooff PPrreettoorriiaa eettdd –– VVaann ddeerr MMeerrwwee,, TT ((22000066))
92
excess production during the demand peaks. Labour becomes more expensive,
because of the casual or temporary staffing needed for order processing, production
and warehouse operations. The overtime and adjusted shift patterns needed to cover
demand peaks also increase labour expenses (Gattorna, 1998:141-142).
When the customer demand is low or in a trough, the same organisation risks the
significant inefficiencies through idle labour and idle production and storage capacity.
The greater the volatility of demand, the greater the resulting costs (Gattorna,
1998:142).
3.2.1.2 Supply chain volatility creates complexity
Demand volatility also causes significant complexity which must be managed
(Gattorna, 1998:142-143). The complexity created by demand volatility may take
many forms, for example:
• Increased supply chain uncertainty about future pressures on the supply
chain.
• Increased reliance on accurate, timely information as a means of gaining
increased visibility of future customer demand.
• Increased risk of stock outs, especially if the organisation operates in a made-
to-stock environment. Furthermore, if it is operating on a long production
cycle, the time taken to replenish the inventory may be significantly greater
than customer order periodicity. Back orders may result and become a chronic
customer service problem.
• Increased customer lead times to increase demand visibility and mitigate
against an organisation’s ineffective internal operations is, in effect, a
reduction in customer service.
• Increased reliance on effective production planning capability. Organisations
must ensure that a significant volume of the monthly production is available in
stock to fulfil customer orders prior to the beginning of the month. The
misalignment between the weekly production and weekly demand implies that
organisations must effectively plan a mini stock build every month.
UUnniivveerrssiittyy ooff PPrreettoorriiaa eettdd –– VVaann ddeerr MMeerrwwee,, TT ((22000066))
93
• Decreased ability to provide accurate information to manufacturing. Generally
sales and marketing divisions produce sales forecasts monthly and at a
reasonably high level in the product hierarchy, that is the product-group level,
not the stock-keeping unit. Volatile demand profiles make accurate sales
forecasting extremely difficult.
Increased obsolescence, if the demand fails to materialise, particularly for products with a short shelf- life. Demand volatility thus adds complexity and costs to the supply chain.
3.2.2 Traditional approaches to resolve mismatches between supply and demand
Past attempts to address the supply-demand mismatch problem have focussed on
improving forecasting, optimising production and inventory plans and reducing lead
times (Gattorna, 1998:173).
Some of the traditional approaches to resolve supply-demand mismatches include
the following:
• Improving forecasting: Despite considerable progress in developing new
demand-forecasting techniques, there is a limited potential for these demand
forecasting techniques to be implemented effectively. The short lifecycles of
some products, for example fashion, toys and music, limit the extent to which
historical demand can be collected. Inaccurate recording of sales data also
impedes the implementation of data-based forecasting. Even scanned items in
a supermarket have only 95 per cent data accuracy and this is much lower for
items that are not scanned, such as fresh produce (Gattorna, 1998:174).
• Improving production and inventory planning: Many companies use various
methods and models to optimise production and inventory plans, for example,
the economic order quantity. Even large material requirement planning
systems, for example, often have modules with economic order quantity
embedded in them. A pitfall of most of these planning approaches, however, is
that they are static, ignoring the possibility of a future operational environment.
In deriving the optimal order quantity, the model assumes that the ordering
set-up costs are fixed and cannot be alerted by management practices.
UUnniivveerrssiittyy ooff PPrreettoorriiaa eettdd –– VVaann ddeerr MMeerrwwee,, TT ((22000066))
94
Companies, such as Toyota, have shown that set-up times can be reduced.
The failure of these models to feature in the links between inventory levels and
operational improvement reduces their relevance in many applications
(Gattorna, 1998:174-175).
• Reducing lead times: Whilst many forecasting errors are the result of
inappropriate forecasting methodologies, the root cause of these problems is
that the forecast error increases as the lead-time increases (Christopher,
1998:153). The pressure from the customer will continue to be for deliveries to
be made in ever-shorter time frames (Christopher, 1998:158). Companies can
reduce lead times through various measures, including reducing set-up times,
increasing conformance quality levels and reducing the frequency of machine
breakdowns, thus reducing the inventory level required to achieve a target fill
rate. Many companies that face unpredictable demands have found that they
can decrease lead times by reducing their dependence on forecasts that tend
to be unpredictable and thereby improve their responsiveness to demand. The
quick response programme, for example, has resulted in a reduction of
manufacturing and transportation lead times and batch sizes and by using
information technology, for example, point-of-sale and electronic data
interchange to accelerate information transfer (Gattorna, 1998:175)
(Christopher, 1998:153, 192, 194). The essence of the quick response
approach is to change from selling what you buy to buying what you sell
(Hughes, Ralf and Michels, 1999:102). The forecast lead-time should also
correlate with your supply chain lead-time. This will ensure that the supply will
be able to react to forecast changes (Johnson, 2002:9).
In order to achieve success, a company must accelerate movement through the
supply chain to make the entire logistics system far more flexible and thus responsive
to fast-changing markets (Christopher, 1998:31).
Responsive supply chains are, by definition, highly integrated. They are internally
integrated across functions and externally integrated with upstream suppliers and
downstream customers. Many companies are impeded in their attempts to become
more agile and responsive because of entrenched functional measures. They
measure functions rather than processes and hence have a fragmented approach to
UUnniivveerrssiittyy ooff PPrreettoorriiaa eettdd –– VVaann ddeerr MMeerrwwee,, TT ((22000066))
95
the marketplace. It is difficult for such firms to contemplate external integration when
they lack internal integration (Christopher, 1998:248). All companies and
departments within the company must adopt the same strategy: to serve the
customer with ever-better quality, lower cost, quicker response, and greater flexibility
(Schonberger, 1990: viii). The aim should be the establishment of an integrated
company, rather than a bunch of functional silos (Gattorna and Walters, 1996:12),
which are blind spots (Kaplan and Norton, 1996:12).
The companies that have succeeded in breaking down the functional silos are now
looking to forge ever closer linkages with their supply chain partners. A key to supply
chain integration is the open flow of information from one end of the pipeline to
another. By sharing information, supply chain partners are able to respond more
rapidly to known demand and to do with less inventory in the system as a whole and
hence at lower costs (Christopher, 1998:248).
The classic response to the dilemma of supply chain response, has mainly been to
add computer inputs and communications to each step, which only adds still more
steps and complexities to the problem. The real problem is the neat
compartmentalisation of specialised functions. The solution is to simplify
communications and to re-establish direct, person-to-person relationships as the
foundation of new, co-operative teamwork between both internal and external people
and organisations (Harmon, 1992:116).
Forecasts, for example, are by definition inaccurate. No matter when the forecast
changes, a company should communicate the full effect of the changes throughout
the organisation and to its suppliers (Langenwalter, 2000:77).
Past attempts to address the supply-demand mismatch problem included various
approaches, for example, improving forecasting, optimising production and inventory
plans and reducing lead times. These traditional approaches, although useful, have
not resolved the major mismatches between supply and demand within a supply
chain.
UUnniivveerrssiittyy ooff PPrreettoorriiaa eettdd –– VVaann ddeerr MMeerrwwee,, TT ((22000066))
96
3.3 Transforming to a responsive organizat ion
A company’s capacity to match supply and demand is a function of its reactive
capacity, i.e. its ability to respond to market signals. Firms have struggled to match
supply with demand by focussing on improving forecasting, optimising production
and inventory plans and cutting lead times. But while these measures are useful,
they do not offer a holistic solution. Firms also need to consider measures to address
the costs of labour and working capital, and they need to find ways to align the
incentives both internally and externally (Gattorna, 1998:171).
In order to remain flexible, organisations need to believe that change does not have
to wait for a crisis to occur. Change should be viewed as an opportunity and not a
threat; a chance to do something better, not a personal risk (Gattorna, 1998:16).
According to Jack Welch, previous chief executive officer of General Electric,
businesses tend to go wrong, because they focus on the predictability of operations.
Instead, businesses should be flexible in order to meet the needs of the marketplace.
Additionally, long-term relationships between companies should be based on
flexibility, rather than today’s market or specific volumes (Langenwalter, 2000:44).
The basic problem that arises from a system that is based on predictability and
standards is that more and more markets are moving faster than traditional
measurement time frames. The other problem with such systems is that they actually
discourage continuous improvement (Langenwalter, 2000:45).
Demand flexibility requires supply flexibility. Demand is flexible and will always be.
Therefore, factories must develop flexible people, equipment, and practices capable
of varying the rate of production to meet the current rate of demand. Flexible supply
will eliminate costly inventory build-up in slow periods and late shipments in others
(Harmon, 1992:30).
The key to effective supply chain management is in closing the gap between day-to-
day changes in the supply chain and companies' ability to recognize and respond to
them. Specifically, companies should be able to identify these changes as they
UUnniivveerrssiittyy ooff PPrreettoorriiaa eettdd –– VVaann ddeerr MMeerrwwee,, TT ((22000066))
97
occur, to quickly understand their potential impact and to act immediately (Valdero,
2002).
Gattorna (1998:23) states that, how a company “senses and responds” to its
customers is a primary determinant of its overall success. Of the many changes that
have taken place in the marketing environment, perhaps the biggest is the focus on
speed. The main reasons for the changes are shortening product lifecycles, shorter
time to market products and the growth in just-in-time practices.
The challenge to every business is to become a responsive organisation. The
organisation should respond to changes in the market with products and services
which provide innovative solutions to customers’ problems. In addition to this; it
should be able to respond to volatile demand and it should also provide high levels of
flexibility in delivery. The five major distinguishing changes required of a responsive
organisation are the following:
• From functions to processes.
• From profit to performance.
• From products to customers
• From inventory to information.
• From transactions to relationships
3.3.1 Changing from functions to processes
3 .3 .1 .1 Organ iza t iona l s t ruc tu re
The concept of integrated logistics management, whereby flows of information and
materials between source and user are co-ordinated and managed as a system is
now widely understood, if not widely implemented. The logic of linking each step of
the process, as materials and products move closer to the customer, is based upon
the principles of optimisation. This means that the goal is to maximise customer
service whilst simultaneously minimising costs and reducing assets locked up in the
logistics pipeline. However, in the conventional organisation, this poses an immediate
problem. Most companies are organised on a functional basis. In other words, they
UUnniivveerrssiittyy ooff PPrreettoorriiaa eettdd –– VVaann ddeerr MMeerrwwee,, TT ((22000066))
98
have sought a division of responsibility concerning a certain function for example
purchasing, production or sales (Christopher, 1998:217).
Most companies adopt an approach whereby each functional area optimises each of
its individual pieces. Experience has shown that that this functional approach will
result in sub- optimal results for the company (Ptak and Schragenheim, 2000:39).
Christopher (1998:218-221) added that the traditional vertical or functional
organisation creates some of the following problems that hamper the successful
implementation of integrated logistics management:
• Inventory builds up at functional boundaries. Individual functions are
encouraged to ‘optimise’ their own costs, because of the budgeting system.
The cost optimisation will often be at the expense of substantially increased
inventory across the system as a whole.
• Pipeline costs are not transparent. The costs relating to the flow of material
across functional areas are not easy to measure, nor are the real costs to
serve customers with different needs. ‘Throughput accounting’ and ‘activity
based costing’ are two attempts to pin down costs as they occur and hence to
make the total pipeline costs easier to identify. It is only a problem because
the costing systems are designed to monitor functional or input costs, rather
than flow or output costs.
• Functional boundaries impede process management. Many of the causes of
variation in the order-to-delivery cycle, for example, stem from the variability
that inevitably arises in the efficient processes that have to be created to
manage the interfaces between functions. The phenomenon is further
compounded by the inability of managers to detach themselves from their
familiar surroundings and to see the ‘big picture’. To achieve a smooth-flowing
logistics pipeline requires an orientation that facilitates end-to-end process
management.
• Conventional organisations present many faces to the customer. The most
damning criticism of the traditional organisation is that it does not present a
‘single face’ to any particular customer. The activities of a traditional
organisation are sequential, performed in series, rather than parallel. Each
function performs its task and then passes the order on to the next function.
UUnniivveerrssiittyy ooff PPrreettoorriiaa eettdd –– VVaann ddeerr MMeerrwwee,, TT ((22000066))
99
The real problem is that no one person or department is empowered to
manage a customer from enquiry through to order delivery, in other words to
take full responsibility for the provision of service to the customer.
Christopher (1998:222) also adds that the horizontal logistics organisation has
unique characteristics which must be considered. These characteristics are the
following:
o Organised around processes, not tasks.
o Flat and de-layered.
o Built upon multi-functional teams.
o Guided by performance metrics that are market-based.
Christopher (1998: 223) also mentions that the process teams should comprise
specialists, drawn from the functional areas and led by ‘integrators’, whose job would
be to focus on the process team concerning the achievement of market-based goals.
The process team should therefore focus on the limited number of core processes
that are central to most businesses:
• Brand development (including new product development)
• Consumer development (focussed on building loyalty with end consumers)
• Customer management (creating relationships with intermediaries)
• Supplier development (strengthening upstream and alliance relationship)
• Supply chain management (the cash-to-cash cycle)
The problem with functions in most companies is that they perform the wrong tasks.
In the lean enterprise the functions have two roles. The first is to serve as a school
where they systematically summarise the current knowledge, search for new
knowledge, and teach all of this to their members. The second role of the functions is
to develop guidelines or best practices (Womack, & Jones, 1994:234).
The problem with the vertical organisational approach is that it is inwardly focussed
and concentrates primarily upon the use of resources, rather than upon the creation
of outputs. The justification for the process view of the business is that these
processes are in effect capabilities and it is through capabilities that the organisation
UUnniivveerrssiittyy ooff PPrreettoorriiaa eettdd –– VVaann ddeerr MMeerrwwee,, TT ((22000066))
100
competes (Christopher, 1998:260). The result is an integral management of materials
and goods flow. The skills that are required are cross-functional management and
planning skills (Christopher, 1998:265).
3 .3 .1 .2 Con f l i c t ing ob jec t i ves
In practice, objectives often conflict with each other, so that progress toward one
objective takes you further away from another. The problem of conflicting objectives
can be particularly hard to detect in supply chains, because different groups within
the company may set their own objectives without realising that they are creating
conflicts. If you fail to detect and eliminate these conflicts, the company will work
against itself, exerting greater effort, but reducing its ability to make any real progress
(Taylor, 2004:239-240).
Inventory levels are a common battleground of conflicting objectives (Taylor,
2004:240-241), (Gattorna, 1998:383), (Gattorna and Walters, 1996:87).
Manufacturers are trying to increase inventory turns by reducing the raw materials,
work-in-progress and finished goods. Manufacturers prefer longer production runs of
like units to help spread the fixed costs of set-up and changeover, thereby reducing
increased levels of inventory. Inventory-managed personnel strive to keep the levels
of inventory as low as possible. The purchasing group is trying to reduce order costs
by placing large orders, which increase the raw materials inventory. The purchasing
department is often evaluated on the lowest purchase price per unit and therefore
has an incentive to buy in larger quantities at a lower purchase price per unit. The
sales force needs more finished goods so that it can offer customers better selection
and faster delivery. Sales and marketing would rather have too much inventory so
that fewer stock outs occur and customer satisfaction is as high as possible. The
transportation department is often evaluated on the lowest cost per ton, resulting in
large shipment volumes to realise truckload discounts and increasing the amount of
inventory on each shipment.
The conflicting objective creates a chronic tension that pulls the company in different
directions. The company that should run smoothly exerts most of its energy into
UUnniivveerrssiittyy ooff PPrreettoorriiaa eettdd –– VVaann ddeerr MMeerrwwee,, TT ((22000066))
101
fighting its own movements, and the best it can do is stagger around (Taylor,
2004:240-241).
Many of the actions of various functional personnel are based on their current
performance incentives within the company. People are only acting to meet their set
performance goals; however, the end result is increased inventory for the entire
company Performance incentives should therefore be changed so that the efficiency
of the whole company is achieved, rather than the performance of a particular
department (Taylor, 2004:240-241), (Gattorna, 1998:383).
Behaviour is likely to be very consistent with the current performance measures. If
the behaviour of the company is not consistent with the desired company direction,
the measurement system must be checked. The review of the measurement system
must be addressed at the most senior levels of the organisation (Ptak and
Schragenheim, 2000:150).
The only way to make any real progress is to align objectives across all the groups
involved in managing the chain. Effective supply chain management involves almost
every department in the company, and the long-standing motivations and practices of
these groups makes alignment a difficult process (Taylor, 2004:241).
One approach to solving the problem of aligning objectives is to find a single,
common objective and map all other objectives back to it. The obvious candidate for
the common objective is profit. Any objective than reduces profit, rather than
increasing it, is not such a good objective (Taylor, 2004:241).
Objectives should be measured on three levels corresponding to the three levels of
management: operations, planning and design. To justify operational objectives, a
company only has to show an increase in sales or a decrease in costs. For planning
purposes, it might compare the net present value of future profits against the more
immediate costs to demonstrate the expected real profit from meeting the objective.
Similarly, one would justify capital expenditure to improve the design of the chain by
calculating the return on the investment of those assets.
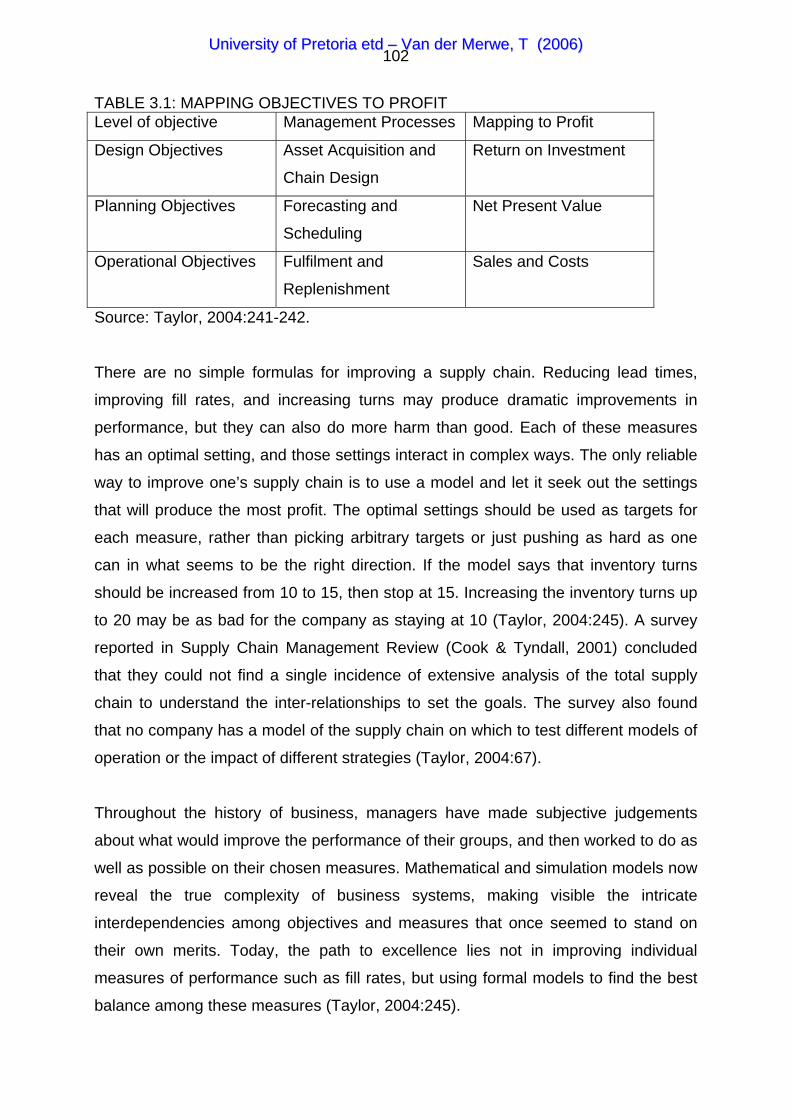
UUnniivveerrssiittyy ooff PPrreettoorriiaa eettdd –– VVaann ddeerr MMeerrwwee,, TT ((22000066))
102
TABLE 3.1: MAPPING OBJECTIVES TO PROFIT Level of objective Management Processes Mapping to Profit
Design Objectives Asset Acquisition and
Chain Design
Return on Investment
Planning Objectives Forecasting and
Scheduling
Net Present Value
Operational Objectives Fulfilment and
Replenishment
Sales and Costs
Source: Taylor, 2004:241-242.
There are no simple formulas for improving a supply chain. Reducing lead times,
improving fill rates, and increasing turns may produce dramatic improvements in
performance, but they can also do more harm than good. Each of these measures
has an optimal setting, and those settings interact in complex ways. The only reliable
way to improve one’s supply chain is to use a model and let it seek out the settings
that will produce the most profit. The optimal settings should be used as targets for
each measure, rather than picking arbitrary targets or just pushing as hard as one
can in what seems to be the right direction. If the model says that inventory turns
should be increased from 10 to 15, then stop at 15. Increasing the inventory turns up
to 20 may be as bad for the company as staying at 10 (Taylor, 2004:245). A survey
reported in Supply Chain Management Review (Cook & Tyndall, 2001) concluded
that they could not find a single incidence of extensive analysis of the total supply
chain to understand the inter-relationships to set the goals. The survey also found
that no company has a model of the supply chain on which to test different models of
operation or the impact of different strategies (Taylor, 2004:67).
Throughout the history of business, managers have made subjective judgements
about what would improve the performance of their groups, and then worked to do as
well as possible on their chosen measures. Mathematical and simulation models now
reveal the true complexity of business systems, making visible the intricate
interdependencies among objectives and measures that once seemed to stand on
their own merits. Today, the path to excellence lies not in improving individual
measures of performance such as fill rates, but using formal models to find the best
balance among these measures (Taylor, 2004:245).
UUnniivveerrssiittyy ooff PPrreettoorriiaa eettdd –– VVaann ddeerr MMeerrwwee,, TT ((22000066))
103
If the root cause of supply-demand mismatch is the mismatch between objectives,
commissions can be altered and brands and vendor-managed programmes can be
used (Gattorna, 1998:182), (Jain, 1994:44). If high inventory holding costs are the
root cause of supply-demand mismatch, ways might be found to make it cheaper to
carry inventory. Large companies, for example, own the inventory at their suppliers
(Gattorna, 1998:182).
3 .3 .1 .3 A l ign ing ob jec t i ves
Research has shown that most companies set too many objectives and take too few
measures, producing conflict concerning the company’s direction and confusion
about its progress. Industry leaders in supply chain performance usually focus their
efforts on either three or five areas, defining and tracking several measures of each.
Another interesting characteristic of these leading companies is that they favour
measures of effectiveness over measures of efficiency (Taylor, 2004:237). The aim
should be to align the individual, departmental and organisational goals (Kaplan and
Norton 1996:139).
3 .3 .1 .4 M isa l igned incen t i ves
Companies that fail to acknowledge the relationship between incentives and channel
inventory levels can incur significant spoilage costs. Some supply chains have
reduced supply-demand mismatch costs by identifying ways in which to reduce
labour and working capital and align incentives. Intermediaries play a useful role in
high factor costs and mismatch incentives (Gattorna, 1998:181-182).
3 .3 .1 .5 A l ign ing incen t i ves
Improving the performance of your supply chain involves using formal models to find
the performance levels that maximise profit, setting objectives for moving toward
these levels, and taking systematic measures to track the progress. However, these
UUnniivveerrssiittyy ooff PPrreettoorriiaa eettdd –– VVaann ddeerr MMeerrwwee,, TT ((22000066))
104
models do not allow for motivating people to achieve the objectives. It is not enough
to set objectives and to encourage people to strive toward them One has to provide
incentives that reward people for making the right kinds of choices, and the
incentives have to be powerful enough to produce significant changes in behaviour
(Taylor, 2004:245-246).
An alternative strategy is to develop a “golf” game for the key participants in the
forecasting process, namely sales and marketing. A forecasting golf game is
particularly popular with sales people, who normally play golf and are
characteristically competitive in nature. Playing a monthly golf game coupled with
prizes, increases the interest and participation of sales and other key participants
(Kahn, 2002:23).
Employees often receive incentives that are aligned with corporate objectives, and
their incentives are rarely tied to supply chain performance. A recent study in the
United States (Anderson & Delattre, 2002) shows that most companies which use
incentives based on supply chain performance; use incentives that are only based on
internal performance measures and are not tied to the performance of the chain as a
whole. The majority of these companies choose the wrong measures and their
incentives are rarely aligned in a way that encourage consistent behaviour. Profound
changes will be necessary if incentives are to be used. (Taylor, 2004:246).
Some incentives might change dramatically. Instead of basing sales commission on
total sales, it could be based on profit contribution. The sales team will then be
encouraged to sell the products that actually make money (Taylor, 2004:246).
Once profit contribution is accepted as the common denominator across all
objectives, all company policies should be examined for their contribution to profit.
For example, a small change in the policy that governs the sequence of processing
incoming orders, could improve a company’s profit potential. A company usually has
an un-stated, implicit policy of processing orders in the order in which they arrive. A
recent study (Anderson & Delattre, 2002) found that the average profits could be
increased by 19 % per year, if orders were to be serviced according to their profit
potential, rather than their arrival date. Most managers would be thrilled to achieve
UUnniivveerrssiittyy ooff PPrreettoorriiaa eettdd –– VVaann ddeerr MMeerrwwee,, TT ((22000066))
105
an 18 % increase in profit from such a simple change, but this would never occur to
them, unless they were already examining every policy for its contribution to profit
(Taylor, 2004:247).
Taylor (2004:247-249) mentions that incentive alignment is a powerful tool that
ensures that everyone’s personal win is consistent with the objectives of the
company. People normally behave in ways that maximise their personal rewards, no
matter how those rewards are defined. If a company’s incentives were to be aligned
in such a way that they all pointed in the same direction, it would create a powerful
force that could drive the company to unprecedented levels of performance. If,
however, these incentives point in different directions, all that energy will work
against itself and the opportunity for stellar performance will be lost.
To achieve the maximum company performance, four distinct steps should be
followed: Firstly, use business models to identify the combination of performance
targets that maximise profits. Secondly, set achievable objectives that will bring the
company closer to its ideal configuration. Thirdly, motivate employees to strive for
these objectives by making their incentives dependent on hitting the targets. Fourthly,
set up a systematic program of measurements to track the progress of each
objective. The results of the measurements will provide the feedback necessary to
guide the entire program. The measurements will determine the size of the incentive
awards, they indicate how much progress has been made toward achieving the
targets, and they will also provide vital feedback on the business model that can be
improved as time goes on.
Profits should also align the objectives across the whole supply chain. If the
individual profits can be aligned with the total profits of the chain, then it is in the
interests of the company to work for the good of the chain. If their profits are not
aligned, they will inevitably pull in different directions and reduce the performance of
the chain. Sharing profits always requires some trade-off. A shared supply chain
model should be built in order to maximise the total profit across the chain and then
the allocation of the profit could be negotiated.
UUnniivveerrssiittyy ooff PPrreettoorriiaa eettdd –– VVaann ddeerr MMeerrwwee,, TT ((22000066))
106
3.3.2 Change from profit to performance
According to Christopher (1998:261-262, 265), there is a growing realisation that if
profit is the end result, then we should spend more time examining the means
whereby it is achieved. There is a saying: what gets measured gets managed,
implying that it is through the choice of performance measurement that behaviour is
determined. The underlying viewpoint is that performance drives profitability.
The management review of the future may not begin with the financial review, but
with a review of non-financial performance indicators such as customer satisfaction,
flexibility and people commitment. Examples of these measures include the following:
Customer satisfaction
• Customer retention
• Brand preference
• Dealer satisfaction
• Service performance
Flexibility
• Set-up times
• Commonality of components and materials
• Reduction of complexity
People commitment
• Employee turnover
• Suggestions submitted and implemented
• Internal service climate and culture
• Training and development index
The focus of companies should be on the key performance drivers of profit. If the
performance improves, the profits will also improve.
UUnniivveerrssiittyy ooff PPrreettoorriiaa eettdd –– VVaann ddeerr MMeerrwwee,, TT ((22000066))
107
3.3.3 Changing from products to customers
There is still an underlying tendency in companies to manage products rather than
customers, as reflected in job titles such as brand manager and product manager.
The customer-focussed company needs to be supported by accounting systems that
can better identify the costs of giving quality service to customers and hence
improved profitability. The problem in the past has been that traditional accounting
systems have not been able to provide accurate measures of the cost-to-serve. By
using activity-based costing and throughput costing, it is possible to identify the
aspects of service that create costs and hence, where necessary, to modify the
service package, customer by customer. In marketing terms, the transformation will
also require more emphasis on customer value and not just brand value. The result
will be more focus on markets and the creation of customer value (Christopher
(1998:262, 265).
3.3.3.1 Making the customer part of the supply chain
A key part of understanding and retaining customers is to draw them into the
company’s orbit, through integrating the supply and demand chain. This means
moving the supply chain from supplying customers indiscriminately according to
forecast demand, to supplying customers with precision according to their actual
demand and their stated requirements. In this way the company lines up its supply
chain to match and mirror the demand requirements of its customers, and it is
capable of moving with customers as their needs change (Gattorna, 1998:41).
UUnniivveerrssiittyy ooff PPrreettoorriiaa eettdd –– VVaann ddeerr MMeerrwwee,, TT ((22000066))
108
3.3.3.2 Flexible manufacturing and logistics
The need for manufacturing agility has been fuelled by shrinking product life- cycles
and increasing competitive intensity. Manufacturers should now, more than ever,
streamline their internal and external processes to maximise the speed of new
product introduction and eliminate the delays and quality problems that typically
occur when it comes to escalating production volume (Berger & Gattorna, 2001:103-
104).
In Japan, Toyota has used the principles of flexible manufacturing and logistics to
provide higher levels of responsiveness to customer needs, with a reduced level of
options. A feature of the Toyota production system is the concept of a ‘full daily mix
schedule’. This means that the aim is to make at least some of every variant every
day. Ideally every factory ought to aim to make every product every day, assuming
that there is a demand. The aim is to achieve a ‘level schedule’ with an optimum mix
of variants so that the demand can be met from the minimum stock (Christopher,
1998:210).
The progress towards the idea of supply chain management as a source of
competitive advantage, will gain momentum as the growth of ‘time-based
competition’ accelerates. In markets that are increasingly volatile, responsiveness
becomes a critical competitive requirement (Christopher, 2003:20).
3.3.4 Changing from inventory to information
An information flow challenge is ensuring that the right people receive the right
information. A common misconception is that companies use information. However,
people use information, and people use it in different ways depending on their job
functions and how their companies are organized. The flood of available information
overwhelms users. In finding solutions to this problem, companies should strive to
customize information for each individual user. Today's software technologies
UUnniivveerrssiittyy ooff PPrreettoorriiaa eettdd –– VVaann ddeerr MMeerrwwee,, TT ((22000066))
109
support creation of solutions that filter information based on individual preferences
and job functions (Woerner, 2001).
The key issue that any company should recognise is the fact that order, and its
associated information flows, should be at the heart of the business. The only
rationale for any commercial company is to generate and fulfil orders (Christopher,
1998:226). The order fulfilment process should thus be designed as an integrated
activity of the company with the conventional functions of the business supporting
that process (Christopher, 1998:226).
The right information should be used to make the right decisions (Ptak and
Schragenheim, 2000:35). Christopher (1998:263,265), states that when companies
are unsure of future demand, they carry inventory to buffer against the uncertainty.
The conventional solution to the problem of uncertainty has been to make a forecast.
It is, however, self- defeating to rely on a forecast since, by definition; the degree of
forecast error will directly influence the need for stock. Instead, if information
concerning actual customer usage of a product could be linked directly with the
logistics system, then the need for the forecast could be reduced. This is the concept
of substituting information for inventory. By capturing information at the point of sale
and swiftly transferring details of what is being sold back to the point of production,
the total response time can be shortened by whole weeks. The results of applying
this concept are a demand based replenishment and quick response systems. The
skills required are information systems and information technology.
3.3.5 Changing from transactions to relationships
One of the primary goals of many companies is market share. However, it can
sometimes be the case that a blind pursuit of market share will put more emphasis
on the winning of customers than keeping them. More and more research is
suggesting that the longer customers stay with a company, the more profitable they
become. There is even a trend with suppliers towards single sourcing. The benefits
of single sourcing include improved quality, innovation sharing, reduced costs, and
UUnniivveerrssiittyy ooff PPrreettoorriiaa eettdd –– VVaann ddeerr MMeerrwwee,, TT ((22000066))
110
integrated scheduling of production and deliveries. Logistics thus becomes the thread
that connects the inbound and outbound flows of channel partners. The result is a
supply- chain- partnership which requires relationship management skills and a win-
win orientation (Christopher, 1998:264-265).
3.3.6 Changing from Economies of Scale to Economies of Scope
Christopher (1998:207-209), states that as the demand by all of the partners in the
supply chain for a quick response increases, more pressure will be placed upon
manufacturing to meet the customer’s need for variety in shorter and shorter time
frames.
The answer to a quick response has to lie in flexibility. The key to flexibility in
manufacturing is not just a new technology e.g. robotics. The main barrier to flexibility
is the time taken to change from one level of volume to another and to change from
making one variant to another. This is referred to as ‘set-up time’. The goal in many
Japanese plants is ‘Single Minute Exchange of Die’ (SMED). In other words, constant
attention by the management and the workforce is focussed upon the ways in which
set-up times can be reduced. Sometimes it will involve new technology, but more
often than not, it is achieved by taking a totally different look at the process itself. In
many cases set-up times have been reduced from hours to seconds, simply by
questioning conventional wisdom.
What is being seen is a fundamental shift away from the economies of scale, which
are volume-based and hence imply long production runs with few change-overs, to
the economies of scope which are based upon producing small quantities of a wider
range, and hence, requiring more change-overs.
Using the economies of scope model, a single plant can produce a variety of output
at the same cost as, if not lower than, a separate plant dedicated to producing one
type of product at a given level. In other words, an economic order quantity (EOQ) of
one unit, and specific production designs, engender no additional costs. Economies
UUnniivveerrssiittyy ooff PPrreettoorriiaa eettdd –– VVaann ddeerr MMeerrwwee,, TT ((22000066))
111
of scope change the materials-driven, batch-system technology into a multi-
functional, flow system configuration.
3.3.6.1 Supplier integration
Conventional purchasing tends towards multiple sources of supply for a single item.
Co-makership, on the other hand, is the development of a long-term relationship with
a limited number of suppliers on the basis of mutual confidence. Supplier
development streamlines and integrates the vendor’s own systems and procedures
more closely with the customer’s (Christopher, 1998:242-243,246).
3.4 Lead t ime gap
Most organisations face the fundamental problem that the time it takes to procure,
make and deliver the finished product to a customer is longer than the time the
customer is prepared to wait for it. This is the basis of the lead-time gap (Christopher,
1998:167).
In the conventional organisation, the only way the gap between the logistics lead
time, i.e. the time taken to complete the process from goods inward to the delivered
product, and the customer’s order cycle, i.e. the period they are prepared to wait for
delivery, is by carrying inventory. This normally implies a forecast. Most companies
seek to forecast the market requirements and then build inventory ahead of demand.
All mistakes in forecasting end up as an inventory problem, whether too much or too
little (Christopher, 1998:168).
Whilst improving forecast accuracy will always be a desirable goal, it may be that the
answer to the problem lies not in investing more money and energy in improving
forecasting techniques, but rather in reducing the lead-time gap (Christopher,
1998:168).
UUnniivveerrssiittyy ooff PPrreettoorriiaa eettdd –– VVaann ddeerr MMeerrwwee,, TT ((22000066))
112
The company that achieves a perfect match between logistics lead-time and the
customers required order- cycle has no need of forecasts and no need for inventory
(Christopher, 1998:169).
Reducing the lead time gap can be achieved by shortening the logistics lead time,
whilst simultaneously trying to move the customer’s order- cycle closer by gaining
earlier warning of their requirements through improved visibility of demand
(Christopher, 1998:167-169).
A significant contribution to the way in which logistics processes are viewed, has
been made by Goldratt who has developed the theory of constraints, which is better
known as optimised production technology. The output of non-bottlenecks that feed
bottlenecks must be governed by the requirements of the bottlenecks they serve
(Christopher, 1998:171), (Halevi, 2001:277), (Goldratt, 1990:4), (Silver, Pyke and
Peterson, 650-652, 658-659).
The aim is to manage the bottlenecks for throughput efficiency, which implies larger
batch quantities and fewer set-ups at those crucial points, whereas non-bottlenecks
should minimise batch quantities even though more set-ups will be involved. The
result is that the flow of work-in-progress increases and the transfer batches merge
into larger process batches at the bottlenecks, enabling a faster flow. (Christopher,
1998:172).
Further opportunities for pipeline reduction can be found at the interfaces with
suppliers’ logistics systems. Lengthy, paper-based re-ordering systems add to the
total lead-time. Even more of an issue is the fact that customers rarely share their
usage data with their suppliers and the supplier is forced to forecast requirements
and carry inventory, thus exacerbating the problem. Many companies are facing
replenishment lead times as long as months, which could be reduced to weeks or
even days (Christopher, 1998:172).
UUnniivveerrssiittyy ooff PPrreettoorriiaa eettdd –– VVaann ddeerr MMeerrwwee,, TT ((22000066))
113
3.5 Rat iona le for supply cha in t ime compress ion
Until recently, supply chain changes have been driven largely by cost, with a narrow
focus on tangible supply chain efficiencies. Organisations looking for business
success need to rethink their strategies for their supply chains (Gattorna, 1998:158).
Innovative organisations are examining their supply chains, not for cost-reduction
opportunities, but for opportunities to improve their service to customers. Companies
that have compressed their supply chain response times have found that the financial
benefits have far outweighed the cost. (Gattorna, 1998:158). The strategic rationale
for time- compression includes some of the following benefits:
• Customer service: A compressed supply chain provides a differentiated level
of customer service by making the right products available to customers in the
right place at the right time. Many organisations with either substandard or
non-differentiated service, find themselves vulnerable to periodic margin
reductions from their customers. Companies with differentiated service often
avoid this ongoing price-service vicious circle (Gattorna, 1998:158).
• Customer responsiveness: This enables organisations to adapt quickly to
volatile and unplanned demand. Sales growth not only comes from capturing
those previously neglected sales opportunities, but also, in the longer term,
through taking market share from those less reliable suppliers. Increasing
business through existing channels using existing fixed assets is a very
efficient, low-risk and therefore profitable way to grow (Gattorna, 1998:159).
• Balance between supply and demand: Achieving a much closer match
between supply and demand leads to a reduction in the wastage, caused by
making or buying too much stock and having to write it off later. When supply
and demand are not synchronised, spectacular order surges are often
followed by significant order reductions. The mismatch between the supply
and the demand encourages organisations to build more capacity than is
required, only to see the capacity poorly used (Gattorna, 1998:159).
• Inventory levels: A major business goal is the reduction and even the possible
elimination of the supply chain inventory, necessary in the traditional made-to-
forecast model. Inventory ties up valuable working capital and chokes
UUnniivveerrssiittyy ooff PPrreettoorriiaa eettdd –– VVaann ddeerr MMeerrwwee,, TT ((22000066))
114
business cash flow. Time compression programmes can often release
sufficient working capital to fund the overall initiative, either partially or
completely (Gattorna, 1998:160).
3.5.1 Strategic lead time reduction
Conventional wisdom was based on the assumption that long minimum lead times
and minimal flexibility were needed. Just-in-time thinking challenged conventional
wisdom by focussing on short lead times and a customer-service driven approach
that required much more flexibility (Christopher, 1998:189).
The importance of strategic lead-time management is that it forces companies to
challenge every process and every activity in the supply chain and to apply the acid
test of ‘does this activity add value for a customer or consumer or does it simply add
cost?’(Christopher, 1998:116).
In many cases much of the non-value adding time in a supply chain exists, because it
has been self-inflicted by the rules that have been imposed or inherited. Such rules
include: economic batch quantities, economic order quantities, minimum order sizes,
fixed inventory review periods, production planning cycles, and forecasting review
periods (Christopher, 1998:115-116).
Supply chain pipeline management is concerned with the removal of the blockages
and the fractures that occur in the pipeline and which lead to inventory build-ups and
lengthened response times. The sources of these blockages and fractures are such
things as extended set-up and change-over times, bottlenecks, excessive inventory,
sequential order processing and inadequate pipeline visibility (Christopher, 1998:162-
163).
Companies could reduce their lead-times by improving the frequency, accuracy and
reliability of deliveries, together with the provision of an emergency quick-response
back-up service (Christopher, 1998:121).
UUnniivveerrssiittyy ooff PPrreettoorriiaa eettdd –– VVaann ddeerr MMeerrwwee,, TT ((22000066))
115
Companies are now recognising the fact that a reduction in lead-time not only
provides quicker response to customers’ demands, but also increases the stock turn
and reduces the need for working capital (Gattorna and Walters, 1996:93).
The reasons for reducing lead times seem obvious, so one wonders why companies
have not picked up these ideas more quickly. The reasons seem to be fourfold
(Christopher, 1998:167):
• Few managers have a grasp of the entire process.
• The convenient way in which things get done, can reflect on the doers as a
desire to protect functional boundaries and a lack of understanding of the
consequences, both upstream and downstream of individual processes.
• Initiatives for change are largely functional and seldom reflect the total cost of
the system.
• Lead times are protected by their custodians as a means of providing a buffer,
and as a way of proving some hidden flexibility to respond.
• Systems hold lead times as parameters which are taken for granted. Few
executives would dare to challenge the basic principles of the computer
systems in the business, far less the accuracy with which they complete the
task. As a result, systems regularly operate on outdated or inappropriate lead-
time constraints which have not been reviewed for years.
3.5.2 Supply chain time compression approaches
The success of time compression is based on adopting the following new
approaches:
3 .5 .2 .1 Tak ing a ho l i s t i c v iew
Organisations, trying to compress their supply chains, need to look beyond their own
boundaries. The complete supply chain is likely to consist of different organisations,
and supply chain reform requires a holistic and integrated approach with all
participants playing a role (Gattorna, 1998:160).
UUnniivveerrssiittyy ooff PPrreettoorriiaa eettdd –– VVaann ddeerr MMeerrwwee,, TT ((22000066))
116
3.5.2.2.1 Supply chain integration
The improved integration is the essence of supply chain management. Supply chain
leaders are reconsidering the linkages, not only between functions within their own
company, but with other organisations up and down the supply chain (Gattorna,
1998: xv).
The greatest opportunities for achieving cost reductions and attracting new business
typically involve multi-enterprise interdependencies, such as continuous
replenishment programmes, instead of companies trying to do their own internal
supply chain management (Gattorna, 1998:102).
Supply chain integration implies process integration, both upstream and downstream.
Process integration implies collaborative working between buyers and suppliers, joint
product development, common systems and shared information (Christopher,
1998:231), (Gattorna, 1998:281).
3.5.2.2.2 Supplier programmes
Lower inventory starts with suppliers. In some cases, the actions of suppliers result in
high inventory. Examples of this are:
• The high costs of production changeovers cause the production of large
orders.
• Suppliers frequently make late deliveries due to the unnecessary time
required to process the latest production schedule information into
production schedules.
• Even when the most recent production schedules are available, deliveries
are late, because a long run already in progress needs to be completed. It
is impractical to interrupt a long run because of the penalty of increased
changeover costs.
UUnniivveerrssiittyy ooff PPrreettoorriiaa eettdd –– VVaann ddeerr MMeerrwwee,, TT ((22000066))
117
• Suppliers frequently deliver defective materials and components that must
either be reworked in- house or returned to suppliers for repair or
replacement.
Supplier programmes that focus on specific manufacturing process improvements
should address all the root causes of large inventories.
3.5.2.1.3 Just-in-time supply programmes
Just-in-time practices offer important insight into how supply chains can be improved.
Although the apparent focus of just-in-time is on reducing inventory, the true spirit of
just-in-time is a systematic pursuit of quality, an aspect of which is eliminating any
unnecessary complexity. One of the great contributions of just-in-time to supply chain
management is to provide a clear demonstration of just how simple the basic flows
can become (Taylor, 2004: 45).
Along with reducing complexity, the just-in-time philosophy of quality also seeks to
reduce variability in every stage of production. Each operation is analysed, refined,
and rehearsed until it can be completed both quickly and consistently. The result of
just-in-time, in the case of supply chains, is that raw material inventories can be
reduced to a fraction of their normal levels without causing shutdowns on the line
(Taylor, 2004: 45).
Just-in-time can make supply chains so fragile that any interruption in the flow of
supplies could bring the entire chain to a halt. Toyota, for example, had to close
down its production lines for an entire week as a result of a fire at one of its suppliers.
Ford was forced to close down five North American plants shortly after September
11, 2001 due to parts shortages, many of them due to delays in bringing trucks
across the Canadian border (Taylor, 2004: 46).
UUnniivveerrssiittyy ooff PPrreettoorriiaa eettdd –– VVaann ddeerr MMeerrwwee,, TT ((22000066))
118
Although just-in-time does an excellent job in reducing lead time and work-in-
progress, it has a few drawbacks that need to be considered (Chase, Aquilano and
Jacobs, 2001:680):
• It is limited to repetitive manufacturing.
• It requires at least a month’s stable production level.
• Just-in-Time does not allow very much flexibility in the products produced.
Products must be similar with a limited number of options.
• It still requires work-in-progress when used with Kanban so that there is
“something to pull”. Completed work must be stored on the downstream side
of each workstation in order to be pulled by the next workstation.
• Vendors need to be located nearby, because the system depends on smaller,
more frequent deliveries.
Just-in-time is not the right approach for every supply chain. It is not a good choice
for low-volume products or for products with uncertain demand. Just-in-time effort
illustrates how much can be done to reduce complexity and variability in supply
chains by emphasising simplicity and consistency (Taylor, 2004: 47).
3.5.2.1.4 Retail customer replenishment programmes
The retail point in the supply chain is the first point at which changing consumer
preferences are experienced. This is also the point where the chain becomes visible
to the consumer (Taylor, 2004: 47).
Through consignment, producers retain both ownership and control over inventories
of their products at a retailer’s site. Consignment is an effective tool for selling
products that retailers might not be willing to carry conventionally. Consignment is not
the first choice for producers, because they have to wait longer before they get paid
for their products (Taylor, 2004: 47).
In vendor-managed inventory approach, a producer receives continuous updates on
a retailer’s inventory level and replenishes it as necessary, with the retailer taking
ownership of the goods on delivery. Producers are given better insight into the sales
UUnniivveerrssiittyy ooff PPrreettoorriiaa eettdd –– VVaann ddeerr MMeerrwwee,, TT ((22000066))
119
of their products, helping them to anticipate demand and improve on their supply.
The retailers also benefit, because they no longer have to track inventory levels or
place orders. Retailers also save money, because they need fewer inventories
(Taylor, 2004: 48).
The quick response program has combined some of the techniques of just-in-time
with technologies for monitoring inventory in real time. Electronic point-of-sale
systems automatically capture data about actual sales as they occur, and then
transmit this data to producers using electronic data interchange connections.
Producers can then respond with daily shipments of pre-tagged items that could go
directly from the trucks to the selling floor (Taylor, 2004: 48).
Continuous replenishment is an extension of the quick response programme.
Improved inventory control and joint forecasting is achieved by producers and
retailers pooling their understanding of consumer demand to improve the prediction
of future sales. Individual purchase orders are eliminated, further streamlining the
replenishment process (Taylor, 2004: 49). In 1993, the grocery industry launched its
own version of continuous replenishment, calling it the efficient consumer response
program. The major contribution of the efficient consumer response program is the
addition of category management, which organises promotion and replenishment
activities around groups of products that consumers view as roughly equivalent in
satisfying their needs. Category management helps grocery stores determine the
best mix of products to put on their shelves, to make sure their consumers’ needs are
met, even if there are occasional shortages (Taylor, 2004: 50).
Retail replenishment programmes reflect a continuous effort to simplify and stabilise
supply flows. The elimination of orders in continuous replenishment has removed a
major source of time and cost that added no value to the end- consumer. Real-time
data on sales allows retailers to respond quickly to variations in consumer buying
patterns, and the addition of joint forecasting allows retailers to prepare for changes
before they reach the stores (Taylor, 2004: 50).
The most ambitious replenishment programme to date is collaborative planning,
forecasting, and replenishment, a multi-industry effort that was formalised in 1998.
UUnniivveerrssiittyy ooff PPrreettoorriiaa eettdd –– VVaann ddeerr MMeerrwwee,, TT ((22000066))
120
This programme relies on advanced Internet- based tools to pool information about
demand and supply, allowing trading partners to co-ordinate their inventory decisions
and to smooth the flow of goods across the chain. It requires companies to make
substantial investments in new technologies. The biggest obstacle is cultural
differences: Companies are required to share highly detailed information about their
operations, and many are reluctant to do that (Taylor, 2004: 50-51). The goal of
collaborative demand planning is to generate a truer demand signal for all partners in
the supply chain. Customer and operational data should be shared among all
partners and joint decisions made in forecasting demand (Gattorna, 1998:200). The
results of collaborative demand planning are lower forecast errors and a smoother
flow of orders (Sagar, 2004:3).
A lean and demand-centric strategy forces the company to operate closer to the
customer. The ideal is to bring customers directly into the company's system, through
collaborative demand planning, as well as through execution (Reary, 2001).
3.5.2.1.5 The problem with supply chain programmes
A team of researchers at Ohio State University conducted a comprehensive analysis
of the inventory levels reported by U.S. corporations over the past 20 years, and they
reached a startling conclusion: The Great Inventory Reduction of the late twentieth
century never happened. The study did reveal a modest overall decline in total
inventory since 1980, but most of that was due to a small number of structural
changes in the supply chains. For example, the elimination of distributors and
retailers in the direct sales model, perfected by Dell, together with other advanced
supply chain techniques, allowed the computer industries to cut total inventories in
half over the 20 year-period. But for other industries, including apparel and grocery,
that pursued retail replenishment programmes, inventory levels remained the same
(Taylor, 2004: 51-52).
The problem with the retail replenishment programmes is that the inventory levels of
the companies participating in those programmes have, in fact, dropped, but it
appears that most of the reductions were achieved by displacing inventory within the
UUnniivveerrssiittyy ooff PPrreettoorriiaa eettdd –– VVaann ddeerr MMeerrwwee,, TT ((22000066))
121
chain, rather than actually eliminating it (Taylor, 2004: 52). In the industries that serve
mega-retailers such as Wal-Mart, inventories of finished goods have actually gone up
over the last 20 years (Taylor, 2004: 53). The programmes may work well for the
companies reporting success, but they do nothing to make the chains more efficient
or competitive overall (Taylor, 2004: 52). The dramatic reductions in inventory up the
chain at the retail level have come, to a large extent, from pushing inventory up the
chain, not from taking inventory out of the chain (Taylor, 2004: 54).
The pattern of pushing inventory up the chain can also be found in just-in-time
programmes. Here again, requiring suppliers to make precisely- timed deliveries and
to respond rapidly to changing consumption, reduces a producer’s inventory of raw
materials at the cost of forcing suppliers to hold more finished goods, in order to
buffer variability in demand. The standard response to this problem is for suppliers to
adopt just-in-time as well, but that can only work if customers and suppliers precisely
synchronise their operations. (Taylor, 2004: 54).
Just-in-time pushes inventory levels downstream, as well as upstream. The best
example comes from the automobile industry. Having sorted out most of the supplier
aspects of just-in-time, U.S. auto plants now operate with as little as three hours of
inventory on hand. On the other hand, the inventory of cars and trucks at dealerships
now runs as high as three months’ worth of supply. Just-in-time may be successful
for the automobile makers, but it does not make their supply chains any more
efficient. Of all the ways in which the industry could inventory, finished goods are by
far the most expensive (Taylor, 2004: 55).
When companies act as true trading partners, working together to pull time and cost
out of the chain, they can create a situation in which everyone makes more money
(Taylor, 2004: 56). The Ohio State University study found that the efforts to increase
efficiency through exercising power simply changed the location of the inefficiency.
The only way to get genuine improvement is to redesign the supply chain to increase
its efficiency as a whole.
The dilemma is that the adjacent members of a supply chain may have very real
opportunities to increase their shared profits, but the underlying tension concerning
UUnniivveerrssiittyy ooff PPrreettoorriiaa eettdd –– VVaann ddeerr MMeerrwwee,, TT ((22000066))
122
how profits are to be divided can prevent them from realising these opportunities.
The only way to overcome this problem is to somehow separate the effects of the co-
operation from those of the competition, recognising that both exist and devising a
way to distribute the profits from the co-operation in a manner that is fair to all
parties. This could prove to be difficult, but the technique of game theory could make
it a little easier (Taylor, 2004: 57).
3.5.2.2 Use of technologies
Many organisations taking a holistic approach to their supply chains are discovering
that new and converging technologies offer unheard-of- opportunities to compress,
and even to eliminate some of the aspects of these chains. Internet book sites, for
example, Amazon.com, do not restrict their customers’ choice of titles, but offer easy
search tools to locate books quickly and allow a much smaller investment to be made
in centralised stock holding (Gattorna, 1998:161).
The biggest change taking place in supply chain software today is the transfer/shift to
the Internet. The Internet does not, as was widely believed at the end of the 1990’s,
lead to a fundamentally different economy, nor does it alter the basic dynamics of
supply chains. Physical goods still have to get from one place to another, and the
Internet does not alleviate the need to choreograph that movement as precisely as
possible. What the Internet does do, however, is provide a vastly improved
communications medium for co-ordinating this movement of goods. Like the
telegraph, the telephone, and the fax machine before it, the primary impact of the
Internet is on speed, and not the nature, of the business (Taylor, 2004:122).
In the future, supply chain management will be transformed in a profound way. As
XML and Web services become widely adopted, all the routine transactions required
to run a supply chain will shift to the Internet. As a result of programmes
communicating directly with other programmes, these transactions will occur below
the level of human awareness and they will happen very quickly. Freed from the
mundane tasks of placing orders and updating schedules, the people who run supply
chains will be able to operate at a much higher level, setting goals for the chain and
UUnniivveerrssiittyy ooff PPrreettoorriiaa eettdd –– VVaann ddeerr MMeerrwwee,, TT ((22000066))
123
analysing its performance. In effect, running a supply chain will become as automatic
as walking; instead of thinking about how to get every muscle to move in just the right
way, one will be free to focus on where one is going and how to get there (Taylor,
2004:126-127).
3.5.2.3 Cut out unnecessary steps
A revealing exercise is to measure the actual process time in supplying a product
order as a proportion of the total order lead-time. Quite often the process time is a
very small fraction of the overall order lead-time. Organisations need to examine all
the opportunities to remove wastage and non-value adding processes. Many of the
reasons for these extraneous processes reflect traditional divisions between
functional areas, and the accompanying mistrust and lack of empowerment.
Organisational realignment into cells is a powerful way to get over the functional
issues (Gattorna, 1998:161-162).
3.5.2.3.1 Elimination of waste
The Japanese truly believe in eliminating waste. Waste in Japan, as defined by
Toyota’s Fujio Cho, is nothing other than the minimum amount of equipment,
materials, parts, and workers or working time which are absolutely essential to
production. Just-in-time defines seven types of waste that should be eliminated:
waste from overproduction, waste from waste of waiting time, transportation waste,
inventory waste, processing waste, waste of motion, and waste from product defects.
The definition of just-in-time leaves no room for surplus or safety stock. No safety
stock is allowed, because if one cannot use it now, one does not need it now; and
that would be waste. Hidden inventory in storage areas, transit systems, carousels,
and conveyors are key targets for inventory reduction (Chase, Aquilano and Jacobs,
2001:396).
Generally, waste elements in the manufacturing process, defined as non-value
adding activities, account for around 96 percent (Gattorna, 1998:342). The causes of
UUnniivveerrssiittyy ooff PPrreettoorriiaa eettdd –– VVaann ddeerr MMeerrwwee,, TT ((22000066))
124
waste in the manufacturing process fall into the following categories: motion, waiting,
faster than necessary pace, correction, over-processing, over-producing, conveyance
and inventory (Gattorna, 1998:343).
An analogy that is frequently drawn in Japan is that an organisation’s investment in
inventory is like a large, deep lake. Well below the surface of this lake are numerous
jagged rocks, but because of the depth of the water, the captain need have no fear of
striking one of the rocks. The comparison with business is simple: the depth of the
water in the lake represents inventory and the rocks represent problems. The
problems might include such things as volatile demand, inaccurate forecasts,
unreliable suppliers, quality problems and industrial relations problems (Christopher,
1998:185).
The Japanese philosophy is that inventory merely hides the problem. Their view is
that the level of water in the lake should be reduced. Now the captain of the ship is
forced to confront the problems and not avoid them. In the same way, if inventory is
reduced, then management must grasp the various problems, for example, forecast
inaccuracy and unreliable suppliers (Christopher, 1998:185-186).
A company should deliberately force the inventory levels down, particularly in good
economic times when problems can be exposed and corrected before they become
more problematic. (Chase, Aquilano and Jacobs, 2001:398).
The Japanese developed the so-called ‘Kanban’ concept as a way of lowering
inventory. Kanban is a pull system which is driven by the demand at the lowest point
in the chain. By progressively reducing the Kanban quantity, i.e. the amount
demanded from the supplying workstation, bottlenecks will become apparent.
Management will then focus attention on the bottleneck to remove it by the most
cost-effective means. The Kanban philosophy essentially seeks to achieve a
balanced supply chain with minimal inventory at every stage and where the process
and transit quantities of materials and stock are reduced to the lowest possible
amount. The Japanese maintain that the ultimate aim should be the economic batch
quantity of 1.
UUnniivveerrssiittyy ooff PPrreettoorriiaa eettdd –– VVaann ddeerr MMeerrwwee,, TT ((22000066))
125
The Japanese logic does not necessarily conflict with the traditional view of how the
economic batch or order quantity is determined. All that is different is that the
Japanese are seeking to minimise the batch quantity by shifting the curve that
represents the cost of ordering or the cost of set-ups to the left. This means that the
Japanese focus on finding ways to reduce set-up costs and ordering costs
(Christopher, 1998:186).
3 .5 .2 .3 .2 Reduce was te by poo l ing r i sk
The idea behind risk pooling is to combine the management of inventories that would
otherwise be controlled separately so that variability in demand can be handled with
less safety stock (Taylor, 2004:301).
Local variations in demand tend to cancel each other out. If the inventories for a few
regions are pooled, then the same safety stock can cover the risk of high demand in
any of the regions, reducing the total inventory requirements. Depending on
conditions, it may be possible to reduce inventories and holding costs by 25 % to 35
% using risk pooling (Taylor, 2004:302).
Risk pooling does not require that inventory actually be located in the same place. All
it requires is that inventory be managed as a common pool through a variety of
techniques, including echelon inventory, multi-sourcing, transhipment and direct
shipment (Taylor, 2004:303).
In the Echelon inventory approach, the set of facilities leading from the central facility
through the central stock provides backup to the regional stock, which provides
backup to the store stock in turn. As long as the delays in getting stock from the next
level up the chain are tolerable to the customer, the total inventory can be greatly
reduced (Taylor, 2004:303-304).
With multi-sourcing, instead of serving all the regions from a single central
warehouse, each region is served by its own, but the warehouses backstop each
other in the event of a stockout. The total inventory reduces as with the centralised
UUnniivveerrssiittyy ooff PPrreettoorriiaa eettdd –– VVaann ddeerr MMeerrwwee,, TT ((22000066))
126
inventory, but it retains the customer proximity of the regional facilities (Taylor,
2004:304).
Shipping from more distant facilities takes longer and is more expensive, so it may be
economically feasible to support all possible links between warehouses and regions.
The solution to this problem is to divide the facilities into separate but overlapping
risk pools (Taylor, 2004:304-305).
With transhipment, facilities exchange inventory themselves at a given level of the
chain. Transhipment is more expensive than multi-sourcing, because products travel
farther on average, but sometimes it is the only option. Transhipment is mostly used
at retail level, because no downstream facilities exist to receive merged shipments
(Taylor, 2004:305).
With direct shipment, one or two links of a supply chain are bypassed altogether and
upstream facilities backstop the inventory of downstream facilities (Taylor, 2004:306).
Risk pooling can be used with any strategy. Inventory levels can be trimmed by as
much as a third without compromising the service level. If a company’s strategy is
based on flexibility, it can respond to greater fluctuations in demand without
increasing inventories (Taylor, 2004:306).
Risk pooling produces the greatest benefits when the demand is uncertain and
relatively independent across regions. If the demand for a product is highly stable,
then one does not need much safety stock, so there is less to be gained by reducing
it. If the demand in the various regions rises and falls together, then risk pooling will
not be very effective, because shortages in one region will most likely be
accompanied by shortages in other regions (Taylor, 2004:307).
Risk pooling can be much harder to manage than a standard echelon distribution
system, for example, goods can be pulled and received from multiple facilities and
the alternatives may be limited to risk pools whose membership varies with every
facility (Taylor, 2004:307).
UUnniivveerrssiittyy ooff PPrreettoorriiaa eettdd –– VVaann ddeerr MMeerrwwee,, TT ((22000066))
127
Properly managed, risk pooling can improve the efficiency of a company (Taylor,
2004:307).
Customers will no longer tolerate failure and those organisations that fail to take up
the challenge of time compression of the supply chain will lose their customers to
those that do (Gattorna, 1998:168).
3.5.2.3.3 Increasing velocity
One of the simplest ways to improve the efficiency of a supply chain is to accelerate
the flow of goods across the supply chain. Acceleration improves efficiency, because
inventory does not stay in the chain so long, which brings down the cost of holding
inventory. Acceleration also enhances flexibility, because it reduces the time required
to change what is in the pipeline in response to changing demand (Taylor, 2004:298).
An obvious way to increase velocity is to switch to a faster mode of transportation.
The increased transportation costs have to be more than offset by the financial
benefits of decreased holding costs, improved sales, reduced write-downs, or some
combination of these factors (Taylor, 2004:298).
A much more effective way to increase velocity is to improve the way the supply
chain handles goods that are not in motion. Despite all the efforts to improve the
efficiency of supply chains over the past few decades, inventory still spends the
majority of its time waiting for something to happen (Taylor, 2004:298).
In short, a better way to increase the velocity of inventory is not to move it faster
when it does move, but to get it to spend more of its time in motion. Achieving this
goal is much harder than just changing the transportation mode. Systematic studies
need to be conducted of how inventory moves across the supply chain, each stop
must be examined, and ways to get it moving again must be found. To achieve
higher velocities, a company needs to re-engineer its supply chain operations,
applying techniques such as just-in-time, lean production, and related disciplines
(Taylor, 2004:299).
UUnniivveerrssiittyy ooff PPrreettoorriiaa eettdd –– VVaann ddeerr MMeerrwwee,, TT ((22000066))
128
One can identify slowdowns just by looking at the size of the queues in the supply
chain. When a bottleneck is found, the first choice should be to find a way to increase
the throughput of that operation, either by adding capacity or by improving the
operation itself. If a way to fix the bottleneck cannot be found, scaling back the
upstream operations that feed into the bottleneck should be tried. It may seem
counterintuitive to accelerate the flow of inventory by slowing some operations down,
but that is precisely the effect that will be achieved. By not pulling inventory into the
chain until it has a clear path, one is making sure that inventory moves faster once it
does enter the chain (Taylor, 2004:299-300).
The value-added and non-value added activities should also be reviewed. The only
activities that add value are those that change the product in a way that increases its
utility to the customer, usually by changing either its form or its location to bring it
closer to the needs of the customer. The situation can get worse, because some
activities actually reduce value (Taylor, 2004:300).
The flow of demand and cash also gains from the increase in velocity. The faster
demand moves up the supply chain, the more quickly upstream suppliers can
respond to changes in demand. Accelerating the demand signal is one of the most
effective ways of eliminating demand amplification, which is the source of much
disruption in supply chains. Finally, accelerating the flow of cash reduces the total
cost of debt across the chain, further improving efficiency without impairing flexibility
(Taylor, 2004:301).
3.5.2.4 Source with service in mind, as well as cost
Sourcing decisions should be viewed to achieve overall service improvement
requirements. Some suppliers co-locate on their customers’ premises. A second
factor in effective sourcing is developing the right relationship with the supplier.
Working together across seamless boundaries is a prerequisite for time compression
(Gattorna, 1998:163).
UUnniivveerrssiittyy ooff PPrreettoorriiaa eettdd –– VVaann ddeerr MMeerrwwee,, TT ((22000066))
129
3.5.2.4.1 Winning through collaboration
When trading partners compete with each other over a fixed sum of money, they are
playing what game theorists call a ‘zero-sum’ game. In ‘zero-sum’ games, there is a
fixed amount of money at stake, and players compete to see who can win the largest
share (Taylor, 2004: 57).
Trading partners that want to improve their combined profits, rather than just fight
over a fixed amount of money, can look for ways to change their relationship into a
positive-sum game. In a co-operative game, the players focus on how to increase
their total winnings and relegate the allocation of those winnings to a secondary
concern. In a competitive game, the winnings are considered fixed and the allocation
is everything (Taylor, 2004: 59-60).
The new competition between supply chains is not based on the effectiveness of
individual links; it is based on the ability of the chain as a whole to bring better
products to the market faster and cheaper than other chains (Taylor, 2004: 64).
The members of a team such as this, need to plan and act with the integrity of a
single organisation, working together to simplify and stabilise the flow of demand,
supply and cash across the chain. The pooling of interests, the synergy of planning
and acting, is the essence of supply chain integration. It means that the members of
the chain come together to form a larger whole, one in which the parts are carefully
aligned and synchronised so that the chain behaves as a single, co-ordinated system
(Taylor, 2004: 64). The current push for collaboration across the chain represents the
natural convergence of two major trends in supply chain management. One trend is
away from common ownership and towards independent companies. The other trend
is away from ad hoc transactions and toward tighter integration. The goal of supply
chain collaboration is where the two trends meet: a team of companies achieving a
high degree of integration across the supply chain while retaining independent
ownership and control (Taylor, 2004: 64).
UUnniivveerrssiittyy ooff PPrreettoorriiaa eettdd –– VVaann ddeerr MMeerrwwee,, TT ((22000066))
130
3.5.2.4.2 Design products with the supply chain in mind
Products are not often designed with responsive supply chain management
objectives in mind, but are often designed in a modular fashion to allow for quick
customisation to the end product. Modules cannot only be made in bulk very
efficiently, but this also ensures the flexibility to configure rapidly to a customer order
requirement. It also allows the two operations to be decoupled and separated. The
bulk items can be produced centrally for maximum efficiency and the customised
items assembled just-in-time in a location close to the final customers to ensure
maximum service effectiveness. An example of process innovation is a consumer
goods manufacturer who has developed the technology to produce colourless,
flavourless products and inject the necessary flavour and colour just before the
product is packaged (Gattorna, 1998:162-163).
3 .5 .2 .4 .3 Designing for supply
In the past, engineers designed a product and then handed it over to manufacturing
to figure out how to build it. The design for manufacturing and concurrent engineering
approach ensured that manufacturing requirements were taken into account during
the design process. Manufacturing companies designed products that were easier to
build and therefore companies were able to simplify production, reduce costs and
enhance quality (Taylor, 2004:307-308).
Today, design for manufacturing is being pushed outside the walls of the factory and
applied to supply chains. The new movement called ‘design for supply’ takes the
entire sequence of operations and movement into account to convert raw materials
into usable products. The only change from the design for manufacturing to design
for supply is the shift in focus from a single company to a coalition of companies
(Taylor, 2004:308).
Two of the most basic design for supply techniques is simplification and commonality
(Taylor, 2004:308). The goal of simplification is to reduce the number of alternative
UUnniivveerrssiittyy ooff PPrreettoorriiaa eettdd –– VVaann ddeerr MMeerrwwee,, TT ((22000066))
131
assemblies by eliminating unnecessary options, even if that increases the cost of
components (Taylor, 2004:308). The standardisation approach seeks out
duplications in like items, which may be called for, either on the same or totally
different specifications. Standardisations seek the one or few line items that can
perform multiple tasks, thereby replacing a multitude of line items specifically
designed for varied, yet similar functions (Kobert, 1992:91), (Harmon, 1992:170),
(Hughes, Ralf and Michels, 1999:50), (Harmon & Peterson, 1990:x-xii), (Chase,
Aquilano and Jacobs, 2001:151-152). Similarly, the goal of commonality is to reduce
the number of similar components by reducing the choices available to designers
(Taylor, 2004:308). This may cause a few products to have larger components than
they need, but it streamlines production by reducing the variety of materials, and it
reduces purchasing costs by combining inventories that would otherwise be handled
separately (Taylor, 2004:308).
A more ambitious technique is the use of modularity in product design (Taylor,
2004:308-309). . Rather than designing each new product from the beginning;
engineers design products as assemblies of pluggable components, using existing
components wherever possible. Savings can be accomplished from re-using the
same components across many different products. Customer options are also
increased by allowing configurations to be assembled from a relatively small set of
components (Taylor, 2004:309). Manufacturers can also produce the modules of a
product simultaneously, rather than building the entire product sequentially (Taylor,
2004:309). Parallel production permits shorter lead times, improving customer
service while reducing holding costs. Parallel production also permits greater
flexibility in the choice of production sites by giving manufacturers the option of using
specialised facilities for the various components (Taylor, 2004:309).
Another technique is designing products for convenient packaging. Low-density
products are expensive to ship, because they cause vehicles to fill up before they
reach their maximum carrying weight. These products are increasingly being
designed in a modular fashion that allows final assembly to be postponed until late in
the chain. An example is ready-to-assemble furniture, such as desks and shelves,
which require final assembly to be performed by the customer (Taylor, 2004:310).
UUnniivveerrssiittyy ooff PPrreettoorriiaa eettdd –– VVaann ddeerr MMeerrwwee,, TT ((22000066))
132
Another technique used in design for supply, in the case of retail products, is making
sure the product will display well in stores. For example products are designed to fit
on to the retailer’s shelves. Even when there is no primary packaging, display
characteristics have a big impact on design. Large plastic items, such as cans and
storage containers, are now designed to nest inside each other when stacked
reducing the precious retail space required displaying these low value-to-volume
products (Taylor, 2004:310).
Another technique is to involve suppliers in the design of a product. Suppliers should
be consulted concerning features, construction techniques and costing in an effort to
improve the final product (Taylor, 2004:310).
The design-for-supply initiative is important as it reverses the roles of manufacturing
and supply chain management. The needs and desires of the manufacturing group
are often subordinated to the requirements of the supply chain as a whole. (Taylor,
2004:310-311).
The main obstacle to design for supply is not the demand of the technique itself, but
the difficulties many production managers have in adjusting to the changing priorities.
Any attempt to redesign the supply chain must therefore be embraced, supported,
and actively managed by the most senior executives within the company (Taylor,
2004:311).
3 .5 .2 .4 .4 Customization
In the drive for reduced supply chain costs and improved efficiency, many companies
have adopted a ‘one-size-fits-all’ mentality when it comes to providing logistics
services (Gattorna, 1998:42).
UUnniivveerrssiittyy ooff PPrreettoorriiaa eettdd –– VVaann ddeerr MMeerrwwee,, TT ((22000066))
133
3.5.2.5 Reduce forecast time and increase accuracy
A key factor in effective time compression is both reducing the forecast time and
increasing forecast accuracy, preferably through the use of actual, rather than
predicted demand. Businesses have remained with the made-to-forecast model,
despite its obvious flaws, simply because alternative approaches appeared to be too
costly. The forecast, more often than not, is singled out as the culprit leading to lost
sales and possible expensive inventory write-downs and write-offs. Experiences
differ by industry, but best-in-class companies struggle to improve their overall
forecast accuracy above 80 to 85 per cent over their planning horizons. This,
however, grossly overstates the accuracy level for the slow-moving products. These
products experience much larger volatility with actual demand. Another factor, often
overlooked, is the reduction of forecast accuracy over time. It is not uncommon for
organisations to undertake significant commitments to inventory, capacity and other
resources in the supply chain based on forecasts beyond their legitimate planning
horizons. In order to cut back the forecasting time horizon and dramatically increase
accuracy, organisations can actually delay the requirement for some demand
information until key stages of the process have been reached. This can provide a
greater level of responsiveness even where further shortening of the overall process
is not feasible. It is necessary to have responsive systems that can supply the latest
information to the point of need in a timely fashion. More responsive systems do not
imply that systems have to work in real time, but only in shorter update periods than
the individual process steps. The benefits of shorter and more accurate forecasting
cycles are beginning to emerge. Some retailers in the UK, for example, are moving
away from costly, on-value-added warehousing through better forecasting, smaller
production batches and more emphasis on customer service (Gattorna, 1998:163-
167).
3.5.2.6 Redesign production processes
Long production runs were traditionally necessary, because changeover processes
were complex, time consuming and wasteful. Production processes can also be re-
UUnniivveerrssiittyy ooff PPrreettoorriiaa eettdd –– VVaann ddeerr MMeerrwwee,, TT ((22000066))
134
engineered, difficult sub- assembles can be ordered and built to forecast information,
and can be quickly assembled into one of many customised end configurations when
the final order arrives. The postponement approach, or delayed configuration
(Christopher, 1998:136) (Gattorna, 1998:78), for example, is becoming the norm in
the personal computer industry. Where a process cannot be broken into intermediate
stages and insufficient capacity occurs to make the total requirement inside the
response time, an alternative approach can be taken. By using historical information
on the level of order fluctuation of a specific product, a confidence level can be
established about what can safely be made in advance and what can be left until
after the order has arrived. The challenge is to reduce the economic batch quantity to
one by challenging the current changeover time and cost (Gattorna, 1998:167). By
adding the desired variety features at the optimal point, demand can be pooled for
the different product options and final configured inventories kept to a minimum
(Gattorna, 1998:203).
3.5.2.7 Theory of constraints
The Theory of Constraints looks for the weakest link in the chain. Both the internal
and external chains should be considered. The weakest link of the internal chain
defines the maximum possible output with the current resource availability (Ptak and
Schragenheim, 2000:19). Any realistic planning should focus on the resource that
lacks the most capacity (Ptak and Schragenheim, 2000:19). When the market
demand is lower than the capacity of the critical resource, then the pace of the whole
system should be fully dictated by the market demand. When the demand
approaches the limit imposed by the most loaded resource, this particular resource,
in turn becomes a capacity constraint resource. It is the balance between the
demand and capacity constrained resource that dictates the actual pace of the
system.
UUnniivveerrssiittyy ooff PPrreettoorriiaa eettdd –– VVaann ddeerr MMeerrwwee,, TT ((22000066))
135
The Theory of Constraints is based on the following three basic principles (Ptak and
Schragenheim, 2000:18):
• An organisation has a goal to achieve.
• An organisation is more than the sum of its parts: There should be synergy
between the various parts of the organisation; otherwise there is no value in
staying together within one organisation. The aim of synergy is to synchronise
many different resources and activities in order to create value in the eyes of
the customer. The synchronisation of the various parts generates many
dependencies within the organisation.
• The performance of an organisation is constrained by very few variables: The
Theory of Constraints defines a constraint as anything that limits the
performance of the whole organisation versus its goal. Only a few constraints
can be active at a time.
The Theory of Constraints is based on DBR Methodology, i.e. Drum-Buffer-Rope.
The Drum must be protected from Murphy’s Law. All the other parts of the system
have enough flexibility to support the Drum, because of their excess capacity. Buffer,
according to the Theory of Constraints, is designed to protect only the critical areas,
those areas that control the performance of the whole system. In the Theory of
Constraint terminology, they are the physical constraints of the system. The rope is
the mechanism that guards that no materials will be released before the scheduled
time. The Theory of Constraints logic points out that there is no point in fully utilising
resources that have excess capacity (Ptak and Schragenheim, 2000:20-21).
There are normally two ways of dealing with bottlenecks. Firstly, a buffer inventory
should be kept in front of the bottleneck to make sure that it always has something to
work on. Because it is a bottleneck, its output determines the throughput of the
system. Secondly, communicate back stream what the other production areas
downstream have produced in order for the areas downstream to provide only the
required volume. This keeps inventory from building up. This communication, called
the rope, can either be formal, such as a schedule, or informal, such as a daily
discussion (Chase, Aquilano and Jacobs, 2001:675).
UUnniivveerrssiittyy ooff PPrreettoorriiaa eettdd –– VVaann ddeerr MMeerrwwee,, TT ((22000066))
136
It is the understanding and management of constraints within the manufacturing
process that will provide the key to successful implementation of synchronous
manufacturing. The throughput of the entire process is totally dependent on the rate
of the slowest resource, or bottleneck. Bottlenecks govern both throughput and
inventories (Gattorna, 1998:340).
According to the Theory of Constraints, the goal of a company is to make money
(Chase, Aquilano and Jacobs, 2001:665). From an operations standpoint, the goal of
the firm is to increase throughput while simultaneously reducing inventory and
reducing operating expense (Chase, Aquilano and Jacobs, 2001:667).
3.5.2.8 Unbalanced capacity
In the past most manufacturers tried to balance capacity across a sequence of
processes in an attempt to match capacity with market demand. However,
unbalanced capacity is better (Chase, Aquilano and Jacobs, 2001:668).
In synchronous manufacturing thinking making all capacities the same is viewed as a
bad decision. Such a balance would only be possible if the output times of all
manufacturing stations were constant or had a very narrow distribution. A normal
distribution in output times causes downstream stations to have idle time when
upstream stations take longer to process. On the other hand, when upstream stations
process in a shorter time, inventory builds up between the stations. The effect of
statistical variation is cumulative. The only way to smooth the statistical variation is
by increasing the work-in-progress to absorb the variation or by increasing the
capacities downstream to be able to make up for longer upstream times. The rule is
that capacities within the process sequence should not be balanced to the same
levels.
Attempts should rather be made to balance the flow of product through the system.
When flow is balanced, capacities are unbalanced (Chase, Aquilano and Jacobs,
2001:668).
UUnniivveerrssiittyy ooff PPrreettoorriiaa eettdd –– VVaann ddeerr MMeerrwwee,, TT ((22000066))
137
3.5.2.9 Supply chain throughput efficiency
In general, most of the time spent in a supply chain is non-value adding time. To
begin to make significant improvements in throughput efficiency firstly requires a
detailed understanding of the processes and activities that comprise the total supply
chain. A useful tool here is supply chain mapping (Christopher, 1998:113).
A supply chain map is a time-based representation of the processes and activities
that are involved as the materials and products move through the chain. In these
supply chain maps, it is usual to distinguish between horizontal time and vertical
time. Horizontal time is time spent in process, for example, in-transit time,
manufacturing or assembly time, time spent in production planning or processing.
Vertical time, on the other hand, is time when nothing is happening and therefore the
material or product is standing still as inventory. No value is being added during
vertical time; only cost (Christopher, 1998:113-114).
3.5.2.10 Process throughput reduction
Critical processes are subject to the well-known rule that time is money. For
example, the longer a customer waits, the more likely it is that he will switch to a
different vendor. The longer material is kept in inventory, the higher the investment
cost. Unfortunately, critical processes often depend on specific limited resources,
resulting in bottlenecks (Chase, Aquilano and Jacobs, 2001:107).
Throughput time can sometimes be reduced without purchasing additional equipment
(Chase, Aquilano and Jacobs, 2001:107-108). The following are a few suggestions
for reducing the throughput time of a process that will not require the purchase of
new equipment:
• Perform activities in parallel: Most of the steps in an operations process are
performed in sequence. A serial approach results in the throughput time for
the entire process being the sum of the individual steps plus transport and
waiting time between steps. Using a parallel approach can reduce throughput
time by as much as 80 percent and produce a better result. A classic example
UUnniivveerrssiittyy ooff PPrreettoorriiaa eettdd –– VVaann ddeerr MMeerrwwee,, TT ((22000066))
138
is product development where the current trend is toward concurrent
engineering. Instead of forming a concept, making drawings, creating a bill of
materials and mapping processes, all activities are performed in parallel by
integrated teams. Development time is reduced dramatically, and the needs of
all those involved are addressed during the development process.
• Change the sequence of activities: Documents are often transported back and
forth between machines, departments, buildings, and so forth. For example, a
document might be transferred between two offices a number of times for
inspection and signing. If the sequence of some of these activities can be
altered, it may be possible to perform much of the document’s processing
when it comes to a building for the first time.
• Reduce interruption: Many processes are performed with relatively large time
intervals between each activity. For example, purchase orders may be issued
only every other day. Individuals preparing reports that result in purchase
orders should be aware of deadlines to avoid missing them, because
improved timing in these processes can save many days of throughput time.
By performing a value-added analysis, focussed on eliminating the non-value adding
activities, the manufacturer can reduce customer order lead times, save cost and
employee time per order and increase customer satisfaction.
3.5.2.11 Postponement
Many companies are now seeking to construct supply chains to enable them to
support a marketing strategy of mass customisation. The challenge is to find ways of
achieving the marketing goal of tailored solutions for their customers’ requirements
without increasing finished goods inventory and without incurring the higher costs of
production normally associated with make-to-order.
Often this can be achieved by postponing the final configuration or assembly of the
product until the actual customer requirement is known (Christopher, 1998:210). For
example, Hewlett-Packard factories used to ship complete finished goods to
distribution centres and then on to dealers. After adopting a policy of postponement,
UUnniivveerrssiittyy ooff PPrreettoorriiaa eettdd –– VVaann ddeerr MMeerrwwee,, TT ((22000066))
139
products were shipped in a generic state. Local features were then added for each
specific market segment at the point of distribution (Hughes, Ralf and Michels, 1999:
17).
The differentiation of products closer to customers is regarded as one of the seven
principles of supply chain management (Berger & Gattorna, 2001: xiii).
Postponement, also called delayed differentiation or freeze-point delay, is the most
exciting innovation towards design for supply. The basic idea of postponement is to
build products in generic form at the plant, ship them to the distribution centres close
to their destinations and then perform the final operations that result in a product.
Postponement offers greater economies of scale in both production and
transportation and also increases a company’s flexibility to respond to changing
demand (Taylor, 2004:311).
The postponement technique has several advantages. First, it allows products to be
specialised to different markets without compromising economies of scale in
production and transportation. Postponement allows specialisation to be done close
to the customer. The manufacturing plant regains economies of scale by producing
large batches of generic product and customers continue to get the variety they want
(Taylor, 2004:312).
Another benefit of postponement is that it takes advantage or risk pooling to reduce
inventory requirements. Postponement achieves risk pooling by combining the
inventories for an entire family of products into a single pool, significantly reducing
the total inventory that must be kept in each region (Taylor, 2004:313). Inventory can
be held at a generic level so there will be fewer stock-keeping variants and hence
fewer inventories in total. Because inventory is generic, a company’s flexibility is
greater, meaning that the same components, modules, or platforms can be used in a
variety of end products (Christopher, 1998:136).
Postponement relies less heavily on forecasting. Production can be based on
aggregate forecasts, which are always more accurate than detailed forecasts.
Postponement allows the variations of a generic product to be pulled through the
UUnniivveerrssiittyy ooff PPrreettoorriiaa eettdd –– VVaann ddeerr MMeerrwwee,, TT ((22000066))
140
chain by immediate demand, rather than being pushed down the chain based on
uncertain, item-level forecasts. At the same time, postponement offers an economical
way of increasing the level of customisation by allowing minor variations to be
determined all the way out to the point of sale (Taylor, 2004:313). Forecasting is also
easier at the generic level than at the level of the finished item. The last point is
particularly relevant in global markets where the local forecasts will be less accurate
than a forecast for worldwide volume (Christopher, 1998:136-137).
Postponement is a form of design for supply and therefore needs products to be
designed and constructed in a modular way, making it easy for downstream facilities
to assemble the final configuration. In the case of computer peripherals, for example,
it may be necessary to redesign the power supply as a plug-in module rather than
building it into the chassis (Taylor, 2004:313).
Postponement requires a change of the role of distribution centres. The role of
distribution centres requires changing from the storage and handling operations to
performing final product assembly. If the distribution centres lack the space,
equipment, or skills necessary to perform the final assembly, converting to
postponement can lead to increases in defects, delays and other production
problems (Taylor, 2004:313-314).
If transforming distribution centres into final assembly is not a viable postponement
option, it can still be applied within the main manufacturing plant. The increased
flexibility that comes from delaying differentiation may still justify the change.
Benetton, for example, changed the sequence of operations involved in making its
sweaters, dying the final sweater rather than dying the wool prior to weaving.
Although this change increased the cost of production by 10%, it produced net
benefits, because it allowed the company to respond much more quickly to emerging
preferences among colours (Taylor, 2004:314).
If the final configuration process is quite simple, or if retailers have special skills, it is
possible to extend postponement to the point of purchase (Silver, Pyke and
Peterson, 1998:474), (Taylor, 2004:314). Bicycles, for example, are specially
configured for individual consumers. It is even possible for final configuration to occur
UUnniivveerrssiittyy ooff PPrreettoorriiaa eettdd –– VVaann ddeerr MMeerrwwee,, TT ((22000066))
141
in the consumer’s own home, as in the case of home entertainment systems (Taylor,
2004:314).
Postponement offers many potential benefits, but it is not without its costs and
challenges. The challenges of postponement include quality and organisational
problems when assembly is pushed down the supply chain. Modularisation of the
product and the re-sequencing of operations may increase the cost of production.
The challenge of postponement is that the technique should produce net savings
(Taylor, 2004:314-315). The postponement technique works best if the variety of
configurations from a common base product is large, and the demand across
configurations is hard to predict. Postponement also works well with innovative
products, such as clothing and consumer goods. Hewlett Packard, for example, even
used postponement with desk jet printers which are relatively mundane products
(Taylor, 2004:315).
The best effective approach is to use postponement selectively across product lines,
applying it only where the advantages outweigh the cost. A company could keep the
bulk of its production in its factories where it is cheaper and easier to manage, safety
stock in downstream facilities could be reduced, and the ability to respond to
unexpected demand at the point of sale is increased (Taylor, 2004:315-316).
To successfully use postponement, there are at least four enablers or building blocks
that will help to make it easier (Gattorna, 1998:88):
Firstly, products or processes should be modular in structure. Product modularity is
the ability to build and test the product in modules, rather than as a complete unit,
and requires the module interface to be redesigned so that these modules can easily
be assembled and tested as a total unit. Process modularity allows a process to be
completed in sub-processes, often leading to shorter lead times and flexibility in
meeting the demand of multiple end products (Gattorna, 1998:88).
Secondly, design engineers should be aware of the importance of supply chain
management, so that they are keenly pursuing design for postponement
opportunities (Gattorna, 1998:88).
UUnniivveerrssiittyy ooff PPrreettoorriiaa eettdd –– VVaann ddeerr MMeerrwwee,, TT ((22000066))
142
Thirdly, postponement involves multiple functions or organisations in collaboration.
For example, postponement may require a supplier to design a standard component.
Logistics postponement may require distribution centres or the channel partner to
take over some customisation steps that used to be carried out by manufacturing.
Research and development functions also have to be involved. In some cases, pull
postponement requires marketing to reposition the product in the marketplace
(Gattorna, 1998:89).
Finally, the degree of postponement must be determined. To determine whether this
would be best for the company, and to be able to justify it requires the ability to
quantify the costs and benefits of postponement. Analytical models are often helpful
as a means to help motivate or justify postponement (Gattorna, 1998:89).
3.5.2.12 Rethink distribution options
In the past, delivery frequencies were driven by transport economies. Product was
shipped only when there was enough to fill the lorry or even the boat. Being
responsive, however, requires that shipping corresponds, not only with distribution
economies, but also with customer needs. A company can join a larger supplier of
the same customer if the locations are convenient. Where other suppliers are not
available, another option is to form a consortium with other smaller suppliers, to use
a nominated carrier and share the costs. Third-party suppliers and service providers
are increasingly able to provide a shared service with those inside and outside the
industry and therefore provide the necessary economies of scale. Many supermarket
chains are developing distribution service offerings, collecting suppliers’ product from
the factory gate in return for being charged just the factory gate price (Gattorna,
1998:168).
UUnniivveerrssiittyy ooff PPrreettoorriiaa eettdd –– VVaann ddeerr MMeerrwwee,, TT ((22000066))
143
3.6 Improving v is ib i l i t y o f demand
The extension of the customer’s order cycle does not mean that customers have to
be persuaded to wait longer for the delivery of their order. What is meant by
extending the customer’s order cycle is that we should seek to obtain significantly
earlier warnings of the customer’s requirements. The two problems are that, first of
all, the demand penetration point is too far down the pipeline and secondly, that the
demand is hidden from view and what one tends to see are orders (Christopher,
1998:172).
The demand penetration point is the point in the supply chain where the real demand
meets the plan (Christopher, 1998:172). The decoupling point is the point that
indicates how deeply the customer order penetrates into the goods flow. This is also
the point where the order-driven activities meet the forecast-driven activities. It is the
place where the independent demand is converted into dependent demand
(Hoekstra & Romme, 1992:66). Ways must be identified to push the demand
penetration point as far as possible upstream. Marketplace data, for example, can be
shared with manufacturing and purchasing. Another route would be to shift the order
penetration point upstream by postponing the final commitment of the product to its
final form (Christopher, 1998:173).
Perhaps the greatest opportunity for extending the customer’s order cycle is by
gaining earlier notice of their requirements. In so many cases, the supplying
company receives no indication of the customer’s actual usage until an order arrives.
If the supplier could receive feed-forward on what was being consumed, he would be
able to anticipate the customer’s requirements and better schedule his own supply
chain activities. In a sense, the information we receive is like the tip of an iceberg.
The area below the surface of the iceberg represents the ongoing consumption,
demand or usage of the product which is hidden from the view of the supplier. It is
only when an order is issued that demand becomes transparent (Christopher,
1998:173).
UUnniivveerrssiittyy ooff PPrreettoorriiaa eettdd –– VVaann ddeerr MMeerrwwee,, TT ((22000066))
144
3.6.1 Causes of induced demand volatility
As businesses became more competitive and used promotions to increase demand,
it became apparent in some industries, especially consumer packaged goods and
retailing, that man, more than nature controlled what would happen in the future.
Methods were used that would look at the past and determine man’s impact on the
demand. Once this impact was understood, it could be used to forecast the future. So
the philosophy of today is primarily the one expressed by Leibniz and Chesterton:
We can predict the future, for the most part, based on some understanding of
peoples’ effect on demand, which is expressed in seasonal and trend buying patterns
and responses to promotions and business cycles. The term “for the most part” is
fitting because while demand forecasting is largely about understanding the reasons
behind fluctuations in demand; it is just as important, though, to recognise and cope
with the uncertainty that remains. This involves such measures as contingency
planning, inventory safety stock and excess capacity which are designed to deal with
uncertainty in demand (Lapide, 1997).
Given the resultant cost and complexity, organisations have a real interest in
identifying and addressing the causes of demand volatility. While organisations may
never achieve a perfectly smooth demand curve, organisations can certainly
understand and address their self-induced drivers of demand swings. The primary
causes of demand volatility are terms of trade; promotions and pricing; specific
company policies and distribution channel structure (Gattorna, 1998:143).
3.6.1.1 Terms of trade
Terms of trade or credit terms refer to the conditions under which organisations
require customers to pay for their purchases (Gattorna, 1998:144).
By fixing a regular date of payment, organisations provide customers with an ideal
regular date for purchase. In order to maximise credit terms, customers will order at
the beginning of each month, effectively giving them 60 days credit instead of 30
days (Gattorna, 1998:144).
UUnniivveerrssiittyy ooff PPrreettoorriiaa eettdd –– VVaann ddeerr MMeerrwwee,, TT ((22000066))
145
Organisations need to be clear about credit terms, communicate those terms
effectively to customers, manage them to reduce volatility and plan their production
and supply chain processes accordingly (Gattorna, 1998:145).
3.6.1.2 Promotions and pricing
Organisations have many reasons for offering price discounts or bulk purchase
discounts for moving large quantities of product in a short period of time. Often,
however, these discounts create demand disturbances that greatly distort the
demand placed on organisations and do not represent the consumer’s real end
consumption or underlying demand (Gattorna, 1998:145).
A similar effect is created when organisations give customers, such as wholesalers,
advanced warning of price increases. In this situation, customers will buy in bulk to
lock in more purchases at a reduced cost, this again bringing forward future
consumption (Gattorna, 1998:147).
The problem can further be exacerbated when the sales promotions are unplanned,
thereby giving the supply chain insufficient time to plan replenishment and increase
production to meet the increase in demand (Gattorna, 1998:147).
3.6.1.3 Specific company policies
Organisations frequently put in place policies that result in customers adjusting their
buying behaviour in an attempt to maximise the benefit of these policies. The
resulting effect is that the policies distort customer behaviour, causing demand
volatility (Gattorna, 1998:147).
Minimum order quantities are a good example of policies which distort customer
ordering behaviour and drive volatility (Gattorna, 1998:149).
UUnniivveerrssiittyy ooff PPrreettoorriiaa eettdd –– VVaann ddeerr MMeerrwwee,, TT ((22000066))
146
Another way in which to reduce volatility is to reduce the production lot sizes and
lead times of production and /or procurement. This is the secret behind Kanban or
pull system replenishment systems (Ptak and Schragenheim, 2000:144).
3.6.1.4 Distribution channel structure
The longer the distribution channels, the greater the distance between supplier and
end customers. As a result, intermediaries stagger their ordering and generate
demand volatility. The greater the number of channel members, the greater the
number of opportunities for demand to be distorted (Gattorna, 1998:149). Long lead
times could create a vicious circle. The longer the quoted lead time, the more time
we give the customer to change his mind which causes last minute changes. The
impression might be that the quoted lead times are not long enough which prevents a
company from cutting lead times (Goldratt, 1990:65).
Effective demand management is achieved when an organisation is no longer driving
customer behaviour in a way that adversely affects organisational and /or supply
chain performance. Some of the significant benefits of effective demand
management include: reduced risk due to higher demand certainty; reduced
inventory levels; improved customer service; improved visibility of real or end
customer demand; reduced reliance on forecasting; improved forecasting accuracy
and fewer staff required to cover demand peaks (Gattorna, 1998:151).
Customers will never be completely predictable, but organisations can ensure that
they themselves are not creating volatile customer demand patterns. Effective
demand management represents a significant and often unexplored opportunity for
organisations to simplify their supply chain operations. The power of demand
management lies in the fact that demand volatility is often induced by organisations
through their own policies and procedures. Consequently, it is within a company’s
capability to control and influence the demand volatility for its own benefit (Gattorna,
1998:153).
UUnniivveerrssiittyy ooff PPrreettoorriiaa eettdd –– VVaann ddeerr MMeerrwwee,, TT ((22000066))
147
3.6.2 Importance of supply chain communication
Communication is regarded as the most important skill in life (Covey, 1990:237).
The advent of information technology has made the exchange of information
between supply chain partners easy and advantageous. The sharing of common
information has resulted in a quicker response to market place changes with less
inventory and lower risk of obsolescence (Christopher, 1998: 235).
Feedback is the lifeblood of supply chains, and many of the supply chain
improvement initiatives are designed to improve the flow feedback up the chain
(Taylor, 2004:86). One of the advantages of vendor-managed inventory, for example,
is that it lets suppliers monitor inventory levels directly in distribution centres and
retail outlets, giving them much earlier feedback on the flow of products and allowing
them to tune their production accordingly. The use of point-of-sales systems in the
quick response programme improves feedback by pushing the flow of information all
the way out to the cash register and detecting the movement of goods the moment it
occurs (Taylor, 2004:86), (Christopher, 1998:195), (Gattorna, 2000:387), (Jain,
1994:2).
The free exchange of information across the supply chain provides the feedback
necessary to regulate the flow of supply, demand and cash across the chain (Taylor,
2004:86).
The great power of feedback in supply chains is that it reduces uncertainty by giving
companies advance information about upcoming variations in demand and supply,
allowing them to cope better with these variations. Without this advance notice, the
only protection against variability in supply and demand is to hold enough inventory
to handle the greatest demand and the lowest supply that are likely to occur, and
inventory is a very expensive form of insurance (Taylor, 2004:86). The fact that
information can reduce the need for inventory has led to systematic efforts within
many industries to replace inventory with information wherever possible. Substituting
information for inventory is one of the most vital aspects of supply chain management
(Taylor, 2004:86-87).
UUnniivveerrssiittyy ooff PPrreettoorriiaa eettdd –– VVaann ddeerr MMeerrwwee,, TT ((22000066))
148
The use of these logistics information systems has the potential to convert supply
chains into demand chains in the sense that the system can now respond to knowing
what the demand will be, rather than having to anticipate that demand through a
forecast (Christopher, 1998:199).
3.6.3 Increasing pipeline visibility
One of the main reasons why any company carries safety stock is because of
uncertainty. A key to improving reliability in logistics processes is enhanced pipeline
visibility. It is often the case that there is limited visibility of downstream demand at
the end of the pipeline. This problem is exacerbated the further removed from final
demand the organisation or supply chain entity is (Christopher, 1998, 32).
Small disturbances in one part of the system can very quickly become magnified as
the effect spreads through the pipeline. Many consumer product companies that are
heavy spenders on trade promotions, like additional discounts and incentives, do not
realise what the true costs of such activities are. In the first instance, there is a loss of
profit through the discount itself, and then there is the hidden cost of the disturbance
to the logistics system. The promotional activity can trigger the ‘acceleration effect’
and hence create a Forrester-type surge throughout the logistics pipeline
(Christopher, 1998: 204). Such unpredictable changes in the production requirement
add considerably to the unit cost of production (Christopher, 1998: 206).
The surge effect can be dramatically reduced by linking the retail checkout desk to
the point of production by means of electronic data transfer (Christopher, 1998:207).
Sharing sales information has been viewed as a major strategy to counter the so-
called ‘bullwhip effect’. This is essentially the phenomenon of demand volatility
amplification along the supply chain, from the retailers, distributors, manufacturer,
and the manufacturers’ suppliers, and so on. Demand distortion can create problems
for suppliers, such as inaccurate demand forecasts, low capacity utilisation,
excessive inventory and poor customer service. By letting the supplier have visibility
UUnniivveerrssiittyy ooff PPrreettoorriiaa eettdd –– VVaann ddeerr MMeerrwwee,, TT ((22000066))
149
of point-of-sales data, the harmful effect of demand distortion can be minimised (Lee,
So and Tang, 2002:626).
It is also noteworthy that most information- sharing takes place during a product’s or
product line’s “middle life,” when execution-type decisions involving suppliers, original
equipment manufacturers, distributors, retailers and customers predominate.
However, the biggest impact of advanced economic information- sharing is usually
manifested at the beginning and at the end. Tighter collaboration at the design and
launch stage, for example, might periodically change companies’ decisions as to how
much of a new product to make, where it should be made, or how it should be priced.
Better communication at the tail end—the “retire” stage—could help avoid huge
backlogs of unsold or heavily discounted product (Derrick, 2003).
Increased sharing of economic information can help align true customer demand with
supply, thus removing variability—and therefore costs—from several major supply
chain processes (Derrick, 2003).
The most well known implementation of demand information sharing is Wal-Mart’s
Retail Link programme, which provides an on-line summary of point-of-sales data to
suppliers such as Johnson and Johnson and Lever Brothers (Lee, So and Tang,
2002:626).
Demand information by a downstream operator to his supplier is the cornerstone of
initiatives such as Quick Response (QR) and Efficient Consumer Response (ECR)
(Lee, So and Tang, 2002:626). Information- sharing is also embedded in
programmes such as Vendor-Managed Inventory (VMI) or Continuous
Replenishment Programmes (CRP) (Lee, So and Tang, 2002:626). By sharing
information, supply chains are enabled to become demand chains and in so doing to
deliver enhanced customer value (Christopher, 1998:239).
The power of Efficient Consumer Response lies in co-operation and the sharing of
information and expertise between trading partners towards a common goal of
increased consumer satisfaction (Gattorna, 1998:106). The two key drivers for
inventory reduction through Efficient Consumer Response programmes in the
UUnniivveerrssiittyy ooff PPrreettoorriiaa eettdd –– VVaann ddeerr MMeerrwwee,, TT ((22000066))
150
consumer supply chain are a smoother flow of products from manufacturer to retail
shelf and better alignment of production quantities and retail sales (Gattorna,
1998:111-112).
Consumers are getting used to being provided with the products they want, when
they want them and in the manner they want them. Even products that were once
restricted by geographic coverage or higher pricing are now becoming widely
available. Consumers can now buy goods via the Internet, consumer direct channels
and home shopping television networks.
The shift in consumer expectations has two implications. Firstly, it is much more
difficult to understand and predict consumer behaviour; and secondly, organisations
have to manage the availability of their product lines effectively if they are to succeed
in meeting customer requirements.
One way to achieve this goal is to get closer to consumers and tailor internal
company processes to meet their needs. Once companies align their internal
processes, further opportunities for improvement lie in integrating this information
across all supply chain partners: contractors, co-packers and suppliers. Integration
throughout the supply chain results in more positive decision- making, a shorter,
consolidated supply chain, reduced inventory levels and more responsive customer
service (Gattorna, 1998:123).
3.6.4 Managing the different demand streams
What a company is trying to forecast is the most fundamental question to resolve
when dealing with forecasts. The usual answer is that it is trying to forecast customer
demand, with demand defined as: what customers want and when they want it. A
good forecast of demand, far enough into the future, allows the organisation to invest
only in the facilities, materials, equipment and staffing that it needs (Gilliland,
2003:7).
UUnniivveerrssiittyy ooff PPrreettoorriiaa eettdd –– VVaann ddeerr MMeerrwwee,, TT ((22000066))
151
If customers place orders to express their demand and if the organisation gives
quality service to its customers by filling all orders in full and on time, then the
demand is quite simply the order and shipment quantity. If both order and shipment
data are readily available in the company’s system, then the historical demand data
is available and can be used in statistical forecasting models (Gilliland, 2003:7).
Unfortunately, few organisations give quality service to their customers. As such,
orders are not a perfect reflection of true demand. When customer service is less
than perfect, orders are subject to all kinds of gamesmanship (Gilliland, 2003:7-8). A
few examples are:
• An unfilled order may be rolled ahead to another bucket. The demand or order
appear in a time bucket later than when it was really required by the customer.
Rolling unfilled orders causes demand to be overstated – the orders appear in
the original time bucket, and again in future buckets until the demand is filled
or the order is cancelled.
• If shortages are anticipated, customers may artificially inflate their orders to
capture a larger share of an allocation. The customer in the second example,
has advanced knowledge that product is scarce and will be allocated. The
customer simply over-orders and ultimately may receive what was really
required in the first place.
• If shortages are anticipated, customers may withhold orders, or direct their
demand to alternative products or suppliers. The use of orders is
contaminated and the true demand is not reflected. If a company is in a
situation of chronic supply shortages, due to either supply problems or much
higher than anticipated demand, customers may simply go elsewhere.
Customers may truly want the product, so there is real demand, but the true
demand will not be reflected in the historical data, because no orders were
placed.
The ability to develop an operational definition of demand that fits its organisation is a
serious problem for most companies (Gilliland, 2003:8).
For many years, monthly factory shipment data was the only type of demand
information available to manufacturers for forecasting product consumption. Although
UUnniivveerrssiittyy ooff PPrreettoorriiaa eettdd –– VVaann ddeerr MMeerrwwee,, TT ((22000066))
152
factory shipment data does not provide the best consumption forecasts,
manufacturers were left with few alternatives. Other demand data better suited to
forecasting consumption was either difficult or expensive to acquire (Kiely, 1999: 3).
The combination of new information technology and co-operative supply chain
partnerships has made the sharing of consumption-based forecasting information
possible in real time. The results of these developments have been traumatic:
improvements in product-forecast accuracy, reductions in supply chain inventories
and efficiency in product distribution (Kiely, 1999: 3).
Instead of monthly forecast shipment information, manufacturers have begun to use
four other types of demand data to drive demand planning systems. Alternative data
comprise the following: (1) customer forecasts, (2) consumer purchases, (3)
customer warehouse withdrawals, and (4) customer orders (Kiely, 1999: 3).
Collectively, this customer-supplied data can be used to form the basis for bottom-up
product forecasts which, when aggregated and rolled back up the supply chain, more
accurately predict independent demand than do factory shipment-based forecasts
(Kiely, 1999: 3).
Independent demand forecasts are typical projections of historical demand patterns.
As such, it is assumed that independent demand is derived from point-of-sale based
consumption data, since consumption is beyond the control of suppliers,
manufacturers and retail customers. The primary reason for using customer-supplied
point- of- sale information, as opposed to factory shipment data, is to drive the
demand planning system with independent demand. Demand planning systems
driven by point-of-sale based forecasts are best suited for synchronising supply chain
plans with consumer demand (Kiely, 1999: 3-4).
Dependent demand, on the other hand, is directly related to, or derived from the bill
of material structure of other items or distribution requirements. Dependent demand
needs to be forecasted, since it can be calculated through Material Requirements
Planning (MRP) or Distribution Requirements Planning (DRP) (Kiely, 1999: 4).
UUnniivveerrssiittyy ooff PPrreettoorriiaa eettdd –– VVaann ddeerr MMeerrwwee,, TT ((22000066))
153
3.6.4.1 Customer-supplied forecasts
The first type of customer-supplied information is demand forecasts. Some retailers,
instead of supplying raw demand data, provide ready-made forecasts to their
manufacturers. Wal-Mart and Target, for example, have established collaborative
forecasting and replenishment programmes whereby a simple four-week moving
average of sales data output from their IMB INFOREM inventory re-order point
systems is sent to the manufacturer via EDI. Manufacturers can then compare these
forecasts with their own to arrive at consensus forecasts. Customer-supplied
forecasts are based upon point-of-sale data derived directly from the retailers’
checkout counters. Consequently, point-of-sale based forecasts of consumption
produced by customers are more accurate than those derived by vendors that do not
use point-of-sale data (Kiely, 1999: 4-5).
3.6.4.2 Point –of-sale data streams
Research has shown that statistical forecast models based upon point- of- sale time-
series- data are the best for predicting consumption. The major benefit of using
customer point- of- sale data is that it captures consumer take away; and as such, it
reflects true independent demand. Real time, high frequency data can be extremely
useful for examining performance of new product launches. By comparison,
syndicated consumption data suffers a delayed effect. It requires long lead times of
up to 21 days to collect, process and transmit consumption data to its subscribers.
(Kiely, 1999: 5).
Point- of- sale data generally does not contain erratic fluctuations, which are typical
of demand patterns that occur at points further upstream in the supply chain.
Customer demand captured further upstream exhibits more variation since this is
where the disturbance due to special promotions and trade deals originate (Kiely,
1999: 5).
Point- of- sales data does have some disadvantages that must be considered. One is
that it can sometimes be unreliable, due to inaccurate scanning at the check out
UUnniivveerrssiittyy ooff PPrreettoorriiaa eettdd –– VVaann ddeerr MMeerrwwee,, TT ((22000066))
154
counter. Improperly scanned point- of- sale data must be cleared before loading into
historical demand database tables. Another challenge of point-of-sale data is the
need to extrapolate total demand from data collected from only a few key accounts,
particularly when the market share is fluctuating (Gattorna, 1998:129).
The greatest disadvantage of point- of- sale data is the extreme amount of detail,
which renders it unusable for most Material Requirements Planning (MRP) or
Distribution Requirements Planning software applications. For use in a
manufacturer’s demand planning system or retail store point- of- sales data needs to
be aggregated (Kiely, 1999: 5).
Where point-of-sale based customer forecast information is not available, aggregated
point- of- sale information is the next best data stream which can be used to forecast
consumption (Kiely, 1999: 5).
3.6.4.3 Customer warehouse movement data
Where aggregated point- of- sale data is not available, customer warehouse
movement data is the next best alternative for forecasting consumption (Kiely, 1999:
6).
The major disadvantage of using warehouse movement data to forecast independent
demand is that it reflects dependent demand. Another disadvantage is that some
vendor- managed inventory customers transmit warehouse withdrawal data in higher
units of measure, for example cases or pallets. This is because warehouse
movement demand data is one step away from the final point of consumption, and
the higher variation reflects the way in which the retailers pull cases or pallet
quantities from the warehouse racking for store replenishment (Kiely, 1999: 6).
UUnniivveerrssiittyy ooff PPrreettoorriiaa eettdd –– VVaann ddeerr MMeerrwwee,, TT ((22000066))
155
3.6.4.4 Customer order data
When a manufacturer cannot obtain point- of- sale data or warehouse movement
data, either directly through customers’ systems or indirectly through third parties,
customer order history could be used as an alternative for independent demand
(Kiely, 1999: 6). A major advantage of using customer order data is that it is easily
obtained by daily or weekly capturing through the company’s order management
system (Kiely, 1999: 6).
There are primarily three disadvantages of using order history to predict consumer
demand (Kiely, 1999: 6):
Firstly, like warehouse movement data, customer order data reflects dependent
demand and does not capture consumer take away in the current period. Rather,
order data reflects what the customer believes his product stocking requirements will
be to meet consumer demand adequately in the future. Consequently, customer
order quantities include safety stock requirements, as well as expected sales.
Customer order history therefore, is more useful if the forecasting objective is to
predict customers’ warehouse replenishment quantities (Kiely, 1999: 6).
Secondly, order data is normally transmitted in customer units of measure, such as
cases or pallets, which increase variation. Order data-based forecasts have larger
errors than those that are based on point- of- sale data (Kiely, 1999: 6).
The third disadvantage of using purchase order history is that in a no backorder
environment, order quantities that cannot be filled during the current order cycle are
cut from the purchase order. Customers tend to over- compensate for poor product
supply by adding the current order cycle’s cut order quantity to the next cycle’s
purchase order. If product supply problems continue for many weeks, customers tend
to continue re-ordering accumulated quantities in an attempt to replenish depleted
inventories. It becomes necessary, therefore, to clean order history that is captured
during stock out periods (Kiely, 1999: 7).

UUnniivveerrssiittyy ooff PPrreettoorriiaa eettdd –– VVaann ddeerr MMeerrwwee,, TT ((22000066))
156
Despite its disadvantages, order data is still preferable to factory shipment data for
predicting consumer demand, because it is closer to the final point of sales (Kiely,
1999: 6).
3.6.4.5 Factory shipment data
Factory shipment data has two advantages when used for purposes other than
forecasting consumption: The first advantage is that factory shipments provide a
good financial cash flow forecast. Once shipments are released, one can estimate
the timing and quantity of account receivables. The second advantage of using
factory shipment data is that it is inexpensive and easy to obtain from the invoicing
system (Kiely, 1999: 8).
However, when used to forecast independent demand, factory shipments suffer from
three disadvantages (Kiely, 1999: 8):
Firstly, factory shipments represent movements in product supply, not changes in
demand. By forecasting shipments, demand plans ignore what is actually demanded
and consider the vendor’s ability to fulfil the demand (Kiely, 1999: 8).
Secondly, shipment data is very volatile for manufacturers that have synchronised
production with consumption. The factors that create fluctuations in the demand
patterns are erratic customer inventory levels, irregular customer order quantities,
highly variable replenishment lead times and rapid inventory building at the customer
distribution centres in anticipation of promotions. These factors that create
fluctuations in the demand patterns are very difficult, if not impossible to decompose,
isolate, and remove from the shipment history (Kiely, 1999: 8). Companies should
consider the impact of predicting demand using constrained historical demand
(Langabeer & Stoughton, 2001:9).
Thirdly, the underlying seasonality of shipment data may not be a true representative
pattern of consumer purchases, but rather created artificially by the pipeline push
UUnniivveerrssiittyy ooff PPrreettoorriiaa eettdd –– VVaann ddeerr MMeerrwwee,, TT ((22000066))
157
strategies that some manufacturers employ to meet corporate financial targets (Kiely,
1999: 8).
Large errors are often associated with consumption forecasts that are based on
factory shipment data. The traditional approach to compensating for such errors has
been to carry enough safety stock, the cost of which far outweighs the savings
incurred by accessing and storing shipment information (Kiely, 1999: 8).
Factory shipment data should only be used as a last resort to forecast consumption
and to drive production plans when other types of customer demand data is not
available (Kiely, 1999: 8).
3.7 Conclus ion
This chapter describes the importance and challenges for supply chains to align
supply and demand. Matching supply and demand is the fundamental cornerstone of
the logistics process. (Christopher and Peck, 2003:85). Retailers and manufacturers
in many product categories have struggled to put together a match between supply
and demand (Gattorna, 1998:171). The costs of a mismatch between the supply and
demand, measured as the combination of inventory carrying costs, markdown costs
and stockout costs, are growing in many industries. Companies have tried to reduce
these costs through better demand forecasting, improved production and inventory
planning, increased production capacity and reduced set-up and transportation lead
times. Companies have also tried to manage the demand process through pricing
policies intended to smooth the arrival pattern of customers. These approaches,
while useful, have failed to address a number of drivers of supply-demand mismatch
(Gattorna, 1998:172).
Most organisations face a fundamental problem: the time it takes to procure, make
and deliver the finished product to a customer is longer than the time the customer is
prepared to wait for it. This is the basis of the lead-time gap (Christopher, 1998:167).
This gap could be reduced by shortening the logistics lead time whilst simultaneously
UUnniivveerrssiittyy ooff PPrreettoorriiaa eettdd –– VVaann ddeerr MMeerrwwee,, TT ((22000066))
158
trying to move the customer’s order cycle closer by gaining earlier warning of
requirements through improved visibility of demand (Christopher, 1998:169). The
benefits of reducing the lead-time gap within a supply chain include higher customer
service, higher customer responsiveness, an improvement in the balance between
supply and demand and a reduction in inventory (Gattorna, 1998:158-160).
Firstly, a company should investigate various options to reduce the demand lead-
time within its supply chain. Most of the demand volatility within a supply chain is
often induced by organisations through their own policies and procedures.
Consequently, it is within a company’s capability to control and influence the demand
volatility within its supply chain (Gattorna, 1998:153). Sharing sales information, for
example, could counter the so-called ‘bullwhip effect’ which is essentially the
phenomenon of demand volatility amplification along the supply chain, from the
retailers, distributors, manufacturers, and the manufacturers’ suppliers, and so on.
(Lee, So and Tang, 2002:626).
By sharing information, it enables supply chains to become demand chains and in so
doing to deliver enhanced customer value (Christopher, 1998:239). A company
should consider the benefits and costs of using different demand data to drive
demand planning systems carefully. Examples of the various alternative demand
data streams include customer forecasts, consumer purchases, customer warehouse
withdrawals and customer orders (Kiely, 1999: 3). Factory shipment data, for
example, should only be used as a last resort to forecast consumption and drive
production plans when other types of customer demand data is not available (Kiely,
1999: 8).
A supply chain should move from supplying customers indiscriminately according to
forecasted demand, to supplying customers with precision according to their actual
demand and their stated requirements (Gattorna, 1998:41). If information on actual
customer usage of a product is linked directly to a company’s logistics system, the
need for the forecast is reduced. This is the concept of substituting information for
inventory. A company’s total response time can be reduced by capturing information
at the point- of- sale and swiftly transferring the details to the point of production
(Christopher, 1998:263).
UUnniivveerrssiittyy ooff PPrreettoorriiaa eettdd –– VVaann ddeerr MMeerrwwee,, TT ((22000066))
159
Secondly, a company should investigate various options to reduce the supply lead-
time within its supply chain. Examples of strategies that could reduce supply lead
time include the following: removing activities that only add cost (Christopher,
1998:116); improving the frequency, accuracy and reliability of deliveries
(Christopher, 1998:121); pooling risk and inventory of various stock locations (Taylor,
2004:301); removing slowdowns and queues in the supply chain (Taylor, 2004:299);
simplification, commonality and standardisation throughout the supply chain (Taylor,
2004:308), (Kobert, 1992:91), (Harmon, 1992:170), (Hughes, Ralf and Michels,
1999:50), (Harmon & Peterson, 1990: x-xii), (Chase, Aquilano and Jacobs, 2001:151-
152); the use of modularity in product design (Taylor, 2004:308-309); balancing the
flow, and not the capacities, of product through the system (Chase, Aquilano and
Jacobs, 2001:668); and postponing the final configuration or assembly of the product
until the actual customer requirement is known (Christopher, 1998:210). There is a
fundamental shift in supply chains from the economies of scale, which is volume-
based and implies long production runs with few change-overs, to the economies of
scope which is based upon producing small quantities of a wider range, hence
requiring more change-overs (Christopher, 1998:209). The management review of
the future will focus on performance, rather than profitability. The main reason is that
performance drives profitability. Therefore, if the performance improves, the profit will
also improve (Christopher, 1998:261-262). A customer service- focussed company,
for example, should identify the costs and profitability of giving quality service to
customers (Christopher, 1998:262).
The companies that have succeeded in breaking down the functional silos are now
looking to forge ever closer linkages with their supply chain partners. A key to supply
chain integration is the open flow of information from one end of the pipeline to
another. By sharing information, supply chain partners are able to respond more
rapidly to known demand and to do with less inventory in the system as a whole and,
hence, at lower costs (Christopher, 1998:248). The key to effective supply chain
management is in closing the gap between day-to-day changes in the supply chain
and the company’s ability to recognize and respond to them. Specifically, companies
must be able to identify these changes as they occur, to quickly understand their
potential impact and to act immediately to deal with them (Valdero, 2002).
UUnniivveerrssiittyy ooff PPrreettoorriiaa eettdd –– VVaann ddeerr MMeerrwwee,, TT ((22000066))
160
In practice, the objectives of the various parties involved in a supply chain are often
in conflict with each other. If the conflicts are not detected and eliminated, a company
will work against itself, exerting greater effort but reducing its ability to make any real
progress (Taylor, 2004:239-240). The only way to do this is to align objectives across
all the groups involved in managing the chain. (Taylor, 2004:241). A company should
align the individual, departmental and organisational goals within the company
(Kaplan and Norton, 1996:139).
Matching supply and demand is the fundamental cornerstone of the logistics process.
Conventional business uses the forecast in an attempt to predict demand. However,
because today’s market place is considerably more volatile and, as a result, less
predictable, it has become necessary to seek alternative approaches to demand
management. The way forward is to substitute information for inventory and in the
process become more responsive to real demand (Christopher and Peck, 2003:85).
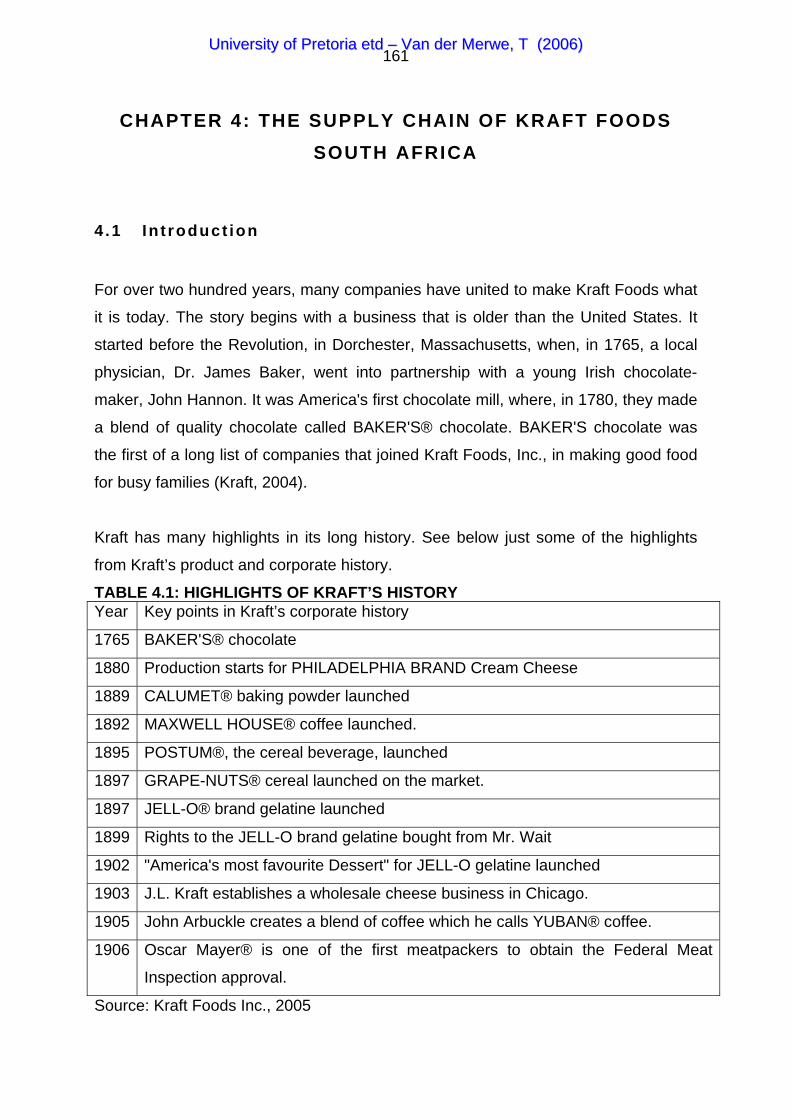
UUnniivveerrssiittyy ooff PPrreettoorriiaa eettdd –– VVaann ddeerr MMeerrwwee,, TT ((22000066))
161
CHAPTER 4: THE SUPPLY CHAIN OF KRAFT FOODS SOUTH AFRICA
4 .1 In t roduct ion
For over two hundred years, many companies have united to make Kraft Foods what
it is today. The story begins with a business that is older than the United States. It
started before the Revolution, in Dorchester, Massachusetts, when, in 1765, a local
physician, Dr. James Baker, went into partnership with a young Irish chocolate-
maker, John Hannon. It was America's first chocolate mill, where, in 1780, they made
a blend of quality chocolate called BAKER'S® chocolate. BAKER'S chocolate was
the first of a long list of companies that joined Kraft Foods, Inc., in making good food
for busy families (Kraft, 2004).
Kraft has many highlights in its long history. See below just some of the highlights
from Kraft’s product and corporate history.
TABLE 4.1: HIGHLIGHTS OF KRAFT’S HISTORY Year Key points in Kraft’s corporate history
1765 BAKER'S® chocolate
1880 Production starts for PHILADELPHIA BRAND Cream Cheese
1889 CALUMET® baking powder launched
1892 MAXWELL HOUSE® coffee launched.
1895 POSTUM®, the cereal beverage, launched
1897 GRAPE-NUTS® cereal launched on the market.
1897 JELL-O® brand gelatine launched
1899 Rights to the JELL-O brand gelatine bought from Mr. Wait
1902 "America's most favourite Dessert" for JELL-O gelatine launched
1903 J.L. Kraft establishes a wholesale cheese business in Chicago.
1905 John Arbuckle creates a blend of coffee which he calls YUBAN® coffee.
1906 Oscar Mayer® is one of the first meatpackers to obtain the Federal Meat
Inspection approval.
Source: Kraft Foods Inc., 2005
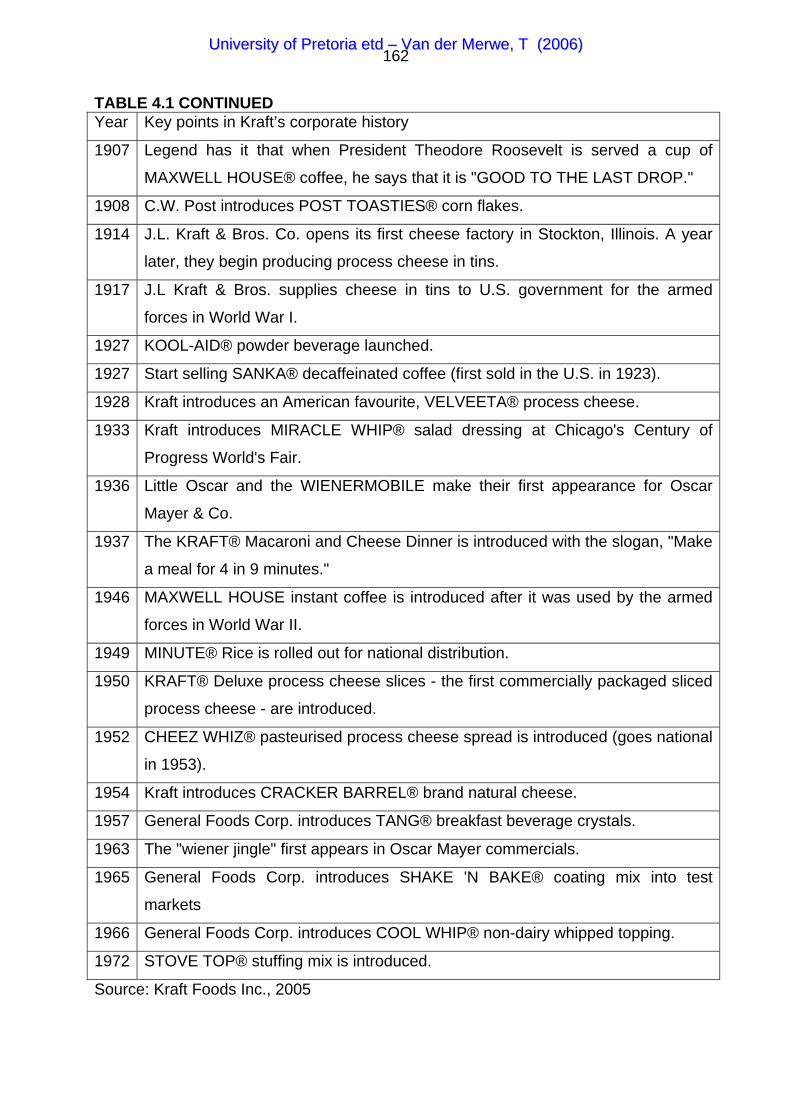
UUnniivveerrssiittyy ooff PPrreettoorriiaa eettdd –– VVaann ddeerr MMeerrwwee,, TT ((22000066))
162
TABLE 4.1 CONTINUED Year Key points in Kraft’s corporate history
1907 Legend has it that when President Theodore Roosevelt is served a cup of
MAXWELL HOUSE® coffee, he says that it is "GOOD TO THE LAST DROP."
1908 C.W. Post introduces POST TOASTIES® corn flakes.
1914 J.L. Kraft & Bros. Co. opens its first cheese factory in Stockton, Illinois. A year
later, they begin producing process cheese in tins.
1917 J.L Kraft & Bros. supplies cheese in tins to U.S. government for the armed
forces in World War I.
1927 KOOL-AID® powder beverage launched.
1927 Start selling SANKA® decaffeinated coffee (first sold in the U.S. in 1923).
1928 Kraft introduces an American favourite, VELVEETA® process cheese.
1933 Kraft introduces MIRACLE WHIP® salad dressing at Chicago's Century of
Progress World's Fair.
1936 Little Oscar and the WIENERMOBILE make their first appearance for Oscar
Mayer & Co.
1937 The KRAFT® Macaroni and Cheese Dinner is introduced with the slogan, "Make
a meal for 4 in 9 minutes."
1946 MAXWELL HOUSE instant coffee is introduced after it was used by the armed
forces in World War II.
1949 MINUTE® Rice is rolled out for national distribution.
1950 KRAFT® Deluxe process cheese slices - the first commercially packaged sliced
process cheese - are introduced.
1952 CHEEZ WHIZ® pasteurised process cheese spread is introduced (goes national
in 1953).
1954 Kraft introduces CRACKER BARREL® brand natural cheese.
1957 General Foods Corp. introduces TANG® breakfast beverage crystals.
1963 The "wiener jingle" first appears in Oscar Mayer commercials.
1965 General Foods Corp. introduces SHAKE 'N BAKE® coating mix into test
markets
1966 General Foods Corp. introduces COOL WHIP® non-dairy whipped topping.
1972 STOVE TOP® stuffing mix is introduced.
Source: Kraft Foods Inc., 2005
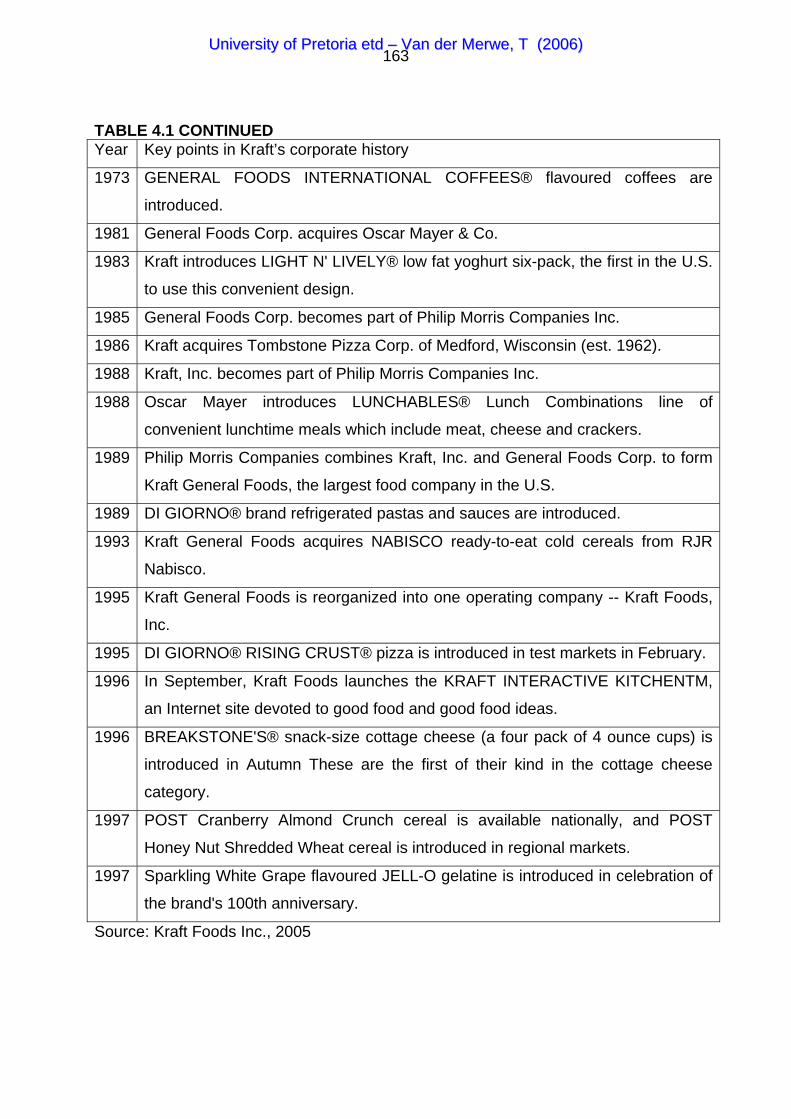
UUnniivveerrssiittyy ooff PPrreettoorriiaa eettdd –– VVaann ddeerr MMeerrwwee,, TT ((22000066))
163
TABLE 4.1 CONTINUED Year Key points in Kraft’s corporate history
1973 GENERAL FOODS INTERNATIONAL COFFEES® flavoured coffees are
introduced.
1981 General Foods Corp. acquires Oscar Mayer & Co.
1983 Kraft introduces LIGHT N' LIVELY® low fat yoghurt six-pack, the first in the U.S.
to use this convenient design.
1985 General Foods Corp. becomes part of Philip Morris Companies Inc.
1986 Kraft acquires Tombstone Pizza Corp. of Medford, Wisconsin (est. 1962).
1988 Kraft, Inc. becomes part of Philip Morris Companies Inc.
1988 Oscar Mayer introduces LUNCHABLES® Lunch Combinations line of
convenient lunchtime meals which include meat, cheese and crackers.
1989 Philip Morris Companies combines Kraft, Inc. and General Foods Corp. to form
Kraft General Foods, the largest food company in the U.S.
1989 DI GIORNO® brand refrigerated pastas and sauces are introduced.
1993 Kraft General Foods acquires NABISCO ready-to-eat cold cereals from RJR
Nabisco.
1995 Kraft General Foods is reorganized into one operating company -- Kraft Foods,
Inc.
1995 DI GIORNO® RISING CRUST® pizza is introduced in test markets in February.
1996 In September, Kraft Foods launches the KRAFT INTERACTIVE KITCHENTM,
an Internet site devoted to good food and good food ideas.
1996 BREAKSTONE'S® snack-size cottage cheese (a four pack of 4 ounce cups) is
introduced in Autumn These are the first of their kind in the cottage cheese
category.
1997 POST Cranberry Almond Crunch cereal is available nationally, and POST
Honey Nut Shredded Wheat cereal is introduced in regional markets.
1997 Sparkling White Grape flavoured JELL-O gelatine is introduced in celebration of
the brand's 100th anniversary.
Source: Kraft Foods Inc., 2005
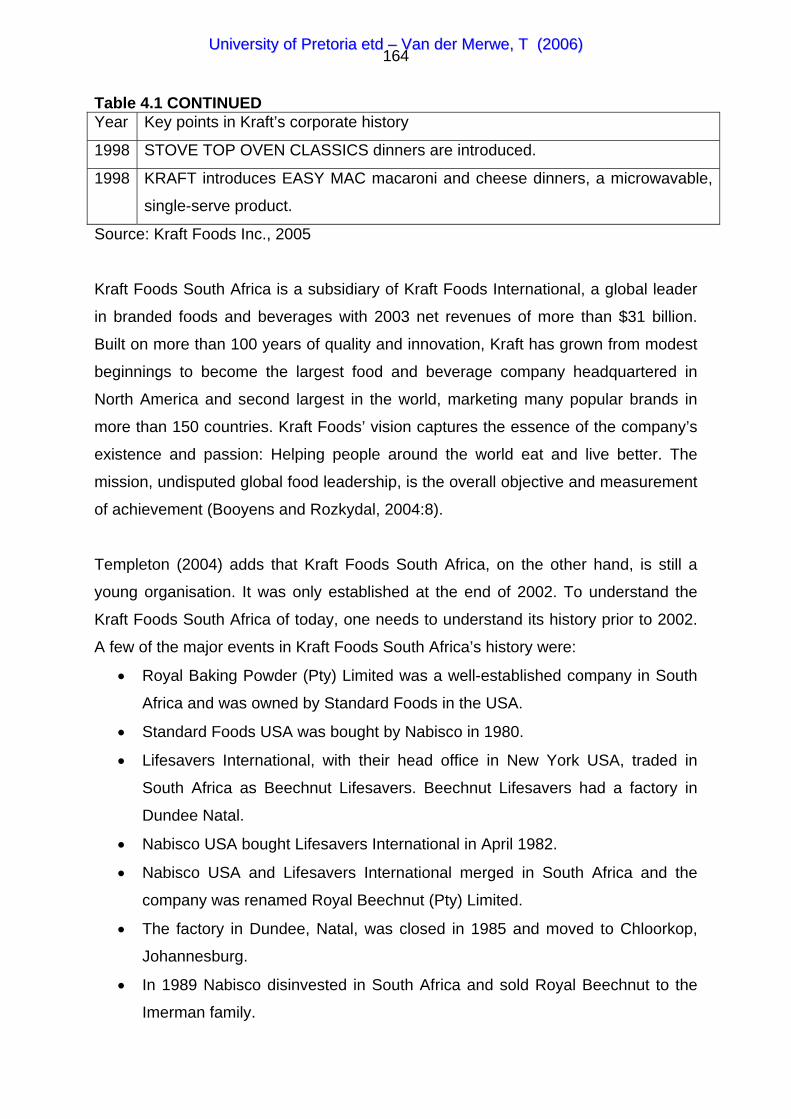
UUnniivveerrssiittyy ooff PPrreettoorriiaa eettdd –– VVaann ddeerr MMeerrwwee,, TT ((22000066))
164
Table 4.1 CONTINUED Year Key points in Kraft’s corporate history
1998 STOVE TOP OVEN CLASSICS dinners are introduced.
1998 KRAFT introduces EASY MAC macaroni and cheese dinners, a microwavable,
single-serve product.
Source: Kraft Foods Inc., 2005
Kraft Foods South Africa is a subsidiary of Kraft Foods International, a global leader
in branded foods and beverages with 2003 net revenues of more than $31 billion.
Built on more than 100 years of quality and innovation, Kraft has grown from modest
beginnings to become the largest food and beverage company headquartered in
North America and second largest in the world, marketing many popular brands in
more than 150 countries. Kraft Foods’ vision captures the essence of the company’s
existence and passion: Helping people around the world eat and live better. The
mission, undisputed global food leadership, is the overall objective and measurement
of achievement (Booyens and Rozkydal, 2004:8).
Templeton (2004) adds that Kraft Foods South Africa, on the other hand, is still a
young organisation. It was only established at the end of 2002. To understand the
Kraft Foods South Africa of today, one needs to understand its history prior to 2002.
A few of the major events in Kraft Foods South Africa’s history were:
• Royal Baking Powder (Pty) Limited was a well-established company in South
Africa and was owned by Standard Foods in the USA.
• Standard Foods USA was bought by Nabisco in 1980.
• Lifesavers International, with their head office in New York USA, traded in
South Africa as Beechnut Lifesavers. Beechnut Lifesavers had a factory in
Dundee Natal.
• Nabisco USA bought Lifesavers International in April 1982.
• Nabisco USA and Lifesavers International merged in South Africa and the
company was renamed Royal Beechnut (Pty) Limited.
• The factory in Dundee, Natal, was closed in 1985 and moved to Chloorkop,
Johannesburg.
• In 1989 Nabisco disinvested in South Africa and sold Royal Beechnut to the
Imerman family.
UUnniivveerrssiittyy ooff PPrreettoorriiaa eettdd –– VVaann ddeerr MMeerrwwee,, TT ((22000066))
165
• The Imerman family bought various brands including Manhattan confectionery,
Lecol beverages; Del Monte canned fruit and fruit juices and various Fed
Foods’ biscuits brands.
• During 1985 to 1991 Royal Beechnut also operated various franchises,
including Tambrands and self-medication products such as Cutacura face
washes and Regulets laxatives.
• On 14 March 1991, Royal Beechnut (Pty) Limited listed 50 % of its shares on
the Johannesburg Stock Exchange as Royal Foods Limited. The remaining 50
% of the shares of Royal Beechnut was still owned by the Imerman family.
• On 1 September 1995, Nabisco purchased 50 % of Royal Beech-Nut and took
over management control. Nabisco also had an option to purchase the
remaining 50 % of Royal Beechnut’s shares.
• On 20 May 1996, the company name Royal Beechnut was changed to
Nabisco South Africa.
• On 18 March 2002, Kraft Foods International announced the purchase of
Nabisco International.
• The original 50 % share- holding of Royal Beechnut, trading as Royal Foods
Limited was de-listed on the Johannesburg Stock Exchange at the beginning
of 2002.
• Kraft Foods Inc bought the remaining 50 % of Royal Beechnut shares from the
Imerman family at the beginning of 2002.
• On 5 July 2002, Kraft Foods International purchased the remaining 50 % of
Nabisco South Africa. Kraft Foods South Africa was then fully owned by Kraft
Foods Inc.
• On 1 November 2002, the company name changed from Nabisco South Africa
to Kraft Foods South Africa.
The name change to Kraft Foods South Africa marked a new beginning, as the
company was now part of Kraft Foods Inc.
UUnniivveerrssiittyy ooff PPrreettoorriiaa eettdd –– VVaann ddeerr MMeerrwwee,, TT ((22000066))
166
4.2 Focus of Kraf t Foods Inc .
Kraft Foods Inc. is the largest branded food and beverage company with its
headquarters in the United States. Prior to June 13, 2001, Kraft was a wholly owned
subsidiary of the Altria Group Inc. On June 13, 2001, Kraft completed an initial public
offering of 280 000 000 shares of its Class A common stock at a price of $31 per
share. After the initial public offering, Altria Group Inc. owned approximately 83.9 %
of the outstanding shares of Kraft’s capital stock through its ownership of 49.5 % of
Kraft’s Class A common shares and 100 % of Kraft’s Class B common shares. By
December 31, 2003, Altria Group Inc., held 97.9 % of the combined voting power of
Kraft’s outstanding capital stock and owned approximately 84.6 % of the outstanding
shares of Kraft’s capital stock (Kraft Foods Inc, 2004:23).
Kraft Foods Inc. conducts its global business through two subsidiaries: Kraft Foods
North America Inc. and Kraft Foods International Inc. Kraft Foods North America
manages its operations principally by product category, while Kraft Foods
International manages its operations by geographical region. From 2001 through to
2003, Kraft Foods North America’s segments were cheese, meals and enhancers;
biscuits, snacks and confectionery; beverages, desserts and cereals; and Oscar
Mayer and Pizza. Kraft Foods North America’s food service business within the
United States and its businesses in Canada, Mexico and Puerto Rico were reported
through the cheese, meals and enhancers segment. Kraft Foods International
segments were Europe, the Middle East, Africa; Latin America and Asia Pacific (Kraft
Foods Inc, 2004:23).
4.3 The cha l lenges of Kraf t
Kraft Foods Inc. is subject to a number of challenges that may adversely affect its
businesses. These challenges include:
• Fluctuations in commodity prices.
• Movements of foreign currencies against the U.S. dollar.
UUnniivveerrssiittyy ooff PPrreettoorriiaa eettdd –– VVaann ddeerr MMeerrwwee,, TT ((22000066))
167
• Competitive challenges in various products and markets, including price gaps
with competitor products and the increasing price consciousness of
consumers.
• A rising cost environment.
• A trend towards increasing consolidation in the retail trade and consequent
inventory reductions.
• Changing consumer preferences.
• Competitors with different profit objectives and less susceptibility to currency
exchange rates.
• Consumer concerns about food safety, quality, and health, including concerns
about genetically modified organisms, trans-fatty acids and obesity (Kraft
Foods Inc, 2004:26).
To confront these challenges, Kraft continues to take steps to build the value of its
brands, to improve its foods business portfolio with new product and marketing
initiatives, to reduce costs through productivity and to address consumer concerns
about food safety, quality and health. In July 2003, Kraft Foods Inc. announced a
range of initiatives addressing product nutrition, marketing practices, consumer
information, and public advocacy and dialogue (Kraft Foods Inc, 2004:26).
4.4 The susta inable growth p lan of Kraf t
On 23 January 2004, Roger Deromedi, Chief Executive Officer, Kraft Foods Inc.,
announced a four-point sustainable growth plan for Kraft Foods Inc. (Kraft Foods Inc,
2004:5)
Firstly, to build superior brand value, Kraft must deliver more product benefits for the
price paid for competitive products (Kraft Foods Inc, 2004:5). The first element of the
plan is to build brand value by continuing to improve its products, to use more value-
added packaging, to develop innovative products, to effectively manage price gaps
and to build closer relationships with consumers (Kraft Foods Inc, 2004:26).
UUnniivveerrssiittyy ooff PPrreettoorriiaa eettdd –– VVaann ddeerr MMeerrwwee,, TT ((22000066))
168
Secondly, to transform the product portfolio, Kraft is aligning its products with key
consumer and customer trends, retail channels and demographic groups (Kraft
Foods Inc, 2004:5). The second element of the plan is to accelerate the shift in
Kraft’s brand portfolio to address growing consumer demand for products meeting
their health and wellness which concerns their desire for convenience (Kraft Foods
Inc, 2004:26). Kraft is reducing the trans-fat in its products, identifying its products
that are low in carbohydrates, introducing more sugar-free products, and
emphasizing positive nutrition products. Examples of Kraft’s response to health and
wellness include products like Triscuit crackers with zero grams trans- fat; Kool Aid
Jammers 10 with only 10 calories per serving; and Tang Plus with fortification and
flavours tailored to the nutritional needs and taste preferences of different countries’
groups (Kraft Foods Inc, 2004:5). Kraft is also addressing convenience needs by
offering more convenient packaging, such as single-serve and resealable packaging,
and products requiring reduced preparation (Kraft Foods Inc, 2004:26). Examples of
Kraft’s response to meeting the growing trend for convenience include products like
single-serve Philadelphia Minis in Europe, nutritionally balanced Lunchables Fun
Fuel in the U.S., and the launch in France later in 2004 of Tissimo, the innovative
new, on-demand, hot beverage system groups (Kraft Foods Inc, 2004:5). Kraft is also
offering packaging that is customised to suit the needs of the growing alternative
channels of distribution such as super centres, mass merchandisers, drugstores and
club stores. Kraft also plans to shift its portfolio to reflect changing demographics, for
example, by expanding the availability of Hispanic products and bilingual packaging
(Kraft Foods Inc, 2004:26).
Thirdly, to expand the global scale in fast-growing developing countries, Kraft is
capturing the growth potential of the core categories in markets where they already
operate, and building infrastructure in new high-potential markets (Kraft Foods Inc,
2004:5). The developing markets account for 84 % of the world’s population and 30
% of its packaged food consumption, but only 11 % of Kraft’s net revenues. The
sustainable growth plan calls for Kraft to capture the growth potential of its core
categories in existing markets and to expand these into new markets (Kraft Foods
Inc, 2004:26).
UUnniivveerrssiittyy ooff PPrreettoorriiaa eettdd –– VVaann ddeerr MMeerrwwee,, TT ((22000066))
169
And fourthly, to reduce the costs and asset base, a major cost-restructuring
programme that goes beyond ongoing productivity efforts and that will help fund
growth initiatives. Over the next three years, Kraft anticipates closing up to 20
production facilities and reducing the global force by approximately 6 %, or about
6000 positions across all levels of the organisation (Kraft Foods Inc, 2004:6). The
restructuring program has the objectives of leveraging Kraft’s global scale, realigning
and lowering the cost structure and optimising capacity utilisation (Kraft Foods Inc,
2004:26). The fourth part of Kraft’s sustainable growth plan is focussed on doing
things at the lowest cost, i.e. the plan focuses on efficiency (Chase, Aquilano and
Jacobs, 2001:335). The aim of the sustainable growth plan is to deliver consistent
results in the long term (Kraft Foods Inc, 2004:6).
The fourth point of Kraft’s sustainable growth plan is based on the interrelationship
between save, invest and grow. This is the continuous cycle that drives long-term,
sustainable results (Kraft Foods Inc, 2004:15).
Productivity and the steady flow of savings will continue to be the hallmark of Kraft.
Although savings can come from many sources, two areas offer particular
opportunity for ongoing cost savings:
The first cost saving opportunity is supply chain initiatives, where Kraft will leverage
its global procurement scale and rationalise less profitable product variations further,
in order to help achieve greater production and distribution efficiencies.
The second cost saving opportunity is through advances in technology. Kraft will
continue to automate its plants and distribution centres, formulate products at lower
costs that improve or maintain its product quality, and seek out alternative, lower-cost
packaging.
The actions that are taken to reduce the costs today will provide financial stability to
fund its future success.

UUnniivveerrssiittyy ooff PPrreettoorriiaa eettdd –– VVaann ddeerr MMeerrwwee,, TT ((22000066))
170
4 .5 Kraf t Foods South Afr ica ’s supply cha in organizat ion
Kraft Foods believes that a Supply Chain organisation must be based on three key
pillars in order to meet its vision (Booyens and Rozkydal, 2004:1-68):
1. Customer Service manages order-to-cash and drives supply chain partnership
with customers.
2. Logistic Operations manages distribution, warehousing and transportation
activities/costs.
3. Demand Planning and Replenishment leads the forecasting process, supply
chain management and replenishment from plants.
Booyens and Rozkydal (2004:1-68) also add that these three pillars form an integral
part of Supply Chain Management, which is the practice of co-ordinating the flow of
goods, services, information and finances as they move from raw materials to parts
supplier to manufacturer to wholesaler to retailer to consumer. The supply chain
process includes order generation, order taking, information feedback and the
efficient and timely delivery of goods and services. The supply chain plays an
important role in achieving the vision and objectives of Kraft Foods South Africa of
obtaining high levels of customer service. In short, the successful management of the
supply chain is dependent on the 7 S’s for Supply Chain Management: Strategy,
Skills, Structure, Staff, Systems, Style and Shared Values.
4 .6 Role p layers in Kraf t Foods South Afr ica ’s supply cha in
Booyens and Rozkydal (2004:15-16) states that Kraft Foods South Africa’s supply
chain consists of two major components: Plant Logistics and Commercial Logistics.
The diagram below depicts the relationship between these two entities:
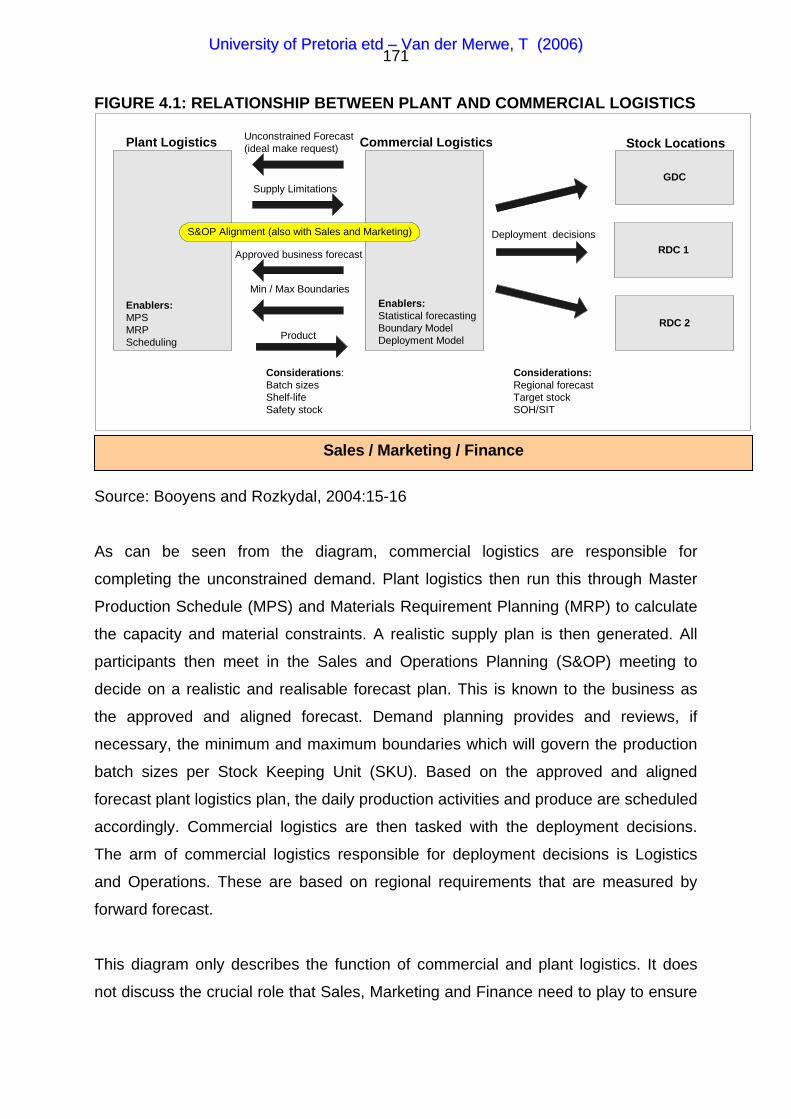
UUnniivveerrssiittyy ooff PPrreettoorriiaa eettdd –– VVaann ddeerr MMeerrwwee,, TT ((22000066))
171
FIGURE 4.1: RELATIONSHIP BETWEEN PLANT AND COMMERCIAL LOGISTICS
RDC 2
GDC
Considerations:Batch sizesShelf-lifeSafety stock
Commercial LogisticsPlant Logistics
RDC 1
Product
Unconstrained Forecast(ideal make request)
Min / Max Boundaries
Deployment decisions
Considerations:Regional forecastTarget stockSOH/SIT
Enablers:MPSMRPScheduling
Enablers:Statistical forecastingBoundary ModelDeployment Model
Stock Locations
Supply Limitations
S&OP Alignment (also with Sales and Marketing)
Approved business forecast
Source: Booyens and Rozkydal, 2004:15-16
As can be seen from the diagram, commercial logistics are responsible for
completing the unconstrained demand. Plant logistics then run this through Master
Production Schedule (MPS) and Materials Requirement Planning (MRP) to calculate
the capacity and material constraints. A realistic supply plan is then generated. All
participants then meet in the Sales and Operations Planning (S&OP) meeting to
decide on a realistic and realisable forecast plan. This is known to the business as
the approved and aligned forecast. Demand planning provides and reviews, if
necessary, the minimum and maximum boundaries which will govern the production
batch sizes per Stock Keeping Unit (SKU). Based on the approved and aligned
forecast plant logistics plan, the daily production activities and produce are scheduled
accordingly. Commercial logistics are then tasked with the deployment decisions.
The arm of commercial logistics responsible for deployment decisions is Logistics
and Operations. These are based on regional requirements that are measured by
forward forecast.
This diagram only describes the function of commercial and plant logistics. It does
not discuss the crucial role that Sales, Marketing and Finance need to play to ensure
Sales / Marketing / Finance
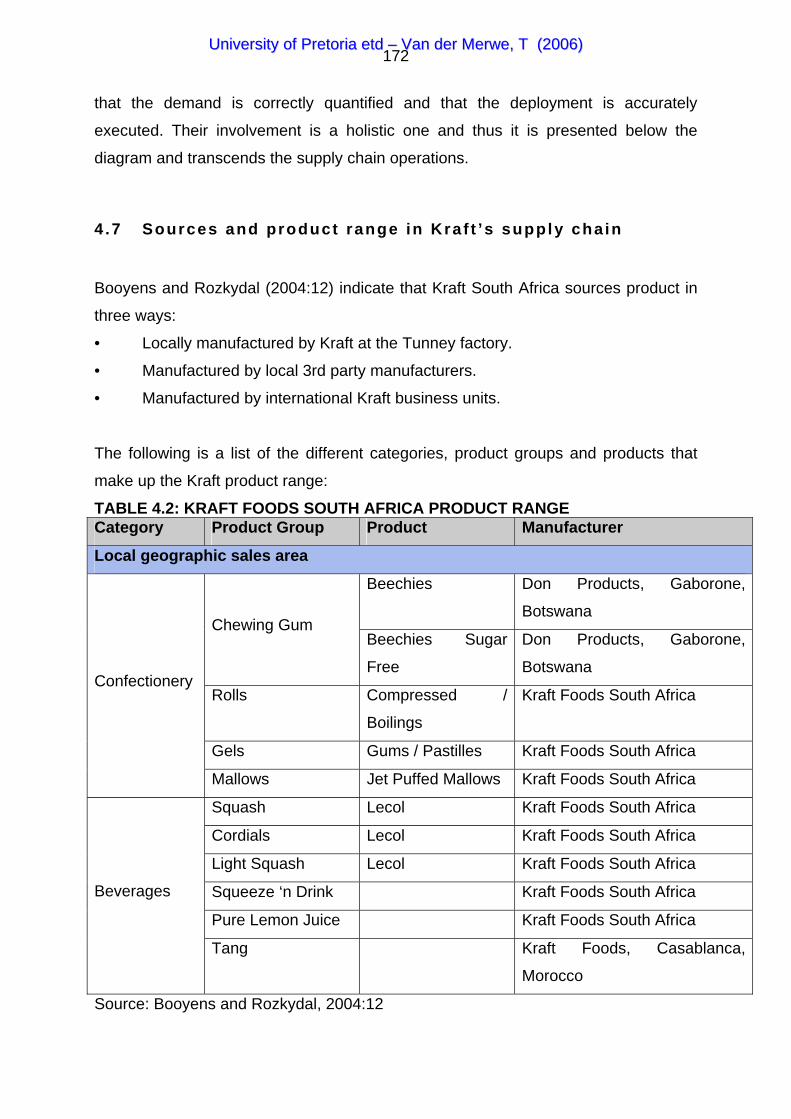
UUnniivveerrssiittyy ooff PPrreettoorriiaa eettdd –– VVaann ddeerr MMeerrwwee,, TT ((22000066))
172
that the demand is correctly quantified and that the deployment is accurately
executed. Their involvement is a holistic one and thus it is presented below the
diagram and transcends the supply chain operations.
4.7 Sources and product range in Kraf t ’s supply cha in
Booyens and Rozkydal (2004:12) indicate that Kraft South Africa sources product in
three ways:
• Locally manufactured by Kraft at the Tunney factory.
• Manufactured by local 3rd party manufacturers.
• Manufactured by international Kraft business units.
The following is a list of the different categories, product groups and products that
make up the Kraft product range:
TABLE 4.2: KRAFT FOODS SOUTH AFRICA PRODUCT RANGE Category Product Group Product Manufacturer
Local geographic sales area
Beechies Don Products, Gaborone,
Botswana Chewing Gum
Beechies Sugar
Free
Don Products, Gaborone,
Botswana
Rolls Compressed /
Boilings
Kraft Foods South Africa
Gels Gums / Pastilles Kraft Foods South Africa
Confectionery
Mallows Jet Puffed Mallows Kraft Foods South Africa
Squash Lecol Kraft Foods South Africa
Cordials Lecol Kraft Foods South Africa
Light Squash Lecol Kraft Foods South Africa
Squeeze ‘n Drink Kraft Foods South Africa
Pure Lemon Juice Kraft Foods South Africa
Beverages
Tang Kraft Foods, Casablanca,
Morocco
Source: Booyens and Rozkydal, 2004:12
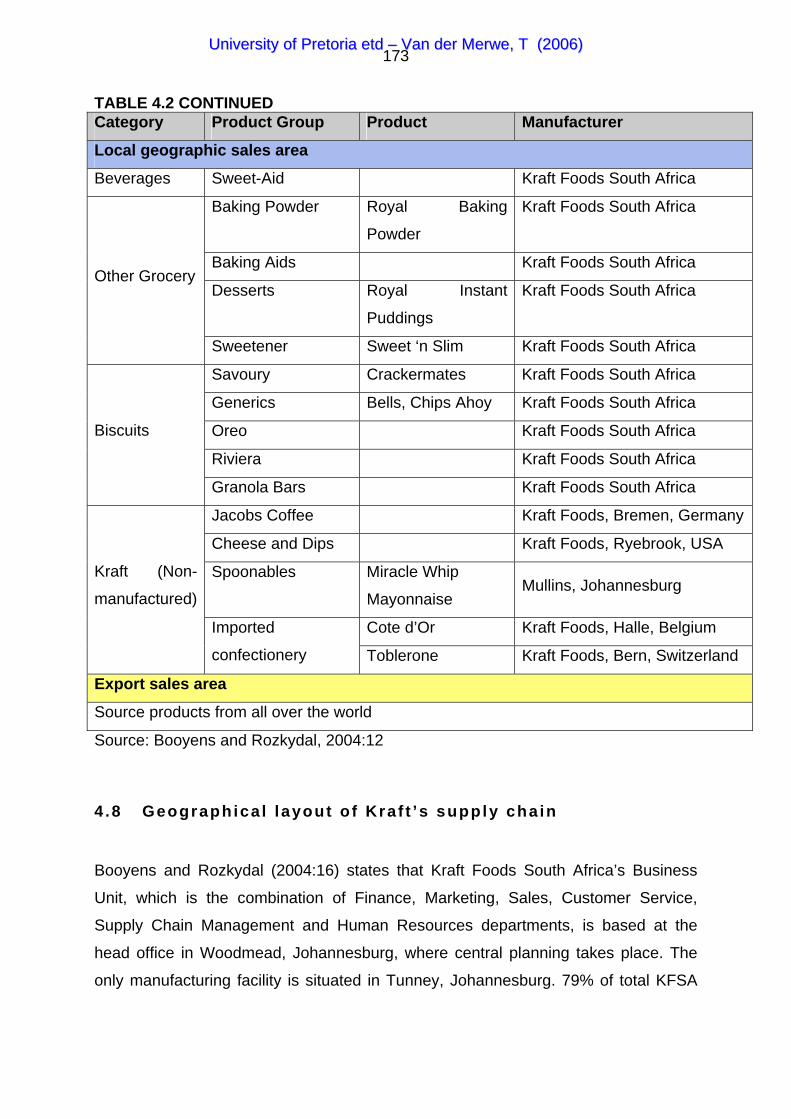
UUnniivveerrssiittyy ooff PPrreettoorriiaa eettdd –– VVaann ddeerr MMeerrwwee,, TT ((22000066))
173
TABLE 4.2 CONTINUED Category Product Group Product Manufacturer
Local geographic sales area
Beverages Sweet-Aid Kraft Foods South Africa
Baking Powder Royal Baking
Powder
Kraft Foods South Africa
Baking Aids Kraft Foods South Africa
Desserts Royal Instant
Puddings
Kraft Foods South Africa Other Grocery
Sweetener Sweet ‘n Slim Kraft Foods South Africa
Savoury Crackermates Kraft Foods South Africa
Generics Bells, Chips Ahoy Kraft Foods South Africa
Oreo Kraft Foods South Africa
Riviera Kraft Foods South Africa
Biscuits
Granola Bars Kraft Foods South Africa
Jacobs Coffee Kraft Foods, Bremen, Germany
Cheese and Dips Kraft Foods, Ryebrook, USA
Spoonables Miracle Whip
Mayonnaise Mullins, Johannesburg
Cote d’Or Kraft Foods, Halle, Belgium
Kraft (Non-
manufactured)
Imported
confectionery Toblerone Kraft Foods, Bern, Switzerland
Export sales area
Source products from all over the world
Source: Booyens and Rozkydal, 2004:12
4 .8 Geographica l layout o f Kraf t ’s supply cha in
Booyens and Rozkydal (2004:16) states that Kraft Foods South Africa’s Business
Unit, which is the combination of Finance, Marketing, Sales, Customer Service,
Supply Chain Management and Human Resources departments, is based at the
head office in Woodmead, Johannesburg, where central planning takes place. The
only manufacturing facility is situated in Tunney, Johannesburg. 79% of total KFSA
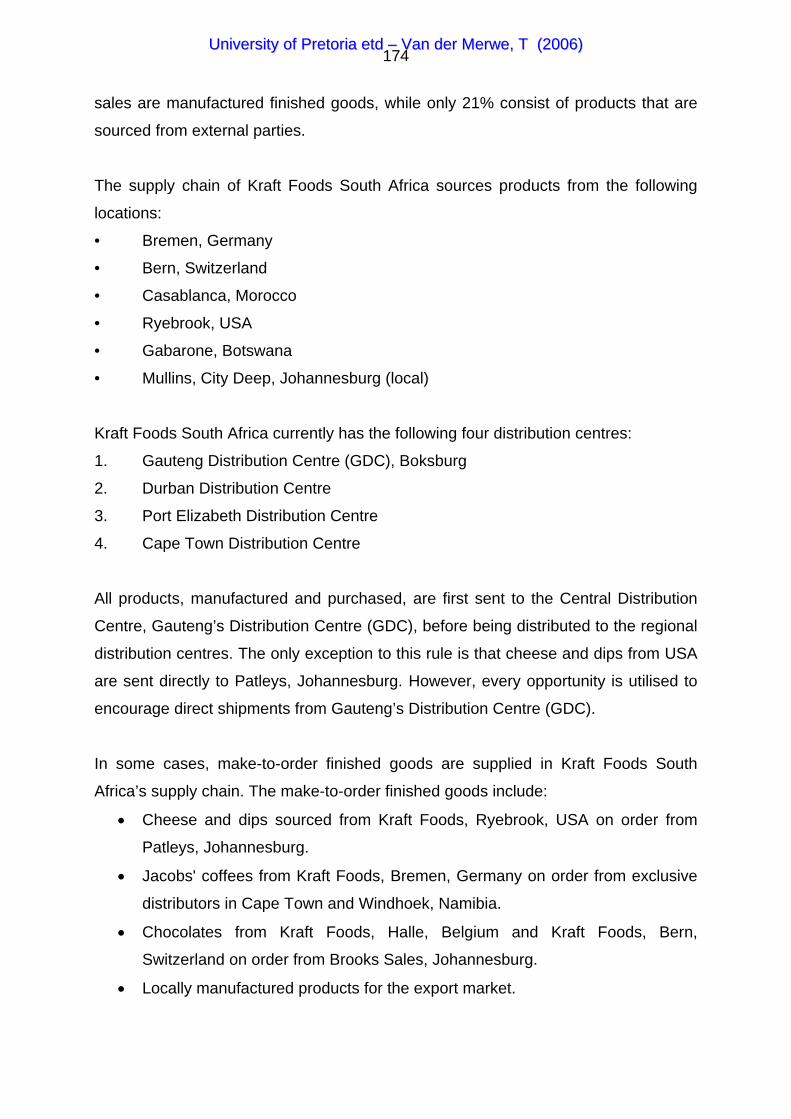
UUnniivveerrssiittyy ooff PPrreettoorriiaa eettdd –– VVaann ddeerr MMeerrwwee,, TT ((22000066))
174
sales are manufactured finished goods, while only 21% consist of products that are
sourced from external parties.
The supply chain of Kraft Foods South Africa sources products from the following
locations:
• Bremen, Germany
• Bern, Switzerland
• Casablanca, Morocco
• Ryebrook, USA
• Gabarone, Botswana
• Mullins, City Deep, Johannesburg (local)
Kraft Foods South Africa currently has the following four distribution centres:
1. Gauteng Distribution Centre (GDC), Boksburg
2. Durban Distribution Centre
3. Port Elizabeth Distribution Centre
4. Cape Town Distribution Centre
All products, manufactured and purchased, are first sent to the Central Distribution
Centre, Gauteng’s Distribution Centre (GDC), before being distributed to the regional
distribution centres. The only exception to this rule is that cheese and dips from USA
are sent directly to Patleys, Johannesburg. However, every opportunity is utilised to
encourage direct shipments from Gauteng’s Distribution Centre (GDC).
In some cases, make-to-order finished goods are supplied in Kraft Foods South
Africa’s supply chain. The make-to-order finished goods include:
• Cheese and dips sourced from Kraft Foods, Ryebrook, USA on order from
Patleys, Johannesburg.
• Jacobs' coffees from Kraft Foods, Bremen, Germany on order from exclusive
distributors in Cape Town and Windhoek, Namibia.
• Chocolates from Kraft Foods, Halle, Belgium and Kraft Foods, Bern,
Switzerland on order from Brooks Sales, Johannesburg.
• Locally manufactured products for the export market.
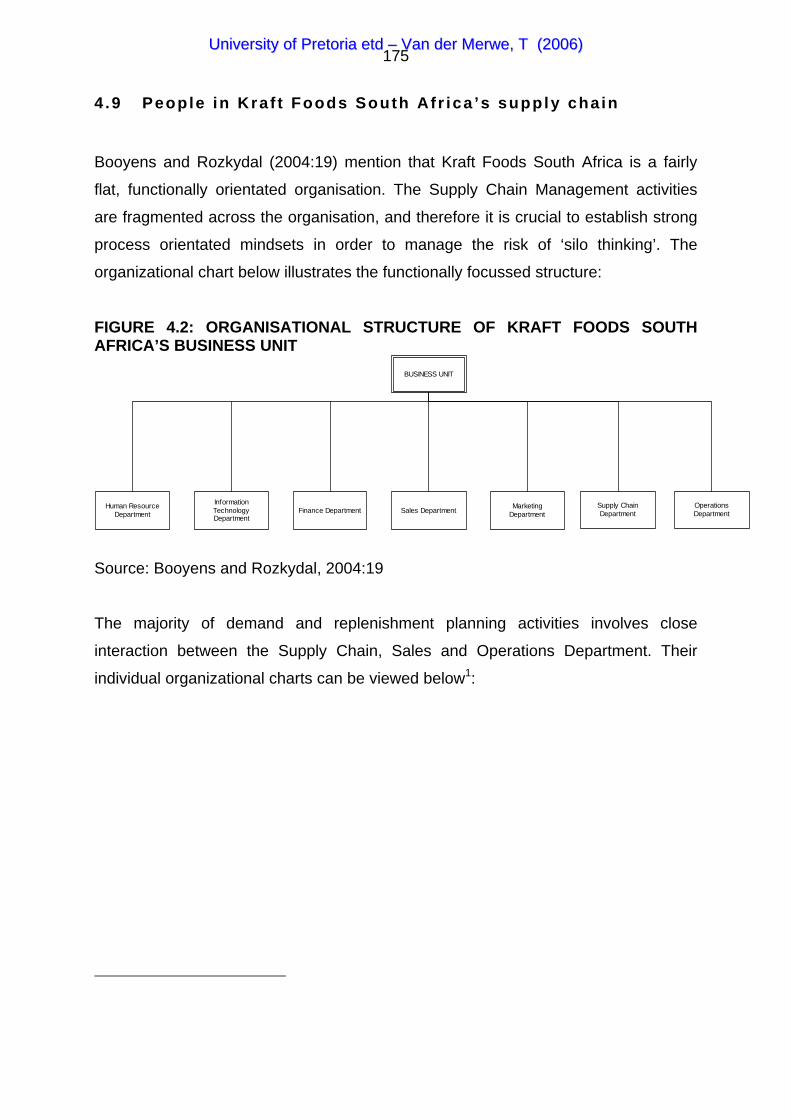
UUnniivveerrssiittyy ooff PPrreettoorriiaa eettdd –– VVaann ddeerr MMeerrwwee,, TT ((22000066))
175
4.9 People in Kraf t Foods South Afr ica ’s supply cha in
Booyens and Rozkydal (2004:19) mention that Kraft Foods South Africa is a fairly
flat, functionally orientated organisation. The Supply Chain Management activities
are fragmented across the organisation, and therefore it is crucial to establish strong
process orientated mindsets in order to manage the risk of ‘silo thinking’. The
organizational chart below illustrates the functionally focussed structure:
FIGURE 4.2: ORGANISATIONAL STRUCTURE OF KRAFT FOODS SOUTH AFRICA’S BUSINESS UNIT
BUSINESS UNIT
Finance Department Sales DepartmentInformationTechnologyDepartment
MarketingDepartment
Human ResourceDepartment
Supply ChainDepartment
OperationsDepartment
Source: Booyens and Rozkydal, 2004:19
The majority of demand and replenishment planning activities involves close
interaction between the Supply Chain, Sales and Operations Department. Their
individual organizational charts can be viewed below1:
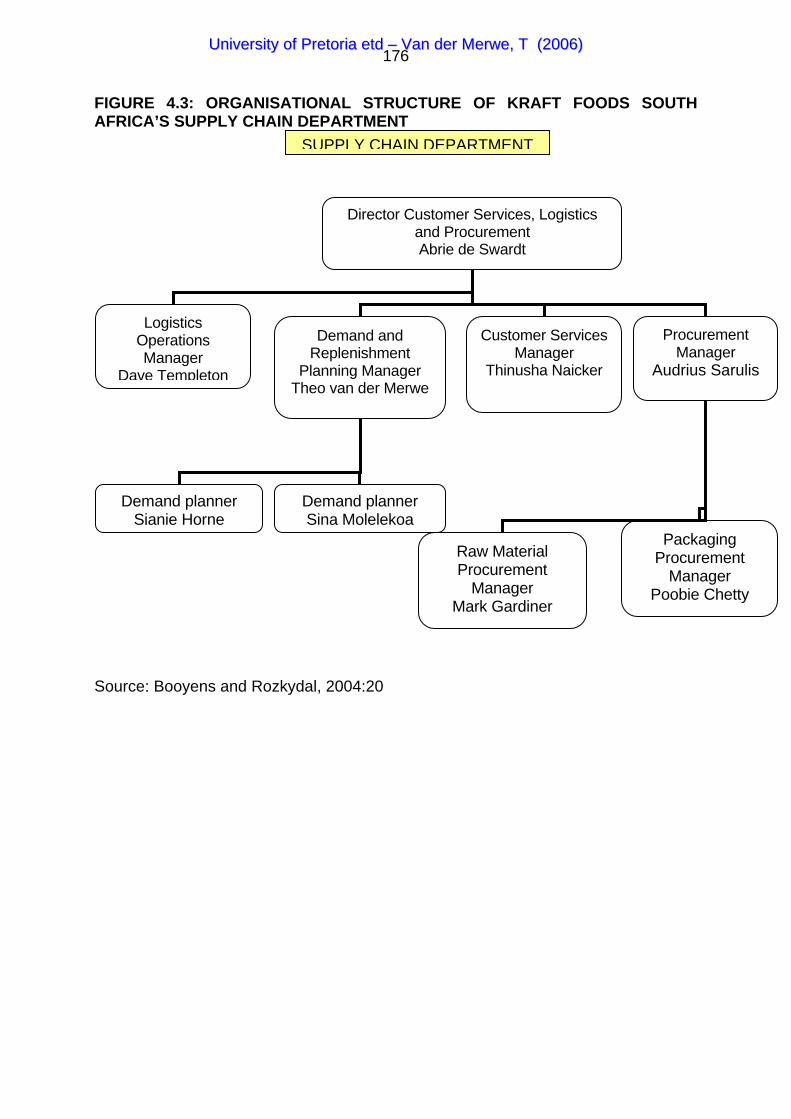
UUnniivveerrssiittyy ooff PPrreettoorriiaa eettdd –– VVaann ddeerr MMeerrwwee,, TT ((22000066))
176
FIGURE 4.3: ORGANISATIONAL STRUCTURE OF KRAFT FOODS SOUTH AFRICA’S SUPPLY CHAIN DEPARTMENT
Source: Booyens and Rozkydal, 2004:20
Director Customer Services, Logistics and Procurement Abrie de Swardt
Logistics Operations Manager
Dave Templeton
Demand and Replenishment
Planning Manager Theo van der Merwe
Customer Services Manager
Thinusha Naicker
Procurement Manager
Audrius Sarulis
Demand planner Sina Molelekoa
Demand planner Sjanie Horne
Packaging Procurement
Manager Poobie Chetty
Raw Material Procurement
Manager Mark Gardiner
SUPPLY CHAIN DEPARTMENT
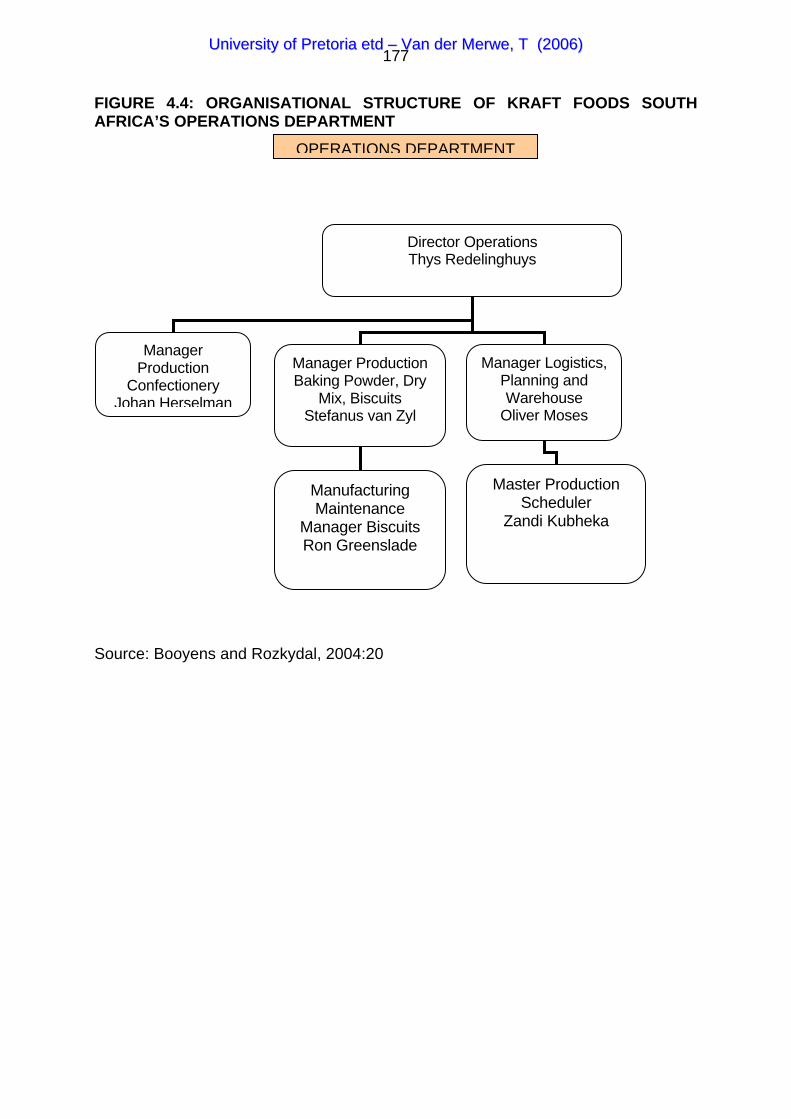
UUnniivveerrssiittyy ooff PPrreettoorriiaa eettdd –– VVaann ddeerr MMeerrwwee,, TT ((22000066))
177
FIGURE 4.4: ORGANISATIONAL STRUCTURE OF KRAFT FOODS SOUTH AFRICA’S OPERATIONS DEPARTMENT
Source: Booyens and Rozkydal, 2004:20
Director Operations Thys Redelinghuys
Manager Production
Confectionery Johan Herselman
Manager Production Baking Powder, Dry
Mix, Biscuits Stefanus van Zyl
Manager Logistics, Planning and Warehouse
Oliver Moses
Master Production Scheduler
Zandi Kubheka
Manufacturing Maintenance
Manager Biscuits Ron Greenslade
OPERATIONS DEPARTMENT
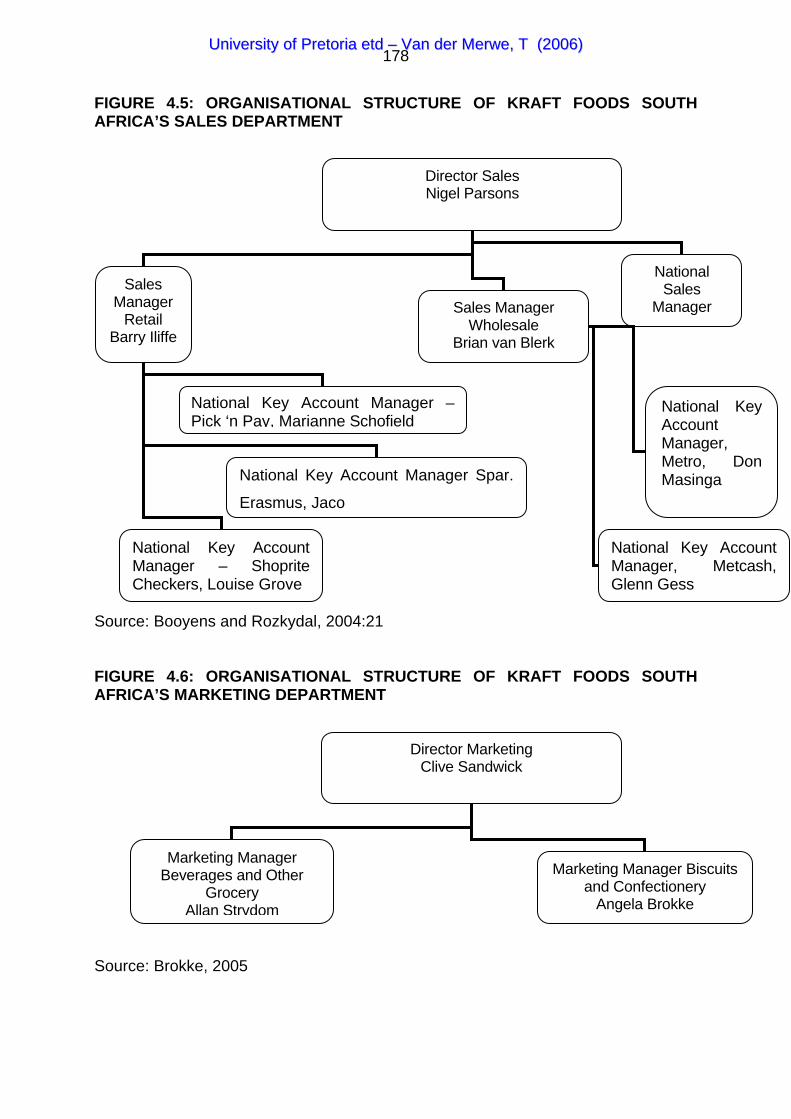
UUnniivveerrssiittyy ooff PPrreettoorriiaa eettdd –– VVaann ddeerr MMeerrwwee,, TT ((22000066))
178
FIGURE 4.5: ORGANISATIONAL STRUCTURE OF KRAFT FOODS SOUTH AFRICA’S SALES DEPARTMENT
Source: Booyens and Rozkydal, 2004:21
FIGURE 4.6: ORGANISATIONAL STRUCTURE OF KRAFT FOODS SOUTH AFRICA’S MARKETING DEPARTMENT
Source: Brokke, 2005
Director Marketing Clive Sandwick
Marketing Manager Beverages and Other
Grocery Allan Strydom
Marketing Manager Biscuits and Confectionery
Angela Brokke
Director Sales Nigel Parsons
Sales Manager
Retail Barry Iliffe
Sales Manager Wholesale
Brian van Blerk
National Sales
Manager
National Key Account Manager Spar.
Erasmus, Jaco
National Key Account Manager – Shoprite Checkers, Louise Grove
National Key Account Manager – Pick ‘n Pay, Marianne Schofield
National Key Account Manager, Metcash, Glenn Gess
National Key Account Manager, Metro, Don Masinga
UUnniivveerrssiittyy ooff PPrreettoorriiaa eettdd –– VVaann ddeerr MMeerrwwee,, TT ((22000066))
179
4.10 Funct iona l involvement in the p lanning processes
Booyens and Rozkydal (2004:1-68) indicate that various functions are involved in the
planning within Kraft Foods South Africa’s supply chain. Each function has a
contribution to the overall planning. The contributions of each department are listed
below:
Demand planning is responsible for:
• Co-ordinating the forecasting process.
• Constructing the consolidated forecast.
• Setting the maximum and minimum boundaries (boundary model).
• Co-ordinating the boundary review process.
• Procurement of finished goods.
Production is responsible for:
• Providing a supply plan.
• Input into aligning supply and demand.
• Planning production.
• Scheduling production.
Logistics and Operations are responsible for:
• Deciding where to deploy stock.
• Priority allocation decisions if insufficient stock exists.
• Redeployment decisions if required.
Sales are responsible for:
• Providing input into the forecast process.
• Providing input into the decomplexity process.
• Providing input into the priority allocation decision.
Marketing is responsible for:
• Providing input into the forecast process.
• Providing input into the decomplexity process.
• Providing input into the priority allocation decision.
UUnniivveerrssiittyy ooff PPrreettoorriiaa eettdd –– VVaann ddeerr MMeerrwwee,, TT ((22000066))
180
Finance is responsible for:
• Suggesting gap closures to align the financial forecast to the base-line
forecast.
• Providing input into the decomplexity process.
Procurement is responsible for:
• Ensuring contracts are in place and that timeous replenishment occurs.
• Providing input into the decomplexity process.
4.11 Technology involved in Kraf t ’s supply cha in
Booyens and Rozkydal (2004:1-68) indicate that technology must be seen as an
enabler. It is crucial that the underlying processes are sound and well adhered to
before technology is introduced. Technology assists people in completing the
processes more efficiently and accurately.
The following technology is utilised in Kraft Foods South Africa’s supply chain:
• ERP System: Currently Kraft South Africa utilises JBA in the business. A move
to MFG Pro is planned for 2005. The advantages and increased functionality
are currently being investigated.
• SCORE: Currently rSCORe (remote SCORe) is used in the business. The
functionality is limited to procurement planning and the execution of finished
goods from international Kraft business units on SCORE. The complete
SCORE package functionality includes demand and inventory replenishment
planning, as well as deployment planning. Currently no definite plans have
been formulated for the full SCORE implementation; however, the aim is to
have the system and processes implemented by the end of 2005.
• Forecast Pro: This is an independent statistical forecasting tool that can be
used in the demand planning process to calculate the base-line projection.
Plans for acquiring Forecast Pro in the first quarter of 2005 exist. An Excel-
based interim solution will be considered.
• Excel and Access: The business is currently dependent on Microsoft Excel
and Access as their main enabler of the planning process. Most models are
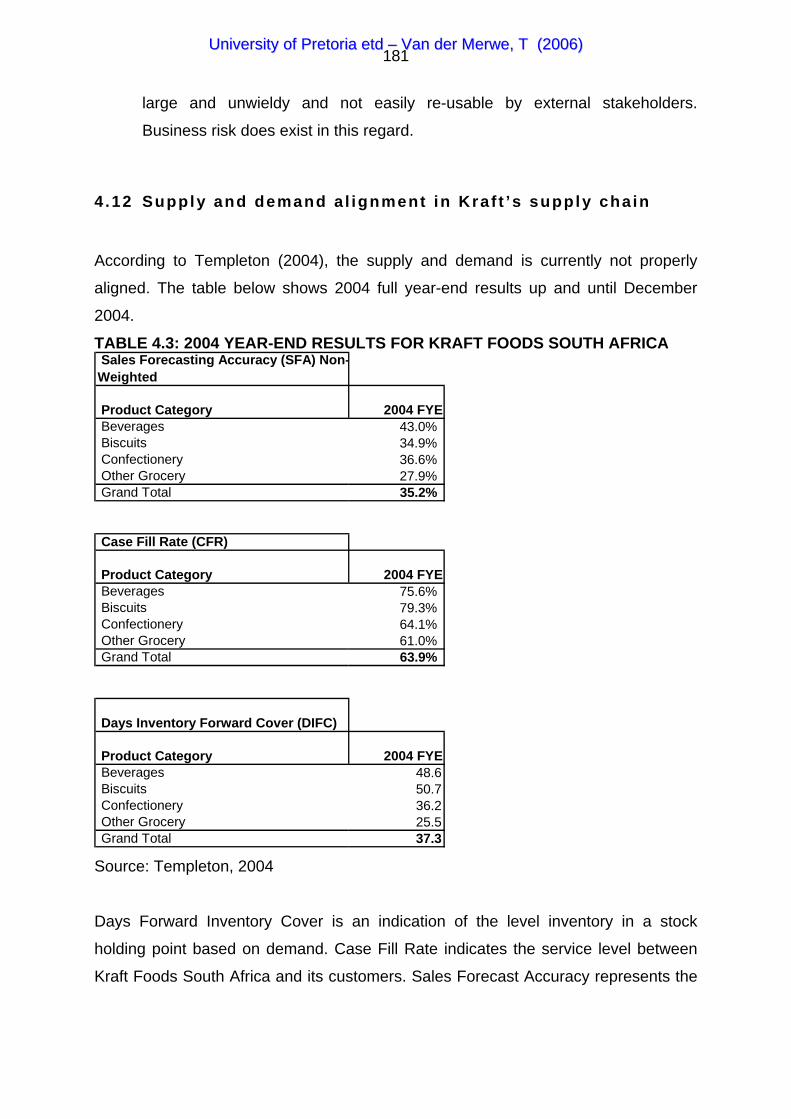
UUnniivveerrssiittyy ooff PPrreettoorriiaa eettdd –– VVaann ddeerr MMeerrwwee,, TT ((22000066))
181
large and unwieldy and not easily re-usable by external stakeholders.
Business risk does exist in this regard.
4.12 Supply and demand a l ignment in Kraf t ’s supply cha in
According to Templeton (2004), the supply and demand is currently not properly
aligned. The table below shows 2004 full year-end results up and until December
2004.
TABLE 4.3: 2004 YEAR-END RESULTS FOR KRAFT FOODS SOUTH AFRICA Sales Forecasting Accuracy (SFA) Non-Weighted
Product Category 2004 FYE Beverages 43.0% Biscuits 34.9% Confectionery 36.6% Other Grocery 27.9% Grand Total 35.2%
Case Fill Rate (CFR)
Product Category 2004 FYE Beverages 75.6% Biscuits 79.3% Confectionery 64.1% Other Grocery 61.0% Grand Total 63.9%
Days Inventory Forward Cover (DIFC)
Product Category 2004 FYE Beverages 48.6 Biscuits 50.7 Confectionery 36.2 Other Grocery 25.5 Grand Total 37.3 Source: Templeton, 2004
Days Forward Inventory Cover is an indication of the level inventory in a stock
holding point based on demand. Case Fill Rate indicates the service level between
Kraft Foods South Africa and its customers. Sales Forecast Accuracy represents the

UUnniivveerrssiittyy ooff PPrreettoorriiaa eettdd –– VVaann ddeerr MMeerrwwee,, TT ((22000066))
182
percentage of correctly forecasted stock keeping units, within a ± 25% tolerance
range, versus the total stock-keeping units.
Although Kraft Foods South Africa had 37.3 days of stock on hand, it could only
deliver 63.9 % of customer order volume. The situation was made worse with a sales
forecast accuracy of only 35.2 %, which was the result of selling different volumes
than the forecasted volume.
UUnniivveerrssiittyy ooff PPrreettoorriiaa eettdd –– VVaann ddeerr MMeerrwwee,, TT ((22000066))
183
CHAPTER 5: RESEARCH DESIGN AND METHODOLOGY
5 .1 In t roduct ion
The research design and methodology chapter documents the design and
methodology followed during the fieldwork (Moutton, 2001:123).
Research could have many purposes depending on the research topic and
objectives. The purposes of research are regarded as mainly threefold (Welman &
Kruger, 2001):
• To describe how things are, that is, to define the nature of the object being
studied.
• To explain why things are the way they are. In some cases one thing has
caused another to change. The aim can also be to explain the relationship
between things.
• To predict phenomena, such as human behaviour in the workplace, with the
aim of using this information, for example, to screen job applicants.
5.2 The purpose i f s tudying research methods
The study of research methods provides a researcher with the knowledge and skills
to solve the problems and meet the challenges of a fast-paced decision-making
environment. Business research can be defined as a systematic inquiry with the
objective of providing information in order to solve managerial problems (Cooper and
Schindler, 2003:5).
Three factors stimulate an interest in a scientific approach to decision- making
(Cooper and Schindler, 2003:5):
1. Managers have an increased need for more and better information.
2. The availability of improved techniques and tools to meet the need for more
and better information.
UUnniivveerrssiittyy ooff PPrreettoorriiaa eettdd –– VVaann ddeerr MMeerrwwee,, TT ((22000066))
184
3. The resulting information overload if discipline is not employed in the process.
The trend towards complexity has increased the risk associated with business
decisions, making it more important to have a sound information base. The following
factors, which characterise the complex business decision-making environment,
demand that managers have more and better information on which to base decisions
(Cooper and Schindler, 2003:6):
• There are more variables to consider in every decision.
• More knowledge exists in every field of management.
• Global and domestic competition is more vigorous, with many
businesses downsizing to refocus on primary competencies, reduce
costs, and make competitive gains.
• The quality of theories and models to explain tactical and strategic
results is improving.
• Government continues to show concern regarding all aspects of
society, becoming increasingly aggressive in protecting these various
members of the public.
• The explosive growth of company sites on the World Wide Web, e-
commerce, and company publications via desktop and electronic
publishing have brought the prospect of extensive new arrays of
information, but information quality is increasingly suspect.
• Workers, shareholders, customers and the general public are
demanding to be included in company decision- making; they are better
informed and more sensitive to their own self-interests than ever
before.
• Organisations are increasingly practicing data mining, learning to
extract meaningful knowledge from volumes of data contained within
internal databases.
• Computer advances have allowed businesses to create the architecture
of data warehousing which comprises, electronic warehouses where
vast arrays of collected, integrated data are ready for mining.
UUnniivveerrssiittyy ooff PPrreettoorriiaa eettdd –– VVaann ddeerr MMeerrwwee,, TT ((22000066))
185
• The power and ease of use of today’s computers have given us the
capability to analyse data to deal with today’s complex managerial
problems.
• Techniques of quantitative analysis take advantage of increasingly
powerful computing capabilities.
• The number and power of the tools used to conduct research have
increased, corresponding with the growing complexity of business
decisions.
• Communication and measurement techniques within research have
been enhanced.
To cope in such an environment, one needs to understand how to identify quality
information and to recognise the solid, reliable research on which high-risk
management decisions are based (Cooper and Schindler, 2003:6).
5.3 Research des ign
There are many definitions for research design, but together they provide the
following essentials (Cooper and Schindler, 2003:146):
• The design is an activity and time- based plan.
• It is always based on the research question.
• It guides the selection of sources and types of information.
• It is a framework for specifying the relationships among the study’s variables.
• It outlines procedures for every research activity.
A number of different research design approaches exist, but unfortunately, no simple
classification system defines all the variations that must be considered. The following
eight different descriptions classify research:

UUnniivveerrssiittyy ooff PPrreettoorriiaa eettdd –– VVaann ddeerr MMeerrwwee,, TT ((22000066))
186
5.3.1 Degree of research question crystallization
A research study may be viewed as exploratory or formal. Exploratory studies tend
toward loose structures with the objective of discovering future research tasks. The
immediate purpose of exploration is usually to develop hypotheses or questions for
further research. The formal study begins where exploration leaves off – with a
hypothesis or research question and involves precise procedures and data source
specification. The goal of a formal research design is to test the hypotheses or
answer the research question posed
(Cooper and Schindler, 2003:146).
This research project is exploratory in nature as it attempts to determine the causes
and solutions of aligning supply and demand in a supply chain.
5.3.2 Method of data collection
The different methods of classification distinguish between monitoring and
interrogation or communication purposes (Cooper and Schindler, 2003:147).
When monitoring, the researcher inspects the activities of a subject or the nature of
some material without attempting to elicit responses from anyone (Cooper and
Schindler, 2003:6). In each case the researcher notes and records the information
available from observations (Cooper and Schindler, 2003:147).
In the interrogation or communication study, the researcher questions the subjects
and collects their responses by personal or impersonal means. The collected data
may result from one or a combination of the following:
• Interview or telephone conversations (Cooper and Schindler, 2003:6).
• Self-administered or self-reported instruments sent through the mail, left in
convenient locations, or transmitted electronically or by other means. (Cooper
and Schindler, 2003:147, 149).
• Instruments presented before and/or after treatment or stimulus condition in
an experiment (Cooper and Schindler, 2003:149).
UUnniivveerrssiittyy ooff PPrreettoorriiaa eettdd –– VVaann ddeerr MMeerrwwee,, TT ((22000066))
187
This research project starts by monitoring the theoretical framework available on the
subject of aligning supply and demand. The research is concluded with a
communication study, whereby stakeholders are interviewed to test the findings of
the theoretical framework.
5.3.3 Researcher control of variables
In terms of the researcher’s ability to manipulate variables, the research designs can
either be experimental or ex post facto designs (Cooper and Schindler, 2003:149).
In an experiment, the researcher attempts to control and/or manipulate the variables
in the study. Experimental design is appropriate when a researcher wishes to
discover whether certain variables produce effects in other variables.
Experimentation provides the most powerful support possible for a hypothesis of
causation (Cooper and Schindler, 2003:149).
With an ex post facto design, researchers have no control over the variables in the
sense of being able to manipulate them. They can only report what has happened or
what is happening. It is important for the researcher who uses ex post facto design
not to influence the variables in order to avoid bias (Cooper and Schindler,
2003:149).
This research project is based on an ex post facto design, as the researcher can only
report what has happened or what is happening within the supply chain of the fast
moving consumer good’s company.
5.3.4 The purpose of the study
The essential difference between descriptive and causal studies lies in their
objectives. Descriptive research studies are concerned with finding out who, what,
where, when and how much (Cooper and Schindler, 2003:149). A descriptive study
UUnniivveerrssiittyy ooff PPrreettoorriiaa eettdd –– VVaann ddeerr MMeerrwwee,, TT ((22000066))
188
tries to discover answers to the questions who, what, when, where and sometimes,
how. The researcher attempts to describe or define a subject, often by creating a
profile of a group of problems, people or events (Cooper, 2003:10).
Causal research studies, on the other hand, are concerned with learning why or how
one variable produces changes in another (Cooper and Schindler, 2003:149). This research project is a descriptive research study as it attempts to find the causes
and solutions of aligning the supply and demand within a supply chain.
5.3.5 The time dimension
Cross- sectional studies are carried out once and represent a snapshot of one point
in time. Longitudinal studies are repeated over an extended period. The advantage of
longitudinal study is that it can track changes over a certain time (Cooper and
Schindler, 2003:149). While longitudinal research is important, the constraints of budget and time impose
the need for cross-sectional analysis. Some benefits of a longitudinal study can be
revealed in a cross-sectional study by skilful questioning about past attitudes, history
and future expectations. Reponses to these kinds of questions should be interpreted
with care, however (Cooper and Schindler, 2003:150). This research is a cross
sectional study as it represents a snapshot of the alignment of the supply and
demand within Kraft Foods South Africa’s supply chain.
5.3.6 The topical scope
The statistical study differs from the case study in several ways. Statistical studies
are designed for breadth rather than depth. They attempt to capture a population’s
characteristics by making inferences from a sample’s characteristics. Hypotheses are
tested quantitatively. Generalisations about findings are presented based on a typical
sample and the validity of the design (Cooper and Schindler, 2003:150).
UUnniivveerrssiittyy ooff PPrreettoorriiaa eettdd –– VVaann ddeerr MMeerrwwee,, TT ((22000066))
189
Case studies place more emphasis on a full contextual analysis of fewer events of
conditions and other interrelations. Although hypotheses are often used, the reliance
on qualitative data makes support or rejection very difficult. An emphasis on detail
provides valuable insight into problem solving, evaluation and strategy. The detail is
secured from multiple sources of information. Evidence can be verified and missing
data can be avoided (Cooper and Schindler, 2003:150).
A single well-designed case study can provide a major challenge to a theory and
provide a source of new hypotheses (Cooper and Schindler, 2003:150).
The research study is a case study of Kraft Foods South Africa’s supply chain.
5.3.7 The research environment
The research design also differs as to whether it occurs under actual environmental
conditions, called field conditions, or under staged or manipulated conditions, called
laboratory conditions (Cooper and Schindler, 2003:150).
Simulations are increasingly used in research, especially in operations research. The
major characteristics of various conditions and relationships in actual situations are
often represented in mathematical models (Cooper and Schindler, 2003:150).
The research is done under actual environmental conditions, called field conditions.
5.3.8 Participants’ perceptions
The usefulness of a design may be reduced when people in a disguised study
perceive that research is being conducted. Participants’ perceptions influence the
outcomes of the research in subtle ways. Although there is no widespread evidence
of attempts by participants or respondents to please researchers through successful
hypothesis guessing, or evidence of the occurrence of sabotage, when participants

UUnniivveerrssiittyy ooff PPrreettoorriiaa eettdd –– VVaann ddeerr MMeerrwwee,, TT ((22000066))
190
believe something out of the ordinary is happening, they may behave less naturally.
There are three levels of perception (Cooper and Schindler, 2003:151):
:
1. The participants perceive no deviation from everyday routines.
2. The participants perceive deviations which are unrelated to the researcher.
3. The participants perceive deviations as researcher- induced.
Participants’ perceptions serve as a reminder to classify one’s study by type, to
examine validation strengths and weaknesses, and to be prepared to qualify results
accordingly (Cooper and Schindler, 2003:151).
The research design and methodology chapter provides full details of the data
collection process, including gaining access to the subjects, data collection
techniques and procedures used, and dates and settings of data gathering (Moutton,
2001:123).
The research methodology indicates how the researcher intends to conduct the
fieldwork (Moutton, 2001:46).
5 .4 Research des ign and methodology
There are differences between the research design and methodology which any
researcher must understand and recognise.
Research design focuses on the end product, i.e. what kind of study is being planned
and what kind of result is aimed at. Research methodology focuses on the research
process and the kind of tools and procedures to be used (Moutton, 2001, 56).
The point of departure of research design is the research problem or question. The
point of departure of research methodology is specific tasks to collect and sample the
data at hand (Moutton, 2001, 56).
UUnniivveerrssiittyy ooff PPrreettoorriiaa eettdd –– VVaann ddeerr MMeerrwwee,, TT ((22000066))
191
Research design focuses on the logic of research to determine the kind of evidence
required to address the research question adequately. Research methodology
focuses on the individual steps in the research process and the most objective or
unbiased procedures to be employed (Moutton, 2001, 56).
Research techniques entail the specific things that researchers use to sample,
measure, collect and analyse information (Welman, 2001:2). Research methodology
considers and explains the logic behind the research methods (Welman, 2001:2).
5.5 Secondary versus pr imary research data
Data can be defined as the facts presented to the researcher from the study’s
environment (Cooper, 2003:87). Data can be collected from either primary or
secondary data sources.
The first step in exploratory study is a search of the secondary literature. Studies
made by others for their own purposes represent secondary data. It is ineffective to
discover anew through the collection of primary data or original research what has
already been done and reported at a level sufficient for management to make a
decision. With secondary data exploration, a researcher should first start with an
organisation’s own data archives. The second source of secondary data is published
documents prepared by authors outside the sponsor organisation. Searching through
secondary sources will supply excellent background information, as well as many
good leads (Cooper, 2003:152-153).
There are a number of reasons why the review of the existing scholarship is so
important (Moutton, 2001:87):
• To ensure that one does not merely duplicate a previous study.
• To discover what the most recent and authoritative theorising about the
subject is.
• To find out what the most widely- accepted empirical findings in the field of
study are.
UUnniivveerrssiittyy ooff PPrreettoorriiaa eettdd –– VVaann ddeerr MMeerrwwee,, TT ((22000066))
192
• To identify the available instrumentation that has proven to be valid and
reliable.
• To ascertain what the most widely accepted definitions of key concepts in the
field are.
• To save time and avoid duplication and unnecessary repetition. A good review
of the available scholarship not only saves one time to avoid making the same
errors and duplicating previous results unnecessarily, but secondary data also
provides clues and suggestions about which avenues to follow.
Data reflects truthfulness by means of its closeness to the phenomena. Secondary
data has had at least one level of interpretation inserted between the events and its
recording. Primary research is very close to the truth (Cooper, 2003:87). The reason
for the preference of primary data versus secondary data is that with each transfer
from one source to another, the information may be inadvertently or deliberately
distorted (Welman, 2001:179).
Secondary data is an interpretation of primary data. Examples of secondary data
include encyclopaedias, textbooks, handbooks, magazine and newspaper articles,
sales analysis summaries, investor annual reports, monographs, conference
proceedings, reference materials, journal articles, newspapers, magazines, reports,
theses and dissertations and unpublished research reports (Cooper, 2003:282),
(Moutton, 2001:88), (Welman, 2001:17). The main categories of search tools are
(Moutton, 2001:89):
• Online databases.
• CD-ROM databases.
• Internet.
Libraries are no longer the only source of information. The development of the
Internet and electronic publishing has had an enormous impact on research
supervision, peer review of publications and general communications capabilities,
and has changed the way researchers work (Welman, 2001:34). Even the World
Wide Web is a source of information. But searching the Web and retrieving reliable
information from it is a great deal more problematic than searching a bibliographic
UUnniivveerrssiittyy ooff PPrreettoorriiaa eettdd –– VVaann ddeerr MMeerrwwee,, TT ((22000066))
193
database. There are no standard database fields, no carefully defined subject
hierarchies, called controlled vocabulary, no cross-references, no synonyms, no
selection criteria, and in general, no rules. There are many search engines and they
all work differently, but how they work is not always easy to determine. Nonetheless,
the convenience of the Web and the extraordinary amount of information to be found
on it are compelling reasons for using it as a source of information (Cooper,
2003:290-291). The Web search engine or portal that the researcher selects may
well be determined by how comprehensive the results should be. For normal
searches, one of the major sites could be used, for example, Yahoo. If, however, the
researcher is interested in gathering comments and opinions that focus on Usenet
groups, a more inclusive search engine such as Northern Light could be used. If the
researcher is interested in comprehensiveness, more than one search engine could
be used (Cooper, 2003:292).
Information from the Internet is considered less reliable than that of printed sources,
because web pages can be updated and changed on a daily basis. A researcher
should even consider including a printed hard copy of the Internet source with the
research paper as an appendix. This will ensure that the factual information used
cannot later be contested (Welman, 2001:34).
It is the researcher’s responsibility to keep abreast of the research reported on the
research topic up to at least the time that the research report is concluded. This
practice will prevent the research from becoming outdated or irrelevant the moment it
is published. In this sense, literature research on a topic is a never-ending process
(Welman, 2001:34-35).
Primary sources have more value than secondary sources, and secondary sources
have more value than tertiary sources. If the information is essential to solving the
management dilemma, it is wise to verify the information in a primary source
(Cooper, 2003:282-283).
The literature review should not consist of mere compilation of separate, isolated
summaries of the individual studies of previous researchers. The researcher should
UUnniivveerrssiittyy ooff PPrreettoorriiaa eettdd –– VVaann ddeerr MMeerrwwee,, TT ((22000066))
194
clearly show how the studies relate to one another and how the proposed research
ties in with them (Welman 2001:35).
As a researcher begins to collect information about the topic, he should conduct a
source evaluation. Information sources are evaluated and selected based on five
factors that can be applied to any type of source, whether printed or electronic.
These factors are purpose, scope, authority, audience and format (Cooper,
2003:284).
5.5.1 Purpose
The purpose of the source is to determine what the author is trying to accomplish.
Once one has determined the purpose of the source, the researcher will also want to
determine whether or how it provides a bias to the information presented. Bias is the
absence of a balanced presentation of information. A researcher can expect sources
offered by independent organisations to be more balanced, presenting both positive
and negative information about relevant organisations, without favouring one or the
other (Cooper, 2003:284).
5.5.2 Scope
Tied closely to the purpose of the source is its source. Issues that should be
considered include the date of publication, the time period covered and the width and
depth of the coverage. If the researcher does not know the scope of the information
sources, essential information might be missed by relying on an incomplete source
(Cooper, 2003:284).
5.5.3 Authority
The primary information sources are the most authoritative. In any source, both the
author and the publisher are indicators of the authority. The author and the author’s
credentials should be given both in the printed and the electronic source. If
UUnniivveerrssiittyy ooff PPrreettoorriiaa eettdd –– VVaann ddeerr MMeerrwwee,, TT ((22000066))
195
credentials are not given, then it is best to check a biographical source. Credentials
may include the author’s educational background, position, or other published and
reviewed work. Credentials alone are not enough. Most scholarly articles are
validated by a system called peer review in which colleagues from other institutions
are asked to comment anonymously on the research presented (Cooper, 2003:286).
5.5.4 Audience
Audience is also an important factor in evaluating an information source and it, too, is
tied to the purpose of the source. When evaluating the plausible audience of a
source, the researcher should look for key indicators including vocabulary, types of
information, and the questions or directions that guide the research (Cooper,
2003:286).
5.5.5 Format
Format factors may vary from one source to another, but in general they relate to
how the information is presented and how easy it is to find a specific piece of
information. In a printed source, the arrangement of the information, for example,
alphabetical, hierarchical or chronological, nearly always has an impact on the
retrieval of information (Cooper, 2003:287).
5.6 Cr i ter ia for a good l i tera ture rev iew
There are some criteria that should be applied when putting the literature review
together (Moutton, 2001:90-91):
• The literature review should be exhaustive in its coverage of the main aspects
of the study. It is obviously impossible to do a review that includes every single
article or contribution ever written on a particular topic. However, the
supervisor may expect the review to be exhaustive in terms of its coverage of
UUnniivveerrssiittyy ooff PPrreettoorriiaa eettdd –– VVaann ddeerr MMeerrwwee,, TT ((22000066))
196
the main aspects or themes of the study. The researcher knows that he has
obtained adequate literature coverage when the following apply:
o When the researcher finds a repetition of references and authors.
o When no new themes or viewpoints emerge.
o When secondary reviews, commentaries or book reviews confirm what
the researcher has found so far.
• A good review is fair in its treatment of others. A study should never be
approached with a pre-set interpretation. The researcher should always aim to
do justice to the author’s arguments and reasoning before starting to criticise
the article.
• The literature review should be topical and not dated. The researcher should
consult the supervisor for advice in terms of the time period that should be
covered.
• A literature review should not be confined to Internet sources. The bulk of the
scholarship, however, is still published in standard scientific journals and
books and these should be the first choice.
• A good literature review should be well organised. A literature review is not a
mere compilation, summary or list of information sources. It should be based
on the research problem being studied. The literature is not simply driven by
the research questions, the opposite also applies: the more the researcher
reads, the more clarity he gets, which often leads to a change in the
formulation of the research problem.
5.7 Exper ience Survey
While published data is a valuable resource, no more than a fraction of the existing
knowledge in a field is usually put into writing. A significant portion of what is known
about a topic, even though it may be in writing, may be proprietary to a given
organisation and thus unavailable to an outside researcher. Internal data archives
are rarely well organised, making these secondary sources, even when known, also
difficult to locate (Cooper, 2003:153).
UUnniivveerrssiittyy ooff PPrreettoorriiaa eettdd –– VVaann ddeerr MMeerrwwee,, TT ((22000066))
197
A researcher will thus benefit by seeking information from persons experienced in the
area of study, tapping into their collective memories and experiences. When persons
in an experience survey are interviewed, the researcher should endeavour to find out
what their ideas about important issues or aspects of the subject are and discover
what is important across the subject’s range of knowledge. The investigative format
used should be flexible enough so that avenues that emerge during the interview can
be explored (Cooper, 2003:154).
5.8 Act ions that guarantee good research
Good research generates dependable data, being derived from practices that are
conducted professionally and that can be used reliably for managerial decision-
making. In contrast, poor research is carelessly planned and conducted, resulting in
data that a manager cannot use to reduce the decision-making risk (Cooper and
Schindler, 2003:14).
Good research follows the standards of the scientific method. Several characteristics
of the scientific method are listed below (Cooper and Schindler, 2003:14):
5.8.1 Purpose clearly defined
The purpose of the research, the problem involved or the decision to be made,
should be clearly defined. The statement of the decision- problem should include its
scope, its limitations and the precise meanings of all the words and terms significant
to the research. Failure to do this adequately may raise legitimate doubts in the
minds of research report readers as to whether the researcher has sufficient
understanding of the problem to make a sound proposal attacking it (Cooper and
Schindler, 2003:14-15).
UUnniivveerrssiittyy ooff PPrreettoorriiaa eettdd –– VVaann ddeerr MMeerrwwee,, TT ((22000066))
198
5.8.2 Research process detailed
The research procedures used should be described in sufficient detail to permit
another researcher to repeat the research (Cooper and Schindler, 2003:16).
5.8.3 Research design thoroughly planned
The procedural design of the research should be carefully planned to yield results
that are as objective as possible. A survey of opinions or recollections ought to be
used when more reliable evidence is available from the documentary sources or by
direct observation. Bibliographical searches should be as thorough and as complete
as possible. Efforts should be made to minimise the influence of personal bias in
selecting and recording data (Cooper and Schindler, 2003:16).
The threat of bias should be given more emphasis. The business researcher often
knows from the beginning what results the sponsor would like to have. To combat
this potentially biased influence, it may be necessary to secure an understanding
between manager and researcher before stating that the objective is to uncover
reality – wherever that leads (Cooper and Schindler, 2003:18).
5.8.4 High ethical standards applied
Careful consideration must be given to those research situations in which there is a
possibility of physical or psychological harm, exploitation, invasion of privacy, and / or
loss of dignity. The need for the research must be weighed against the potential for
adverse effects (Cooper and Schindler, 2003:17).
5.8.5 Limitations frankly revealed
The researcher should report, with complete frankness, flaws in procedural design
and estimate their effect on the findings. There are very few perfect research
UUnniivveerrssiittyy ooff PPrreettoorriiaa eettdd –– VVaann ddeerr MMeerrwwee,, TT ((22000066))
199
designs. Some of the imperfections may have little effect on the validity and reliability
of the data; others may invalidate it entirely. A competent researcher should be
sensitive to the effects of imperfect design, and the researcher’s experience in
analysing the data should provide a basis of estimating the influence. As a decision-
maker, the value of the research should be questioned where no limitations are
reported (Cooper and Schindler, 2003:17).
Despite the limitations and challenges, the research for this project was completed
within the available time and with the resources available.
5.8.6 Adequate analysis for decision- maker’s needs
Adequate analysis of the data is the most difficult phase of research for the novice.
The data should be classified in ways that assist the researcher in reaching pertinent
conclusions and clearly reveal the findings that have led to those conclusions
(Cooper and Schindler, 2003:17).
5.8.7 Findings presented clearly
Some evidence of the competence and integrity of the researcher may be found in
the report itself. For example, language that is restrained, clear and precise;
assertions that are carefully drawn and hedged with appropriate reservations; and an
apparent effort to achieve maximum objectivity, tend to leave a favourable
impression of the researcher with the decision- maker. Generalisations that outrun
the evidence on which they are based, exaggerations and unnecessary verbiage
tend to leave an unfavourable impression. Such reports are not valuable to managers
wading through the minefields of business decision- making. Presentations of data
should be comprehensive, easily understood by the decision- maker, and organised
so that the design- maker can readily locate critical findings (Cooper and Schindler,
2003:17).
UUnniivveerrssiittyy ooff PPrreettoorriiaa eettdd –– VVaann ddeerr MMeerrwwee,, TT ((22000066))
200
5.8.8 Conclusions justified
Conclusions should be limited to those for which the data provide an adequate basis.
Researchers are often tempted to broaden the basis of their conclusions by including
personal experience and their interpretations thereof, which would be data that has
not been subjected to the controls under which the research data was gathered.
Equally undesirable is the frequent practice of drawing conclusions from a study of a
limited population and applying them universally. Researchers may also be tempted
to rely too heavily on data collected in a prior study and use it in the interpretation of
a new study. Such practice sometimes occurs among research specialists who
confine their work to clients in a small industry. These actions tend to decrease the
objectivity of the research and weaken readers’ confidence in the findings. Good
researchers always specify the conditions under which their conclusions seem to be
valid (Cooper and Schindler, 2003:17).
5.8.9 Researcher’s experience reflected
Greater confidence in the research is guaranteed if the researcher is experienced,
has a good reputation in research and is a person of integrity. Where it is possible for
the reader of the research report to obtain sufficient information about the researcher,
this criteria perhaps would be one of the best bases for judging the degree of
confidence a piece of research warrants and the value of any decision based upon it.
For this reason, the research report should contain information about the
qualifications of the researcher (Cooper and Schindler, 2003:17-18).
The research report should cover information on all individuals involved in the
research project. It should also cover the professional research competence, for
example, relevant research experience, the highest academic degree held, and
memberships in business and technical societies; as well as relevant management
experience (Cooper and Schindler, 2003:103).
UUnniivveerrssiittyy ooff PPrreettoorriiaa eettdd –– VVaann ddeerr MMeerrwwee,, TT ((22000066))
201
5.9 Invest igat ive quest ions
Once the research question has been selected, researcher- thinking moves to a
more specific level, that of investigative questions. Investigative questions reveal the
specific pieces of information the manager requires to answer the specific research
question (Cooper and Schindler, 2003:75).
Investigative questions are questions the researcher must answer to satisfactorily
arrive at a conclusion about the research question. To formulate them, the
researcher takes a general research question and breaks it into more specific
questions about which data to gather (Cooper and Schindler, 2003:75).
Target questions address the investigative questions of a specific study. These
questions may be structured or unstructured. Structured questions present the
participants with a fixed set of choices, often called closed questions. The closed
question restricts the answers to a small set of responses and requires the
questionnaire designer to have a fair knowledge of the range of options the subjects
might have in this area. Unstructured questions do not limit responses, but provide a
frame of reference for participants’ answers, sometimes referred to as open-ended
questions. The open-ended question has the merit of not imposing restrictions as to
the possible answer, but it is harder to aggregate and to computerise. Open-ended
questions offer rich and deeper responses (Cooper and Schindler, 2003:362), (Riley
2000: 95).
The type of interview also affects the question structure. In extremely unstructured
interviews, the interviewer’s task is to encourage talking in-depth about a set of
topics. The in-depth interview encourages participants to share as much information
as possible in an unconstrained environment. The interviewer uses a minimum of
prompts (Cooper and Schindler, 2003:362).
UUnniivveerrssiittyy ooff PPrreettoorriiaa eettdd –– VVaann ddeerr MMeerrwwee,, TT ((22000066))
202
5.10 Deduct ion versus induct ion
To induce is to draw a conclusion from one or more particular facts or pieces of
evidence. The conclusion explains the facts, and the facts support the conclusion
(Cooper and Schindler, 2003:37). One form of inductive inference is retroductive
reasoning, whereby inferences from observations or data are used to construct or
infer an explanation of the observation. Retroductive inferences involve the creation
of hypotheses that provide plausible accounts and explanations of observed events
and data (Moutton, 2001:118).
Deduction is a form of inference. The conclusion must follow the reasons given. The
reasons are said to imply the conclusion and represent proof. For a deduction to be
correct, it must be true and valid. Premises or reasons given for the conclusion must
agree with the real world and the conclusion must necessarily follow from the valid
premises (Cooper and Schindler, 2003:36). Phrases that usually indicate deductive
reasoning include “following this”, “on the basis of the aforementioned”, “hence”,
“thus”,” therefore”, “this leads to” (Moutton, 2001:117).
5.11 Surveys
Once the researcher has determined that surveying is the appropriate data collection
approach; various methods may be used to secure information from individuals. A
researcher can conduct a survey by personal interview, telephone, mail, computer, or
a combination of these.
5.11.1 Personal interviewing
A personal interview is a two-way conversation initiated by an interviewer to obtain
information from a participant. The interviewer and participant can be strangers, and
the interviewer generally controls the topics and patterns of discussion (Cooper and
Schindler, 2003:323).
UUnniivveerrssiittyy ooff PPrreettoorriiaa eettdd –– VVaann ddeerr MMeerrwwee,, TT ((22000066))
203
There are real advantages, as well as clear limitations to personal interviewing. The
greatest value lies in the depth of information and detail that can be secured.
Personal interviewing far exceeds the information secured from telephone and self-
administered studies via intercepts, mail surveys, or computer, both intranet and
Internet. The interviewer can also do more things to improve the quality of the
information received than with another method (Cooper and Schindler, 2003:325).
In order to have a successful personal interview, three broad conditions must be met
(Cooper and Schindler, 2003:326):
• The participant must possess the information being targeted by the
investigative questions.
• The participants must understand their role in the interview as the providers of
accurate information.
• The participant must be adequately motivated to participate.
The interviewer’s introductory explanations should be no more detailed than
necessary. Too much information can introduce a bias (Cooper and Schindler,
2003:329).
5 .11 .1 .1 Gather ing persona l in te rv iew da ta
A difficult task in interviewing is to make certain the questions adequately satisfy the
question’s objectives. It is important to know the objectives of questions, because
many first responses are inadequate even in the best-planned events (Cooper and
Schindler, 2003:330). Interviewing cannot begin until decisions have been made
about who to interview and what questions to ask (May, 2002:204).
The technique of stimulating participants to answer fully and relevantly is termed
probing. There are several different probing styles (Cooper and Schindler, 2003:326):
• A brief statement of understanding and interest. The comments from the
interviewer can tell the participant that he is listening.
• An expectant pause will suggest to the participant that more information is
required.

UUnniivveerrssiittyy ooff PPrreettoorriiaa eettdd –– VVaann ddeerr MMeerrwwee,, TT ((22000066))
204
• Repeating the question. This is particularly useful when the participant
appears not to have understood the question or has strayed from the subject.
• Repeating the participant’s reply. Hearing thoughts restated often promotes
revisions of further comments.
• A neutral question or comment makes a direct bid for information. Examples
are: “Why do you think this is so?” or “Anything else?”
• Question clarification. When the answer is unclear or is inconsistent with
something already said, the interviewer may suggest to the participant that he
has failed to understand fully.
5 .11 .1 .2 Record ing persona l in te rv iews
While the methods used in recording will vary, the interviewer usually writes down the
answers of the participants. Some guidelines can make this task more efficient.
Responses should be recorded as they occur. If the researcher waits until later,
much of what has been said could be lost. Another technique is for the interviewer to
repeat the response while writing it down (Cooper and Schindler, 2003:331). A
researcher should not wait until all the data has been collected before starting to
analyse it. He should thus write up or record the field notes as soon as possible
(Moutton, 2001:111).
5.12 F indings, summary, conclus ions and recommendat ions
The objective with the findings section is to explain the data, rather than draw
interpretations or conclusions. When quantitative data can be presented, this should
be done with charts, graphics and tables (Cooper and Schindler, 2003:664).
The researcher does not need to include all the data collected. However, he should
show findings that are unfavourable to the hypotheses, as well as those that support
it (Cooper and Schindler, 2003:664).
UUnniivveerrssiittyy ooff PPrreettoorriiaa eettdd –– VVaann ddeerr MMeerrwwee,, TT ((22000066))
205
The summary, on the other hand, is a brief statement of the essential findings.
Sectional summaries may be used if there are many specific findings (Cooper and
Schindler, 2003:665).
Findings state facts; conclusions represent inferences drawn from findings. A writer is
sometimes reluctant to make conclusions and leaves the task to the reader. The
researcher is the best informed about the factors that critically influence his findings
and conclusions (Cooper and Schindler, 2003:665).
In academic research, the recommendations are often further study suggestions that
broaden or test understanding of the subject area. In applied research, the
recommendations will usually be for managerial action, rather than for research
action. The writer of the research report may offer several alternatives with
justifications (Cooper and Schindler, 2003:665).
5.13 Reducing in terv iew subject iv i ty
Awareness of what problems subjectivity presents, should help the interviewer to use
and explore subjectivity during the interview. The challenge, however, comes at the
interpretation stage when the researcher is faced with tape recordings or transcripts
of the interview. The three areas that should be covered are relativity, point of view
and context (Moutton, 2001:130).
5.13.1 Relativity
When people make statements they often make relative judgements and thus
comparisons, either directly or by inference. Comparisons can be seen on two
dimensions - subject and time. When the subject is making a comparison with the
past or future, it is important to understand the meaning they attribute to what they
are describing (Moutton, 2001:131).
UUnniivveerrssiittyy ooff PPrreettoorriiaa eettdd –– VVaann ddeerr MMeerrwwee,, TT ((22000066))
206
5.13.2 Point of view
There are three aspects to point of view that must be considered by the researcher
(Moutton, 2001:131):
• The subject’s perspective, his own perspective or the perspective of another
role, for example a manager.
• The knowledge of the subject used when making the statement.
• The expertise of the subject. The level of knowledge or ignorance that lies
behind a statement plays a part in its interpretation.
5.13.3 Context
When people speak, there is always an implied background or situation even if it not
mentioned specifically. The background is important to understand what is being
said. The researcher should be on the look out for implied comparisons, changes in
point of view and implied contexts as part of good interviewing practice (Moutton,
2001:131).
5.14 Credib i l i ty o f qua l i ta t ive research
The credibility of the qualitative inquiry depends on three distinct, but related inquiry
elements (Patton, 2002:543-544):
• Rigorous methods for doing fieldwork that yield high-quality data that is
systematically analysed with attention to issues of credibility (Patton,
2002:543). Qualitative research depends from the beginning on astute pattern
recognition. The researcher should approach the topic with the approach of
searching for alternative themes, divergent patterns, and rival explanations
which enhance credibility. The mind-set of the researcher should not be
focussed on attempting to disprove the alternatives; rather to look for data that
support alternative explanations (Patton, 2002:543).
• The credibility of the researcher, which is dependent on training, experience,
track record, status, and presentation of self (Patton, 2002:543). Since the
UUnniivveerrssiittyy ooff PPrreettoorriiaa eettdd –– VVaann ddeerr MMeerrwwee,, TT ((22000066))
207
researcher is the instrument in the qualitative inquiry, a qualitative report
should include some information about him, for example, the experience,
training, and perspective the researcher brings to the field; who funded the
research and what arrangements were made with the researcher; how did the
researcher gain access to the study site; what prior knowledge did the
researcher bring to the research topic; what personal connections does the
researcher have to the people, programme, or topic studied (Patton,
2002:566).
• Philosophical belief in the value of qualitative inquiry, that is, a fundamental
appreciation of naturalistic inquiry, qualitative methods, inductive analysis,
purposeful sampling, and holistic thinking (Patton, 2002:543). The use of
qualitative methods can be quite controversial. The controversy stems from
the long-standing debate in science concerning how best to study and
understand the world. How the debate is framed depends on the perspectives
that people bring to it and the language available to them to talk about it
(Patton, 2002:571). Subjective data imply opinion rather than fact, intuition
rather than logic, impression rather than confirmation Even so, the ways in
which measures are constructed in psychological tests, questionnaires, cost-
benefit indicators, and routine information management systems are no less
open to the intrusion of biases than making observations in the field or asking
questions in interviews. Numbers do not protect against bias; they merely
disguise it. All statistical data is based on someone’s definition of what to
measure and how to measure it (Patton, 2002:574).
5.15 L imi ta t ions of the research
People viewing qualitative research findings through different paradigmatic lenses
will react differently just as researchers and evaluators vary in how they think about
what they do when the word is studied (Patton, 2002:543).
The research has had the following limitations which need to be mentioned:
• Limited experience: The researcher has had limited experience in the subject
of aligning the supply and demand within a supply chain. The previous work
UUnniivveerrssiittyy ooff PPrreettoorriiaa eettdd –– VVaann ddeerr MMeerrwwee,, TT ((22000066))
208
experience includes some parts of the demand and supply side of the supply
chain, but no extensive experience of aligning the supply and demand within
the supply chain.
• Limited access to other companies: Due to the sensitive nature of the
research and information, the research was limited to academic research, as
well as reports published by Kraft Foods for internal and external use.
• The research was limited to Kraft Foods South Africa. The principles of the
demand and supply alignment could be applied to other Kraft units, the fast
moving consumer goods industry, as well as other industries battling with the
challenges of supply and demand alignment.
• No previous research on the supply and demand alignment within Kraft Foods
South Africa has ever been done. Secondary research material concerning
Kraft Foods South Africa was therefore very limited. Much of the secondary
research material is also not available to the public, because of confidentiality
and the sensitivity of the information.
Despite the limitations of the research, it was completed on time and will add
valuable knowledge to the understanding of supply and demand alignment within
a supply chain.
5.16 Conclus ion
This chapter describes the study of the research methods that provide a researcher
with the knowledge and skills to solve the problems and meet the challenges of a
fast-paced decision-making environment (Cooper and Schindler 2003:5).
This research study was a descriptive research study as the researcher attempted to
describe or define a research subject, by creating a profile of a group of problems,
people or events (Cooper, 2003:10). During the interrogation or communication part
of the research study, the researcher questioned the subjects and collected their
responses by personal and telephonic interviews (Cooper and Schindler, 2003:6).
UUnniivveerrssiittyy ooff PPrreettoorriiaa eettdd –– VVaann ddeerr MMeerrwwee,, TT ((22000066))
209
The research design was an ex post facto design, because the researcher had no
control over the variables and simply reported what has happened or what is
happening within Kraft Foods South Africa (Cooper and Schindler, 2003:149). All
responses to all questions were carefully interpreted (Cooper and Schindler,
2003:150). The research can also be regarded as a cross- sectional study as it
represents a snapshot of the alignment of the supply and demand within Kraft Foods
South Africa’s supply chain.
The case study of Kraft Foods South Africa’s supply and demand alignment placed
more emphasis on a full contextual analysis of fewer events of conditions and other
interrelations (Cooper and Schindler, 2003:150). The research design was done
under actual environmental conditions, called field conditions, for example, up-to-
date supply chain results were reported and interviews were done with all the parties
that were involved in Kraft Foods South Africa’s daily operations (Cooper and
Schindler, 2003:150).
The first step in the exploratory study was an examination of the secondary literature.
The aim of the secondary research was to use previously published studies or
information about supply and demand alignment within a supply chain (Cooper,
2003:152-153). As the researcher collected the information about the topic, the
sources were evaluated and selected based on the following five factors: purpose,
scope, authority, audience, format (Cooper, 2003:284). The researcher tried to
ensure that the literature review was exhaustive in its coverage; fair in its treatment of
others; that the research material is topical and not dated; and that the literature is
well- organised (Moutton, 2001:90-91).
While published data is a valuable resource, no more than a fraction of the existing
knowledge in a field is put into writing. A significant portion of what is known
concerning a topic, while in writing, may be proprietary to a given organisation and
thus unavailable to an outside researcher. Also internal data archives are rarely well-
organised, making secondary sources even when known, difficult to locate (Cooper,
2003:153).
UUnniivveerrssiittyy ooff PPrreettoorriiaa eettdd –– VVaann ddeerr MMeerrwwee,, TT ((22000066))
210
Experience surveys or structured interviews were therefore conducted with key
people within Kraft Foods South Africa’s supply chain to determine the cause and
solutions of supply and demand alignment within the supply chain (Cooper and
Schindler, 2003:362). During the interviews various open and closed questions were
asked to determine the answers for the research study (Riley 2000: 95).
Researchers are often tempted to broaden the basis of induction by including
personal experience and their interpretations; however, the researcher limited the
conclusions to those for which the data provided an adequate basis (Cooper and
Schindler, 2003:17).
The research study was completed even though, the following limitations were
experienced: the researcher had limited experience in the subject of aligning the
supply and demand within a supply chain, as well as previous research work; limited
access to other companies due to the sensitive nature of the research and
information; the research was limited to Kraft Foods South Africa; and finally no
previous research has been done on the alignment of supply and demand within
Kraft Foods South Africa’s supply chain.
UUnniivveerrssiittyy ooff PPrreettoorriiaa eettdd –– VVaann ddeerr MMeerrwwee,, TT ((22000066))
211
CHAPTER 6: RESEARCH FINDINGS
6 .1 In t roduct ion
While published data is a valuable resource, no more than a fraction of the existing
knowledge in a field is put into writing. The structured in-depth interviews will
essentially be experience surveys. A significant portion of what is known on a topic
may be proprietary to a given organisation and thus unavailable to an outside
researcher (Cooper and Schindler, 2003: 153). The aim of the structured in-depth
interviews was to seek information from people experienced in the area of the
research study, tapping into their collective memories and experience (Cooper and
Schindler, 2003: 154). The structured in-depth interviews were conducted with key
people within Kraft Foods South Africa that were involved in the alignment of supply
and demand on a daily basis. The interviews, which were split into demand and
supply management, were conducted with the following people:
Demand management:
• Nigel Parsons, Sales Director, Kraft Foods South Africa. Personal interview.
• Barry Iliffe, Retail Sales Manager, Kraft Foods South Africa. Personal
interview.
• Brian van Blerk, Wholesale Sales Manager, Kraft Foods South Africa.
Personal interview.
• Alan Devraj, National Sales Manager, Kraft Foods South Africa. Personal
interview. Alan Devraj is responsible for the smaller customer accounts not
covered by the national key account managers.
• Marianne Schofield, National Key Account Manager – Pick ‘n Pay, Kraft Foods
South Africa. Telephonic interview.
• Louise Grove, National Key Account Manager – Shoprite Checkers, Kraft
Foods South Africa. Telephonic interview.
• Don Masinga, National Key Account Manager – Metro, Kraft Foods South
Africa. Personal interview.
UUnniivveerrssiittyy ooff PPrreettoorriiaa eettdd –– VVaann ddeerr MMeerrwwee,, TT ((22000066))
212
• Glenn Gess, National Key Account Manager – Metcash, Kraft Foods South
Africa. Personal interview.
• Jaco Erasmus, National Key Account Manager – Spar. Kraft Foods South
Africa. Personal interview.
• Abrie de Swardt, Director Customer Services, Logistics and Procurement.
Kraft Foods South Africa. Personal interview.
• Dave Templeton, Logistics Operations Manager. Kraft Foods South Africa.
Personal interview.
• Thinusha Naicker, Customer Services Manager. Kraft Foods South Africa.
Personal interview.
• Sjanie Horne, Demand Planner. Kraft Foods South Africa. Personal interview.
• Sina Molelekoa, Demand Planner. Kraft Foods South Africa. Personal
interview.
• Clive Sandwick, Marketing Director. Kraft Foods South Africa. Personal
interview.
• Allan Strydom, Marketing Manager – Beverages and Other Grocery. Kraft
Foods South Africa. Personal interview.
• Angela Brokke, Marketing Manager – Biscuits and Confectionery. Kraft Foods
South Africa. Personal interview.
Supply management
• Thys Redelinghuys, Plant Director, Kraft Foods South Africa. Telephonic
interview.
• Oliver Moses, Production Planning Manager, Kraft Foods South Africa.
Telephonic interview.
• Zandi Kubheka, Master Production Scheduler, Kraft Foods South Africa.
Telephonic interview.
• Ron Greenslade, Manufacturing Maintenance Manager Biscuits, Kraft Foods
South Africa. Telephonic interview.
• Stefanus van Zyl, Production Manager, Kraft Foods South Africa. Telephonic
interview.
• Johan Herselman, Production Manager, Kraft Foods South Africa. Telephonic
interview.

UUnniivveerrssiittyy ooff PPrreettoorriiaa eettdd –– VVaann ddeerr MMeerrwwee,, TT ((22000066))
213
• Dave Templeton, Logistics Operations Manager. Kraft Foods South Africa.
Personal interview.
• Abrie de Swardt, Director Customer Services, Logistics and Procurement.
Kraft Foods South Africa. Personal interview.
• Audrius Sarulis, Procurement Manager. Kraft Foods South Africa. Telephonic
interview.
• Mark Gardiner, Raw Material Purchasing Manager. Kraft Foods South Africa.
Telephonic interview.
• Preggie Chetty, Packaging Purchasing Manager. Kraft Foods South Africa.
Telephonic interview.
The personal structured interviews were conducted in the meeting rooms of Kraft
Foods South Africa’s new office at Woodmead, Johannesburg. The researcher, as
well as the sales and supply chain departments, are based at the Woodmead offices
which allowed for personal interviews. The supply management staff members are
based at the Tunney factory in Elandsfontein, Johannesburg, which is about half an
hour’s drive away from the administrative head office at Woodmead. Not all the
supply management staff members could be interviewed at the same time.
Telephonic interviews were thus conducted with most of the supply management
staff members due to the distance between the Woodmead and Tunney offices, and
to cater for the different times people were available for interviews. The interviews
were conducted between December 2004 and May 2005. Some of the interviews
were conducted during and after working hours depending on the availability of the
various people interviewed. The interviews, which were planned for November 2004,
were postponed to December 2004 as a result of a visit from Kraft Foods’ Regional
Director in November 2004.
At the beginning of December 2004, a research document was distributed to the key
people involved in the demand and supply alignment of Kraft Foods South Africa.
The research document contained an introduction, aim of the research and a detailed
list of the questions. The document explained the background and purpose of the
UUnniivveerrssiittyy ooff PPrreettoorriiaa eettdd –– VVaann ddeerr MMeerrwwee,, TT ((22000066))
214
research. The list of questions allowed people to prepare for the interviews. The
responses from the people who were available for the interviews were very positive.
The interviews were split into the two main areas of the research, demand and
supply management, and were conducted with people that were involved in each
area. Some of the questions were interrelated and the interviews were concluded
with an overview and status of the current supply and demand alignment within Kraft
Foods South Africa. Printed copies of the interview questionnaire were provided. The
researcher asked the questions and the responses were immediately recorded on
paper. When necessary, clarifying questions were added to ensure that the
responses were understood. In some cases, the responses were repeated to ensure
that they were recorded accurately. In some cases, a general example was provided
to evoke additional responses, for example, supply management staff members were
asked if they believed local raw materials and packaging would speed up the
response of the factory to demand changes.
6.2 Outcome of s t ructured in terv iews
The costs of a mismatch between supply and demand, measured as the combination
of inventory carrying costs, markdown costs and stockout costs, are growing in many
industries (Gattorna, 1998:172). The benefits of reducing the supply-demand
mismatch are enormous. An improvement in the alignment between supply and
demand can lead to a significant increase in profits, better customer service and
therefore additional sales (Gattorna, 1998:172).
The aims of the structured interviews were to determine the following:
• To identify the causes of the misalignment between the supply and
demand within Kraft Foods South Africa’s supply chain.
• To identify potential solutions that could improve the alignment between
the supply and demand within Kraft Foods South Africa’s supply chain.
UUnniivveerrssiittyy ooff PPrreettoorriiaa eettdd –– VVaann ddeerr MMeerrwwee,, TT ((22000066))
215
The interviews were split between demand and supply management, in order to
focus on the interviewee’s area of expertise and to identify individually and overall
what the solutions to improving the alignment between supply and demand are.
6.2.1 Demand management
6.2 .1 .1 Focus o f demand fo recas t
Kraft Foods South Africa is currently trying to forecast the factory shipment data (Van
Blerk, 2005), (Erasmus, 2004), (Gess, 2004), (Devraj, 2004), (Parsons, 2004)
(Templeton, 2004) (Sandwick, 2005) (Molelekoa, 2005), (Iliffe, 2005), (Masinga,
2005), (Grove, 2005), Schofield, 2005), (Horne, 2005), (Naicker, 2005), (Strydom,
2005) (Brokke, 2005). The factory shipment data is the actual volume shipped from
Kraft Foods to the customers, for example, Checkers distribution centres or individual
customer stores.
Other alternative demand data, which is available and should be considered, are for
example:
• Van Blerk (2005) indicated that point- of- sales data is already available for the
top-end retail channels like Pick ‘n Pay, Shoprite and Spar. According to van
Blerk (2005), the wholesale channel normally does not sell its point- of- sales
data; however, the information can be obtained through negotiation and at a
cost.
• Van Blerk (2005) also indicated that consumer sales trends are also published
by market research companies like AC Nielsen, who use consumer-scanning
data obtained from top-end retail and wholesale sales channels.
• The aim of the demand forecasting, is to determine the true demand
(Erasmus, 2004). In order to determine the future demand, Erasmus (2004)
suggested that the following adjustments be made: increasing Kraft’s historical
actual sales with a reasonable percentage of lost sales; future growth
expectations from the customer accounts and /or product category; sales
volume expectations from planned and confirmed activities such as in-store
UUnniivveerrssiittyy ooff PPrreettoorriiaa eettdd –– VVaann ddeerr MMeerrwwee,, TT ((22000066))
216
activities; consumer consumption trends and not chain fill. Erasmus (2004)
warned that the customer sales rate patterns for the various demand streams
should be considered, for example, smaller Spar stores would normally order
every week, while Spar distribution centres would place an order every 4 to 6
weeks.
• Erasmus (2004) pointed out that the demand data for the all the other demand
streams are available for Spar, for example customer supplied forecasts,
point- of- sales data, customer warehouse movement data, customer order
data and factory shipment data. One simply has to request the data.
• Gess (2004) indicated that point- of- sales data can be obtained from
Massmart’s SAP system. There is no additional cost involved. In the case of
Massmart, we simply have to request the data. Gess (2004) pointed out that
initially Massmart may have concerns about sharing confidential information,
and they may also fear that Kraft will contact their biggest customers directly.
• Devraj (2004) also indicated that point- of- sales data is available from our
major customers, for example EPOS – Pick ‘n Pay, B2B – Shoprite, E3 –
Metro, EDI –Spar.
• Templeton (2004) raised the concern that the forecast unit of measure should
change from tons to units. The factory and our customers both use unit
volumes and not ton volumes. Checkers Shoprite can only supply customer-
supplied forecasts for its distribution centres.
• Brokke (2005) warned that the specific customer profile should be considered
when using customer supplied forecast. Forecasts submitted by store owners,
for example Spar franchises, are more accurate than corporate stores, for
example Pick ‘n Pay stores where managers and not the owners submit the
forecasts.
Customer supplied forecasts have been obtained in the past, for example baking
powder, jellies’ and desserts’ forecasts for October to December 2004 (Van Blerk
2005), (Erasmus, 2004), (Gess, 2004), (Devraj, 2004), (Parsons, 2004), (Templeton,
2004). Kraft’s major customers, however, do not supply the information on a regular
basis, because of Kraft’s low service levels.
UUnniivveerrssiittyy ooff PPrreettoorriiaa eettdd –– VVaann ddeerr MMeerrwwee,, TT ((22000066))
217
In some cases, the business used a combination of the various demand data
streams during certain periods of the year (De Swardt, 2005). Customer supplied
forecasts, for example, were obtained from Checkers Shoprite for Easter 2005, while
a combination of customer order data and factory shipment data was used for items
with low service levels in order to determine the historical baseline data.
Iliffe (2005), Strydom (2005) and Brokke (2005) mentioned that the business should
move from determining what the customers want to what the consumers want. Iliffe
(2005) added that more information is required to understand the various demand
streams, for example, who is the real shopper of the products, who is the real
consumer, how often does the shopper buy – daily, weekly, monthly. One of the
implications of focussing on factory shipment data is incorrect stock levels (Brokke,
2005). Too high stock levels result in stock freshness issues and too low stock levels
result in lost sales. The demand distortions created by customer push strategies can
be reduced by focussing on true consumer pull (Brokke, 2005). De Swardt (2005)
also added that Kraft Foods Inc. was already considering using more actual customer
and consumer demand data in future, for example, some trade channels in Europe
and the United States have started pilot projects on vendor management inventory
and radio frequency identification.
6.2 .1 .2 Supp ly cha in t r igger : o rder ve rsus fo recas t
The trigger for Kraft Foods South Africa’s supply chain is currently the forecast (Van
Blerk, 2005), (Erasmus, 2004), (Gess, 2004), (Devraj, 2004), (Parsons, 2004),
(Templeton, 2004), (Sandwick, 2005), (Molelekoa, 2005), (Iliffe, 2005), (Masinga,
2005), (Grove, 2005), Schofield, 2005), (Horne, 2005), (Naicker, 2005), (Strydom,
2005) (Brokke, 2005) (De Swardt, 2005). The participants also mentioned that the
ideal situation would be that the supply chain should be triggered with a customer
order in the future. In a made-to-order situation, however, the supply chain can be
triggered by a customer order (Naicker, 2005). De Swardt (2005) mentioned that the
business should move gradually from customer forecasts to customer orders.
However, the business is still very far from realizing this and this will also require
significant improvements in the collaboration with key customers.
UUnniivveerrssiittyy ooff PPrreettoorriiaa eettdd –– VVaann ddeerr MMeerrwwee,, TT ((22000066))
218
The major reasons for using the forecast as the trigger for the supply chain are:
• Kraft’s Supply chain can currently not react to a customer’s order
requirements, such as nominated delivery dates and 48 to 72 hour delivery
windows. The result is that the forecast is used to provide the supply chain
with sufficient time to react to customer orders (Van Blerk, 2005) (Erasmus,
2004).
• Some of the systems used by our customers such as Massmart, only allow for
a maximum of one-week delivery. Where orders are not executed, they are
removed from the system. Where deliveries can take place after one-week
delivery lead-time, new orders have to be confirmed by the customers (Gess
2004).
6.2 .1 .3 Invo lvement o f cus tomer and supp l ie rs in p lann ing
Kraft’s customers have a limited involvement in the planning. Suppliers are not
involved at all at this stage (Van Blerk, 2005), (Erasmus, 2004), (Gess, 2004),
(Devraj, 2004), (Parsons, 2004) (Templeton, 2004) (Sandwick, 2005) (Molelekoa,
2005), (Iliffe, 2005), (Masinga, 2005), (Grove, 2005), Schofield, 2005), (Horne, 2005),
(Naicker, 2005), (Strydom, 2005) (Brokke, 2005).
Van Blerk (2005) and Iliffe (2005) reflected on some initiatives to obtain customer
supplied forecasts from Shoprite Checkers and Metro regarding baking powder,
jellies and desserts for October to December 2004. Iliffe (2005) indicated that the
customers supplied forecasts were currently limited to the distribution centre
customers and the high peak seasons of Easter and Christmas. Van Blerk (2005)
added that customers were willing to share forecasts in order to secure orders and
force allocated stock. Customer business plans are jointly compiled by Kraft and its
key customers. The customer business plans cover topics such as strategic intent,
SWOT analysis, 3-year historical trend, activity priorities, and objectives per product
categories, action plans per product categories, concerns, barriers, promotional grids
and profit and loss statements.
UUnniivveerrssiittyy ooff PPrreettoorriiaa eettdd –– VVaann ddeerr MMeerrwwee,, TT ((22000066))
219
Customers have very little involvement at the moment. Kraft’s low customer service
levels have had an impact on the company’s credibility with the trade. The low
service levels have resulted in limited support from the customers. Some of the
customers are willing; however, Kraft’s commitment has been questioned (Erasmus
(2004). Customer supplied forecasts data can be obtained, however the historical
sales pattern is distorted due to low service level to fulfil customer orders (Masinga,
2005). Brokke (2005) also mentioned that the other complication in the past has
been that Kraft is not a product category leader as is the case in other markets
around the world. Customers, for example, have not accepted category management
planograms so easily in the past because they regarded Kraft less of a priority in
certain categories, for example biscuits.
Gess (2004) suggested that we involve our customers more and more. He also
suggested using exclusive imported lines, such as chocolates, to obtain commitment
from the trade. The exclusivity would act as an incentive for the selected trade
partners to take part in the planning. The other benefit of exclusive distribution is that
price becomes less of an issue during negotiations. Standard items, that are widely
distributed, are regarded as commodities.
Templeton (2004) indicated that some of our customers are actually part of the
planning processes. Made-to-order products forecasts are provided by Patleys for
Cheese and Lufil provide forecasts for Spoonables like Miracle Whip.
De Swardt (2005) warned that the business should implement the basics first before
considering involving customers and suppliers in the planning and execution. Some
collaboration with customers has taken place, for example Shoprite Checkers provided
Kraft with their Easter 2005 forecast, while quarterly performance reviews between
Spar and Kraft are planned for later in 2005. Some collaboration with suppliers has
also taken place, for example, lower minimum production minimum order quantities
were negotiated with the supplier of Beechies chewing gum which resulted in an
improvement in working capital. The suggested supply orders for a longer forecast
period were also shared with some suppliers to reduce the “bull whip effect”, for
example the required supply orders for Miracle Whip mayonnaise have been shared
with the supplier Mullins as from January 2005, which allowed the supplier to plan their
UUnniivveerrssiittyy ooff PPrreettoorriiaa eettdd –– VVaann ddeerr MMeerrwwee,, TT ((22000066))
220
procurement and production in anticipation of an increase or reduction in forecast.
Measurement should be part of all the planning and execution activities with customers
and suppliers, for example customer service levels per stock keeping unit per store
and sales forecast accuracy per item should be reviewed with customers.
6 .2 .1 .4 Causes o f demand var iab i l i t y
The demand variability is caused mainly by non-supply or over-supply to our
customers (Van Blerk, 2005), (Erasmus, 2004), (Gess, 2004), (Devraj, 2004),
(Parsons, 2004) (Templeton, 2004), (Sandwick, 2005), (Molelekoa, 2005), (Iliffe,
2005), (Masinga, 2005), (Grove, 2005), Schofield, 2005), (Horne, 2005), (Naicker,
2005), (Strydom, 2005) (Brokke, 2005) (De Swardt, 2005). Erasmus (2004) indicated
that the non-supply is caused by Kraft’s historical inability to supply against demand.
The over-supply, on the other hand, is caused by push sales strategies according to
Erasmus (2004). (Erasmus, 2004) and Sandwick (2005) indicated that reactive sales
target gap closure plans have been initiated to achieve overall sales volume targets.
Erasmus (2004), Naicker (2005) and Strydom (2005) added that the reactive sales
target gap closures, in most cases, do not reflect true customer and consumer
demand, for example, high volumes are sold to customers just before price increases
are implemented with the trade. One of the implications of push sales strategies is
that customers will adapt their buying pattern based on their expectations of a repeat
of promotions, for example, customers will delay their buying in anticipation of a
potential annual price increase by Kraft. Horne (2005) and Strydom (2005) added
that the inconsistent supply from the local Tunney plant has also affected the
demand variability pattern.
Price increases should not be implemented across all sales channels at the same
time. One option, for example, is to implement a price increase in wholesale first and
then later in retail. Wholesalers may react and buy 4 to 8 weeks of stock, while retail
buys 2 to 4 weeks of stock. The gradual implementation of price increases across all
sales channels will ensure that the price increase and subsequent demand variability
is spread more smoothly across all accounts (Gess, 2004).
UUnniivveerrssiittyy ooff PPrreettoorriiaa eettdd –– VVaann ddeerr MMeerrwwee,, TT ((22000066))
221
Devraj (2004) indicated that economies of scale and payment terms also play a role
in demand variability. Customers buy in bulk in line with their requirements for the
next couple of weeks. Dedicated delivery dates also play a role in bulk buying as
deliveries to customers do not take place on a daily basis. Various deliveries are
combined to meet the required delivery dates. The customer payment terms also
alter customers’ normal buying patterns. Customers know that Kraft’s financial
month-end is the middle of the calendar month, for example, Kraft December 2004
month-end was on 15 December 2004. Customers delay orders until the start of a
new Kraft financial month-end, in order to benefit from extended trade terms.
Customers, for example, delayed orders until 16 December 2004, the start of the
Kraft January 2005 month, to take advantage of an extra month’s credit terms.
Demand variability is also caused by the lack of detail provided for future promotions.
The promotional grids only indicate the timings of future promotions. They do not
indicate the volume expectations. Demand expectations are updated too close to the
implementation of promotions which puts a lot of pressure on supply to react to the
demand expectations. The risk is that money has been invested, in the form of
advertising and promotional stands, while the business is unable to provide sufficient
supply. The ongoing and proactive alignment of the demand and supply is crucial
especially for long lead-time items. The demand forecast for the Sensations
Chocolate range, for example, was reviewed and increased 4 weeks before the trade
launch, while the normal supply lead time is 8 to 10 weeks from the date of placing
purchase orders at overseas Kraft plants to take receipt of the product in South
Africa. This mismatch of demand and supply resulted in lost sales (Templeton, 2004).
In other cases, the forecasts for new product launches were too low. The sales team
tried rather to over deliver on the forecast due to the sales incentive plan linked to
new product launches. The sales team has been penalised in the past for not
achieving the sales volume forecasts (Sandwick, 2005).
The demand variability has been affected by the change in pack size configuration,
for example Beechies, Manhattan Pre-Packs, Super C Rolls and Crackermates
biscuits. During the early stages of implementing the pack size reduction of Super C
UUnniivveerrssiittyy ooff PPrreettoorriiaa eettdd –– VVaann ddeerr MMeerrwwee,, TT ((22000066))
222
Rolls, the sales volumes increased in units, however the volumes decreased in tons
(Brokke, 2005).
The combination of the various factors to drive demand is also distorting demand
variability, for example price increases and promotions are done at the same time, it
is very difficult to determine the impact of the various strategies (Brokke, 2005),
(Strydom, 2005). One option to determine the impact of the various factors is to
implement them at various intervals and not at the same time. The cell phone
industry has used the strategy very well, for example, various special offers are
provided at different times. If customers do react to certain specials, the impact can
be determined. The airline industry and retail sector have implemented customer
loyalty programmes which allow them to determine the impact of various special
offers, for example the South African Airways Voyager Miles and Clicks loyalty card
programmes (Brokke, 2005).
Other factors outside Kraft could also affect the demand variability, for example,
competitive activity and seasonality. Nestle South Africa, for example, could not
process all the customer orders during the first few months of 2005 due to the
implementation of SAP. The out-of-stock situation at Nestle increased the demand
for Kraft competitive products like mayonnaise and coffee. The out-of-stock situation
with Maynard, a confectionery brand of Beacon, also increased the demand for
Kraft’s Manhattan confectionery range (Molelekoa, 2005), (Brokke, 2005). The
demand variability for some Kraft products is normally very seasonal, for example
more baking powder is sold during the Easter and Christmas periods (Molelekoa,
2005). Iliffe (2005) added that some of the retailers have also started importing cheap
biscuits. Even negotiations with the trade could result in some variability in the
demand, for example, a disagreement with the trade could result in the delisting of
some of Kraft’s products. New consumer trends towards food with low levels of
carbohydrates and saturated fats have also affected the demand patterns of
products. Other trends in the market place in South Africa include the increase in the
aspiring new middle class, for example consumers switched from Minora to Gillette
shaving blades and they started moving from spazas to shopping malls. Horne
(2005) added that the demand variability is also normally higher before and during
public holidays. Brokke (2005) warned that major changes in macro economic
UUnniivveerrssiittyy ooff PPrreettoorriiaa eettdd –– VVaann ddeerr MMeerrwwee,, TT ((22000066))
223
conditions could also affect the demand variability of products, for example, if petrol
prices increase, consumers will have less money available for their baskets. The
impact of macro economic factors is normally gradual.
De Swardt (2005) added that there are other external factors that also have an
impact on the demand variability. The business should concentrate on the factors
within its control that cause demand variability. Kraft Foods, for example, cannot plan
for the timing and impact of potential competitive price promotions. The power of
retailers on the demand variability should also be considered, for example, jab
orders, retailer birthday orders and special orders could distort the demand pattern of
products.
Parsons (2004) and Erasmus (2004) warned that the end result of all the demand
variability created by all the promotional activities and pricing is that Kraft does not
have a good understanding of its baseline business. The incremental event volumes
and baseline volumes form part of the aggregated sales history. The lack of
understanding of historical baseline demand volumes makes it very difficult to
forecast and commit to future demand volumes, for example, if historical price
promotions are not repeated, demand forecasts will not be achieved. De Swardt
(2005) also mentioned that the inability of the business to forecast might result in
further push sales strategies, for example selling short dated stock, which might
distort the demand pattern even further.
The major causes of demand variability are caused by Kraft Foods South Africa itself,
although seasonality and other external factors play a role (Van Blerk, 2005),
(Erasmus, 2004), (Gess, 2004), (Devraj, 2004), (Parsons, 2004) (Templeton, 2004)
(Sandwick, 2005), (Molelekoa, 2005), (Iliffe, 2005), (Masinga, 2005), (Grove, 2005),
Schofield, 2005), (Horne, 2005), (Naicker, 2005), (Strydom, 2005) (Brokke, 2005).
6 .2 .1 .5 Demand fo recas t ing versus demand management
Kraft Foods is only forecasting demand at the moment. All parties indicated that
demand should rather be managed than forecasted in future (Van Blerk, 2005),
UUnniivveerrssiittyy ooff PPrreettoorriiaa eettdd –– VVaann ddeerr MMeerrwwee,, TT ((22000066))
224
(Erasmus, 2004) (Gess, 2004) (Devraj, 2004) (Parsons, 2004) (Templeton, 2004)
(Sandwick, 2005) (Molelekoa, 2005) (Iliffe, 2005) (Masinga, 2005) (Grove, 2005),
Schofield, 2005) (Horne, 2005) (Naicker, 2005) (Strydom, 2005) (Brokke, 2005). De
Swardt (2005) warned that the business needed a combination of forecasting and
managing demand. Demand forecasting allowed the business to produce in
anticipation of future demand. The business had to manage the demand due to the
low forecasting accuracy.
According to Erasmus (2004), Kraft requires the following to manage demand:
• A good understanding of the historical baseline volumes. Kraft must determine
what the normal sales volumes would have been without any events such as
supply shortages or promotional activity.
• A good understanding of the impact of activities on historical demand, for
example, the impact of price increases.
• A good understanding of the expectations of planned activities, for example,
volume expectations of planned product launches.
The above- mentioned should result in a better understanding of the historical and
future demand with the aim of creating and managing a smoother demand line
(Erasmus, 2004),
The business has tried in some cases to influence and manage demand. The internal
focus has moved from high volume to high margin product groups, like Oreo, Royal
baking powder and Manhattan Gells. The focus on high margin product categories
has also resulted in a change in the sales mix in the trade which has ultimately
resulted in a change in the consumer baskets (Iliffe, 2005). All promotions in the
business have been aligned to the high margin product groups (Masinga, 2005)
(Schofield, 2005). Where the business experienced out-of-stock situations, it tried to
move customer orders to those items where the business had enough stock, for
example, Kronung 100g was promoted during Winter 2005, while the business had
no Kronung 200g stock (Horne, 2005).
Moving from forecasting to managing demand also has certain challenges. Gess
(2004) warned that most fast moving consumer goods companies, even competitors
UUnniivveerrssiittyy ooff PPrreettoorriiaa eettdd –– VVaann ddeerr MMeerrwwee,, TT ((22000066))
225
like Nestle, are trying to forecast and not manage demand. Most companies struggle
to forecast demand and have not considered managing demand (Gess, 2004).
Devraj (2004) pointed out that Kraft Foods South Africa’s brands are not yet strong
enough or well-enough established to move to a situation where demand is
managed. Kraft Foods South Africa, for example, will not be able to implement a
price increase across the wholesale and retail trade at different times. The wholesale
and retail trade channels monitor the retail selling prices across all channels on a
weekly basis based on data supplied by Adcheck. Major differences in pricing will
thus be very difficult to negotiate and implement as the buyers from the wholesale
and retail trade channels monitor the pricing variances on a weekly basis. Van Blerk
(2005) adds that Kraft Foods South Africa is trying to maintain one window to the
trade, which complicates the different strategies across the wholesale and retail
trade. Some of the bigger customer groups also have wholesale and retail trade
channels. Negotiating and implementing a different pricing strategy across the
wholesale and retail trade with the same customer group would be a challenge.
Naicker (2005) warned that the business should always be prepared to react to
demand changes. Brokke (2005) mentioned that Kraft Foods South Africa should
manage the demand when the business has high out-of-stock. The business should
thus rather manage the supply and related demand issues, rather than simply
focussing on forecasts only. Daily forecasts can be done if the product supply is
consistent and reliable, for example bread sales forecasts are done daily by Albany
Bakeries.
The normal sales budgets should focus on forecasting demand, while planned
customer promotions should aim at managing demand. Planned customer
promotions, for example, could be implemented earlier or later to influence the
customer demand patterns. The requirement of a successful planned promotion is
that it should also be aligned with the supply capabilities of the business, and vice
versa. The trade launch of Oreo Project Iceberg, for example, was delayed in 2004,
which resulted in additional warehousing costs (Templeton, 2004).
UUnniivveerrssiittyy ooff PPrreettoorriiaa eettdd –– VVaann ddeerr MMeerrwwee,, TT ((22000066))
226
6 .2 .1 .6 In fo rmat ion tha t i nc reases fo recas t accuracy
Erasmus (2004) stated that consumer consumption data could improve forecast
accuracy. The data for all the other demand streams, which could be obtained at a
cost, would increase forecast accuracy. The demand streams include customer-
supplied forecasts, point- of- sales data, customer warehouse movement data,
customer order data and factory shipment data. The aim is to get the forecast as
close as possible to the consumer consumption (Erasmus, 2004), (Gess, 2004)
(Devraj, 2004), (Strydom, 2005).
Devraj (2004) warned that Kraft Foods should ensure that the various demand data
differentiate between the promotional period, which is the time when the trade
promotes the stock, and the inventory investment period, which is the time when the
trade buys-in stock. The inventory investment period occurs before the promotional
period. If Kraft only ensures stock availability during the promotional period, the stock
will arrive too late in the trade. The delay in stock availability would result in lost
sales. Molelekoa (2005) added that the cannibalisation of new products should be
quantified.
The following information could increase forecast accuracy:
• A better understanding of base business and trends (Parsons, 2004)
• A better knowledge of promotional volumes from trade (Parsons, 2004).
• A better post- evaluation of promotions (Parsons, 2004).
• Historical sales data should be stated in units and not in tons. Tons is the
standard unit of measure within Kraft, however, customers and the factory
work in units. Where pack size changes are made, the impact in units is a
better reflection of the demand forecast changes, for example, the unit weight
per Super C roll has been decreased. A pack size reduction should result in
lower volume in tons, because customers normally continue to buy the same
amount of selling units (Templeton, 2004).
• The impact of lost sales should be added to the factory shipment data. This
concern was also raised by Erasmus (2004) (Masinga, 2005).
UUnniivveerrssiittyy ooff PPrreettoorriiaa eettdd –– VVaann ddeerr MMeerrwwee,, TT ((22000066))
227
• The Kraft sales team and customers should review their demand expectations
closer to when the promotions occur. The demand review would allow Kraft to
react to any potential demand changes before the start of the promotion
(Templeton, 2004).
• The effect of competitive activity, for example, determines the potential
increase in Kraft’s coffee demand if Nestle experiences out-of-stock
(Molelekoa, 2005).
• Consumer insight information, for example, which consumers use the brands,
and determine the reasons why they switch brands (Iliffe, 2005).
• The impact of the various product life cycles, for example pack size changes
could help when a product achieves maturity (Iliffe, 2005)
• The historical store discount levels and corresponding sales volumes could
explain the change in demand pattern (Masinga, 2005).
• Stock levels and potential stock freshness risks of the various trade partners
could also have an impact on the demand pattern (Masinga, 2005) (Strydom,
2005). Strydom (2005) also suggested that the impact of competitor stock
levels and activity on Kraft’s demand patterns should be analysed and
understood.
• Post-evaluations on promotions can also increase sales forecast accuracy
(Schofield, 2005). Strydom (2005) added that the forward share before and
after major promotional events could indicate the impact of the various
promotions on the demand variability.
• Additional and more in-depth market research in future could also improve
sales forecast accuracy (Schofield, 2005). Brokke (2005) admitted that AC
Nielsen market research is available; however the research only measures
those trade channels where scanned consumer data is available.
• Brokke (2005) suggested that the key account sales managers obtain daily
and weekly customer and consumer sales data in order to determine the
sales-in and sales-out volume. If the consumer sales-out volume is much
higher than the customer sales-in volume, the business could experience lost
sales. If the customer sales-in volume is much higher than the consumer
sales-out volume, the business could stock freshness issues. The concern is
UUnniivveerrssiittyy ooff PPrreettoorriiaa eettdd –– VVaann ddeerr MMeerrwwee,, TT ((22000066))
228
that most of the in-depth sales analysis per store and per account is done by
marketing and not sales.
• The business should also establish plans to react to supply changes (De
Swardt, 2005). A better understanding of the factory dynamics would allow the
business to include more flexibility in the supply plans which should increase
the service levels.
Van Blerk (2005) warned that point- of- sales data could be obtained but at a high
cost, for example, the cost of Pick ‘n Pay consumer sales data was 0.5 % of the
turnover in 2004 and the cost of Engen forecourt sales data was ZAR 200 000 per
annum. Naicker (2005) added that Shoprite charge ZAR 5000 per month for access
to consumer sales data. In other cases, for example, Metro and Spar consumer sales
data can be obtained free of charge (Brokke, 2005) (Masinga, 2005). Van Blerk
(2005) concluded that any company should consider the benefit and costs of
additional demand data.
6 .2 .1 .7 Cos ts and imp l i ca t ions o f m isa l ignment be tween supp ly and demand The misalignment of the supply and demand has resulted in too high or too low stock
levels and poor service levels (Sandwick, 2005), (Molelekoa, 2005), (Iliffe, 2005),
(Masinga, 2005), (Grove, 2005), Schofield, 2005), (Horne, 2005), (Naicker, 2005),
(Strydom, 2005) (Brokke, 2005). Lost sales occurred where the stock levels were too
low, while the business had to deal with stock freshness issues where the stock
levels were too high. Erasmus (2004) was very concerned that the total lost sales for 2004 was more than
ZAR 100 million for Kraft Foods South Africa. The work in capital was also severely
affected by the increase in inventory caused by stock being produced later than
required by customers. The lost sales also affected the potential cash that could have
been collected from customers. The lost sales claim from key customers was above
ZAR 100 000 of which ZAR 40 000 was approved. Kraft was also forced to pay the
Spar group a rebate of 1 % of the turnover, due to the lost sales value. The lost sales
opportunities have also affected Kraft’s credibility and relationship with the trade
UUnniivveerrssiittyy ooff PPrreettoorriiaa eettdd –– VVaann ddeerr MMeerrwwee,, TT ((22000066))
229
(Erasmus, 2004) (Brokke, 2005). The danger and risk were that end users could
have switched to competitive products. Schofield (2005) also warned that some of
the trade investments could be wasted if promotions were not executed properly.
Gess (2004) was forced to approve lost sales claims of ZAR 7000 from the trade.
The company’s credibility lost with the trade could also have an impact on the
commitment from trade on future promotions, for example, Game did not want to
feature any Kraft products in promotional leaflets to avoid a risk of products being out
of stock. One way of creating enthusiasm with the trade is to ensure that Kraft is the
first to market a new product or that the trade is offered exclusivity.
The lost sales of ZAR 100 million was overstated, however, Kraft probably lost about
ZAR 20 million in turnover. The losses associated with promotional claims are
between ZAR 200 000 and 300 000 per annum (Devraj, 2004). Van Blerk (2005) also
confirmed that Kraft was forced to pay for promotions; even though the stock for the
promotions could not be supplied. Van Blerk (2005) and (Masinga, 2005) were also
concerned about the impact on Kraft’s credibility with the trade in the longer term. It is
estimated that it costs about seven times more to win an old customer back (van
Blerk, 2005). Masinga (2005) also added that the lost sales and profit affected Kraft,
as well as the trade partners. Naicker (2005) warned that the future implication of lost
sales should be considered. Where lost sales, for example, continue in trade, the
loyalty of a customer and consumer towards a company’s brand will decrease which
could result in a reduction of allocated shelf space. (Brokke, 2005) also added that
lost sales could also affect Kraft’s ability to negotiate favourable trade terms and
discounts with the retail and wholesale trade. Continuing lost sales may also result in
a delay in receiving payment from its customers affecting the cash flow of the
business.
Kraft wrote off ZAR 400 000 worth of inventory to the trade in 2004. The few
examples of inventory written off, include the Oreo Hulk promotion stock that was
written off after the promotion; Lecol 2 litre orange was written off after sales
decreased their trade discounts; and biscuits, which have a shelf- life of 6 months
and which are produced in large quantities because of the minimum batch sizes,
were written off because the trade did not accept products with less than 4 months to
UUnniivveerrssiittyy ooff PPrreettoorriiaa eettdd –– VVaann ddeerr MMeerrwwee,, TT ((22000066))
230
the date of expiry. Kraft was also forced to carry about 30 % of excess inventory at a
cost of ZAR 3.6 million in 2004 (Templeton, 2004).
Iliffe (2005) warned that the misalignment between the supply and demand also
affected the supply side of the business. The factory was sometimes required to
arrange overtime for its labour force, while in other cases no labour or production
was required. The aim should be to have more consistent and stable production.
The misalignment of supply and demand also affected the distribution of products.
Emergency transportation was used for urgent customer orders, however in other
cases trucks returned empty from delivery routes (Iliffe, 2005) (Brokke, 2005)
(Strydom, 2005). Schofield (2005) and Horne (2005) also mentioned the impact on
inbound transportation and replenishment, for example, Tang powdered beverage
stock had to be flown in at a huge cost from Morocco to fulfil customer orders due to
higher than expected sales which depleted safety stock levels. The higher variable
product costs could result in higher customer prices which could ultimately result in
lower sales volumes (Brokke, 2005).
6 .2 .1 .8 A l ignment o f depar tmenta l ob jec t i ves and incen t i ves
According to Erasmus (2004), all departments do not have the same objectives and
incentives. All departments need to align themselves with the overall budget,
objectives and incentives. The conflict of interests currently prevents departments
from being aligned. The sales department, for example, is interested in higher service
levels and quicker response to demand changes. The factory, on the other hand, is
more interested in higher volumes and longer production runs. The sales and
marketing department also do not share common objectives. Marketing, for example,
does not discuss new product developments with sales. The result is that timings of
launches are not met, while the rationale for product introductions is not well
developed and understood. Additional SKUs have to be added for the sake of growth
without proper rationale.
Gess (2004) is under the impression that the factory has no sense of urgency.
Marketing also does not agree with their action plans and strategies with sales.
UUnniivveerrssiittyy ooff PPrreettoorriiaa eettdd –– VVaann ddeerr MMeerrwwee,, TT ((22000066))
231
Marketing, for example, planned big promotions for Oreo Shrek in 2004 in the retail
trade, without considering the needs of the wholesale channel. Some of the pack
sizes are not suitable for all sales channels. Oreo 22g * 24 pack, for example, works
well in the retail and wholesale trade; however, the wholesale trade prefer Oreo 100
g - 2 * 10 and not 1 *20.
Devraj (2004) also thinks that not all of the departments are aligned. The factory,
which is measured according to overall plant compliance, can make a surplus of
items that can be produced easily while neglecting the production of items actually
needed. Parsons (2004) suggested that Kraft needs collective buy-in from
departments. Van Blerk (2005) suggested that the factory should indicate in advance
if they foresee any supply risks before committing to a production plan which cannot
be delivered.
For performance measures and appraisal purposes, Templeton (2004) thinks that
objectives are aligned. In reality, however, the objectives of the various departments
are not aligned. The factory is not penalised if products are constantly in short
supply. Sales incentive plans result in the sales force committing to numbers the
company wants to hear instead of committing to more realistic numbers. In some
cases, the sales department implement a volume gap closure program, ignoring the
profit contribution and additional complexity for the supply chain to react to the last
minute demand changes. Brokke (2005) also added that the objectives are generally
aligned, but the detailed objectives and incentives were not aligned. The sales
department, for example, agreed on the launch of Toblerone 4.5 kilogram in 2005;
however the sales team did not agree amongst themselves who the exact target
customers and regions would be. The sales department also demonstrated a weak
understanding of the financial implications of a specific item, for example, the
wholesale sales team wanted to decrease the sales price of Tendermints 1 kilogram
in January 2005, while the item achieved a negative margin. When it comes to
detailed plans, the sales team is more focussed on price and volumes, while the
marketing team is focussed on profit margin.
The commitment of the various departments was also not aligned (Masinga, 2005).
In April 2005, the sales and trade marketing team launched a new trade marketing
UUnniivveerrssiittyy ooff PPrreettoorriiaa eettdd –– VVaann ddeerr MMeerrwwee,, TT ((22000066))
232
plan to ensure that Kraft achieved the sales and profit targets. No member of the
marketing team, for example the brand managers, attended the launch and
presentations, however where important sales and marketing meetings and launches
are done, the key players in all departments should attend to ensure that the whole
business is aligned to the same objectives and incentives. Grove (2005) also added
that the marketing team is not under the same pressure as the sales team, to
forecast and achieve the forecast. De Swardt (2005) suggested that sales forecast
accuracy which is included in the performance goals of sales and supply chain
should also be included in the goals of marketing. Sandwick (2005), on the other
hand, mentioned that the sales team provided different trade marketing budgets to
marketing which created financial forecast risks. The sales team, for example,
provided marketing with the commitment that the operating budget for Oreo was
sufficient to support the product for 6 months in the trade; however the sales team
realised later than the budget could only support 2 months of trade marketing
support.
Molelekoa (2005) and Horne (2005) also indicated that not all the objectives and
incentives of all departments are aligned. Molelekoa (2005) indicated that the supply
chain department is measured on sales forecast per stock keeping unit; however the
sales department compile their sales forecast and strategies per product category.
Another objective of the supply chain department is to reduce the amount of items in
the business; however the objective of the marketing department is to introduce more
items. New Tendermints items, for example, were launched in January 2005;
however the Tunney factory did not have enough production capacity for the current
Tendermints range. The supply chain department is also trying to reduce the finished
goods inventory levels; however the factory is trying to increase the stock levels to
achieve more economic production runs. Horne (2005) also added that the sales and
marketing teams are satisfied if they constantly over achieve a forecast; however the
supply chain department had to react to the overselling by replenishing and
deploying additional stock. The sales and marketing departments did not constantly
communicate with each other concerning the updates on forthcoming strategies, for
example in May 2005 the regional sales managers were not aware that the business
had already decided to phase out the Lecol Squeeze ‘n Drink beverage business in
the Western Cape and Port Elizabeth regions by the end of March 2005.
UUnniivveerrssiittyy ooff PPrreettoorriiaa eettdd –– VVaann ddeerr MMeerrwwee,, TT ((22000066))
233
The organisational structure and objectives of some of the departments were not
aligned. Strydom (2005) mentioned that the sales team was structured according to
the sales channel. Each sales team thus sold the same portfolio of products to their
relevant channels and customers. The marketing department, on the other hand, was
aligned per brand. The marketing department was thus forced to deal with various
sales people in order to clarify or follow-up on brand related issues. The sales
incentives plans were also structured according to the Rand value per kilogram which
could be measured on the average product portfolio sold. The marketing department,
on the other hand, is measured according to their specific brand revenue and profit
levels. The marketing department could thus not achieve their targets by changing
the sales mix.
Iliffe (2005) mentioned that some efforts were being made in sales and marketing to
align objectives and incentives. For 2005, for example, the sales and marketing
team agreed on the same list of high margin brands for the promotional calendars
and incentive plans. The sales and marketing departments worked together to
convert the marketing plan into a trade marketing and sales plan. Naicker (2005)
added that the supply chain and sales departments started working together on
projects in 2005 to improve the business, for example, the service level recovery and
invoice accuracy projects.
6.2 .1 .9 F rozen fo recas t
The forecast for the following month is always frozen. The reason for this is that it
provides production with a more stable forecast and subsequently more stable
production (Van Blerk, 2005) (Erasmus, 2004) (Gess, 2004) (Devraj, 2004) (Parsons,
2004) (Templeton, 2004) (Sandwick, 2005), (Molelekoa, 2005), (Iliffe, 2005),
(Masinga, 2005), (Grove, 2005), Schofield, 2005), (Horne, 2005), (Naicker, 2005),
(Strydom, 2005) (Brokke, 2005). Erasmus (2004) and Gess (2004) added that most
branded companies have a frozen forecast for a period of one month. Gess (2004)
and van Blerk (2005) did, however, point out that demand forecast changes should
be the exception, made only if the business is aware of upcoming customers’ orders
UUnniivveerrssiittyy ooff PPrreettoorriiaa eettdd –– VVaann ddeerr MMeerrwwee,, TT ((22000066))
234
which are greater than the current demand forecast, for example, big export orders.
Templeton (2004) indicated that the reasons for the frozen forecast period are the
production constraints, long lead-time of imported items and lead-time from co-
manufacturers and co-packers. The frozen forecast period allows the relevant
sources to react to the original forecast.
Molelekoa (2005) mentioned that the business should move from one month to one
week frozen demand forecast in line with Kraft Foods best practice. Horne (2005)
and De Swardt (2005) added that the business had started considering and reacting
to weekly demand forecast changes. Schofield (2005) warned that the lead time of
the product item should determine the forecast horizon, for example, if the purchase
order lead time is 7 weeks, the forecast horizon should be at least 7 weeks.
6 .2 .1 .10 Supp ly cha in complex i t y
Kraft Foods South Africa’s supply chain is more complex than those of other Kraft
units (Van Blerk, 2005) (Erasmus, 2004) (Gess, 2004) (Devraj, 2004) (Parsons
(2004) (Templeton, 2004) (Sandwick, 2005), (Molelekoa, 2005), (Iliffe, 2005),
(Masinga, 2005), (Grove, 2005), Schofield, 2005), (Horne, 2005), (Naicker, 2005),
(Strydom, 2005) (Brokke, 2005) (De Swardt, 2005).
Erasmus (2004) supplies the following reasons:
• More delivery points. Kraft Foods South Africa have about 3500 delivery
points, while most Kraft units in Europe only service a few hundred. De Swardt
(2005) added that current customer base is quite complex, for example, 1200
of the 3500 customers only account for 4 % of the total volume and 80 % of
the turnover is done through five powerful trade customers.
• Various routes to markets, sometimes even for the same customer. Kraft
Foods have to deal with various routes to markets, while other Kraft units have
a small and limited variety of routes to their markets. In South Africa, for
example, customer orders to Metro, Pick ‘n Pay, Shoprite and Spar could be
shipped via distribution centres or directly to the various stores.
UUnniivveerrssiittyy ooff PPrreettoorriiaa eettdd –– VVaann ddeerr MMeerrwwee,, TT ((22000066))
235
• Kraft Foods South Africa covers a bigger geographical area than most Kraft
units.
• The support and system infrastructure of Kraft Foods South Africa is outdated
and slower, and requires longer lead times. De Swardt (2005) indicated that
imported chocolates from Belgium might take 10 weeks from the placement of
the order to the receipt of the stock in South Africa.
Gess (2004) pointed out that Kraft Foods have more finished goods stock keeping
units than most Kraft units, which adds complexity throughout the supply chain. Most
of the customers in South Africa are not as advanced in processes and systems, for
example, the independent stores which account for about 20 % of Kraft Foods South
Africa’s business have no formal systems in place. A few of the bigger customers,
like Makro, do implement SAP. Van Blerk (2005) added that old and slow systems
make Kraft Foods South Africa a more complex business to manage and the
systems are also slow to react to changes.
The high staff turnover within Kraft Foods South Africa has also added complexity to
the business. The new employees have to be trained and also require a settling- in
period. In most cases, knowledge is lost as highly skilled people leave the business.
Systems and processes are important, but any business needs skilled people to
successfully implement strategies and manage the business on an ongoing basis
(Van Blerk, 2005).
Van Blerk (2005) was also concerned about the additional complexity of promotions.
Kraft Foods South Africa has tried to promote too many product items, or have even
added additional items to the portfolio which has increased the complexity. Most of
the products cater for the retail channel, which makes it very difficult to sell to the
wholesale trade. The customer discount structure does not differentiate enough
between the retail and wholesale trade. The result is that the sales force is forced to
sell items to the retail and wholesale trade at almost the same price which makes
trade negotiations more complex. The supply constraints of promotional items like
baking powder, jellies and desserts, have also complicated the implementation of
promotions. Demand forecasts were provided to the factory 3 months before the
UUnniivveerrssiittyy ooff PPrreettoorriiaa eettdd –– VVaann ddeerr MMeerrwwee,, TT ((22000066))
236
promotion; however, the factory communicated supply constraints and risks just
before the implementation of the promotions.
Templeton (2004) stated that the following logistics issues also add to the complexity:
• Order collections: In some countries, customers collect their orders from Kraft;
however, Kraft Foods South Africa delivers directly to stores. Iliffe (2005) also
added that Kraft delivers to distribution centres in the United States only.
• Made to order or forecast: In some countries, Kraft Foods make stock for
customers based on their rolling forecast, however, Kraft Foods South Africa
uses a forecast of 95 % of its projected sales volumes.
• Customer base and delivery points: Kraft Germany delivers coffee to about
100 customers, while Kraft Foods South Africa delivered to 3900 customers in
2004. Iliffe (2005) added that some customers prefer various delivery options,
for example Pick ‘n Pay might receive direct store deliveries, distribution
centres and others may even be delivered with representatives.
• Transportation: Kraft normally uses long- haul primary transportation vehicles
to deliver stock to customers, while a complex combination of primary and
secondary transportation is used in South Africa. Molelekoa (2005) and de
Swardt (2005) also mentioned that the logistics infrastructure was more
complex due to the multiple warehouse locations and bigger geographical
area.
• Production: Most of the overseas Kraft production facilities are dedicated
plants, for example, Germany produces about 20 stock keeping units, while
South Africa sells and produces 240 stock keeping units from various product
categories and production technologies. Molelekoa (2005) also mentioned that
the Tunney factory did not provide enough flexibility to meet demand forecast
changes of sales and marketing. The Tunney factory also had quite a few
production capacity constraints which limited the ability of the business to
react, for example, the output through the Manhattan hot rooms and packing
machines was constrained in 2004. Brokke (2005) added that the factory was
not fully utilising all its equipment.
UUnniivveerrssiittyy ooff PPrreettoorriiaa eettdd –– VVaann ddeerr MMeerrwwee,, TT ((22000066))
237
Iliffe (2005) and Horne (2005) added that the wide product range was adding
complexity to Kraft Foods South Africa. Where other Kraft units could focus on coffee
and chocolates only, Kraft Foods South Africa focussed on many different product
segments, for example coffee, beverages, other groceries, biscuits and cheese. Kraft
Foods South Africa handled about 250 stock keeping units, while most other Kraft
units in Central Europe and Middle East did not handle more than 150 stock keeping
units. Horne (2005) also warned that the wide variety of sourcing options was also
adding complexity to the business. Products, for example, could be sourced locally
from the Tunney plant, from local and imported third parties or imported from other
Kraft units. The various factories also had various lead times which added complexity
in the replenishment decisions. Strydom (2005) added that the sales team’s job was
more complex than that of other Kraft units. In South Africa, for example, the sales
team had to handle confectionery, beverages, till point or commodities, as well as
impulse or account lines. The sales team’s efforts were also hampered because they
did not have a focussed trade marketing team which could resolve a lot of sales and
marketing issues.
Strydom (2005) mentioned that the relationship with the trade customers was less
complex in other countries. Kraft Foods South Africa had to deal with the poor
customer service levels and perception about Kraft. Customers were not so
enthusiastic about collaborative planning and new product launches due to the poor
track record of Kraft Foods South Africa.
6 .2 .1 .11 D i f fe ren t ia t ion o f se rv ice leve ls be tween p roduc ts and cus tomers
Erasmus (2004), Devraj (2004) and Iliffe (2005) indicated that Kraft Foods South
Africa tries to maintain a higher service for its key customers in the following
sequence: Pick ‘n Pay, Shoprite and then the remainder of the customers. Erasmus
(2004) added that the sequence is determined by the size of the business and the
profits generated by the accounts. Currently, 80 % of the business is done through 5
key accounts. The risk of doing business in this way is the political pressure to
maintain ever- increasing demands from the trade, for example longer shelf- life and
longer payment terms. Kraft Foods South Africa regularly reviews its product
UUnniivveerrssiittyy ooff PPrreettoorriiaa eettdd –– VVaann ddeerr MMeerrwwee,, TT ((22000066))
238
profitability, but also assumes the same profitability based on the product volumes
purchased. The customer account profitability is thus not regularly calculated and
reviewed taking into account rebates, credit notes and outstanding debtor days.
Erasmus (2004) was confident that the customer profitability ranking would change if
the customers’ true profitability were to be considered. Erasmus (2004) concluded
that Kraft Foods sells the correct product, but more work needs to be done to
understand customer profitability.
Gess (2004) added that profitability is not considered when customer orders are
executed. The account manager who does the most follow-ups will eventually receive
the stock. The account managers thus review the stock levels on a regular basis to
ensure that orders are executed. Where ranking is used to prioritise, the expected
customer demand in volume and not profit is used. De Swardt (2005) also mentioned
that Kraft should start to differentiate not just product but also customer
differentiation, for example, providing smaller “C” customers with lower, yet
acceptable service levels.
High volume products like baking powder, squashes and jellies are used as the basis
to prioritise orders (Devraj, 2004), (Masinga, 2005), Iliffe (2005), Grove (2005),
(Schofield, 2005) (Horne, 2005) (Naicker, 2005). Van Blerk (2005) was very sceptical
and did not think Kraft Foods differentiated between customers. The main reasons
are that Kraft does not understand its service levels and also does not try to manage
its service levels with the customers. Templeton (2004) also does not think that Kraft
differentiates between the service levels of its customers and products. Templeton
(2004) suggested that Kraft should concentrate its efforts on key profit categories.
Molelekoa (2005) mentioned that the business did not properly differentiate between
customers and products when forecasts are done. The key account forecasts, for
example, have only been submitted per brand up and until April 2005. Supply chain,
for example, was responsible to break the forecast down into a sales forecast per
account per region per stock keeping unit.
UUnniivveerrssiittyy ooff PPrreettoorriiaa eettdd –– VVaann ddeerr MMeerrwwee,, TT ((22000066))
239
6 .2 .1 .12 D i f fe ren t fo recas t ta rge ts Kraft Foods South Africa has different targets which create confusion within the
supply chain (Van Blerk, 2005), (Erasmus, 2004), (Gess, 2004), (Devraj (2004),
(Parsons, 2004) (Templeton, 2004) (Sandwick, 2005), (Molelekoa, 2005), (Iliffe,
2005), (Masinga, 2005), (Grove, 2005), Schofield, 2005), (Horne, 2005), (Naicker,
2005), (Strydom, 2005) (Brokke, 2005). Erasmus (2004) believes that the gap
between the targets is closing and will eventually fall away. The key business
decisions, like procurement and production, should be based on the more realistic
business forecast (Devraj, 2004), (Masinga, 2005), (Strydom, 2005) (De Swardt,
2005).
Gess (2004) and Iliffe (2005) stated that the various Kraft forecast targets create a
great amount of confusion throughout the business. The sales department, for
example, are not sure which target they are supposed to achieve, i.e. first revised
forecast, second revised forecast, third revised forecast, last estimate, operating
budget or the business forecast. Kraft needs to focus on one set of numbers to avoid
confusion and have clear expectations. Templeton (2004) added that Kraft will never
have one set of numbers, as the financial forecast is normally very political and will
not agree with the business forecast. Brokke (2005) also warned that Kraft Foods
South Africa is too internally focussed on the various planning versions instead of
focussing on micro-management which adds value. Sandwick (2005) mentioned that
the various forecast versions created less confusion for the marketing team, because
they could focus only on a few brands and categories per person. The sales team, on
the other hand, had to handle all categories.
6 .2 .1 .13 Reduc t ion o f the demand lead- t ime gap
Van Blerk (2004), Molelekoa (2005) and De Swardt (2005) suggested that the
demand planners should meet with Kraft’s national account managers. The demand
planners and key account managers should also meet with the customers. The
various meetings should also be followed up with debriefing meetings, where the key
issues and priorities can be reviewed and agreed upon. Molelekoa (2005) and Iliffe
UUnniivveerrssiittyy ooff PPrreettoorriiaa eettdd –– VVaann ddeerr MMeerrwwee,, TT ((22000066))
240
(2005) mentioned that the customers should also play a bigger role through
collaborative planning. Strydom (2005) and Sandwick (2005) indicated that ongoing
communication between sales, marketing, supply chain and the customers should
reduce the lead time gap. Sandwick (2005) added that daily updates on the actual
sale rate would allow the business to monitor and react to sales trends. The business
should also focus on the high volume and profit categories. Brokke (2005) warned
that a good relationship with the trade is required to obtain advance warning of
demand. Kraft Foods South Africa, for example, is not the category champion in
biscuits and beverages, which makes it more difficult to negotiate and obtain
advance notification of customer orders.
Templeton (2004) indicated that the business will benefit if the customers inform Kraft
in advance what they require. This will allow the business to base its decisions, not
only on the forecast, but on the early notification of orders which will increase the
forecast accuracy. Erasmus (2004) suggested that the national account managers
should understand all their activities per account per region. The maximum forecast
horizon for customers is 1 month, while made-to-order commitments for exclusive
lines could be determined one year in advance. Gess (2004) also suggested
fortnightly meetings with customers to review their forecasts. The 3 months forecast
window could also be extended to 6 months based on the updated promotional grid,
for example, Makro publishes a broadsheet planning calendar per supplier. Devraj
(2004) said that the onus was on the key account managers to conclude their
upcoming promotions with customers three months in advance. The commitment of
volume and delivery dates would then be based on the mutual trust established.
Erasmus (2004) and Parsons (2004) both agreed that Kraft needed to understand
the base and incremental volume. Masinga (2005) added that high service levels
were achieved on Metcash orders which were negotiated 8 weeks before the
required delivery date and forwarded to customer services for execution. Some
customers, like Checkers Shoprite, now allow Kraft to review historical sales and
forecasts on their websites (Grove, 2005). Horne (2005) warned that Kraft should
also consider and react to competitive opportunities and threats, for example, when
Nestle experienced supply issues with the implementation of SAP during the latter
part of 2000, the demand increased for Kraft coffee and mayonnaise. Where
forecasts are not provided by customers and the sales team, statistical forecast
UUnniivveerrssiittyy ooff PPrreettoorriiaa eettdd –– VVaann ddeerr MMeerrwwee,, TT ((22000066))
241
software, like Forecast Pro, could also provide a statistical sales forecast. Naicker
(2005) even suggested that the customers forward the customer deal sheet to all
parties within Kraft to ensure full transparency in potential orders.
6 .2 .1 .14 Demand and supp ly a l ignment w i th in a supp ly cha in
Van Blerk (2004) pointed out that the demand and supply alignment was improving
and becoming more professional. The risk was that Kraft tried to overcomplicate and
over- analyse the numbers. Kraft has to make sure that it sticks to the fundamentals
first. Molelekoa (2005) mentioned that the whole business was focussed on
improving customer service levels and even included the recovery plan targets into
the personal performance targets. Naicker (2005) was encouraged by the
improvement in service as from February 2005 which resulted in a higher
commitment from sales to improve and rectify the situation.
Erasmus (2004) also felt that some of the fundamentals were not in place yet. He
expected the results to start improving only from the second quarter in 2005. Gess
(2004) said that the baseline was still unknown as the national account manager
team was only established during 2004. The results should be measured and tracked
in future, in order to take corrective action, for example, if the actual sales are always
higher than the forecast, the forecast should be increased to avoid an out of stock
situation. Grove (2005) was impressed with the higher service level up and until
March 2005, however consistent supply from the factory was required to maintain
and improve the service level. Horne (2005) also suggested that the Tunney plant
needed to focus on prioritising production and decreasing production batch sizes.
Schofield (2005) warned that the business would need about a year of good service
levels to understand the baseline for forecasting purposes.
Devraj (2004) indicated that the current process was very fragmented. He suggested
that the future process should be more aligned. The lead times of items should also
be considered before promotions are agreed upon, for example, the forecasts of
imported items should be reviewed in advance to allow the supply chain to react to
demand changes. Molelekoa (2005) and Masinga (2005) mentioned that the forecast
accuracy would improve as more people become involved in the forecast process.
UUnniivveerrssiittyy ooff PPrreettoorriiaa eettdd –– VVaann ddeerr MMeerrwwee,, TT ((22000066))
242
Iliffe (2005) also suggested that marketing should become more involved in the sales
forecast process. The business also needed to start working with external suppliers
and customers. Kraft needed to invest in additional tools to assist in the process, for
example, Kraft should invest in Forecast Pro, the sales forecast statistical software,
and MFG Pro, the enterprise resource planning software during 2005.
De Swardt (2005) concluded that the alignment between supply and demand has
improved, however better results were required. The finished good stock cover has
decreased from 66 days in December 2003 to 39 days in December 2004 and a
reduction to 35 days was planned by December 2005. The results could improve
through micro-management; a more optimum balance between stock cover, service
level and sales forecast accuracy; and finally more supply flexibility, for example,
reducing the minimum production batch sizes. The integration of supply and demand
into the demand and replenishment planning function in the supply chain department
also ensures that the alignment of the supply and demand is reviewed regularly and
the appropriate corrective action is taken. The business needs to collaborate
internally first before exploring collaboration opportunities with customers and
suppliers.
Parsons (2004) and Templeton (2004) agreed that the immediate priority was to
improve the service level of 60% and to align the business to high profit items. The
improvement in the service level would also improve Kraft’s profitability and credibility
with the trade. Strydom (2005) indicated that the business should try to understand
the real demand of consumers. The customer sales could include seasonal buy-ins,
sell-in campaigns and price increase or decrease promotions. Brokke (2005)
mentioned that the Tunney factory, which supplies the majority of the products, could
delay the improvement process. The factory provided the business with the following
challenges: low production compliance, high costs, under utilisation of some the
equipment, long and slow processes and unionised labour force. In April 2005, for
example, the Tunney factory had the lowest raw material costs in the world, however
the highest factory costs.
UUnniivveerrssiittyy ooff PPrreettoorriiaa eettdd –– VVaann ddeerr MMeerrwwee,, TT ((22000066))
243
6.2.1 Supply management
6.2 .2 .1 D i f fe ren t ia t ion o f se rv ice leve ls be tween p roduc ts and cus tomers
Kraft Foods tries to maintain a better service level with key customers and high profit
items (Moses, 2004), (Herselman, 2004), (Van Zyl, 2005), (Templeton, 2004)
(Redelinghuys, 2005), (Chetty, 2005) (Sarulis, 2005) (Gardiner, 2005) (De Swardt,
2005). Chetty (2005) added that Kraft Foods South Africa started to communicate the
actual service levels throughout the company from January 2005 which has improved
the visibility and focus on the service level recovery plans. Kubheka (2005) and
Greenslade (2004), on the other hand, were under the impression that Kraft tries to
maintain a high service level on all products and to all customers.
6.2 .2 .2 Supp ly cha in t r igger : o rder ve rsus fo recas t
The trigger for Kraft Foods’ supply chain is the forecast (Moses, 2004), (Herselman,
2004), (Van Zyl, 2005), (Templeton, 2004), (Kubheka, 2005) (Greenslade, 2004)
(Redelinghuys, 2005), (Chetty, 2005) (Sarulis, 2005) (Gardiner, 2005) (De Swardt,
2005). Kraft Foods is currently unable to react to the customer order in time. Moses
(2004) also added that the situation is made worse because of the low forecast
accuracy which is 35 %. The only time the factory sees the order is when the stock is
made-to-order (Van Zyl, 2005). Redelinghuys (2005) also mentioned that the
business is driven by the forecast; however the forecast is adjusted by the actual
customer orders.
6.2 .2 .3 Reduc t ion o f supp ly lead t ime The following are a few ideas suggested to reduce the supply lead times, which will
allow the supply chain to react quicker to demand and demand changes:
• Moses (2004) and van Zyl (2005) suggested changing the sourcing of raw
materials and packaging from international to local suppliers.
UUnniivveerrssiittyy ooff PPrreettoorriiaa eettdd –– VVaann ddeerr MMeerrwwee,, TT ((22000066))
244
• Moses (2004) suggested that the factory should make smaller runs more
often. Equipment needs to be calibrated and the formulas of some of the
products need to be changed, for example, product formulas need to be
adjusted if batch sizes are reduced.
• Longer production runs will decrease the scrap rate of the factory
(Greenslade, 2004).
• Greenslade (2004) and Chetty (2005) suggested that an increase in forecast
accuracy would allow the factories to plan and not to react. Kubheka (2005)
and Chetty (2005) added that the business should communicate demand
changes on a more regular basis to all parties, for example suppliers should
receive a forecast update on a monthly basis and not just once a year.
• Packaging machine set-ups could be aligned with manufacturing, for example,
packaging should be done from lighter to darker colours which would reduce
the clean-up and change-overs of machinery (Greenslade, 2004).
• Van Zyl (2005) suggested the removal of small volume items which would
result in bigger production runs more regularly, for example, Oreo 22 g needs
to be produced with the 175 g or 150 g Oreo.
• Van Zyl (2005) also suggested that some of the production equipment needs
to be upgraded, for example jellies and puddings. The current packing
machines are old and unreliable. In some cases, the demand is much higher
than the available production capacity, for example, jellies and puddings.
• Kubheka (2005) suggested that some of the production and packing
machinery could be calibrated to allow for quicker changeovers. Herselman
(2005) suggested that the speed on machines could be calibrated to allow for
smaller minimum batch sizes. Templeton (2004) concluded that the business
needed to move away from long production runs to flexible, more frequent
production runs.
• Herselman (2005) mentioned that the supply chain would be able to react
quicker if the business agreed to invest in more raw materials, packaging and
finished goods inventory.
• The status of all purchase orders at suppliers should be constantly checked,
for example, all outstanding purchase orders should agree between Kraft and
its suppliers, purchase order volume and due delivery dates should be
UUnniivveerrssiittyy ooff PPrreettoorriiaa eettdd –– VVaann ddeerr MMeerrwwee,, TT ((22000066))
245
confirmed and upcoming purchase order deliveries should be checked on a
weekly basis (Chetty, 2005).
• Kraft should move to change the unique and customised specifications of raw
materials to common, off-the-shelf raw materials. Unique raw materials can
normally only be sourced from overseas suppliers which increases the supply
lead time and decreases the ability of the factory to react to demand forecast
changes (Gardiner, 2005).
• The factory should increase the capacity output to the level where the
production output is not limited by the production capacity, but by the
availability of raw materials and packaging (Redelinghuys, 2005).
• Kraft should also streamline its product portfolio and remove small volume
items that add complexity and increase the supply lead-time. The smaller, less
complex product range will allow Kraft to react quicker (Redelinghuys, 2005).
• The deployment from the central warehouse in Johannesburg to the regional
warehouses in Durban, Cape Town and Port Elizabeth should be done in
smaller batches and on a more regular basis. The business should determine
the cost / benefit trade-off between the more regular deployment and keeping
additional stock closer to the point of consumption (Redelinghuys, 2005).
6 .2 .2 .4 F rozen p roduc t ion lead t ime
The production plan is frozen for a period of one month. The frozen production plan
allows the factory to plan their production, for example, raw material and packaging
sourcing, as well as labour. The machinery in the factory is very old with the result
that long production runs and long changeovers are preferred (Moses, 2004),
(Herselman, 2004) (Van Zyl, 2005) (Templeton, 2004) (Greenslade, 2004).
The factory was considering moving to a one week frozen forecast, which is the norm
in other Kraft units (Moses, 2004) (Chetty, 2005) (Redelinghuys, 2005). Templeton
(2004) added that the factory should be more flexible to cater for demand changes.
Changes are not uncommon in the fast moving consumer goods markets and all
companies need to react to changes on a monthly, weekly and even hourly basis 365
days a year.
UUnniivveerrssiittyy ooff PPrreettoorriiaa eettdd –– VVaann ddeerr MMeerrwwee,, TT ((22000066))
246
Greenslade (2004) also indicated that the factory prefers long production runs which
provide better production efficiency. The set-up and scrap- rate on biscuits, for
example, increases from 1 % to 5 % if the production is planned for only one day
versus a production run of 3 days non-stop.
Van Zyl (2005) mentioned that the factory will, by exception, consider weekly
changes if there are big opportunities or risks that the business must react to, for
example, trade de-listings if product is not delivered by certain dates.
6 .2 .2 .5 A l ignment o f depar tmenta l ob jec t i ves and incen t i ves
The objectives of all departments agree broadly (Moses, 2004) (Herselman, 2004)
(Van Zyl, 2005) (Templeton, 2004) (Greenslade, 2004) (Chetty, 2005) (Redelinghuys,
2005).
Moses (2004) indicated that there was a difference in the implementation of the
different objectives. The objective of sales, for example, is the achievement of sales
volumes targets and high sales forecast accuracy. The sales targets provided are
volume targets per major product family or group and not per stock keeping unit. In
order to achieve sales volume targets, sales deals are implemented at a product
group level, ignoring the implication on service level and forecast accuracy at a stock
keeping unit. The erratic swing in demand between stock keeping units within a
product group resulted in a service level of 60 % and forecast accuracy of 35 % in
2004.
Greenslade (2004) indicated that the objectives of all departments are the same.
Where actions were taken in the past which were in conflict with another department,
it was not done deliberately. In order to survive, some departments like sales,
implemented plans which were not aligned with those of the factory. Sales, currently,
does not understand the factory and vice versa, for example, the production
complexities involved to react to a sudden sales gap closure plan.
UUnniivveerrssiittyy ooff PPrreettoorriiaa eettdd –– VVaann ddeerr MMeerrwwee,, TT ((22000066))
247
Van Zyl (2005) questioned the rationale of sales and marketing to implement
promotions on products with production constraints, for example, baking powder,
jellies and desserts. The additional promotional demand, which was not met during
October to December 2004, resulted in large quantities of lost sales. Sales and
marketing should not make commitments to the trade if they are aware of internal
supply constraints. Kubheka (2005) suggested that sales and marketing should
consult with the factory first before commitments are made with the trade. In the past,
promotions and the volume expectations of promotions were communicated too late
to the factory.
Herselman (2004) would also prefer more details on promotions from sales and
marketing. The volume expectations are communicated, but not the exact timings of
promotions. Some promotions, for example, were implemented over a trade month-
end, while the factory did not plan any major production before the trade month-end.
The factory was forced to react to the trade promotion at a high cost, for example,
extra production shifts and over time. Gardiner (2005) also added that more
information about upcoming sales and marketing promotions would allow the
procurement and production team to react to business opportunities. In January 2005
the production and procurement teams only reacted to the finished goods, raw
materials and packaging requirements based on the material requirements planning
reports.
In the past, not all departments received incentives for adding value to the business
(Chetty, 2005). The procurement team, for example, worked on the baking powder
capacity problem in 2004 quarter 4. They worked closely with sales, marketing,
production and packaging suppliers and implemented a packaging solution that
resolved the capacity constraints at the Tunney factory. The procurement team’s
efforts to resolve a business risk were not recognised by the business. Only the
sales and marketing team currently receive special performance incentives.
Redelinghuys (2005) concluded that the alignment between departments is much
better than in the past. The key drivers for business success, for example, forecast
accuracy, production compliance and product availability, have been included into
people’s business performance goals. Since January 2005, all departments have
UUnniivveerrssiittyy ooff PPrreettoorriiaa eettdd –– VVaann ddeerr MMeerrwwee,, TT ((22000066))
248
initiated a big effort to improve the results and to avoid blaming individuals and
departments.
6 .2 .2 .6 Supp ly cha in complex i t y
The supply chain of Kraft Foods South Africa is more complex than most of the other
Kraft units (Moses, 2004) (Herselman, 2004) (Van Zyl, 2005) (Templeton, 2004)
(Greenslade, 2004) (Chetty, 2005) (Sarulis, 2005) (Gardiner, 2005) (De Swardt,
2005) (Redelinghuys, 2005). Some of the factors that make the supply chain more
complex are the following:
• More finished goods stock keeping units which add complexity throughout the
supply chain, for example, more items to produce and pack (Moses, 2004).
• More different production lines, production processes and technologies
(Moses, 2004). Some of the other Kraft units simply have a wide range of
different pack sizes for the same product type, for example Kraft Switzerland
produces different Toblerone pack sizes and Kraft Germany produce different
Jacobs Kronung pack sizes (Chetty, 2005). Greenslade (2004) indicated that
some of the other Kraft plants were more automated, for example, packing
areas. Most of the equipment at the current Tunney plant is very old and the
packing area requires a lot of manual labour. The current Tunney plant,
according to Van Zyl (2005) and Redelinghuys (2005), is handling the
production of about 7 different technologies, while most of the Kraft plants in
Europe only handle one or two technologies, for example, the coffee plant in
Germany only produces freeze-dried granular and filter coffee and the
chocolate plants in Switzerland and Belgium only produce a limited range of
chocolate items. The Tunney plant of Kraft Foods South Africa, on the other
hand, handles the following technologies: gels (Manhattan brand),
marshmallows (Manhattan brand), soft candy extrusion (Sugus and
Tendermints brands), hard- boiled candy (Beechnut brands), bottled liquid
(Lecol brand), dry mixes like baking powder, jellies and instant puddings
(Royal brand), compressed (Super C brand) and biscuits (Oreo, Riviera and
Crackermates brands).
UUnniivveerrssiittyy ooff PPrreettoorriiaa eettdd –– VVaann ddeerr MMeerrwwee,, TT ((22000066))
249
• The long range of small volume items adds unnecessary complexity to the
supply chain (Van Zyl, 2005) (Redelinghuys, 2005). The result is that the
factory cannot achieve better economies of scale. A trade-off is required,
because the volumes in small and large quantities are required for overhead
fixed cost recovery.
• The business has to deal with more suppliers each handling small volume
and high variety product ranges (Sarulis, 2005). The procurement team is
currently focussing on the high volume and high profit items.
6 .2 .2 .7 S t reaml in ing cus tomer and p roduc t por t fo l io
The customer base and product portfolio should be streamlined (Moses, 2004),
(Herselman, 2004) (Van Zyl, 2005) (Templeton, 2004) (Greenslade, 2004) (Chetty,
2005) (Sarulis, 2005) (Gardiner, 2005) (De Swardt, 2005) (Redelinghuys, 2005).
Moses (2004) added that Kraft Foods South Africa should focus on high volume and
profit items and customers. De Swardt (2005) suggested that different sales
strategies should be applied to different customers based on the cost to serve
scenarios. To streamline the customer base, Templeton (2004) suggested that the
business should implement a minimum case order size and minimum order value.
Smaller customers should be allocated to agents. The amount of finished goods
items should also be reduced. Some Kraft units have reduced their product range
with small volume items, while maintaining the same volume which results in higher
economies of scale. Kubheka (2005) warned that the business should understand
the reason for an item’s performance before the item is removed, for example, poor
sales and marketing communication to create awareness and repeat purchases
could result in poor sales. On the other hand, the sales and marketing team should
try to increase the demand of products to match the high minimum production runs,
for example, every minimum production run of Lecol Diet beverages and Bells Basic
biscuits provides 10 weeks stock cover which increases the stock aging risk.
The best way to streamline the product portfolio is to prevent items being launched
(Chetty, 2005). Oreo 22 g and Tendermints Spearmint were launched in 2004 and
2005, however soon after the product launches, the top management team
UUnniivveerrssiittyy ooff PPrreettoorriiaa eettdd –– VVaann ddeerr MMeerrwwee,, TT ((22000066))
250
requested the procurement team to achieve cost savings to make the products more
profitable and feasible. Products with less than the minimum required profitability
should not be launched.
The business should focus on key brands and priorities and discontinue smaller
volume items, for example, Oreo 22g dispenser and small volume Manhattan items
(Chetty, 2005) Herselman (2005) (Redelinghuys, 2005). Other options are that as the
business grows and the current volumes increase through sales and marketing,
another business or factory may have to be acquired (Herselman, 2005). De Swardt
(2005) added that the business had already reduced the amount of finished goods
items from 301 in December 2003 to 220 by December 2004.
6.2 .2 .8 Supp ly cha in bo t t lenecks
The Tunney production facility has a few supply bottlenecks, which include the
following:
• Packing constraint: Moses (2004) and Van Zyl (2004) mentioned that the
production capacity, in some cases, is far greater than the packing ability.
Products that have a packing constraint include baking powder, desserts,
jellies, biscuits and Lecol beverage. Compressed confectionery like Super C
and Beechnut can sometimes only be packed two days after production due to
the bottlenecks of the packing machines (Templeton, 2004). Templeton (2004)
also added that the production speed and output of the biscuit ovens are
higher than the packing speed of the biscuit line. Biscuits are stored on special
trays until the packing machines are available. The same problem is
encountered with jellies which are made in batches, stored in a hopper and
then later packed when the packing machines become available, according to
Kubheka (2005). The factory currently balances the production output and the
speed of small and large bottles of Lecol beverages with the packing
machines, in order to balance the output of the production process which is
higher than the packing process (Herselman, 2005). The current packing
machines are old and cannot meet the ever- increasing demand. In some
cases, like baking powder refills, the packing is done manually (Moses, 2004).
UUnniivveerrssiittyy ooff PPrreettoorriiaa eettdd –– VVaann ddeerr MMeerrwwee,, TT ((22000066))
251
Kubheka (2005) warned that the business should consider additional packing
machines to avoid continuing lost sales.
• Production process constraint: Moses (2004) indicated that in other cases, the
production process takes very long. The packing output is thus higher than the
production output. The curing times of some of the Manhattan items in the hot
rooms are between 24 and 48 hours (Templeton, 2004). There are currently
also not enough hot rooms available to produce the full product range at all
times (Moses, 2004). The production is prioritised based on the curing times,
volumes and current stock cover. Other examples of production process
limitations are Sugus, Tendermints and Manhattan marshmallows (Moses,
2004) (Van Zyl, 2005). The business should critically review the feasibility of
some items (Greenslade, 2004) (De Swardt, 2005). Oreo 22 g, for example,
cannot currently be produced on its own. Production is forced to also make
150 g or 175 g Oreo to achieve a minimum batch size. In some cases, the
factory cannot react to an increase in demand in all the categories, for
example Sugus, Tendermints and Boilings confectionery share the same
cooking and pulling process, while Super C and Beechnut compressed share
the same punching or pill forming process (Herselman, 2004). The factory
should keep a balance between the available production capacity and the
reliability of production equipment, for example, the machinery for jellies and
desserts are old and less reliable which requires the factory to start building
stock for high peak seasons (Redelinghuys, 2005).
• The major cause of stock build in the past has been the incorrect sales
forecasts. Where products have been underselling, the raw material and
packaging stock levels increased at the factory while the finished goods stock
levels increased at all warehouses (Chetty, 2005). De Swardt (2005) added
that the business was not proactively warned of potential supply or demand
issues which resulted in the business constantly reacting to issues.
The supply side of the business is thus currently constrained, based on a mix of
packing and production constraints.
UUnniivveerrssiittyy ooff PPrreettoorriiaa eettdd –– VVaann ddeerr MMeerrwwee,, TT ((22000066))
252
6 .2 .2 .9 Reac t ion o f supp ly to demand changes
Assuming that raw materials and packaging material are available, the factory would
normally be able to react to demand changes (Herselman, 2005). The normal
production process and packing machine constraints would unfortunately still apply,
for example, the slow output of Manhattan gels from the hot rooms and the slow
process to cook and punch Tendermints (Herselman, 2005) (Chetty, 2005).
Herselman (2005) added that the reaction to demand changes would also imply extra
shifts and thus extra costs. It normally takes the factory an average of 8 working days
to react to major demand changes. During peak seasons, the factory cannot react to
major demand changes, for example Manhattan and Jellies (Herselman, 2005)
(Redelinghuys, 2005). Moses (2004) and Templeton (2004) warned that the reaction
time for imported finished goods and raw material and packaging is about 6 to 8
weeks, which limits the ability of the supply chain to react to demand changes. The
risk of constantly reacting to demand changes is that the raw material and packaging
safety stock cover, available for future demand, is reduced or cleared (Greenslade,
2004).
The following suggestions could help the supply chain to react quicker to demand
changes:
• Herselman (2005) suggested additional or an upgrade of manufacturing and
packing machinery, for example, additional hot rooms for Manhattan gels,
additional cooking and punching machines for Sugus and Tendermints,
additional bottle fillers for Lecol beverages and automated cooking machines
for Sugus and Tendermints.
• Moses (2004) suggested changing from imported to locally sourced raw
materials, packaging and finished goods.
• Changing the production machinery changeover settings to cater for shorter
production runs (Moses, 2004).
• Van Zyl (2005) and Greenslade (2004) suggested an improvement in the
forecast accuracy. Van Zyl (2005) added that a reduction in forecast
fluctuations would result in more production planning stability and smoother
supply to the market. The business should focus on planning, rather than
reaction.
UUnniivveerrssiittyy ooff PPrreettoorriiaa eettdd –– VVaann ddeerr MMeerrwwee,, TT ((22000066))
253
• A reduction in the finished goods product portfolio would remove complexity,
for example, less production changeovers (Van Zyl, 2005).
• Research and development should change certain product ingredients to
allow for quicker production turnarounds. Crackermates biscuits, for example,
contain a great amount of fats and oils which take a long time to clean before
the next biscuit production.
• Greenslade (2004) indicated that the complexity of the production process and
materials in progress make it very difficult to react, for example, if biscuit
dough has been made, it must be processed through the ovens to avoid
scrapping all the dough. Production in progress can thus not simply be
switched on and off. Kubheka (2005) also added that priority will always be
given to the production in progress. It normally takes the plant a week to start
working on new priorities.
• An increase in the raw material and packaging warehouse space would allow
the factory to react quicker to demand changes (Chetty, 2005).
• Improving and maintaining a good relationship with raw and packaging
material suppliers (Gardiner, 2005). Good supplier relationships have resulted
in a reduction in lead-time, for example, the raw materials from flavour houses
have been reduced from 65 to 14 days lead-time.
• De Swardt (2005) also suggested that the distribution company should be
more flexible to demand and supply issues, for example stock should be
replenished and deployed to the regional depots on a more regular basis.
6 .2 .2 .10 Oppor tun i t i es to poo l r i sk
Herselman (2005), Moses (2004) and Redelinghuys (2005) mentioned that the
factory does not carry the majority of the raw materials and packaging at the plant.
The materials are kept at the suppliers and transferred to the factory when required.
The suppliers normally carry about a month’s stock. Moses (2004) and Greenslade
(2004) added that the level of raw materials and packaging could decrease if the
sales forecast accuracy of the finished goods increased. Kubheka (2005) stated that
some of the suppliers of cartons could only react within 4 days. The lead-time of raw
material and packaging sourcing is normally not a problem if the sourcing is planned.
UUnniivveerrssiittyy ooff PPrreettoorriiaa eettdd –– VVaann ddeerr MMeerrwwee,, TT ((22000066))
254
In cases of low sales forecast accuracy and overselling, the factory cannot effectively
plan and manage their supply and reduce their inventory.
The risk related to demand and supply fluctuations could be reduced by making the
products simpler (Van Zyl, 2005). Examples of making the products simpler include
the following:
• Using common packaging and common shrinks. Redelinghuys (2005) also
mentioned that the procurement team should work with suppliers to reduce
their minimum packaging order volume.
• Using simpler packaging, for example, jellies are currently packed in sachets,
then an inner box and finally in a large outer box. Jellies could also be packed
into a small soup box type of container and then finally into a big outer box
making the process simpler and faster.
• Reducing the pack size variants, for example, jellies are sold in 80 g sachets,
while instant puddings are sold in 90 g sachets. The production process could
be simplified if jellies and instant puddings were to be sold in the same pack
sizes.
Templeton (2004) and De Swardt (2005) also believed that the number of
warehouses could be reduced. Kraft Foods currently have regional warehouses in
Johannesburg, Durban, Cape Town and Port Elizabeth. Port Elizabeth, for example,
could be changed to a transhipment warehouse and Durban to a transhipment and
cross-dock warehouse. Transhipment implies that stock is picked up in bulk at the
central warehouse in Johannesburg, shipped to Port Elizabeth, broken into the
individual orders and finally shipped to the customer. Cross-dock, on the other hand,
implies that the orders have already been picked up at the central warehouse in
Johannesburg, and shipped to Durban via primary transportation and finally
transferred to secondary transportation for final delivery to the customer. This could
also entail in orders picked in Johannesburg and cross docked via the Distribution
Centre of the customer, utilizing their network and/or fleet, which could reduce lead-
times, handling and costs further. Except for the higher costs incurred, the number of
warehouses should also be reduced in order to reduce inventory. The same level of
safety stock is stored at each warehouse facility, for example, 4 weeks of safety
UUnniivveerrssiittyy ooff PPrreettoorriiaa eettdd –– VVaann ddeerr MMeerrwwee,, TT ((22000066))
255
stock is carried at each regional warehouse. If the number of warehouses is reduced,
there should also be a reduction in the inventory levels.
The Tunney factory should utilise all production equipment to its maximum available
capacity and efficiency. Some of the production equipment, however, is running at
less than 50 percent utilisation. The issues should be closely monitored and
resolved. The relevant production equipment should be fixed, upgraded or replaced.
The business should also determine if it makes business sense to move the
production to an external production source (Chetty, 2005).
Templeton (2004) warned that Kraft Foods South Africa should reduce inventory
gradually. A sudden reduction in inventory could result in a reduction in service levels
and on-time deliveries, for example, if the problem of trucks breaking down were not
resolved as well, there would be less stock in the supply chain to buffer against
supply variability.
6.2 .2 .11 Produc t o r p roduc t ion des ign changes
According to Moses (2004), Herselman (2004), van Zyl (2005) Templeton (2004) and
Greenslade (2004), there are various product and production design changes that
could make the supply chain of Kraft Foods South Africa more reactive, for example:
• The curing times of Manhattan gels could be reduced by changing to an
ingredient called Pekten (Herselman, 2005). The texture would, however,
change which would need to be agreed through test panels with sales,
marketing and the final consumers.
• Moses (2004) and Templeton (2004) suggested that the pack sizes of items
should be standardised. The production and packing process could be
simplified if jellies and instant puddings were sold in the same pack size.
Greenslade (2004) added that Kraft should consider standardising its biscuit
sizes. The standardised products would result in less production changeovers,
(Templeton, 2004).
UUnniivveerrssiittyy ooff PPrreettoorriiaa eettdd –– VVaann ddeerr MMeerrwwee,, TT ((22000066))
256
• Moses (2004) and van Zyl (2005) suggested that packaging should be
standardised within a product group, for example some biscuit brands are
packed in boxes while others are flow-wrapped. A standardised packing
method would reduce the packaging changeovers and would allow the factory
to react quicker to demand changes. The packaging for all Riviera and
Crackermates biscuits, for example, could change from boxes to flow-wrap.
Van Zyl (2005) added that packaging for the same products should be
simplified, for example, compressed Beechnut rolls’ outer wrap and foil
packaging should be reduced to one packaging material only. The more
simplified the production process, the quicker the supply chain can react.
• Sales and marketing should investigate the option of increasing the units per
selling units and per case for certain products (Van Zyl, 2005). The units of
jellies per selling unit, for example, could be increased from 6 to 12 as is the
case with instant puddings. The packing output will thus increase as a result of
the packing configuration adjustment.
• Moses (2004) also suggested that common packaging material should be
used. Outer boxes, for example, could be standardised and different printed
stickers could be applied at the end of the packing line.
• The business should also standardise its raw materials, for example, Sodium
Bicarb could only be sourced from two international sources due to the unique
specifications. If the business used a more standardised Sodium Bicarb
specification, the procurement team would be able to source from 10
international suppliers. The increase in supplier base would increase the
ability to negotiate better prices and also reduce any potential supply risks
(Gardiner, 2005).
• Some of the products are very complex to manufacture (Van Zyl, 2005). A
combination of automatic and manual labour is required for the production of
biscuit shells for Riviera creamy chocolate biscuits. The complexity is
increased when the manual labour is planned only for certain days.
• Greenslade (2004) suggested that granola bars could be changed from a
coated biscuit to an enrobed biscuit. Some changes would need to be made to
the biscuit ovens to handle the change in product design.
UUnniivveerrssiittyy ooff PPrreettoorriiaa eettdd –– VVaann ddeerr MMeerrwwee,, TT ((22000066))
257
• The business should remove product items from its portfolio that have no
differentiation versus other product offering, for example, Kraft’s Beechnut
versus Nestlé’s Wilson boilings or hard candy. The range of flavours and pack
sizes should also be reduced to make Kraft’s supply chain less complex. A
complex supply chain reduces Kraft’s ability to launch innovative products, for
example, a jelly filled Manhattan marshmallow was mentioned at a product
innovation workshop, however a year later the product has not yet been
launched. Beacon, on the other hand, launched a jelly filled marshmallow
during April 2005 to the trade (Chetty, 2005). The combination of finished
goods flavours should also be streamlined. In 2004, the factory had to produce
5 different flavours of Sugus in order to complete the finished product. If the
factory could reduce the flavour mix to 3, the production output would
increase. Less variety could result in less complexity throughout the supply
chain (Redelinghuys, 2005).
Production design changes would result in a more reactive supply chain:
• The biscuit oven speed and temperature could be increased resulting in higher
output (Greenslade, 2004).
• Automating the packing lines was mentioned by Greenslade (2004).
• Herselman (2005) indicated that the factory was already producing from lighter
to darker colours on the Lecol beverages filling line. Manhattan gel product
was also being produced from lighter to darker colours in the following
sequence: white, yellow, green, red and black. Templeton (2004) also added
that manufacturing from lighter to darker coloured confectionery and
beverages, for example, would require the plant to do less washing before the
next production run. The supply chain could thus react to changes quicker at
less cost. Kubheka (2005) mentioned that the lighter to darker production
runs, would result in smaller changeovers between production shifts.
• Sugar, used in the manufacturing of sugar- coated confectionery, is reworked
and re-used to save costs and reduce the lead time of production (Herselman,
2005)
• Herselman (2005) and van Zyl (2005) suggested that similar products should
be made and packed at the same time, for example, Manhattan milk bottles
UUnniivveerrssiittyy ooff PPrreettoorriiaa eettdd –– VVaann ddeerr MMeerrwwee,, TT ((22000066))
258
150 g and 400g pre-packs. The synergy in manufacturing and packing for the
same product mix would reduce the changeovers in production.
• Van Zyl (2005) mentioned that the business should investigate new and
automated packing machines. Baking powder refills, for example, are currently
being packed manually. A special doy-bag packing machine would automate
the packing, as the packing machine would make and pack the baking powder
at the same time.
• Flavours could be added to savoury biscuits at the end of the production
process instead of at the beginning to allow for flexibility and last minute
changes if required (Greenslade, 2004). In the case of Oreo biscuits, more
flavours could be introduced to cater for different needs or seasonal taste
preferences or themes.
• Biscuit cookie cappers and automated wrapping machines for the biscuit lines
could be introduced (Greenslade, 2004). The higher level of automation would
result in a supply chain which could react quicker to demand changes.
• Kubheka (2005) suggested that the factory should introduce an ink injector for
the Manhattan marshmallow production. At present, pink and white
marshmallows are made in separate production runs and later combined at
the packing line.
• Smaller production runs for biscuits could be considered, but the additional
production and scrap costs would also need to be considered with the other
potential supply chain cost savings (Greenslade, 2004).
• De Swardt (2005) also suggested more cross training of people between
departments. Factory staff, for example, should be used for various production
lines during different periods.
De Swardt (2005) concluded that all departments should consider the supply chain
implications of their actions. The research and development team, for example,
should design products with longer shelf life and shorter production curing times.
Changes to the product and production designs could improve the alignment of
supply and demand.
UUnniivveerrssiittyy ooff PPrreettoorriiaa eettdd –– VVaann ddeerr MMeerrwwee,, TT ((22000066))
259
6 .2 .2 .12 Demand and supp ly a l ignment w i th in a supp ly cha in
Herselman (2005) did not think that the supply and demand was properly aligned at
present. More and quicker communication throughout the supply chain is required.
The sales and marketing calendar and the relevant volume expectations need to be
reviewed on a 3 month rolling basis.
Gardiner (2005) and Redelinghuys (2005) indicated that the demand and supply
alignment principles and efforts to improve results were good; however the alignment
processes had to be refined to deal with the practical problems. Gardiner (2005)
mentioned that the procurement team would prefer more stability in their sourcing
plans, however they had to react to raw material and packaging sourcing plan
changes every week when the material requirements planning updates were done.
Redelinghuys (2005) also added that the factory should focus its efforts on improving
supply reliability, for example rebuilding production machinery and preventative
maintenance programmes.
Greenslade (2004) suggested that the tolerances of the various performance
measures should be standardised. Sales forecast accuracy per stock keeping unit,
for example, is achieved if the actual sales are within 25 % tolerance of the
forecasted sales. Production compliance per stock keeping unit, on the other hand, is
achieved if the actual production is within 10 % tolerance of the planned production.
Moses (2004), van Zyl (2005), Greenslade (2004) and Templeton (2004) believe that
the situation is improving, but the service level and sales forecast accuracy is still too
low. More interaction between departments could improve the results even further
(Chetty, 2005). Templeton (2004) mentioned that the first priority of the business
should be improving the service level of 60%and focussing on high profit items.
6.3 Conclus ion
The aim of this chapter was to present the results of the structured interviews
conducted on the alignment of supply and demand within Kraft Food South Africa’s
UUnniivveerrssiittyy ooff PPrreettoorriiaa eettdd –– VVaann ddeerr MMeerrwwee,, TT ((22000066))
260
supply chain. The information was collected through personal and telephonic
interviews with key supply and demand management staff members of Kraft Foods
South Africa between December 2004 and May 2005. The aim of the structured
interviews was to identify the causes of the misalignment between the supply and
demand within Kraft Foods South Africa’s supply chain and also to identify potential
solutions that could improve the alignment.
The key findings of the interviews conducted regarding demand management were
the following:
• Kraft Foods South Africa is currently trying to forecast the factory shipment
data, which is the expected sales volume to be shipped from Kraft Foods to its
customers. There are many differences and unnecessary volatility between
the factory shipment data and the final consumer data. All parties interviewed
suggested that the business should rather focus its forecast efforts on final
consumer demand, which excludes adjustments like promotions and out of
stock situations. The current trigger for the supply chain is the forecast and not
the customer order. The supply chain is currently not able to react to the
customer’s order. Customers expect delivery of their orders within 72 hours.
• Customers have limited involvement in Kraft Foods South Africa’s planning
and suppliers are not involved at all.
• Most of the causes of demand variability are driven by internal causes created
by Kraft Foods South Africa. These include financial forecast gap closure
strategies, price increases, planned and unplanned promotions. The end
result of all the demand variability created by all the promotional activities and
pricing is that Kraft does not have a good understanding of its baseline
business.
• Kraft is currently trying to forecast and not manage demand, because the
company does not understand the difference between baseline and
incremental volume. All the parties interviewed suggested, however, that Kraft
Foods should rather manage demand proactively.
• Other alternative demand data, for example, final consumer sales, is available
and can be obtained through negotiation with trade partners or needs to be
UUnniivveerrssiittyy ooff PPrreettoorriiaa eettdd –– VVaann ddeerr MMeerrwwee,, TT ((22000066))
261
purchased from the trade. Kraft Foods also needs to establish a more reliable
source of information with a split between baseline and incremental volume.
• The costs and implications of misalignment between supply and demand is
very high, for example ZAR 100 million of lost sales in 2004 (Erasmus, 2004)
and ZAR 0.4 million of stock write-offs in 2004 (Templeton, 2004). The
misalignment between supply and demand has also adversely affected Kraft’s
credibility and relationship with the trade (Erasmus, 2004).
• Not all the objectives and incentives of all objectives are aligned, for example,
the factory wants longer productions and a stable forecast while sales wants
shorter production runs and a flexible forecast (Erasmus, 2004). Some of the
performance measures are also not aligned, for example, the factory is not
penalised for constantly producing less than planned (Templeton, 2004).
• The frozen forecast horizon is for a period of one month which provides
stability to the factory in order to plan production (Van Blerk, 2005), (Erasmus,
2004), (Gess, 2004), (Devraj, 2004), (Parsons, 2004) (Templeton, 2004). The
forecast is frozen for one month due to production constraints, long lead time
of imported items and lead time from co-manufacturers and co-packers
(Templeton, 2004).
• The supply chain of Kraft Foods South Africa is currently more complex than
that of most Kraft units (Van Blerk, 2005), (Erasmus, 2004), (Gess, 2004),
(Devraj, 2004), (Parsons, 2004) (Templeton, 2004). The main reasons for the
additional complexity are more product items, bigger variety of product types
and technology, more customer delivery points, various routes to markets, the
bigger geographical area covered, the old and outdated systems, high staff
turnover, complexity of promotions, transportation network and the local
production dynamics and complexity.
• In some cases, Kraft Foods differentiates between the service levels of
products and customers, for example, better service for key customers. The
profitability of products is well understood while the productivity of customers
is not. Kraft needs to maintain a better service level on high profit items.
• There are different forecast targets which create confusion throughout the
supply chain.
UUnniivveerrssiittyy ooff PPrreettoorriiaa eettdd –– VVaann ddeerr MMeerrwwee,, TT ((22000066))
262
• The demand lead time gap could be reduced, for example, customers could
inform Kraft in advance what their estimated forecast is which could result in
an increase in forecast accuracy for the company.
• The demand and supply alignment within Kraft’s supply chain is improving, but
a lot of work still needs to be done. The immediate priority is to improve the
service level of 60% which will improve Kraft’s credibility with the trade.
The key findings taken from the interviews conducted concerning supply
management were the following:
• Kraft tries to differentiate between the service levels of products and
customers, for example, better service levels for key customers and high profit
items (Moses, 2004) (Herselman, 2004) (Van Zyl, 2005) (Templeton, 2004).
• The supply team also indicated that the forecast, and not the customer order,
is currently the trigger for the supply chain, because Kraft is currently unable
to react within 72 hours to the customer order alone.
• The supply lead time could be reduced, which would allow the supply chain to
react quickly to demand changes, for example, Moses (2004) and van Zyl
(2005) suggested changing the sourcing of raw materials and packaging from
international to local suppliers.
• Moses (2004) indicated that the production lead-time for the Tunney factory is
frozen for a period of one month. Moses (2004) added that the factory is
considering moving to a period of one week frozen forecast, which is the norm
in other Kraft units.
• The factory also agreed that not all the objectives and incentives of all the
departments are aligned which is evident from the low service level of 60 %
(Moses, 2004).
• The supply chain of Kraft Foods South Africa is more complex than that of
most Kraft units for several reasons, for example, the high number of small
volume items (Van Zyl, 2004).
• The customer and product portfolio of Kraft Foods South Africa should be
streamlined, for example, small volume and profit items should be removed.
• There are a few bottlenecks in the supply chain, which vary between
production and packing process constraints.
UUnniivveerrssiittyy ooff PPrreettoorriiaa eettdd –– VVaann ddeerr MMeerrwwee,, TT ((22000066))
263
• The factory is able to react to demand changes, although it might take as long
as a week. In order for the factory to be able to react to demand changes
sooner, changes need to be made to product, production and packaging
process designs which may require additional investment in machinery.
• The supply chain does have opportunities to pool risk, for example, regional
warehouses could be closed and converted to transhipment and cross-dock
warehouses (Templeton, 2004).
• Product and production design changes are required to make Kraft’s supply
chain even more reactive to demand changes (Greenslade, 2004).
• The supply management team also agree that the supply and demand
alignment process needs to improve for Kraft Foods South Africa.
The supply and demand within Kraft Foods South Africa’s supply chain needs to be
aligned in order to increase the customer service level of 60%, restore credibility with
the trade, improve the profitability of Kraft and reduce the working capital tied up in
the supply chain.
UUnniivveerrssiittyy ooff PPrreettoorriiaa eettdd –– VVaann ddeerr MMeerrwwee,, TT ((22000066))
264
CHAPTER 7: SUMMARY, CONCLUSION AND RECOMMENDATIONS
7 .1 In t roduct ion
The quality of a company’s supply chain performance can mean the difference
between business prosperity and failure (Gattorna, 1998: xiii). Cutting-edge supply
chains are double-edged swords. Wielded with skill, they can slice open new
markets. Improperly handled, they can lead to deep, self-inflicted wounds. For all the
advantages from getting the supply chain right, getting it wrong could be catastrophic
(Taylor, 2004:8).
7.2 L i tera ture research rev iew and research des ign
The aim of the descriptive research study is to find the causes and solutions of
aligning supply and demand within a supply chain. The research study focuses
specifically on the alignment between supply and demand within Kraft Foods South
Africa’s supply chain. The research design was done under actual environmental
conditions.
There is extensive literature available concerning the importance of aligning the
demand and supply side of the supply chain. Most of the literature identifies the
major benefits of an improved alignment between the supply and demand within any
supply chain. However, little research has been done on the alignment of the supply
and demand within a supply chain (Cooper and Schindler, 2003: 152-153).
Secondary literature and structured interviews were used to collect research data on
the alignment of supply and demand within a supply chain. The first step in the
research study was to identify secondary literature inside and outside Kraft Foods
South Africa involving the alignment of supply and demand within a supply chain.

UUnniivveerrssiittyy ooff PPrreettoorriiaa eettdd –– VVaann ddeerr MMeerrwwee,, TT ((22000066))
265
Structured interviews were also done in order to seek information from people
experienced in the alignment of supply and demand within a supply chain. Various
structured interviews were conducted with key people within Kraft Foods South
Africa’s supply chain, to determine the causes and solutions of the misalignment
between supply and demand within the supply chain. The structured interviews were
conducted from December 2004 to May 2005 at the Woodmead and Elandsfontein
offices with the following departments in Kraft Foods South Africa: sales, marketing,
procurement, production, production planning, customer services and logistics
operations. During the personal and telephonic interviews various open and closed
questions were asked to determine the answers. The research conclusions were
finally limited to those for which the data provided adequate answers.
The supply chain of Kraft Foods South Africa is struggling with the classic symptoms
of a mismatch between supply and demand – low sales forecast accuracy, high and
aging inventory, as well as low customer service. In 2004, for example, Kraft Foods
South Africa lost ZAR 100 million in sales and also wrote off ZAR 0.4 million of
finished goods stock (Templeton, 2004) (Erasmus, 2004). The misalignment between
supply and demand has also adversely affected Kraft’s credibility and relationship
with the trade (Erasmus, 2004).
The difficulty of managing supply chains comes primarily from the complexity that
creeps into their structure and the variability that characterises their flows (Taylor,
2004:21). Any business has to be willing to make hard choices about which
customers and products are right for the supply chain, and also modify those
practices that are deeply ingrained in the company’s corporate culture (Taylor,
2004:278). The Pareto, or 80/20 rule, can provide the basis for developing a more
cost- effective service strategy (Christopher, 1998:56). The highest service should be
given to key customers and key products (Christopher, 1998:57). Most of the
respondents indicated that the supply chain of Kraft Foods South Africa is currently
more complex than most Kraft units. The main reasons for the additional complexity
are more product items, bigger variety of product types and technology, more
customer delivery points, various routes to markets, the bigger geographical area
covered, the old and outdated systems, high staff turnover, complexity of promotions,
transportation network and the local production dynamics and complexity. Most of the
UUnniivveerrssiittyy ooff PPrreettoorriiaa eettdd –– VVaann ddeerr MMeerrwwee,, TT ((22000066))
266
respondents added that the customer and product portfolio of Kraft Foods South
Africa should be streamlined, for example, small volume and profit items should be
removed. Kraft Foods South Africa, for example, could differentiate between the
service levels of products and customers, by providing better service levels for key
customers and high profit items. Most of the respondents also mentioned a few
bottlenecks in the supply chain that should be removed, which vary between
production and packing process constraints. Some respondents also indicated that
the supply chain does have opportunities to pool risk, for example, regional
warehouses could be closed and converted to transhipment and cross-dock
warehouses. The respondents also mentioned that most of the causes of demand
variability are driven by internal causes created by Kraft Foods South Africa itself.
These include financial forecast gap closure strategies, price increases, planned and
unplanned promotions. The end result of all the demand variability created by all the
promotional activities and pricing is that Kraft does not have a good understanding of
its baseline business.
Most attempts to freeze the production schedule are relatively unsuccessful (Harmon
& Peterson, 1990:215). Exceptional swings of market demand will always occur, and
the superior manufacturer must be prepared to take exceptional action in response
(Harmon & Peterson, 1990:216). It is thus better if the forecast is not frozen. If all the
available information is utilised, if updates could be provided as soon as
circumstances change, then inventories could be better managed, and ultimately, the
customer could be better served (Riehm and Stephen, 1999:18). The true test of an
inventory management system is not merely in the planning and forecast stage, but
also in the ability to re-plan and react. The ability to re-plan and react is the essence
of management control (Kobert, 1992:165-166). The respondents mentioned that the
current frozen forecast horizon for Kraft Foods South Africa is one month. The
forecast is frozen for one month due to production constraints, long lead-time of
imported items and lead-time from co-manufacturers and co-packers. The
respondents added that the factory is considering moving to a period of one week
frozen forecast, which is the norm in other Kraft units.
The weak link in the build-to-stock model is a company’s reliance upon sales
forecasts. A build-to-order model, on the other hand, begins with the order and not
UUnniivveerrssiittyy ooff PPrreettoorriiaa eettdd –– VVaann ddeerr MMeerrwwee,, TT ((22000066))
267
the forecasts (Chase, Aquilano and Jacobs, 2001:549). The respondents in the
supply team warned that the forecast, and not the customer order, is currently the
trigger for Kraft Foods South Africa’s supply chain, because Kraft is currently unable
to react within 72 hours to the customer order alone.
Although the phrase “supply chain management” is now widely recognised, it could
be argued that it should really be termed “demand chain management” to reflect the
fact that the chain should be driven by the market, not by the suppliers (Christopher,
1998:18). The aim of any company should be to convert its supply chain from push to
pull by responding to customer demand. Technology is used to link the supply chain
(Hughes, Ralf and Michels, 1999:163). Most respondents agreed that Kraft should
move away from using factory shipment data as the basis for its forecast data to
actual consumer sales, in order to plan and react to the real consumer trends. If
demand is managed, Kraft will also be less dependent on forecasts which are always
wrong.
The key to getting sustained cooperation across the supply chain is to align
everyone’s incentives (Taylor, 2004:272). The mission of supply chain management
is to create a ‘one-plan’ mentality within the business which seeks to replace the
conventional stand-alone and separate plans of marketing, distribution, production
and procurement. Supply chain management is therefore an integrative concept that
seeks to develop a system-wide view of the firm (Christopher, 1998:14). The
respondents added that not all the objectives and incentives of the various
departments within Kraft Foods South Africa are aligned, for example, the factory
wants longer productions and a stable forecast, while sales wants shorter production
runs and a flexible forecast (Erasmus, 2004). Some of the performance measures
are also not aligned, for example, the factory is not penalised for constantly
producing less than planned (Templeton, 2004). The respondents also added that
the various and different forecast targets create confusion throughout the supply
chain. A key to supply chain integration is the open flow of information from one end
of the pipeline to another. By sharing information, supply chain partners are able to
respond more rapidly to known demand and to do with less inventory in the system
as a whole and, hence, at lower costs (Christopher, 1998:248). The respondents
UUnniivveerrssiittyy ooff PPrreettoorriiaa eettdd –– VVaann ddeerr MMeerrwwee,, TT ((22000066))
268
agreed that customers and suppliers should play a bigger role in the planning and
execution activities in Kraft Foods’ supply chain.
Matching supply and demand is the fundamental cornerstone of the logistics process.
(Christopher and Peck, 2003:85). Retailers and manufacturers in many product
categories have struggled to put together a match between supply and demand
(Gattorna, 1998:171). The costs of a mismatch between the supply and demand,
measured as the combination of inventory carrying costs, markdown costs and
stockout costs, are growing in many industries. Companies have tried to reduce
these costs through better demand forecasting, improved production and inventory
planning, increased production capacity and reduced set-up and transportation lead
times. Companies have also tried to manage the demand process through pricing
policies intended to smooth the arrival pattern of customers. These approaches,
while useful, have failed to address a number of drivers of supply-demand mismatch
(Gattorna, 1998:172).
Most organisations face a fundamental problem: the time it takes to procure, make
and deliver the finished product to a customer is longer than the time the customer is
prepared to wait for it. This is the basis of the lead-time gap (Christopher, 1998:167).
This gap could be reduced by shortening the logistics lead time whilst simultaneously
trying to move the customer’s order cycle closer by gaining earlier warning of
requirements through improved visibility of demand (Christopher, 1998:169). The
benefits of reducing the lead-time gap within a supply chain include higher customer
service, higher customer responsiveness, an improvement in the balance between
supply and demand and a reduction in inventory (Gattorna, 1998:158-160).
Firstly, a company should investigate various options to reduce the demand lead-
time within its supply chain. Most of the demand volatility within a supply chain is
often introduced by organisations through their own policies and procedures.
Consequently, it is within a company’s capability to control and influence the demand
volatility within its supply chain (Gattorna, 1998:153). Sharing sales information, for
example, could counter the so-called ‘bullwhip effect’ which is essentially the
phenomenon of demand volatility amplification along the supply chain, from the
retailers, distributors, manufacturers, and the manufacturers’ suppliers, and so on.
UUnniivveerrssiittyy ooff PPrreettoorriiaa eettdd –– VVaann ddeerr MMeerrwwee,, TT ((22000066))
269
(Lee, So and Tang, 2002:626). The respondents mentioned various ways to reduce
the demand lead time gap, for example, customers could inform Kraft in advance
what their estimated forecast is which could result in an increase in forecast accuracy
for the company. Most of the respondents also added that consumer demand data is
currently available and could be obtained from most of the major trade customers of
Kraft Foods South Africa.
Secondly, a company should investigate various options to reduce the supply lead-
time within its supply chain. Examples of strategies that could reduce supply lead
time include the following: removing activities that only add cost (Christopher,
1998:116); improving the frequency, accuracy and reliability of deliveries
(Christopher, 1998:121); pooling risk and inventory of various stock locations (Taylor,
2004:301); removing slowdowns and queues in the supply chain (Taylor, 2004:299);
simplification, commonality and standardisation throughout the supply chain (Taylor,
2004:308), (Kobert, 1992:91), (Harmon, 1992:170), (Hughes, Ralf and Michels,
1999:50), (Harmon & Peterson, 1990: x-xii), (Chase, Aquilano and Jacobs, 2001:151-
152); the use of modularity in product design (Taylor, 2004:308-309); balancing the
flow, and not the capacities, of product through the system (Chase, Aquilano and
Jacobs, 2001:668); and postponing the final configuration or assembly of the product
until the actual customer requirement is known (Christopher, 1998:210). There is a
fundamental shift in supply chains from the economies of scale, which is volume-
based and implies long production runs with few change-overs, to the economies of
scope which is based upon producing small quantities of a wider range, hence
requiring more change-overs (Christopher, 1998:209). The respondents agreed that
the supply lead time could be reduced, which would allow the supply chain to react
quickly to demand changes, for example, Moses (2004) and van Zyl (2005)
suggested changing the sourcing of raw materials and packaging from international
to local suppliers. The factory is able to react to demand changes, although it might
take as long as a week. In order for the factory to be able to react to demand
changes sooner, changes need to be made to product, production and packaging
process designs which may require additional investment in machinery (Greenslade,
2004).
UUnniivveerrssiittyy ooff PPrreettoorriiaa eettdd –– VVaann ddeerr MMeerrwwee,, TT ((22000066))
270
The alignment of the supply and demand within Kraft Foods South Africa should
increase the customer service level from 60%, restore credibility with the trade,
improve the profitability of Kraft and reduce the working capital tied up in the supply
chain.
7 .3 Research object ives rev is i ted
The primary objective of the research was to identify the main causes of the
misalignment between the supply and demand within Kraft Foods South Africa’s
supply chain. The result of an improved match between the supply and demand
should result in a reduction in inventory, higher sales forecast accuracy and an
increase in the customer service level.
The main issues identified that cause the misalignment between the supply and
demand within Kraft Foods South Africa’s supply chain were the following:
• Kraft Foods South Africa’s supply chain is too complex. The
business currently has a lot of small volume items and customers
that simply add complexity but very little value and profit. The
complex business model has resulted in higher inventory, as well as
lower service levels and forecast accuracy.
• The demand pattern of Kraft Foods South Africa is too variable. The
high variability in the supply chain has been created mostly by the
internal push strategies to customers in order to achieve financial
volume targets and sales incentives. The high variability results in
the business carrying high inventory levels before peak sales
periods followed by an increase in the warehousing and distribution
costs.
• The supply chain of Kraft Foods South Africa has been designed
around the sales forecast and is currently over dependent on the
sales forecast, because the factory is unable to react to the
customer order within the required delivery time. Forecasts are
always wrong which results in the business either carrying too much
or too little stock.
UUnniivveerrssiittyy ooff PPrreettoorriiaa eettdd –– VVaann ddeerr MMeerrwwee,, TT ((22000066))
271
• The demand and supply forecasts for Kraft Foods South Africa’s
supply chain are frozen for a month. The business is unable to react
to any major demand and supply changes, resulting in incorrect
stock levels and poor customer service levels.
• Kraft Foods South Africa is using factory shipment data as the base
for its demand forecast data. The factory shipment includes all the
push sales strategy volumes and therefore does not agree with the
actual customer and finally consumer demand. The supply chain of
Kraft Foods will thus only react to the push sales strategy volumes
and not to the customer or final consumer demand changes. The
ongoing push strategies have resulted in poor customer service
levels as the business is forced to sell what it makes because it
cannot make what sells.
• All the stakeholders in Kraft Foods South Africa’s supply chain do
not have the same objectives and incentives. Companies,
departments and individuals will aim to achieve their own targets
and not the overall targets.
• Kraft Foods South Africa has several demand and supply plans and
targets which create confusion amongst the stakeholders of the
supply chain. The various stakeholders do not always know which
business plan they have align to. A supplier, for example, could be
making packaging for a finished goods item that Kraft wants to
discontinue in the next few months.
• The demand and supply changes are not shared amongst the
members of the Kraft Foods South Africa’s supply chain. A sudden
increase in the demand for a product of Kraft Foods South Africa,
for example, is only shared with suppliers when purchase orders are
placed, resulting in longer lead time and lower customer service
levels.
• Kraft Foods South Africa does not have ongoing plans to increase
the demand lead times and/or decrease the supply lead time of its
supply chain. Kraft Foods South Africa, for example, only obtains
customer sales forecasts for high peak periods. The sales forecasts
UUnniivveerrssiittyy ooff PPrreettoorriiaa eettdd –– VVaann ddeerr MMeerrwwee,, TT ((22000066))
272
and subsequent supply plans for the other periods are thus a
calculated guess.
The secondary objectives of the research were the following:
• To improve the supply and demand alignment for all partners within Kraft
Foods South Africa’s supply chain, including retail and wholesale
customers, as well as suppliers.
• To identify the best practices that could add value to all Kraft units
worldwide, in order to improve their alignment between demand and
supply.
The research also identified the following opportunities within Kraft Foods South
Africa’s supply chain:
• All partners within Kraft Foods South Africa’s supply chain need to
establish and share objectives, incentives and information. Demand
changes, for example, need to be shared with all partners to allow
the total supply chain to react quickly and effectively.
• Best practices were identified for Kraft Foods South Africa, as well
as for other Kraft units. These best practices form part of the
recommendations.
7.4 Recommendat ions
Given the results of the research study, the following recommendations are feasible,
practical, actionable and directly usable as inputs into the managerial decision-
making.
7.4.1 Decrease complexity in the supply chain
It is recommended that Kraft Foods South Africa should decrease the complexity of
its supply chain. Kraft should reduce and simplify its product range, customer base
and different production technologies, especially those with low volume and
UUnniivveerrssiittyy ooff PPrreettoorriiaa eettdd –– VVaann ddeerr MMeerrwwee,, TT ((22000066))
273
profitability levels. The reduction recommendations should be done using the 80/20
rule or Pareto Analysis. This will allow all resources within the supply chain to focus
only on key products and customers that really add value instead of accumulating
costs.
7.4.2 Decrease variability in the supply chain
Kraft Foods South Africa should work with all parties in the supply chain, internally
and externally, to decrease the variability within the supply chain. Variability in the
supply chain amplifies down the supply chain, while variability in demand amplifies
up the supply chain. The only real solution to the variability problem is thus for Kraft
to work together with its trading partners to remove variability across the chain, rather
than trying to cope on its own. Kraft could, for example, start sharing rolling forecasts
with its suppliers to reduce the variability of the supplier’s demand pattern. On the
other hand, Kraft should work together with its customers to obtain up-to-date
customer forecasts, thereby reducing the variability in its supply chain. Kraft Foods
should also critically review all business practices and policies that are the biggest
contributor to demand volatility like trade terms, promotions and financial budget
volume gap closure sales deals. By constantly sharing information, supply chain
partners will be able to respond more rapidly to known demand with fewer inventories
and at less cost.
7.4.3 Move from demand planning to demand management
Kraft is currently managing its demand reactively by focussing on demand planning.
The aim should rather be to manage demand and not simply forecast demand.
Customer price increases or promotions, for example, could be delayed if the factory
is unable to meet the potential demand increase before a price increase or
promotion. If demand is managed, Kraft will also be less dependent on forecasts,
which are always wrong.
UUnniivveerrssiittyy ooff PPrreettoorriiaa eettdd –– VVaann ddeerr MMeerrwwee,, TT ((22000066))
274
7.4.4 Changing the supply chain trigger from forecasts to actual consumer demand
The trigger for Kraft Foods South Africa’s supply chain is currently the forecasts.
Forecasts are always wrong; therefore the trigger for Kraft’s supply chain will always
be wrong, resulting in lost sales or over-stock situations. It is recommended that Kraft
Foods South Africa should start using actual consumer demand data in its
forecasting process, instead of factory shipment data. The actual consumer demand
is hidden between the factory shipment data and the final consumer sales data; for
example, factory shipment includes out-of-stock situations or special price
promotions to influence the trade to buy more than usual. If actual consumer demand
data is used, it will make Kraft’s supply chain less dependent on forecasts that are
always wrong. Kraft’s supply chain will gradually be converted from a push to a pull
supply chain where only the items that are selling are made. The actual consumer
data could be obtained through negotiation or acquisition from the various trade
partners. By obtaining actual consumer data, information could be used to replace
inventory in Kraft’s supply chain.
7.4.5 Unfrozen forecast horizon
It is recommended that Kraft should not have a frozen forecast horizon. Things do
change on the supply and demand side. An unfrozen demand forecast will ensure
that the supply side needs to be constantly aligned with the demand side of the
supply chain. The constant and ongoing alignment between supply and demand will
ensure that the business can react to business opportunities that arise and the
supply side of the business will only make items that are really required. The true test
of an aligned supply chain is its ability to re-plan and react to changes.
7.4.6 Aligning objectives and incentives of all participants in the supply chain
The objectives and incentives of all participants in the supply chain should be
aligned. All internal and external supply chain partners should have objectives and
UUnniivveerrssiittyy ooff PPrreettoorriiaa eettdd –– VVaann ddeerr MMeerrwwee,, TT ((22000066))
275
incentives that encourage supply and demand alignment in the supply chain. Sales,
for example, should not receive incentives for selling more than the forecasted
volumes, but should rather have sales forecast accuracy as an objective. The factory
on the supply side, should also not try to achieve maximum plant compliance through
long production runs. The plant should rather focus on making what is required in
smaller batch sizes and should also receive incentives to react quickly to demand
changes.
7.4.7 Create one plan
The business should combine the various financial and business forecasts into one
realistic business forecast. This one plan will ensure that all parties within the supply
chain are aligned to only one plan. All progress concerning this one realistic plan
should be tracked on a regular basis and corrective action should be taken if
necessary.
7.4.8 Reduce the supply chain lead time gap
It is recommended that Kraft should reduce the supply chain lead-time gap by
reducing the supply lead-time, whilst simultaneously obtaining earlier warning of
customer requirements through improved visibility of demand. Any reduction in lead-
time will result in higher sales forecast accuracy and therefore alignment between
supply and demand. Demand lead-time can be reduced by obtaining actual
consumer sales data, thereby obtaining earlier visibility of actual consumer demand.
Examples of strategies that could reduce supply lead time include the following:
removing activities that only add cost, improving the frequency, accuracy and
reliability of deliveries, pooling risk and inventory of various stock locations; removing
slowdowns and queues in the supply chain; simplification, commonality and
standardisation throughout the supply chain; the use of modularity in product design;
balancing the flow, and not capacities, of product through the system; and
postponing the final configuration or assembly of the product until the actual
customer requirement is known.
UUnniivveerrssiittyy ooff PPrreettoorriiaa eettdd –– VVaann ddeerr MMeerrwwee,, TT ((22000066))
276
The above- mentioned recommendations should improve the alignment between the
supply and demand in Kraft Foods South Africa. The improved alignment will result in
higher customer service levels, higher forecast accuracy, and an overall reduction in
inventory and costs throughout the supply chain.
7 .5 L imi ta t ions of the research
All research studies have certain limitations caused by financial budget, time or other
constraints. Some of the limitations encountered during the research study were the
following:
• Limited experience: The researcher has had limited experience in the subject
of aligning the supply and demand within a supply chain. Previous work
experience includes some parts of the demand and supply side of the supply
chain, but no extensive experience of aligning the supply and demand of the
supply chain.
• Limited access to other companies: Due to the sensitive nature of the
research and information, the research was limited to academic research, as
well as reports published by Kraft Foods for internal and external use.
• The research was limited to Kraft Foods South Africa. The principles of the
demand and supply alignment could be applied to other Kraft units, the fast
moving consumer goods industry, as well as other industries battling with the
challenges of supply and demand alignment.
• No previous research on the supply and demand alignment within Kraft Foods
South Africa has ever been done. Secondary research material on Kraft Foods
South Africa was therefore very limited. Much of the secondary research
material is also not available to the public, because of confidentiality and the
sensitivity of the information.
UUnniivveerrssiittyy ooff PPrreettoorriiaa eettdd –– VVaann ddeerr MMeerrwwee,, TT ((22000066))
277
7.6 Benef i ts o f the s tudy and fu ture research
The research study on supply and demand alignment within a supply chain could be
beneficial to the following individuals:
Academics could use the research study as a point of reference if they wish to
expand their research on the topic. Only the key theoretical principles will be
available to the public, due to the confidential nature of the study.
• The management team within the Centre of Excellence of Kraft Foods Inc.
may decide to apply the findings and best practices to other Kraft Foods units.
• Decision- makers for small, medium and large companies struggling to align
the supply and demand within their supply chains could apply the findings and
recommendations.
It is foreseen that this research project will inspire future research projects. Some
examples include the following:
• A follow-up research project to move from the design phase of supply and
demand alignment to the implementation phase, for example, implementing
collaborative demand and replenishment planning with a key trade partner.
• Developing a supply and demand alignment evaluation checklist, key
performance indicators and corrective action for the fast moving consumer
goods market and other interested industries.
UUnniivveerrssiittyy ooff PPrreettoorriiaa eettdd –– VVaann ddeerr MMeerrwwee,, TT ((22000066))
278
BIBLIOGRAPHY
Anderson, D.L. & Delattre, A.L. 2002. 5 Predictions that will make you rethink your
supply chain. Supply Chain Management Review. 6:5:24
Berger, A.J. & Gattorna, J. 2001. Supply Chain Cybermastery: building high performance supply chains of the future. Aldershot: Gower Publishing.
Bonomo, C. 2003. Forecasting from the centre of the supply chain. Journal of Business Forecasting Methods & Systems. 22:1:3
Booyens, U. & Rozkydal, E. 2004. Kraft Foods South Africa Customer Services Policy version 4.1. Prepared October. Published 2 November. 1-88.
Brokke, A. Marketing Manager – Biscuits and Confectionery. Kraft Foods South
Africa. Interview on the alignment of supply and demand within a supply chain. 19
April 2005
Burruss, J., Kuettner, D. 2003. Forecasting for short-lived products: Hewlett-
Packard’s journey. Journal of Business Forecasting Methods & Systems. 21:4:9
Catron, H.A. 2000. Daily demand forecasting at Columbia Gas. Journal of Business Forecasting Methods & Systems. 19:2:10
Chase, R.B., Aquilano, N.J. Jacobs, F.R. 2001. Operations Management for competitive advantage. 9th ed. New York: McGraw-Hill Irwin
Chetty, P. Packaging Purchasing Manager. Kraft Foods South Africa. Interview on
the alignment of supply and demand within a supply chain. 19 April 2005
Christopher, M. 1998. Logistics and Supply Chain Management: Strategies for reducing cost and improving service. 2nd ed. London: Financial Times
Professional
UUnniivveerrssiittyy ooff PPrreettoorriiaa eettdd –– VVaann ddeerr MMeerrwwee,, TT ((22000066))
279
Christopher, M. & Peck, H. 2003. Marketing Logistics. 2nd ed. Oxford: Butterworth-
Heinemann
Cook, M. & Tyndall, R. 2001. Lessons from the leaders. Supply Chain Management Review. 5:6:22
Cooper, D.R. & Schindler, P.S. 2003. Business Research Methods. 8th ed.
Singapore: McGraw-Hill/Irwin Company.
Covey, S.R. 1990. The seven habits of highly effective people: restoring the character ethic. New York: Fireside.
De Bono, E. 1998. Simplicity. London: Penguin Books
Derrick, D.R. 2003. Challenging the Bullwhip Effect with Advanced Information
Sharing. Outlook Point of View, March 2003.
http://www.accenture.com/xdoc/en/ideas/outlook/pov/infosharing_usltr.pdf Accessed: 15 January 2005
De Swardt, A. 2004. Customer Services, Logistics and Procurement. Kraft Foods
South Africa. Personal communication. 1 June 2004.
De Swardt, A. Director Customer Services, Logistics and Procurement. Kraft Foods
South Africa. Interview on the alignment of supply and demand within a supply chain.
10 May 2005
Devraj, A. 2004. National Sales Manager. Kraft Foods South Africa. Interview on the
alignment of supply and demand within a supply chain. 22 December 2005
Erasmus, J. 2004. National Account Manager Spar. Kraft Foods South Africa.
Interview on the alignment of supply and demand within a supply chain. 20
December 2004
UUnniivveerrssiittyy ooff PPrreettoorriiaa eettdd –– VVaann ddeerr MMeerrwwee,, TT ((22000066))
280
Fisher, M.L. 1997. What is the right supply chain for your product? Harvard Business Review. 75:2:105.
Fosnaught, K. 1993. The strategic power of consensus forecasting: setting your
organisation up to win. Journal of Business Forecasting Methods & Systems. 18:3:3
Gardiner, M. Raw Material Purchasing Manager. Kraft Foods South Africa. Interview
on the alignment of supply and demand within a supply chain. 22 April 2005
Gattorna, J. 1998. Strategic Supply Chain Alignment: Best Practice in Supply
Chain Management. Hampshire: Gower Publishing. Gattorna, J.L. & Walters, D.W. 1996. Managing the supply chain: a strategic perspective. Hampshire: Macmillan Press.
Gess, G. 2004. National Accounts Manager Metcash. Kraft Foods South Africa.
Interview on the alignment of supply and demand within a supply chain. 20
December 2004.
Gilliland, M. 2004. Alternative metrics for forecasting performance. Journal of Business Forecasting Methods & Systems. 22:4:17
Gilliland, M. 2003. Fundamental issues in business forecasting. Journal of Business Forecasting Methods & Systems. 22:2:7
.
Gilliland, M. 2002. Forecasting a waste of time? Supply Chain Management Review. 6:4:16.
Goldratt, E.M. 1990. Theory of constraints. New York: North River Press.
Greenslade, R. 2004. Manufacturing Maintenance Manager. Kraft Foods South
Africa. Interview on the alignment of supply and demand within a supply chain. 28
December 2004
UUnniivveerrssiittyy ooff PPrreettoorriiaa eettdd –– VVaann ddeerr MMeerrwwee,, TT ((22000066))
281
Grove, L. National Key Account Manager – Shoprite Checkers, Kraft Foods
South Africa. Interview on the alignment of supply and demand within a supply chain.
20 April 2005
Halevi, G. 2001. Handbook of production management methods. Oxford:
Butterworth-Heinemann.
Hannon, D. 2003. Demand forecasting rises on logistics’ radar screens. Purchasing.
132:12:55
Harmon, R.L. & Peterson, L.D. 1990. Reinventing the factory: productivity breakthroughs in manufacturing today. New York: The Free Press
Harmon, R.L. 1992. Reinventing the factory II: managing the world class factory.
New York: The Free Press
Harvard Business Review on managing the value chain. 2000. Boston: Harvard
Business School Press
Harvey, S. 2004. Is the collaborative planning forecasting and replenishment model (CPFR) applicable to the South African consumer goods market? Executive Summary. [email protected] 072-569-1010 Email dated 14 March
2004 from Claire Welsh, Customer Services Manager, Cheltenham, United Kingdom,
Kraft Foods
Herselman, J. 2005. Production Manager. Kraft Foods South Africa. Interview on the
alignment of supply and demand within a supply chain. 4 January 2005
Hoekstra, S. & Romme, J. 1992. Integral logistics structures: developing customer oriented goods flow. London: McGraw-Hill Book Company
Horne, S. Demand Planner. Kraft Foods South Africa. Interview on the alignment of
supply and demand within a supply chain. 19 April 2005
UUnniivveerrssiittyy ooff PPrreettoorriiaa eettdd –– VVaann ddeerr MMeerrwwee,, TT ((22000066))
282
Hughes, J., Ralf, M. & Michels, B. 1999. Transform your supply chain. London:
International Thomson Business Press.
Iliffe, B. Retail Sales Manager. Kraft Foods South Africa. Interview on the alignment
of supply and demand within a supply chain. 21 April 2005
Jain, C.L. 2002. 10 step approach to win the support of top management for a
forecasting function. Journal of Business Forecasting Methods & Systems. 21:2:2
Jain, C.L. 2003. Benchmarking forecasting errors. Journal of Business Forecasting Methods & Systems. 22:3:18
Jain, C.L. 2003. Benchmarking forecasting models. Journal of Business Forecasting Methods & Systems. 22:3:16
Jain, C.L. 2003. Benchmarking the forecasting process. Journal of Business Forecasting Methods & Systems. 22:3:11
Jain, C.L. 2003. Business forecasting in the 21st century. Journal of Business Forecasting Methods & Systems. 22:3:3
Jain, C.L.2003. Benchmarking forecasting models. Journal of Business Forecasting Methods & Systems. 22:3:16
Jain, C.L.2004. How to measure the cost of a forecast error. Journal of Business Forecasting Methods & Systems. 22:4:2
Jain, C.L. 1994. Ready or not, here comes vendor managed inventory program.
Journal of Business Forecasting Methods & Systems. 13:2:2
Jain, C.L. 2004. How to measure the cost of a forecast error. Journal of Business Forecasting Methods & Systems. 22:4:2
UUnniivveerrssiittyy ooff PPrreettoorriiaa eettdd –– VVaann ddeerr MMeerrwwee,, TT ((22000066))
283
Jain, C.L. 1994. Ready or not, here comes vendor managed inventory program.
Journal of Business Forecasting Methods & Systems. 13:2:2
Johnson, S. 2002. Key to a successful closed loop forecasting process. Journal of Business Forecasting Methods & Systems. 21:2:8
Kahn, K.B. 2002. How to use a “golf” game to enhance the forecasting process.
Journal of Business Forecasting Methods & Systems. 21:2:8
Kaplan, R.S. & Norton, D.P. 1996. The balanced scorecard: translating strategy into action. Boston: Harvard Business School Press
Kiely, D.A. 1999. Synchronizing supply chain operations with consumer demand
using customer data. Journal of Business Forecasting Methods & Systems. 17:4:3
Kobert, N. 1992. Managing inventory for cost reduction. Englewood Cliffs:
Prentice Hall
Kraft Foods Inc. 2005. History. http://164.109.46.215/100/index.html Accessed: 15
January 2005
Kraft Foods Inc. 2004. “Kraft Foods Inc. Profile”. Kraft Foods Inc.
http://164.109.46.215/profile/index.html Accessed: 14 January
Kraft Foods Inc. 2004. 2003 Annual Report.
http://164.109.46.215/investors/annual.html Accessed: 14 January 2005
Kraft Foods. 2004. “Kraft Foods Inc. reports 2003 results and announces sustainable
growth plan”. http://www.corporate-
ir.net/ireye/ir_site.zhtml?ticker=KFT&script=410&layout=0&item_id=488662
Accessed: 14 January 2004
UUnniivveerrssiittyy ooff PPrreettoorriiaa eettdd –– VVaann ddeerr MMeerrwwee,, TT ((22000066))
284
Kubheka, Z. 2005. Master Production Scheduler. Kraft Foods South Africa. Interview
on the alignment of supply and demand within a supply chain. 4 January 2005
Langabeer, J. & Stoughton, T. 2001. Demand planning and forecasting in the high
technology industry. Journal of Business Forecasting Methods & Systems. 20:1:7
Langenwalter, G. 2000. Enterprise resource planning and beyond: integrating your entire organisation. Florida: CRC Press LCC
Lapide, L. 2003. Benchmarking and its value. Journal of Business Forecasting
Methods & Systems. 22:3:8
Lapide, L. 2003. Demand forecasting can support enterprise performance
management. Journal of Business Forecasting Methods & Systems. 22:1:19
Lapide, L. 1997. Developments in demand forecasting from ancient Greeks to
present. Journal of Business Forecasting Methods & Systems. 16:3:32
Lapide, L. 2004. Make the baseline forecast your trusted advisor. Journal of Business Forecasting Methods & Systems. 22:4:21
Lapide, L. 2000. Debunking executive conventional wisdom. Journal of Business Forecasting Methods & Systems. 19:2:16
.
Lapide, L. 2003. Organising the forecasting department. Journal of Business Forecasting Methods & Systems. 22:2:20
Lapide, L. 2003. Where should the forecasting function reside? Journal of Business Forecasting Methods & Systems. 21:4:15
Lee, H.L., So, K.C. & Tang, C.S. 2002. The value of information sharing in a two-
level supply chain. Management Science. 46:5:626
UUnniivveerrssiittyy ooff PPrreettoorriiaa eettdd –– VVaann ddeerr MMeerrwwee,, TT ((22000066))
285
Leenders, M., Fearon, H.E., Flynn, A. & Johnson, P.F. 2002. Purchasing and Supply Management. 12th ed. Boston: McGraw-Hill Higher
Martha, J.A. & Vratimos, E. 2003. 7 Tips that help hedge against future supply chain
disruptions. Supplier Selection and Management Report. 3:3:5
Masinga, D. National Key Account Manager – Metro, Kraft Foods South Africa.
Interview on the alignment of supply and demand within a supply chain. 20 April 2005
May, T. 2002. Qualitative research in action. London: Sage Publications.
Miller, T. 2001. Hierarchical operations and supply chain planning. London:
Springer
Molelekoa, M. Demand Planner. Kraft Foods South Africa. Interview on the alignment
of supply and demand within a supply chain. 21 April 2005
Moses, O. Production Planning Manager. Kraft Foods South Africa. Interview on the
alignment of supply and demand within a supply chain. 23 December 2005
Moutton, J. 2001. How to succeed in your Master’s Doctoral Studies: a South African Guide and Resource Book. Pretoria: Van Schaik Publishers.
Naicker, T. Customer Services Manager. Kraft Foods South Africa. Interview on the
alignment of supply and demand within a supply chain. 19 April 2005
Ozturkmen, Z.A. 2000. Forecasting in the rapidly changing telecommunications
industry: AT&T’s experience. Journal of Business Forecasting Methods & Systems. 19:3:3
Parsons, N. 2004. Sales Director. Kraft Foods South Africa. Interview on the
alignment of supply and demand within a supply chain. 15 December 2004
UUnniivveerrssiittyy ooff PPrreettoorriiaa eettdd –– VVaann ddeerr MMeerrwwee,, TT ((22000066))
286
Patton, M.Q. 2002. Qualitative research and evaluation methods. 3rd ed.
California: Safe Publications
Petersen, H. 2004. Integrating the forecasting process with the supply chain: Bayer
Healthcare’s Journey. Journal of Business Forecasting Methods & Systems. 19:3:3
Ptak, C.A., Schragenheim, E. 2000. ERP tools, techniques and applications for integrating the supply chain. Florida: CRC Press LLC
Reary, B. 2002. A survivor’s guide to integrated demand and supply. Journal of Business Forecasting Methods & Systems. 21:2:3
Reary, B. 2001. Return on Relationship: A Different Lens on Business.
http://www.ascet.com/documents.asp?grID=149&d_ID=436 Accessed: 15 January
2005
Redelinghuys, T. Plant Director, Kraft Foods South Africa. Interview on the alignment
of supply and demand within a supply chain. 21 April 2005
Reeder, G. & Rowell, T. 2001. Integration of supply chain with demand planning –
Tropicana’s journey. Journal of Business Forecasting Methods & Systems. 20:3:3
.
Riehm, S.R. & Stephen, R. 1999. Melting the frozen forecast. Journal of Business Forecasting Methods & Systems. 17:4:15
Riley, M, Wood, R.C., Clark, M.A., Wilkie, E., & Szivas, E. 2000. Researching and writing dissertations in business and management. London: Thomson Learning.
Sagar, N. 2004. CPFR at Whirlpool Corporation: two heads and an exception engine. Journal of Business Forecasting Methods & Systems. 22:4:3
UUnniivveerrssiittyy ooff PPrreettoorriiaa eettdd –– VVaann ddeerr MMeerrwwee,, TT ((22000066))
287
Sandwick, S. Marketing Director. Kraft Foods South Africa. Interview on the
alignment of supply and demand within a supply chain. 21 April 2005
Sarulis, A. Procurement Manager. Kraft Foods South Africa. Interview on the
alignment of supply and demand within a supply chain. 22 April 2005
Schofield, M. National Key Account Manager – Pick ‘n Pay, Kraft Foods South Africa.
Interview on the alignment of supply and demand within a supply chain. 19 April 2005
Shapiro, J. 2002. Modeling Approaches for Supply Chain Decisions.
http://www.ascet.com/documents.asp?d_ID=1002 Accessed: 14 January 2005
Sherman, R.J. 1998. Collaborative planning, forecasting & replenishment (CPFR):
realising the promise of efficient consumer response through collaborative
technology. Journal of Marketing Theory & Practice 6:4:6
Schonberger, R.J. 1990. Building a chain of customers: linking business functions to create world class company. London: The Free Press
Silver, E.A., Pyke, D.F. & Peterson, R. 1998. Inventory management and production planning and scheduling. 3rd ed. New York: John Wiley & Sons, Inc.
Singhal, V. & Hendricks, K. 2002. How supply chain glitches torpedo shareholder
value. Supply Chain Management Review. 6:1:18
Song, H. & Triantis, J. 2003. Building alliance with clients: key to success in
forecasting. Journal of Business Forecasting Methods & Systems. 21:4:2
Strydom, A. Marketing Manager – Beverages and Other Grocery. Kraft Foods South
Africa. Interview on the alignment of supply and demand within a supply chain. 19
April 2005
Templeton, D. 2004. Logistics Operations Manager. Kraft Foods South Africa.
Personal communication. 4 March 2004.
UUnniivveerrssiittyy ooff PPrreettoorriiaa eettdd –– VVaann ddeerr MMeerrwwee,, TT ((22000066))
288
Templeton, D. 2004. Logistics Operations Manager. Kraft Foods South Africa.
Interview on the alignment of supply and demand within a supply chain. 15
December 2004
Taylor, D.A. 2004. Supply chains: a manager’s guide. Boston: Pearson Education
Valdero. 2002. From Planning to Control: Improving The High-Tech Supply Chain.
http://www.bettermanagement.com/library/library.aspx?libraryid=2567&pagenumber=
8 Accessed: 15 January 2005
Van Blerk, B. 2005. Wholesale Channel Sales Manager. Kraft Foods South Africa.
Interview on the alignment of supply and demand within a supply chain. 4 January
2005
Van Zyl, S. 2005. Production Manager. Logistics Operations Manager. Kraft Foods
South Africa. Interview on the alignment of supply and demand within a supply chain.
4 January 2005
Wall, B. 2002. Evolution in the forecasting process at Krispy Kreme. Journal of Business Forecasting Methods & Systems. 21:1:15
Welman, J.C, & Kruger, S.J. 2001. Research methodology: for the business and administrative sciences. 2nd ed. Oxford: Oxford University Press.
Wilson, N. Jnr. 2001. Game plan for a successful collaborative forecasting process.
Journal of Business Forecasting Methods & Systems. 20:1:3
Wild, T. 2002. Best practice in inventory management. 2nd ed. Cambridge,
England: Butterworths-Heinemann
Woerner, I. 2001. Minimizing the Cost of Managing Supply Chain Exceptions.
http://www.ascet.com/authors.asp?a_ID=536 Accessed: 15 January 2005

UUnniivveerrssiittyy ooff PPrreettoorriiaa eettdd –– VVaann ddeerr MMeerrwwee,, TT ((22000066))
289
Womack, J.P. & Jones. D.T. 1994. From lean production to the lean enterprise.
Harvard Business Review. 72:2:93
Yang, K.H. & Ruben, R.A.., Webster, S. 2003. Managing vendor inventory in a dual
level distribution system. Journal of Business Logistics. 24:2:91
UUnniivveerrssiittyy ooff PPrreettoorriiaa eettdd –– VVaann ddeerr MMeerrwwee,, TT ((22000066))
290
ANNEXURE A
University of Pretoria, Department of Business Management QUESTIONNAIRE ON THE ALIGNMENT OF THE SUPPLY AND DEMAND WITHIN A SUPPLY CHAIN
Introduction
The costs of a mismatch between supply and demand, measured as the combination
of inventory carrying costs, markdown costs and stock out costs, are growing in
many industries (Gattorna, 1998:172).
The benefits of reducing the supply-demand mismatch are enormous. Fewer
mismatches between supply and demand can lead to a significant increase in profits,
better customer service and therefore additional sales (Gattorna, 1998:172).
The aim of the research
The aim of the research is to determine the following:
• To identify the causes of the misalignment between the supply and
demand within Kraft Foods South Africa’s supply chain.
• To identify potential solutions that could improve the alignment between
the supply and demand within Kraft Foods South Africa’s supply chain.
Structured Interview - Demand management
People interviewed:
• Nigel Parsons, Sales Director, Kraft Foods South Africa.
• Barry Iliffe, Retail Sales Manager, Kraft Foods South Africa.
• Brian van Blerk, Wholesale Sales Manager, Kraft Foods South Africa.
• Alan Devraj, National Sales Manager, Kraft Foods South Africa.
• Marianne Schofield, National Key Account Manager – Pick ‘n Pay, Kraft Foods
South Africa.
• Louise Grove, National Key Account Manager – Shoprite Checkers, Kraft
Foods South Africa.
UUnniivveerrssiittyy ooff PPrreettoorriiaa eettdd –– VVaann ddeerr MMeerrwwee,, TT ((22000066))
291
• Don Masinga, National Key Account Manager – Metro, Kraft Foods South
Africa.
• Glenn Gess, National Key Account Manager – Metcash, Kraft Foods South
Africa.
• Erasmus, Jaco, National Key Account Manager – Spar. Kraft Foods South
Africa.
• Abrie de Swardt, Director Customer Services, Logistics and Procurement.
Kraft Foods South Africa.
• Dave Templeton, Logistics Operations Manager. Kraft Foods South Africa.
• Thinusha Naicker, Customer Services Manager. Kraft Foods South Africa.
• Sjanie Horne, Demand Planner. Kraft Foods South Africa.
• Sina Molelekoa, Demand Planner. Kraft Foods South Africa.
• Clive Sandwick, Marketing Director. Kraft Foods South Africa.
• Allan Strydom, Marketing Manager – Beverages and Other Grocery. Kraft
Foods South Africa.
• Angela Brokke, Marketing Manager – Biscuits and Confectionery. Kraft Foods
South Africa.
Questionnaire - Demand management
1. Which demand are you trying to forecast and why? Which other demand data
can be obtained?
• Customer supplied forecasts.
• Point- of- sales data.
• Customer warehouse movement data.
• Customer order data or
• Factory shipment data?
2. What is the trigger for the supply chain - the customer order or forecast?
3. To what extent do we involve customers and suppliers in the planning and
execution activities within our supply chain?
4. What are the causes of demand variability, for example, terms of trade,
promotions and pricing, specific company policies, distribution channel
structure, delays, and economies of scale?
5. Does the company try to forecast or manage demand?
UUnniivveerrssiittyy ooff PPrreettoorriiaa eettdd –– VVaann ddeerr MMeerrwwee,, TT ((22000066))
292
6. Which additional information, if obtained, could result in an increase in
forecast accuracy and decrease in inventory?
7. What are the costs and implications of the misalignment between supply and
demand, measured as the combination of inventory carrying costs, markdown
costs and stock out costs, versus target and have the costs increased or
decreased over the past year?
8. Do you think the individual, departmental and organisational objectives and
incentives of all departments are aligned? Why or why not?
9. Which portion of the demand forecast is frozen?
10. How complex is the supply chain versus other Kraft units, for example number
of sourcing plants, number of items on promotion, number of finished goods
SKUs, number of customers, number of warehouses?
11. Does the company differentiate service levels targets between products or
customers?
12. Does the company have various forecast targets, for example, sales targets
and financial targets, and which target is used to align supply and demand?
13. How can you reduce the demand lead-time gap, for example, earlier
notification of demand?
14. Please give me your view on the demand and supply alignment in Kraft Foods
South Africa?
UUnniivveerrssiittyy ooff PPrreettoorriiaa eettdd –– VVaann ddeerr MMeerrwwee,, TT ((22000066))
293
Structured Interview – Supply management
People interviewed:
• Thys Redelinghuys, Plant Director, Kraft Foods South Africa.
• Oliver Moses, Production Planning Manager, Kraft Foods South Africa.
• Zandi Kubheka, Master Production Scheduler, Kraft Foods South Africa.
• Ron Greenslade, Manufacturing Maintenance Manager Biscuits, Kraft Foods
South Africa.
• Stefanus van Zyl, Production Manager, Kraft Foods South Africa.
• Johan Herselman, Production Manager, Kraft Foods South Africa.
• Dave Templeton, Logistics Operations Manager. Kraft Foods South Africa.
• Abrie de Swardt, Director Customer Services, Logistics and Procurement.
Kraft Foods South Africa.
• Audrius Sarulis, Procurement Manager. Kraft Foods South Africa.
• Mark Gardiner, Raw Material Purchasing Manager. Kraft Foods South Africa.
• Preggie Chetty, Packaging Purchasing Manager. Kraft Foods South Africa.
Questionnaire – Supply management
1. Does the company differentiate between service levels targets between
products or customers?
2. What is the trigger for the supply chain - the customer order or forecast?
3. How can we decrease the supply lead-time?
4. Which portion of the production forecast is frozen?
5. Do you think the individual, departmental and organisational objectives and
incentives of all departments are aligned? Why or why not?
6. How complex is the supply chain versus other Kraft units, for example number
of sourcing plants, number of items on promotion, number of finished goods
SKUs, number of customers, number of warehouses?
7. Is the supply chain serving the right customers with the right products or
should the customer and product portfolio be streamlined?
8. Are there any major queues in the supply chain and why, for example, work-
in-progress at certain stages of the production process?

UUnniivveerrssiittyy ooff PPrreettoorriiaa eettdd –– VVaann ddeerr MMeerrwwee,, TT ((22000066))
294
9. How quickly can the factory react to demand changes? Which issues are
preventing the factory to react quicker?
10. What opportunities exist to pool risk, for example reducing stock locations?
11. Which product or production design changes could result in a more reactive
supply chain, for example, adding flavour at the end of the production process
instead of at the beginning?
12. Please give me your view on the demand and supply alignment in Kraft Foods
South Africa?
Top Related