


Languages
Pages
Legal

AFAMRL.TR-1-21
X
AIRCRAFT TRANSPARENCY OPTICAL QUALITY:NEW METHODS OF MEASUREMENT
LOUIS V. GENCO, O.D., Lt. Colonel
HARRY L. TASK, Ph.D.
FEBRUARY 1981 i
'1
Approved for public release; distribution unlimited.
AIR FORCE AEROSPACE MEDICAL RESEARCH LABORATORYLiJ AEROSPACE MEDICAL DIVISION
AIR F'ORCE SYSTEMS COMMANDWRIGHT-PArIERSON AIR FORCE BASE, OHIO 45433
ihen US Government drawings, erýar Icains, or other data ore used for svy pu-re other ihm a dedlnale redstodGovernmet procurement o0erafl the Governntent terby •wurs no rveatsfeAsil nor axy o•hl•tM Ion ,aftzemver,and tbo fwct that the Government may have formulated, krnioed, or In say t-y o. Xie. th• said drowiy-a, speeifl-cattons, or other data, is not to be regarded by fmpgleatsm or otwrwtse, as in =W manner ikenafn te hawar oriny other perso or corpuration, or coaveyln sany rights or permission to mimdctn',re, Use, Wr Sell aMy Pateu1sdinvention that may in sny way be related the reo.
Please do not request copies of this report Irom Air Force Aerosr we Medical Rebeareh lAboratozy. Additionalcoples may be purchased from:
National Tecb al Information Service523R Port Ftlo RoadSpringfield, Virginia 22161
Federal Government agenieos ac their contaesters reietered with i•enw Docutmtation Center should directrequests for copies of 016, report toz
Defense. Ecuventation CenterCameron StationAlex~rdrta, Virginla 22314
TECHNI'CAL REVIEW AND APPROVAL
AFAWII -TR-81- 21
This rerort has been reviewed by the Office of Public Afhirs A) &•d is -&msable to the National Technical
Information Service (NTIS). At NTIS, it will be avatlak'as to tht emrs' ,lic, bx'ling foreign nations.
This tthnic•u report has been reviewed ani 6i, approved for publlc~don.
FOR THE COMMANDER
dIESBAES, JR.
Chief
Human Engtoeering DiviskmAir Force Aerospace Medics! Research LaLoratory
AIR FORCE/5u780/2" Fe~ 1951 - 250
L 4
I,

SECURITT CLASSIFICATION OF THIS PAGE (When. Dae. Entered)
REPORT DOCUMENTA.TION PAGE READ INSTRUCTIONSREPORT________________PAGE_ BEFORE COMPLETING FORM
S/ -4--e"AMPRL - - 2. GOVT ACCESSION NO. 3. REC ENT'S CA'fALOG NUMBER
i 'AFAMRL-TR8l2l #9~A I L ad Subtitl0) '
J IRCRAFT JRANSPARZNCY aPTICAL JUALITY:! I Technical,EW METHODS OF MEASUREMENT I PER _ ORMI_ G - R N40 7 -7....... ... ...... . 'ERO ,H REPORT, NU BER'
7. A T H0 R,&,_S. CONTRACT OR GRANT NUMBER(*)
Louis V./Gencj 0. D.___.•arry L./Tas :i ' 4,,•E- 6,
9. PERFORMING ORGANIZATION NAME AND ADDRESS 10. PROGRAU 6eE T.PR .JECT. TASKAir Force Aerospace Medical Research Laboratory,
Aerospace Medical Division, Air Force Systems 62202F 7184 18-02Command, irlght-Patterson AFB, Ohio 45433
I1 CONTROLLING OFFICE NAME AND ADDRESS • 8Ait Force Aerospace Medical Research Laboratory // e b r_______81Aerospace Medical Division, Air Force Systems n- NUMBEROF PAGE
Command, Wright-Patterson AFB, Ohio 45433 3114. MONITORING AGENCY NAME & ADDOR.F C lloferent from Cnntrolling Office) IS. SECURITY CLASS. (of this report)
Unclassified15m. DECLASSIFICATION/DOWNGRAOING
SCHEDULE
IS. DISTRIBUTION STATEMENT (of this Report)
Approved for public release; distribution unlimited.
17. DISTRIBUTION STATEMENT (of the abettrac entered Izi Block 20, If different from Report)
18. SUPPLEMENTAr.Y NOTES
19. KEY WORDS (Continua on reverse aide if neceasary and Identify by block number)
Aircraft Windscreens Angular DeviationOptical Assessment Optical Quality
S* ABSTRACT (Continua qn reverse aide If neeeaaary and identify by block number)
>his report describes some traditional methods of measuring distortion in air-craft transparencies. A more expedient means of interpreting photographic dis-tortion data via computerized digital analysis of the photc is also described.Finally, two new devices are introduced: one that measures angular deviationwith extreme accuracy in a relatively small space and one that brings laboratoraccuracy to field optical measurements. These latter devices employ state-of-the-art components and knowledge to provide extreme accuracy and usefulness.
DD JAN 73 1473 EDITION OF I NOV 65 IS OBSOLETE
• ? , ••g ) RITY CLASSIFICATION OF THIS PAGE (When Data Enter
tram~~~~s HA~o. a.

PREFACE
The devices described in this document and the research which contributed to
their development were initiated by the Air Force Aerospace Medical Research
Laboratory (AFAMRL), Human Engineering Division, Wright-Patterson Air Force
Base, Ohio, under Work Unit 7184-18-02. Funding for this effort was pro-
vided by Air Force Wright Aeronautical Laboratories, Flight Dynamics Laboratory,
Vehicle Equipment ADP Branch. Computer software engineering and fabrication
support were provided by Systems Research Laboratories, Inc. {SRL), Dayton, Ohio.
The authors wish to express their appreciation to these individuals who
provided encouragement and assistance throughout this effort, including
Major Robert Eggleston, who contributed much to the initial idea; Ken Smith,
who designed and constructed the electronics in the angular deviation
receiver; and George Dabbs, who was responsible for much of the design and
fabrication of the devices.
Y . ... . .. .
I -.I
I
__.. .,. . - - -
TABLE OF CONTENTS
Section Page
1 INTRODUCTION 4
2 GRID BOARD PHOTOGRAPHY 5
ANALYSIS OF GRID BOARD PHOTOS, 6GRID LINE SLOPE
LENSING AND DISPLACEMENT GRADE 6
DIGITAL PROCESSING OF GRID BOARD PHOTOS 7
3 DIRECT MEASUREMENT OF ANGULAR DEVIATION 8
DESCRIPTION OF THE DEVICE 12
THEORY OF OPERATION 13
DE!IGN CONSIDERATIONS 16
OPERATIONAL EVALUATION 19
4 FIELD USABLE MEASUREMENT DEVICE 20
DESIRABLE CHARACTERISTICS 20
CLRRENT TECHNIQUES 21
EVOLUTION OF PORTABLE TRANSPARENCYOPTICAL TEST SYSTEM (P-TOTS) 22
REFERENCES 28
2

- .-.-.-..--.
LIST OF ILLUSTRATIONS
Figure Page
I Lateral Displacement and Angular DeviationEffects of Aircraft Transparencies 8
2 Pictorial Layout of Windscreen AngularDeviation Measurement Device 13
3 Target Pattern fir the Projector Half ofthe Angular Devittion Measurement Device 14
4 Intersection of the Image of the TargetPattern with the Vertical Channel CCD Array 14
5 Signal Output from the CCD Array Electronics Showingthe Pulses Resulting from the Intersection of theTarget Pattern Leg Segment and the CCD Array (A--B) 15
6 Projector-Receiver Ray Trace Showing MaximumDistance h1 Possible Without IncurringVignetting at Lens L2 Due to Diameter d 17
S7 Projector-Receiver Ray Trace for 50 percentVignetting Due to Lens L2 Diameter d2 18
8 Typical Indoor F-111 Photographic Configuration 21
9 Retroreflective Effect of Screen 23
10 Effective Gain of Retroreflective Screen as aFunction of Angle of Divergence in Degrees 24
11 Schematic of the Portable TransparencyOptical Test System (P-TOTS) 26
3
S~3
- L - ' ... .... ",--, .:72,----• .:-7•.7 •

Section1INTRODUCTION -
The optical "side effects" of aircraft trnprece include distortion,binocular distortion, angular deviation, displacement, haze, transmission
loss, multiple imaging, rainbowing (birefringence), and minor defects. Mostof the distortion related effects, as well as multiple imaging and bire-fringence are recorded using some type of grid board photographic technique.Haze and transmission loss are usually measured with a hazemeter under stan-
dard test conditions. Angular deviation may be measured with the aid of a
telescope (or theodolite) or a laser. This report will initroduce a new way
to examine some of the data obtained with standard photographic distortionmeasures and will describe two new devices which employ state-of-the-art
* methodology to obtain critical optical data from aircraft transparencies.
4
III
Section 2
GRID BOARD PHOTOGRAPHY
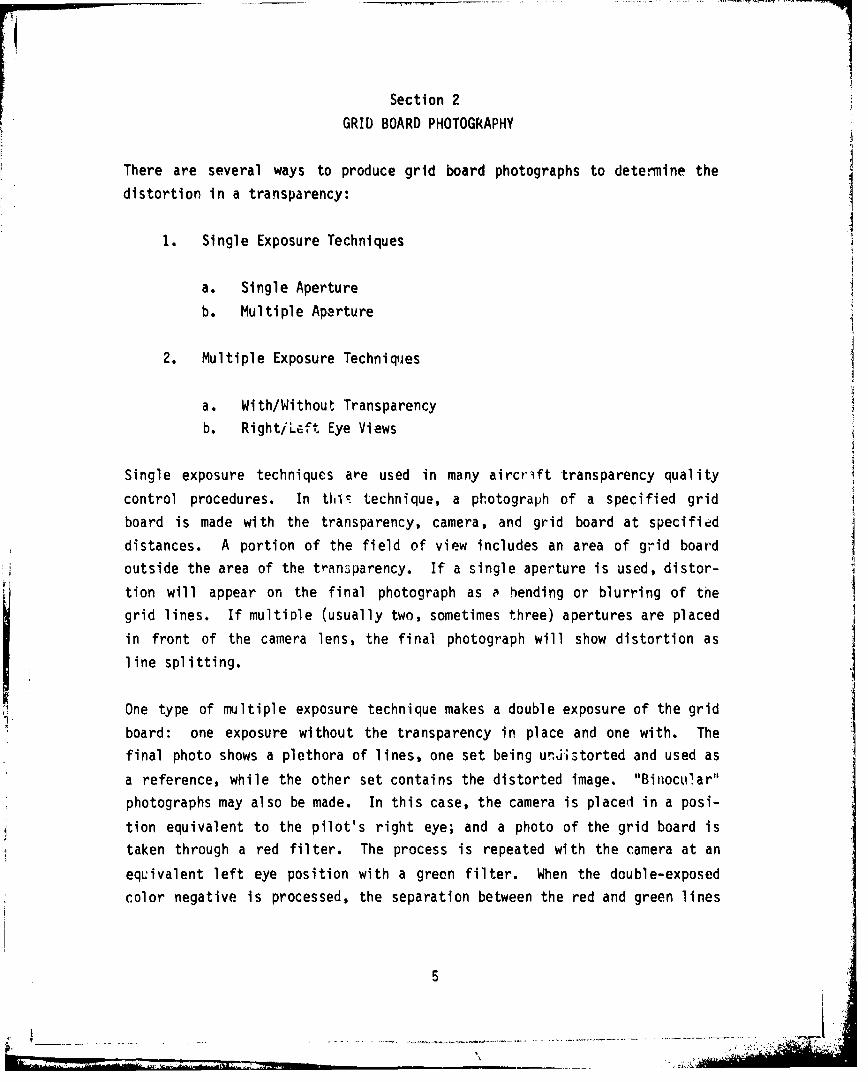
There are several ways to produce grid board photographs to determine the
distortion in a transparency:
1. Single Exposure Techniques
a. Single Aperture
b. Multiple Aperture
2. Multiple Exposure Techniques
a. With/Without Transparencyb. RightiLEft Eye Views
Single exposure techniques are used in many aircrift transparency quality
control procedures. In thi• technique, a photograph of a specified grid
board is made with the transparency, camera, and grid board at specified
distances. A portion of the field of view includes an area of grid board
outside the area of the transparency. If a single aperture is used, distor-
tion will appear on the final photograph as i bending or blurring of thegrid lines. If multiple (usually two, sometimes three) apertures are placed
in front of the camera lens, the final photograph will show distortion as
line splitting.
One type of multiple exposure technique makes a double exposure of the grid
board: one exposure without the transparency in place and one with. The
final photo shows a plethora of lines, one set being unJistorted and used as
a reference, while the other set contains the distorted image. "Binocular"
photographs may also be made. In this case, the camera is placed in a posi-
tion equivalent to the pilot's right eye; and a photo of the grid board istaken through a red filter. The process is repeated with the camera at an
equivalent left eye position with a green filter. When the double-exposedcolor negative is processed, the separation between the red and green lines
5
S. . ........
MEL--
indicates the "binocular residual distortion" which the visual system mustdeal with in order to maintain single simultaneous binocular vision.
ANALYSIS OF GRID BOARD PHOTOS, GRID LINE SLOPE
Once the photographs have been taken, the problem of analysis and interpre-
tation remains. A common method of reducing the data to a more understtsnd-
able format involves the determination of grid line slope. In this method,
the enlarged photograph is usually affixed to a drafting board and alignedsuch that undistorted grid lines are horizontal. Drafting instruments are
then used to measure the slope (deviation from true horizontal over a speci-
fic distance) of lines photographed through the transparency. This deter-
mination is made for several horizontal and vertical lines. The maximum
slope is recorded as a ratio, such as 1 in 10, indicating the tanget of the
angle between the distorted line direction and a true horizontal (or verti-
cal). Grid line slope c&n also be measured on a double eYposure by using
the undistorted grid as a reference.
LENSING AND DISPLACEMENT GRADE
A refinement of the grid line slope method is used to determine distortion
in F-111 windscreens. This refinement introduced two new concepts, those of
lensing and displacement grade (ATP 601-E, 1979).
Lensing or Lens Factor (LF) measures are made from the single aperture
single 'xposure photos described above. The baseline measure is a count of
grid squares per inch !n an undistorted portion of the picture. Several
similar counts of grids per inch are then made of grid areas photographed
through the windscreen. The most deviant of these latter counts is then
compared to the basel!i'e by dividing the larger number hy the smaller. The
result is then cubed to increase the "spread" between findings. This result
is designated as the Lens Factor.
Displacement Grade (DG) measures are made from the same photos used to
d termine LF. For any area of ;nterest, the maximum vertical displacement
6

of a horiznntal line is measured in hundredths of an inch. This value is
added to the maximum horizontal displacement of any vertical grid line. The
sum is then multiplied by 1000 to yield the Displacement Grade value for the
area measured.
DIGITAL PROCESSING OF GRID BOARD PHOTOS hII
A 1979 study undertaken by the University of Dayton Research Institute
(UDRI), while under contract to AFAMRL, indicated the greatest source of
error for measurements of this type lies in the physical measurement of the
grid line slope (Harris, 1981). There could exist a wide variability among
readings since the slopes are actually segments of curved lines rather than
straight lines, the ability to measure any set of lines repeatedly is a
matter of experience, and there is an inherent error in the draftitng instru-
ments. AFAMRL found a partial solution to this variability problem by
employing an electronic digitizer to sample salient portions of the photo-
graph. The technician simply places a "bug" consisting of a cross hair
under a magnifying lens on a series of grid line intersections. When align-
ment has been achieved, he presses a button to record the position of the"bug." This position is recorded to an accuracy of 0.005 inch and stored in
digital format in a computer. The digitized data are then processed by the
computer to yield Displacement Grade, Lens Factor, and grid line slope
values without the tedium of using drafting instruments and interpolating
thousandths of an inch from boxwood scales.
Investigation of the digitizer method showed that equivalent LF and DGreadings were obtained from photographs measi•ed by experienced quality
control personnel using the drafting instruments and relatively inexperi-
enced technicians using the digitizer. The greatest source of error in the
latter method appeared to be the tremor in the technician's hand! A sig-
nificant time savings was also realized by using the computer method.
Unfortunately, the main objection to any grid line slope measure made from a
photo still existed--the technician had to estimate a tangential position
for a distorted segment of a curve. In other words, if grid line slopp were
to be measured, where on the curved line should the bug be placed?
7
A "AL.-
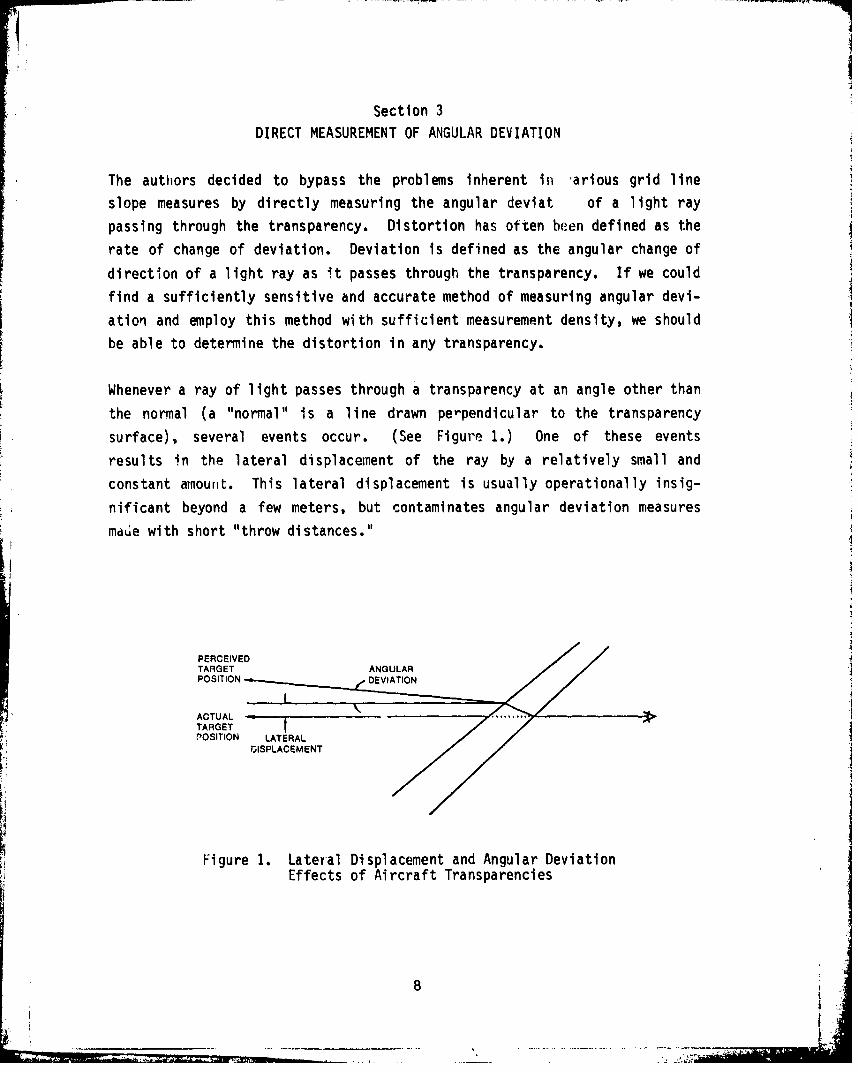
Section 3DIRECT MEASUREMENT OF ANGULAR DEVIATION
The authors decided to bypass the problems inherent in arious grid line
slope measures by directly measuring the angular deviat of a light ray
passing through the transparency. Distortion has often been defined as therate of change of deviation. Deviation is defined as the angular change of
direction of a light ray as it passes through the transparency. If we could
find a sufficiently sensitive and accurate method of measuring angular devi-
ationi and employ this method with sufficient measurement density, we shouldbe able to determine the distortion in any transparency.
Whenever a ray of light passes through a transparency at an angle other than
the normal (a "normal" is a line drawn per'pendicular to the transparency
surface), several events occur. (See Figure 1.) One of these events
results in the lateral displacement of the ray by a relatively small and
constant amount. This lateral displacement is usually operationally insig-
nificant beyond a few meters, but contaminates angular deviation measures
md~ie with short "throw distances."
PERCEIVEDTARGETANURPOSITION DVA O
ACTUAL.....TARGETPOSITION LATERAL
K rjISPLACEMENT
Fiur 1.Laeal Displacement and Angular Deviation
Effects of Aircraft Transparencies
8

A second event causes the light ray to undergo an angular directionalchange. This angular error can be quite significant when considering its
effect on apparent target position as seen by the pilot. For each milli-radian (mr) of error, the target's true position will be displaced fromi its
apparent position by 1 foot for each 1000 feet of range. In other words, a
transparency inducing a mere 10 mr error can move the apparent position of a
target located 3000 feet away a distance of 30 feet; more than enough to
miss the target.
Angular deviation is caused by i,oth relatively local areas of nonparallel-
ism, as well as overall nonparal lellism of the surfaces of the transparency.
The angle of installation, pilot's line of sight, and other factors contri-
bute to modifying the severity of this problem. The end result of this-
problem is to produce a nonlinear mapping of external objects. In other
words, the actual position of the target does not correspond with its appar-
ent position as seen from the cockpit.
Several methods presently exist for determining the angular deviation inher-
ent in an aircraft transparency. One method uses a telescope or theodolite
to view a reference target. The transparency is then interposed, and the
Htarget is viewed through several predetermined locations of the transpar-ency. The difference in angular position of the target as seen with andwithout the transparency is a measure of the total deviation induced by the
transparency. This total deviation measure includes the effects of both
lateral displacement and angular deviation.
Another problem with telescope-based systems arises when the telescope is
used to look through an area of transparency which has a poor ModulationTransfer Function (MTF), resulting in a blurring or doubling of the images.
MTF and ant,ýiorphic lensing problems introduced by the transparency make
measurements through certain areas extremely difficult, if not impossible.
An alternative to the telescope method involves projecting a laser beam
through the transparency onto a screen. The position of the laser spot is
9

compared to its position prior to insertion of the transparency, and appro-priate mathematical exercises would yield a figure representing total devia-
tion. Although MTF and lensing would influence the size and shape of the
spot, it appears easier to estimate the center of the distorted spot than to
see the degraded image in a telescope-based system.
Both telescope-based and laser-based systems commonly reduce the effect of
lateral displacement by viewing (or projecting) over a long distance--approaching 100 feet. For systems of this type, the total dev'iation meas-
ured is primarily due to the angular deviation and not the displacement.
For this reason, these systems are preferable. However, an obvious disad-vantage of systems incorporating long throw distances is the requirement for
clear space which may conflict with other functions of the facility in which
the test apparatus is housed.
The laser-based system has been used to make angular deviation maps of F-ill
windscreens as they were held perpendicular to the laser beam. A rather
complicated process of drawing vectors and overlaying templates was intended
to be used as an indication of the severity of angular deviation after the
windscreen was returned to its installed position. Acceptance/rejection
criteria were based on a relatively low density mapping of the wiridscreen
(ATP 601-E, 1979). :
A somewhat higher mapping density is used for F-16 canopies, and the canopy
is measured while held in the installed position. The advantage of mea-.curing angular deviation of the transparency while it is mounted in the
installed position is that the measured values represent exactly what is
seen by the pilot. Both laser-based and telescope-based systems are used.USAF acceptance/ rejection criteria are 1 mr RMS and 3 mr maximum deviation
from a best fit curve of several data points. All data are recorded manu-
ally, including azimuth and elevation position as well as azimuth and eleva-
tion deviation for up to 73 positions of each canopy.
The University of Dayton Research Institute compared grid line slope meas-
ures of photographs to point-by-point measures made with a telescope of90-inch focal length (Harris, 1981). Their conclusions follow:
10
In the use of a slope technique for evaluation of a windscreeninstead of point-to-point measurements, the results will not des-cribe the amount of constant displacement or deviation which mayexist due to the windscreen geometry. Also, there is less accu-racy obtainable froml the grid slope rie-1hod than from the point-by-point method. The first problem is due to the ambiguity ofwhere to measure the slope, as mentioned previously. There isalso a direct problem of measurement of the photographic data, Ifwe take the limit of accuracy of the point-by-point system to bethe accuracy to which the target can be measured (±1/16 inch forthe 90-inch focal length lens), this gives accuracy of close to±1 minute of arc. To realize this same accuracy on a photographprinted to 16 grid squares per inch, measurement must be made toless than .004 inch. This accuracy would be very difficult toobtain.
The grid board photography techniques are simple to perform in thelaboratory and provide the overall distorting information in onehard copy for the record. The effort involved in the grid boardphotography occurs when the measurements are made. The desiredaccuracy and repeatability are not easy to obtain. On the otherhand, point-by-point techniques are very laboratory intensive,which can be hard on the person taking the data (an effect whichmay itself introduce some errors). As mentioned before, thiseffort would be greatly lessened with a movible mount, automatedmapping technique. There are still some out-of -the-lIaboratorycomputations required to get the grid board information (which arenot direct) since the pictures must be evaluated to get thedesired data.
'4 The procedure for taking the grid board photographs is straight-forward. However, because many of the photographs must be com-pared to each other or to a standard photograph, there are strictrequirements on stability of the camera and repeatability of theposition of the camera because any vibration will produce fuzzypictures. A little vibration from the camera shutter is usuallyof little concern; however, in attempting to read these grid boardphotographs to less than 0.01 inch, a shakey tripod will allowthis much movement to occur. Another stability problem wasencountered in taking binocular photographs where the camera mustbe translated between the two photographs without changing itslongitudinal position (and hence the focus). Most camera tripodswill "tilt" from side to side if the weight of the load -is notevenly centered on the tripod. A heavy-duty tripod was requiredto take correctly registered binocular photographs (translatingthe windscreen laterally), These photographs indicate that thewindscreen does, in fact, introduce a "tilting" of the grid boardimage, which cannot be accurately measured if the tripod itselfmay also be tilting.

These problems with camera stability also introduced a repeata*.bility error. If the photographs of the grid board are to becompared, a stable and repeatable reference point with respect tothe gric6 board must. be maintained.
Another major source of error in taking the photographs is causedby focus errors. Any set of exposures which are to be comparedlater by overlaying the negatives must all be taken with the samefocus setting on the camera. This is because any focus error (dueto focLS setting changes or tilts and translations of the camerarelative to the grid board) will cause a change in magnificationof the grid board. Any changes in the size, shape, or characterof the brid board should be due to the windscreen under test. The
windscreen should be the only optical variable.I From this information, we may conclude that a properly executed point-by-point angular deviation measurement, if taken with sufficient density, wouldbe a very reliable metric of both angular deviation and distortion. Themajor disadvantage appears to be a requirement for significant work on the
part of the person taking the readings, with an attendant possibility of
error and significant time usage.
In an attempt to obtain high density, extremely accurate angular deviationmeasures of F-16 canopies while maintaining a relatively small spacerequirement and relatively low technician workload, the authors have pro-Iduced an angular deviation measurement device which both exceeds our expec-L tations and should meet the most stringent demands for optical quality meas-
ures in any aircraft transparency requiring strict optical control (Task,
1979, 1980).I
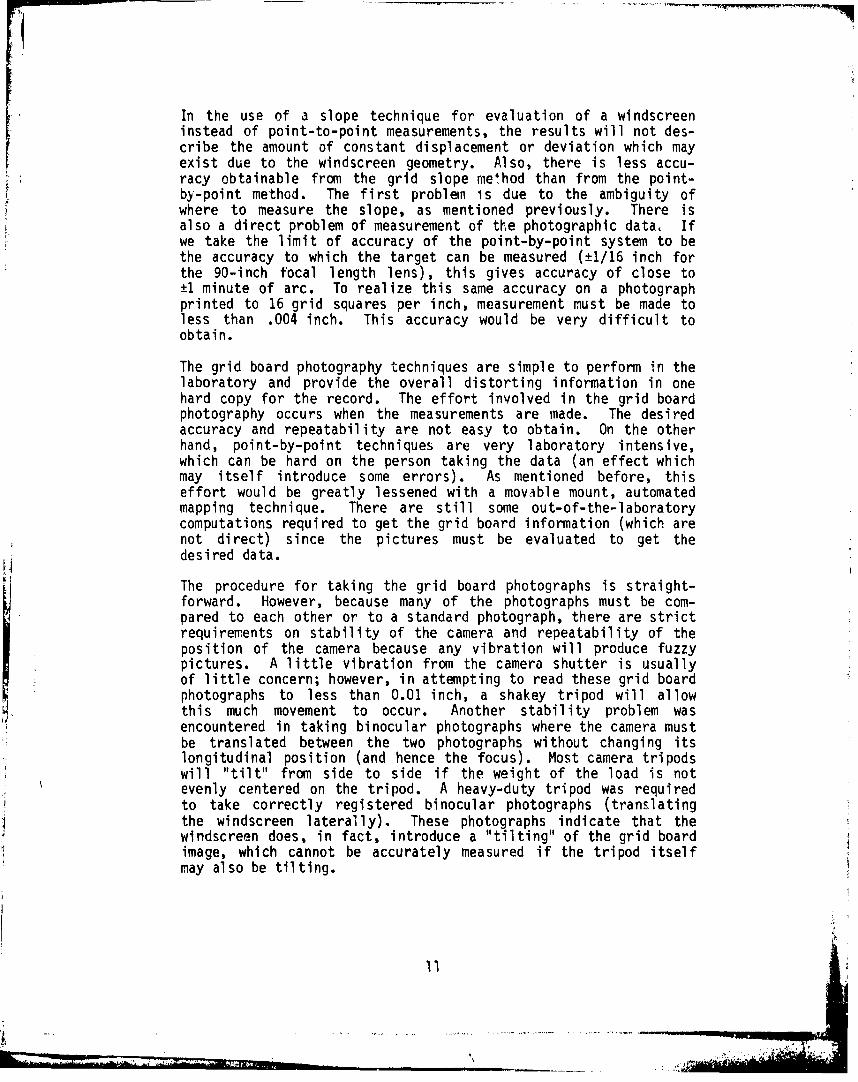
DESCRIPTION OF THE DEVICE
Figure 2 shows a pictorial top view of the optical system. From left toright, light from an incandescent lamp is collected by a condensing lens to
illuminate the target slide. The projection lens is located one focal
length from the target slide such that it collimates the image of the target
slide. This portion of the system is positioned such that the projectionlens is approximately at the design eye position or observer position for
the transparency under test. The remainder of the system (the receiver) is
located on the other side of the transparency.
12
LINEAR CCD ARRAY(HORIZONTAL)
DISPLACEMENT COMPENSATION
LIGHT SOURCE AND IMAGING LENS V
TARGET SLIDEB EAM SPLITTER
______ AZIMUTH CHANNEL
PROJECTION LENS
ELEVATIONCONDENSING LENS CHANNEL IMAGE OF TARGET SLIDE
LINEAR CCD ARRAY(VERTIC AL.
Figure 2. Pictorial Layout of Windscreen Angular DeviationMeasurement Device (the windscr'een to be measuredis positioned between the projection lens and thedisplacement compensation lens)
The receiving lens compensates for lateral displacement (thus eliminating
that error source) and images the target slide one focal length away. A
beam splitter divides the light into two approximately equal intensities:
one channel to measure azimuth (horizontal) deviation and one to measureelevation (vertical) deviation Except for a 90-degree rotation about the
optical axis, both channels are id itical. In each channel i segment of the
target slide image intersects a charge coupled device (CCD) linear array and
its associated electronics. The positional change of this intersection
between windscreen and no windscreen conditions is mathematically related to
the angular deviation of the windscreen at the point measured.
THEORY OF OPERATION
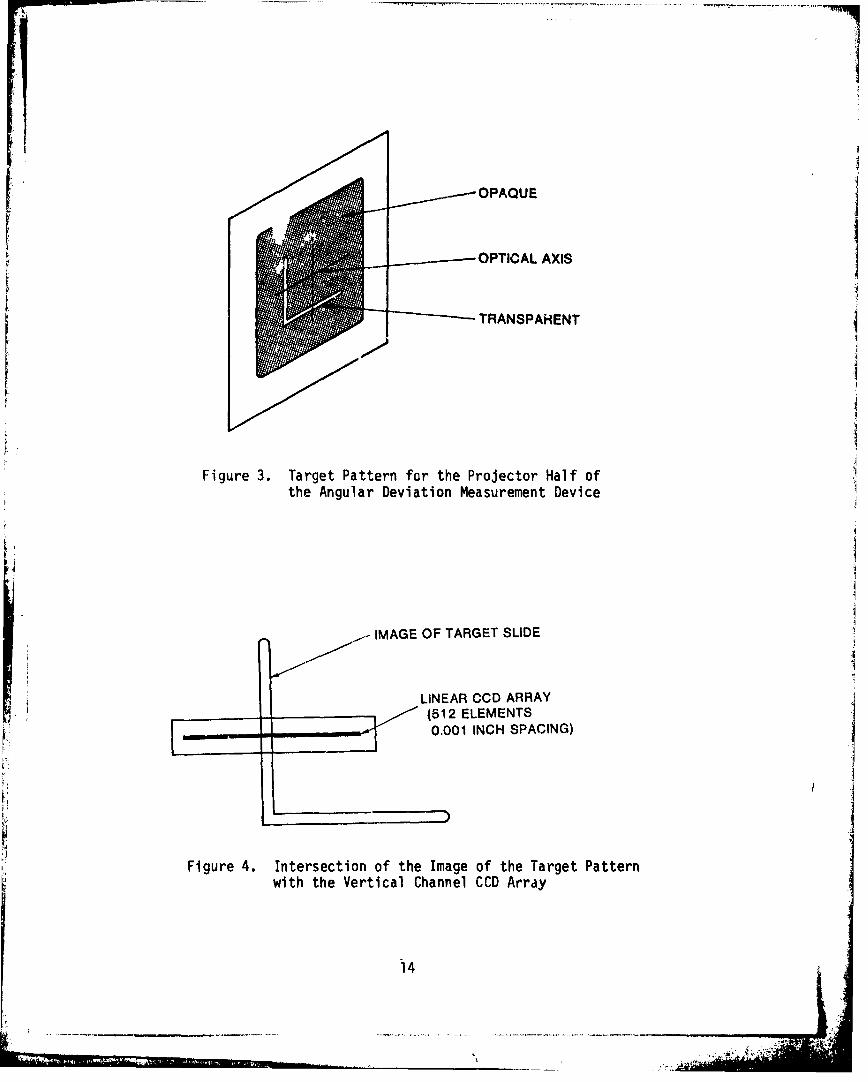
The target slide is shown in Figure 3. The dimensions and location of the
"L" are not critical; however, the stroke width of the "L" must be uniform
to reduce error. The image of the "L" is produced at the plane of the CCD
array. The array is offset from the optical axis so that only one leg of
the "L" intersects the array as shown in Figure 4.
13
_---------OPTICAL AXIS
TRANSPAHENT
iI
Figure 3. Target Pattern for the Projector Half ofthe Angular Deviation Measurement Device
IMAGE OF TARGET SLIDE
LINEAR CCD ARRAY-.,-' (512 ELEMENTS
0.001 INCH SPACING)
Figure 4. Intersection of the Image of the Target Pattern
k with the Vertical Channel CCD Array
14

As the individual CCDs are sampled, the electronic output signal appears asshown in Figure 5. Typically, several CCD elements are activated as shownby the series of spikes between A and B in Figure 5. To ascertain the loca-tion of the center position of the "L" segment, a counter counts CCD clockpulses until the output of the array exceeds a detection threshold level.The first counter stops counting at this point (A) and a second counterstarts counting. The second counter counts every second pulse until theoutput of the array falls below the threshold (B). The counts from bothcounters are added. This resulting count corresponds to the center of the"L" leg segment. This position Is shown as (C) in Figure 5. Equation (1)
shows this relationship.
----- DETECTOR0 THRESHOLD LEVEL
0 A C B 512
TIME -(CCD ELEMENT NUMBER)
Figure 5. Signal Output from the CCD Array Electronics Showingthe Pulses Resulting from the Tntersection of theTarget Pattern Leg Segment and the CCD Array (A--B)
C B-A (1)
2where:
C = center position CCD element number
A = front edge of "L" element number
B - back edge of "L" element number
15

The accuracy capability of the optical system is determined by the lensquality of the projection lens ( I) and the receiver lens (L2 ), the spacingof the CCD array elements and the focal length of L2 . The minimum detecta-
ble angular deviation is determined by Equation (2).
harctan 1 (2)
where:
= minimum measurable angle
h = spacing of CCD array elements= focal length of
For the device that was fabricated and tested, h was 0.025mm and f was360mm. Thus, from Equation (2) the "least count" was 0.07 mrad. It isobvious from Equation (2) that the minimum measurable angular deviation canbe improved by increasing the focal length, f2, or decreasing the CCD ele-
ment spacing.
DESIGN CONSIDERATIONS
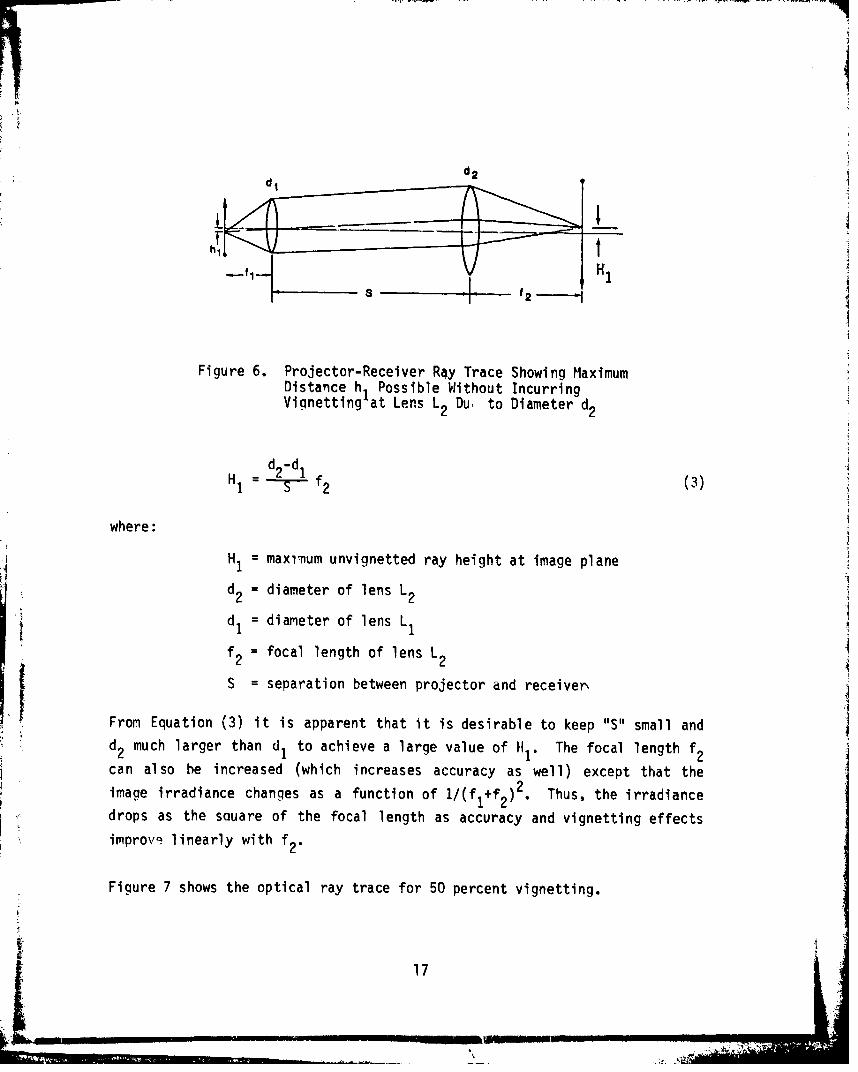
Although the separation distance (S) between the projector and the receiveris not critical and does not affect the measurement accuracy, it does havean effect on the light energy at the image plane. As shown in Figure 6 thediameter of L2 is greater than the diameter of L1. This increases the angu-
lar coverage at the image plane that is not vignetted. The largest distancefrom the optical axis at the image plane that does not incur vignetting isalso shown in Figure 6 and is calculated with Equation (3).
16
L..
d2
Figure 6. Projector-Receiver Ray Trace Showing MaximumDistance h1 Possible Without IncurringVignettinglat Lens L2 Du, to Diameter d
d2 -d1
HI 2= 1 f2 (3)1 s- ~2
where:
H1 = maxitnum unvignetted ray height at image planed2 = diameter of lens L2 diameter of lensdi= diameter of lens L
f = focal length of lens L2
S = separation between projector and receiver
From Equation (3) it is apparent that it is desirable to keep "S" small and
d much larger than d to achieve a large value of H1. The focal length f 2
can also be increased (which increases accuracy as well) except that theimaae irradiance changes as a function of 1/(f 1+f2 )2 . Thus, the irradiancedrops as the souare of the focal length as accuracy and vignetting effects
improve linearly with f 2 "
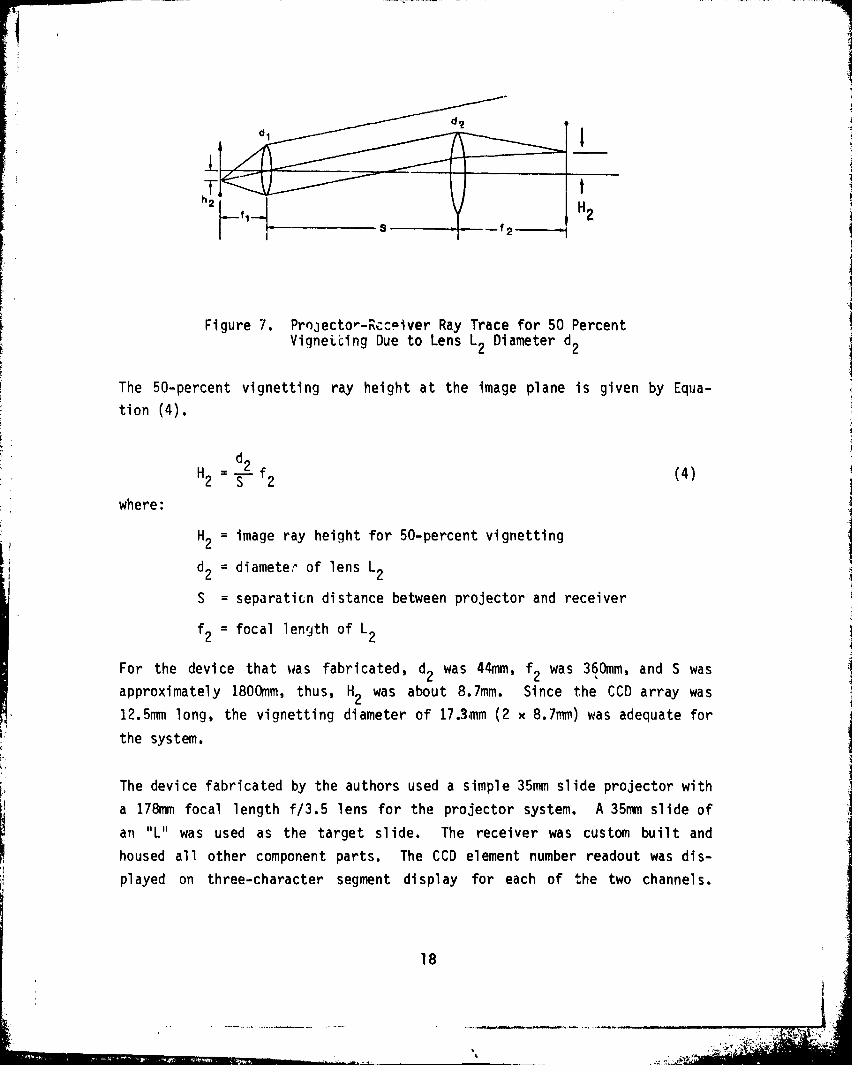
Figure 7 shows the optical ray trace for 50 percent vignetting.
17
I
Figure 7. Projector-Rcc~iver Ray Trace for 50 PercentVignet~ing Due to Lens L2 Diameter d2
The 50-percent vignetting ray height at the image plane is given by Equa-tion (4).
dd2
H2 =S
where:F image ray height for 50-percent vignetting
d2nein Du toameteL DiamensrLd
S = separation distance between projector and receiver
= focal length of
For the device that w¢as fabricated, d2 was 44mm, f2 was 360mm, and S was
approximately 1800mm, thus, H2 was about 8.7mm. Since the CCD array was12.5mm long, the vignetting diameter of 17.3mm (2 i 8.7mm) was adequate for
the system.
The device fabricated by the authors used a simple 35mm slide projector witha 178mm focal length ff3.5 lens for the projector system. A 35mm slide ofn "L" was used as the target slide. The receiver was custom built and
ahoused all other component parts. The CCD element number readout was dis-played on three-character segment display for each of the two channels.
18
the syst
The ~ ~ ~ ~ ~ ~ ~ S devic farctdb h-uhosue ipe3msiepoetrwt
OPERATIONAL EVALUATION
As stated previously the resolution or "least count" of this instrument was
0.07 mrad. To determine the repeatability of measurement, a windscreen was
placed on a windscreen movement table; and two points were repeatedly meas-
ured by alternating between them. Thus, positioning accuracy of the wind-
screen movement table and the repeatability of the angular deviation device
contributed to reading errors. Out of a total of 40 readings at each of the
two points by two different operators (20 measurements each), the readings
never varied by more than one digit or 0.07 mrad.
Measurements of F-16 windscreens using this device have compared quite
favorably with data produced at other facilities using different techniques.
Although the system in its present configuration is successfully used in our
laboratory, we are in the process of interfacing it to a microcomputer con-
trol system which will allow both automatic motorized azimuth and elevation
positioning of the ranopy, as well as digital recording of the associated
position and deviation data on a computer disk. This modification will
permit a very dense mapping of the entire critical area of the canopy with
minimal human intervention. The digitally recorded data will then be pro-
cessed to yield appropriate curves and graphs by simply removing the disk
from the data acquis ion system and inseting it into a second computer
which is proqrammed to reduce these data to understandable terms. A similar
feat was successful,y perfornm id an AFAMRL Windscree':, Program study of
F-111 windscreeiv,.
19
Section 4FIELD USABLE MEASUREMENT DEVICE
Both grid board photographic techniques and the angular deviation measure-ment. device are used under laboratory conditions to determine the optical
parameters of newly manufactured aircraft transparencies. There appeared tobe no accurate way to determine optical changes in these transparencies
after the part was installed and while it remained on the aircraft. In a
separate effort, the authors devised a method to allow measurement of
several F-ill windscreen optical parameters with laboratory accuracy underfield conditions. This method may be applied to any aircraft transparencywith simple modifications of a positioning fixture (Genco, 1979).
DESIRABLE CHARACTERISTICS
The ideal field evaluation unit for optics evaluation would possess all ofthe following characteristics:
1. Measurement results taken with the field unit would be compatible
with those taken under current quality assurance evaluation
conditions.
2. Equ i plent. would be easily portable, maintain its calibration,
under field use conditions be easily and quickly installed withmininial effect on normal aircraft operational usage.
3. Automatic compensation would be included for slight alignment andlighting errors.
4.- Th ytmwudb eaieyfIlroe o prto ynnscientific technical personnel.
20

CURRENT TECHNIQUES
Current indoor photographic evaluation techniques for assessing optical
quality of aircraft transparencies use large string boards or light boxes
requiring considerable space, exact placement, and high electrical powerdemand. Special Jigs or positioning devices are required to hold the trans-
parency in its design position, and large format 4 inch x 5 inch cameras are
usually employed for the photogr .,hs. As an example, F-111 windscreen accep-
tance photos are taken with the camera at design eye position and a grid
board 10 feet From the forward arch (see Figure 8). Seid and Self (1978)
have shown that photographic capture of transparency optical magnification
effects (distortion) is most effective when the windscreen target distanceis at least 2 meters. In the Figure 8 configuration, the required 135mm Icamera lens yields a photograph with a field of view of approximately
42 degrees x 50 degrees.
TARGET
WINDSCREEN CAMERA
(DESIGN EYE)
- 1C
lo ft I5.75 ft ------
Figure 8. Typical Indoor F-ill Photographic Configuration
The target may consist of either 1 inch grid squares for distortion measure-
ments, 6- or 8-inch grid squares for multiple image measurements, or a par-
tially polarized screen for birefringence photos. Currently, AFAMRL uses alarge light box to hold 6 feet x 6 feet or 8 feet x 8 feet back illuminated
target panels that subtend an approximate 22-degrete field of view. Most
manufacturers use larger light boxes or string boards. Quite obviously, the
21
if
use of such a large grid board in field situations would be prohibitive; but
a grid boa,'d of more manageable proportions W)Llu be either too small to
examine a significant area of the windscreen in one photo, or it would have
to be placed too close to the windscreen to reveal significant magnification
errors.
EVOLUTION OF PORTABLE TRANSPARENCY OPTICAL TEST SYSTEM(P-TOTS)
At first, a rear projection screen was considered in which targets would be
thrown on a screen held in front of the aircraft, and photos would be taken
from the cockpit design eye position; but preliminary experiments indicated
two major drawbacks:
1. The relatively low illuminance on the screen required that photos
be taken in almost total darkness to avoid unwanted contrast
degradation, In addition, long time exposures were necessary.
During this time, screen movement caused significant image posi-
tion shifts. Increasing lamp luminance increases heat and
decreases the life expectancy of the slide. Also, we could notdepend on calm nights uninterrupted by the appearance of disrup-
tive vehicles or runway lights.i
2. Polarization effects could not be studied due to the destructive
effects of the screen upon polarized light.
Since both major problems appeared to be related to the projection screen,
various materials that would yield high reflectance and maintain polariza-
tion were investigated. Eventually, a 3M product (Scotchlite No. 7611 High-Gain Reflective Sheeting) was found that acts as an excellent retroreflector
in that the reflected light ray follows a path almost exactly like that
taken by the incident light ray (Figure 9). The result of this circumstancecauses much of the incident light to be returned to its source and yields a
very bright image within an extremely narrow angle of return. Additionally,
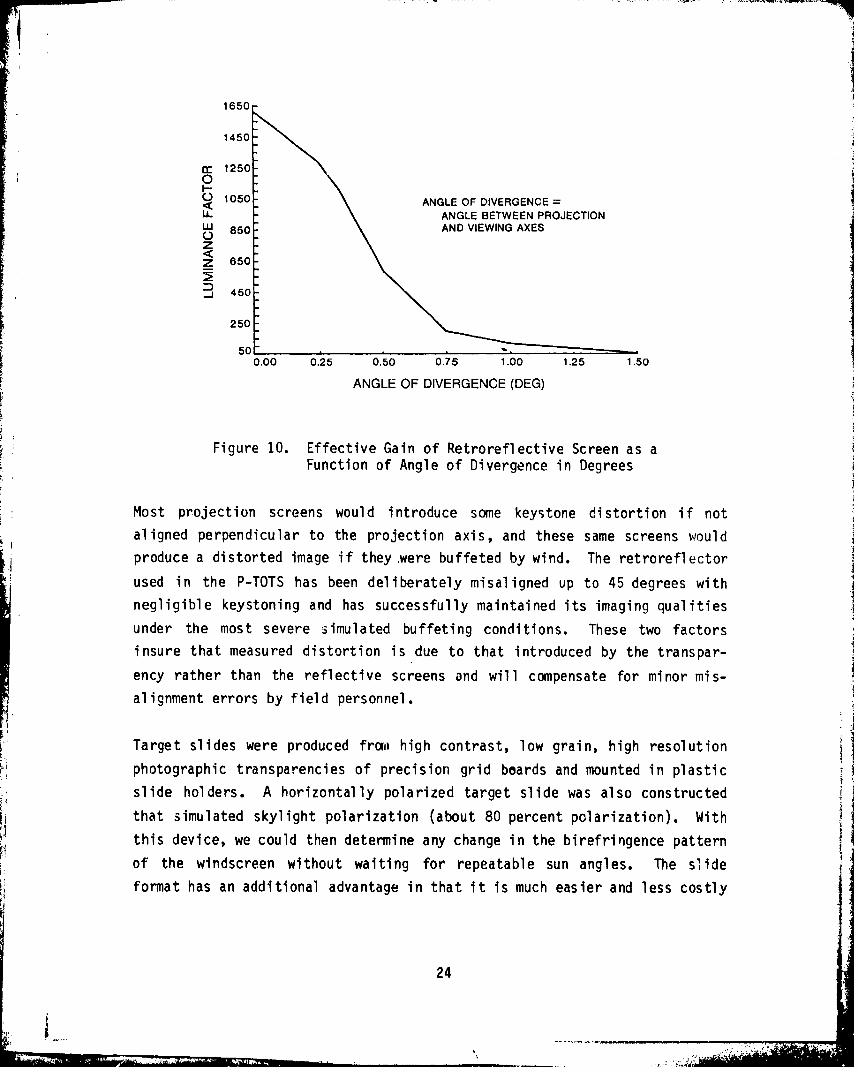
polarization of the incident light is not derZroyed. Figure 10 shows that
22

the selected material has a luminance factor (gain) of about 1600 for on-axis measurements when the angle of divergence or angle between the incidentand reflected rays equals 0. This compares with a gain of about .85 forwhite paper measured under similar conditions. The net result of this-increased gain is a brighter target, permi'-ting shorter exposures andsolving most of the problems listed above. The narrow angle of acceptancealso reduces the effect of extraneous light and attendant contrast reduc-tions, thus allowing photos to be taken in relatively high ambient light
conditions.
Figure 9. Retroreflective Effect of Screenj
23
1650
1450
CC 1250
I-O 1050 ANGLE OF DIVERGENCE =
LL ANGLE BETWEEN PROJECTIONLU 850 AND VIEWING AXESUzZ 650
..j 450
250
500.00 0.25 0.50 0.75 1.00 1.25 1.50
ANGLE OF DIVERGENCE (DEG)
Figure 10. Effective Gain of Retroreflective Screen as aFunction of Angle of Divergence in Degrees
Most projection screens would introduce some keystone distortion if not
aligned perpendicular to the projection axis, and these same screens would
produce a distorted image if they were buffeted by wind. The retroreflector
used in the P-TOTS has been deliberately misaligned up to 45 degrees with
negligible keystoning and has successfully maintained its imaging qualities
under the most severe simulated buffeting conditions. These two factors
insure that measured distortion is due to that introduced by the transpar-
ency rather than the reflective screens and will compensate for minor mis-
alignment errors by field personnel.
Target slides were produced froal high contrast, low grain, high resolutionphotographic transparencies of precision grid boards and mounted in plastic
slide holders. A horizontally polarized target slide was also constructed
that simulated skylight polarization (about 80 percent polarization). With
this device, we could then determine any change in the birefringence pattern
of the windscreen without waiting for repeatable sun angles. The slide
format has an additional advantage in that it is much easier and less costly
24
~i
to design a special pattern for capturing a particular optical problem withthis format than with large grid boards.
The projection system (Figure 11) consists of an H3, 12 volt halogen lamp,
an aspheric condensing lens, a modified 35mm slide holder, a 105mm f2.5
Nikon camera lens used as a projection lens, and a beamsplitter. The H3lamp was chosen because of: (1) its ability to be oriented in such a manner
as tu present a point source to the condensing lens, (2) its resistance tothe effects of shock and vibration, (3) its high intensity, (4) long service
life, and (5) availability of 12 Vdc electrical power. The 46mm focallength aspheric condenser was intended to converge a significant amount of
light onto the film plane. The Nikon lens is of excellent optical quality
and is of such a size as to slightly overfill the retroreflective screen at
a projection distance of 28 feet (28 feet was considered the minimum accept-able distance from design eye to just beyond the F-111 pitot boom). The low
f-number of the lens provides sufficient light to fill the projection angleof 23 degrees. The beamsplitter allows the viewing or photographing path to
be coaxial with the projection path; thus, the angle of divergence
(Figure 10) is 0 degrees. Photos taken significantly off axis would suffer
from light loss and keystone distortion.
The projected light passes through the windscreen to be retroreflected
toward the source. This reflected light passes back along nearly the same
path as that taken by the incident ray to again pass through the transpar-
ency and beamsplitter and finally focus on the film plane or eye
(Figure 11). This optical arrangement, coupled with a precision mountingi! fixture to assure exact camera and P-TOTS positioning in the cockpit, allows
accurate and repeatable observations of the following optical effects.
Bi refringence
The light beam emerging from the P-TOTS can be polarized to a degree similarto that found at the aircraft's operating altitude. The reflected beam may
be imaged on a color plate to show the effect of birefringence. An analyzermay be placed on the camera lens to enhance the saturation of the pattern.
25

RETROREFLECTOR
............ REFLECTED RAY
---- INCIDENT RAY
TRANSPARENCY
I
BEAMSPLITTERNIKKOR 105mm f/2.5 LENS35mm SLIDEHOLDER
/ 46mm FOCAL LENGTH67mm DIAMETERASPHERIC CONDENSOR
H* BULB
. CAMERA HEATE OR EYE FILTER
Figure 11. Schematic of the Portable TransparencyOptical Test System (P-TOTS)
Distortion
An image of a precision 1-inch grid pattern is projected through the system.
This image passes through the windscreen twice--once exiting the P-TOTS and
once on its return path. Resultant photos are similar and related to those
taken of standard grid boards; however, the absolute amounts of lensing maydiffer. This method is excellent for relative measurements, using a photo
of the newly-installed transparency as a baseline and comparing subsequentphotos to this baseline. Effects of stress-induced optical changes may be
readily seen. Birdstrike damage and mechanical loading effects on opticalparameters may also be depicted, as well as the effects of continued opera-
tional pressure and thermal cycling. Since photographic prints made with
P-TOTS can be enlarged to a convenient size, presently accepted metrics of
distortion (grid line slope, lensing, or displacement yraj_' iady be used.
26
.4.4
4.:,• ','•-• ••••p;•

We are presently evaluating the differences between amounts of distortiondepicted by P-TOTS and various standard methods.
Binocular Distortion
The mounting fixture has two mechanical stops located 32mm on either side of
design eye. These two positions represent the positions of a pilot's two
!yes. The P-TOTS can be moved from one position to the other obtaining
suitable single or double exposure binocular photos.
Multiple Imaging
Since the light passes through the transparency twice rather than once as inprevious laboratory measures, twice as many multiple images are seen with
the P-TOTS than with usual photos. This may be an advantage in that each
pair of multiple images is antisymmetric and may allow a more exact measure
of the distortion component by measuring the relative position of the twosecondary images rather than measuring the secondary image with respect to
the primary.
Haze
One of the greatest concerns of the Air Force is the life cycle costs of
aircraft transparencies. One of the primary causes of replacement of air-
craft transparencies is the optical degradation of the transparency sur-
faces. Environmental and maintenance caused surface problems result in a
haze or halation, effect which reduces the contrast of targets seen through
the transparency. If the halation is great enough, targets at a consid-
erable angular distance from the glare source may be effectively lost toview as the entire transparency appears to "light up.'' Present methods of
measuring volume haze are both inadequate and inaccurate when applied to
pilot perceived halation. P-TOTS is being configured to measure the haze in
a manner which will portray the visual effects. A later paper will describe
this effort.
27
REFERENCES
A Acceptance Test Procedure 601-E, 20 March 1979, Revision E for F-FB-111 BirdImpact Resistant Transparencies.Harris, J. S. and K. G. Harding, February 1981, Study and Evaluation ofExisting Techniques for Measuring Aircraft Windscreen Optical Quality,:Development of Techniques for Measuring Aircraft Windscreen Optical Distor-tion, AFAMRL-TR-81-25, Air Force Aerospace Medical Research Laboratory,Wriqht-Putterson Air Force Base, Ohio 45433.
Task, Harry I.., May 1979, "Windscreen Angular Deviation Measurement Device,"U.S. Air Force Invention No. 13647, Patent Pending.
Task, Harry L., Louis V. Genco, and Kenneth L. Smith, April 1980, "Wind-screen Angular Deviation Measurement Device Using Incoherent Light," U.S.Air Force Invention No. 14071, Patent Pending.
Genco, Louis V. and Harry L. Task, September 1979, "Field Test Unit for
Windscreen Optical Evaluation," Air Force Invention No. 13807, PatentPending.
Seid, Rickey C. and Herschel C. Self, Deceh•_r 1978, Influence of Gridboardl inp Width and Spacina on Windscreen Distortion Measurements, AMRC--TR78f93, Aerospace Medical Research Laboratory, Wright-Patterson AFB, Ohio 45433,[AD A..065821]
28*U.S.Government Printing Officei 1981 - 757-002/397
~.ti __
Top Related