


Languages
Pages
Legal

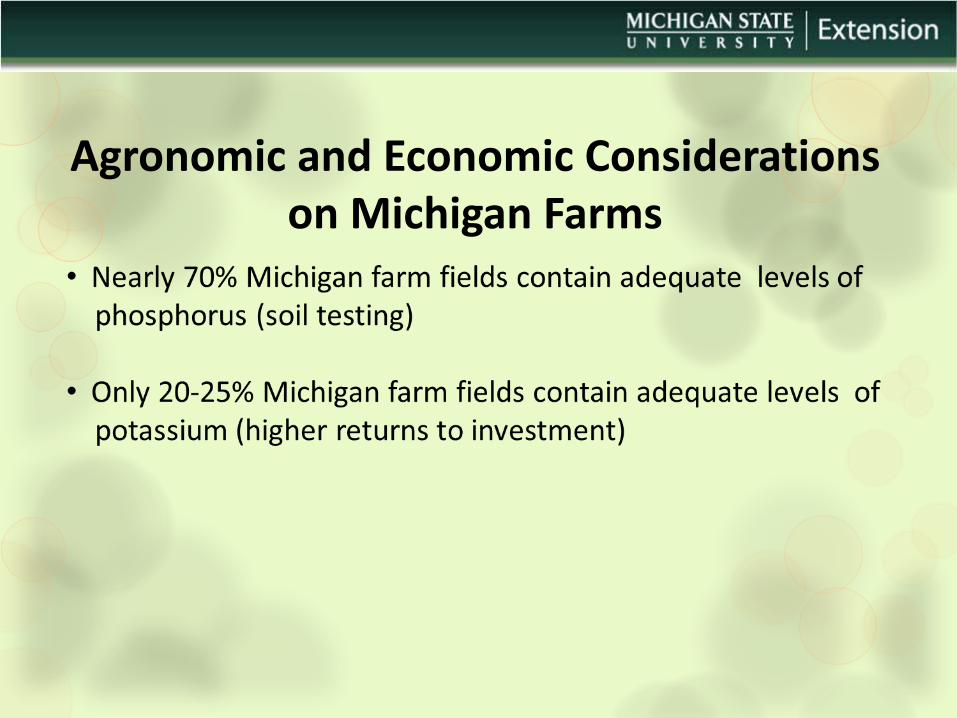
Agronomic and Economic Considerations on Michigan Farms

MSU Phosphorus and Potassium
Fertilizer Recommendations for Field Crops
The key ingredients: • Soil Test Information • Yield Goal • Buildup, Maintenance and drawdown
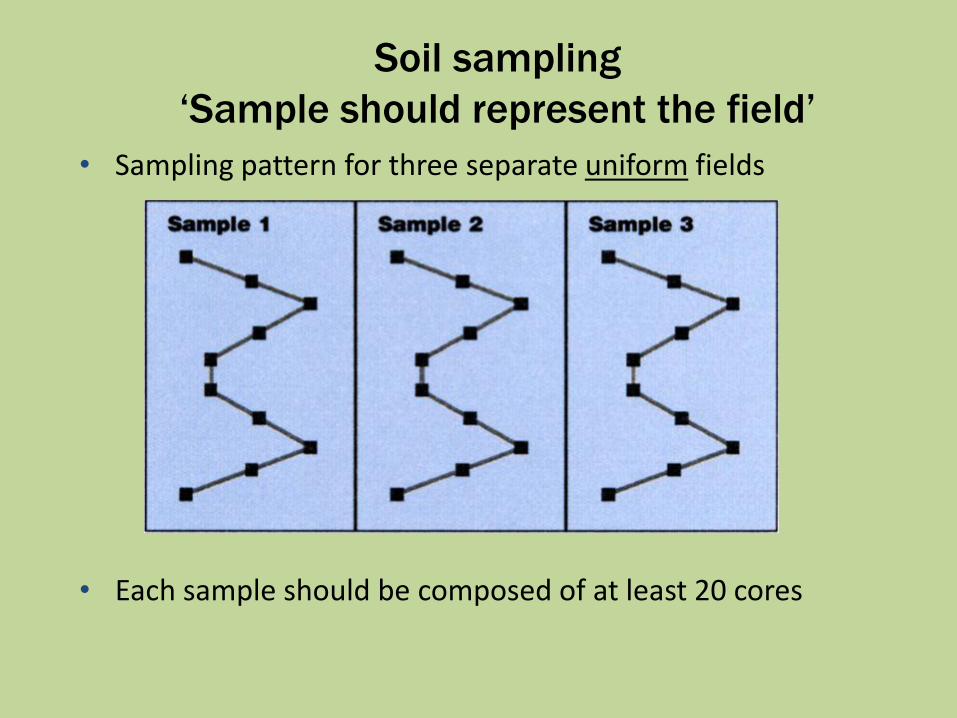
Soil sampling
‘Sample should represent the field’
• Sampling pattern for three separate uniform fields
• Each sample should be composed of at least 20 cores
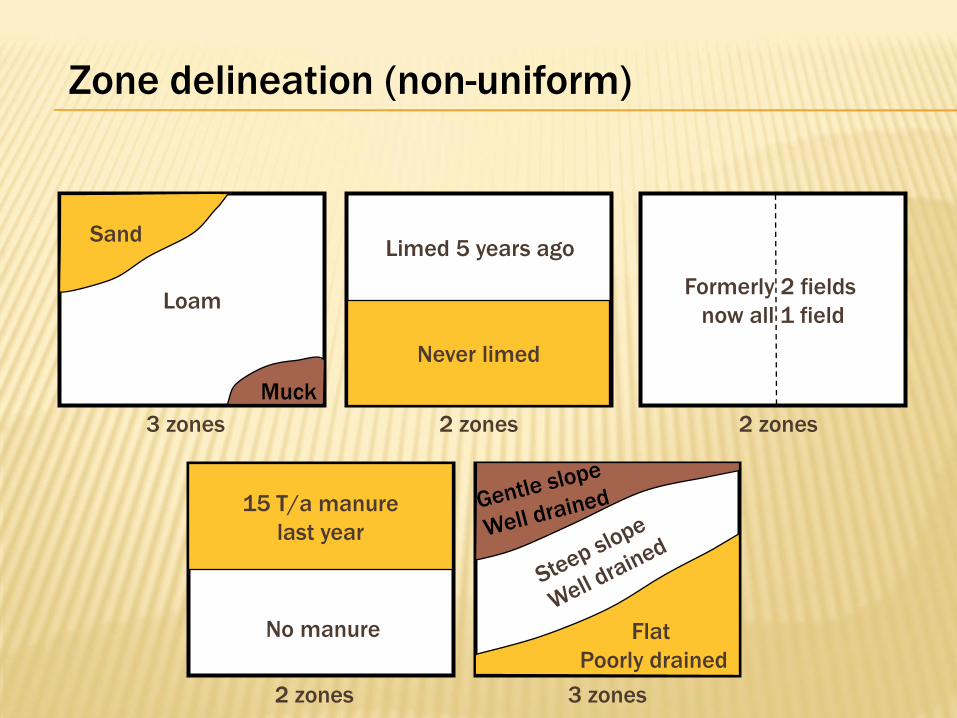
Loam Formerly 2 fields
now all 1 field
Sand
Muck
Never limed
Limed 5 years ago
3 zones 2 zones 2 zones
15 T/a manure
last year
No manure Flat
Poorly drained
2 zones 3 zones
Zone delineation (non-uniform)
MSU Phosphorus and Potassium
Fertilizer Recommendations for Field Crops
The key ingredients: • Soil Test Information • Yield Goal • Buildup, Maintenance and drawdown
Building up low soil testing soils to a critical level Adding P and K to maintain that level year after year Flexibility to change the rate
Buildup and Maintenance Approach

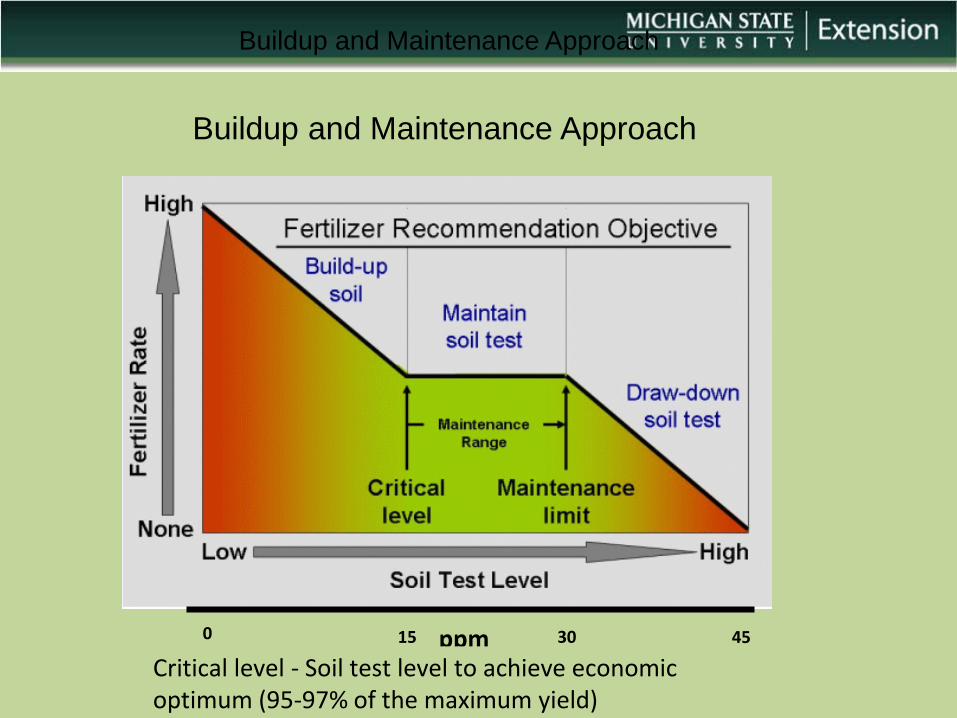
Buildup and Maintenance Approach
0 15 30 45 ppm Critical level - Soil test level to achieve economic optimum (95-97% of the maximum yield)
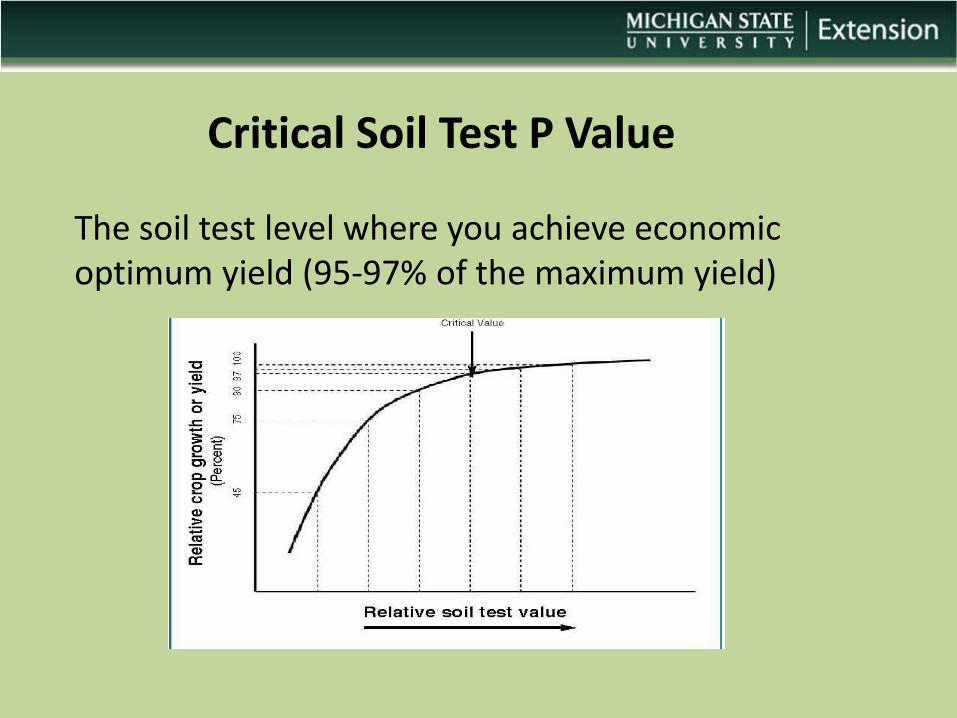
Critical Soil Test P Value The soil test level where you achieve economic optimum yield (95-97% of the maximum yield)

Critical Soil Test P Level
Crop
Critical P level (ppm)
Corn 15
Soybean 15
Wheat 25
Alfalfa 25
The soil test level where you achieve economic optimum yield (95-97% of the maximum yield)
Buildup and Maintenance Approach
Buildup and Maintenance Approach
0 15 30 45 ppm Critical level - Soil test level to achieve economic optimum (95-97% of the maximum yield)
Buildup and Maintenance Approach
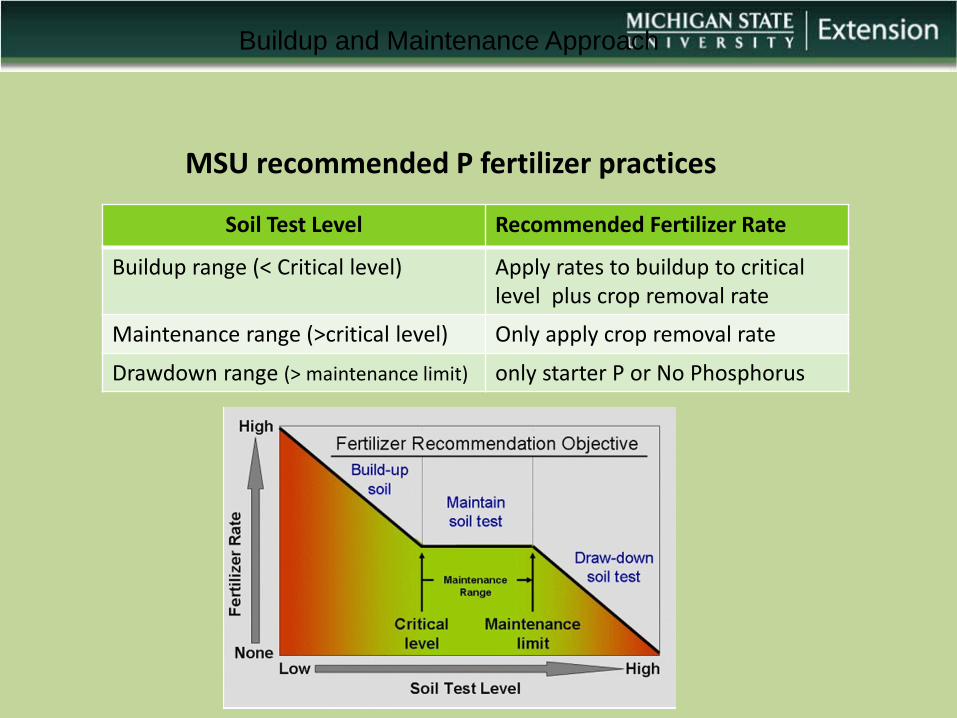
MSU recommended P fertilizer practices
Soil Test Level Recommended Fertilizer Rate
Buildup range (< Critical level) Apply rates to buildup to critical level plus crop removal rate
Maintenance range (>critical level) Only apply crop removal rate
Drawdown range (> maintenance limit) only starter P or No Phosphorus
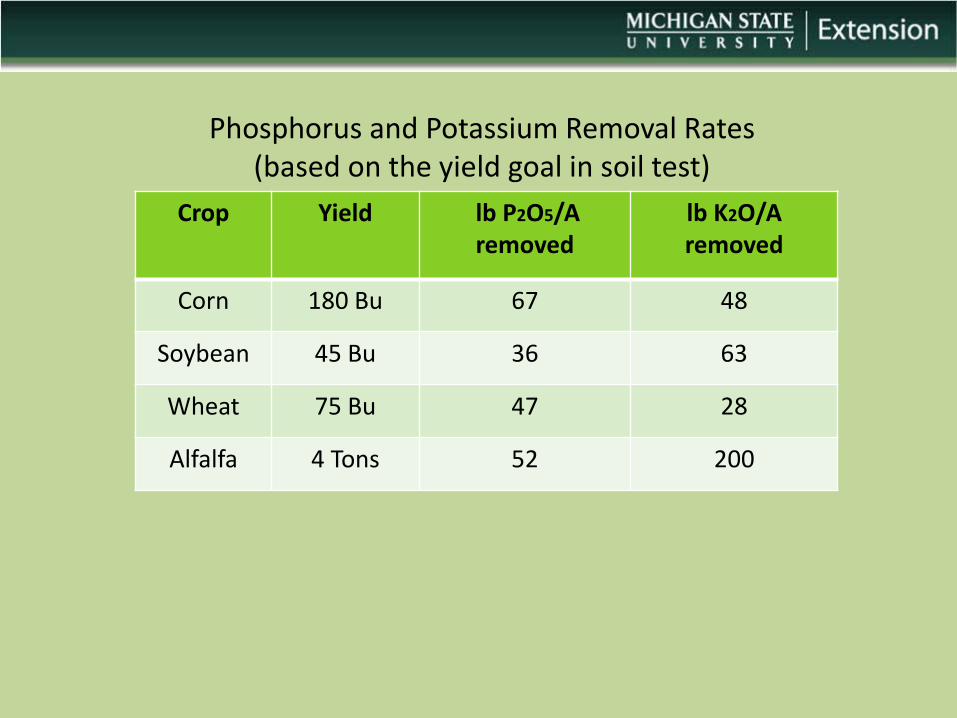
Crop Yield lb P2O5/A removed
lb K2O/A removed
Corn 180 Bu 67 48
Soybean 45 Bu 36 63
Wheat 75 Bu 47 28
Alfalfa 4 Tons 52 200
Phosphorus and Potassium Removal Rates (based on the yield goal in soil test)
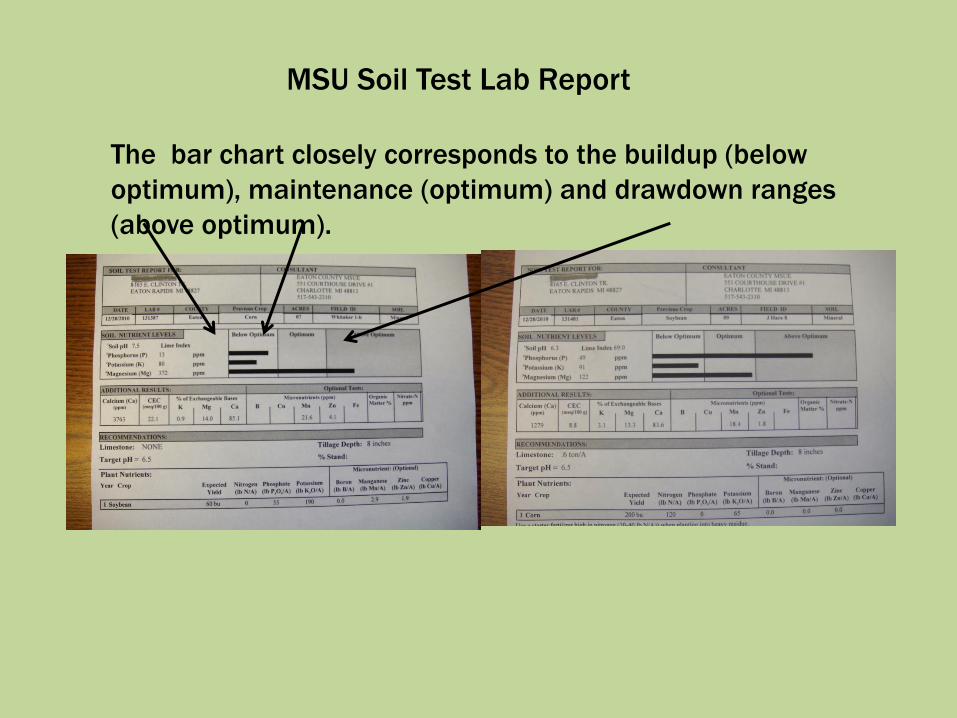
MSU Soil Test Lab Report
The bar chart closely corresponds to the buildup (below
optimum), maintenance (optimum) and drawdown ranges
(above optimum).
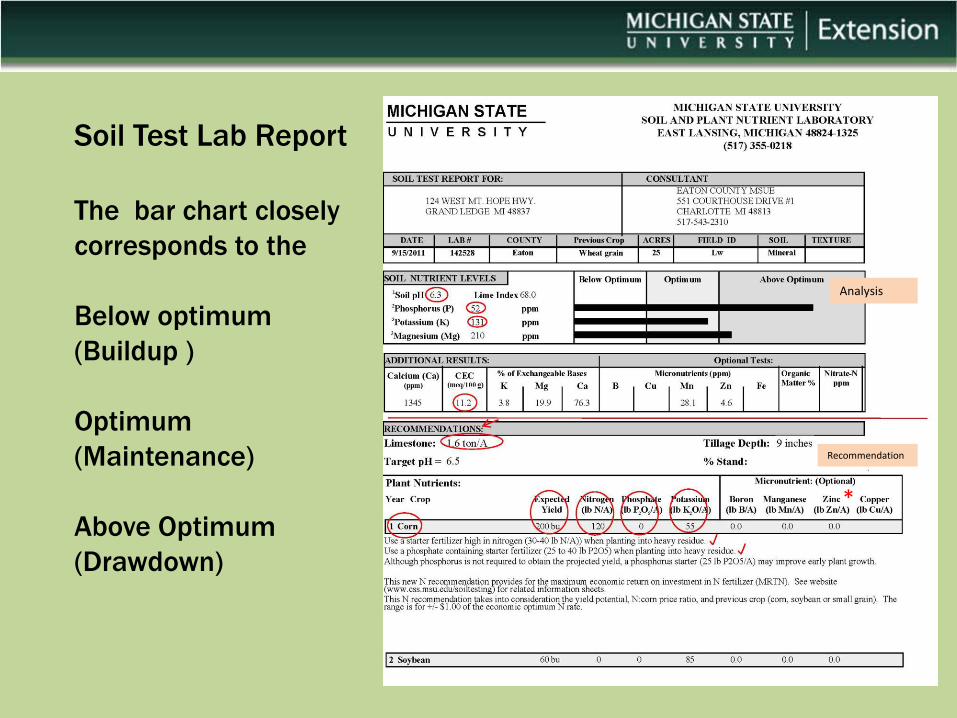
Soil Test Lab Report
The bar chart closely
corresponds to the
Below optimum
(Buildup )
Optimum
(Maintenance)
Above Optimum
(Drawdown)
Analysis
Recommendation
*
Buildup and Maintenance Approach
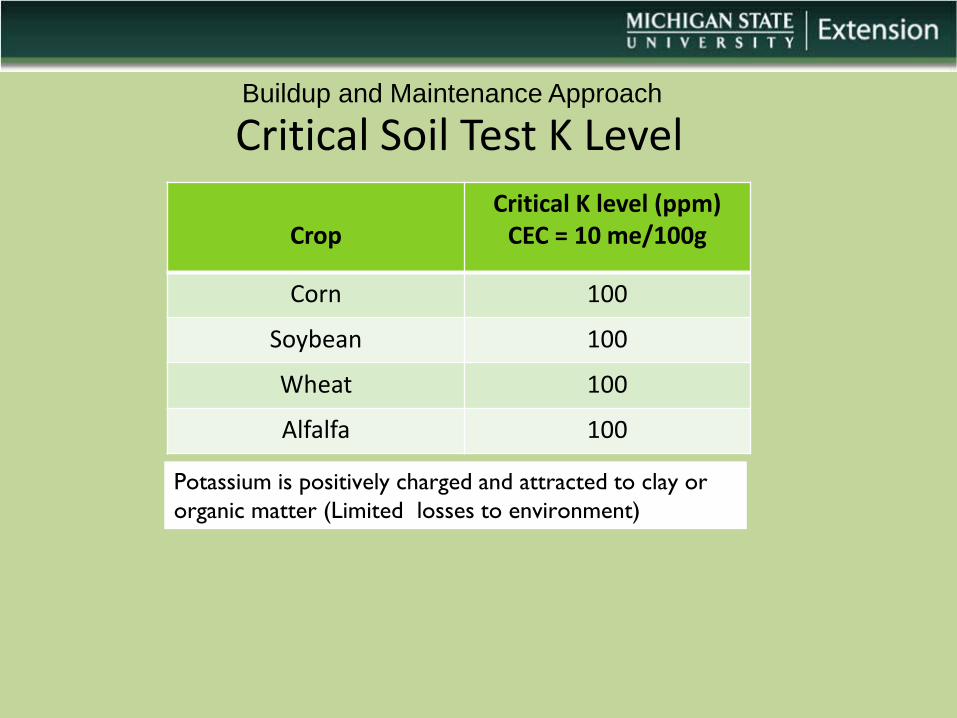
Critical Soil Test K Level
Crop
Critical K level (ppm) CEC = 10 me/100g
Corn 100
Soybean 100
Wheat 100
Alfalfa 100
Potassium is positively charged and attracted to clay or
organic matter (Limited losses to environment)
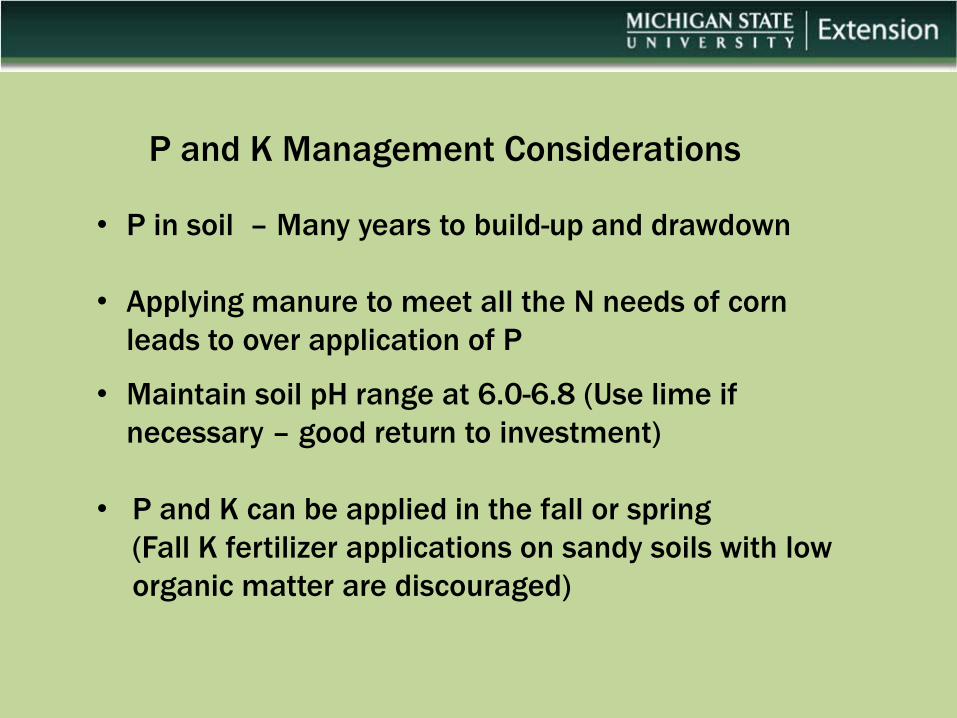
• P in soil – Many years to build-up and drawdown
• Applying manure to meet all the N needs of corn
leads to over application of P
• Maintain soil pH range at 6.0-6.8 (Use lime if
necessary – good return to investment)
• P and K can be applied in the fall or spring
(Fall K fertilizer applications on sandy soils with low
organic matter are discouraged)
P and K Management Considerations

More information on this approach – Special situations
will be discussed at the advanced session


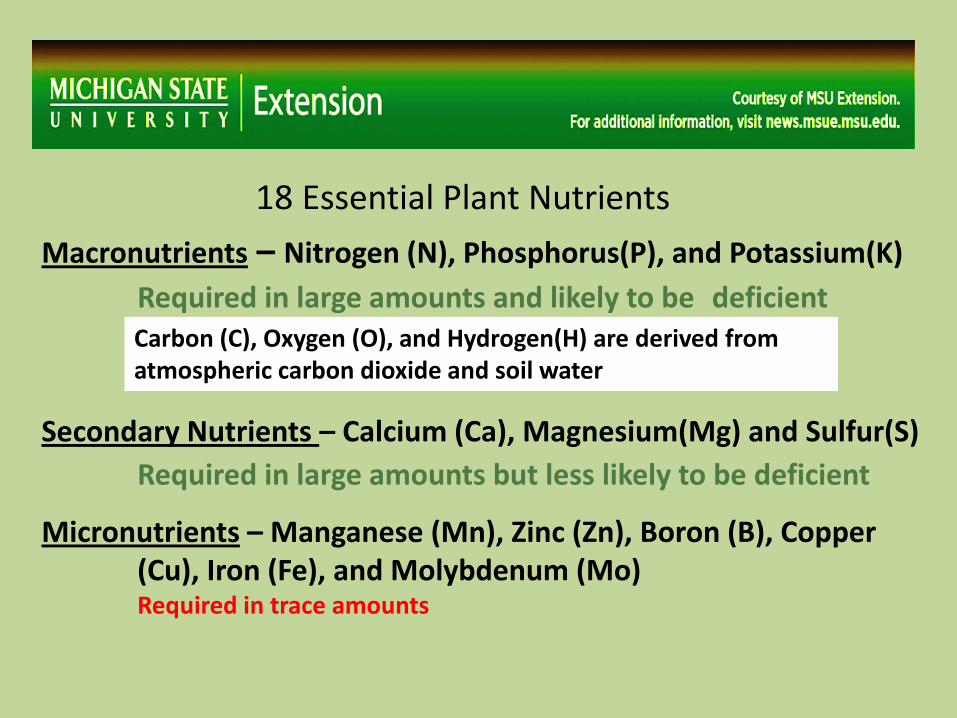
Macronutrients – Nitrogen (N), Phosphorus(P), and Potassium(K)
Required in large amounts and likely to be deficient
Secondary Nutrients – Calcium (Ca), Magnesium(Mg) and Sulfur(S)
Required in large amounts but less likely to be deficient
Micronutrients – Manganese (Mn), Zinc (Zn), Boron (B), Copper (Cu), Iron (Fe), and Molybdenum (Mo) Required in trace amounts
18 Essential Plant Nutrients
Carbon (C), Oxygen (O), and Hydrogen(H) are derived from atmospheric carbon dioxide and soil water
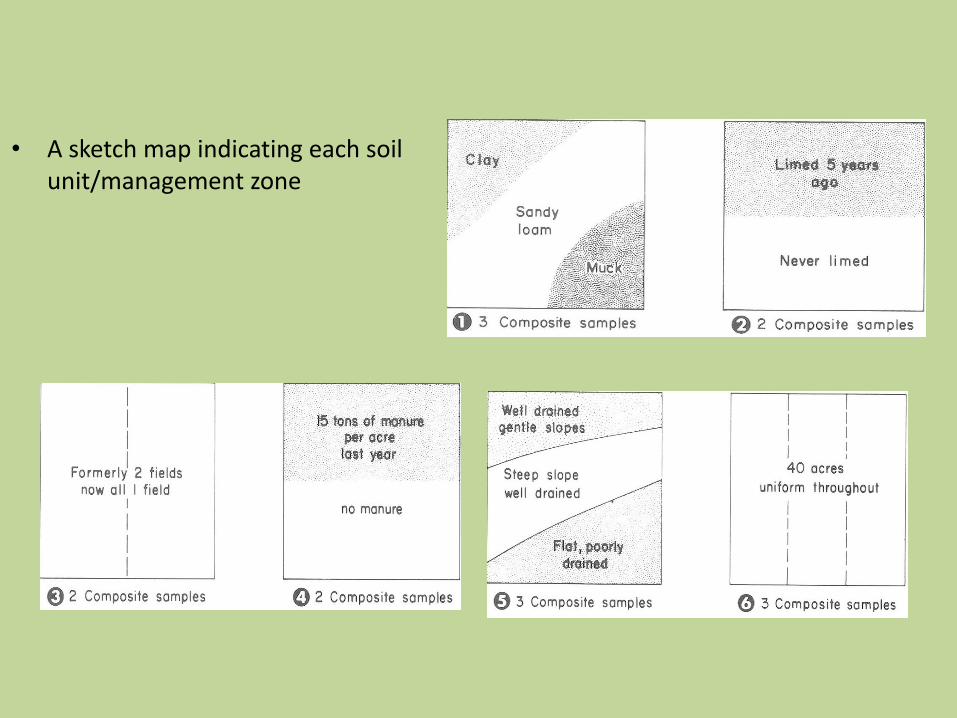
• A sketch map indicating each soil unit/management zone
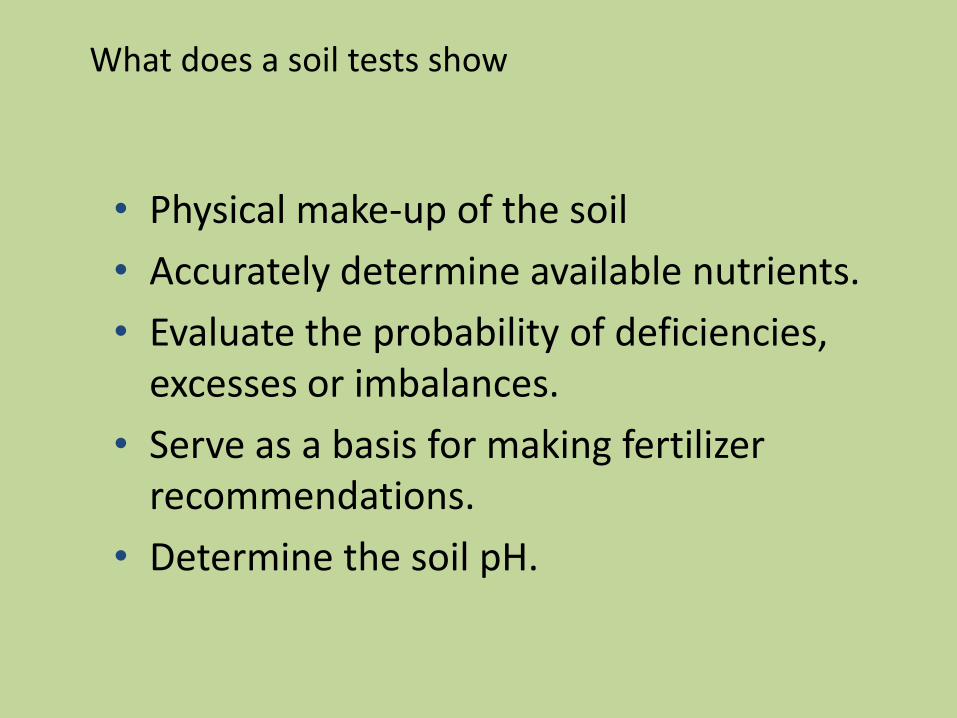
• Physical make-up of the soil
• Accurately determine available nutrients.
• Evaluate the probability of deficiencies, excesses or imbalances.
• Serve as a basis for making fertilizer recommendations.
• Determine the soil pH.
What does a soil tests show
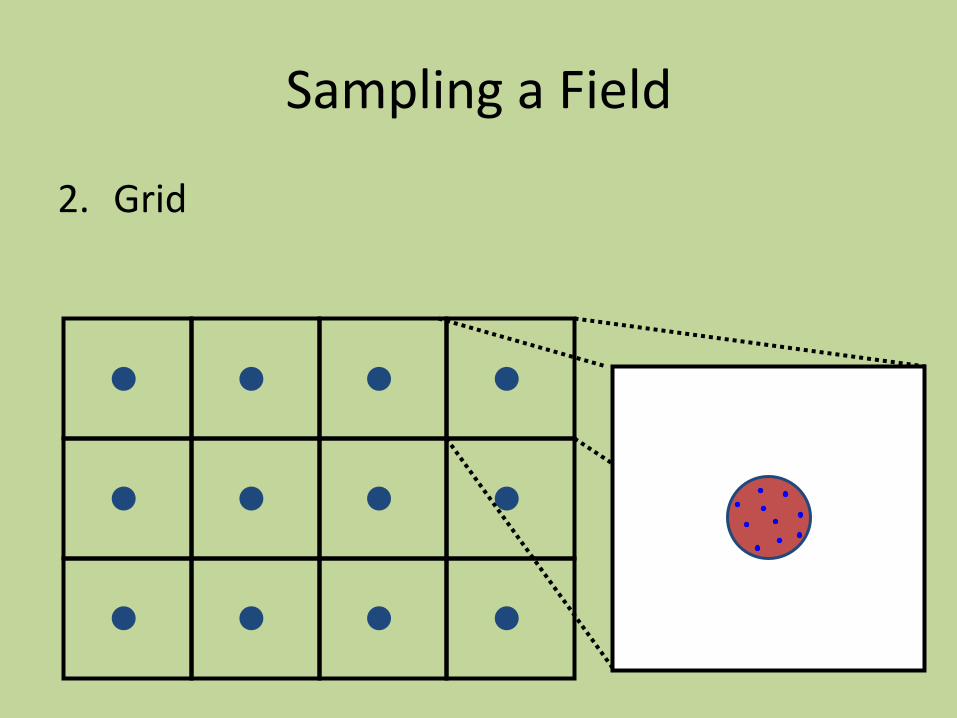
Sampling a Field
2. Grid
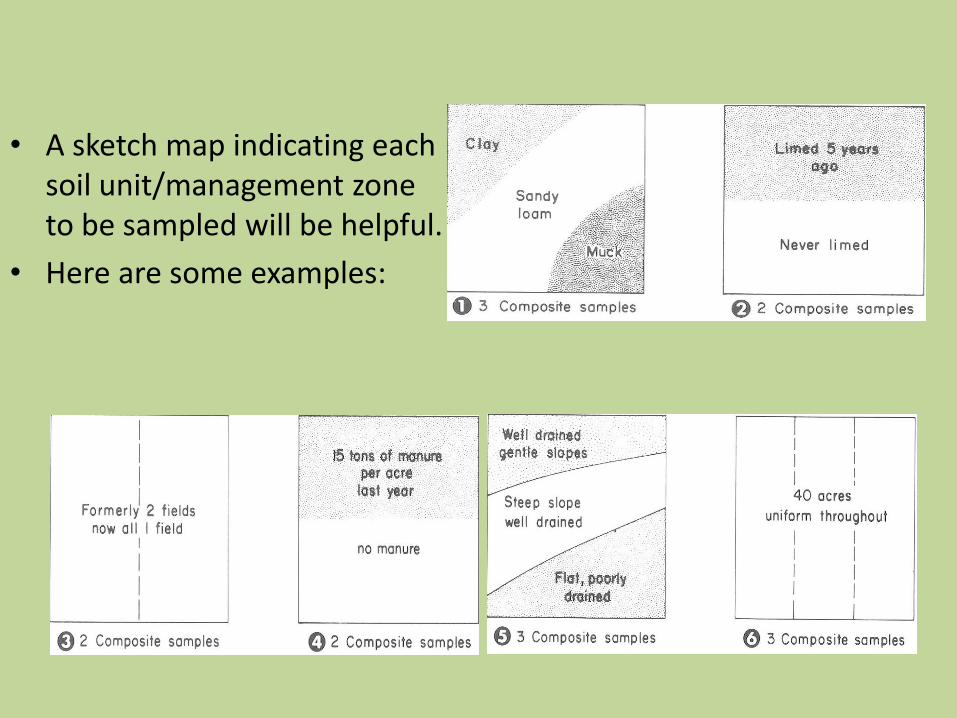
• A sketch map indicating each soil unit/management zone to be sampled will be helpful.
• Here are some examples:
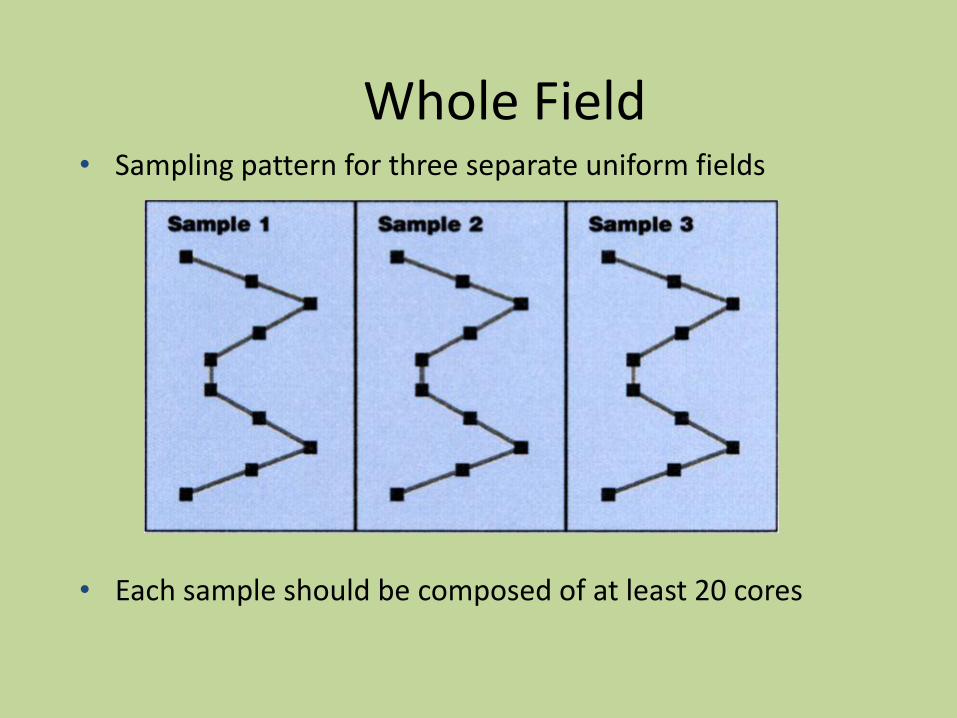
Whole Field • Sampling pattern for three separate uniform fields
• Each sample should be composed of at least 20 cores
Grid – Systematic sampling
• Used where nutrients will be applied variably
• Can be useful if purchase/rent new ground and past history not well known
• Plus – good assessment of nutrient variability
• Minus – expensive
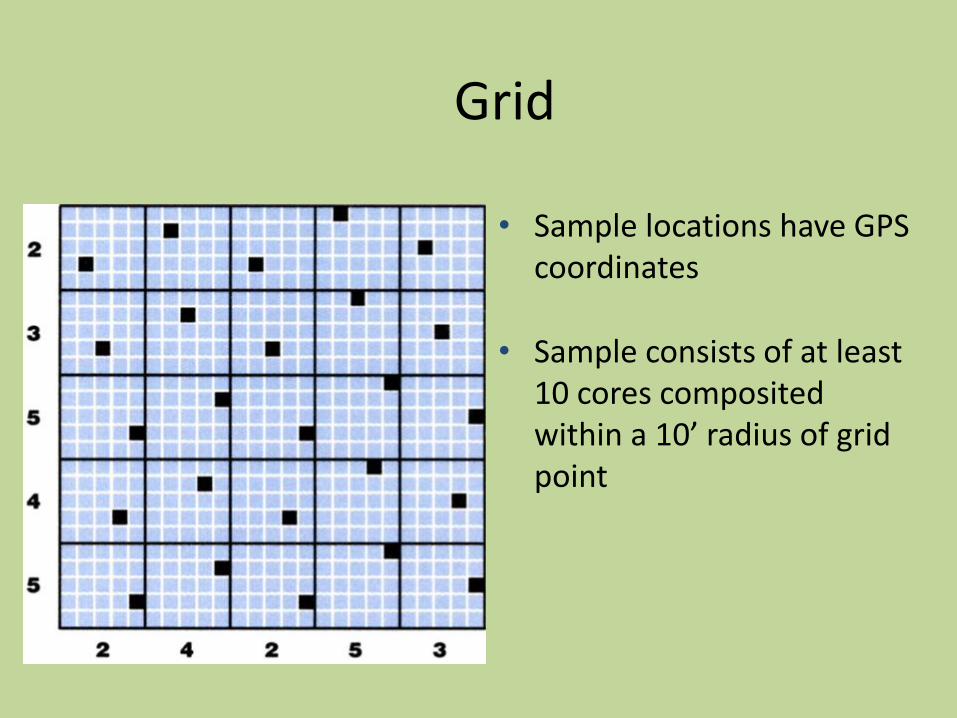
Grid
• Sample locations have GPS coordinates
• Sample consists of at least 10 cores composited within a 10’ radius of grid point
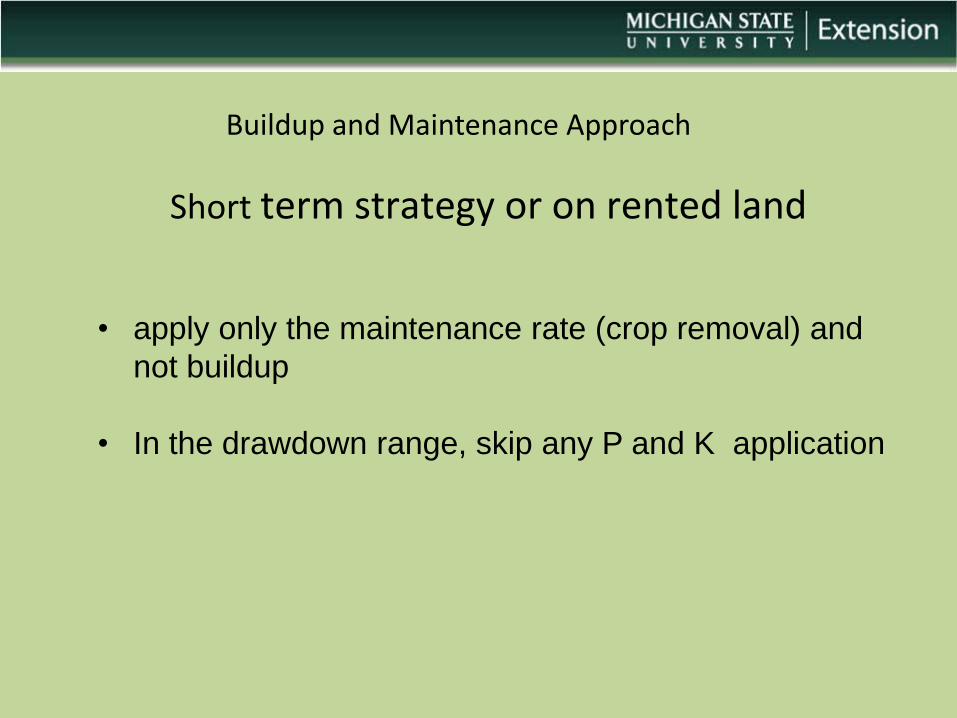
Buildup and Maintenance Approach
• apply only the maintenance rate (crop removal) and
not buildup
• In the drawdown range, skip any P and K application
Short term strategy or on rented land
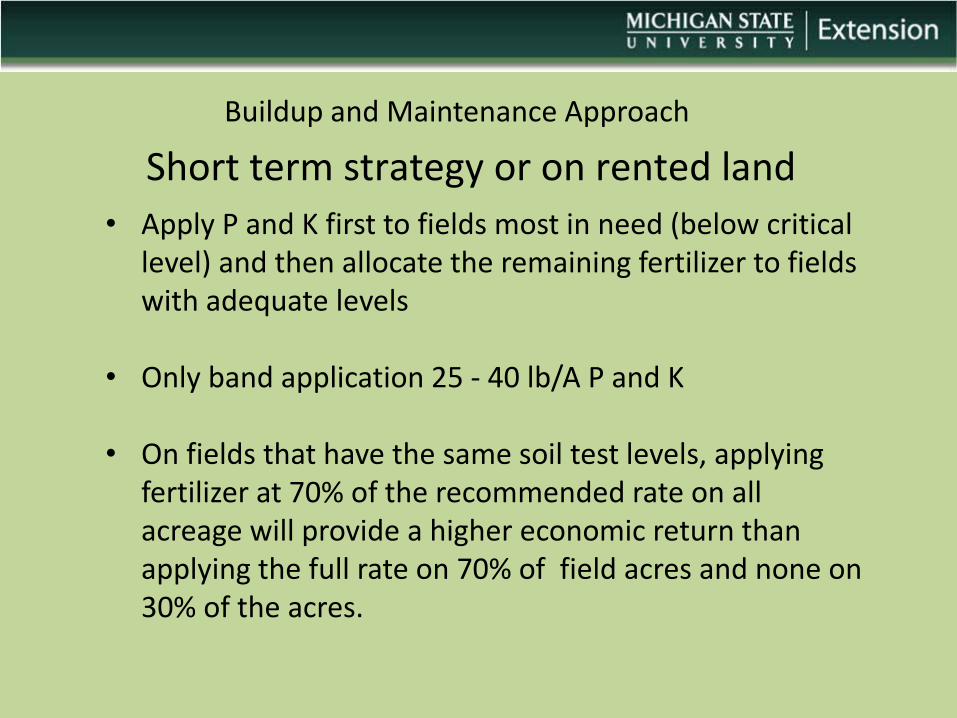
Buildup and Maintenance Approach
Short term strategy or on rented land
• Apply P and K first to fields most in need (below critical level) and then allocate the remaining fertilizer to fields with adequate levels
• Only band application 25 - 40 lb/A P and K
• On fields that have the same soil test levels, applying fertilizer at 70% of the recommended rate on all acreage will provide a higher economic return than applying the full rate on 70% of field acres and none on 30% of the acres.
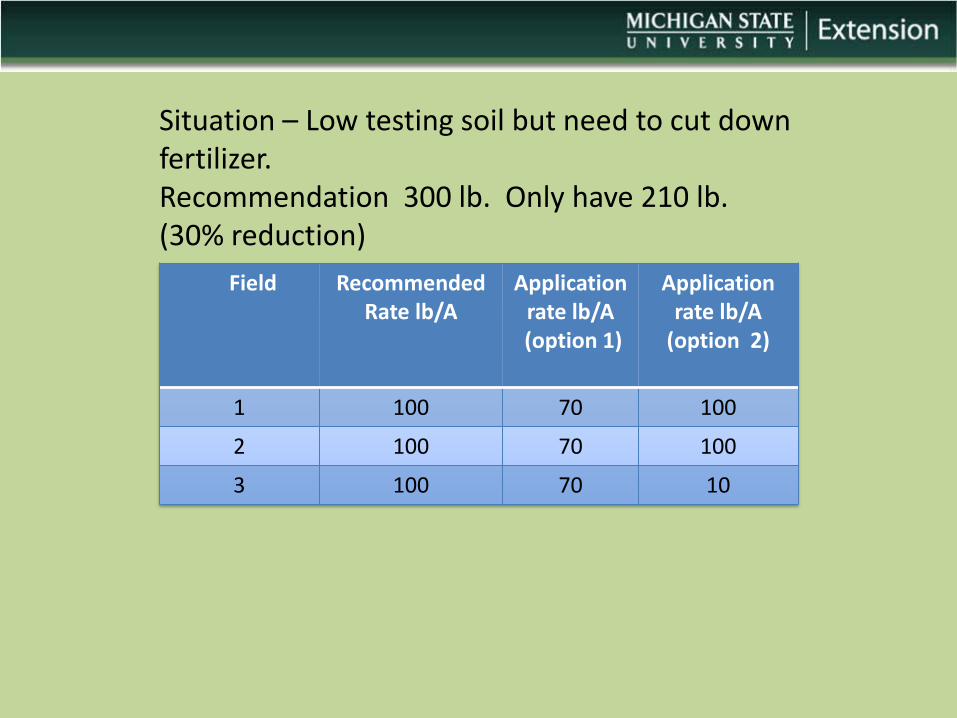
Field Recommended Rate lb/A
Application rate lb/A
(option 1)
Application rate lb/A
(option 2)
1 100 70 100
2 100 70 100
3 100 70 10
Situation – Low testing soil but need to cut down fertilizer. Recommendation 300 lb. Only have 210 lb. (30% reduction)
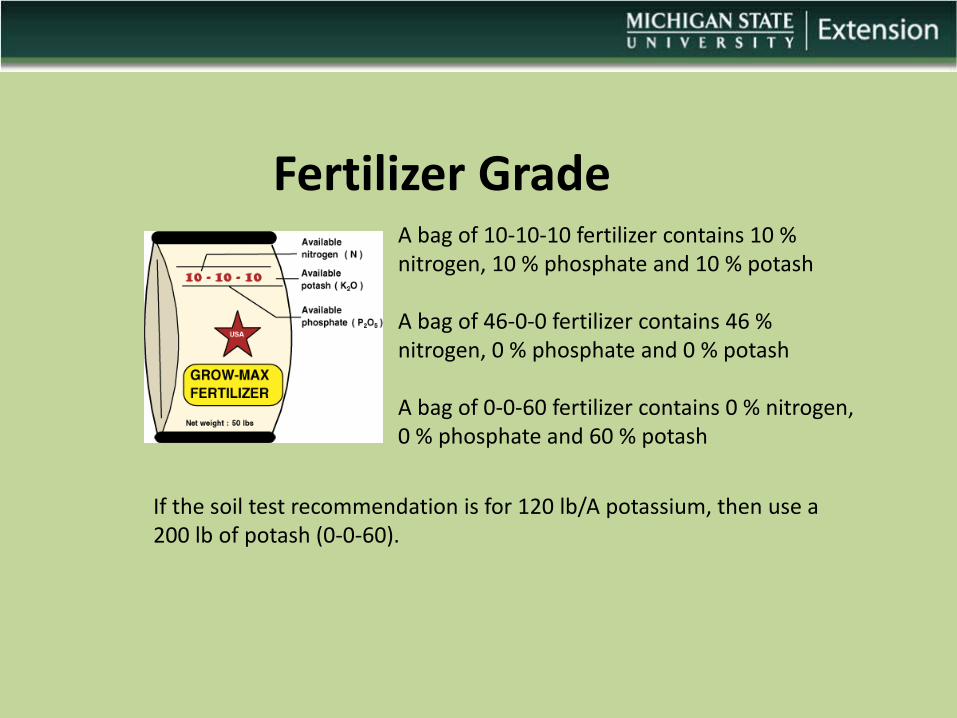
Fertilizer Grade A bag of 10-10-10 fertilizer contains 10 % nitrogen, 10 % phosphate and 10 % potash A bag of 46-0-0 fertilizer contains 46 % nitrogen, 0 % phosphate and 0 % potash A bag of 0-0-60 fertilizer contains 0 % nitrogen, 0 % phosphate and 60 % potash
If the soil test recommendation is for 120 lb/A potassium, then use a 200 lb of potash (0-0-60).
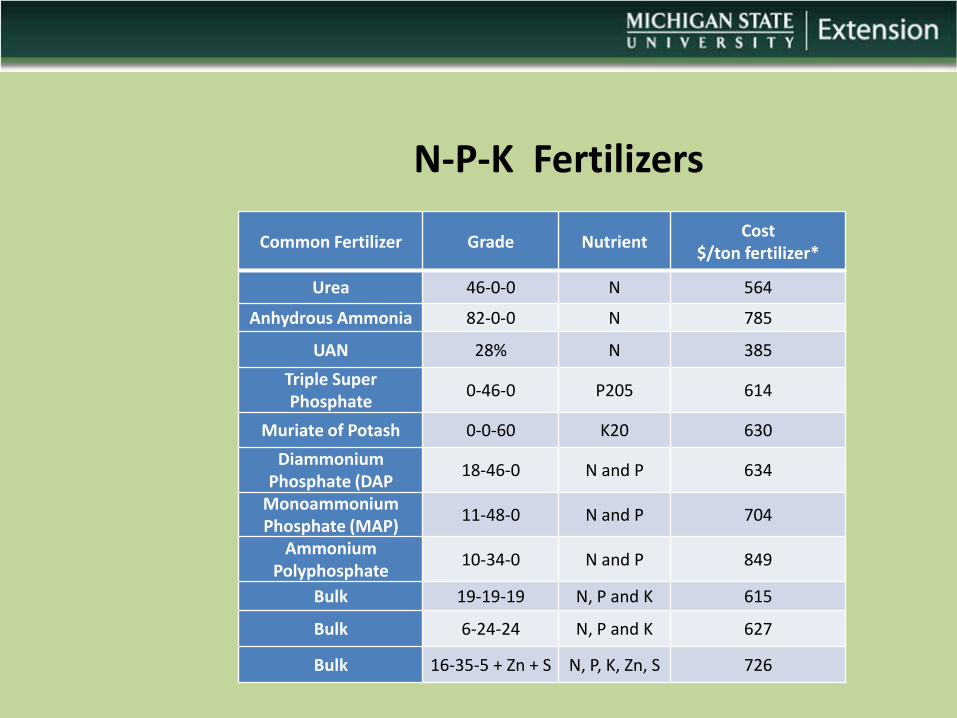
N-P-K Fertilizers
Common Fertilizer Grade Nutrient Cost
$/ton fertilizer*
Urea 46-0-0 N 564
Anhydrous Ammonia 82-0-0 N 785
UAN 28% N 385
Triple Super Phosphate
0-46-0 P205 614
Muriate of Potash 0-0-60 K20 630
Diammonium Phosphate (DAP
18-46-0 N and P 634
Monoammonium Phosphate (MAP)
11-48-0 N and P 704
Ammonium Polyphosphate
10-34-0 N and P 849
Bulk 19-19-19 N, P and K 615
Bulk 6-24-24 N, P and K 627
Bulk 16-35-5 + Zn + S N, P, K, Zn, S 726
Top Related