


Languages
Pages
Legal


STRENGTHENING NATIONAL COMPREHENSIVE AGRICULTURAL PUBLIC EXPENDITURE IN SUB-SAHARAN
AFRICA
Agricultural Public Expenditure Training WorkshopAccra, Ghana
(April 13 -14, 2011)
MODULE 3SPECIALIZED STUDIES:
EXPENDITURE COMPONENT IMPACT EVALUATION

CONTENTS
I) BACKGROUND
II) OBJECTIVE/SCOPE
III) METHODOLOGY
IV) DATA SOURCES
V) PROCESS
VI) TA TEAM
VII) TIMELINE
2

I) BACKGROUND
• A common constraint in most SSA countries is the absence of sound impact studies on agriculture public expenditures (AgPEs).
• Such impact studies could help enhance substantially the outcomes and sustainability of AgPEs.
• Expenditure component impact evaluation (IE) comprise one of the key components of the specialized studies, focusing on outcomes of AgPEs.
• There are template TOR for IE (A3.1), to help ensure a checklist of key items for soundness, country consistency and comparisons, and which draw for their methodology on various reports.
Background Objective/Scope Methdology Data Sources Process TA Team Timeline
3

II) OBJECTIVES AND SCOPE Objectives:• To assist governments in SSA to enhance the
outcomes and sustainability of their agriculture sector programming and budgeting and the efficiency and effectiveness of their AgPEs.
• To strengthen the evidence base for policy making, scaling-up successful programmes, identifying corrective actions in existing programmes to ensure that both current and future investments in key subsectors generate the expected and sustainable outcomes.
• To help create a “management-for-results” environment and capacity, with a focus on enhancing the efficiency of budget planning, execution and analytical assessment.Background Objective/Scope Methdology Data Sources Process TA Team Timeline
4
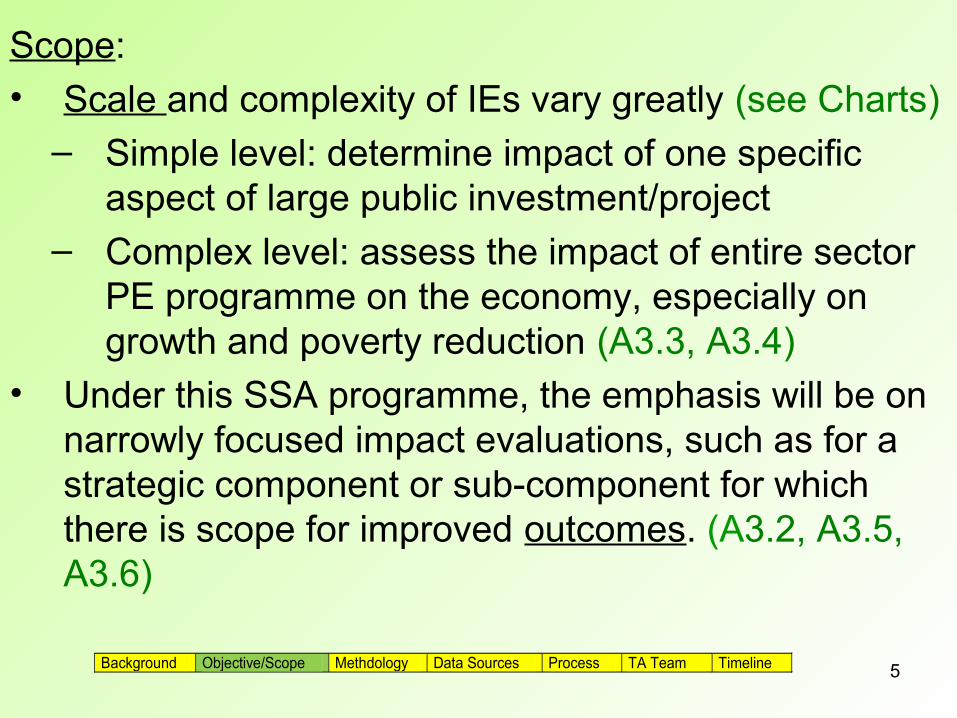
Scope:• Scale and complexity of IEs vary greatly (see Charts)
– Simple level: determine impact of one specific aspect of large public investment/project
– Complex level: assess the impact of entire sector PE programme on the economy, especially on growth and poverty reduction (A3.3, A3.4)
• Under this SSA programme, the emphasis will be on narrowly focused impact evaluations, such as for a strategic component or sub-component for which there is scope for improved outcomes. (A3.2, A3.5, A3.6)
Background Objective/Scope Methdology Data Sources Process TA Team Timeline
5
Impact Assessment: Selected Country Examples……
• The Vietnam Agriculture PER (Volume II) (World Bank 2005b) relied on existing impact studies showing that government expenditure have been crucial to growth and poverty reduction in Vietnam. Two studies have measured the impact of this spending. The first, by Fan et al (2004, from IFPRI) found that government spending on irrigation, roads and agricultural research has contributed to both agriculture growth and poverty reduction. The second study, by Baker et al (2002), estimated determinants of agriculture growth for the same period and found that public investment in irrigation was the most important source of agriculture growth (accounting for 28 percent of the growth), followed by agriculture research (27 percent). An important finding from these two studies is that while irrigation has been the largest source of growth, the aggregate irrigation investment programmed has become uneconomic. The conclusion is that the sector expenditure program should select only those irrigation investments with acceptable rates of return and that savings should be reallocated to high-return activities, particularly agricultural research.
•
6
Impact Assessment: Selected Country Examples
The Nigeria agriculture PER (World Bank 2008a) summarizes key findings from a comprehensive literature review used to analyze the impact of agricultural research and extension in the country. The agriculture PER also undertakes qualitative assessment of the core agricultural subsectors in relation to their institutional and public finance characteristics. These sub-sectors include: agricultural input supply and subsidies, agricultural financial services, national strategic food reserve.
7

Summary Empirical IA of NAADS Program:
8
Impact Assessment: Selected Country Examples (cont.)
The Ghana Agriculture PER (2008) highlights that lack of information limit the possibility to conduct impact analysis on key subsectors. Required data include: (i) time-series data, disaggregated by region and district, on government and other public expenditures on the various agricultural subsectors (crops, livestock, fishery, forestry, and natural resource management) and data on (ii) functions or activities (research, extension and training, marketing, inputs (such as seed, fertilizer, and chemicals), and infrastructure (irrigation, feeder roads, marketing information system, and post-harvest handling). However, the Ghana agriculture PER uses various quantitative methods to assess the effectiveness of public spending, including benefit-incidence analysis of impacts at the local level. Data from the fifth Ghana Living Standards Survey were used to understand the geographical distribution of households’ income and showed that the effects of ongoing poverty reduction strategy were mainly benefitting the South of the country, deepening the divide between North and South.
9
Impact Assessment: Selected Country Examples (cont.)
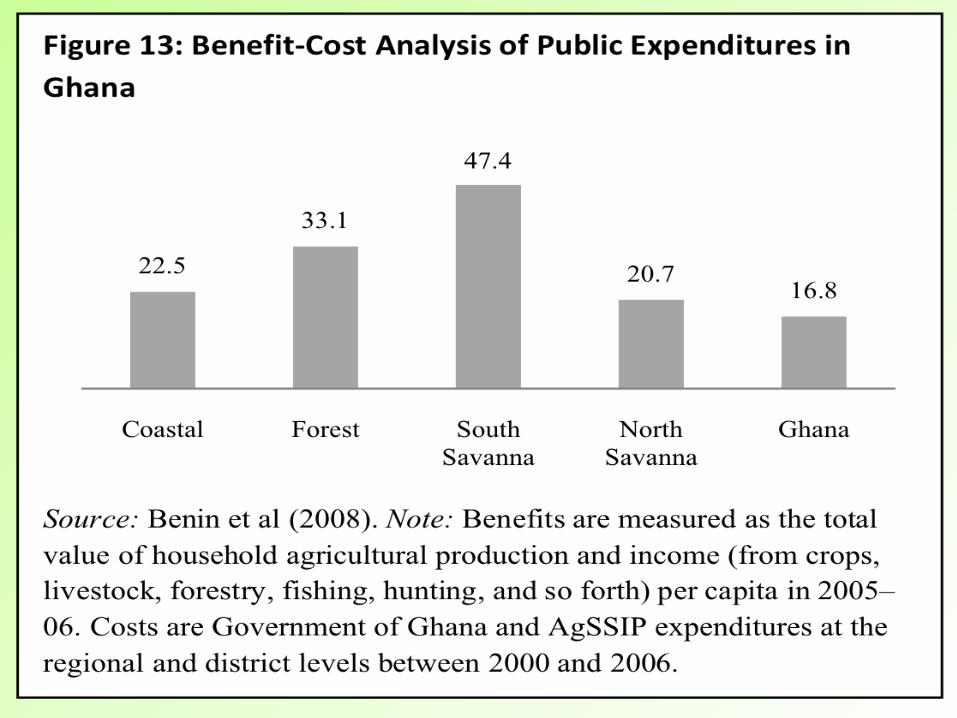
Econometric analysis from Benin et al (2008) was used to guide new efforts to target agricultural and rural development analysis (case of Ghana). A cost-benefit analysis was undertaken. Results showed (i) that different agro-ecological zones have different comparative advantage in production; (ii) that there is a trade-off between allocating resources to areas where the growth effects are highest (Southern Savannah) and areas where the prevalence of poverty is highest (Northern Savannah). Results suggested that an effective strategy should take into account returns associated with different types of agriculture expenditures (e.g.: extension, research, input support or irrigation) in different regions.
10
11
Impact Assessment: Selected Country Examples (cont.)
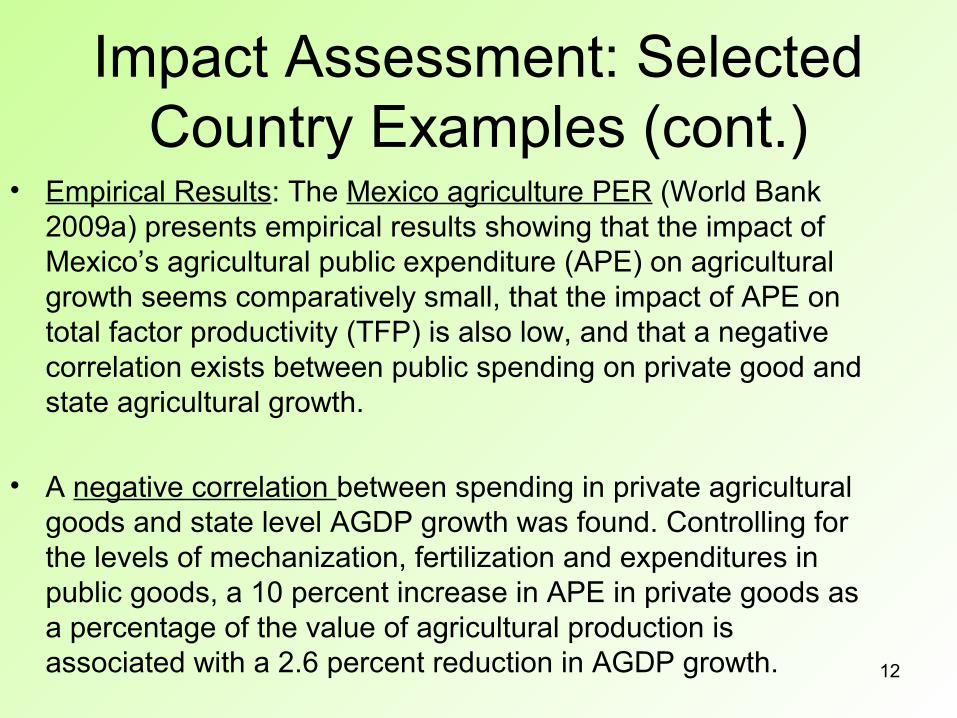
• Empirical Results: The Mexico agriculture PER (World Bank 2009a) presents empirical results showing that the impact of Mexico’s agricultural public expenditure (APE) on agricultural growth seems comparatively small, that the impact of APE on total factor productivity (TFP) is also low, and that a negative correlation exists between public spending on private good and state agricultural growth.
• A negative correlation between spending in private agricultural goods and state level AGDP growth was found. Controlling for the levels of mechanization, fertilization and expenditures in public goods, a 10 percent increase in APE in private goods as a percentage of the value of agricultural production is associated with a 2.6 percent reduction in AGDP growth. 12

Ghana Uganda Tanzania Ethiopia China India Thailand
Agriculture 16.8 12.4 12.5 0.14 6.8 13.5 12.6
Education -0.2 7.2 9 0.56 2.2 1.4 2.1
Health 1.3 0.9 n.e. -0.03 n.e. 0.8 n.e.
Roads 8.8 2.7 9.1 4.22 1.7 5.3 0.9
Agriculture n.e. 1 2 n.e. 2 2 1
Education n.e. 3 1 n.e. 1 3 3
Health n.e. 4 n.e. n.e. n.e. 4 n.e.
Roadsd n.e. 2 3 n.e. 3 1 2
Sector
Returns to agriculture or rural income
(local currency/local currency spending)b
Ranking in returns to poverty reduction
However, other countries achieve positive returns to agricultural public investments

-0.3
-0.2
-0.1
0
0.1
0.2
0.3
0.4
0.5
Private Goods
Public
Equity
Confidence interval (95%) for the correlation with Ag. Domestic Growth (ADP)
- 0.052
+ 0.143
+ 0.081
Dissaggregaed Impact Analysis of GPA: Case of Guatemala (1980 – 2008)
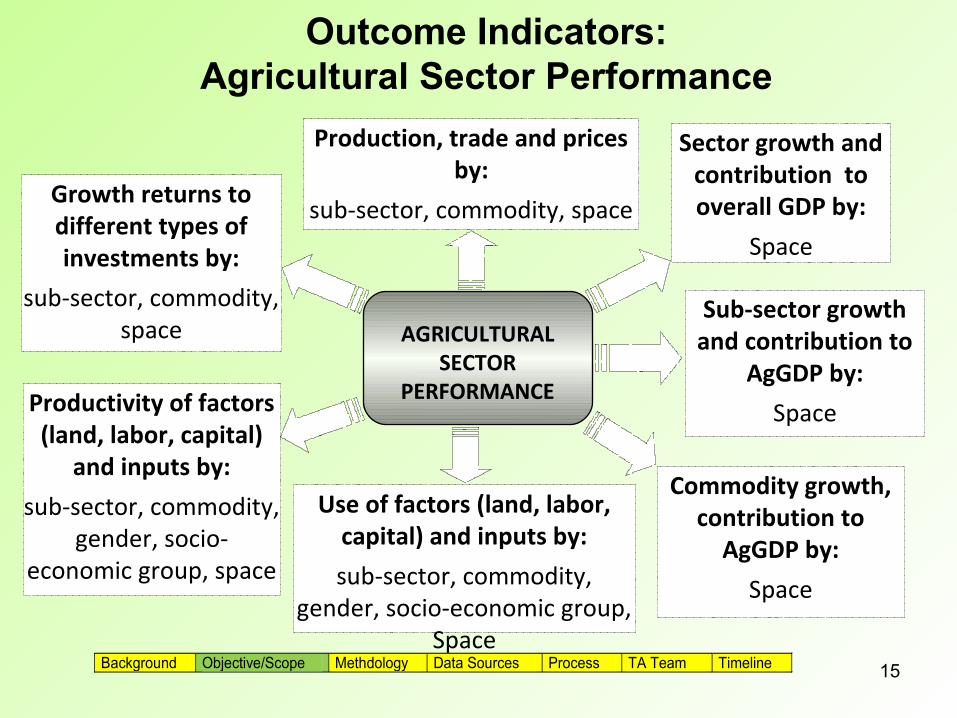
Outcome Indicators:Agricultural Sector Performance
AGRICULTURAL SECTOR
PERFORMANCE
Use of factors (land, labor, capital) and inputs by:
sub-sector, commodity, gender, socio-economic group,
Space
Growth returns to different types of investments by:
sub-sector, commodity, space
Sub-sector growth and contribution to
AgGDP by:
Space
Commodity growth, contribution to
AgGDP by:
Space
Productivity of factors (land, labor, capital)
and inputs by:
sub-sector, commodity, gender, socio-
economic group, space
Sector growth and contribution to overall GDP by:
Space
Production, trade and prices by:
sub-sector, commodity, space
Background Objective/Scope Methdology Data Sources Process TA Team Timeline
15
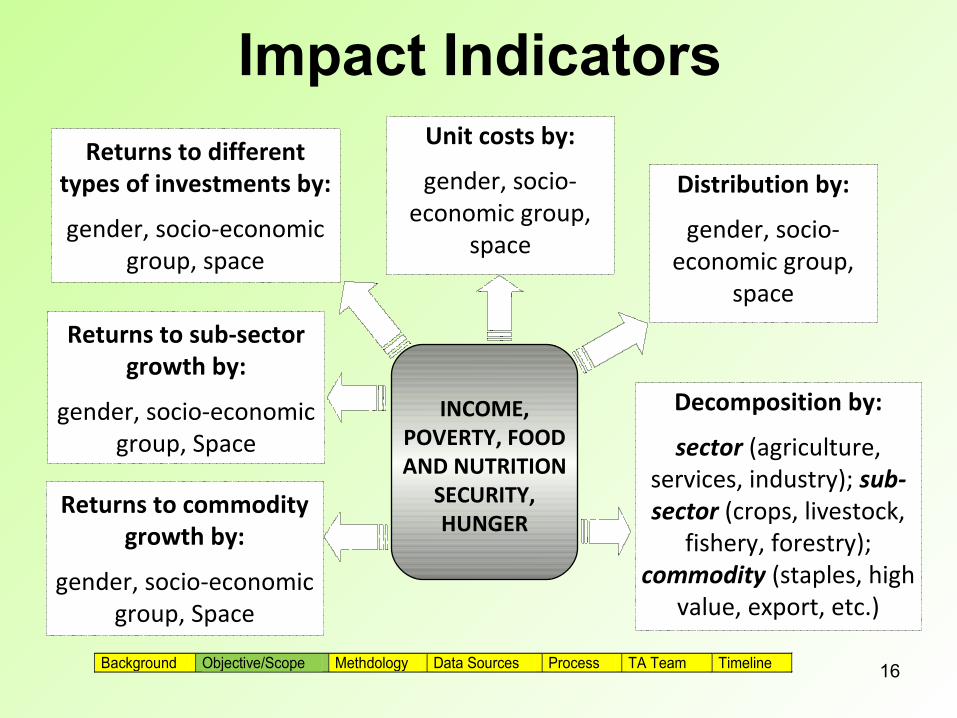
Impact Indicators
INCOME, POVERTY, FOOD AND NUTRITION
SECURITY, HUNGER
Returns to different types of investments by:
gender, socio-economic group, space
Decomposition by:
sector (agriculture, services, industry); sub-sector (crops, livestock,
fishery, forestry); commodity (staples, high
value, export, etc.)
Distribution by:
gender, socio-economic group,
space
Returns to commodity growth by:
gender, socio-economic group, Space
Unit costs by:
gender, socio-economic group,
space
Returns to sub-sector growth by:
gender, socio-economic group, Space
Background Objective/Scope Methdology Data Sources Process TA Team Timeline
16

Study Focus Themes: • Each evaluation is likely to cover just one of the following key themes:
– Extension and training– Agricultural research– Input supply interventions– Support for marketing and value chains– Infrastructure development (such as: irrigation, feeder roads, others)– Support for a specific commodity, product group (such as specific
crops, livestock, fisheries, or forestry products), value chain analysis– Institutional issues such as access to land/credit
Country Selection Criteria: Impact evaluation studies should be conducted in countries which meet key criteria, including: adequate level of PEM; functional M&E framework; completed “Basic” Ag. PER; Govt. “openness”
Institutional Scope: Choice of thematic focus of IA will determine responsible and collaborating institution (normally MOA)
Background Objective/Scope Methdology Data Sources Process TA Team Timeline
17
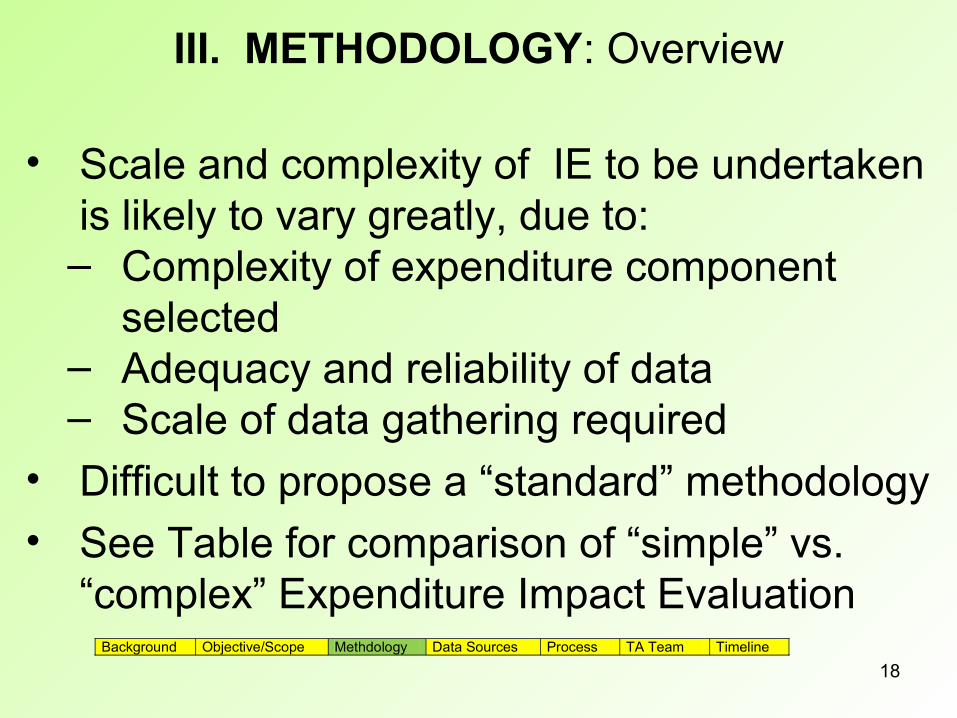
III. METHODOLOGY: Overview
• Scale and complexity of IE to be undertaken is likely to vary greatly, due to:
– Complexity of expenditure component selected
– Adequacy and reliability of data– Scale of data gathering required
• Difficult to propose a “standard” methodology
• See Table for comparison of “simple” vs. “complex” Expenditure Impact Evaluation
Background Objective/Scope Methdology Data Sources Process TA Team Timeline 18

Simple vs. Complex Impact EvaluationsSimple Evaluation Complex Evaluation
Study Focus • Small country• Comparatively new service or programme• Largely undifferentiated population with respect to topic• Centrally managed
• Large country• Large-scale, long-term service• Need for careful stratification of sample• Many administrative layers• Decentralized responsibilities
Data Availability • Good M&E system in place• Baseline undertaken• Target and non-target population data available
• Poor or non-existent M&E system• No baseline data available• Data do no address survey issues
Data Gathering • TA team• Small counterpart team
• TA team• Counterparts• Interviewers/enumerators
Additional Costs • Small – can be accommodated within existing budget
• Substantial costs for hiring and mobilizing interviewers and enumerators
Background Objective/Scope Methdology Data Sources Process TA Team Timeline
19
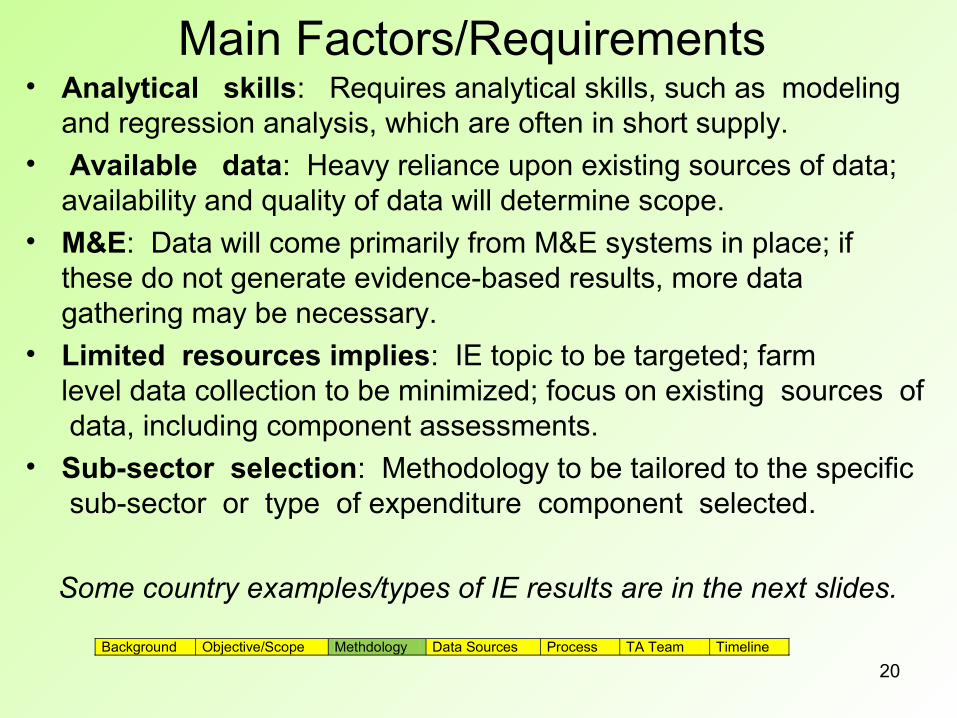
Main Factors/Requirements • Analytical skills: Requires analytical skills, such as modeling
and regression analysis, which are often in short supply.
• Available data: Heavy reliance upon existing sources of data; availability and quality of data will determine scope.
• M&E: Data will come primarily from M&E systems in place; if these do not generate evidence-based results, more data gathering may be necessary.
• Limited resources implies: IE topic to be targeted; farm level data collection to be minimized; focus on existing sources of data, including component assessments.
• Sub-sector selection: Methodology to be tailored to the specific sub-sector or type of expenditure component selected.
Some country examples/types of IE results are in the next slides.
Background Objective/Scope Methdology Data Sources Process TA Team Timeline 20

Uganda - Effects of Rural Investment
• Returns in shilling per shilling Investment
• Number of poor reduced per million shillings investment
0
5
10
15
20
Cen
tral
East
Nor
th
Wes
t
Uga
nda
Agricultural R&D
Education
Feeder Roads
Health
0
5
10
15
20
Cen
tral
Eas
t
Nor
th
Wes
t
Uga
nda
Agricultural R&D
Education
Feeder Roads
Health
Background Objective/Scope Methdology Data Sources Process TA Team Timeline
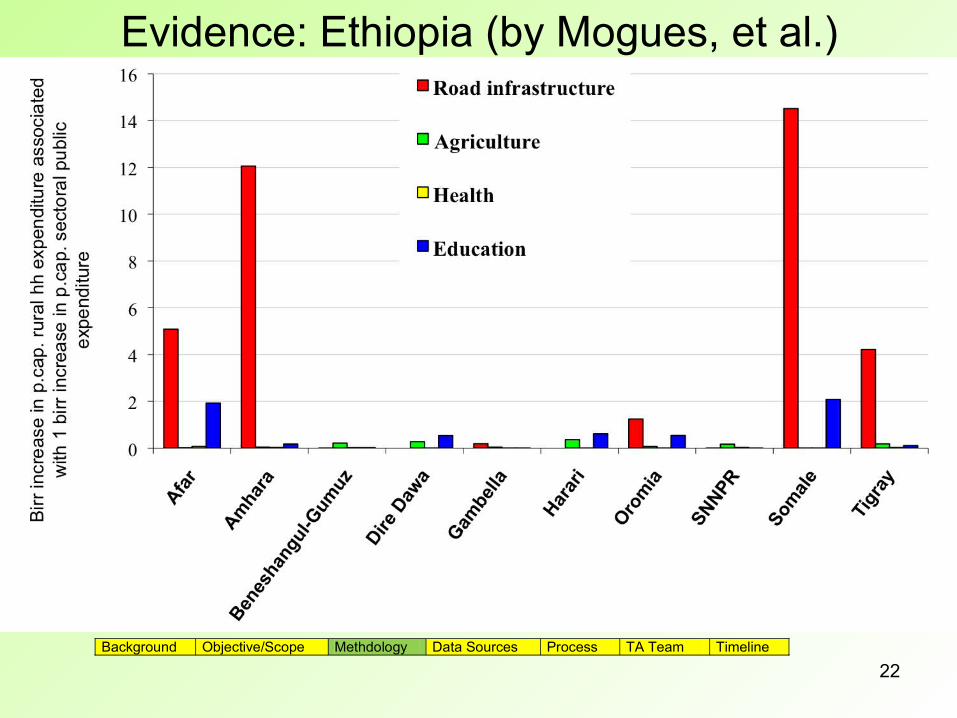
Evidence: Ethiopia (by Mogues, et al.)
Background Objective/Scope Methdology Data Sources Process TA Team Timeline 22

Summary of Public Investment Impact(Mogues, et al.)
Ghana Uganda Tanzania Ethiopia China India Thailand
Agriculture 16.8 12.4 12.5 0.14 6.8 13.5 12.6
Education -0.2 7.2 9 0.56 2.2 1.4 2.1
Health 1.3 0.9 n.e. -0.03 n.e. 0.8 n.e.
Roads 8.8 2.7 9.1 4.22 1.7 5.3 0.9
Agriculture n.e. 1 2 n.e. 2 2 1
Education n.e. 3 1 n.e. 1 3 3
Health n.e. 4 n.e. n.e. n.e. 4 n.e.
Roadsd n.e. 2 3 n.e. 3 1 2
Sector
Returns to agriculture or rural income
(local currency/local currency spending)b
Ranking in returns to poverty reduction
Background Objective/Scope Methdology Data Sources Process TA Team Timeline 23

What Have We Learnt from Impact Studies?• Targeted spending needed for agricultural growth
and poverty reduction– Agricultural research/extension, rural infrastructure
and education have largest impact on both growth and poverty reduction
• Impact of spending changes over time– Subsidies initially important to promote use of
technologies, but need to be phased out over time– Irrigation often has large returns during initial stage
of development
• Large regional variations in impact exist within countries
Background Objective/Scope Methdology Data Sources Process TA Team Timeline 24

Main Steps for Conducting IEStep 1: Selection of Evaluation Topic: consensus by key actors• Selection Criteria:
– Programme is a core part of the sector– Programme share of total public expenditure in the sector
is large (say, >20%)– There is scope for replication or scaling-up– It has innovative features, but where the impact needs
substantiation– It is a substantial programme, but there are questions
over its impact and sustainability
TA team to propose research hypotheses and “results chains” to facilitate public investment-to-impacts linkages and focus
Background Objective/Scope Methdology Data Sources Process TA Team Timeline 25
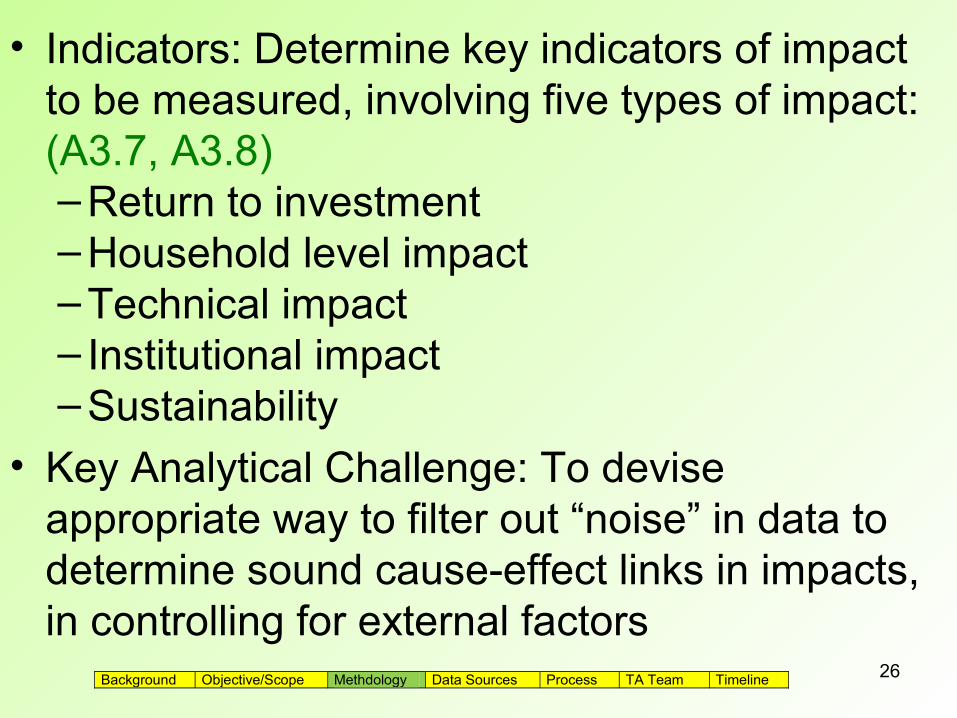
• Indicators: Determine key indicators of impact to be measured, involving five types of impact: (A3.7, A3.8)– Return to investment– Household level impact– Technical impact– Institutional impact– Sustainability
• Key Analytical Challenge: To devise appropriate way to filter out “noise” in data to determine sound cause-effect links in impacts, in controlling for external factors
Background Objective/Scope Methdology Data Sources Process TA Team Timeline
26

Main Steps for Conducting IE (cont.)Step 2: Assessment of Data & Information Sources:
Key Features to include:– Time series – Level of detail – Quality – Baseline – Raw data
Secondary information and other data sources (evaluations, beneficiary impact assessments) are to be used for consistency cross-checks
Background Objective/Scope Methdology Data Sources Process TA Team Timeline 27

Main Steps for Conducting IE (cont.)
Step 3: Supplementary Data Gathering – Key Steps
(a) Design Sample and questionnaire: will involve qualitative and quantitative data;
(b) Prepare draft questionnaire: simplify, tailor to the various admin. levels, and test;
(c) Implement Survey: simple and complex evaluations will entail different requirements;
(d) Conduct Case Studies: can generate useful insights, especially if quality data are lacking.
Background Objective/Scope Methdology Data Sources Process TA Team Timeline 28

Main Steps for Conducting IE (cont.)
Step 4: Key components -
(a) Data analysis: to be carried out by TA team
(a) Reporting: summary of the data analysis and initial conclusions of the evaluation
(c) Dissemination of IE report: to be agreed with key agency and to be discussed at a workshop with key stakeholders
Background Objective/Scope Methdology Data Sources Process TA Team Timeline 29

Methodology: Conclusions and Recommendations
• Emerging directly from the IE analysis• Arising beyond the scope of the IE report:
– Where data availability or quality have proved to be an issue, there will be a need to introduce a functional or enhanced M&E framework for the sector
– The creation of institutional and sectoral data systems to enable better analysis in the future
Background Objective/Scope Methdology Data Sources Process TA Team Timeline 30
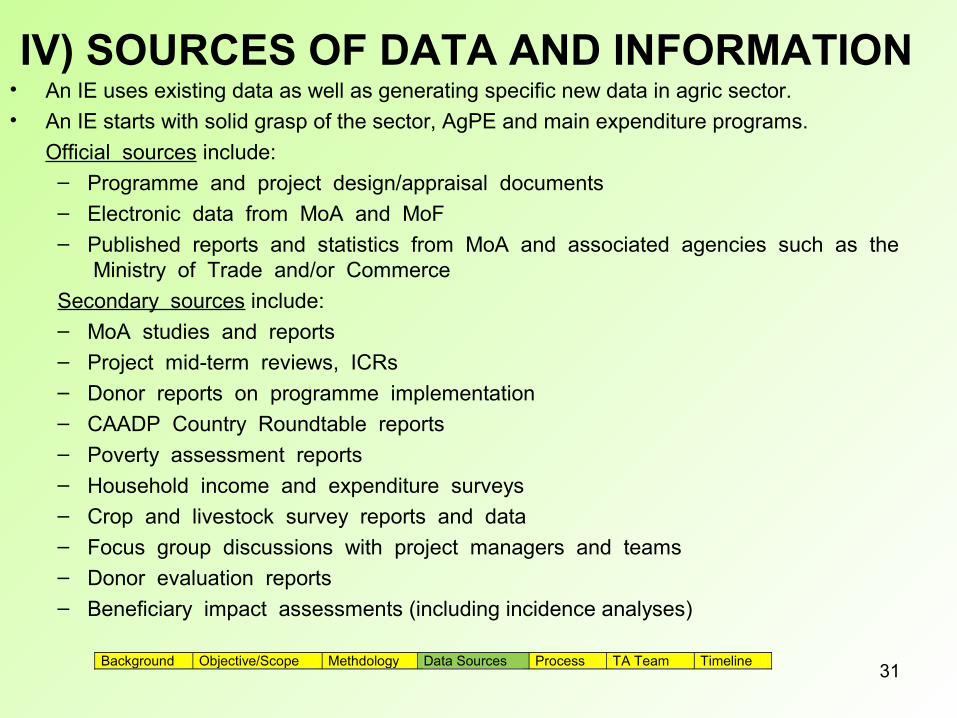
IV) SOURCES OF DATA AND INFORMATION• An IE uses existing data as well as generating specific new data in agric sector.• An IE starts with solid grasp of the sector, AgPE and main expenditure programs.
Official sources include:– Programme and project design/appraisal documents– Electronic data from MoA and MoF– Published reports and statistics from MoA and associated agencies such as the
Ministry of Trade and/or Commerce
Secondary sources include:– MoA studies and reports– Project mid-term reviews, ICRs– Donor reports on programme implementation– CAADP Country Roundtable reports– Poverty assessment reports– Household income and expenditure surveys– Crop and livestock survey reports and data– Focus group discussions with project managers and teams– Donor evaluation reports– Beneficiary impact assessments (including incidence analyses)
Background Objective/Scope Methdology Data Sources Process TA Team Timeline 31
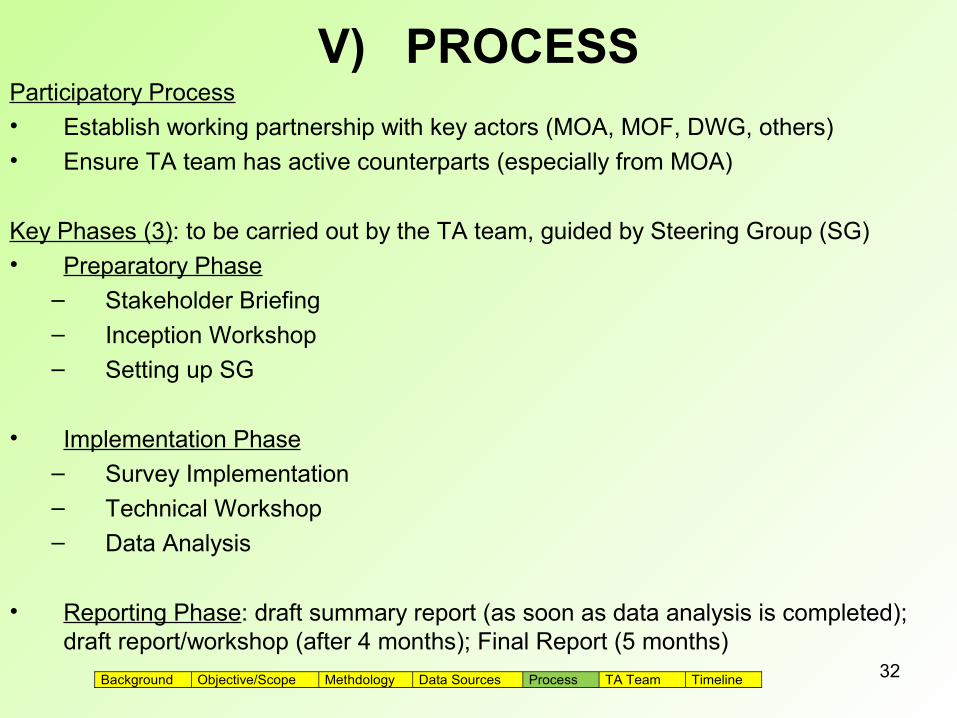
V) PROCESSParticipatory Process• Establish working partnership with key actors (MOA, MOF, DWG, others)• Ensure TA team has active counterparts (especially from MOA)
Key Phases (3): to be carried out by the TA team, guided by Steering Group (SG)• Preparatory Phase
– Stakeholder Briefing
– Inception Workshop– Setting up SG
• Implementation Phase– Survey Implementation
– Technical Workshop– Data Analysis
• Reporting Phase: draft summary report (as soon as data analysis is completed); draft report/workshop (after 4 months); Final Report (5 months)
Background Objective/Scope Methdology Data Sources Process TA Team Timeline
32
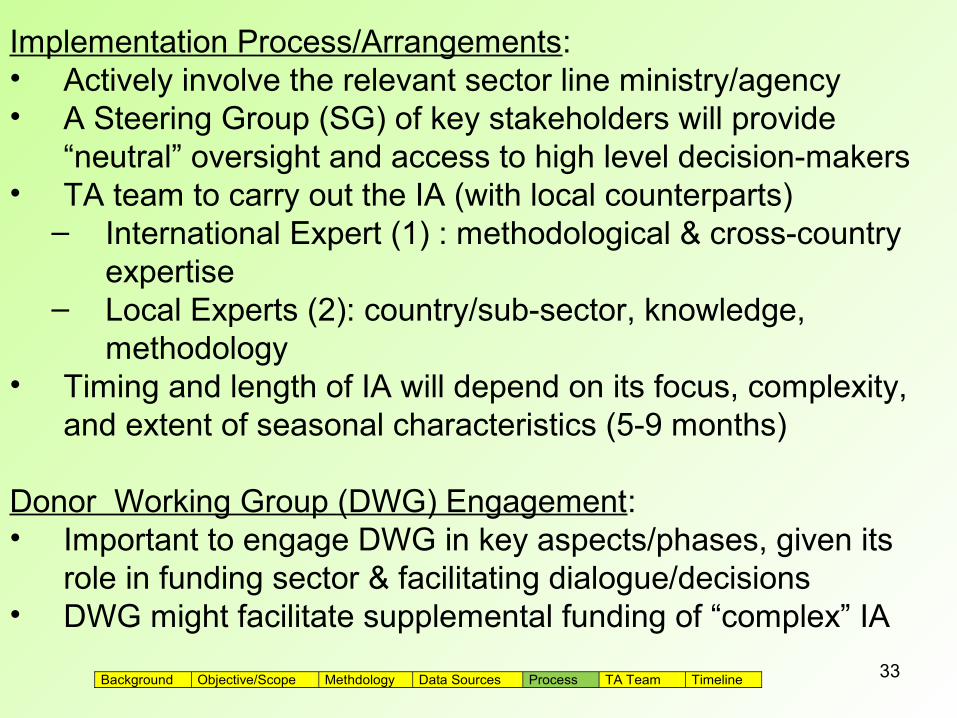
Implementation Process/Arrangements:• Actively involve the relevant sector line ministry/agency• A Steering Group (SG) of key stakeholders will provide
“neutral” oversight and access to high level decision-makers • TA team to carry out the IA (with local counterparts)
– International Expert (1) : methodological & cross-country expertise
– Local Experts (2): country/sub-sector, knowledge, methodology
• Timing and length of IA will depend on its focus, complexity, and extent of seasonal characteristics (5-9 months)
Donor Working Group (DWG) Engagement:• Important to engage DWG in key aspects/phases, given its
role in funding sector & facilitating dialogue/decisions• DWG might facilitate supplemental funding of “complex” IA
Background Objective/Scope Methdology Data Sources Process TA Team Timeline
33

VI) TA TEAM: Tasks and Outputs
TA team, in collaboration with MOA, to conduct the following tasks/outputs: • Discuss with government & donors the evaluation topic• Help to refine the research hypothesis• Prepare a “results chain”/expenditure-outcome linkages• Design the supplementary data gathering (as needed)• Carry out data analysis• Carry out on-the-job training in impact evaluation methodology and
management• Design/manage inception, technical & draft report workshops• Liaise with the donor working group • Formulate recommendations for enhancing sector M&E systems and the
utilization of evaluation results• Ensure all evaluation data utilized can be put online• Prepare a summary report and a full evaluation report
Background Objective/Scope Methdology Data Sources Process TA Team Timeline 34
TA Team: Main Reports and Data Base Main Reports (based on consultation with key stakeholders):• Inception report: within two weeks of study launch, and raises key
issues.• Summary report: presents the main results of the evaluation.• Full evaluation report: within one month of the completion of the
initial analysis, presents main conclusions and recommendations.• Final report: 5-9 months, incorporates key feedback.
Database• The TA team, in collaboration with MoA and MoF, will establish a
database including: background documents and sources; evaluation methodology; data sampling frame and questionnaires; survey data, analytical working papers & analyses that can be put online.
• Database will be used for capacity building purposes as part of a joint learning activity under the overall public expenditure programme.
Background Objective/Scope Methdology Data Sources Process TA Team Timeline 35
VII) TIMELINE
• About 5 months, for simple evaluation, and up to 9 months for “complex” evaluation, especially involving supplementary data.
Resources Required:• TA Consultant Team (1 international +
2 local experts), each working about 12 weeks
• MOA and/or other relevant agency to provide one full-time counterpart or team equivalent for each consultant
• Think tanks, universities and other local participants will be encouraged to participate, but not remunerated
• For “complex” IEs, additional funds will need to be mobilized from other sources (ex. DWG)
Background Objective/Scope Methdology Data Sources Process TA Team Timeline 36

KEY REFERENCES/DOCUMENTS(See Annex 3 for selected excerpts)
A3.1: Template TOR for Ag. Expenditure Component Impact Evaluation (June 2010)
A3.2: Returns to spending on agricultural extension: the case of the National Agricultural Advisory Services (NAADS) program of Uganda, forthcoming journal article (Journal of Agricultural Economics, 2010) of larger research effort and Uganda Ag. PER (2010), prepared by Sam Benin et al. (IFPRI)
A3.3: Growth and Poverty Reduction Impacts of Public Investments in Agriculture and Rural Areas: Assessment Techniques, Tools, and Guide for Practitioners, prepared by S. Benin et al (IFPRI; Sept., 2008) (Excerpt: table of contents and abstract)
A3.4: Comprehensive Monitoring and Evaluation (M&E) report for the CAADP, B. Omilola et al (ReSAKSS), April 2010 (excerpt: Table of Contents)
A3.5: Country Experience of Impact Evaluation (several country excerpts/examples)
A3.6: Zambia Impact Assessment of the Fertilizer Support Program: Analysis of Effectiveness and Efficiency (World Bank, June 2010)
A3.7: Marginal Returns to Public Spending Across Sectors (several country examples)
A3.8: Elasticity Approaches to Expenditure Analysis
Website references: www.worldbank.org/afr/agperprogram and
web.worldbank.org/apea
Relevant Website references include: (to be completed)
www.worldbank.org/afr/agperprogram
web.worldbank.org/apea
37
Top Related