


Languages
Pages
Legal


CONFIDENTIALAFC Asia Frontier FundSeptember 2013
AFC Asia Frontier Fund May 2017

2
INTRODUCING ASIA FRONTIER CAPITAL
AFC Asia Frontier Fund

3
Proven Expertise In Frontier Markets• Asia Frontier Capital Limited was created in June 2013 through a Management Buy Out from Leopard Capital• The founder and CEO, Thomas Hugger, has more than 20 years experience in investing in Frontier Markets• Licensed by SFC Hong Kong for Type 4 (advising on securities) and Type 9 (asset management)
Asia Frontier Capital Offers Three Funds• AFC Asia Frontier Fund – Launched 30th March 2012• AFC Vietnam Fund – Launched 23rd December 2013• AFC Iraq Fund – Launched 26th June 2015
Attractive Equities Identified in Structured Investment Policy• Asia Frontier Capital has identified equities with good upside potential• The Fund has access to numerous primary and secondary research sources• A Structured Investment and Research process is being followed
AFC Asia Frontier Fund
INTRODUCING ASIA FRONTIER CAPITAL

Our Team
Thomas Hugger, CEO and Fund Manager, has spent 27 years inprivate banking and has been investing in Asian and AfricanFrontier Markets since 1993. He is the former Managing Partner,CFO & COO of Leopard Capital; and was previously a ManagingDirector and Head of Portfolio Management at LGT Bank in HongKong. Mr. Hugger was the founding shareholder of one of thelargest brokerage companies in Bangladesh. He is also a CertifiedFinancial Investment Analyst (CFIA) and Investment Adviser(Switzerland) and a Certified European Federation of FinancialAnalysts Societies (EFFAS) Financial Analyst.
Ahmed Tabaqchali, CIO of Iraq Investments, is an experienced capitalmarkets professional with over 22 years of experience in MENAmarkets as well as the US. He is currently a board member of the CreditBank of Iraq and former Executive Director of NBK Capital, theinvestment banking arm of the National Bank of Kuwait. Prior to theseroles Ahmed was Managing Director and Head of InternationalInstitutional Sales at WR Hambrecht + Co. This followed on from rolesas a Managing Director at KeyBanc Capital Markets and Director &Head of Capital Markets & Institutional Sales at Jefferies Int'l in London.Ahmed is an Iraqi as well as British national and holds a M.Sc. inMathematics from Oxford University in England, a B.Sc. (Hons, 1st class)in Mathematics from Victoria University and a B.Sc. in Mathematicsfrom Canterbury University in New Zealand.
Ruchir Desai, CFA, Senior Investment Analyst, is an MBA graduatein Finance from CUHK Business School at The Chinese University ofHong Kong and is also an alumnus of The Fuqua School of Businessat Duke University where he spent a semester during his MBAprogram. He is also a Chartered Financial Analyst (CFA) charterholder. Prior to being based in Hong Kong, Ruchir was based inMumbai where he spent two years as a Senior Analyst at HandsOnVentures LLC, a private equity group focused on investments in theBusiness Services industry. Prior to this role, he spent three yearsas a Research Analyst at Pioneer Investcorp Ltd, an institutionalbrokerage based in Mumbai.
Peter de Vries, Marketing Director, has over 25 years experience infinance of which 20 in Hong Kong. He is a former Director and SeniorRelationship Manager at Leopard Capital. Prior to that he was anExecutive Vice President at Upbest Financial Services where he wasinvolved with fund raising and deal structuring for real estateinvestment and development projects in Macau. Previously he workedas Executive Vice President at ViewTrade Securities in Hong Kong ashead of the business development for the Asia Pacific region. Mr. DeVries has also held the position of Assistant Vice President at MerrillLynch Asia Pacific. He holds an MBA in finance from Calstate Hayward,and a Masters of Science in Electrical Engineering from TwenteUniversity in the Netherlands. Mr. De Vries is fluent in Dutch, Englishand German.
Scott Osheroff, Regional Research Analyst, holds a Bachelor’sDegree in Business Administration with a Concentration in Financefrom Northeastern University. Prior to joining Asia Frontier Capital,Scott worked with Pathfinder Capital Management in SoutheastAsia and Mongolia. Prior to this role, Scott co-founded a publishingcompany whose principal asset, EmergingFrontiers.com, wasleveraged to provide investment coverage on public and privateinvestments in Asia’s frontier markets. He has spent the last twoyears between Mongolia and Cambodia, and currently resides inYangon, Myanmar.
Ms. Margaret Kwok, Accounting & Administration Executive, has over30 years of prior work experience in accounting, administration, andfinancial services at institutions such as Christfund Securities, PFCInternational, and Guoyuan Securities. She holds advanced levelcertificates in Accounting & Costing from London Chamber ofCommerce & Industry and a Certificate in Accountancy from KwaiChung Technical Institute. Margaret is fluent in Cantonese, Mandarinand English.
4AFC Asia Frontier Fund
OUR TEAM

Our Team
Thomas Hugger, CEO and Fund Manager,has spent 27 years in private banking and hasbeen investing in Asian and African FrontierMarkets since 1993. He is the formerManaging Partner, CFO & COO of LeopardCapital; and was previously a ManagingDirector and Head of Portfolio Managementat LGT Bank in Hong Kong. Mr. Hugger wasthe founding shareholder of one of thelargest brokerage companies in Bangladesh.He is also a Certified Financial InvestmentAnalyst (CFIA) and Investment Adviser(Switzerland) and a Certified EuropeanFederation of Financial Analysts Societies(EFFAS) Financial Analyst.
Lord Fraser of Corriegarth, Director.Andrew Fraser is a graduate of St John'sCollege, Oxford after which he held numerousposts in the financial sector both in the City ofLondon and elsewhere. He has previously heldpositions as; CEO of Baring Securities in theUK, Chairman of Equity Partners Ltd., aBangladesh investment bank, as well asChairman of Bridge Securities, a quoted Koreancompany, amongst other posts. At present heis a global investor based in London.
Dr. Marc Faber, is CEO, investment advisor
and fund manager of Marc Faber Limited. He
is the publisher of a widely read monthly
investment newsletter The Gloom, Boom
and Doom report which highlights global
investment opportunities. Dr. Faber is
respected around the world for his market
forecasts over the past three decades.
5AFC Asia Frontier Fund
SHAREHOLDERS OF ASIA FRONTIER CAPITAL LIMITED

6
WHY ASIAN FRONTIER MARKETS?
AFC Asia Frontier Fund

7AFC Asia Frontier Fund
WHY ASIAN FRONTIER MARKETS
AFC Asia FrontierFund Universe
Bangladesh
Cambodia
Iraq
Laos
Maldives
Mongolia
Myanmar
Pakistan
Papua New Guinea
Sri Lanka
Vietnam

8
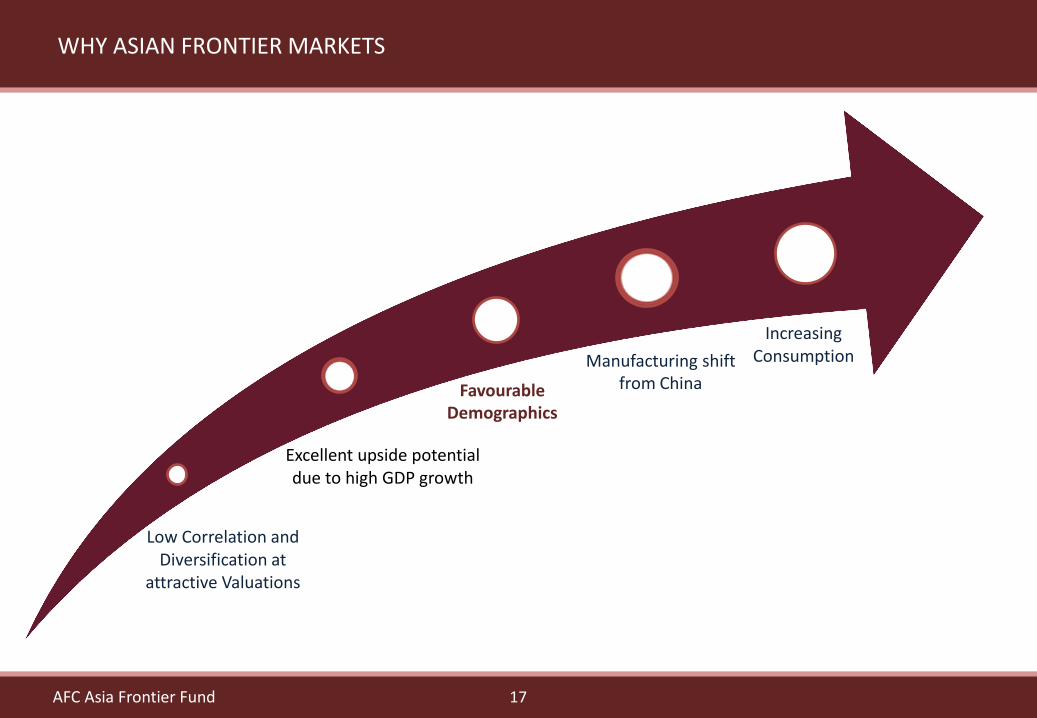
Excellent upside potential due to high GDP growth
Low Correlation and Diversification at
attractive Valuations
Increasing Consumption
Favourable Demographics
AFC Asia Frontier Fund
WHY ASIAN FRONTIER MARKETS
Manufacturing shift from China

9
Diversification has led to Low Correlations for the Fund with Global Markets
AFC Asia Frontier Fund
Source: Bloomberg, Asia Frontier Capital. Correlations based on Monthly Returns and Net Fund ReturnsAAFF – AFC Asia Frontier Fund
WHY ASIAN FRONTIER MARKETS
Correlation of AAFF with MSCI Indexes since Inception (30th March 2012)
Variable AAFFMSCI World
Index
MSCI Emerging Markets
Index
MSCI BRIC Index
MSCI Frontier Markets Index
MSCI World Index 0.33 1.00
MSCI Emerging Markets Index 0.30 0.75 1.00
MSCI BRIC Index 0.33 0.74 0.98 1.00
MSCI Frontier Markets Index 0.57 0.63 0.58 0.57 1.00
MSCI Frontier Markets Asia Index 0.79 0.43 0.35 0.35 0.62

10
Low Correlations for the Fund with Global Markets has led to excellent Risk-Return profile
AFC Asia Frontier Fund
*Returns of indexes are based on Net Total Return USD IndexesReturns of funds are net, after fees.
Annualised Volatility
Cumulative Returns*
AFC Asia Frontier Fund 9.01% 78.07%
MSCI World Index 10.87% 58.77%
MSCI Frontier Markets Index
11.60% 34.26%
MSCI Frontier Markets Asia Index
13.61% 42.04%
MSCI Emerging Market Index
15.26% 6.37%
MSCI BRIC Index 18.39% 4.04%
WHY ASIAN FRONTIER MARKETS
AFC Asia Frontier Fund USD A
MSCI World
MSCI Frontier Markets
MSCI Frontier Markets Asia
MSCI Emerging Markets MSCI Bric Index
0%
10%
20%
30%
40%
50%
60%
70%
80%
90%
6% 8% 10% 12% 14% 16% 18% 20%
Net
Re
turn
Annualised Volatility
Annualised Volatility vs. Fund Performance (Net) (Since Inception, March 2012)
11
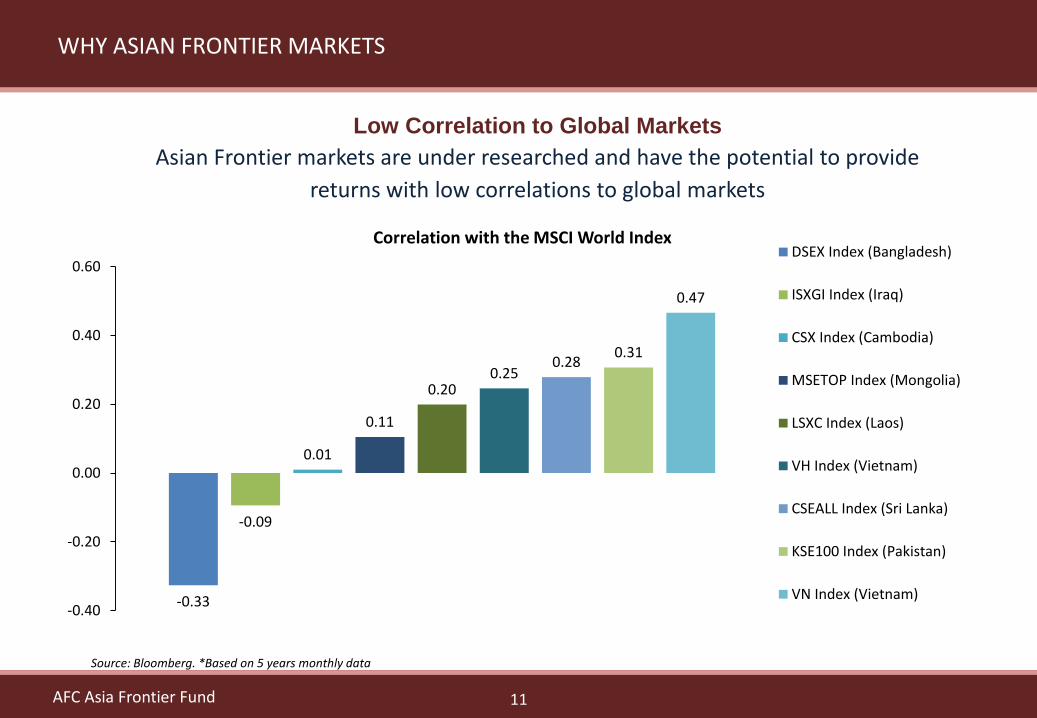
Low Correlation to Global Markets
Asian Frontier markets are under researched and have the potential to provide
returns with low correlations to global markets
AFC Asia Frontier Fund
WHY ASIAN FRONTIER MARKETS
Source: Bloomberg. *Based on 5 years monthly data
-0.33
-0.09
0.01
0.11
0.200.25
0.280.31
0.47
-0.40
-0.20
0.00
0.20
0.40
0.60
Correlation with the MSCI World IndexDSEX Index (Bangladesh)
ISXGI Index (Iraq)
CSX Index (Cambodia)
MSETOP Index (Mongolia)
LSXC Index (Laos)
VH Index (Vietnam)
CSEALL Index (Sri Lanka)
KSE100 Index (Pakistan)
VN Index (Vietnam)

12
Attractive Valuations
Asian Frontier markets offer attractive dividend yieldsand lower Price to Earnings and Price to Book ratiosrelative to emerging markets
Asian Frontier markets are valued attractively relativeto emerging Asian countries
AFC Asia Frontier Fund
Source: Bloomberg. P/E is based on Trailing 12 Months and P/B is latest reporting period.
WHY ASIAN FRONTIER MARKETS
Select Asian Frontier Index Valuations
Country Index P/E (x) P/B (x)Dividend Yield (%)
Pakistan KSE100 10.6 2.0 4.3
Laos LSXC 11.3 0.9 6.4
Sri Lanka CSEALL Share 12.0 1.3 3.1
Vietnam VNINDEX 15.6 2.2 2.9
Emerging Asia Index Valuations
Country Index P/E (x) P/B (x)Dividend Yield (%)
Thailand SET 16.5 1.9 3.1
Malaysia FBMKLCI 17.4 1.8 3.1India BSE SENSEX 21.8 2.8 1.3
Philippines PCOMP 21.8 2.5 1.6Indonesia JCI 23.3 2.5 1.9
Source: Bloomberg. P/E is based on Trailing 12 Months and P/B is latest reporting period.

13AFC Asia Frontier Fund
WHY ASIAN FRONTIER MARKETS
Low Market Cap/GDP relative to Emerging Markets Offers Value
Source: Bloomberg, Asia Frontier Capital
3% 6% 8%
19% 22%28%
32%39% 39% 40% 43%
69%74%
82% 83%
102%
0%
20%
40%
60%
80%
100%
120%
Market Cap. as % of GDP - Asian Frontier v/s Emerging Markets

14
Excellent upside potential due to high GDP growth
Low Correlation and Diversification at
attractive Valuations
Increasing Consumption
Favourable Demographics
AFC Asia Frontier Fund
WHY ASIAN FRONTIER MARKETS
Manufacturing shift from China

15
Healthy GDP Growth Outlook for AFC Frontier Universe
AFC Asia Frontier Fund
WHY ASIAN FRONTIER MARKETS
Source: IMF
7.77.2 6.8 6.7
6.25.3 5.2
4.7 4.6
3.1
1.4
5.4
0.0
2.0
4.0
6.0
8.0
10.0
Average GDP Growth Estimates (2017-2021)

16
The AFC Frontier Universe offers attractive investment opportunities as their combined GDP is comparable in size to emerging and developed countries
AFC Asia Frontier Fund
WHY ASIAN FRONTIER MARKETS
Source: IMF
GDP of AFC Frontier Universe: USD 1,045 billion (as of 2015)
25.9%
19.8%
18.3%
15.8%
7.8%
6.0%
2.0% 1.7%
1.2% 1.1%
0.3%
AFC Universe - GDP Mix Pakistan
Bangladesh
Vietnam
Iraq
Sri Lanka
Myanmar
Papua NewGuineaCambodia
Lao P.D.R.
Mongolia
Maldives
1,378
1,045
859
718 664 646
493
-
250
500
750
1,000
1,250
1,500
GDP (USD billion)
17
Excellent upside potential due to high GDP growth
Low Correlation and Diversification at
attractive Valuations
Increasing Consumption
Favourable Demographics
AFC Asia Frontier Fund
WHY ASIAN FRONTIER MARKETS
Manufacturing shift from China

18AFC Asia Frontier Fund
WHY ASIAN FRONTIER MARKETS
The AFC Frontier Universe has a sizeable population which continues to grow and will support future GDP growth
AFC Frontier Universe Combined Population: 583 million (as of 2015)
Source: IMF
32.6%
27.4%
15.7%
8.9%
6.0%
3.6%2.7%
1.3% 1.2% 0.5% 0.1%
AFC Universe - Population Mix Pakistan
Bangladesh
Vietnam
Myanmar
Iraq
Sri Lanka
Cambodia
Papua NewGuineaLao P.D.R.
Mongolia
Maldives
1,373 1,293
583
337 322 255 204
-
250
500
750
1,000
1,250
1,500
China India AFCUniverse
EuroArea
UnitedStates
Indonesia Brazil
Population (millions)

19
Compared to Developed Markets, the AFC Frontier Universe has a much younger population growing at a faster rate: This supports future economic growth and consumption
AFC Asia Frontier Fund
WHY ASIAN FRONTIER MARKETS
Source: United Nations Population Division.
AFC Frontier Universe – A Young and Growing Population
AFC Frontier Universe is supported by huge young population Developed Markets are not getting younger. AFC Frontier Universe offer young and growing population
59%
39% 37%33%
28%
0%
20%
40%
60%
80%
AFCUniverse
NorthAmerica
NorthernEurope
WesternEurope
Japan
% of Population below age of 30
25
38 4044
471.5%
0.7%0.6%
0.2%
-0.2%-0.4%
0.0%
0.4%
0.8%
1.2%
1.6%
0
10
20
30
40
50
AFCUniverse
NorthAmerica
NorthernEurope
WesternEurope
Japan
Median Age and Population Growth
Median Age Population Growth

20AFC Asia Frontier Fund
Increasing urbanisation will support growth in the Consumer, Infrastructure and Financial sectors
WHY ASIAN FRONTIER MARKETS
The AFC Universe is Urbanising from a Low Base
Source: World Bank
38%
62%
AFC Universe
Urban Rural
80%
20%
OECD Members
Urban Rural

21
Excellent upside potential due to high GDP growth
Low Correlation and Diversification at
attractive Valuations
Increasing Consumption
Favourable Demographics
AFC Asia Frontier Fund
WHY ASIAN FRONTIER MARKETS
Manufacturing shift from China

22AFC Asia Frontier Fund
Asian Frontier countries presently have similar demographics to what China had in the 1990s. By 2020 Asian Frontier countries will continue to have a young population relative to China
WHY ASIAN FRONTIER MARKETS
The Shift from China
Source: United Nations Population Division
Median Age – China in 1990 v/s Asian Frontier countries at present have similar median ages
% of Population > Age 60 – China v/s Asian Frontier countries in 2020 - Asian Frontier countries’ younger population offer an
alternative to China
37
2522 22 24 26
2830
32
0
10
20
30
40
Median Age
17%16%
13%
10%
8% 8% 7% 7%
0%
4%
8%
12%
16%
20%
% of Population Aged > 60

23AFC Asia Frontier Fund
Combination of young workforce and low wages is attracting manufacturing activities to Asian frontier countries as wages in China increase and the workforce gets greater employment opportunities
WHY ASIAN FRONTIER MARKETS
The Shift from China
Source: China Statistical Bulletin, Wage Indicator Foundation, Bangladesh Garment Manufacturers & Exporters Association, General Statistics Office of Vietnam
*Rebased to 100 (2003). RMG: Ready Made Garments
Wages in Asian Frontier countries are amongst the lowest in the regionBangladesh and Vietnam are good examples of the shift of
manufacturing from China to neighboring countries
0
100
200
300
400
500
2006 2007 2008 2009 2010 2011 2012 2013 2014 2015
Bangladesh RMG & Vietnam Export Growth*
Bangladesh Vietnam
65 6883
111 115133
150
223251 252
274298
0
75
150
225
300
375
Monthly Minimum Wage (USD)

24
Excellent upside potential due to high GDP growth
Low Correlation and Diversification at
attractive Valuations
Increasing Consumption
Favourable Demographics
AFC Asia Frontier Fund
WHY ASIAN FRONTIER MARKETS
Manufacturing shift from China

25AFC Asia Frontier Fund
Percentage of Durables in Private Consumption
AFC AsiaFrontier Fund
Universe
Per capita income USD PPP (2012)
Bangladesh $ 729
Cambodia $ 792
Iraq $ 3,918
Laos $ 1,017
Maldives $ 4,385
Mongolia $ 2,499
Myanmar -
Pakistan $ 1,217
PNG $ 1,625
Sri Lanka $ 2,699
Vietnam $ 1,372
WHY ASIAN FRONTIER MARKETS

26AFC Asia Frontier Fund
Consumption Expenditure is Increasing in Frontier Markets
0
1
2
3
4
5
6
7
8
9
19
93
19
94
19
95
19
96
19
97
19
98
19
99
20
00
20
01
20
02
20
03
20
04
20
05
20
06
20
07
20
08
20
09
20
10
20
11
20
12
20
13
Household final consumption expenditure per capita growth (annual %)
BRICS Average Linear (BRICS Average)
-1
0
1
2
3
4
5
6
7
8
9
19
93
19
94
19
95
19
96
19
97
19
98
19
99
20
00
20
01
20
02
20
03
20
04
20
05
20
06
20
07
20
08
20
09
20
10
20
11
20
12
20
13
Household final consumption expenditure per capita growth (annual %)
AFC Country Universe Average Linear (AFC Country Universe Average)
$-
$200
$400
$600
$800
$1,000
$1,200
$1,400
$1,600
19
93
19
94
19
95
19
96
19
97
19
98
19
99
20
00
20
01
20
02
20
03
20
04
20
05
20
06
20
07
20
08
20
09
20
10
20
11
20
12
20
13
Household final consumption expenditure per capita (USD - constant 2005) Bangladesh
Cambodia
Iraq
Lao PDR
Maldives
Mongolia
Myanmar
Pakistan
Papua NewGuineaSri Lanka
Vietnam
AFC Average
-2
-1
0
1
2
3
4
19
93
19
94
19
95
19
96
19
97
19
98
19
99
20
00
20
01
20
02
20
03
20
04
20
05
20
06
20
07
20
08
20
09
20
10
20
11
20
12
20
13
Household final consumption expenditure per capita growth (annual %)
Developed Countries Linear (Developed Countries)
WHY ASIAN FRONTIER MARKETS
27AFC Asia Frontier Fund
WHY ASIAN FRONTIER MARKETS
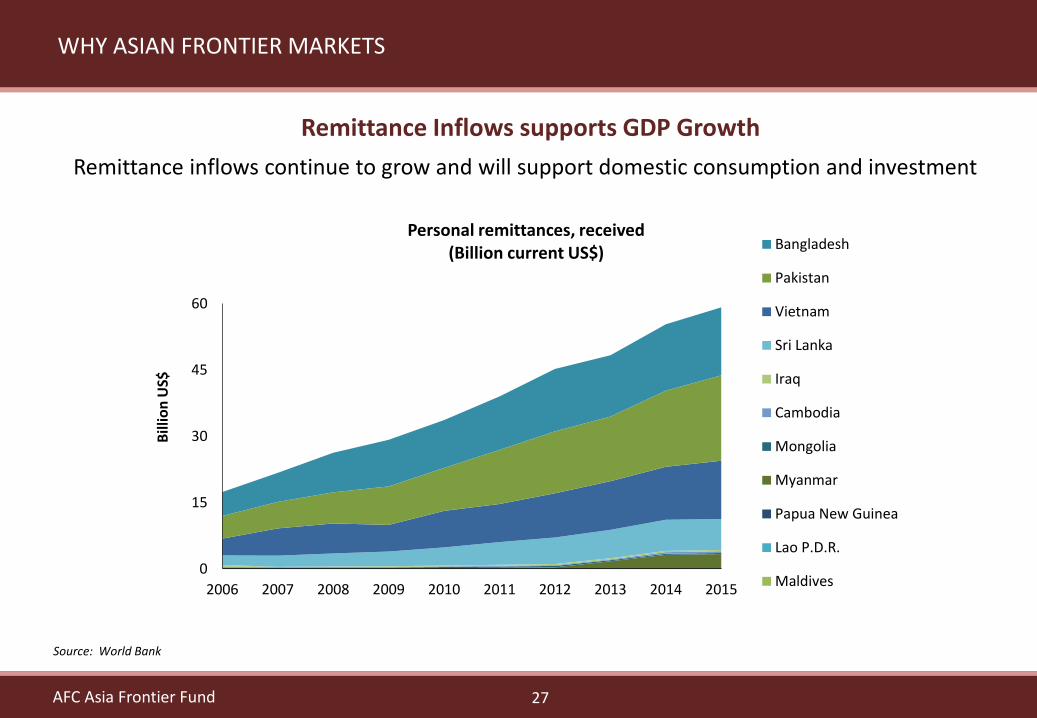
Remittance inflows continue to grow and will support domestic consumption and investment
Remittance Inflows supports GDP Growth
Source: World Bank
0
15
30
45
60
2006 2007 2008 2009 2010 2011 2012 2013 2014 2015
Bill
ion
US$
Personal remittances, received (Billion current US$)
Bangladesh
Pakistan
Vietnam
Sri Lanka
Iraq
Cambodia
Mongolia
Myanmar
Papua New Guinea
Lao P.D.R.
Maldives

28AFC Asia Frontier Fund
Asian Frontier Consumer Stocks are undervalued and some companies have been catching up with Emerging Market valuations over the past year. This has helped generate alpha for the fund.
Asian Frontier Consumer Picks
Regional Comparisons
Source: Bloomberg. P/E based on Trailing 12 Month Earnings, P/B based on most recent reporting period.
Country Company P/E (x) P/B (x) Dividend Yield (%)
Vietnam Consumer Beverage Products 8.7 1.8 1.7
Vietnam Consumer Food Products 14.1 3.8 5.0
Mongolia Consumer Food Products 17.1 0.5 0.6
Bangladesh Shoe Retailer 18.7 5.3 2.0
Pakistan Automobile Manufacturer 22.6 2.6 0.6
Country Company P/E (x) P/B (x) Dividend Yield (%)
Thailand President Bakery 19.7 4.7 2.6
Philippines Universal Robina Corp 25.9 5.3 1.8
India Maruti Suzuki India 26.8 5.4 0.5
India Bata India 33.7 6.2 0.6
China Tsingtao Brewery 38.8 2.5 1.2
WHY ASIAN FRONTIER MARKETS

29
INVESTMENT STRATEGY
AFC Asia Frontier Fund

30
Top-down Approach
Value / Growth
Risk Mitigation
Cash
AFC Asia Frontier Fund
INVESTMENT STRATEGY

INVESTMENT STRATEGY – IDEA GENERATION PROCESS – COMBINATION OF BOTTOM UP-TOP DOWN
31AFC Asia Frontier Fund
Bottom-up stock shortlisting using tools
based on Valuation and Fundamental
parameters
Top-down stock shortlisting based on
economy and industry analysis
Access to Third Party Research (daily
updates, company specific research, industry research)
On the ground visits to countries. Conducted
269 management meeting over the past
15 months
Relationship with sell side analysts for views on company/industry

32AFC Asia Frontier Fund
•Historical trend of growth, margins and cash from operations
• Focus on trend in RoEs and dividend payout ratios.Historical Financial Statement
Analysis
•Well established brand
• Large distribution network
•High Market Share
•Economies of Scale
•Cost Structure
• Stable Management
Competitive Advantages
• Is company operating in an industry with favorable outlook
•Example 1: Shoes per capita in Bangladesh is significantly lower than emerging market peers
•Example 2: Upswing in infrastructure spending in Pakistan positive for cement companies
Industry Outlook & Opportunity
• Conduct both local and regional peer analysis by comparing valuation, fundamental and industry metrics
Peer Comparison Analysis
INVESTMENT STRATEGY – RESEARCH PROCESS
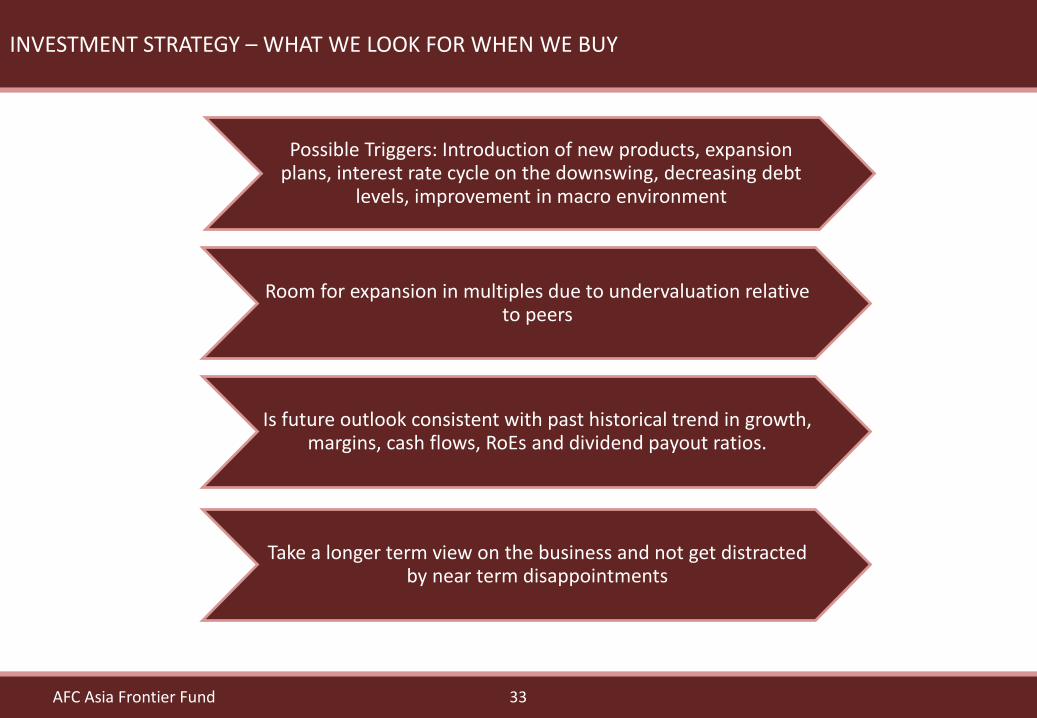
INVESTMENT STRATEGY – WHAT WE LOOK FOR WHEN WE BUY
33AFC Asia Frontier Fund
Possible Triggers: Introduction of new products, expansion plans, interest rate cycle on the downswing, decreasing debt
levels, improvement in macro environment
Room for expansion in multiples due to undervaluation relative to peers
Is future outlook consistent with past historical trend in growth, margins, cash flows, RoEs and dividend payout ratios.
Take a longer term view on the business and not get distracted by near term disappointments
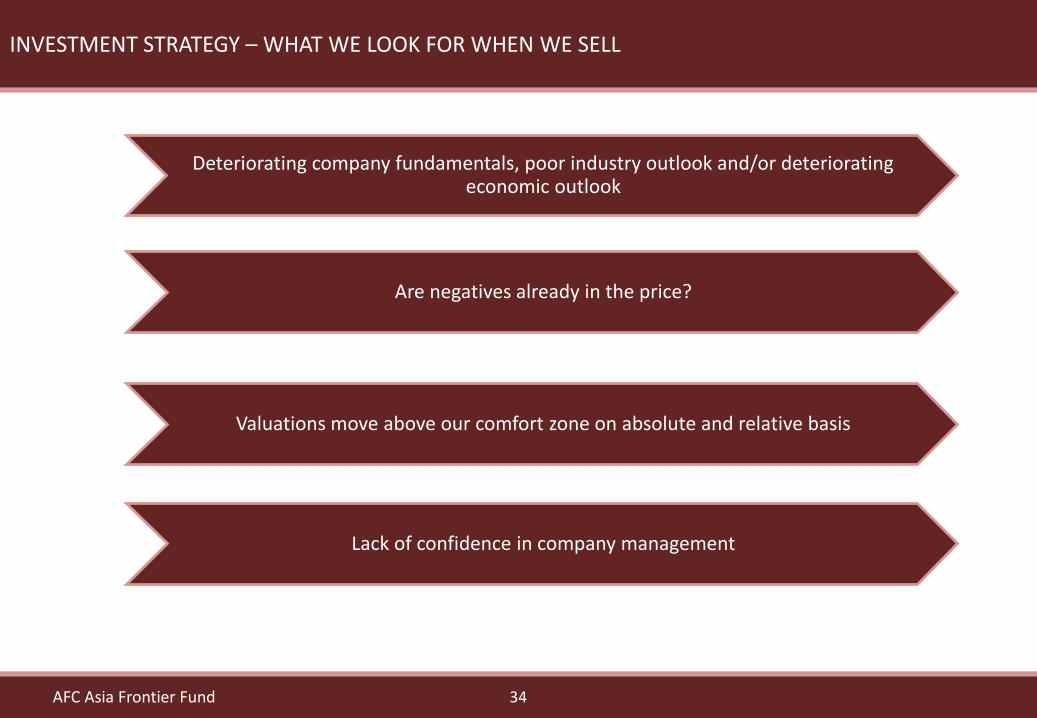
INVESTMENT STRATEGY – WHAT WE LOOK FOR WHEN WE SELL
34AFC Asia Frontier Fund
Deteriorating company fundamentals, poor industry outlook and/or deteriorating economic outlook
Are negatives already in the price?
Valuations move above our comfort zone on absolute and relative basis
Lack of confidence in company management
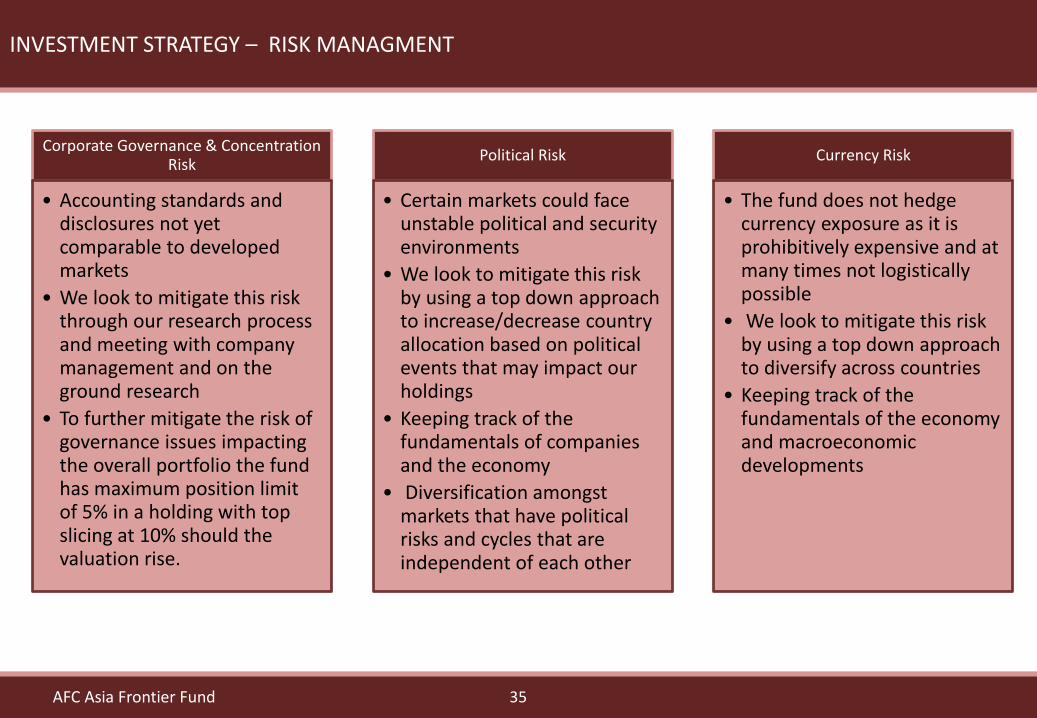
INVESTMENT STRATEGY – RISK MANAGMENT
35AFC Asia Frontier Fund
Corporate Governance & Concentration Risk
• Accounting standards and disclosures not yet comparable to developed markets
• We look to mitigate this risk through our research process and meeting with company management and on the ground research
• To further mitigate the risk of governance issues impacting the overall portfolio the fund has maximum position limit of 5% in a holding with top slicing at 10% should the valuation rise.
Political Risk
• Certain markets could face unstable political and security environments
• We look to mitigate this risk by using a top down approach to increase/decrease country allocation based on political events that may impact our holdings
• Keeping track of the fundamentals of companies and the economy
• Diversification amongst markets that have political risks and cycles that are independent of each other
Currency Risk
• The fund does not hedge currency exposure as it is prohibitively expensive and at many times not logistically possible
• We look to mitigate this risk by using a top down approach to diversify across countries
• Keeping track of the fundamentals of the economy and macroeconomic developments

INVESTMENT STRATEGY – TOP 10 HOLDINGS
36AFC Asia Frontier Fund
Current Top 10 HoldingsCompany Country Sector % of NAVBeximco
PharmaceuticalsBangladesh Healthcare 9.2%
AFC Iraq Fund Iraq Fund/ETF 3.6%
Searle Company Ltd. Pakistan Healthcare 3.5%
D.G. Khan Cement Pakistan Materials 2.6%
Pak Elektron Pakistan Consumer Discretionary 2.5%
Traphaco JSC Vietnam Healthcare 2.4%
Cotec Construction Vietnam Industrials 2.3%
Hai Duong Pump Vietnam Industrials 2.3%
Safaco Foodstuff Vietnam Consumer Staples 2.4%
Atlas Honda Pakistan Consumer Discretionary 2.0%
37
FUND INFORMATION
AFC Asia Frontier Fund
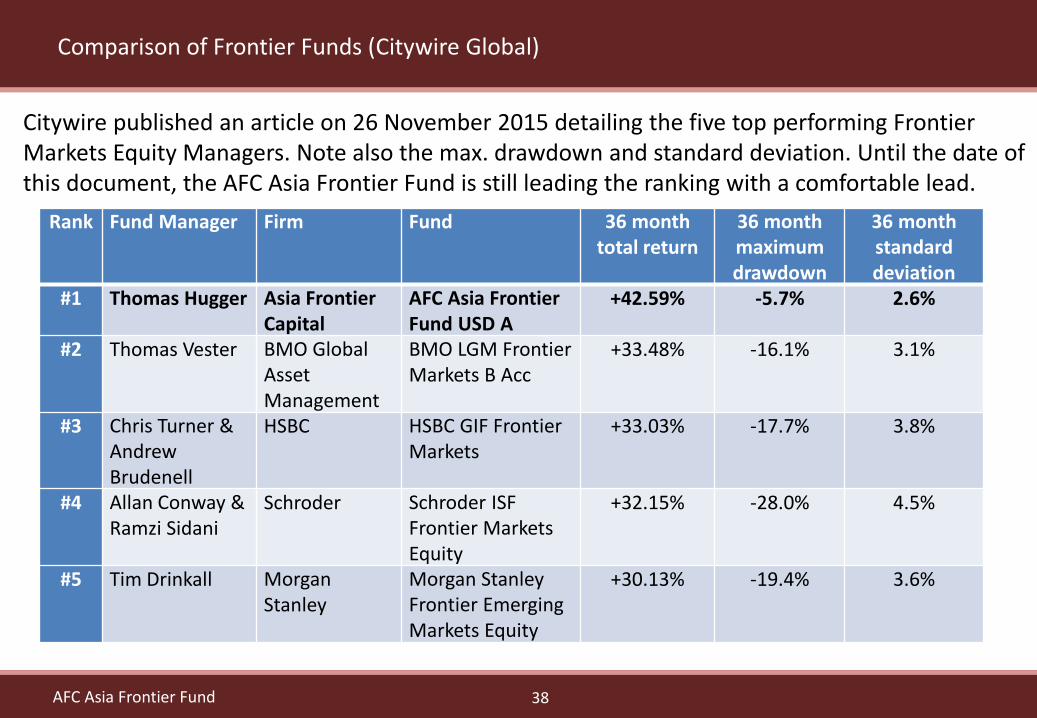
Comparison of Frontier Funds (Citywire Global)
38AFC Asia Frontier Fund
Rank Fund Manager Firm Fund 36 month total return
36 month maximumdrawdown
36 month standard deviation
#1 Thomas Hugger Asia Frontier Capital
AFC Asia Frontier Fund USD A
+42.59% -5.7% 2.6%
#2 Thomas Vester BMO Global Asset Management
BMO LGM Frontier Markets B Acc
+33.48% -16.1% 3.1%
#3 Chris Turner &Andrew Brudenell
HSBC HSBC GIF Frontier Markets
+33.03% -17.7% 3.8%
#4 Allan Conway & Ramzi Sidani
Schroder Schroder ISF Frontier Markets Equity
+32.15% -28.0% 4.5%
#5 Tim Drinkall Morgan Stanley
Morgan Stanley Frontier Emerging Markets Equity
+30.13% -19.4% 3.6%
Citywire published an article on 26 November 2015 detailing the five top performing Frontier Markets Equity Managers. Note also the max. drawdown and standard deviation. Until the date of this document, the AFC Asia Frontier Fund is still leading the ranking with a comfortable lead.

AWARDS
39AFC Asia Frontier Fund
40AFC Asia Frontier Fund
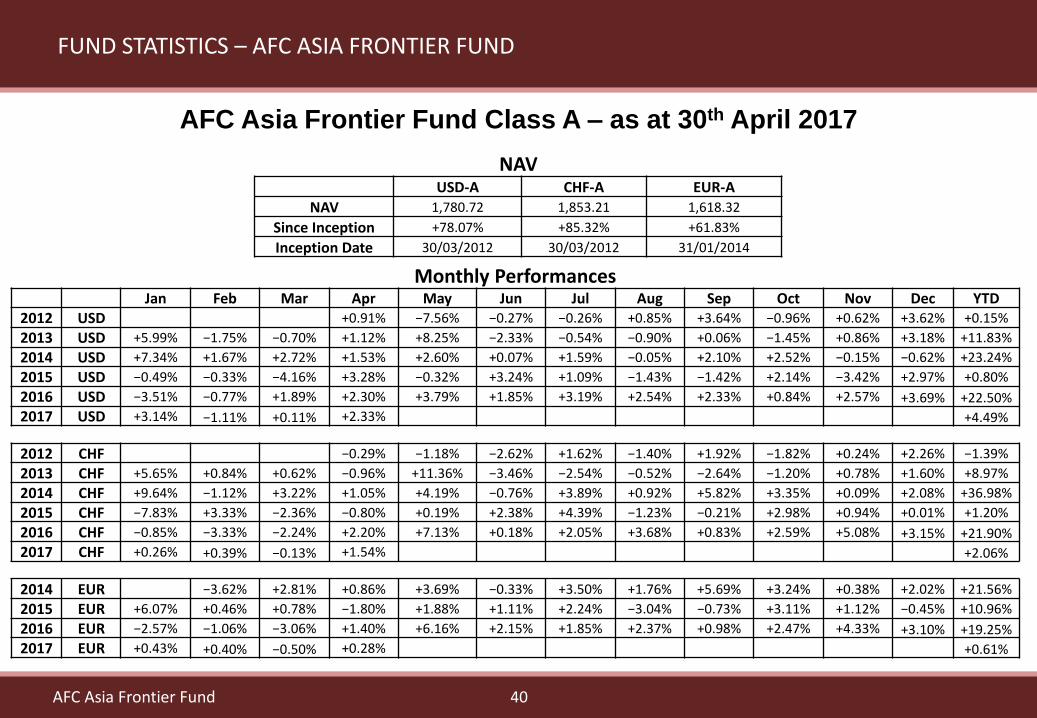
FUND STATISTICS – AFC ASIA FRONTIER FUND
NAVUSD-A CHF-A EUR-A
NAV 1,780.72 1,853.21 1,618.32
Since Inception +78.07% +85.32% +61.83%
Inception Date 30/03/2012 30/03/2012 31/01/2014
Monthly PerformancesJan Feb Mar Apr May Jun Jul Aug Sep Oct Nov Dec YTD
2012 USD +0.91% −7.56% −0.27% −0.26% +0.85% +3.64% −0.96% +0.62% +3.62% +0.15%
2013 USD +5.99% −1.75% −0.70% +1.12% +8.25% −2.33% −0.54% −0.90% +0.06% −1.45% +0.86% +3.18% +11.83%
2014 USD +7.34% +1.67% +2.72% +1.53% +2.60% +0.07% +1.59% −0.05% +2.10% +2.52% −0.15% −0.62% +23.24%
2015 USD −0.49% −0.33% −4.16% +3.28% −0.32% +3.24% +1.09% −1.43% −1.42% +2.14% −3.42% +2.97% +0.80%
2016 USD −3.51% −0.77% +1.89% +2.30% +3.79% +1.85% +3.19% +2.54% +2.33% +0.84% +2.57% +3.69% +22.50%
2017 USD +3.14% −1.11% +0.11% +2.33% +4.49%
2012 CHF −0.29% −1.18% −2.62% +1.62% −1.40% +1.92% −1.82% +0.24% +2.26% −1.39%
2013 CHF +5.65% +0.84% +0.62% −0.96% +11.36% −3.46% −2.54% −0.52% −2.64% −1.20% +0.78% +1.60% +8.97%
2014 CHF +9.64% −1.12% +3.22% +1.05% +4.19% −0.76% +3.89% +0.92% +5.82% +3.35% +0.09% +2.08% +36.98%
2015 CHF −7.83% +3.33% −2.36% −0.80% +0.19% +2.38% +4.39% −1.23% −0.21% +2.98% +0.94% +0.01% +1.20%
2016 CHF −0.85% −3.33% −2.24% +2.20% +7.13% +0.18% +2.05% +3.68% +0.83% +2.59% +5.08% +3.15% +21.90%
2017 CHF +0.26% +0.39% −0.13% +1.54% +2.06%
2014 EUR −3.62% +2.81% +0.86% +3.69% −0.33% +3.50% +1.76% +5.69% +3.24% +0.38% +2.02% +21.56%
2015 EUR +6.07% +0.46% +0.78% −1.80% +1.88% +1.11% +2.24% −3.04% −0.73% +3.11% +1.12% −0.45% +10.96%
2016 EUR −2.57% −1.06% −3.06% +1.40% +6.16% +2.15% +1.85% +2.37% +0.98% +2.47% +4.33% +3.10% +19.25%
2017 EUR +0.43% +0.40% −0.50% +0.28% +0.61%
AFC Asia Frontier Fund Class A – as at 30th April 2017
41AFC Asia Frontier Fund
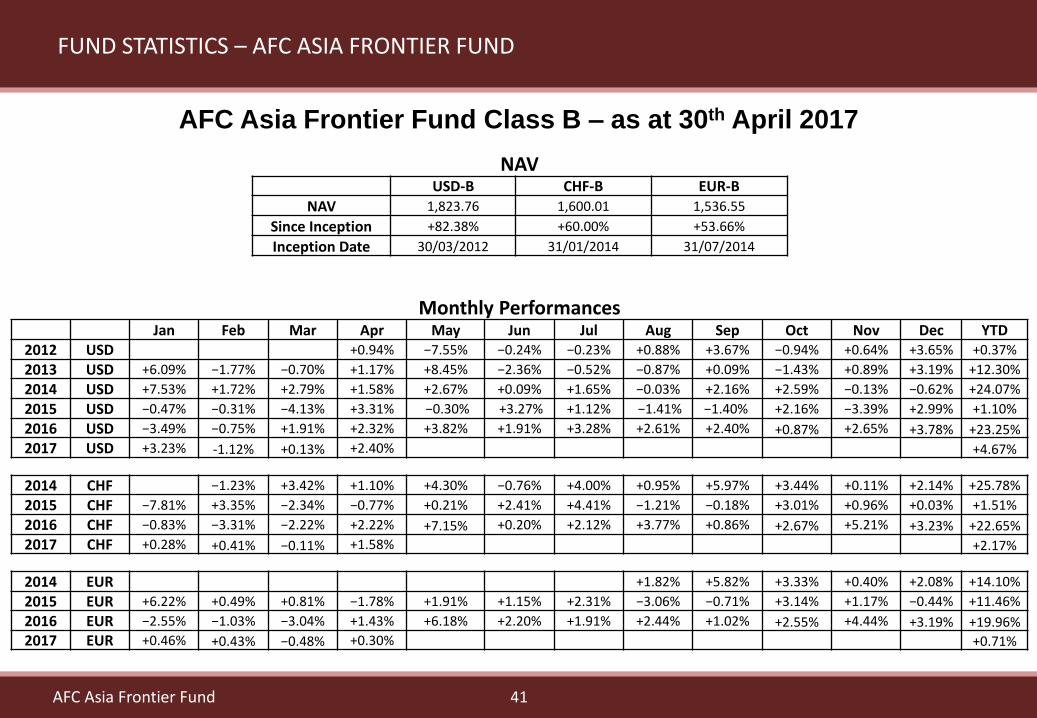
FUND STATISTICS – AFC ASIA FRONTIER FUND
Monthly PerformancesJan Feb Mar Apr May Jun Jul Aug Sep Oct Nov Dec YTD
2012 USD +0.94% −7.55% −0.24% −0.23% +0.88% +3.67% −0.94% +0.64% +3.65% +0.37%
2013 USD +6.09% −1.77% −0.70% +1.17% +8.45% −2.36% −0.52% −0.87% +0.09% −1.43% +0.89% +3.19% +12.30%
2014 USD +7.53% +1.72% +2.79% +1.58% +2.67% +0.09% +1.65% −0.03% +2.16% +2.59% −0.13% −0.62% +24.07%
2015 USD −0.47% −0.31% −4.13% +3.31% −0.30% +3.27% +1.12% −1.41% −1.40% +2.16% −3.39% +2.99% +1.10%
2016 USD −3.49% −0.75% +1.91% +2.32% +3.82% +1.91% +3.28% +2.61% +2.40% +0.87% +2.65% +3.78% +23.25%
2017 USD +3.23% -1.12% +0.13% +2.40% +4.67%
2014 CHF −1.23% +3.42% +1.10% +4.30% −0.76% +4.00% +0.95% +5.97% +3.44% +0.11% +2.14% +25.78%
2015 CHF −7.81% +3.35% −2.34% −0.77% +0.21% +2.41% +4.41% −1.21% −0.18% +3.01% +0.96% +0.03% +1.51%
2016 CHF −0.83% −3.31% −2.22% +2.22% +7.15% +0.20% +2.12% +3.77% +0.86% +2.67% +5.21% +3.23% +22.65%
2017 CHF +0.28% +0.41% −0.11% +1.58% +2.17%
2014 EUR +1.82% +5.82% +3.33% +0.40% +2.08% +14.10%
2015 EUR +6.22% +0.49% +0.81% −1.78% +1.91% +1.15% +2.31% −3.06% −0.71% +3.14% +1.17% −0.44% +11.46%
2016 EUR −2.55% −1.03% −3.04% +1.43% +6.18% +2.20% +1.91% +2.44% +1.02% +2.55% +4.44% +3.19% +19.96%
2017 EUR +0.46% +0.43% −0.48% +0.30% +0.71%
NAVUSD-B CHF-B EUR-B
NAV 1,823.76 1,600.01 1,536.55
Since Inception +82.38% +60.00% +53.66%
Inception Date 30/03/2012 31/01/2014 31/07/2014
AFC Asia Frontier Fund Class B – as at 30th April 2017

42AFC Asia Frontier Fund
FUND STATISTICS – AFC ASIA FRONTIER FUND (NON – US)
NAVUSD-A CHF-A EUR-A
NAV 1,780.59 1,853.21 1,618.32
Since Inception +78.06% +85.32% +61.83%
Inception Date 30/03/12 30/03/12 31/01/14
AFC Asia Frontier Fund (non-US) Class A – as at 30th April 2017
Monthly PerformancesJan Feb Mar Apr May Jun Jul Aug Sep Oct Nov Dec YTD
2012 USD +0.90% −7.56% −0.27% −0.26% +0.85% +3.64% −0.96% +0.61% +3.62% +0.14%
2013 USD +5.99% −1.75% −0.70% +1.12% +8.25% −2.33% −0.54% −0.90% +0.06% −1.45% +0.86% +3.18% +11.83%
2014 USD +7.34% +1.67% +2.72% +1.53% +2.60% +0.07% +1.59% −0.05% +2.10% +2.52% −0.15% −0.62% +23.24%
2015 USD −0.49% −0.34% −4.15% +3.28% −0.32% +3.24% +1.09% −1.43% −1.42% +2.14% −3.42% +2.96% +0.79%
2016 USD −3.51% −0.77% +1.89% +2.30% +3.80% +1.85% +3.19% +2.54% +2.33% +0.84% +2.57% +3.69% +22.51%
2017 USD +3.14% −1.11% +0.11% +2.33% +4.49%
2012 CHF −0.29% −1.18% −2.62% +1.62% −1.40% +1.92% −1.82% +0.24% +2.26% −1.39%
2013 CHF +5.65% +0.84% +0.62% −0.96% +11.36% −3.46% −2.54% −0.52% −2.64% −1.20% +0.78% +1.60% +8.97%
2014 CHF +9.64% −1.12% +3.22% +1.05% +4.19% −0.76% +3.89% +0.92% +5.82% +3.35% +0.09% +2.08% +36.98%
2015 CHF −7.83% +3.33% −2.36% −0.80% +0.19% +2.38% +4.39% −1.23% −0.21% +2.98% +0.94% +0.01% +1.20%
2016 CHF −0.85% −3.33% −2.24% +2.20% +7.13% +0.18% +2.05% +3.68% +0.83% +2.59% +5.08% +3.15% +21.90%
2017 CHF +0.26% +0.39% −0.13% +1.54% +2.06%
2014 EUR −3.62% +2.81% +0.86% +3.69% −0.33% +3.50% +1.76% +5.69% +3.24% +0.38% +2.02% +21.56%
2015 EUR +6.07% +0.46% +0.78% −1.80% +1.88% +1.11% +2.24% −3.04% −0.73% +3.11% +1.12% −0.45% +10.96%
2016 EUR −2.57% −1.06% −3.06% +1.40% +6.16% +2.15% +1.85% +2.37% +0.98% +2.47% +4.33% +3.10% +19.25%
2017 EUR +0.43% +0.40% −0.50% +0.28% +0.61%
43AFC Asia Frontier Fund
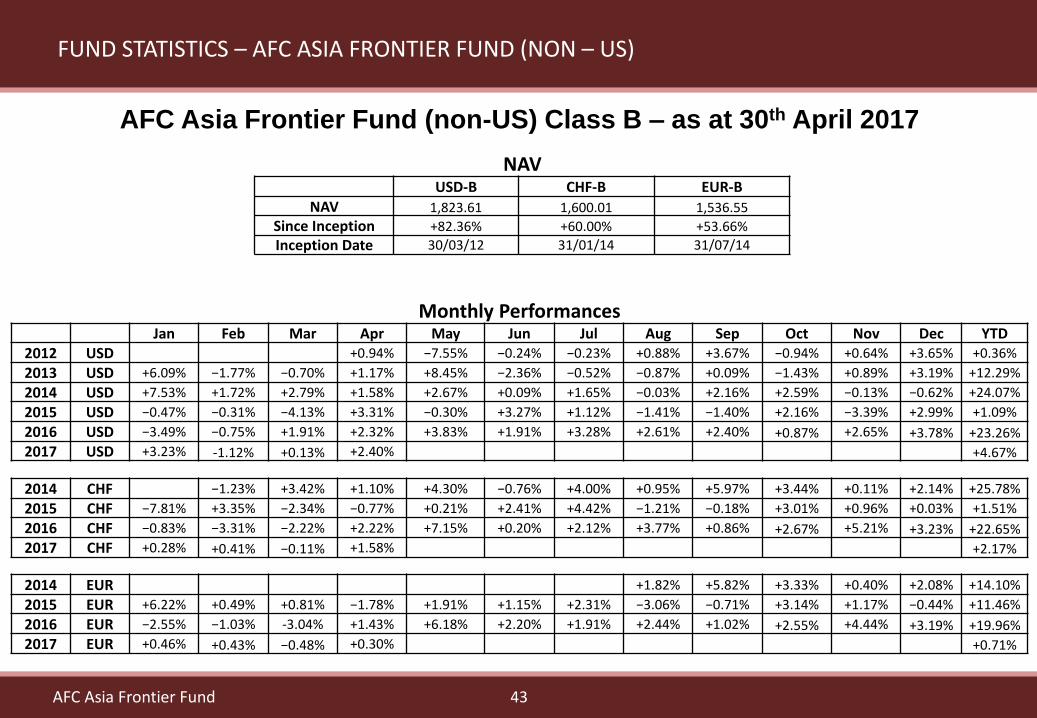
NAVUSD-B CHF-B EUR-B
NAV 1,823.61 1,600.01 1,536.55
Since Inception +82.36% +60.00% +53.66%
Inception Date 30/03/12 31/01/14 31/07/14
FUND STATISTICS – AFC ASIA FRONTIER FUND (NON – US)
AFC Asia Frontier Fund (non-US) Class B – as at 30th April 2017
Monthly PerformancesJan Feb Mar Apr May Jun Jul Aug Sep Oct Nov Dec YTD
2012 USD +0.94% −7.55% −0.24% −0.23% +0.88% +3.67% −0.94% +0.64% +3.65% +0.36%
2013 USD +6.09% −1.77% −0.70% +1.17% +8.45% −2.36% −0.52% −0.87% +0.09% −1.43% +0.89% +3.19% +12.29%
2014 USD +7.53% +1.72% +2.79% +1.58% +2.67% +0.09% +1.65% −0.03% +2.16% +2.59% −0.13% −0.62% +24.07%
2015 USD −0.47% −0.31% −4.13% +3.31% −0.30% +3.27% +1.12% −1.41% −1.40% +2.16% −3.39% +2.99% +1.09%
2016 USD −3.49% −0.75% +1.91% +2.32% +3.83% +1.91% +3.28% +2.61% +2.40% +0.87% +2.65% +3.78% +23.26%
2017 USD +3.23% -1.12% +0.13% +2.40% +4.67%
2014 CHF −1.23% +3.42% +1.10% +4.30% −0.76% +4.00% +0.95% +5.97% +3.44% +0.11% +2.14% +25.78%
2015 CHF −7.81% +3.35% −2.34% −0.77% +0.21% +2.41% +4.42% −1.21% −0.18% +3.01% +0.96% +0.03% +1.51%
2016 CHF −0.83% −3.31% −2.22% +2.22% +7.15% +0.20% +2.12% +3.77% +0.86% +2.67% +5.21% +3.23% +22.65%
2017 CHF +0.28% +0.41% −0.11% +1.58% +2.17%
2014 EUR +1.82% +5.82% +3.33% +0.40% +2.08% +14.10%
2015 EUR +6.22% +0.49% +0.81% −1.78% +1.91% +1.15% +2.31% −3.06% −0.71% +3.14% +1.17% −0.44% +11.46%
2016 EUR −2.55% −1.03% -3.04% +1.43% +6.18% +2.20% +1.91% +2.44% +1.02% +2.55% +4.44% +3.19% +19.96%
2017 EUR +0.46% +0.43% −0.48% +0.30% +0.71%

44AFC Asia Frontier Fund
FUND STATISTICS
900
1,000
1,100
1,200
1,300
1,400
1,500
1,600
1,700
1,800M
ar 1
2A
pr
12
May
12
Jun
12
Jul 1
2A
ug
12
Sep
12
Oct
12
No
v 1
2D
ec 1
2Ja
n 1
3Fe
b 1
3M
ar 1
3A
pr
13
May
13
Jun
13
Jul 1
3A
ug
13
Sep
13
Oct
13
No
v 1
3D
ec 1
3Ja
n 1
4Fe
b 1
4M
ar 1
4A
pr
14
May
14
Jun
14
Jul 1
4A
ug
14
Sep
14
Oct
14
No
v 1
4D
ec 1
4Ja
n 1
5Fe
b 1
5M
ar 1
5A
pr
15
May
15
Jun
15
Jul 1
5A
ug
15
Sep
15
Oct
15
No
v 1
5D
ec 1
5Ja
n 1
6Fe
b 1
6M
ar 1
6A
pr
16
May
16
Jun
16
Jul 1
6A
ug
16
Sep
16
Oct
16
No
v 1
6D
ec 1
6Ja
n 1
7Fe
b 1
7M
ar 1
7A
pr
17
Fund Performance - USD Class A (Net)
MSCI Frontier Markets Asia Net Total Return USD Index AFC Asia Frontier Fund (after fees)

45AFC Asia Frontier Fund
FUND STATISTICS
900
1,000
1,100
1,200
1,300
1,400
1,500
1,600
1,700
1,800
1,900
2,000
2,100
2,200
2,300M
ar 1
2A
pr
12
May
12
Jun
12
Jul 1
2A
ug
12
Sep
12
Oct
12
No
v 1
2D
ec 1
2Ja
n 1
3Fe
b 1
3M
ar 1
3A
pr
13
May
13
Jun
13
Jul 1
3A
ug
13
Sep
13
Oct
13
No
v 1
3D
ec 1
3Ja
n 1
4Fe
b 1
4M
ar 1
4A
pr
14
May
14
Jun
14
Jul 1
4A
ug
14
Sep
14
Oct
14
No
v 1
4D
ec 1
4Ja
n 1
5Fe
b 1
5M
ar 1
5A
pr
15
May
15
Jun
15
Jul 1
5A
ug
15
Sep
15
Oct
15
No
v 1
5D
ec 1
5Ja
n 1
6Fe
b 1
6M
ar 1
6A
pr
16
May
16
Jun
16
Jul 1
6A
ug
16
Sep
16
Oct
16
No
v 1
6D
ec 1
6Ja
n 1
7Fe
b 1
7M
ar 1
7A
pr
17
Fund Performance – USD Class A (Gross)
MSCI Frontier Markets Asia Net Total Return USD Index AFC Asia Frontier Fund (Gross)

46AFC Asia Frontier Fund
Growth in Fund Size and Number of Clients
FUND STATISTICS
0
20
40
60
80
100
120
140
-
5,000
10,000
15,000
20,000
25,000Fe
b 1
2
Ap
r 1
2
Jun
12
Au
g 1
2
Oct
12
Dec
12
Feb
13
Ap
r 1
3
Jun
13
Au
g 1
3
Oct
13
Dec
13
Feb
14
Ap
r 1
4
Jun
14
Au
g 1
4
Oct
14
Dec
14
Feb
15
Ap
r 1
5
Jun
15
Au
g 1
5
Oct
15
Dec
15
Feb
16
Ap
r 1
6
Jun
16
Au
g 1
6
Oct
16
Dec
16
Feb
17
Ap
r 1
7
Nu
mb
er
of
Clie
nts
Fun
d S
ize
(U
S$'0
00
)
Private Clients (Right Axis) Institutional Clients (Right Axis) Fund Size (US$'000) (Left Axis)

47AFC Asia Frontier Fund
COUNTRY ALLOCATION
26.1%24.7%
17.8%
12.6%
4.0% 3.6% 2.8%1.6% 1.1% 0.3%
5.4%
0%
5%
10%
15%
20%
25%
30%
Country Allocation – 30th April 2017

48AFC Asia Frontier Fund
SECTOR ALLOCATION
18.2%
15.1% 14.5%
11.9% 11.5%10.6%
4.4%3.6%
2.1%1.4% 1.3%
5.4%
0%
2%
4%
6%
8%
10%
12%
14%
16%
18%
20%
Sector Allocation – 30th April 2017

49
Investment Manager: Asia Frontier Capital Ltd., Cayman Islands
Investment Advisor: Asia Frontier Investments Ltd., Hong Kong
Fund Base Currencies: USD, EUR, CHF
Subscription Frequency: Monthly, 5 business days before end of month
Redemption: Monthly:
- 90 days prior notice for class A shares
- 180 days prior notice for class B shares
Management Fee: 1.8% p.a. of NAV for class A shares
1.5% p.a. of NAV for class B shares
Performance Fee: 10% NAV appreciation above 3 month USD-LIBOR +2% and high water mark for class A shares
8% NAV appreciation above 3 month USD-LIBOR +2% and high water mark for class B shares
Initial Minimum Investment: USD/EUR/CHF 50,000 for US Investors
USD/EUR/CHF 25,000 for non-US Investors
FUND TERMS & CONDITIONS
AFC Asia Frontier Fund
50
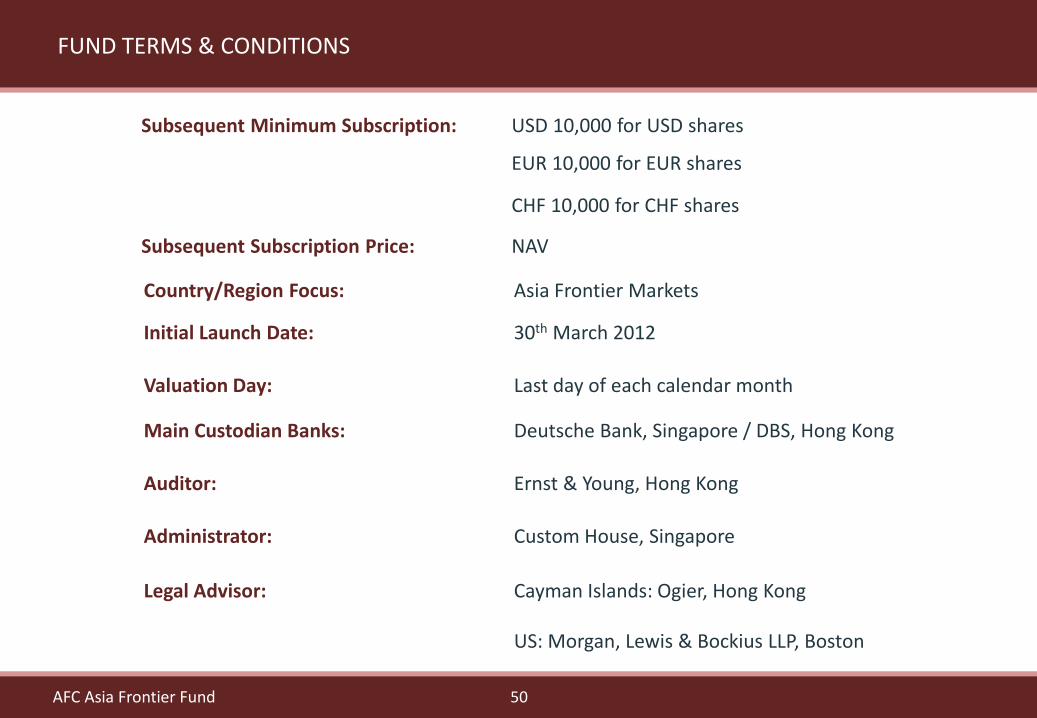
Subsequent Minimum Subscription: USD 10,000 for USD shares
EUR 10,000 for EUR shares
CHF 10,000 for CHF shares
Subsequent Subscription Price: NAV
Country/Region Focus: Asia Frontier Markets
Initial Launch Date: 30th March 2012
Valuation Day: Last day of each calendar month
Main Custodian Banks: Deutsche Bank, Singapore / DBS, Hong Kong
Auditor: Ernst & Young, Hong Kong
Administrator: Custom House, Singapore
Legal Advisor: Cayman Islands: Ogier, Hong Kong
US: Morgan, Lewis & Bockius LLP, Boston
AFC Asia Frontier Fund
FUND TERMS & CONDITIONS

51
ASIA FRONTIER CAPITAL LTD.Thomas Hugger, CEO and Fund Manager, Hong KongEmail: [email protected]: +852 3904 1015, Fax: +852 3904 1017
Peter de Vries, Marketing Director, Hong KongEmail: [email protected]: +852 3904 1079, Fax: +852 3904 1017
Website: www.asiafrontiercapital.com
Registered Office: c/o Intertrust Cayman Islands, 190 Elgin Avenue, George TownGrand Cayman KY1-9007, Cayman Islands
Hong Kong Office:Asia Frontier Investments Limited905, 9th Floor, Loon Kee Building, 267-275 Des Voeux Road Central, Hong Kong
AFC Asia Frontier Fund
CONTACT INFORMATION
Asia Frontier Investments Limited is licensed by SFC Hong Kong for Type 4 (advising on securities) and Type 9 (asset management)
*The representative of the Fund in Switzerland is Hugo Fund Services SA, 6 Cours de Rive, 1204 Geneva. The distribution of Sharesin Switzerland must exclusively be made to qualified investors. The place of performance and jurisdiction for Shares in the Funddistributed in Switzerland are at the registered office of the Representative.

This Presentation is presented solely for purposes of discussion to assist prospective investors in determining whether they have a preliminary interest in the investment opportunity described herein. Under no
circumstances is it to be used or considered as an offer to sell, or a solicitation of an offer to buy, any security or other interest in AFC Asia Frontier Fund, AFC Umbrella Fund or any other fund related thereto (the
“Fund”). Offers and sales of interests in the Fund will not be registered under the laws of any jurisdiction and will be made solely to qualified investors under all applicable laws. Potential investors must read the entire
Offering Memorandum delivered by the Fund and the disclosure in this Subscription Agreement. Nothing contained herein shall be deemed to be binding against, or to create any obligations or commitment on the
part of, any potential investor or the Asia Frontier Capital (the “Fund Sponsors”). The Fund Sponsors reserve the right, in their sole and absolute discretion with or without notice, to alter the terms or conditions of this
Presentation and the Fund and/or to alter or terminate the potential investment opportunity described herein. Potential investors are not to construe this Presentation as investment, legal or tax advice. Prior to
making any potential investment, potential investors should consult with their own legal, investment, accounting, regulatory, tax and other advisors to determine the consequences of the potential investment
opportunity described herein and to arrive at an independent evaluation of such potential investment opportunity.
By accepting this Presentation, the recipient agrees not to copy, distribute, discuss or otherwise disclose this Presentation or the contents hereof (including the potential investment opportunity described) or any
other related information provided by the Fund Sponsors or by its agents to any person other than employees of recipient evaluating this potential investment opportunity on recipient’s behalf without the prior written
consent of the Fund Sponsors.
While the information contained herein has been obtained from various sources which the Fund Sponsors believe, but does not guarantee, to be reliable, the Fund Sponsors do not represent that it is accurate or
complete and it should not be relied upon as such. No person has been authorized to give any information or make any representation or warranty regarding the subject matter hereof, either express or implied, and,
if given or made in this Presentation, in other materials or verbally, such information, representation or warranty cannot and should not be relied upon nor is any representation or warranty made as to the accuracy,
content, suitability or completeness of the information, analysis or conclusions or any information furnished in connection herewith contained in this Presentation and it is not to be relied upon as a substitute for
independent review of the underlying documents, available due diligence information and such other information as prospective investors may deem appropriate or prudent to review. The Fund Sponsors, their
agents, their respective affiliates, and each of their respective shareholders, members, officers, directors, managers, employees, counsel, advisors, consultants and agents (“Representatives”), expressly disclaim any
and all liability for express or implied representations or warranties that may be contained in, or for omissions from or inaccuracies in, this Presentation or any other oral or written communication transmitted or made
available to a prospective investor or its Representatives. Without limiting the generality of the foregoing, nothing contained herein is or shall be relied upon as a promise or representation as to any matter, including,
without limitation, the future performance of the potential investment opportunity described herein. None of the Fund Sponsors, their agents, or their respective Representatives is under any obligation to correct any
inaccuracies or omissions in this Presentation. Each prospective investor will have the sole responsibility for verifying the accuracy of all information furnished in this Presentation and in any other due diligence
information furnished to a prospective investor, and each prospective investor shall have the sole responsibility for determining the value of the potential investment based on assumptions said prospective investor
believes to be reasonable. There shall be no recourse against the Fund Sponsors or any of their Representatives in the event of any errors or omissions in the information furnished, the methodology used, the
calculations of values or conclusions. Without limiting the generality of the foregoing, any historical information or information based on past performance included herein is for informational purposes only, has
inherent limitations and is not intended to be a representation, warranty or guarantee of future performance. All of the information presented herein is subject to change without notice. Actual returns to potential
investors may be lower than the figures shown herein. Projected performance data shown constitutes “forward-looking information” which is based on numerous assumptions and is speculative in nature. Actual
results may vary significantly from the values and rates of return projected herein. There can no assurance that the Fund will realize its rate of return objectives or return of investors’ capital. Potential investors should
have the financial ability and willingness to accept the risks (including without limitation the risk of loss and lack of liquidity) characteristic of investments in entities such as the Fund.
AN INVESTMENT IN THE FUND WILL NOT BE APPROPRIATE FOR ALL INVESTORS. INTERESTS IN THE FUND WILL INVOLVE A HIGH DEGREE OF RISK AND ARE INTENDED FOR SALE ONLY TO
SOPHISTICATED INVESTORS WHO ARE CAPABLE OF UNDERSTANDING AND ASSUMING THE RISKS INVOLVED. INVESTORS MAY LOSE ALL OR SUBSTANTIALLY ALL OF THEIR INVESTMENT.
THE INTERESTS IN THE FUND HAVE NOT BEEN REGISTERED UNDER THE U.S. SECURITIES ACT OF 1933, AS AMENDED (THE “SECURITIES ACT”), OR THE APPLICABLE SECURITIES LAWS OF ANY
US. STATE OR ANY NON-U.S. JURISDICTION, AND ARE BEING OFFERED AND SOLD IN RELIANCE ON EXEMPTIONS FROM THE REGISTRATION REQUIREMENTS OF THE SECURITIES ACT AND ANY
SUCH APPLICABLE LAWS. INTERESTS IN THE FUND HAVE NOT BEEN APPROVED OR DISAPPROVED BY THE US. SECURITIES AND EXCHANGE COMMISSION OR BY THE SECURITIES REGULATORY
AUTHORITY OF ANY STATE OR ANY OTHER RELEVANT JURISDICTION, NOR HAS ANY OTHER AUTHORITY OR COMMISSION PASSED UPON THE ACCURACY OR ADEQUACY OF THIS MEMORANDUM.
ANY REPRESENTATION TO THE CONTRARY IS UNLAWFUL.
*The representative of the Fund in Switzerland is Hugo Fund Services SA, 6 Cours de Rive, 1204 Geneva. The distribution of Shares in Switzerland must exclusively be made to qualified investors. The place of
performance and jurisdiction for Shares in the Fund distributed in Switzerland are at the registered office of the Representative.
** The Fund is registered for sale to investors in Japan, Switzerland (qualified investors), Hong Kong & UK (professional investors), Singapore (accredited investors) and USA (accredited investors and qualified
purchasers).
** By accessing information contained herein, users are deemed to be representing and warranting that they are either a Hong Kong Professional Investor or are observing the applicable laws and regulations of their
relevant jurisdictions.
52AFC Asia Frontier Fund
DISCLAIMER
Top Related