


Languages
Pages
Legal

AEROBIC AND ANAEROBIC TRANSFORMATIONS OF SULFIDE IN A SEWER SYSTEM – FIELD STUDY AND MODEL SIMULATIONS
Asbjørn Haaning Nielsen, Jes Vollertsen, Henriette Stokbro Jensen, Heidi Ina Madsen, Thorkild
Hvitved-Jacobsen Section of Environmental Engineering, Aalborg University,
Sohngaardsholmsvej 57, 9000 Aalborg, Denmark ABSTRACT The formation and fate of sulfide in a force main and a downstream-located gravity sewer were investigated in an extensive field study. Sulfide formation during approximately 4 hours of anaerobic transport in the force main was significant. The following gravity sewer was aerobic and a fast reduction of the sulfide concentration was observed due to sulfide oxidation and emission of hydrogen sulfide gas to the sewer atmosphere. During 14 minutes of transport in the gravity sewer, the sulfide concentration decreased on average 30%. Despite the continuous emission of hydrogen sulfide, the concentration in the atmosphere of the gravity sewer was generally below 3% of the concentration in equilibrium with the sulfide concentration in the wastewater. This observation demonstrated that removal of hydrogen sulfide gas by adsorption onto the sewer walls exposed to the sewer atmosphere was fast compared with emission from the wastewater. An application of a conceptual sewer process model for simulating the formation and fate of sulfide in wastewater collection systems was demonstrated. The model was able to reproduce the average conditions in the investigated intercepting sewer satisfactory, but could not account for the observed variability. Overall, the model predicted that approximately 90% of the decrease of the sulfide concentration in the gravity sewer was due to sulfide oxidation and that only a small fraction entered the sewer atmosphere, causing odor and corrosion. Even so, the model predicted concrete corrosion rates of up to 1.2 mm per year in the gravity sewer section. KEYWORDS Concrete corrosion, force main, gravity sewer, hydrogen sulfide, modeling, wastewater quality. INTRODUCTION Sulfide related problems are a major concern when designing and operating wastewater collection systems. The major problems related to buildup of sulfide in sewers include corrosion of sewer structures, odor nuisance and health impacts on sewer workers (U.S. EPA., 1974). The corrosion of sewer structures result from adsorption of hydrogen sulfide gas onto the wetted surfaces exposed to the sewer atmosphere and subsequent oxidation of the hydrogen sulfide to sulfuric acid. The sulfuric acid reacts readily with the alkaline components of the concrete structures such as sewer pipes and manholes. The odor nuisance result from emission of foul gases into the urban atmosphere including hydrogen sulfide gas as well as other low molecular and volatile organic compounds (VOC’s) produced under anaerobic conditions. The health impacts relate to the buildup of toxic/lethal levels of hydrogen sulfide gas in the sewer atmosphere.
3654
WEFTEC®.06
Copyright 2006 Water Environment Foundation. All Rights Reserved©
The formation and fate of sulfide in wastewater collection systems is governed by a large number of complex and interrelated processes (Pomeroy and Parkhurst, 1977). Sulfide is produced by anaerobic heterotrophic degradation of organic matter with sulfate as terminal electron acceptor. This process mainly takes place in the biofilm and sediments covering the submerged sewer walls. From here, the sulfide diffuses towards areas of lower sulfide concentration; i.e., the outer layers of the biofilm/sediments and the wastewater stream. In case dissolved oxygen (DO) is present, the sulfide is readily oxidized by chemical or biological processes. However, if anaerobic conditions prevail, the sulfide will enter the wastewater stream. Sulfide present in the flowing wastewater may then either be oxidized, react with metals to produce insoluble metal sulfides, or be emitted as hydrogen sulfide gas to the overlaying sewer atmosphere. Models are much needed that can be applied for design and management of wastewater collection systems. The models must allow prediction of sulfide and the consequent problems, and must be applicable as decision support tools for sulfide control practices. A number of empirical models have been developed for these purposes. However, these empirical models have serious limitations in terms of applicability. A more widely applicable approach for sulfide prediction in both gravity sewers and force mains relies on a conceptual description of the sulfur cycle in terms of a sewer process model for sulfide build-up. An example of such a conceptual sewer process model is the WATS model (Wastewater Aerobic-anaerobic Transformations in Sewers) developed at Aalborg University, Denmark (Hvitved-Jacobsen, 2002). The WATS model has successfully been calibrated and validated for simulation of the in-sewer carbon cycle against field measurements (e.g., Almeida et al., 2000; Vollertsen et al., 2005). Similarly, model simulations of sulfide buildup in force mains have also proven feasible (e.g., Nielsen et al., 1998). However, a thorough validation of the sulfur cycle transformations in gravity sewers has not yet been performed. The objective of this study was accordingly: 1. To establish data on the formation of sulfide in a force main and the fate of sulfide in a
downstream-located aerobic gravity sewer. 2. To validate the applicability of the WATS model for simulating the formation and fate of
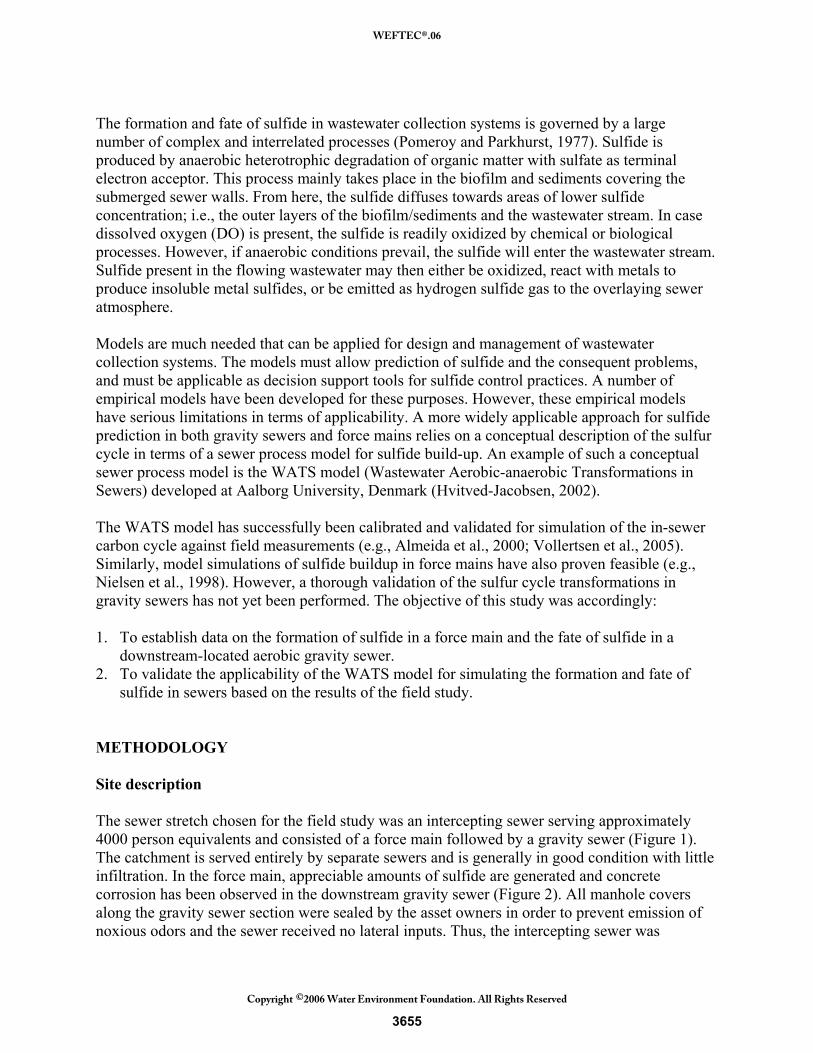
sulfide in sewers based on the results of the field study. METHODOLOGY Site description The sewer stretch chosen for the field study was an intercepting sewer serving approximately 4000 person equivalents and consisted of a force main followed by a gravity sewer (Figure 1). The catchment is served entirely by separate sewers and is generally in good condition with little infiltration. In the force main, appreciable amounts of sulfide are generated and concrete corrosion has been observed in the downstream gravity sewer (Figure 2). All manhole covers along the gravity sewer section were sealed by the asset owners in order to prevent emission of noxious odors and the sewer received no lateral inputs. Thus, the intercepting sewer was
3655
WEFTEC®.06
Copyright 2006 Water Environment Foundation. All Rights Reserved©
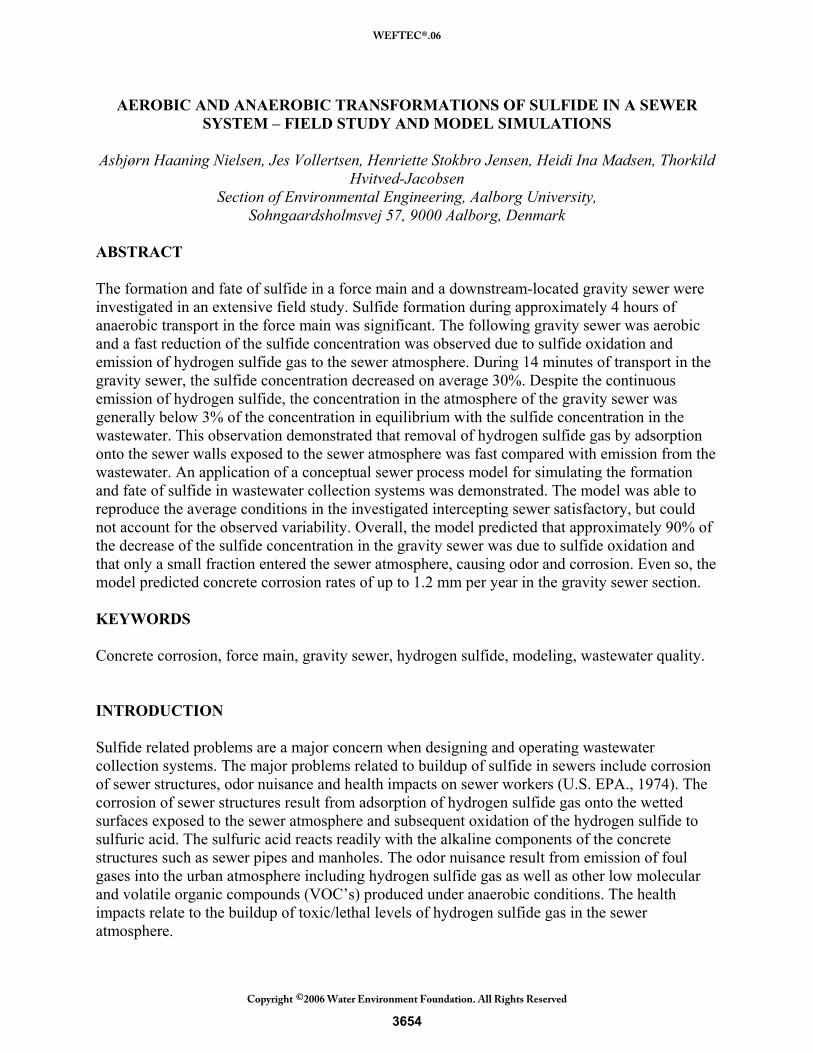
essentially a flow-through reactor, which made it ideal for studying wastewater quality changes during transport. Main characteristics of the intercepting sewer are summarized in Table 1. Figure 1 - The intercepting sewer where the field study was conducted, cf. text. The sampling sites are indicated by a star and a number: G1, G2, G3 are gravity sewer manholes; PS is the force main pumping station
Figure 2 - Severely corroded concrete pipe located downstream of the force main, Figure 1. The aggregates in the concrete are clearly visible.
Table 1 - Main characteristics of the intercepting sewer. Force main Gravity sewer* Pipe inner diameter (mm) 300 400 Length (m) 2012 402 Slope of the gravity sewer (m m-1) - 0.0024 Flow rate (m3 h-1)** 37.5 – 41.1 37.5 – 41.1 Flow velocity (m s-1)** 0.15 – 0.16 0.45 – 0.47 Hydraulic retention time (h)** 3.63 – 4.66 0.24 – 0.25 DO concentration (gO2 m-3) 0 0.1 – 0.8 *sampling section; **during sampling The pumping station featured a variable-speed drive, which maintained a continuous flow of wastewater in the force main. Accordingly, the flow variations during sampling were not influenced by start and stop of the pump. Wastewater flow rates were obtained from readouts of the variable-speed drive controller. The velocity of the flowing wastewater in the gravity sewer section was calculated assuming steady and uniform flow. The calculated velocity was verified by pulse addition of an inert tracer (NaCl) into the flowing wastewater in the discharge manhole and conductivity measurements in the downstream manholes. The velocity was then calculated from the travel time of the tracer pulses between the manholes. Similarly, the gas phase velocity was estimated by pulse injection
3656
WEFTEC®.06
Copyright 2006 Water Environment Foundation. All Rights Reserved©
of a tracer gas (O2) into the headspace of the discharge manhole and corresponding O2 measurements in the downstream manholes as described by Madsen et al. (2005). The wastewater intercepted in the sewer comprises mainly of domestic wastewater, however, one food processing industry (soft drinks) at times affects the wastewater quality significantly, resulting in high concentrations of readily biodegradable substrates and fluctuations of the wastewater pH. Sample collection The field study was conducted during the period June - September, 2005, and a total of 20 sets of samples were collected. For studying anaerobic transformations of sulfide during transport in the force main, samples were collected at the pumping station (PS) and from the discharge manhole (G1) (Figure 2). For studying the aerobic transformations in the gravity sewer section, samples were collected from three manholes along a distance of 402 m (G1, G2 and G3). Wastewater samples were obtained using automatic wastewater samplers (Teledyne Isco, Inc., Lincoln, Nebraska). One sampler was installed at the pumping station with the suction line suspended into the pump sump. The other three samplers were placed in G1, G2 and G3 with the end of the suction line positioned approximately 5 cm above the bottom of the sewer pipe in order to avoid sediments or pieces of biofilm in the samples. During a sampling round, 24 samples (250 mL) were obtained at each location. It was attempted to follow a plug of wastewater as it flowed through the system. Accordingly, the samplers were started in succession with a time-offset equivalent to the travel time of the wastewater between the sampling locations. However, the hydraulic retention time in the force main could first be estimated after each sampling round was completed. In order to sample the same plug of wastewater, the sampler located in the pumping station was therefore programmed to take 15 minutes composite samples while the samplers positioned along the gravity sewer section took samples with time intervals of 2 minutes. This mode of sampling made it possible to identify matching samples from the pumping station and the gravity sewer section after each sampling round was completed. In addition, 5 L grab samples for laboratory determination of the wastewater quality were obtained from the discharge manhole (G1) immediately before and after each sampling round. Analytical procedures Several parameters were measured in each sampling round. The main parameters and the mode of measuring/sampling are summarized in Table 2.
3657
WEFTEC®.06
Copyright 2006 Water Environment Foundation. All Rights Reserved©
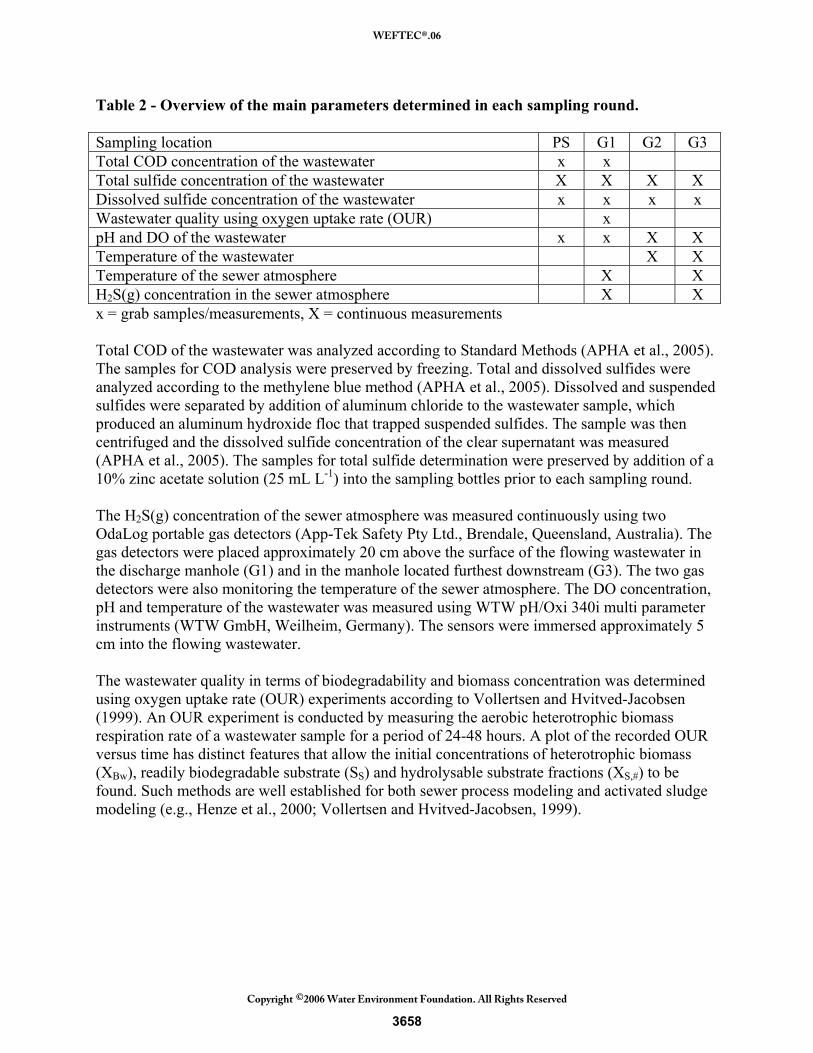
Table 2 - Overview of the main parameters determined in each sampling round. Sampling location PS G1 G2 G3 Total COD concentration of the wastewater x x Total sulfide concentration of the wastewater X X X X Dissolved sulfide concentration of the wastewater x x x x Wastewater quality using oxygen uptake rate (OUR) x pH and DO of the wastewater x x X X Temperature of the wastewater X X Temperature of the sewer atmosphere X X H2S(g) concentration in the sewer atmosphere X X x = grab samples/measurements, X = continuous measurements Total COD of the wastewater was analyzed according to Standard Methods (APHA et al., 2005). The samples for COD analysis were preserved by freezing. Total and dissolved sulfides were analyzed according to the methylene blue method (APHA et al., 2005). Dissolved and suspended sulfides were separated by addition of aluminum chloride to the wastewater sample, which produced an aluminum hydroxide floc that trapped suspended sulfides. The sample was then centrifuged and the dissolved sulfide concentration of the clear supernatant was measured (APHA et al., 2005). The samples for total sulfide determination were preserved by addition of a 10% zinc acetate solution (25 mL L-1) into the sampling bottles prior to each sampling round. The H2S(g) concentration of the sewer atmosphere was measured continuously using two OdaLog portable gas detectors (App-Tek Safety Pty Ltd., Brendale, Queensland, Australia). The gas detectors were placed approximately 20 cm above the surface of the flowing wastewater in the discharge manhole (G1) and in the manhole located furthest downstream (G3). The two gas detectors were also monitoring the temperature of the sewer atmosphere. The DO concentration, pH and temperature of the wastewater was measured using WTW pH/Oxi 340i multi parameter instruments (WTW GmbH, Weilheim, Germany). The sensors were immersed approximately 5 cm into the flowing wastewater. The wastewater quality in terms of biodegradability and biomass concentration was determined using oxygen uptake rate (OUR) experiments according to Vollertsen and Hvitved-Jacobsen (1999). An OUR experiment is conducted by measuring the aerobic heterotrophic biomass respiration rate of a wastewater sample for a period of 24-48 hours. A plot of the recorded OUR versus time has distinct features that allow the initial concentrations of heterotrophic biomass (XBw), readily biodegradable substrate (SS) and hydrolysable substrate fractions (XS,#) to be found. Such methods are well established for both sewer process modeling and activated sludge modeling (e.g., Henze et al., 2000; Vollertsen and Hvitved-Jacobsen, 1999).
3658
WEFTEC®.06
Copyright 2006 Water Environment Foundation. All Rights Reserved©
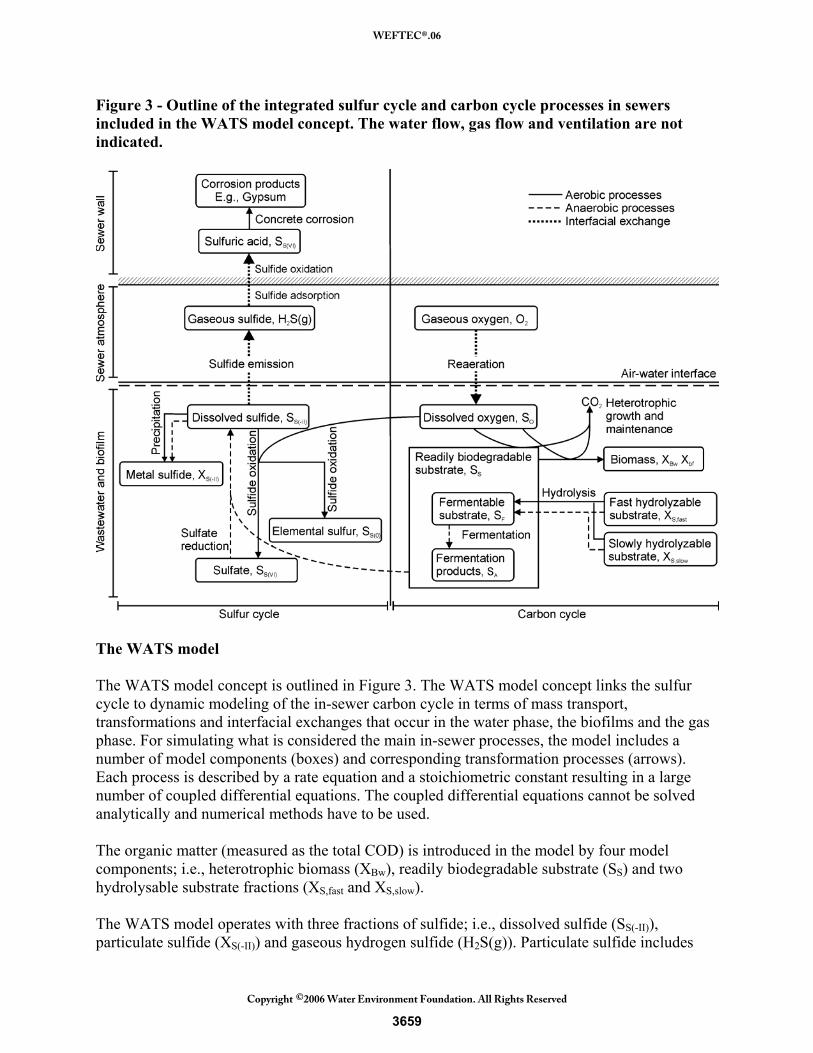
Figure 3 - Outline of the integrated sulfur cycle and carbon cycle processes in sewers included in the WATS model concept. The water flow, gas flow and ventilation are not indicated.
The WATS model The WATS model concept is outlined in Figure 3. The WATS model concept links the sulfur cycle to dynamic modeling of the in-sewer carbon cycle in terms of mass transport, transformations and interfacial exchanges that occur in the water phase, the biofilms and the gas phase. For simulating what is considered the main in-sewer processes, the model includes a number of model components (boxes) and corresponding transformation processes (arrows). Each process is described by a rate equation and a stoichiometric constant resulting in a large number of coupled differential equations. The coupled differential equations cannot be solved analytically and numerical methods have to be used. The organic matter (measured as the total COD) is introduced in the model by four model components; i.e., heterotrophic biomass (XBw), readily biodegradable substrate (SS) and two hydrolysable substrate fractions (XS,fast and XS,slow). The WATS model operates with three fractions of sulfide; i.e., dissolved sulfide (SS(-II)), particulate sulfide (XS(-II)) and gaseous hydrogen sulfide (H2S(g)). Particulate sulfide includes
3659
WEFTEC®.06
Copyright 2006 Water Environment Foundation. All Rights Reserved©
various metal sulfides and gaseous hydrogen sulfide is calculated as the partial pressure of hydrogen sulfide in the sewer atmosphere. Dissolved sulfide is introduced as the sum of molecular hydrogen sulfide (H2S) and hydrosulfide ion (HS-). At pH values typical for municipal wastewater, the equilibrium between hydrogen sulfide and the hydrosulfide ion is significantly influenced by even moderate pH variations. This aspect is important as only molecular hydrogen sulfide can be emitted from the wastewater to the sewer atmosphere. At pH above 7, the hydrosulfide ion dominates and the emission of hydrogen sulfide is reduced. A more thorough description of the model concept for aerobic and anaerobic transformations of organic matter has been summarized by Hvitved-Jacobsen (2002). Additional details concerning the sulfur cycle processes have been described by Nielsen et al. (2005). WATS model simulation of in-sewer transformations WATS model simulations as outlined in Figure 3 were carried out on the data obtained in each sampling round. For the model simulations, a single set of kinetic and stoichiometric parameter values was used. The model parameters describing organic matter transformations were adapted from Hvitved-Jacobsen (2002). The model parameters for sulfide emission and the removal of hydrogen sulfide gas from the sewer atmosphere by adsorption and subsequent oxidation on moist sewer walls were adapted from Nielsen et al. (2005). The rate constant for sulfide production was selected at a value recommended for wastewater from mixed domestic and industrial (foodstuff) sources (Nielsen et al., 1998). The kinetics of chemical and biological sulfide oxidation in the wastewater has been found to be highly site specific – probably more than any of the other model parameters (Nielsen et al., 2006, Wilmot et al., 1988). Accordingly, the kinetic and stoichiometric model parameters for sulfide oxidation were determined in a series of specifically designed laboratory experiments as described by Nielsen et al. (2006). A total of 8 individual experiments were conducted, and the median parameter values were used for the model simulations. The only parameters changed according to the actual conditions in each sampling round were the pH, temperature, quality of the wastewater, and the wastewater flow rates. RESULTS AND DISCUSSION Wastewater characteristics The COD of the wastewater is typical for Danish municipal wastewater from catchments with little infiltration (Table 3). The relatively high COD concentration indicates that substrate is widely available for the sulfate reducing bacteria. The public water supply in the area is based on groundwater extracted from limestone aquifers resulting in slightly alkaline wastewater with a high buffer capacity. The pH of the wastewater is therefore also relatively constant. The recorded temperatures are typical for summer conditions in Denmark, representing a maximum potential for sulfide buildup.
3660
WEFTEC®.06
Copyright 2006 Water Environment Foundation. All Rights Reserved©
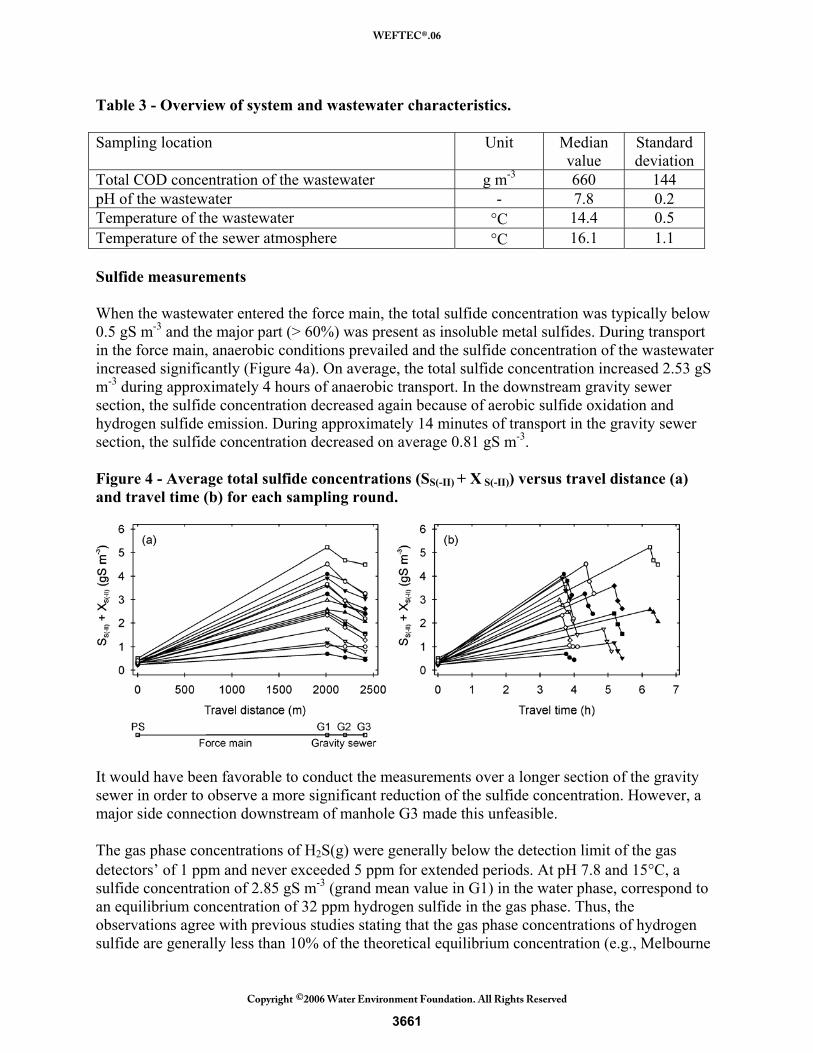
Table 3 - Overview of system and wastewater characteristics. Sampling location Unit Median
value Standard deviation
Total COD concentration of the wastewater g m-3 660 144 pH of the wastewater - 7.8 0.2 Temperature of the wastewater °C 14.4 0.5 Temperature of the sewer atmosphere °C 16.1 1.1 Sulfide measurements When the wastewater entered the force main, the total sulfide concentration was typically below 0.5 gS m-3 and the major part (> 60%) was present as insoluble metal sulfides. During transport in the force main, anaerobic conditions prevailed and the sulfide concentration of the wastewater increased significantly (Figure 4a). On average, the total sulfide concentration increased 2.53 gS m-3 during approximately 4 hours of anaerobic transport. In the downstream gravity sewer section, the sulfide concentration decreased again because of aerobic sulfide oxidation and hydrogen sulfide emission. During approximately 14 minutes of transport in the gravity sewer section, the sulfide concentration decreased on average 0.81 gS m-3. Figure 4 - Average total sulfide concentrations (SS(-II) + X S(-II)) versus travel distance (a) and travel time (b) for each sampling round.
It would have been favorable to conduct the measurements over a longer section of the gravity sewer in order to observe a more significant reduction of the sulfide concentration. However, a major side connection downstream of manhole G3 made this unfeasible. The gas phase concentrations of H2S(g) were generally below the detection limit of the gas detectors’ of 1 ppm and never exceeded 5 ppm for extended periods. At pH 7.8 and 15°C, a sulfide concentration of 2.85 gS m-3 (grand mean value in G1) in the water phase, correspond to an equilibrium concentration of 32 ppm hydrogen sulfide in the gas phase. Thus, the observations agree with previous studies stating that the gas phase concentrations of hydrogen sulfide are generally less than 10% of the theoretical equilibrium concentration (e.g., Melbourne
3661
WEFTEC®.06
Copyright 2006 Water Environment Foundation. All Rights Reserved©
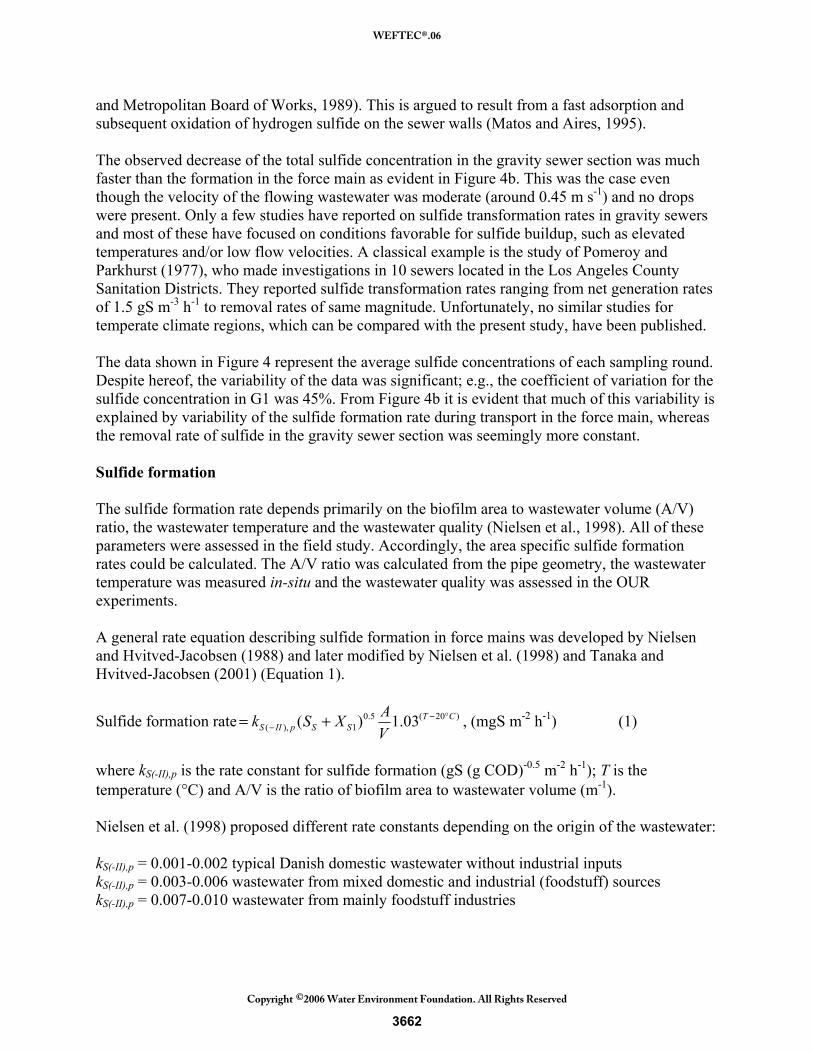
and Metropolitan Board of Works, 1989). This is argued to result from a fast adsorption and subsequent oxidation of hydrogen sulfide on the sewer walls (Matos and Aires, 1995). The observed decrease of the total sulfide concentration in the gravity sewer section was much faster than the formation in the force main as evident in Figure 4b. This was the case even though the velocity of the flowing wastewater was moderate (around 0.45 m s-1) and no drops were present. Only a few studies have reported on sulfide transformation rates in gravity sewers and most of these have focused on conditions favorable for sulfide buildup, such as elevated temperatures and/or low flow velocities. A classical example is the study of Pomeroy and Parkhurst (1977), who made investigations in 10 sewers located in the Los Angeles County Sanitation Districts. They reported sulfide transformation rates ranging from net generation rates of 1.5 gS m-3 h-1 to removal rates of same magnitude. Unfortunately, no similar studies for temperate climate regions, which can be compared with the present study, have been published. The data shown in Figure 4 represent the average sulfide concentrations of each sampling round. Despite hereof, the variability of the data was significant; e.g., the coefficient of variation for the sulfide concentration in G1 was 45%. From Figure 4b it is evident that much of this variability is explained by variability of the sulfide formation rate during transport in the force main, whereas the removal rate of sulfide in the gravity sewer section was seemingly more constant. Sulfide formation The sulfide formation rate depends primarily on the biofilm area to wastewater volume (A/V) ratio, the wastewater temperature and the wastewater quality (Nielsen et al., 1998). All of these parameters were assessed in the field study. Accordingly, the area specific sulfide formation rates could be calculated. The A/V ratio was calculated from the pipe geometry, the wastewater temperature was measured in-situ and the wastewater quality was assessed in the OUR experiments. A general rate equation describing sulfide formation in force mains was developed by Nielsen and Hvitved-Jacobsen (1988) and later modified by Nielsen et al. (1998) and Tanaka and Hvitved-Jacobsen (2001) (Equation 1).
Sulfide formation rate )20(5.01),( 03.1)( CT
SSpIIS VAXSk °−
− += , (mgS m-2 h-1) (1)
where kS(-II),p is the rate constant for sulfide formation (gS (g COD)-0.5 m-2 h-1); T is the temperature (°C) and A/V is the ratio of biofilm area to wastewater volume (m-1). Nielsen et al. (1998) proposed different rate constants depending on the origin of the wastewater: kS(-II),p = 0.001-0.002 typical Danish domestic wastewater without industrial inputs kS(-II),p = 0.003-0.006 wastewater from mixed domestic and industrial (foodstuff) sources kS(-II),p = 0.007-0.010 wastewater from mainly foodstuff industries
3662
WEFTEC®.06
Copyright 2006 Water Environment Foundation. All Rights Reserved©
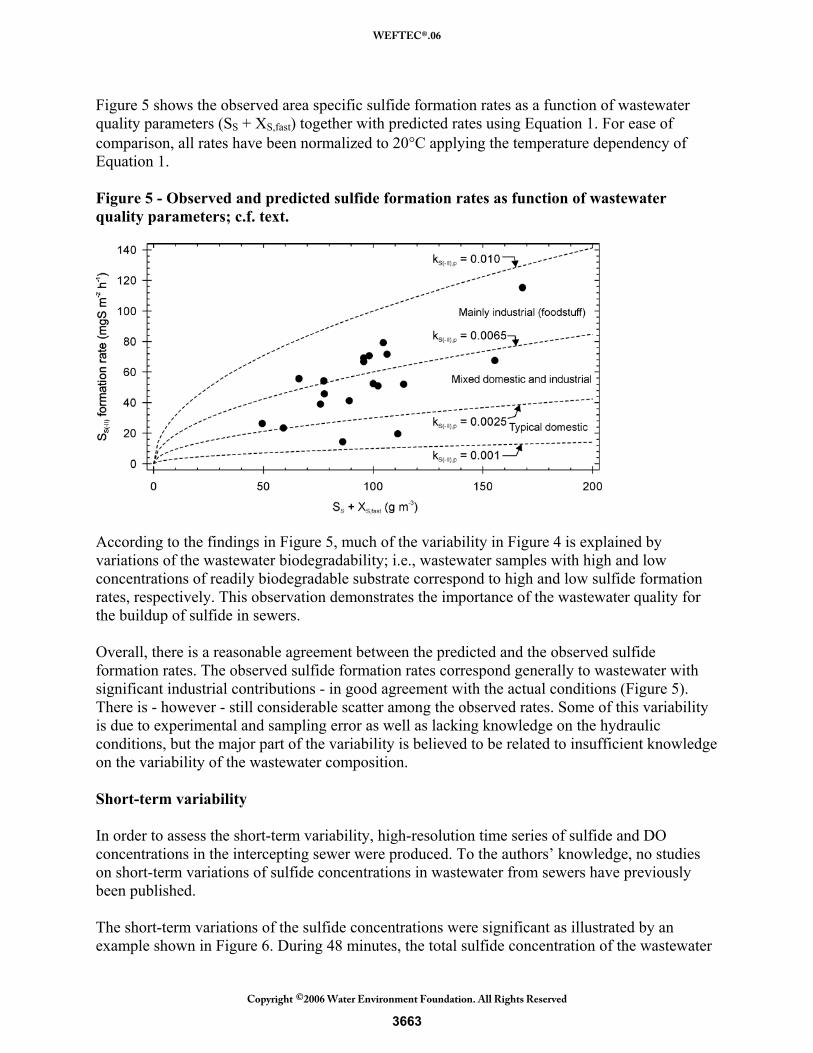
Figure 5 shows the observed area specific sulfide formation rates as a function of wastewater quality parameters (SS + XS,fast) together with predicted rates using Equation 1. For ease of comparison, all rates have been normalized to 20°C applying the temperature dependency of Equation 1. Figure 5 - Observed and predicted sulfide formation rates as function of wastewater quality parameters; c.f. text.
According to the findings in Figure 5, much of the variability in Figure 4 is explained by variations of the wastewater biodegradability; i.e., wastewater samples with high and low concentrations of readily biodegradable substrate correspond to high and low sulfide formation rates, respectively. This observation demonstrates the importance of the wastewater quality for the buildup of sulfide in sewers. Overall, there is a reasonable agreement between the predicted and the observed sulfide formation rates. The observed sulfide formation rates correspond generally to wastewater with significant industrial contributions - in good agreement with the actual conditions (Figure 5). There is - however - still considerable scatter among the observed rates. Some of this variability is due to experimental and sampling error as well as lacking knowledge on the hydraulic conditions, but the major part of the variability is believed to be related to insufficient knowledge on the variability of the wastewater composition. Short-term variability In order to assess the short-term variability, high-resolution time series of sulfide and DO concentrations in the intercepting sewer were produced. To the authors’ knowledge, no studies on short-term variations of sulfide concentrations in wastewater from sewers have previously been published. The short-term variations of the sulfide concentrations were significant as illustrated by an example shown in Figure 6. During 48 minutes, the total sulfide concentration of the wastewater
3663
WEFTEC®.06
Copyright 2006 Water Environment Foundation. All Rights Reserved©
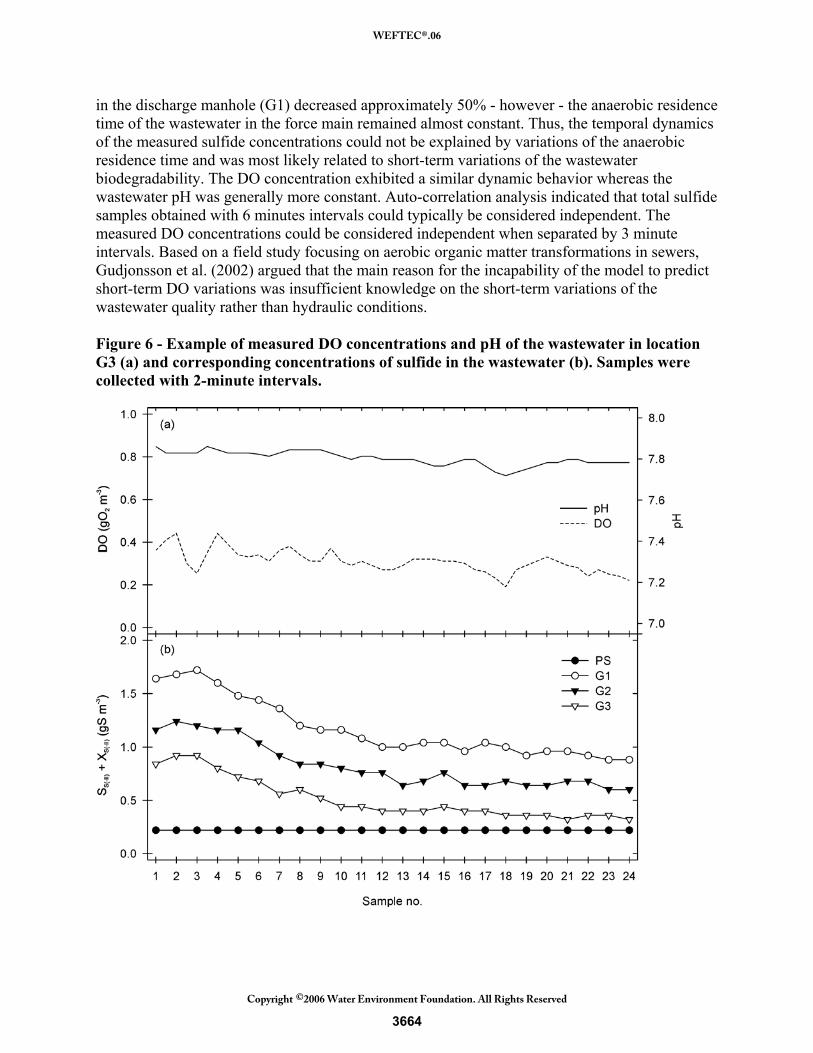
in the discharge manhole (G1) decreased approximately 50% - however - the anaerobic residence time of the wastewater in the force main remained almost constant. Thus, the temporal dynamics of the measured sulfide concentrations could not be explained by variations of the anaerobic residence time and was most likely related to short-term variations of the wastewater biodegradability. The DO concentration exhibited a similar dynamic behavior whereas the wastewater pH was generally more constant. Auto-correlation analysis indicated that total sulfide samples obtained with 6 minutes intervals could typically be considered independent. The measured DO concentrations could be considered independent when separated by 3 minute intervals. Based on a field study focusing on aerobic organic matter transformations in sewers, Gudjonsson et al. (2002) argued that the main reason for the incapability of the model to predict short-term DO variations was insufficient knowledge on the short-term variations of the wastewater quality rather than hydraulic conditions. Figure 6 - Example of measured DO concentrations and pH of the wastewater in location G3 (a) and corresponding concentrations of sulfide in the wastewater (b). Samples were collected with 2-minute intervals.
3664
WEFTEC®.06
Copyright 2006 Water Environment Foundation. All Rights Reserved©
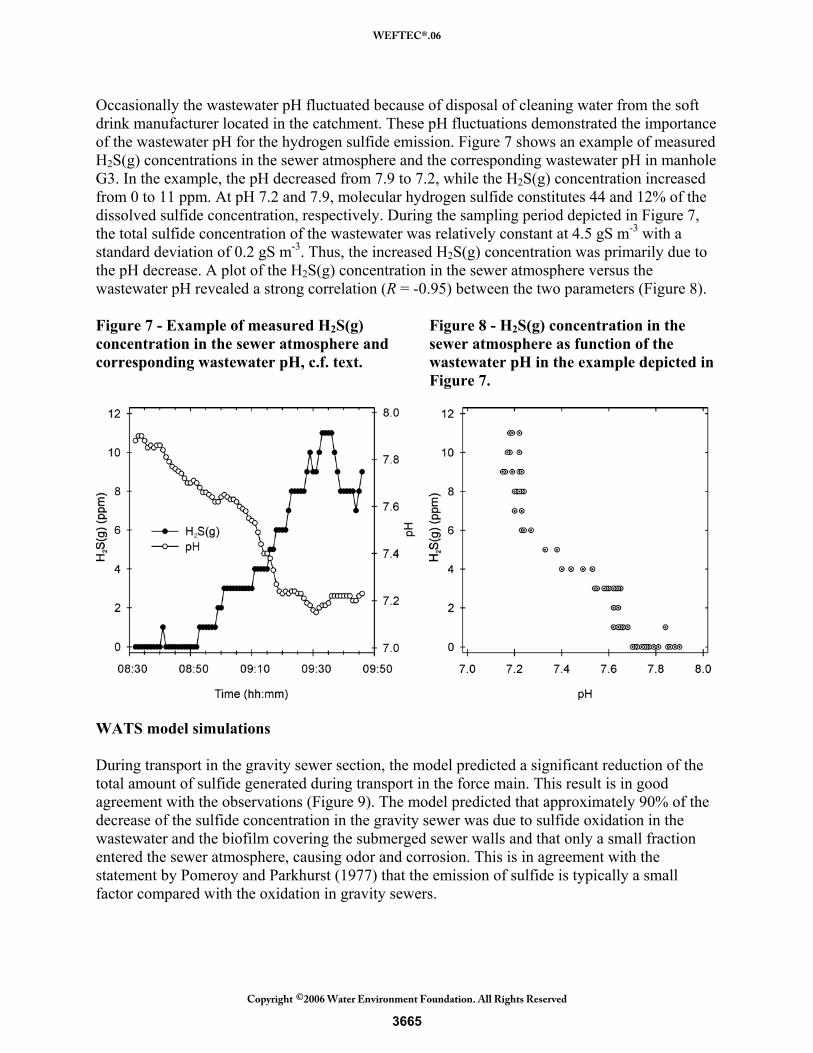
Occasionally the wastewater pH fluctuated because of disposal of cleaning water from the soft drink manufacturer located in the catchment. These pH fluctuations demonstrated the importance of the wastewater pH for the hydrogen sulfide emission. Figure 7 shows an example of measured H2S(g) concentrations in the sewer atmosphere and the corresponding wastewater pH in manhole G3. In the example, the pH decreased from 7.9 to 7.2, while the H2S(g) concentration increased from 0 to 11 ppm. At pH 7.2 and 7.9, molecular hydrogen sulfide constitutes 44 and 12% of the dissolved sulfide concentration, respectively. During the sampling period depicted in Figure 7, the total sulfide concentration of the wastewater was relatively constant at 4.5 gS m-3 with a standard deviation of 0.2 gS m-3. Thus, the increased H2S(g) concentration was primarily due to the pH decrease. A plot of the H2S(g) concentration in the sewer atmosphere versus the wastewater pH revealed a strong correlation (R = -0.95) between the two parameters (Figure 8). Figure 7 - Example of measured H2S(g) concentration in the sewer atmosphere and corresponding wastewater pH, c.f. text.
Figure 8 - H2S(g) concentration in the sewer atmosphere as function of the wastewater pH in the example depicted in Figure 7.
WATS model simulations During transport in the gravity sewer section, the model predicted a significant reduction of the total amount of sulfide generated during transport in the force main. This result is in good agreement with the observations (Figure 9). The model predicted that approximately 90% of the decrease of the sulfide concentration in the gravity sewer was due to sulfide oxidation in the wastewater and the biofilm covering the submerged sewer walls and that only a small fraction entered the sewer atmosphere, causing odor and corrosion. This is in agreement with the statement by Pomeroy and Parkhurst (1977) that the emission of sulfide is typically a small factor compared with the oxidation in gravity sewers.
3665
WEFTEC®.06
Copyright 2006 Water Environment Foundation. All Rights Reserved©
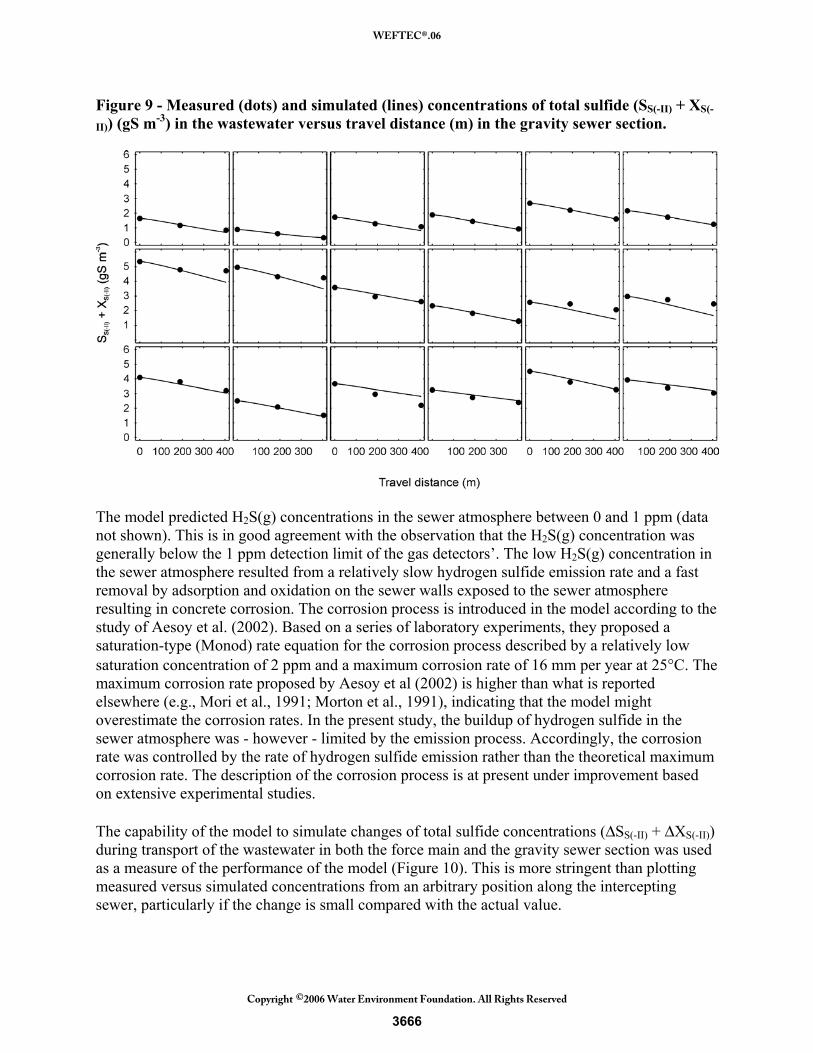
Figure 9 - Measured (dots) and simulated (lines) concentrations of total sulfide (SS(-II) + XS(-
II)) (gS m-3) in the wastewater versus travel distance (m) in the gravity sewer section.
The model predicted H2S(g) concentrations in the sewer atmosphere between 0 and 1 ppm (data not shown). This is in good agreement with the observation that the H2S(g) concentration was generally below the 1 ppm detection limit of the gas detectors’. The low H2S(g) concentration in the sewer atmosphere resulted from a relatively slow hydrogen sulfide emission rate and a fast removal by adsorption and oxidation on the sewer walls exposed to the sewer atmosphere resulting in concrete corrosion. The corrosion process is introduced in the model according to the study of Aesoy et al. (2002). Based on a series of laboratory experiments, they proposed a saturation-type (Monod) rate equation for the corrosion process described by a relatively low saturation concentration of 2 ppm and a maximum corrosion rate of 16 mm per year at 25°C. The maximum corrosion rate proposed by Aesoy et al (2002) is higher than what is reported elsewhere (e.g., Mori et al., 1991; Morton et al., 1991), indicating that the model might overestimate the corrosion rates. In the present study, the buildup of hydrogen sulfide in the sewer atmosphere was - however - limited by the emission process. Accordingly, the corrosion rate was controlled by the rate of hydrogen sulfide emission rather than the theoretical maximum corrosion rate. The description of the corrosion process is at present under improvement based on extensive experimental studies. The capability of the model to simulate changes of total sulfide concentrations (ΔSS(-II) + ΔXS(-II)) during transport of the wastewater in both the force main and the gravity sewer section was used as a measure of the performance of the model (Figure 10). This is more stringent than plotting measured versus simulated concentrations from an arbitrary position along the intercepting sewer, particularly if the change is small compared with the actual value.
3666
WEFTEC®.06
Copyright 2006 Water Environment Foundation. All Rights Reserved©
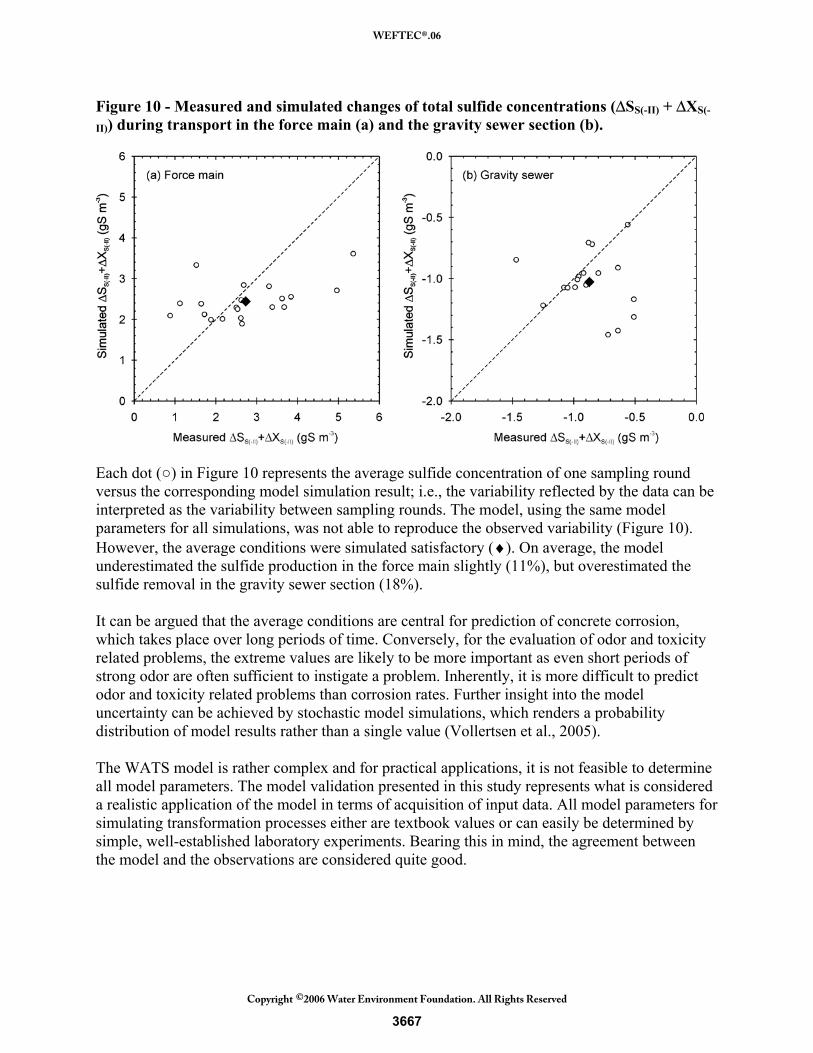
Figure 10 - Measured and simulated changes of total sulfide concentrations (ΔSS(-II) + ΔXS(-
II)) during transport in the force main (a) and the gravity sewer section (b).
Each dot (○) in Figure 10 represents the average sulfide concentration of one sampling round versus the corresponding model simulation result; i.e., the variability reflected by the data can be interpreted as the variability between sampling rounds. The model, using the same model parameters for all simulations, was not able to reproduce the observed variability (Figure 10). However, the average conditions were simulated satisfactory (♦). On average, the model underestimated the sulfide production in the force main slightly (11%), but overestimated the sulfide removal in the gravity sewer section (18%). It can be argued that the average conditions are central for prediction of concrete corrosion, which takes place over long periods of time. Conversely, for the evaluation of odor and toxicity related problems, the extreme values are likely to be more important as even short periods of strong odor are often sufficient to instigate a problem. Inherently, it is more difficult to predict odor and toxicity related problems than corrosion rates. Further insight into the model uncertainty can be achieved by stochastic model simulations, which renders a probability distribution of model results rather than a single value (Vollertsen et al., 2005). The WATS model is rather complex and for practical applications, it is not feasible to determine all model parameters. The model validation presented in this study represents what is considered a realistic application of the model in terms of acquisition of input data. All model parameters for simulating transformation processes either are textbook values or can easily be determined by simple, well-established laboratory experiments. Bearing this in mind, the agreement between the model and the observations are considered quite good.
3667
WEFTEC®.06
Copyright 2006 Water Environment Foundation. All Rights Reserved©
Concrete corrosion The intercepting sewer has been in operation for less than 30 years and significant corrosion has been recognized. The corrosion is particularly pronounced in the sewer line close to manhole G1 where the wall thickness has been reduced by several mm and the aggregates of the concrete are clearly visible (Figure 2). The WATS model was therefore used to assess the rate of concrete corrosion in the gravity sewer section. For this purpose, model simulations for each month of the year were performed and the annual mean corrosion rate was calculated. Long term monitoring of the system has revealed that the sulfide buildup in the system is negligible during winter, resulting in corresponding low corrosion rates. It was therefore assumed that concrete corrosion only takes place in the period from April to October. The model predicted corrosion rates of 1.2 mm per year in manhole G1 and approximately 0.5 mm per year in manhole G3. Thus, the predicted corrosion in manhole G1 is consistent with the observed deterioration of the concrete gravity pipes. At such high corrosion rates, the 300 mm concrete pipes (53 mm wall thickness) will hardly last 50 years. It is - however - problematic to compare the simulation results with the observed corrosion as the catchment has undergone significant changes since the sewer was initially put in operation. For instance, the variable speed drive of the force main pumps has only been in operation a few years. This has expectedly reduced the hydrogen sulfide emission in the discharge manhole (G1) as starts and stops of the pump have become less frequent. Ongoing research at Aalborg University has reveled that the surface pH of the concrete pipe is highly acidic and that corrosion continues to take place. CONCLUSIONS The field study produced several important findings. A few key findings are summarized below: • Despite sulfide concentrations in the wastewater of up to 6 gS m-3, hydrogen sulfide
concentrations in the sewer atmosphere never exceeded 11 ppm and were mostly below the gas sensors’ detection level of 1 ppm. This is significantly lower than the hydrogen sulfide concentration in equilibrium with the sulfide concentration in the wastewater, demonstrating that removal of hydrogen sulfide by adsorption onto the sewer walls exposed to the sewer atmosphere and subsequent oxidation to sulfuric acid was fast.
• During transport in the gravity sewer, a significant reduction of sulfide in the wastewater was observed. The sulfide concentration 400 m downstream of the force main was on average 70% of the concentration at the outlet of the force main.
• Short-term variations of the sulfide concentrations were considerable. The temporal dynamics of the measured sulfide concentrations could not be explained by variations of the anaerobic residence time and were most likely related to short-term variations of the wastewater biodegradability. This observation demonstrates the importance of the wastewater quality for the buildup of sulfide in sewer networks.
3668
WEFTEC®.06
Copyright 2006 Water Environment Foundation. All Rights Reserved©
The field study verified the ability of the WATS model for predicting sulfide concentrations in both force mains and gravity sewers. The WATS model allows the user to interpret field observations; e.g., quantification of how much sulfide is emitted from the wastewater to the sewer atmosphere and prediction of the lifetime of sewer structures. REFERENCES Almeida, M.C.; Butler, D.; Matos, J.S. (2000) In-sewer biodegradation study at the Costa do
Estoril interceptor system. Urban Water, 2(4), 327. American Public Health Association (APHA); American Water Works Association (AWWA);
Water Environment Federation (WEF) (2005) Standard Methods for the Examination of Water and Wastewater, 21st ed.; Washington, D.C.
Gudjonsson, G.; Vollertsen, J.; Hvitved-Jacobsen, T. (2002) Dissolved oxygen in gravity sewers – measurement and simulation. Water Sci. Technol., 45(3), 35.
Henze, M.; Gujer, W.; Mino, T.; Loosdrecht, M. van (eds.) (2000) The Activated Sludge Models (ASM1,ASM2, ASM2d and ASM3); IWA Scientific and Technical Report; IWA publishing; London, U.K.
Hvitved-Jacobsen, T. (2002) Sewer Processes – microbial and chemical process engineering of sewer networks, 1st ed.; CRC Press; Boca Raton, Florida.
Melbourne and Metropolitan Board of Works (1989) Hydrogen sulfide control manual – Septicity, corrosion and odour control in sewerage systems, vols. 1 and 2; Technological Standing Committee on Hydrogen Sulphide Corrosion in Sewerage Works; Melbourne, Australia.
Mori, T.; Koga, M.; Hikosaka, Y.; Nonaka, T.; Mishina, F.; Sakai, Y.; Koizumi, J. (1991) Microbial corrosion of concrete pipes, H2S production from sediments and determination of corrosion rate. Water Sci Technol., 23(7-9), 1275.
Morton R.L.; Yanko W.A.; Graham D.W.; Arnold R.G. (1991) Relationships Between Metal Concentrations and Crown Corrosion in Los-Angeles-County Sewers. Res. J. Water Pollut. Control Fed., 63, 789.
Nielsen, A.H.; Vollertsen, J.; Hvitved-Jacobsen, T. (2006) Kinetics and stoichiometry of sulfide oxidation in sewer wastewater – effects of pH and temperature. Water Environ. Res., 78, 275.
Nielsen, A.H.; Yongsiri, C.; Hvitved-Jacobsen, T.; Vollertsen, J. (2005) Simulation of sulfide buildup in wastewater and atmosphere of sewer networks. Water Sci. Technol., 52(3), 201.
Nielsen, P.H.; Hvitved-Jacobsen, T. (1988) Effect of sulfate and organic matter on the hydrogen sulfide formation in biofilms of filled sanitary sewers. J. Water Pollut. Control Fed., 60, 627.
Nielsen, P.H.; Raunkjær, K.; Hvitved-Jacobsen, T. (1998) Sulfide production and wastewater quality in pressure mains. Water Sci. Technol., 37(1), 97.
Pomeroy, R. D.; Parkhurst, J. D. (1977) The forecasting of sulfide build-up rates in sewers. Prog. Water Technol., 9, 621.
Tanaka, N.; Hvitved-Jacobsen, T. (2001) Sulfide production and wastewater quality – investigations in a pilot plant pressure sewer. Water Sci. Technol., 43(5), 129.
U.S. Environmental Protection Agency (1974) Process Design Manual for Sulfide Control in Sanitary Sewerage Systems; EPA-625/1-74-005; Washington, D.C.
3669
WEFTEC®.06
Copyright 2006 Water Environment Foundation. All Rights Reserved©
Vollertsen J.; Hvitved-Jacobsen, T. (2002) Biodegradability of wastewater – a method for COD-fractionation. Water Sci. Technol., 45(3), 25.
Vollertsen J.; Hvitved-Jacobsen, T.; Nielsen, A.H. (2005) Stochastic modeling of Chemical Oxygen Demand transformation in gravity sewers. Water Environ. Res., 77, 331.
Wilmot, P.D.; Cadee, K.; Katinic, J.J.; Kavanagh, B.V. (1988) Kinetics of sulfide oxidation by dissolved oxygen. J. Water Pollut. Control Fed., 60, 1264-1270.
Yongsiri, C.; Vollertsen, J.; Rasmussen, M.; Hvitved-Jacobsen, T. (2004) Air-water transfer of hydrogen sulfide: an approach for application in sewer networks. Water Environ. Res., 76, 81.
3670
WEFTEC®.06
Copyright 2006 Water Environment Foundation. All Rights Reserved©
Top Related