


Languages
Pages
Legal


Advancing Traveler Information Technologies for Managed Lane Networks
Nick Wood, P.E.Texas A&M Transportation Institute
Monday, July 17, 2017IBTTA/TRB Joint Symposium on Managed Lanes & AET
Dallas, Texas

PROBLEMML networks are complex, interconnected facilities that require traveler information
• Pricing Rules, Vehicle Occupancy, Hours of Operation, Access
Past projects developed for single corridors now turning into expansive regional networks
Roadway signage to convey info will become ineffective as complexity increases
2

3

RESEARCH PLAN
Consisted of these parts:
• National State-of-the-Practice Review
• Human Factors Assessment (Travel Surveys)
• Technology Assessment
4

REVIEW: DISTANCE PRICING STRUCTURECurrent practice is evolving, syntax is not standardizedSingle entry price
• Travelers pay only one price for any location, any dist.
Uniform per-mile• Same $ per mile along corridor
Destination-based• Travelers pay different $ per mile, depending on entry/exit
5

REVIEW: DISTANCE PRICING STRUCTURE
Zone-based
• Variation of destination-based pricing
• Grouping of specific origin-destination pairs
6I-880 Express Lanes in Alameda County, CA

REVIEW: NUMBER OF DESTINATION POINTS
7
Varies nationally from 1-3 prices on overhead signs
• Private concessionaires tend to want fewer prices
• More prices can lead to driver confusion (sole vs additive price)

REVIEW: ONLINE TOLL INFORMATION
8
Availability of real-time toll rate information varies nationally
• Some fear complaints about changing rates
• Other operators allow third-parties to access data feeds (GitHub, existing 511)
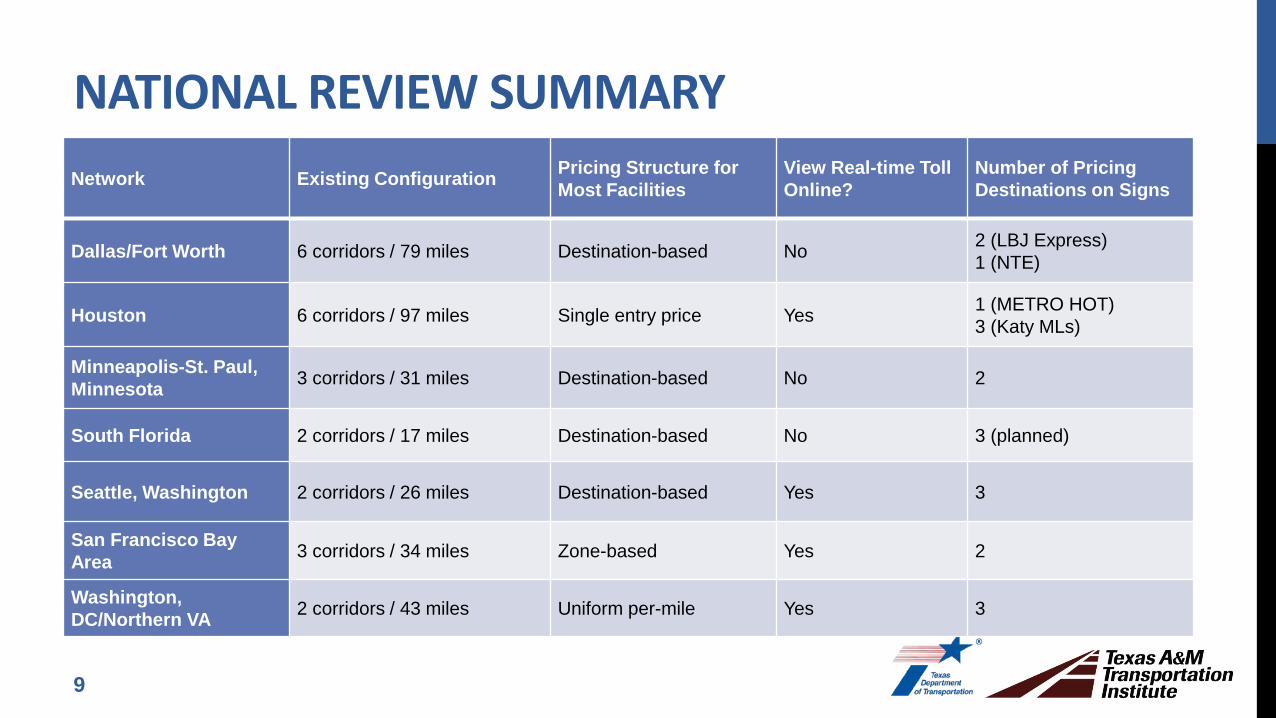
NATIONAL REVIEW SUMMARY
9
Network Existing Configuration Pricing Structure for Most Facilities
View Real-time Toll Online?
Number of Pricing Destinations on Signs
Dallas/Fort Worth 6 corridors / 79 miles Destination-based No 2 (LBJ Express)1 (NTE)
Houston 6 corridors / 97 miles Single entry price Yes 1 (METRO HOT)3 (Katy MLs)
Minneapolis-St. Paul, Minnesota 3 corridors / 31 miles Destination-based No 2
South Florida 2 corridors / 17 miles Destination-based No 3 (planned)
Seattle, Washington 2 corridors / 26 miles Destination-based Yes 3
San Francisco Bay Area 3 corridors / 34 miles Zone-based Yes 2
Washington, DC/Northern VA 2 corridors / 43 miles Uniform per-mile Yes 3

HUMAN FACTORS ASSESSMENT: SURVEYSOnline web-based survey instrument
Open from February – March 2017
Collected over 800 responses
Focused on ML travelers in D/FW, Houston, Austin
10

What pre-trip tools do you use often or very often?
11
79%
65%
35%
17%13% 13%
5% 2%0%
10%
20%
30%
40%
50%
60%
70%
80%
90%
100%
SmartPhone AppMapping WebsiteRoad Agency WebsiteIn-Vehicle Navigation SystemGPS Navigation SystemTV or Radio ReportsPaper MapsDirections from a Friend
Respondents can select more than one option.

What trip elements are critical?Deemed Critical by 80% or more of respondents
• Expected Delays• Re-routing Advice• Alternate Routes
Deemed Critical by less than 80%• Trip Distance (63%)• Toll Cost (43%)• Toll Payment Options (41%)• Bus or Train Options (23%)
12

What is the single most important factor in your decision to use managed lanes?
13
35%
23%15%
9% 7% 5% 3% 2%0%
10%
20%
30%
40%
50%
60%
70%
80%
90%
100%Traffic conditions that I observe inthe regular lanesTraffic reports on a smartphone mapor in-vehicle GPSWhether I have enough passengersto qualify for HOV statusWhether the lane has an exitconvenient to my destinationPrice shown on sign
I think it is safer than the regularlanesTraffic conditions that I observe inthe managed lanes
Respondents can only select one option.

Which information should be on a sign or provided on an in-vehicle device?
14
0% 10% 20% 30% 40% 50% 60% 70% 80% 90% 100%
Entrance location to the managed laneNumber of occupants required
Restrictions about vehicle type (like “no towed trailers”) Speed limit
Toll tag requirementsCurrent toll price
List of points where you can exit the managed laneList of intersecting roads the managed lane connects to
Travel time estimates to certain destinationsTraffic condition status
Alerts about crashes, construction, or other incidents
Road sign In vehicle device

TECH CONSIDERATIONSSome private parties would love to have data, but encounter challenges
• Don’t know where managed lanes exist – can find barrier-separated facilities, but not those with a changeable, pylon, or striped buffer
• Need to know which elements are relatively static vs. dynamic
• Lack of consistency across facilities
• MLs are not a core need for some map providers
Agencies need to provide timely, accurate, and structured information
15

MOVING FORWARD: ONE PATHWAYProvide information through an open-source data format for use by third-party entities
A sample data set might include:• Corridors (lat/long, left/right of the GPLs)• Access (ingress, egress points)• Tolls (O-D table, based on destination points)• Payment (transponder, pay-by-mail)• Vehicle Type (tolled, discounted, not permitted)• Hours of Operations (closed, reversible)
16

Realize the importance of incremental progress
Don’t wait for perfection
Understand the need for continuous improvement
17

MORE INFORMATIONResearch report expected to be complete next month
Forthcoming paper for the 2018 TRB Annual Meeting
Contact Info:
Nick Wood, P.E.
Texas A&M Transportation Institute
Phone: 512-407-1115
E-mail: [email protected]
18
Top Related