


Languages
Pages
Legal


1
Advances in modeling attrition The added value of paradata and machine
learning algorithms
Peter Lugtig (Utrecht University [email protected])
Annelies Blom (University of Mannheim [email protected]
Big Surv conference – 25-27 October, 2018

2
Attrition in German Internet Panel
Wave 1: 2014, n= 4174 2012, n= 1483

3
Goal of paper – predict attrition
◆ Existing attrition analyses low predictive power – socio-demographic variables
◆ 1. Does paradata add something? – Survey process variables: Behavior in survey, and
underlying attitudes – Do machine learning models add something?
◆ 2. Do models cross-validate? – Do we find the same patterns across waves? – Do we find the same patterns across datasets?
◆ 3. Can we target likely attriters?

4
About the German Internet Panel
◆ Probability-based online panel – Germans between 16 and 75 – Receive a PC and Internet if necessary – Waves bi-monthly – See http://reforms.uni-mannheim.de/internet_panel/home/
◆ 2012 and 2014 recruitments – Fieldwork identical across recruitments

5
Training model in 2012: traditional vars Variables Scale/coding Constant, or
time-varying Gender Male=0/female=1 ConstantAge In years ConstantAge2 In years ConstantEducation ConstantHousehold Income In euros ConstantEmployed No=0, Yes=1 ConstantEast/West Germany West=0/East=1 ConstantSingle No=0, Yes=1 ConstantLiving with children No=0, Yes=1 ConstantSingle * age Interaction term ConstantBig 5: openness Factor score ConstantBig 5: conscientiousness (factor) Factor score ConstantBig 5: Extraversion (factor) Factor score ConstantBig 5: Agreeableness (factor) Factor score ConstantBig 5: neuroticism (factor) Factor score ConstantOther HH members part of panel No=0, Yes=1 Internet experience Constant

6
…+ paradata Variables Scale/coding Constant, or time-varying
Survey evaluation: interesting 1-5 Time-varyingSurvey evaluation: relevant 1-5 Time-varyingSurvey evaluation: different topics 1-5 Time-varyingSurvey evaluation: too long 1-5 Time-varyingSurvey evaluation: too difficult 1-5 Time-varyingSurvey evaluation: too personal 1-5 Time-varyingSurvey evaluation: general 1-5 Time-varyingWhether reminder was sent 1-3 Time-varyingLeft negative comment at end of questionnaire
No=0, Yes=1 Time-varying
Received a PC from panel No=0, Yes=1 Time-varyingTime since last personal contact (via phone)
1-24 months Time-varying
Time between invitation and survey completion
0-29 days Time-varying
How incentives are spent 1=cash, 2=amazon voucher, 3=donation to charity
Time-varying (waves5,8and11)
Age of browser version 1-100 months ConstantDevice used 1=PC/laptop, 2=tablet
3=smartphone Time-varying
Duration of questionnaire 1-2788 minutes Time-varyingMedian duration of questionnaire 1-74 minutes ConstantInterruption No=0, Yes=1 Time-varyingBreakoff No=0, Yes=1 Time-varying

9
1a. Does paradata help to explain attrition?

10
Training data: 2012 recruitment wave-on-wave models (Wald-stats)
W2 W3 W4 W5 W6 W7 W8 W9 W10 W11 W12Stable predictorIntercept 7.74 3.97 3.31 2.73 2.94 3.89 1.46 4.71 0.66 2.16 1.10children -2.27 -2.05 -2.13Education 2.31 2.19 2.10openness -2.11neuroticism -2.13Internet experience
2.62 2.48 2.00 2.83 2.49 3.32
Benpc 2.58 2.21 -3.11agebrowser 2.70Paradata # days needed to complete survey
-20.57 -2.12 -3.28 -3.03 -2.07 -3.25 -2.23
Needed reminder -3.01 -3.05 -3.74Left negative comments
3.08 2.67 3.23 3.62
Did not complete prev wave
-5.51 -4.46 -5.92 -6.11 -6.87 -6.59 -6.00 -9.59 -9.35 -3.82 -12.54
too long -2.22 -2.06 -2.80too personal -2.08 -3.35general 2.20 2.10 2.78 ICC 0.43 0.40 0.40 0.40 0.40 0.46 0.48 0.43 0.44 0.49 0.45R-square 0.61 0.51 0.49 0.53 0.52 0.65 0.61 0.63 0.61 0.62 0.64
12
How does paradata drive attrition?
Examples from wave 3

13
People who complete the prev wave at lower risk (2012)

14
Reminders have big effect on attrition in next wave (2012)

15
Higher attrition for respondents who wait longer the previous wave to start (2012)

16
5% difference in attrition rates between slowest and fastest respondents

17
The strongest predictors in 2012 are paradata
◆ Days needed to complete survey after invitation in previous wave
◆ Needed a reminder in previous wave ◆ Break-off in previous wave ◆ Duration of response (in min.) of previous wave ◆ Median duration over course of 12 waves ◆ Paradata can predict attrition ◆ And predictors are largely consistent across waves

18
1b. Do machine-learning models add something?

19
Can we get more from Machine Learning? Here: a CART for wave 3 - 2012
Translation - No reminder, previous wave not completed -> 25% chance attrition - No reminder, previous wave completed, <3 days -> 2% atrition - No reminder, previous wave completed, > 3 days -> 10% attrition - Reminder, previous wave not completed -> 52% attrition - Reminder, previous wave completed, fast response, -> 30% attrition
<20 days - - Reminder, previous wave completed, fast response,-> 45% attrition
>20 days
[1] root | [2] reminder_w2 <= 0 | | [3] prev_w2 <= 0: 1 (n = 47, err = 25.5%) | | [4] prev_w2 > 0 | | | [5] daypass_w2 <= 3: 1 (n = 566, err = 2.5%) | | | [6] daypass_w2 > 3: 1 (n = 258, err = 9.7%) | [7] reminder_w2 > 0 | | [8] prev_w2 <= 0: 0 (n = 67, err = 47.8%) | | [9] prev_w2 > 0 | | | [10] medianduration <= 3 | | | | [11] daypass_w2 <= 20: 1 (n = 209, err = 29.2%) | | | | [12] daypass_w2 > 20: 1 (n = 121, err = 44.6%) | | | [13] medianduration > 3 | | | | [14] duration2 <= 1: 0 (n = 17, err = 41.2%) | | | | [15] duration2 > 1: 1 (n = 198, err = 17.2%)

20
Can we get more from Machine Learning? Here: a CART for wave 3 - 2012
Translation - No reminder, previous wave not completed -> 25% chance attrition - No reminder, previous wave completed, <3 days -> 2% atrition - No reminder, previous wave completed, > 3 days -> 10% attrition - Reminder, previous wave not completed -> 52% attrition - Reminder, previous wave completed, <20 days -> 30% attrition
generally fast respondents - Reminder, previous wave completed, 20 days -> 45% attrition
generally fast respondents, - Reminder, previous wave completed, -> 59% attrition
generally slow respondents, now fast - Reminder, previous wave completed, -> 17% attrition
generally slow respondents, now not fast
There appear to be some complex interactions

21
2. Do models cross-validate?

22
Do models cross-validate?
◆ Across waves - yes ◆ Across datasets – use 2012 and 2014 data
1. Use model from training data (2012) » Logistic regression » Random Forest
2. hold all predictions constant (regression coef, splits) 3. Predict 2014 outcome with 2014 covariates and 2012 coefficients 4. Validate against true outcomes in 2014

23
The model does cross-validate
◆ Predicive accuracy is around 80% Prediction model 2012 - Train data 2014 - test data
Wave 3 Logistic Regression 84 84
Wave 6 Logistic Regression 78 80
Wave 9 Logistic Regression
81 77
Wave 3 Random Forest 81 86
Wave 6 Random Forest 80 79
Wave 9 Random Forest 84 78

Where are we?
1. Paradata drives attrition • Large effects of single paradata variables
2. Do models cross-validate? • Yes, across waves • Yes, across datasets
3. Can we target likely attriters?

3. Can we identify likely attriters?

Attrition is hard to predict Propensity scores for wave 3

Whom to target? Propensity scores for wave 3

Whom to target? Propensity scores for wave 3

Choosing whom to target… ROC curve – wave 3 attrition for log regression

Classification problem in practice – wave 3
0.7cutoffLogisticmodel
Trueattrition
Truestay
Modelpredictsattrition
4% 9%
Modelpredictsstay
9% 78%
0.5cutoffLogisticmodel
Trueattrition
Truestay
Modelpredictsattrition
1% 1%
Modelpredictsstay
11% 86%
0.7cutoffRandomForest
Trueattrition
Truestay
Modelpredictsattrition
2% 3%
Modelpredictsstay
11% 84%
0.5cutoffRandomForest
Trueattrition
Truestay
Modelpredictsattrition
1% 1%
Modelpredictsstay
12% 86%
31
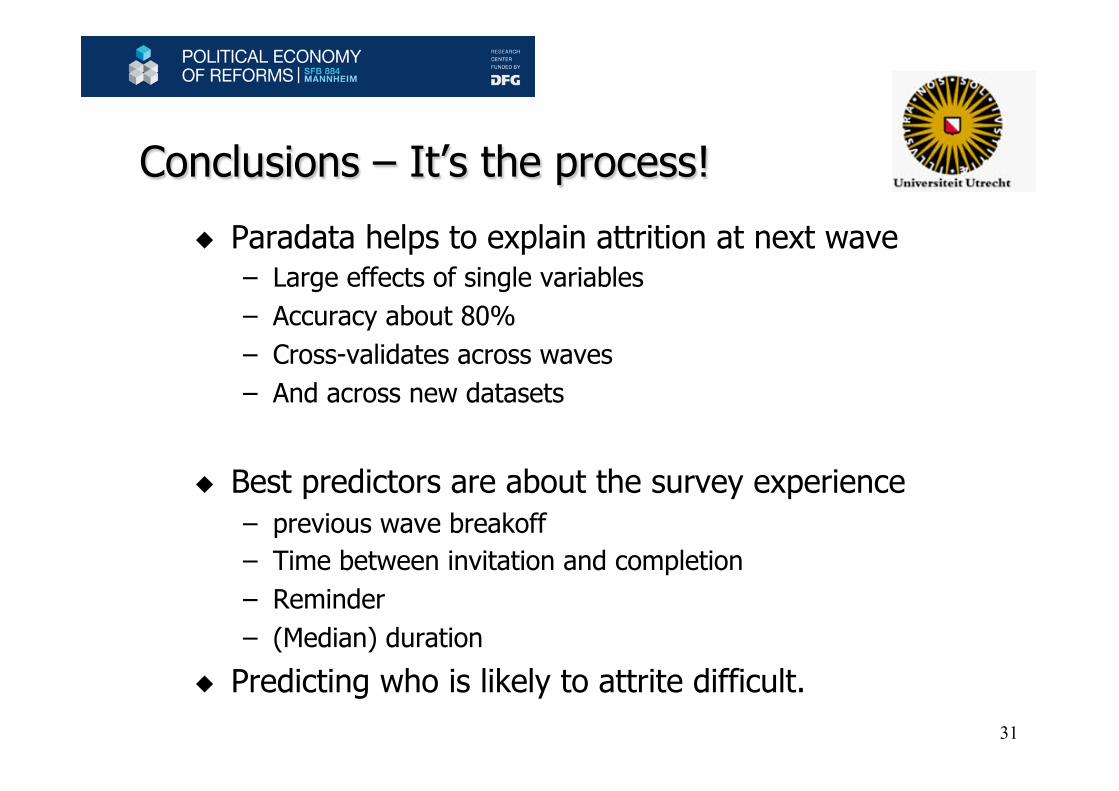
Conclusions – It’s the process!
◆ Paradata helps to explain attrition at next wave – Large effects of single variables – Accuracy about 80% – Cross-validates across waves – And across new datasets
◆ Best predictors are about the survey experience – previous wave breakoff – Time between invitation and completion – Reminder – (Median) duration
◆ Predicting who is likely to attrite difficult.

32
Next steps
◆ Do an intervention on paradata – Easy to identify those who will not attrite – Harder to identify those who attrite
◆ Target one variable or combinations? – previous wave breakoff – Time between invitation and completion – Needed reminder – (Median) duration – Combinations (using Machine Learning models)
» Reminders + long durations » Reminders + not completed prev. wave

33
Thank you!
◆ Peter Lugtig – [email protected] – www.peterlugtig.com
◆ Annelies Blom – [email protected]
Top Related