


Languages
Pages
Legal


Global Development Horizons 2011
Multipolarity: The New Global Economy
ADVANCE EDITION


Global Development Horizons 2011
Multipolarity: The New Global Economy
ADVANCE EDITION

© 2011 The International Bank for Reconstruction and Development / The World Bank
1818 H Street NWWashington DC 20433Telephone: 202-473-1000Internet: www.worldbank.org
All rights reserved
1 2 3 4 14 13 12 11
This volume is a product of the staff of the International Bank for Reconstruction and Development / The World Bank. The fi ndings, interpretations, and conclusions expressed in this volume do not necessarily refl ect the views of the Executive Directors of The World Bank or the governments they represent.
The World Bank does not guarantee the accuracy of the data included in this work. The boundaries, colors, denominations, and other information shown on any map in this work do not imply any judgement on the part of The World Bank concerning the legal status of any territory or the endorsement or acceptance of such boundaries.
Rights and Permissions
The material in this publication is copyrighted. Copying and/or transmitting portions or all of this work without permission may be a violation of applicable law. The International Bank for Reconstruction and Development / The World Bank encourages dissemination of its work and will normally grant permission to reproduce portions of the work promptly.
For permission to photocopy or reprint any part of this work, please send a request with complete informa-tion to the Copyright Clearance Center Inc., 222 Rosewood Drive, Danvers, MA 01923, USA; telephone: 978-750-8400; fax: 978-750-4470; Internet: www.copyright.com.
All other queries on rights and licenses, including subsidiary rights, should be addressed to the Offi ce of the Publisher, The World Bank, 1818 H Street NW, Washington, DC 20433, USA; fax: 202-522-2422; e-mail: [email protected].
This is an advance edition. Changes may be made to the content following the release of this edition. Such changes will be refl ected in the fi nal edition of the book.
Cover image: Untitled, by Marc Pekala, 2010Cover design: Financial Communications, Inc., Bethesda, Maryland, United States
G L O B A L D E V E L O P M E N T H O R I Z O N S 2 0 1 1 v
Contents
Foreword . . . . . . . . . . . . . . . . . . . . . . . . . . . . . . . . . . . . . . . . . . . . . . . . . . . . . . . . . . . . . . . . . . . . . . . . . . . . . . . . . . . . . . . . . . .xi
OVERVIEW . . . . . . . . . . . . . . . . . . . . . . . . . . . . . . . . . . . . . . . . . . . . . . . . . . . . . . . . . . . . . . . . . . . . . 1
Emerging Growth Poles Will Alter the Balance of Global Growth . . . . . . . . . . . . . . . . . . . . . . . . . . . 2
Emerging-Market Multinationals Becoming a Potent Force in Reshaping the Process of Industrial Globalization . . . . . . . . . . . . . . . . . . . . . . . . . . . . . . . . . . . . . . . . . . . . . . . . . . . . . . . . . . 4
Multipolar International Economy to Lead to a Larger Role for the Euro and, in the Long Term, for the Renminbi . . . . . . . . . . . . . . . . . . . . . . . . . . . . . . . . . . . . . . . . . . . . . . . . . . 6
Multipolarity to Bring Benefi ts and New Challenges to the Developing World . . . . . . . . . . . . . . . . . 9
CHAPTER 1: Changing Growth Poles and Financial Positions . . . . . . . . . . . . . . . . . . . . . . . . . 13
Growth Poles and the Global Macroeconomy in the Postcrisis Era . . . . . . . . . . . . . . . . . . . . . . . . . 14
The Character of Growth in the Potential Emerging Economy Poles . . . . . . . . . . . . . . . . . . . . . . . . 24
Dynamics of New Growth Poles: Implications for Domestic Output, Trade Flow Patterns, and Global Payments Imbalances . . . . . . . . . . . . . . . . . . . . . . . . . . . . . . . . . . . . . . . . . . . . . . . . 36
Growth Poles and Multipolarity in the Future World Economy . . . . . . . . . . . . . . . . . . . . . . . . . . . . 45
Policy Challenges and the Development Agenda . . . . . . . . . . . . . . . . . . . . . . . . . . . . . . . . . . . . . . . 47
Annexes . . . . . . . . . . . . . . . . . . . . . . . . . . . . . . . . . . . . . . . . . . . . . . . . . . . . . . . . . . . . . . . . . . . . . . . 51
Notes . . . . . . . . . . . . . . . . . . . . . . . . . . . . . . . . . . . . . . . . . . . . . . . . . . . . . . . . . . . . . . . . . . . . . . . . . 62
References . . . . . . . . . . . . . . . . . . . . . . . . . . . . . . . . . . . . . . . . . . . . . . . . . . . . . . . . . . . . . . . . . . . . 65
CHAPTER 2: The Changing Global Corporate Landscape . . . . . . . . . . . . . . . . . . . . . . . . . . . . . 73
Emerging-Market Multinationals: Agents of Change in a Multipolar World . . . . . . . . . . . . . . . . . . . 75
The Growth and Globalization of Emerging-Market Corporate Finance . . . . . . . . . . . . . . . . . . . . . . 89
Devising an Effective Framework for Cross-Border Investment . . . . . . . . . . . . . . . . . . . . . . . . . . 104
Annexes . . . . . . . . . . . . . . . . . . . . . . . . . . . . . . . . . . . . . . . . . . . . . . . . . . . . . . . . . . . . . . . . . . . . . . 108
vi Contents Global Development Horizons 2011
Notes . . . . . . . . . . . . . . . . . . . . . . . . . . . . . . . . . . . . . . . . . . . . . . . . . . . . . . . . . . . . . . . . . . . . . . . . .118
References . . . . . . . . . . . . . . . . . . . . . . . . . . . . . . . . . . . . . . . . . . . . . . . . . . . . . . . . . . . . . . . . . . . 120
CHAPTER 3: Multipolarity in International Finance . . . . . . . . . . . . . . . . . . . . . . . . . . . . . . . . . 125
International Currency Use . . . . . . . . . . . . . . . . . . . . . . . . . . . . . . . . . . . . . . . . . . . . . . . . . . . . . . . 127
Moving to a Multicurrency International Monetary System . . . . . . . . . . . . . . . . . . . . . . . . . . . . . . 133
The Shape of Things to Come: Some Scenarios for a Future International Monetary System . . . 142
A Path toward Improved Institutional Management of a Multipolar World . . . . . . . . . . . . . . . . . . 147
Conclusion . . . . . . . . . . . . . . . . . . . . . . . . . . . . . . . . . . . . . . . . . . . . . . . . . . . . . . . . . . . . . . . . . . . . 151
Annexes . . . . . . . . . . . . . . . . . . . . . . . . . . . . . . . . . . . . . . . . . . . . . . . . . . . . . . . . . . . . . . . . . . . . . . 153
Notes . . . . . . . . . . . . . . . . . . . . . . . . . . . . . . . . . . . . . . . . . . . . . . . . . . . . . . . . . . . . . . . . . . . . . . . . 155
References . . . . . . . . . . . . . . . . . . . . . . . . . . . . . . . . . . . . . . . . . . . . . . . . . . . . . . . . . . . . . . . . . . . 157
Boxes1.1 What is a growth pole? Defi ning poles in theory and practice . . . . . . . . . . . . . . . . . . . . . . 16
1.2 Growth poles at the regional level . . . . . . . . . . . . . . . . . . . . . . . . . . . . . . . . . . . . . . . . . . . 21
1.3 Proximate and fundamental factors related to multidimensional growth polarity . . . . . . . 22
1.4 Suggestive evidence of successful transitions to consumption-driven growth . . . . . . . . . 35
1.5 Modeling the current account and growth process . . . . . . . . . . . . . . . . . . . . . . . . . . . . . . 38
1.6 Multipolarity and commodities . . . . . . . . . . . . . . . . . . . . . . . . . . . . . . . . . . . . . . . . . . . . . . 50
2.1 Empirical analysis of cross-border bilateral M&A fl ows from emerging economies . . . . . 87
2.2 The global expansion of cross-border fi nancial transactions . . . . . . . . . . . . . . . . . . . . . . . 90
2.3 Data on international bond issues by fi rms . . . . . . . . . . . . . . . . . . . . . . . . . . . . . . . . . . . . 100
2.4 Econometric estimations of corporate bond spreads . . . . . . . . . . . . . . . . . . . . . . . . . . . . 102
2.5 The long history of failed negotiations over a multilateral investment framework . . . . . . 105
3.1 Historically, one national currency has played a global role—or at most, a few national currencies . . . . . . . . . . . . . . . . . . . . . . . . . . . . . . . . . . . . . . . . . . . . . . . . . 129
3.2 Benefi ts from currency internationalization . . . . . . . . . . . . . . . . . . . . . . . . . . . . . . . . . . . 135
3.3 The changing external fi nancial position of developing countries . . . . . . . . . . . . . . . . . . 143
Figures1.1 Channels of growth spillovers from a growth pole . . . . . . . . . . . . . . . . . . . . . . . . . . . . . . . 17
1.2 Historical evolution of simple growth polarity, selected economies, 1–2008 . . . . . . . . . . 18
1.3 Modern evolution of multidimensional growth polarity, selected advanced and emerging economies, 1969–2008 . . . . . . . . . . . . . . . . . . . . . . . . . . . . . . . . . . . . . . . . . . . 19
1.4 Evolution of multipolarity, alternative indexes, 1968–2008 . . . . . . . . . . . . . . . . . . . . . . . . 23
1.5 Global distribution of growth poles, 1994–98 and 2004–08 . . . . . . . . . . . . . . . . . . . . . . . 24
1.6 Total factor productivity contribution to growth, selected potential poles . . . . . . . . . . . . . 26
1.7 Technological innovation, selected potential emerging economy poles . . . . . . . . . . . . . . 27
1.8 Technological adoption, selected potential emerging economy poles, 1971–2003 . . . . . . 28
1.9 Export and consumption contribution to growth, selected potential poles . . . . . . . . . . . . 29

Global Development Horizons 2011 Contents vii
1.10 Dominance of consumption to exports in growth, selected potential emerging economy poles, 1977–2006 . . . . . . . . . . . . . . . . . . . . . . . . . . . . . . . . . . . . . . . . . . . . . . . . 30
1.11 Evolution of saving, selected potential growth poles, by sector . . . . . . . . . . . . . . . . . . . . 31
1.12 Incremental capital-output ratios, selected potential emerging economy poles, 1965–2008 . . . . . . . . . . . . . . . . . . . . . . . . . . . . . . . . . . . . . . . . . . . . . . . . 32
1.13 Investment shares of growth, selected potential emerging economy poles, 1972–2006 . . . . . . . . . . . . . . . . . . . . . . . . . . . . . . . . . . . . . . . . . . . . . . . . . . . . . . . . 33
1.14 Global distribution of research and development expenditure and researcher shares, average over 2004–08 . . . . . . . . . . . . . . . . . . . . . . . . . . . . . . . . . . . . . . . . . . . . . . 33
1.15 Global distribution and selected evolution of consumption share by per capita income . . 34
B1.4.1 Evolution of consumption and export shares, Botswana and Mauritius . . . . . . . . . . . . . . 35
1.16 Global real output shares, 2010 and 2025, baseline scenario . . . . . . . . . . . . . . . . . . . . . . 39
1.17 Output growth for emerging and advanced economies, 15-year average, 1996–2010 (historical) and 2011–25 (baseline scenario) . . . . . . . . . . . . . . . . . . . . . . . . . . 40
1.18 Consumption and investment shares of output, current and potential growth poles, 2011–25 baseline . . . . . . . . . . . . . . . . . . . . . . . . . . . . . . . . . . . . . 41
1.19 Global import and export shares of global trade, advanced and emerging economies, 2004–25 baseline . . . . . . . . . . . . . . . . . . . . . . . . . . . . . . . . . . . . . . 42
1.20 Net international investment positions, advanced and emerging economies, and selected net asset countries, 2004–25 baseline . . . . . . . . . . . . . . . . . . . . . . . . . . . . . 43
1.21 Evolution of multipolarity, economic size and simple polarity index, 1968–2025 (projected) . . . . . . . . . . . . . . . . . . . . . . . . . . . . . . . . . . . . . . . . . . . . . . . . . . . . 47
1.22 Shares of total LDC bilateral trade, selected advanced and emerging economies, 1991–2010 . . . . . . . . . . . . . . . . . . . . . . . . . . . . . . . . . . . . . . . . . . . 48
1.23 Dominant LDC merchandise exports to and imports from selected emerging economies . . . . . . . . . . . . . . . . . . . . . . . . . . . . . . . . . . . . . . . . . . . . . . 49
1.24 Net ODA from DAC countries to LDCs as share of LDC GDP, 1960–2008 . . . . . . . . . . . . 49
B1.6.1 Commodities price index, 1948–2010, and commodity intensity of demand, 1971–2010 . . . . . . . . . . . . . . . . . . . . . . . . . . . . . . . . . . . . . . . . . . . . . . . . . . . . . . 50
1A.1 Nominal GDP overtaking scenarios, selected emerging and advanced economy poles, 2009–25 . . . . . . . . . . . . . . . . . . . . . . . . . . . . . . . . . . . . . . . . . . . . . . . . . . 59
1A.2 Real output growth in divergent productivity scenario, advanced economies and high- versus low-productivity emerging economies, 2005–25 . . . . . . . . . . . . . . . . . . . . . 60
1A.3 Marginal productivity of capital and imports under various unbalanced growth scenarios, China, 2011–25 . . . . . . . . . . . . . . . . . . . . . . . . . . . . . . . . . 60
1A.4 Investment share of output under various external balance scenarios, selected potential emerging economy poles, 2004–25 . . . . . . . . . . . . . . . . . . . . . . . . . . . 61
2.1 Total cross-border M&A deals by fi rms from advanced economies and emerging-market economies, 1997–2010 . . . . . . . . . . . . . . . . . . . . . . . . . . . . . . . . . . . . . 75
2.2 Total cross-border greenfi eld investment by fi rms from advanced economies and emerging-market economies, 2003–09 . . . . . . . . . . . . . . . . . . . . . . . . . . 76
2.3 Total cross-border greenfi eld investment and M&A deals by emerging-market fi rms, 2003–10 . . . . . . . . . . . . . . . . . . . . . . . . . . . . . . . . . . . . . . . . . . . . 76
2.4 Geographic distribution of the top 1,000 fi rms by R&D spending . . . . . . . . . . . . . . . . . . . 77
2.5 Cross-border patents granted worldwide to residents of emerging economies, 1995–2008 . . . . . . . . . . . . . . . . . . . . . . . . . . . . . . . . . . . . . . . . . . . 77
2.6 Technology and institutional environment in developing and developed countries . . . . . . 78
2.7 Top source countries of emerging-market fi rms’ cross-border M&A deals in emerging economies and advanced economies . . . . . . . . . . . . . . . . . . . . . 79
viii Contents Global Development Horizons 2011
2.8 Top destination countries for emerging- market fi rms’ cross-border M&A deals in emerging economies and advanced economies . . . . . . . . . . . . . . . . . . . . . 80
2.9 South-South cross-border greenfi eld investments and M&A deals, by value, 2003–10 . . 81
2.10 South-North cross-border greenfi eld investments and M&A deals, by value, 2003–10 . . 81
2.11 Cross-border M&A investment to low-income countries, 1997–2010 . . . . . . . . . . . . . . . . 85
B2.1.1 Selected bilateral M&A fl ows from home to host economies, 2007 . . . . . . . . . . . . . . . . . 87
2.12 Projected emerging-market outbound cross-border deals through 2025 . . . . . . . . . . . . . 89
B2.2.1 Global expansion of cross-border economic transactions, 1983–2008 . . . . . . . . . . . . . . . 90
B2.2.2 Stronger growth in international trade of fi nancial assets than in goods trade, 1987–2008 . . . . . . . . . . . . . . . . . . . . . . . . . . . . . . . . . . . . . . . . . . . . . 91
2.13 New cross-listings by foreign fi rms on U.S. and European international stock exchanges, 2005–10 . . . . . . . . . . . . . . . . . . . . . . . . . . . . . . . . . . . . . . 95
2.14 Share of cross-listed fi rms that announced acquisitions of foreign fi rms . . . . . . . . . . . . . 95
2.15 Equity fi nancing raised on the LSE, NYSE, and NASDAQ by emerging-market acquirer fi rms, 1995–oct 2010 . . . . . . . . . . . . . . . . . . . . . . . . . . . . . . . . . . . . . . . . . . . . . . 96
2.16 International bank lending to low income countries, 1995–2010 . . . . . . . . . . . . . . . . . . . . 98
2.17 International bond issues emanating from emerging economies, 1998–2010 . . . . . . . . . 98
2.18 International debt fi nancing by emerging-market fi rms, 2000–10 . . . . . . . . . . . . . . . . . . . 99
2.19 Average at-issue spreads of international private corporate bonds, by currency, 2003–07 . . . . . . . . . . . . . . . . . . . . . . . . . . . . . . . . . . . . . . . 99
2.20 Private bond spread versus GDP per capita . . . . . . . . . . . . . . . . . . . . . . . . . . . . . . . . . . . 100
2.21 Private bond spread versus sovereign risk rating . . . . . . . . . . . . . . . . . . . . . . . . . . . . . . . 101
2.22 U.S. dollar corporate bond spread to benchmarks, 2000–10, average by year . . . . . . . . 103
2.23 Total number of active bilateral investment treaties, 1980–2007 . . . . . . . . . . . . . . . . . . 106
2.24 Number of bilateral investment treaties signed by advanced economy countries, as of 2007 . . . . . . . . . . . . . . . . . . . . . . . . . . . . . . . . . . . . . . . . . . . . 106
2.25 The number of newly signed South-South BITs rose rapidly in the 1990s, ahead of the actual surge in South-South investment . . . . . . . . . . . . . . . . . . . . . . . . . . . 108
2A.1 Source of ADR issues on U.S. exchanges, 2000–10 . . . . . . . . . . . . . . . . . . . . . . . . . . . . .111
2A.2 Breakdown of tallies for new foreign company listings on the LSE AIM, 2000–10 . . . . . .112
B3.1.1 Historical Timeline of Dominant International Currencies . . . . . . . . . . . . . . . . . . . . . . . . 129
3.1 Currency denominations of banks’ international assets and international bonds outstanding, by percentage, 1999–2010 . . . . . . . . . . . . . . . . . . . . . . . . . . . . . . . . 130
3.2 Global foreign exchange market turnover, by currency (net of local, cross-border, and double counting), 1998–2007 . . . . . . . . . . . . . . . . . . . . . . . . . . . . . . . 131
3.3 Composite indicator of international currency shares, 1999–2009 . . . . . . . . . . . . . . . . . 132
3.4 Global currency shares relative to trade share and economic size . . . . . . . . . . . . . . . . . . 133
B3.2.1 Gains from the international status of currency . . . . . . . . . . . . . . . . . . . . . . . . . . . . . . . . 135
3.5 Foreign residents’ U.S. asset holdings, 1980–2007 . . . . . . . . . . . . . . . . . . . . . . . . . . . . . 136
3.6 U.S. balance of payments, 1946–2008 . . . . . . . . . . . . . . . . . . . . . . . . . . . . . . . . . . . . . . 137
3.7 The geographic distribution of trade concentration relative to China, the European Union, and the United States, 2005–09 period average . . . . . . . . . . . . . . 138
3.8 Share of global manufacturing exports . . . . . . . . . . . . . . . . . . . . . . . . . . . . . . . . . . . . . . . 140
B3.3.1 Evolution of net international investment positions, advanced and emerging economies, 2004–25 . . . . . . . . . . . . . . . . . . . . . . . . . . . . . . . . . . . . . . . . . . . . 143
Global Development Horizons 2011 Contents ix
3.9 Implied U.S. fi scal balances and global economic sizes, dollar standard and multipolar currencies scenarios . . . . . . . . . . . . . . . . . . . . . . . . . . . . . . . . . . . . . . . . . . . . 144
3.10 Membership in major international organizations, 1945–2010 . . . . . . . . . . . . . . . . . . . . . 146
3.11 Macroeconomic policy disparities, selected actual and potential growth poles among advanced and emerging economies . . . . . . . . . . . . . . . . . . . . . . . . . . . . . . . . . . . 147
3.12 Exchange rate arrangements of developing countries, 2000 and 2010 . . . . . . . . . . . . . . 149
3.13 SDRs as a percentage of the world’s foreign exchange reserves, 1970–2010 . . . . . . . . 150
3.14 Distribution of foreign exchange reserves, 1999 and 2008 . . . . . . . . . . . . . . . . . . . . . . . 151
Tables1.1 Multidimensional polarity index, top 15 economies, 2004–08 average . . . . . . . . . . . . . . . 20
B1.2.1 Regional simple polarity index, top three countries, 2004–08 average . . . . . . . . . . . . . . . 21
1.2 Current account balances, current and potential growth poles, 2004–25 . . . . . . . . . . . . . 41
1.3 Key perturbations for alternative growth and external balance scenarios . . . . . . . . . . . . . 44
1.4 Measures of growth poles, top 15 countries, 2021–25 baseline average . . . . . . . . . . . . . 46
1A.1 Principal components index (with and without migration subindex) for growth poles, top 10 economies, 2004–08 average . . . . . . . . . . . . . . . . . . . . . . . . . . . . . 54
1A.2 Estimates for proximate determinants of growth polarity . . . . . . . . . . . . . . . . . . . . . . . . . 56
1A.3 Estimates for fundamental determinants of growth polarity . . . . . . . . . . . . . . . . . . . . . . . 57
1A.4 Correlations for consumption, investment, and exports with output, and changes in consumption, investment, and exports with change in output, current and potential pole . . . . . . . . . . . . . . . . . . . . . . . . . . . . . . . . . . . . . . . . . . . . 58
1A.5 Estimates for empirical current account balances model, by country group . . . . . . . . . . . 58
1A.6 Additional current account balances, potential poles, 2004–15 . . . . . . . . . . . . . . . . . . . . . 59
2.1 Regional distribution of cross-border mergers and acquisitions, by number of deals and value, 1997–2010 . . . . . . . . . . . . . . . . . . . . . . . . . . . . . . . . . . . . . . . 83
2.2 Top emerging-market multinationals in cross-border mergers and acquistions, by number of deals, 1997–2010 . . . . . . . . . . . . . . . . . . . . . . . . . . . . . . . . . . . . . . . . . . . . . 92
B2.4.1 Detailed econometric results for regressions on spread determinants . . . . . . . . . . . . . . 102
2A.1 Summary statistics of corporate bond issuance by emerging-market countries, 1995–2009 . . . . . . . . . . . . . . . . . . . . . . . . . . . . . . . . . . . . . . . . . . . . . . . . . . . . 109
2A.2 Defi nitions of key variables included in the database . . . . . . . . . . . . . . . . . . . . . . . . . . . . .110
2A.3 Determinants of cross-border outbound M&A investments . . . . . . . . . . . . . . . . . . . . . . .114
3.1 Currency shares of foreign exchange reserve holdings, by percentage, 1995–2009 . . . 131
3.2 Importance of selected national fi nancial markets . . . . . . . . . . . . . . . . . . . . . . . . . . . . . . 134
3.3 International debt securities outstanding, by currency, 1999–2010 . . . . . . . . . . . . . . . . . . . 139
3.4 Renminbi local currency swap arrangements, July 2010 . . . . . . . . . . . . . . . . . . . . . . . . . .141
3.5 Currency denominations of the external balance sheets of the United States and China, end-2009 . . . . . . . . . . . . . . . . . . . . . . . . . . . . . . . . . . . . . . . . . . . . . . . 142
3A.1 Estimates of long-run global money demand for the U.S. dollar, euro, pound sterling, and yen . . . . . . . . . . . . . . . . . . . . . . . . . . . . . . . . . . . . . . . . . . . . . . . . . . . 154
3A.2 Principle factor analysis of international currency use . . . . . . . . . . . . . . . . . . . . . . . . . . . 155


G L O B A L D E V E L O P M E N T H O R I Z O N S 2 0 1 1 xi
Foreword
THE WORLD ECONOMY IS IN THE
midst of a transformative change. One of
the most visible outcomes of this trans-
formation is the rise of a number of dynamic
emerging market countries to the helm of the
global economy. It is likely that, by 2025, emerg-
ing economies—such as Brazil, China, India,
Indonesia, and the Russian Federation—will
be major contributors to global growth, along-
side the advanced economies. As they pursue
growth opportunities abroad and encouraged by
improved policies at home, corporations based
in emerging markets are playing an increasingly
prominent role in global business and cross_bor-
der investment. Th e international monetary sys-
tem is likely to cease being dominated by a single
currency. Emerging-market countries, where
two-thirds of offi cial foreign exchange reserves
are currently held and whose sovereign wealth
funds and other pools of capital are increasingly
important sources of international investment,
will become key players in fi nancial markets. In
short, a new world order with a more diff use dis-
tribution of economic power is emerging—thus
the shift toward multipolarity.
Th roughout the course of history, major eco-
nomic transitions have always presented chal-
lenges, as they involve large uncertainties sur-
rounding identifi cation of emerging global issues
of systemic importance and development of
appropriate policy and institutional responses. It
is in this context that the World Bank is launch-
ing a new report, Global Development Horizons (GDH).1 The new report serves as a vehicle
for stimulating new thinking and research on
anticipated structural changes in the global
economic landscape. To retain this forward-
looking orientation and to serve the World Bank
Group’s mandate of development and poverty
alleviation, it is envisaged that future editions of
GDH will be dedicated to themes of importance
to the emerging development agenda and global
economic governance, including changing global
income inequality, increasing economic inse-
curity, global population aging, and the future
shape of development fi nance.
Th e inaugural edition of GDH addresses the
broad trend toward multipolarity in the global
economy, particularly as it relates to structural
changes in growth dynamics, corporate invest-
ment, and international monetary and fi nancial
arrangements. Multipolarity, of course, has dif-
ferent interpretations within diff erent spheres of
contemporary international relations. In interna-
tional politics, where much of the discussion has
been focused, the debate centers on the potential
for a nonpolar world, in which numerous national
concentrations of power exist but no single center
dominates (as opposed to the bipolar global polit-
ical environment that defi ned the Cold War era).
In the realm of international economics, multi-
polarity—meaning more than two dominant
growth poles—has at times been a key feature
of the global system. But at no time in modern
history have so many developing countries been
at the forefront of a multipolar economic system.
This pattern is now set to change. Within the
next two decades, the rise of emerging economies
will inevitably have major implications for the
global economic and geopolitical landscape.
1. GDH now contains the thematic analysis that previously appeared in Global Development Finance and Global
Economic Prospects. Global Economic Prospects will continue to be produced, but without the thematic chapters, and
Global Development Finance will be focused on data.

xii Foreword Global Development Horizons 2011
the size and dynamism of China’s economy and
the rapid globalization of its corporations and
banks will position the renminbi to take on a
more important international role. By 2025, the
most probable global currency scenario will be a
multipolar one centered around the dollar, euro,
and renminbi. Th is scenario is supported by the
likelihood that the United States, the euro area,
and China will constitute the three major growth
poles by that time, providing stimulus to other
countries through trade, finance, and technol-
ogy channels and thereby creating international
demand for their currencies.
The potential for rising competition among
power centers that is inherent in the shift to a
more multipolar world makes strengthening
policy coordination across economies—develop-
ing and developed—critical to reducing the risks
of political and economic instability. In the years
leading up to the fi nancial crisis, the role of inter-
national economic policy making was confi ned
to managing the symptoms of incompatible mac-
roeconomic policies, such as exchange rate mis-
alignments and payments imbalances. As capital
markets have been liberalized and exchange rates
made more f lexible, balance of payments con-
straints on national economies have been consid-
erably eased, shifting policy coordination toward
the more politically sensitive spheres of domestic
monetary and fi scal policy.
For its part, the international fi nancial com-
munity must recognize that it has a complex bur-
den to shoulder in ensuring that the least devel-
oped countries (LDCs) are guarded against the
volatility that could accompany the transition
to a multipolar order. Many LDCs are heav-
ily reliant on external demand for growth and,
hence, their ability to manage their external rela-
tions becomes critical. For those with f loating
exchange rate regimes, a critical element would
be the development of the necessary institutional
policy frameworks, market microstructure, and
fi nancial institutions that can ensure the smooth
functioning of foreign exchange markets. Aid
and technical assistance from international fi nan-
cial institutions have the potential to cushion
volatility in these economies as they adapt to the
global forces involved in the transition to a mul-
tipolar world.
In a world of progressively more multipolar
economic growth and fi nancial centers, policy
makers will need to equip themselves with the
tools and capabilities to eff ectively capitalize on
opportunities while simultaneously safeguard-
ing their economies against the risks that remain
stubbornly high as the global economy struggles
to find a stable footing. Within the realm of
immediate concerns, the tragic earthquake and
tsunami that hit Japan in March 2011, the polit-
ical turmoil gripping much of the Middle East
and North Africa, and the financial tremors
emanating from the European sovereign debt
crisis are all likely to exact a heavy toll on global
fi nancial markets and growth. Seen against the
backdrop of a sub-par global growth trajectory,
high levels of unemployment in many advanced
and developing economies, and rising infl ation-
ary pressures in many emerging and low-income
economies, these events call for further bold,
concrete actions to shore up confidence and
establish the underpinning for bankers to lend,
and for businesses to invest in equipment and
technology that will boost productivity, create
jobs, and generate long-term growth. Indeed,
it is through rising investment and economic
growth that productive jobs will be created to
absorb the large youth cohort in the Middle
East and North Africa region and elsewhere,
that earthquake-shattered parts of Japan will
be rebuilt, and that fi scal consolidation in the
United States and Europe will become more
achievable.
The transformation of global patterns of
economic growth is also driving a change in
the international monetary system. At the cur-
rent juncture, the U.S. dollar remains the most
important international currency, despite a slow
decline in its role since the late 1990s and aban-
donment nearly forty years ago of the Bretton
Woods system of fi xed exchange rates (in which
the dollar offi cially anchored the world’s curren-
cies). But the dollar now faces growing compe-
tition in the international currency space. Chief
within this space is the euro, which has gained
ground in recent years as a currency in which
goods are invoiced and offi cial reserves are held,
while the yen and pound represent only single
digit shares of offi cial reserves In the longer term,

Initiative and greater emphasis on open knowl-
edge exchange (http://data.worldbank.org). In the
future, the site will also serve as a repository of
related research papers from the broader develop-
ment community, as well as a vehicle for inter-
active debate and networking with various think
tanks, business associations, and policy establish-
ments concerned with long-term global economic
change and its implications for development pol-
icy and discourse.
Justin Yifu Lin
Chief Economist and Senior Vice President
Th e World Bank
Global Development Horizons 2011 Foreword xiii
Finally, the World Bank believes that a pub-
lication geared toward stimulating new thinking
and research on the implications of a changing
global landscape should embed change in its own
format and design. Thus, GDH will consist of
both a hard copy publication and a companion
website (http://www.worldbank.org/GDH2011)
that will serve as an extension of the paper pub-
lication. Th is website will be a platform for the
report’s underlying data, methodology, blog post-
ings, and relevant background papers. Th e site
will also include an interactive feature that will
allow visitors to explore the scenarios described
in GDH. Th is is in line with the Bank’s agenda
to “democratize” development via our Open Data


Global Development Horizons 2011 1
Overview
SWEEPING CHANGES ARE AFOOT
in the global economy. As the second
decade of the 21st century unfolds and
the world exits from the 2008–09 fi nancial crisis,
the growing clout of emerging markets is paving
the way for a world economy with an increasingly
multipolar character. Th e distribution of global
growth will become more diff use, with no single
country dominating the global economic scene.
Th e seeds of this change were planted some
time ago. Over the past two decades, the world
has witnessed emerging economies rise to become
a powerful force in international production,
trade, and fi nance. Developing countries’ share of
international trade fl ows has risen steadily, from
30 percent in 1995 to an estimated 45 percent in
2010. Much of this rise has been due to an expan-
sion of trade not between developed countries
and developing countries, but among develop-
ing countries. Similarly, more than one-third of
foreign direct investment in developing countries
currently originates in other developing countries.
Emerging economies have also increased their
financial holdings and wealth. Emerging and
developing countries now hold two-thirds of all
offi cial foreign exchange reserves (a reversal in the
pattern of the previous decade, when advanced
economies held two-thirds of all reserves), and
sovereign wealth funds and other pools of capital
in developing countries have become key sources
of international investment. At the same time,
the risk of investing in emerging economies has
declined dramatically. Borrowers such as Brazil,
Chile, and Turkey now pay lower interest rates
on their sovereign debts than do several European
countries.
As investors and multinational companies
increase their exposure to fast-growing emerg-
ing economies, internationa l demand for
emerging-economy currencies will grow, making
way for a global monetary system with more than
one dominant currency. Th e growing strength of
emerging economies also aff ects the policy envi-
ronment, necessitating more inclusive global eco-
nomic policy making in the future.
Th is broad evolution under way in the global
economy is not without precedent. Th roughout
the course of history, paradigms of economic
power have been drawn and redrawn according
to the rise and fall of states with the greatest capa-
bility to drive global growth and provide stimulus
to other countries through cross-border com-
mercial and fi nancial engagements. In the fi rst
half of the second millennium, China and India
were the world’s predominant growth poles. Th e
Industrial Revolution brought Western European
economies to the forefront. In the post–World
War II era, the United States was the predomi-
nant force in the global economy, with Germany
and Japan also playing leading roles.
In more recent years, the global economy has
begun yet another major transition, one in which
economic infl uence has clearly become more dis-
persed than at any time since the late 1960s. Just
as important, developing countries have never
been at the forefront of multipolarity in economic
affairs. During the forecast period of Global
Development Horizons (GDH) 2011—from 2011
to 2025—the rise of emerging economies will
inevitably have major implications for the global
economic and geopolitical hierarchy, just as simi-
lar transformations have had in the past.
Increased diff usion of global growth and eco-
nomic power raises the imperative of collective
management as the most viable mechanism for
addressing the challenges of a multipolar world
economy. Th e key diff erences that the manage-
ment of a multipolar global economy will present

2 Overview Global Development Horizons 2011
link between economic power concentration and
stability, the North-South axis of capital fl ows,
and the centrality of the U.S. dollar in the global
monetary system. Such a reappraisal off ers much
in advancing the debate on the future course of
international development policy and discourse.
In anticipation of the shape of the future
global economy, this f irst edition of Global Development Horizons aims to map out the
emerging policy agenda and challenges that an
increasingly multipolar world economy poses for
developing countries.
Emerging Growth Poles Will Alter the Balance of Global GrowthThe coming decades will see global economic
growth increasingly being generated in emerg-
ing economies. By 2025, global economic growth
will predominantly be generated in emerging
economies. Although many high-income coun-
tries are only gradually recovering from the fi nan-
cial crisis, most developing countries have swiftly
returned to their fast precrisis growth trend.
China was one of the fi rst economies to emerge
from the crisis, and it returned quickly to around
10 percent growth. India experienced a stronger
contraction, but also attained more than 10 per-
cent growth in 2010, and the government is put-
ting in place an ambitious new Five Year Plan
(with improved policies and necessary invest-
ment programs) to keep growth at that level.
Latin America sharply rebounded in 2010, after
contracting sharply in 2009. Even Sub-Saharan
Africa is expected to return quickly to almost
6 percent annual growth, similar to its perfor-
mance in the years before the crisis. Even in the
absence of such exceptionally high growth rates
in the developing world, the balance of global
growth is expected to shift dramatically.
Th e changing role of developing countries will
come with major transformations to their econo-
mies, corporate sectors, and financial systems.
Th ese changes are likely to occur in a wide vari-
ety of scenarios. Th e baseline scenario considered
in GDH 2011—which is derived from longer-
term historical trends and from forward-looking
relative to the postwar era of the U.S.-centered
global economic order relate to the distribution
of the costs and responsibilities of system main-
tenance and the mechanisms for sharing the spe-
cial privileges and benefi ts associated with being a
global growth pole. In the postwar era, the global
economic order was built on a complementary
set of tacit economic and security arrangements
between the United States and its core partners,
with developing countries playing a peripheral
role in formulating their macroeconomic poli-
cies and establishing economic links with an eye
toward benefi ting from the growth dynamism in
developed countries. In exchange for the United
States assuming the responsibilities of system
maintenance, serving as the open market of last
resort, and issuing the most widely used interna-
tional reserve currency, its key partners, Western
European countries and Japan, acquiesced to the
special privileges enjoyed by the United States—
seigniorage gains, domestic macroeconomic pol-
icy autonomy, and balance of payments fl exibility.
Broadly, this arrangement still holds, though
hints of its erosion became evident some time
ago. For example, the end of the postwar gold
exchange standard in 1971 heralded a new era
of fl oating currencies (formalized by the Jamaica
Agreement in 1976), a trend that has not been
limited to developed countries. Particularly since
the East Asian fi nancial crisis of 1997–98, devel-
oping countries have increasingly f loated their
currencies. Changes in currency use have also
occurred. As Europe has followed a trajectory of
ever-increasing economic integration, the euro
has come to represent a growing proportion of
international transactions and foreign exchange
reserve holdings. At the same time, developing
economies’ increased trade fl ows and the gradual
opening of their economies to foreign capital have
benefited developing economies handsomely,
boosting their growth potential and tying their
economic and financial stakes to the continu-
ation of a liberal global order. In the unfolding
global economic environment, in which a num-
ber of dynamic emerging economies are evolving
to take their place at the helm of the global econ-
omy, the management of multipolarity demands
a reappraisal of three pillars of the conventional
approach to global economic governance—the
Global Development Horizons 2011 Overview 3
components such as anticipated changes in
demography, labor force growth, saving patterns,
and educational levels—off ers a lens into the pos-
sible transformations to come. Th is scenario envi-
sions average growth over the next 15 years that
will be substantially lower than the highs of 2010.
However, emerging economies will still, collec-
tively, expand by an average of 4.7 percent per
year (more than twice the developed world’s 2.3
percent rate) between 2011 and 2025. (Given the
considerable uncertainty underlying long-term
growth projections, the baseline scenario includes
error bands to emphasize the wide range of pos-
sible outcomes). By 2025, six major emerging
economies—Brazil, China, India, Indonesia, the
Republic of Korea, and the Russian Federation—
will collectively account for more than half of all
global growth. Several of these economies will
become key drivers of global growth, alongside
advanced economies. Th is new global economy, in
which the centers of growth are distributed across
both developed and emerging economies, is what
GDH 2011 envisions as a multipolar world.
Altering this balance calls for productivity
growth in emerging economies and
realignment of demand away from
external sources
Even with a moderation of growth in developing
countries, successful realization of the baseline
scenario presented in GDH 2011 is dependent
on several important changes to the character
of growth in emerging economies. In particular,
strong future growth performance of emerging
markets depends critically on these economies’
ability to sustain improvements in technological
dynamism—often referred to as total factor pro-
ductivity (TFP)—and to successfully transition
toward internal sources of demand.
Historically, economic progress in emerg-
ing economies has followed one of two paths.
The first, which characterizes economies such
as China, India, and Russia, is one in which
TFP growth is a major contributor to economic
growth. The second path, which has recently
been common among the economies of Latin
America and Southeast Asia, is one in which
growth is led by the rapid mobilization of factors
of production. Yet even in the former case, TFP
growth has been largely due to the rapid adop-
tion of existing technologies, economywide factor
reallocation, and improvements in institutional
governance, rather than progress in pure innova-
tive capacity. Th e long-run viability of fast-paced
growth in emerging economies will thus depend,
in part, on the ability of emerging economies to
enhance their indigenous innovation through
investments in human capital and through the
creation of appropriate institutional mechanisms
to stimulate expenditure on research and devel-
opment (R&D).
Innovation and innovative capacity are
already rising in emerging economies. Since
2000, China and India have invested heavily
in R&D; expenditures on R&D accounted for
1.4 percent of gross domestic product (GDP) in
China and 0.8 percent in India, about an order
of magnitude greater than that shown by peer
economies in their respective income groups.
Th e siting of major research facilities in China
by Microsoft, the invention of the Nano micro-
car by Indian fi rm Tata, and the continued string
of aeronautical breakthroughs in Russia suggest
the emerging-economy giants’ strong poten-
tial for fostering growth through technological
advancement.
Rapid growth in the major emerging econo-
mies will also need to be accompanied by a
realignment of growth away from external
sources and toward internal demand—a pro-
cess that is under way in many cases. In China,
for example, consumption is projected to rise
from the current 41 percent of national income
to 55 percent by 2025, much closer to the level
of developed countries. Similar increases are
also likely to occur in the emerging economies
of Eastern Europe. Latin American economies,
where the consumption share of income is already
65 percent and is expected to remain at that level,
will be the exception to this trend. Th e sharpest
declines in savings rates are likely in East Asian
and Eastern European economies, where popu-
lation aging will be at a more advanced stage.
In Eastern Europe, rising levels of consumption
are likely to occur concomitantly with relative
declines in investment shares, consistent with the
declining labor force in several countries. As a
result, current account defi cits could narrow in

4 Overview Global Development Horizons 2011
in 2010 (approximately three times the $2.1 tril-
lion in reserves held by advanced economies), and
the share of cross-border mergers and acquisitions
(M&A) by fi rms based in emerging economies in
2010 was 29 percent ($470 billion) of the global
total.
The road ahead for emerging economies—
while cautiously positive—will nevertheless
entail downside risks of both a short- and a
long-term nature. If economies with historically
low TFP contributions are unable to raise their
productivity levels through institutional reform
and technological innovation, the existing two-
track global economy may fracture even further
into a slowly divergent growth path between
advanced economies, low-productivity develop-
ing economies, and high-productivity developing
economies. Similarly, if outward-oriented emerg-
ing economies with weak internal demands are
not successful in increasing their consumption
share, capital in these economies may eventually
be channeled toward increasingly unproductive,
low-yielding investments. The run-up in com-
modity prices since 2003 may also become per-
sistent, which could potentially derail growth
in developing countries that are especially com-
modity intensive. On the upside, if emerging
economies successfully navigate their rising per
capita incomes, provide necessary infrastructural
improvements, and facilitate corporate sector
reform, the baseline scenario may underestimate
emerging economies’ future growth potential.
Finally, unexpected economic and geopolitical
developments may introduce fundamental uncer-
tainty of a nature that is impossible to develop
scenarios for.
Emerging-Market Multinationals Becoming a Potent Force in Reshaping the Process of Industrial GlobalizationLong relegated to second-tier status, emerging-
market companies are becoming powerful forces
and agents of change in the global industrial
and fi nancial landscape. Trends in foreign direct
investment (FDI) f lows are one indication of
this shifting status. Between 1997 and 2003,
those countries. Conversely, account surpluses
in several Asian countries could be reduced with
the declining savings rates. Together with ris-
ing domestic savings in the United States after
the fi nancial crisis, the more prominent role of
emerging economies coincides with a narrowing
of global imbalances, which indeed is part of the
baseline scenario.
Sustaining higher consumption shares of out-
put in emerging economies will be key in con-
solidating the transition from externally driven
to internally driven growth and will require an
expansion of the middle class, which, in turn,
will call for emerging-market policy makers to
usher in broad fi nancial sector development and
to improve domestic social safety nets. To meet
demand for more diverse consumption goods,
increasing numbers of small and medium enter-
prises are required, together with open trade
relations.
As the international trade shares of the
emerging and developed world converge,
global wealth and asset holdings will shift
toward emerging economies
As a group, emerging economies are likely to
experience significant increases in their inter-
national trade f lows by 2025, in terms of both
imports and exports. The value of Indonesia’s
exports, for example, is likely to double between
2010 and 2025, while the value of its imports
is expected to be more than one-and-a-half
times higher by 2025. Global trade is forecast to
expand as a share of global output over the same
time period, from 49.9 percent of output to 53.6
percent.
Th ese current account paths mean that major
emerging economies are likely to collectively
take on a large and rising net asset international
position (albeit at a diminishing rate) in their
holdings of investments in developed economies
(which, in turn, are expected to build equally
large net liability positions). Global wealth and
asset holdings will thus shift further toward
emerging economies with surpluses, such as
China and major oil exporters in the Middle
East. Th is adjustment is already refl ected in the
current fi nancial landscape: International reserves
held by emerging economies topped $7.4 trillion

Global Development Horizons 2011 Overview 5
emerging-market fi rms is forecast to more than
double by 2025, while the annual number of
cross-border M&A deals is expected to more than
triple (from fewer than 2,500 in 2011 to almost
8,000 in 2025). Th is trend outpaces the underly-
ing GDP growth rates in emerging-market fi rms’
home countries.
The development of emerging-market firms
into a potent force for globalization in their own
right will have important implications for cross-
border capital formation, technology genera-
tion and diff usion, and fi nancing of commercial
activities. A number of innovative and dynamic
emerging-market fi rms are on a path toward dom-
inating their industrial sectors globally—much in
the same way that companies based in advanced
economies have done over the past half century.
Many emerging-market fi rms have already begun
overtaking their advanced-country competitors
in terms of the priority accorded to developing
innovative technologies and industrial processes,
with 114 fi rms from emerging economies ranking
among the top 1,000 fi rms worldwide by R&D
spending as of 2009, twice as many as fi ve years
earlier. Th is is a particularly noteworthy accom-
plishment given that the private sector tradition-
ally has not been the main fi nancier of R&D in
developing countries. In 2025, a luxury sedan is
as likely to be a Hyundai or Tata as a Mercedes
or Lexus, is as likely to be powered with fuel from
Lukoil or Pertamina as from ExxonMobil or BP,
and is as likely to be fi nanced by China’s ICBC
(Industrial and Commercial Bank of China Ltd.)
or Brazil’s Itaú as by Citi or BNP Paribas.
Th ere are strong signs of mutually reinforcing
links between commercial and fi nancial
globalization
Th e shift in economic and fi nancial power toward
the developing world is also reshaping cross-border
corporate fi nance, transforming emerging-market
fi rms into signifi cant participants in international
capital markets. Th e progress of a growing number
of developing countries in improving the sound-
ness and transparency of domestic institutions and
policies has enabled their fi rms to gain increased
access to international bond and equity markets,
and at better terms, in their efforts to expand
globally. Nearly two-thirds of emerging-market
companies based in emerging economies engaged
in cross-border investment through M&A
deals of $189 billion, or 4 percent of the value
of all global M&A investments over the period.
Between 2004 and 2010, that amount increased
to $1.1 trillion—17 percent of the global total.
Since 2003, approximately 5,000 firms based
in emerging markets have established a global
presence through 12,516 greenfi eld investments
of $1.72 trillion. More than one-third of FDI
infl ows to developing countries now originate in
other developing countries: Of the 11,113 cross-
border M&A deals announced worldwide in
2010, 5,623—more than half—involved emerg-
ing-market companies, either as buyers or as take-
over targets by advanced-country fi rms. As they
venture overseas, companies based in emerging
markets tend to seek assets that will help them
accomplish one or more of several goals: diver-
sifi cation of their growth, a larger global market
share, exploitation of growth opportunities not
available in their domestic economies, or freedom
from an unfavorable domestic economic climate.
As they pursue growth opportunities abroad,
corporations based in emerging markets play
an increasingly prominent role in global busi-
ness, competing with firms based in advanced
countries for natural resources, technology, and
access to international markets. Many emerg-
ing-market fi rms often have an advantage over
advanced-country firms in navigating difficult
policy environments in other developing coun-
tries, because they have experienced similar con-
ditions in their home countries. Th ese two trends,
together with the overall strengthening of South-
South trade links, will ensure that South-South
investment continues to expand. Further, M&A
activity by emerging-market firms in develop-
ing countries is on the rise and is becoming an
important source of FDI. Because such transac-
tions typically occur within close geographical
proximity, they will not only deepen regional
economic ties, but also accelerate the integration
of low-income countries into the global economy.
Emerging-market fi rms have also been active in
South-North acquisitions, especially in advanced
economies with sophisticated equity markets and
favorable growth prospects. Th e annual value of
cross- border M&A transactions undertaken by

6 Overview Global Development Horizons 2011
From a policy perspective, the growing role
and infl uence of emerging-market fi rms in global
investment and fi nance may make it more pos-
sible—and indeed, critical—to move forward
with the sort of multilateral framework for reg-
ulating cross-border investment that has been
derailed several times since the 1920s. In contrast
to international trade and monetary relations, no
multilateral regime exists to promote and govern
cross-border investment. Instead, the surge of
bilateral investment treaties (BITs)—more than
2,275 BITs were in place in 2007, up from just
250 in the mid-1980s—has provided the most
widely used mechanism for interstate negotia-
tion over cross-border investment terms, includ-
ing access to international arbitration of disputes.
Th ough BITs have proven to be suboptimal from
an economic point of view, there are reasons to
believe that their proliferation and the associ-
ated experience of formulating, negotiating,
and implementing them across a large number
of developed and developing countries have set
the stage for transition into a multilateral frame-
work. Th e elimination of investment restrictions
through BITs, for example, may be supportive of
more general multilateral liberalization eff orts.
Moreover, BITs have also set the stage for com-
plementary institutional advancements at the
global level. Indeed, the International Centre for
the Settlement of Investment Disputes (ICSID)
has experienced growing demand for cross-border
investment dispute settlement services—cases
registered with the ICSID averaged 25 per year
between 2001 and 2010, up from an average of
about two cases per year between 1981 and 1990.
Th is increase in demand has allowed the matu-
ration of an institutional infrastructure that is
well positioned to serve as an important founda-
tion, especially on legal aspects, for a multilateral
framework in the future.
Multipolar International Economy to Lead to a Larger Role for the Euro and, in the Long Term, for the RenminbiRapid growth in emerging-market economies has
led to enormous wealth creation and substantial
firms that have been active acquirers since the
late 1990s—those fi rms that have undertaken 10
or more acquisitions—have tapped international
markets to access one or more forms of fi nancing
through syndicated loans, bond issues, and equity
listings. As evidence of the mutually reinforcing
links between commercial and fi nancial globaliza-
tion, a growing number of emerging-market fi rms
undertake at least one cross- border acquisition
within two years of accessing international capi-
tal markets. International bond issuance, in par-
ticular, by borrowers based in emerging markets
has grown dramatically since the mid-1990s and
is now one of the main sources of capital infl ows
for those countries. Since 1995, a large number
of emerging private companies have engaged in
high-profi le global bond market transactions, with
80 of them issuing bonds over $1 billion each, of
which 10 were issuances of over $2 billion. Some
prominent issuers include Petrobras International
Finance Company of Brazil, América Móvil of
Mexico, Novelis Inc of India, and VTB bank of
Russia. Over the next decade and beyond, there is
likely to be signifi cant scope for emerging-market
companies to further expand their access to inter-
national capital markets and at more favorable
terms.
In emerging-market economies such as Brazil,
Chile, and Mexico, where local capital markets
have seen considerable growth and maturity in
recent years, companies have the capacity to fund
their growth through a more balanced mix of
local and international capital market issuance.
Furthermore, in some emerging growth poles,
particularly those in Asia, signs already exist
that their local capital markets are evolving into
regional fi nancing hubs. During the next decade
and beyond, as local consumer demand continues
to rise in the fastest-growing emerging markets
and as local capital markets in those countries
become deeper and better regulated, manufactur-
ing and consumer goods fi rms based in developed
countries can be expected to also seek access to
capital markets in emerging markets. Cross-
listings of securities by developed-country fi rms,
although initially motivated by the desire to raise
their fi rms’ brand recognition, will be followed by
issues that tap large pools of available savings in
emerging markets.

Global Development Horizons 2011 Overview 7
accumulation of their net claims on the rest of
the world, raising the profi le of emerging mar-
kets in the international financial system as a
result. Developing and emerging countries held
two-thirds of the world’s $9 trillion of offi cial for-
eign exchange reserves as of late 2010, compared
to only 37 percent of reserves held at the end of
2000. Sovereign wealth funds and other pools
of capital in developing countries have become
a major source of international investment.
Between 2010 and 2025, the collective net inter-
national investment position of major emerging
markets is projected to rise to a surplus of more
than $15.2 trillion (in 2009 dollars) under the
baseline scenario presented in GDH 2011, off set
by a corresponding deficit in today’s advanced
economies.
Even though the role of emerging markets in
international fi nance is growing, there is a great
disparity between their economic size and their
role in the international monetary system. At
present, no emerging economy has a currency
that is used internationally—that is, one in which
official reserves are held, goods and services
are invoiced, international claims are denomi-
nated, and exchange rates are anchored—to any
great extent. Virtually all developing countries
are exposed to currency mismatch risk in their
international trade and investment and fi nanc-
ing transactions. Addressing these disparities in
the international monetary system needs urgent
attention, in terms of both the management of
the system (here, the International Monetary
Fund [IMF] continues to play a leading role) and
the understanding of long-term forces shaping
the future workings of the system.
International currency use exhibits consider-
able inertia and is subject to network externali-
ties, rendering currencies already in widespread
use the most attractive. For now, the U.S. dollar
remains the chief international currency, despite
a slow decline in the proportion of global reserves
held in dollars since the late 1990s. But the dol-
lar now faces several potential rivals for the role
of international currency. At present, the euro is
the most credible of those alternatives. Its status
is poised to expand, provided the euro area can
successfully overcome the sovereign debt crises
currently faced by several of its member countries
and can avoid the moral hazard problems asso-
ciated with bailouts of countries within the
European Union.
Looking further ahead, as emerging econo-
mies account for an ever-growing share of the
global economy and participate more actively
in cross-border trade and fi nance, one sees that
their currencies—particularly the renminbi—
will inevitably play a more important role in the
international fi nancial system. A larger role for
the renminbi would help resolve the disparity
between China’s great economic strength on the
global stage and its heavy reliance on foreign cur-
rencies. On one hand, China is the world’s largest
exporting country and holds the largest stock of
foreign exchange reserves by far ($2.9 trillion held
as of end 2010). On the other hand, China faces a
massive currency mismatch because transactions
by its government, corporations, and other enti-
ties with the rest of the world are almost entirely
denominated in foreign currencies, primarily
U.S. dollars. With private entities in China not
able to directly address the currency mismatch,
the task falls to the government. In moving to
address such issues, Chinese authorities have
undertaken the internationalizing of the ren-
minbi on two fronts: (1) developing an off shore
renminbi market and (2) encouraging the use of
the renminbi in trade invoicing and settlement.
Such initiatives are beginning to have an eff ect in
laying the foundation for the renminbi taking on
a more important global role.
Building on this unfolding reality, GDH 2011
presents three potential scenarios for the future
of the international monetary system: a status
quo centered on the U.S. dollar, a multicurrency
system, and a system with the Special Drawing
Right (SDR) as the main international currency.
Th e most likely of the three scenarios is the mul-
ticurrency system. Under this scenario, the cur-
rent predominance of the U.S. dollar would end
sometime before 2025 and would be replaced by
a monetary system in which the dollar, the euro,
and the renminbi would each serve as full-fl edged
international currencies. This expected transi-
tion raises several important questions. First, how
will developing countries, the majority of which
will continue to use foreign currencies in trade
of goods and assets, be aff ected by a move to a
8 Overview Global Development Horizons 2011
In a multipolar global economy, it is likely that
dissatisfaction with a national currency–based
system will deepen. But from a monetary policy
perspective, the creation of a system in which
global currency decisions are made on a truly mul-
tilateral level—that is, with the explicit agreement
of a large number of countries—is not likely; as
such, a new system would require countries to
cede national sovereignty over their monetary
policy. The great deal of inertia in the current
international monetary system based on national
currencies is also a factor, as is the expectation that
a more diffuse distribution of global economic
power is likely to render cooperation on any sort
of economic policy across borders more diffi cult.
In the years leading up to the fi nancial crisis,
the role of international economic policy mak-
ing was confined to managing the symptoms
of incompatible macroeconomic policies, such
as exchange rate misalignments and payments
imbalances. As capital markets have been liber-
alized and exchange rates made more f lexible,
balance of payments constraints on national
economies have been considerably eased, shifting
policy coordination toward the more politically
sensitive spheres of domestic monetary and fi scal
policy. Unless a country’s borrowing and trade
are concentrated in one of the three key curren-
cies, instability in exchange rates between the
key currencies will lead to fl uctuations in com-
petitiveness and the value of assets and liabilities,
impeding that country’s economic policy making
and potentially jeopardizing the welfare of its res-
idents. Th us, countries without leading currencies
will need to step up their eff orts to hedge against
exchange rate volatility. Th is will be the case for
developing countries, in particular.
Some of the challenges facing the international
monetary system could possibly be managed
through increased use of the SDR. Established by
the IMF in the 1960s as an international reserve
asset and unit of account, the SDR is currently
valued in terms of a basket of four major inter-
national currencies—the euro, Japanese yen,
pound sterling, and U.S. dollar. Enhancing the
role of the SDR in the international monetary
system could help address both the immediate
risks to global fi nancial stability and the ongoing
costs of currency volatility. From an operational
multicurrency system? Second, can a multipolar
economic system—with its dangers of instabil-
ity—be managed within the existing institutional
arrangements, or is a more fundamental reform
of the system necessary? Th ird, what can be done
to smooth the transition to multipolarity, short
of fundamental reform of the international mon-
etary system?
A more multipolar international monetary
system will still involve currency risks for
most developing countries
Th e dollar-based international monetary system of
the present and the likely multicurrency system of
the future share a number of defects inherent to
a system based on national currencies. Th e fun-
damental problem is an asymmetric distribution
of the costs and benefi ts of balance of payments
adjustment and fi nancing. Countries whose cur-
rencies are key in the international monetary sys-
tem benefi t from domestic macroeconomic policy
autonomy, seigniorage revenues, relatively low
borrowing costs, a competitive edge in fi nancial
markets, and little pressure to adjust their exter-
nal accounts. Meanwhile, countries without key
currencies operate within constrained balance of
payment positions and bear much of the external
adjustment costs of changing global fi nancial and
economic conditions. Th is asymmetric distribu-
tion of the cost of adjustment has been a major
contributor to the widening of global current
account imbalances in recent years. It has also
produced a potentially destabilizing situation in
which (a) the world’s leading economy, the United
States, is also the largest debtor, and (b) the
world’s largest creditor, China, assumes massive
currency mismatch risk in the process of fi nanc-
ing U.S. debt. Another shortcoming of the current
system is that global liquidity is created primar-
ily as the result of the monetary policy decisions
that best suit the country issuing the predominant
international currency, the United States, rather
than with the intention of fully accommodating
global demand for liquidity. Th is characteristic
means that the acute dollar shortage that devel-
oped in the wake of the Lehman Brothers collapse
in 2008, which aff ected non–U.S. banks particu-
larly hard, was in many respects worse than the
dollar shortage of the 1950s.
Global Development Horizons 2011 Overview 9
coordination framework put into place by the
Group of 20 (G-20) and to preserve the gains
made in central bank collaboration and har-
monization of financial regulations during the
2008–09 financial crisis. Importantly, coordi-
nation should focus on outcomes that would be
mutually benefi cial to a large number of coun-
tries—that is, on international public goods, such
as environmentally friendly technologies—rather
than on zero-sum variables, in which a gain for
one country implies a loss for another. Only by
recognizing that multilateral coordination has
welfare-enhancing benefi ts for all will countries
voluntarily take into account the concerns of
other countries.
Multipolarity to Bring Benefi ts and New Challenges to the Developing WorldA more multipolar global economy will, on bal-
ance, be positive for developing countries as a
whole—though not necessarily for each of them
individually. Growth spillovers—flowing from
trade, fi nance, migration, and technology chan-
nels—will induce technological transfer, spur
demand for exports, and improve the terms of
trade in developing countries as well as enable
them to develop their domestic agricultural
and manufacturing industries. For example,
since 1990, bilateral trade f lows between the
least developed countries (LDCs) and the major
emerging economies have increased threefold;
trade with emerging economies now accounts
for a greater share of LDCs’ bilateral trade fl ows
than their trade with major advanced economies.
Moreover, a more diff use distribution of global
growth will also create new external growth driv-
ers, meaning that idiosyncratic shocks in individ-
ual growth pole economies will have less impact
on the volatility of external demand in those
countries than at present. Th is characteristic was
evident in the aftermath of the 2008–09 fi nan-
cial crisis, when cross-border M&A originating in
emerging economies accounted for more than a
quarter of the value of all deals in 2009 and 2010.
Greater multipolarity could also have a tangible
eff ect on patterns of foreign aid, as increased aid
perspective, there are two main ways to increase
use of the SDR. The first would be to encour-
age official borrowing denominated in SDRs.
A second avenue would be to formalize central
bank currency swap facilities using the SDR,
which would be useful during a fi nancial crisis,
or perhaps to adjust the composition of the SDR
basket to include the renminbi or other major
emerging-market currencies. Over time, the SDR
could serve as a natural hedge, especially for low-
income countries that lack developed fi nancial
markets.
Nevertheless, a multilateral approach
will remain the best way to manage global
economic policy making
In a world of progressively more multipolar eco-
nomic growth and fi nancial centers, interdepen-
dency will be the operating norm even more than
at the present, bringing new challenges for eco-
nomic diplomacy, national economic policy mak-
ing, and management of transnational capital
channeled across national borders. Th e potential
for rising competition among power centers that
is inherent in the shift to a more multipolar world
makes it especially important to improve the
design of policy coordination across economies—
both developing and developed. More generally,
as global economic integration increases, so, too,
do spillovers of monetary and fi scal policies across
countries. Thus, policy coordination is needed
not only to improve the average performance of
the global economy, but also to avert the atten-
dant risks. Countries should move quickly to
better coordinate their responses to global imbal-
ances, to improve financial regulation, and to
expand mutual surveillance of macroeconomic
policies. To the extent that the vulnerability that
comes with interdependence can be managed
through appropriate responses by international
institutions and multilateral agreements—such
as the provision of emergency financial assis-
tance and commitments to open-door policies to
ensure access to international markets—interde-
pendence can lead to a shared increase in global
prosperity.
Even in the absence of fundamental reform
in international policy coordination, a number
of concrete steps could be taken to further the

10 Overview Global Development Horizons 2011
Furthermore, cross-border investment could also
benefi t from a multilateral framework similar to
the World Trade Organization. Meanwhile, the
IMF is well positioned to take the lead in guid-
ing reforms in the international monetary sys-
tem, including providing support for the design
of coordination mechanisms for a multicurrency
regime that would limit currency volatility and,
hence, help LDCs mitigate external exchange rate
risks.
Major transitions such as the one currently
underway in the global economy always present
challenges, because they involve large uncertain-
ties and necessitate complex policy responses. Th e
transition at hand is not just a matter of leaving
behind old economic paradigms. Rather, it is
about establishing the appropriate mindset and
the proper policy and institutional responses—in
developing countries, developed countries, and
multilateral institutions—to facilitate the transi-
tion to, among other matters, better development
outcomes. Developing countries have made con-
siderable progress in integrating themselves into,
and expanding their profile within, the tradi-
tional channels and institutions of international
trade and finance. But much work remains to
ensure that developing economies adapt to the
transition now under way in the global economy
in a manner that allows them to share the burden
of system maintenance commensurate with their
increased stakes in an open international system.
It is also critical that major developed economies
simultaneously craft policies that are mindful of
the growing interdependency associated with the
increasing presence of developing economies on
the global stage and leverage such interdepen-
dency to derive closer international cooperation
and prosperity worldwide.
disbursements by emerging economies push offi -
cial development assistance to even greater shares
of gross national income in LDCs.
Th e eff ect of an increasingly multipolar global
economy is likely to diff er across countries, how-
ever, and LDCs—many of which are heavily reli-
ant on external demand for growth—are at the
greatest risk of not being able to adapt to risks
created by the transformation. LDCs that are net
importers of commodities and mineral resources
may face higher global prices because of increased
global demand for raw materials. Even in cases
where LDCs are net commodity or resource
exporters, export-biased growth in LDC econo-
mies runs the risk of immiserizing growth. For
LDCs with fl oating exchange rate regimes, criti-
cal elements of their response to a more multipolar
global economy will be development of institu-
tional policy frameworks, market microstructure,
and financial institutions that can ensure the
smooth functioning of foreign exchange markets.
Multilateral institutions can play a role in
ushering in this new multipolar world by provid-
ing technical assistance and promoting policy-
learning forums that enhance understanding of
the process of transition to a multipolar world
economic order. Efforts to raise awareness and
equip policy makers in developing countries with
the necessary policy tools and fi nancial capacity
would help the policy makers to better position
their countries in response to expected future
challenges and risks, while capitalizing on their
countries’ strengths and opportunities. Aid and
technical assistance from international fi nancial
institutions to LDCs also have the potential to
cushion the economic shocks and lessen volatil-
ity in the LDCs’ economies as they seek to adapt
to the global forces involved in this transition.


Global Development Horizons 2011 13
Changing Growth Poles and Financial Positions
THE GLOBAL ECONOMY OF 2025 IS
likely to look signifi cantly diff erent from
that of 2011. Today’s emerging econo-
mies will, in real terms, account for 45 per-
cent of global output, compared with about 37
percent in 2011 and 30 percent in 2004. Th ese
countries will account for about as great a vol-
ume of international trade and investment fl ows
as the developed world, and the drivers of global
growth will be not only developed giants, but
also major developing countries such as China
and India, which are likely to experience rapid
growth between 2011 and 2025. Emerging econ-
omies also will hold a greater proportion of global
wealth, as measured by net international invest-
ment positions (IIPs).
Shifts in global economic power are not new.
Th roughout the trajectory of economic history,
each phase of global growth has been driven by
a small set of countries. From the start of China’s
Tang dynasty to the Ming dynasty (600–1600),
China was a dominant force in the global econ-
omy, accounting for a quarter of its output and as
much as a third of its growth. Th e Renaissance
saw the beginning of the rise of economies
in Western Europe—beginning with Italy,
Portugal, and Spain and then, with the advent of
the Industrial Revolution, Belgium, France, and
Great Britain—accompanied by a transformation
of incomes, production, and trade. In the decades
following World War II, the mutually reinforcing
engines of American innovation and strong con-
sumer demand propelled the United States to the
position of the world’s foremost economic power,
with Germany, Japan, and the former Soviet
Union also playing leading roles.
As the world exits the 2008–09 fi nancial cri-
sis, the global economy appears poised to tran-
sition to a new set of growth poles—defi ned in
this book as an economy that signifi cantly drives
global growth—with some hitherto “emerging”
economies prominent among them. Although
growth in the advanced economies remains slug-
gish—a phenomenon that has been described as
a “new normal” (El-Erian 2009)—developing
economies have recovered from the crisis and are
exhibiting robust growth. Global growth in the
fi rst quarter of the 21st century thus is likely to
be driven by the sustained rise of China, India,
and other emerging economic powerhouses.
Th is chapter explores the economic and fi nancial
implications of this shift in greater detail. The
main messages of chapter 1 are as follows:
• Under the most likely baseline global eco-
nomic scenario presented here, emerging
economies will become increasingly impor-
tant engines of global growth between 2011
and 2025. The combined real output of
six major emerging economies—Brazil,
the Russian Federation, India, Indonesia,
China, and the Republic of Korea (the
BRIICKs)—will match that of the euro
area by 2025. Growth in emerging mar-
kets will, in this scenario, average 4.7
percent over 2011–25, compared with the
developed world’s growth of 2.3 percent,
and will be accompanied by a signifi cant
realignment of consumption, investment,
and trade shares. The shares of global
trade fl ows accounted for by emerging and
advanced economies will converge rapidly,
with each group accounting for roughly
half of all global trade by 2025, contrary to
the current situation in which the advanced
economies represent the majority of both
exports and imports. In some major
1

14 Changing Growth Poles and Financial Positions Global Development Horizons 2011
way. Just as important, variations in aggre-
gate demand brought about by changes in
the configuration of the world’s growth
poles may have significant impacts on
the prospects of least developed countries
(LDCs), which are often reliant on external
demand for their growth.
• As a group, potential emerging economy growth poles are having an ever-greater impact on global investment, trade f lows, and external imbalances. Th ere have already
been tangible shifts in global trade and
investment patterns, most notably in the
greater volume of South-South fl ows. Yet
the unfolding dynamics of global imbal-
ances will depend as much on the policies
adopted by governments as they do on
private trade and capital fl ows responding
to such policies. Eff orts to promote fi nan-
cial market development, for example, can
help reduce oversaving behavior and facili-
tate adjustment in countries running very
large current account surpluses; similarly,
enhancing the business environment for
exporting can help defi cit countries rein in
their current accounts.
Growth Poles and the Global Macroeconomy in the Postcrisis EraThe emergence of new poles
In the years leading up to the global financial
crisis of 2008–09, many developing economies
were beginning to display their economic vital-
ity and dynamism. Emerging developing-world
powerhouses such as Brazil, Russia, India, and
China—the so-called BRIC economies (O’Neill
2001)—began to challenge the economic power
of the G-7, accounting for an ever-increasing
share of global trade, fi nance, and labor fl ows.
Th e fi nancial crisis has accelerated this trend.
With postcrisis economic performance in devel-
oping countries undeniably stronger than in
developed countries (developing economies as a
whole grew by 1.5 percent in 2009, compared to
a decline of 3.4 percent in developed countries)
and near-term growth forecasts suggesting that
emerging economies, these structural
changes are already under way.
• Th e changing landscape of growth drivers in the world economy points toward a distribu-tion of economic size and growth that is more diff use: a multipolar world. In the 2004–08
period, the United States, the euro area, and
China served as the world’s main growth
poles. By 2025, emerging economies, includ-
ing Brazil, India, Indonesia, and Korea—
along with advanced economies such as
Japan and the United Kingdom—are likely
to join these three poles in accounting for
much of the world’s growth activity. But to
sustain their growth momentum and serve
as true growth poles, emerging economies
will need to undertake structural changes
that will generate self-sustaining, internally
driven growth through a combination of
sustained productivity advances and robust
domestic demand. Th is undertaking calls
for saving rates consistent with investment
opportunities, capital that is effi ciently allo-
cated and utilized, and the ability not only
to adopt new technologies but also to drive
innovation.
• The potential emerging economy growth poles are far from a monolithic group, with their rapid rise to power characterized by the diversity of their development pathways. East
Asian growth poles, such as China and
Korea, historically have been heavily reli-
ant on exports to drive growth, whereas
in Latin American growth poles, such as
Brazil and Mexico, domestic consump-
tion has been more important. With the
emergence of a substantial middle class
in developing countries and demographic
transitions underway in several major East
Asian economies, stronger consumption
trends are likely to prevail, which in turn
can serve as a source of sustained global
growth. Strong investment trends also have
the potential to drive global growth going
forward, and to increase productivity in
emerging economies. In many large emerg-
ing economies, the structural changes that
will drive changes in their consumption
and investment trends are already under

Global Development Horizons 2011 Changing Growth Poles and Financial Positions 15
developing and emerging economies will con-
tinue to expand considerably faster than their
high-income counterparts, the global growth
poles are beginning to expand beyond developed
economies.
China and India are likely to be the main fl ag
bearers among emerging market growth poles in
the years ahead. Th is is especially so for China,
which overtook Japan as the world’s second-
largest economy in 2010 and Germany as the
world’s largest exporter in 2009. In the medium
term, the proportion of global economic growth
represented by other emerging countries such as
Brazil, Indonesia, Korea, and Russia likely will
increase dramatically. Together with China and
India, these countries—epitomized by the BRIC
economies but not limited to them—will increas-
ingly become the world’s major consumers, inves-
tors, and exporters, aff ecting both the developed
world and the LDCs with which they interact.
From poles to the periphery: Channels by which poles drive global growth
Although widely used in the policy commu-
nity, the term “growth pole” remains somewhat
ambiguously defi ned (box 1.1). Th is book con-
ceives of a growth pole as an economy whose
growth spills over to—and thus helps drive—the
growth process in other economies. To that end,
this book applies a quantitatively based defi nition
that depends on the contribution of the economy
to global growth, adjusted by the strength of
linkages from domestic to global growth.1 In this
fashion, a growth pole not only is a hive of eco-
nomic activity, but also is able to stimulate eco-
nomic activity in the countries with which it has
strong links.
Because the focus of this chapter is on the
transmission of real economic growth (and asso-
ciated implications of this growth for economic
policy), the defi nition of a growth pole employed
here departs from definitions of polarity and
distribution of power that are more commonly
found in fields of study such as political sci-
ence and international relations (Felsenthal and
Machover 1998; Mansfield 1993).2 The distri-
bution of economic infl uence, nonetheless, has
practical implications for issues of international
policy coordination, policy choices, and inter-
national monetary relations, all of which are
addressed in chapter 3.
A number of economic transmission channels
are supported by both theory and empirical evi-
dence. Since technological progress is a key driver
of sustainable, long-run growth (Romer 1990;
Solow 1956), channels of technological diffu-
sion are central to growth spillovers. Th ese chan-
nels include fl ows of knowledge through trade,
finance, and migration, as well as more direct
transfers of technology embedded in physical
capital and technological knowledge embodied
in human capital (fi gure 1.1). For example, for-
eign direct investment (FDI) from the United
States to China may lead to indirect technology
transfer via the building of U.S.-designed manu-
facturing plants and equipment, although a more
direct transfer of know-how may occur in the use
of capital-intensive technology; through train-
ing of operational line workers, back-offi ce staff ,
and management; and through learning by local
suppliers.
In addition to technological diff usion, growth
spillovers can be promoted through the transfer
of institutional advances that shape incentives to
develop or adopt new technologies, or through
the release of constraints that prohibit the adop-
tion of technologies (Acemoglu, Johnson, and
Robinson 2005; Rodrik, Subramanian, and
Trebbi 2004). Although such transfer of insti-
tutional practices is undoubtedly important, the
transfer tends to come about slowly and often is
diffi cult to measure accurately.
To some extent, the transfer of institutional
practices can be captured indirectly in data on a
potential growth pole’s growth rate and economic
size. It is plausible that when reform of economic
institutions promotes growth, people in other
countries take notice and demand similar reforms
of their governments. Moreover, the larger the
economy in which the reforms and growth take
place, and the more rapid the growth, the more
conscious people in other countries likely will be
of these events, assuming all else is held constant.
Trade, capital fl ows (particularly FDI), and inter-
national migration also may facilitate some trans-
fer of institutional advances, reinforcing the more

16 Changing Growth Poles and Financial Positions Global Development Horizons 2011
traditional knowledge and technological transfer
roles of these channels.
Trade is a major channel by which growth is
propagated from growth poles to periphery econ-
omies. Th e more commercial exchange domestic
fi rms have with foreign fi rms, the more industrial
and technological knowledge the domestic fi rms
In this book, a growth pole is defi ned as an economy
whose domestic growth helps drive the growth pro-
cess in other economies. This defi nition is motivated
in part by a desire to focus on the importance of eco-
nomic dynamism and progress—the “growth” part of
the expression—while capturing the important role of
spillover externalities, knowledge transfer, and gains
from exchange (the “pole” part of the term). However,
given the lack of consensus on the definition of a
“growth pole,” it is useful to examine alternative con-
ceptualizations of the term.
The term “growth pole” was fi rst introduced in the
context of economic growth by François Perroux in
1949. Initially, the expression was used in reference to
agglomerations of fi rms or industries in which growth
is concentrated and that had linkages to each other
and to peripheral fi rms. Since then, the term has been
applied to an increasingly varied set of related con-
cepts, with “growth pole” quickly taking on a spatial or
geographic dimension. These concepts differ mainly in
terms of the space in which poles are identifi ed. In dis-
cussions of regional development policy, for example,
cities where economic growth is concentrated came to
be known as growth poles, with the aspects of verti-
cal linkages and external economies of scale remaining
central to the concept. In fact, the study of tensions
between forces supporting greater agglomeration ver-
sus specialization spawned the fi eld of economic geog-
raphy (Fujita, Krugman, and Venables 1999; World Bank
2009b).
The idea of growth polarity then became extended
to the global scale, while simultaneously becoming
somewhat enmeshed with the concept of polarity—
sites of concentration of geopolitical power and infl u-
ence—being developed in the international relations
literature. This connection is due in part to the intuitive
idea that geopolitical infl uence stems ultimately from
economic size; still, to clearly defi ne a “growth pole,”
the concept must be unlinked from that of geopolitical
infl uence per se. The concept of global growth poles
also differs somewhat from the idea of growth poles
conceptualized in regional, national, or geographic
space, to the extent that the nature of international eco-
nomic linkages differs from linkages within national or
regional economies, and not merely in terms of scale.
Even when a global scale is specifi ed, the expres-
sion “growth pole” is not always used consistently.
Some generalizations, however, can be made as to
the term’s qualitative meaning. In this book, a global
growth pole is broadly defined as an economy in
which global growth is signifi cantly concentrated and
that drives growth in other economies suffi ciently to
have an impact on the growth of the world economy
as a whole. Thus, a quantitatively based defi nition of a
global growth pole depends on the growth rate of the
economy relative to the growth rate of the world econ-
omy, and on the strength of linkages between domes-
tic and global growth (see annex 1.1).
In establishing this defi nition for identifying global
growth poles, countries are the natural units to con-
sider, mainly due to aggregation of relevant data at the
country level. However, in some special cases in which
a group of countries is highly integrated—as is the case
for an economic and monetary union, for example—
it is probably justifiable to consider the entire group
as a potential pole. If this approach is taken, clearly
defi ned criteria are required to group countries consis-
tently. This book aggregates the economies of the euro
area, the two CFA franc zones (independently), the
Eastern Caribbean dollar zone, and the South African
Multilateral Monetary Area as single economic units. In
addition, China and its special administrative regions of
Hong Kong and Macao are classifi ed as a single eco-
nomic unit.
BOX 1.1 What is a growth pole? Defi ning poles in theory and practice
acquire; hence, the evolution of technological
progress and comparative advantage are inter-
linked and jointly determined (Grossman and
Helpman 1991a). Trade in intermediate goods
may function as a channel of technology diff usion
and spillover in a second, weaker way: intermedi-
ate goods embody technologies, so importation

Global Development Horizons 2011 Changing Growth Poles and Financial Positions 17
GROWTHBENEFICIARY
GROWTHBENEFICIARY
DIRECTCHANNEL
TRADECHANNEL
FINANCIALCHANNEL
MIGRATIONCHANNEL
Emigration & knowledge transfer
Migrantnetwork
Importabsorption
Technologytransfer
Technologytransfer
Portfolio capitaland FDI
Institutionalinnovation
GROWTHPOLE
GROWTHBENEFICIARY
GROWTHBENEFICIARY
Factortechnology
F IGURE 1.1 Channels of growth spillovers from a growth pole
Source: World Bank staff calculations.
Note: Arrows point to direction of fl ow, whereby growth from a pole can infl uence growth elsewhere, while annotations indicate the specifi c growth stimuli transferred to the benefi ciary of the pole.
of intermediate goods can reduce costs of prod-
uct development and production of new prod-
ucts (Eaton and Kortum 2002; Grossman and
Helpman 1991b; Rivera-Batiz and Romer 1991).
Th e broad implication that trade is an impor-
tant channel of technology diff usion is supported
by a small body of empirical research. For exam-
ple, in East Asian economies, firm openness is
associated with subsequent advantages in fi rm-
level productivity (Hallward-Driemeier, Iarossi,
and Sokoloff 2002). Although empirical support
is greater for importation than for exportation
as a signifi cant channel of technology diff usion
to the country in question, a growth pole nev-
ertheless may drive growth in a periphery econ-
omy simply by absorbing its exports and driving
expansion of exporting industries. Exportation
also is associated with intraindustry reallocation
of production from low-productivity firms to
high- productivity fi rms and, in some industries,
with market size eff ects stemming from increas-
ing returns to scale (Krugman 1979; Melitz
2003). Th us, it is possible that growth is driven by
bidirectional trade—that is, by importing from a
growth pole and by exporting to a pole.
Capital f lows, particularly FDI, have the
potential to be an important channel of techno-
logical diff usion. FDI fl ows from multinational
parent companies to subsidiaries (or greenfield
investments) have the potential to directly trans-
fer technological knowledge, or at least result in
indirect knowledge transfers from subsidiaries
to other fi rms in the host country through labor
turnover or technology embedded in intermediate

18 Changing Growth Poles and Financial Positions Global Development Horizons 2011
(Griffi th, Redding, and Simpson 2004; Haskel,
Pereira, and Slaughter 2007). In some cases,
there is also evidence of vertical spillovers. In
Lithuania, for example, technological spillovers
from FDI occur through backward linkages from
partly foreign-owned fi rms to their domestic sup-
pliers, but not from fully foreign-owned firms
(Javorcik 2004).
Given that technological knowledge is diffi-
cult or impossible to codify fully, meaning that
some technological knowledge is transferred only
from person to person, the mobility of labor also
plays a role in promoting knowledge spillovers.
Empirical evidence supports the hypothesis that
both migration and short-term business travel
facilitate diff usion of tacit technological knowl-
edge. International labor mobility promotes not
only knowledge fl ows to the fi rms that hire immi-
grants, but also knowledge spillovers to other
fi rms in the economy (Hovhannisyan and Keller
2010; Kim, Lee, and Marschke 2009; Oettl and
Agrawal 2008). Th e stock of migrants may induce
network eff ects from increased trade and knowl-
edge transfer (Kerr 2008; Kerr and Lincoln 2010;
Rauch 2001) and serve as a source of growth for
the recipient nation, as migrants tend to be self-
selected as industrious and seeking opportunity
(McCraw 2010). Historically, emigration has been
associated with the onset of modern economic
growth in Europe—a phenomenon sometimes
termed the “mobility transition” (Hatton 2010).
Evolving growth poles in the global economy
Over the course of two millennia, large swings in
global growth leadership have occurred. Until the
first half of the second millennium, China and
India were the world’s predominant growth poles.3
Starting in the 1500s, Western Europe began its
unrelenting rise, accounting for a rising share of
total global output (Maddison 2007) and playing
a growing role in shaping global growth dynamics.
Th is is evident from examining these countries’
simple polarity index, which measures a country’s
contribution to global growth (fi gure 1.2).4
Although Western Europe retained its position
as the predominant growth pole through much of
the fi rst half of the 20th century—in large part
goods and services (Du, Harrison, and Jeff erson
2011; Ethier 1986; Fosfuri, Motta, and Rønde
2001; Markusen 2004; Rodríguez-Clare 1996).
FDI also may promote growth through channels
other than technology diffusion, such as real-
location of production to the most productive
sectors within an economy or to the most produc-
tive fi rms within sectors. More broadly, fi nancial
openness can promote growth, especially when
such liberalization is combined with complemen-
tary institutional reform, which spurs domestic
fi nancial market development and fosters growth
(Beck and Levine 2005; Quinn and Toyoda
2008). Th us, capital fl ows, indeed, can be another
important channel through which growth poles
drive global growth.
Th e empirical evidence that FDI is an impor-
tant channel of technological diff usion is some-
what mixed. Large intraindustry spillovers are
found primarily in case studies of high- technology
FDI projects, as in the case of microchip-maker
Intel in Costa Rica (Larraín, López-Calva, and
Rodríguez-Clare 2001) and other technology sec-
tors (Keller and Yeaple 2009). Firm-level studies
using broader industry samples typically find
evidence of only small intraindustry spillovers
Western Europe
formerUSSR
UnitedStates
ChinaIndia
Japan
0
20
40
60
80
100
1–99
9
1000
–149
9
1500
–181
9
1820
–186
9
1870
–191
2
1913
–194
9
1950
–197
9
1980
–200
8
sim
ple
po
lari
ty in
dex
FIGURE 1 .2 Historical evolution of simple growth polarity, selected economies, 1–2008
Source: World Bank staff calculations, from Maddison 2003.
Note: The simple polarity index was calculated from size-weighted (compound) GDP growth rates measured in 1990 international Geary-Khamis dollars normalized to the maximum and minimum of the f ull 1–2008 period.
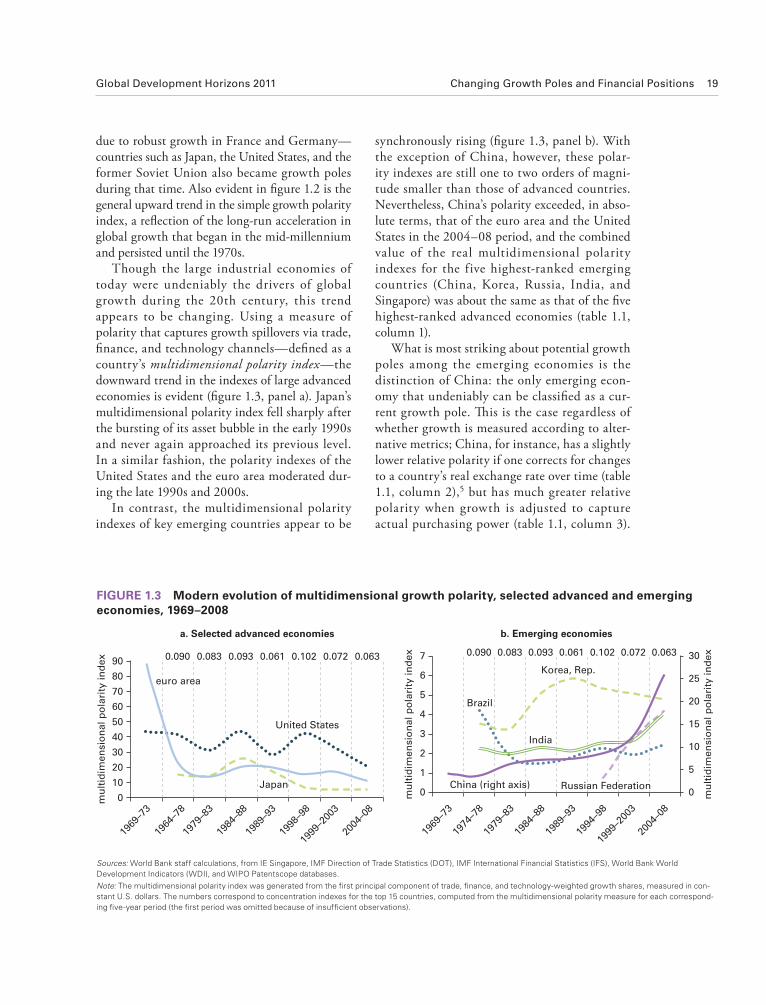
Global Development Horizons 2011 Changing Growth Poles and Financial Positions 19
due to robust growth in France and Germany—
countries such as Japan, the United States, and the
former Soviet Union also became growth poles
during that time. Also evident in fi gure 1.2 is the
general upward trend in the simple growth polarity
index, a refl ection of the long-run acceleration in
global growth that began in the mid-millennium
and persisted until the 1970s.
Though the large industrial economies of
today were undeniably the drivers of global
growth during the 20th century, this trend
appears to be changing. Using a measure of
polarity that captures growth spillovers via trade,
fi nance, and technology channels—defi ned as a
country’s multidimensional polarity index—the
downward trend in the indexes of large advanced
economies is evident (fi gure 1.3, panel a). Japan’s
multidimensional polarity index fell sharply after
the bursting of its asset bubble in the early 1990s
and never again approached its previous level.
In a similar fashion, the polarity indexes of the
United States and the euro area moderated dur-
ing the late 1990s and 2000s.
In contrast, the multidimensional polarity
indexes of key emerging countries appear to be
synchronously rising (fi gure 1.3, panel b). With
the exception of China, however, these polar-
ity indexes are still one to two orders of magni-
tude smaller than those of advanced countries.
Nevertheless, China’s polarity exceeded, in abso-
lute terms, that of the euro area and the United
States in the 2004–08 period, and the combined
value of the real multidimensional polarity
indexes for the five highest-ranked emerging
countries (China, Korea, Russia, India, and
Singapore) was about the same as that of the fi ve
highest-ranked advanced economies (table 1.1,
column 1).
What is most striking about potential growth
poles among the emerging economies is the
distinction of China: the only emerging econ-
omy that undeniably can be classifi ed as a cur-
rent growth pole. Th is is the case regardless of
whether growth is measured according to alter-
native metrics; China, for instance, has a slightly
lower relative polarity if one corrects for changes
to a country’s real exchange rate over time (table
1.1, column 2),5 but has much greater relative
polarity when growth is adjusted to capture
actual purchasing power (table 1.1, column 3).
0.090 0.083 0.093 0.061 0.102 0.072 0.063
0
1
2
3
4
5
6
7
1969
–73
1974
–78
1979
–83
1984
–88
1989
–93
1994
–98
1999
–200
3
2004
–08
mu
ltid
imen
sio
nal p
ola
rity
in
dex
mu
ltid
imen
sio
nal p
ola
rity
in
dex
0
5
10
15
20
25
300.090 0.083 0.093 0.061 0.102 0.072 0.063
0
10
20
30
40
50
60
70
80
90
1969
–73
1964
–78
1979
–83
1984
–88
1989
–93
1998
–98
1999
–200
3
2004
–08
mu
ltid
imen
sio
nal p
ola
rity
in
dex
a. Selected advanced economies b. Emerging economies
euro areaeuro area
Japan
Korea, Rep.Korea, Rep.
India
Brazil
China (right axis) Russian Federation
United StatesUnited States
FIGURE 1.3 Modern evolution of multidimensional growth polarity, selected advanced and emerging economies, 1969–2008
Sources: World Bank staff calculations, from IE Singapore, IMF Direction of Trade Statistics (DOT), IMF International Financial Statistics (IFS), World Bank World Development Indicators (WDI), and WIPO Patentscope databases.
Note: The multidimensional polarity index was generated from the fi rst principal component of trade, fi nance, and technology-weighted growth shares, measured in con-stant U.S. dollars. The numbers correspond to concentration indexes for the top 15 countries, computed from the multidimensional polarity measure for each correspond-ing fi ve-year period (the fi rst period was omitted because of insuffi cient observations).
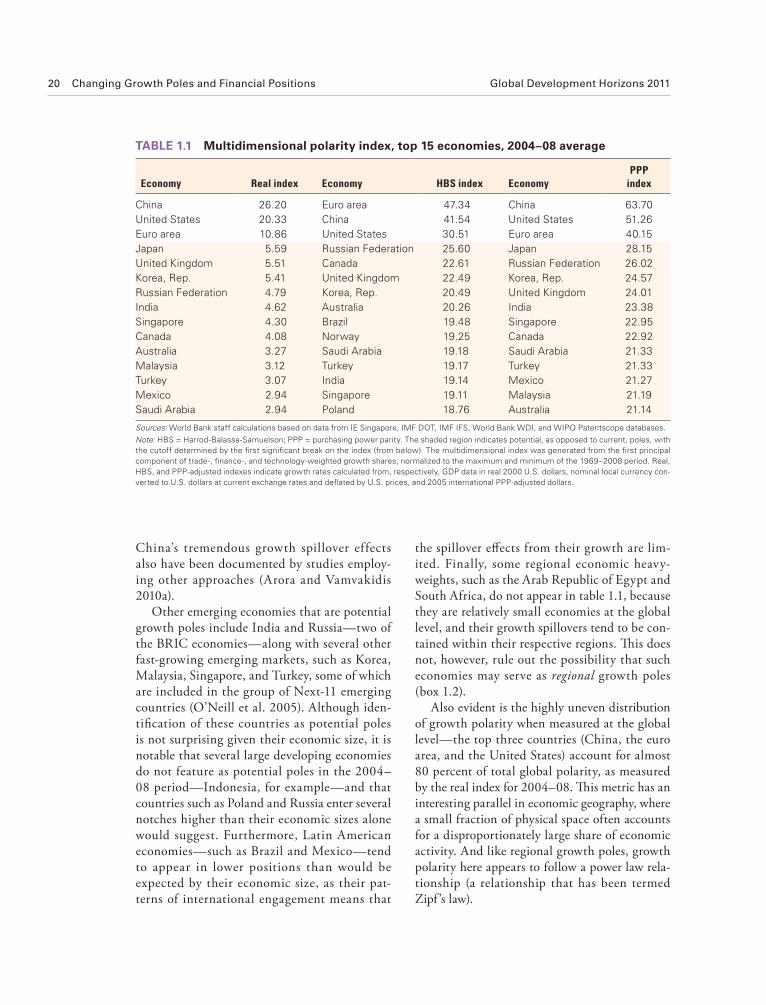
20 Changing Growth Poles and Financial Positions Global Development Horizons 2011
the spillover eff ects from their growth are lim-
ited. Finally, some regional economic heavy-
weights, such as the Arab Republic of Egypt and
South Africa, do not appear in table 1.1, because
they are relatively small economies at the global
level, and their growth spillovers tend to be con-
tained within their respective regions. Th is does
not, however, rule out the possibility that such
economies may serve as regional growth poles
(box 1.2).
Also evident is the highly uneven distribution
of growth polarity when measured at the global
level—the top three countries (China, the euro
area, and the United States) account for almost
80 percent of total global polarity, as measured
by the real index for 2004–08. Th is metric has an
interesting parallel in economic geography, where
a small fraction of physical space often accounts
for a disproportionately large share of economic
activity. And like regional growth poles, growth
polarity here appears to follow a power law rela-
tionship (a relationship that has been termed
Zipf ’s law).
China’s tremendous growth spillover effects
also have been documented by studies employ-
ing other approaches (Arora and Vamvakidis
2010a).
Other emerging economies that are potential
growth poles include India and Russia—two of
the BRIC economies—along with several other
fast-growing emerging markets, such as Korea,
Malaysia, Singapore, and Turkey, some of which
are included in the group of Next-11 emerging
countries (O’Neill et al. 2005). Although iden-
tifi cation of these countries as potential poles
is not surprising given their economic size, it is
notable that several large developing economies
do not feature as potential poles in the 2004–
08 period—Indonesia, for example—and that
countries such as Poland and Russia enter several
notches higher than their economic sizes alone
would suggest. Furthermore, Latin American
economies—such as Brazil and Mexico—tend
to appear in lower positions than would be
expected by their economic size, as their pat-
terns of international engagement means that
TABL E 1.1 Multidimensional polarity index, top 15 economies, 2004–08 average
Economy Real index Economy HBS index EconomyPPP
index
China 26.20 Euro area 47.34 China 63.70
United States 20.33 China 41.54 United States 51.26
Euro area 10.86 United States 30.51 Euro area 40.15
Japan 5.59 Russian Federation 25.60 Japan 28.15
United Kingdom 5.51 Canada 22.61 Russian Federation 26.02
Korea, Rep. 5.41 United Kingdom 22.49 Korea, Rep. 24.57
Russian Federation 4.79 Korea, Rep. 20.49 United Kingdom 24.01
India 4.62 Australia 20.26 India 23.38
Singapore 4.30 Brazil 19.48 Singapore 22.95
Canada 4.08 Norway 19.25 Canada 22.92
Australia 3.27 Saudi Arabia 19.18 Saudi Arabia 21.33
Malaysia 3.12 Turkey 19.17 Turkey 21.33
Turkey 3.07 India 19.14 Mexico 21.27
Mexico 2.94 Singapore 19.11 Malaysia 21.19
Saudi Arabia 2.94 Poland 18.76 Australia 21.14
Sources: World Bank staff calculations based on data from IE Singapore, IMF DOT, IMF IFS, World Bank WDI, and WIPO Patentscope databases.
Note: HBS = Harrod-Balassa-Samuelson; PPP = purchasing power parity. The shaded region indicates potential, as opposed to current, poles, with the cutoff determined by the fi rst signifi cant break on the index (from below). The multidimensional index was generated from the fi rst principal component of trade-, fi nance-, and technology-weighted growth shares, normalized to the maximum and minimum of the 1969–2008 period. Real, HBS, and PPP-adjusted indexes indicate growth rates calculated from, respectively, GDP data in real 2000 U.S. dollars, nominal local currency con-verted to U.S. dollars at current exchange rates and defl ated by U.S. prices, and 2005 international PPP-adjusted dollars.

Global Development Horizons 2011 Changing Growth Poles and Financial Positions 21
The definition of growth pole used in this book
focuses on the spillover effects that an economy’s
growth induces on the global level. One implication of
such a defi nition is that smaller or less globally inte-
grated economies that may well be signifi cant driv-
ers at a regional level—but exert a relatively marginal
impact at the global level—will not generally be iden-
tifi ed as growth poles. While this exclusion is entirely
appropriate for examining the phenomenon of global
multipolarity, it is nevertheless interesting to explore
growth polarity within geographical regions, espe-
cially since regional poles can have a strong infl uence
on the economic prospects of LDCs.
Table B.1.2.1 summarizes these regional indexes.
As might be expected, economies that drive growth at
the global level tend to appear as growth poles for their
regions as well. However, since the relative importance
of an economy in driving regional growth may differ
from its global impact, the relative positions of econo-
mies—as measured by regional growth polarity—may
not correspond to their global ones. For example, Brazil
appears to be more important in Latin America than
Mexico, even though Mexico places higher globally, as
reported in table 1.1.
The most notable aspect of the information pre-
sented in the table below is that economies that are
otherwise “crowded out” in terms of their role as global
growth poles can nevertheless play an important role
at the regional level in driving growth. South Africa, for
example, is far and away the most important regional
growth pole in the Sub-Saharan Africa region, a fi nd-
ing that has been echoed in the literature (Arora and
Vamvakidis 2010b). Indeed, for the 2004–08 period,
South Africa’s simple polarity index is one-and-a-half
times more than that of the next-largest regional growth
pole in Sub- Saharan Africa, Nigeria. Another factor that
is important when taking into account regional consid-
erations is how regional economic blocs may, if suffi -
ciently integrated, serve as growth poles in their own
right. While this topic is not explored in detail in this
book, it is entirely conceivable that an integrated eco-
nomic grouping, such as the Gulf Cooperation Council,
may be a regional (or even global) growth pole.
These fi ndings underscore the importance of under-
standing the distinction between a global growth pole
and a regional one. Since the channels of growth spill-
overs may differ from one region to another, and from a
regional to a global level, economies that are important
at one level may be less so at another. Also important is
that these differences suggest that spillovers in growth
are complex and dynamic, and hence any given “rank-
ing” of growth poles, including the ones reported here,
should be treated as suggestive in the context that they
are defi ned.
BO X 1.2 Growth poles at the regional level
TABLE B1.2.1 Regional simple polarity index, top three countries, 2004–08 average
Country Simple index Country Simple index Country Simple index
Sub-Saharan Africa East Asia and Pacifi c Eastern Europe and Central Asia
South Africa 63.90 China 98.87 Russian Federation 69.44
Nigeria 41.42 Korea, Rep. 12.68 Turkey 64.18
Angola 27.57 Indonesia 5.70 Czech Republic 48.95
Latin America and the Caribbean Middle East and North Africa South Asia
Brazil 45.60 Saudi Arabia 28.26 India 100.00
Argentina 33.84 Iran 26.12 Bangladesh 10.96
Mexico 24.42 Egypt, Arab Rep. 25.71 Pakistan 8.52
Source: World Bank staff calculations based on data from World Bank WDI database.
Note: The regional multidimensional index was generated from the size-weighted growth rate calculated from GDP data in real 2000 U.S. dollars, by region, normalized to the maximum and minimum of the 1969–2008 period. To minimize distortion of the index, the normalization for ECA excludes Russian data for 1994–96. The values reported for South Asia should be interpreted with caution, since data limitations mean that the indexes are cal-culated only for four economies. Indexes are not comparable across regions.

22 Changing Growth Poles and Financial Positions Global Development Horizons 2011
The most natural candidates for explanatory variables
to include in any regression of growth polarity are
those that have been identifi ed in the cross- country
growth literature. However, there are dozens of such
potential regressors, with little consensus on which
variables are the most important. Such factors can be
classifi ed into two broad categories: proximate and
fundamental.
As many as a quarter of all proximate factors
examined in the literature have been identifi ed as sig-
nifi cantly and robustly related to growth, per se. The
strongest evidence, as suggested by an augmented
Solow growth model, comes from population growth,
physical capital investment, and level of schooling
(Mankiw, Romer, and Weil 1992). Other proximate fac-
tors that have been found to be relatively more impor-
tant include the quality of a country’s infrastructure, the
health of its population, the dependency ratio, and the
size of its government (Sala-i-Martin, Doppelhofer, and
Miller 2004).
The set of fundamental factors, while smaller and
possibly more eclectic, often are regarded as more cen-
tral to explaining long-run income patterns. The case
has variously (and convincingly) been made that fac-
tors such as institutional quality, economic integration,
geography, ethnolinguistic fractionalization, human cap-
ital, and social capital matter (Acemoglu, Johnson, and
Robinson 2005; Alesina et al. 2003; Frankel and Romer
1999; Gallup, Sachs, and Mellinger 1999; Glaeser et al.
2004; Knack and Keefer 1997; Rodrik, Subramanian,
and Trebbi 2004).
By and large, econometric analysis (described in
detail in annex 1.3) fi nds that the most reliable corre-
late of multidimensional growth polarity at the proxi-
mate level is educational attainment. This result is
consistent with the theoretical literature that stresses
the centrality of human capital for the growth process
(Bils and Klenow 2000; Mankiw, Romer, and Weil
1992). Physical capital investment also appears to
contribute positively to a country being a growth pole,
BOX 1.3 Proximate and fundamental factors related to multidimensional growth polarity
Like economic growth itself, growth polar-
ity is infl uenced by both proximate and fun-
damental factors. In determining what factors
are supportive of growth polarity, therefore, it
is useful to disentangle these distinct classes
of inf luences. Proximate factors include the
standard ingredients that one might expect to
be associated with strong economic growth,
such as increased capital accumulation and
population growth. Underlying these factors
are “deeper” structural factors, such as the
strength of the country’s institutions and the
extent to which a country’s geography favors
growth. Formal econometric analysis (reported
in box 1.3) suggests that the proximate factors
of importance include physical capital, educa-
tion attainment, the dependency ratio, and the
population’s health, while institutional quality
and economic integration are key fundamental
factors.
Changing multipolarity in the world economy
What do the changing polarities mean for the
distribution of economic infl uence in the global
economy as a whole? To the extent that growth
polarity is an accurate measure of such inf lu-
ence, it is possible to compute a concentration
index that summarizes the degree of multipolar-
ity in the global economy.6 Such a multipolarity index—calculated from shares of growth polar-
ity and scaled between 0 (totally diff used growth
polarity) and 1 (fully concentrated growth
polarity)—suggests that multipolarity increased
steadily through the end of the Cold War, fell
during the final decade of the 20th century,
before fi nally rising again in the fi rst decade of
the 21st century. Indeed, over the past decade,
the world has attained some of the most diverse
distributions since 1968 (fi gure 1.4).7,8
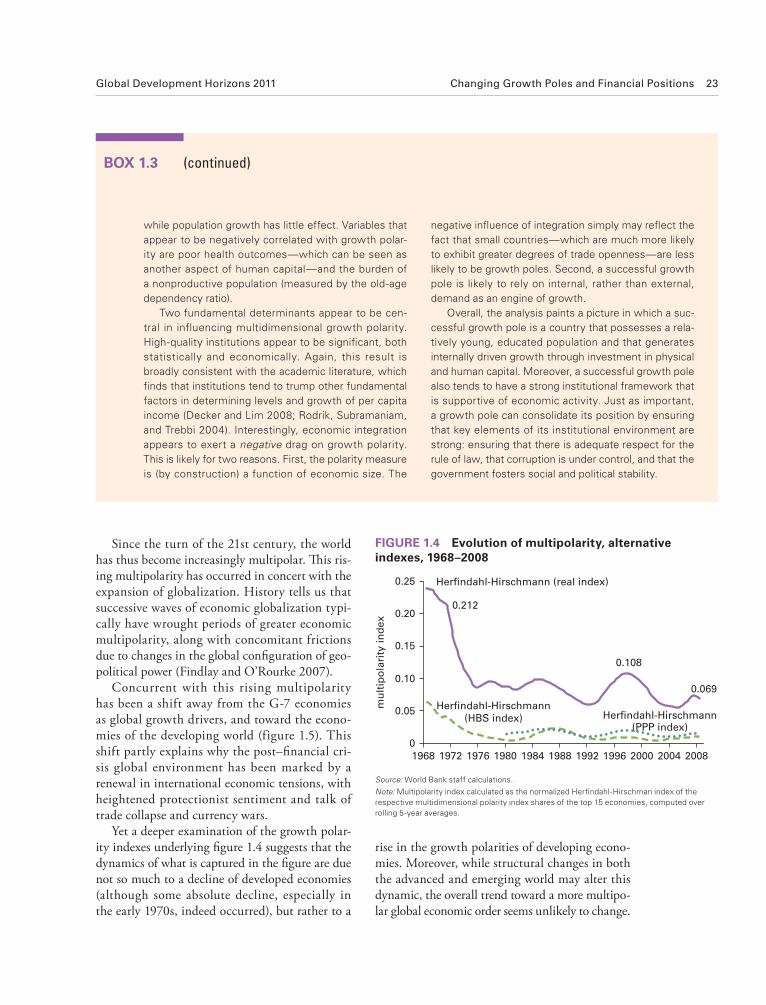
Global Development Horizons 2011 Changing Growth Poles and Financial Positions 23
Since th e turn of the 21st century, the world
has thus become increasingly multipolar. Th is ris-
ing multipolarity has occurred in concert with the
expansion of globalization. History tells us that
successive waves of economic globalization typi-
cally have wrought periods of greater economic
multipolarity, along with concomitant frictions
due to changes in the global confi guration of geo-
political power (Findlay and O’Rourke 2007).
Concurrent with this rising multipolarity
has been a shift away from the G-7 economies
as global growth drivers, and toward the econo-
mies of the developing world (figure 1.5). This
shift partly explains why the post–fi nancial cri-
sis global environment has been marked by a
renewal in international economic tensions, with
heightened protectionist sentiment and talk of
trade collapse and currency wars.
Yet a deeper examination of the growth polar-
ity indexes underlying fi gure 1.4 suggests that the
dynamics of what is captured in the fi gure are due
not so much to a decline of developed economies
(although some absolute decline, especially in
the early 1970s, indeed occurred), but rather to a
0.212
0.108
0.069
0
0.05
0.10
0.15
0.20
0.25
1968 1972 1976 1980 1984 1988 1992 1996 2000 2004 2008
mu
ltip
ola
rity
in
dex
Herfindahl-Hirschmann (real index)
Herfindahl-Hirschmann(PPP index)
Herfindahl-Hirschmann(HBS index)
FIGURE 1.4 Evolution of multipolarity, alternative indexes, 1968–2008
Source: World Bank staff calculations.
Note: Multipolarity index calculated as the normalized Herfi ndahl-Hirschman index of the respective multidimensional polarity index shares of the top 15 economies, computed over rolling 5-year averages.
while population growth has little effect. Variables that
appear to be negatively correlated with growth polar-
ity are poor health outcomes—which can be seen as
another aspect of human capital—and the burden of
a nonproductive population (measured by the old-age
dependency ratio).
Two fundamental determinants appear to be cen-
tral in influencing multidimensional growth polarity.
High-quality institutions appear to be signifi cant, both
statistically and economically. Again, this result is
broadly consistent with the academic literature, which
fi nds that institutions tend to trump other fundamental
factors in determining levels and growth of per capita
income (Decker and Lim 2008; Rodrik, Subramaniam,
and Trebbi 2004). Interestingly, economic integration
appears to exert a negative drag on growth polarity.
This is likely for two reasons. First, the polarity measure
is (by construction) a function of economic size. The
negative infl uence of integration simply may refl ect the
fact that small countries—which are much more likely
to exhibit greater degrees of trade openness—are less
likely to be growth poles. Second, a successful growth
pole is likely to rely on internal, rather than external,
demand as an engine of growth.
Overall, the analysis paints a picture in which a suc-
cessful growth pole is a country that possesses a rela-
tively young, educated population and that generates
internally driven growth through investment in physical
and human capital. Moreover, a successful growth pole
also tends to have a strong institutional framework that
is supportive of economic activity. Just as important,
a growth pole can consolidate its position by ensuring
that key elements of its institutional environment are
strong: ensuring that there is adequate respect for the
rule of law, that corruption is under control, and that the
government fosters social and political stability.
BOX 1.3 (continued)
rise in the growth polarities of developing econo-
mies. Moreover, while structural changes in both
the advanced and emerging world may alter this
dynamic, the overall trend toward a more multipo-
lar global economic order seems unlikely to change.
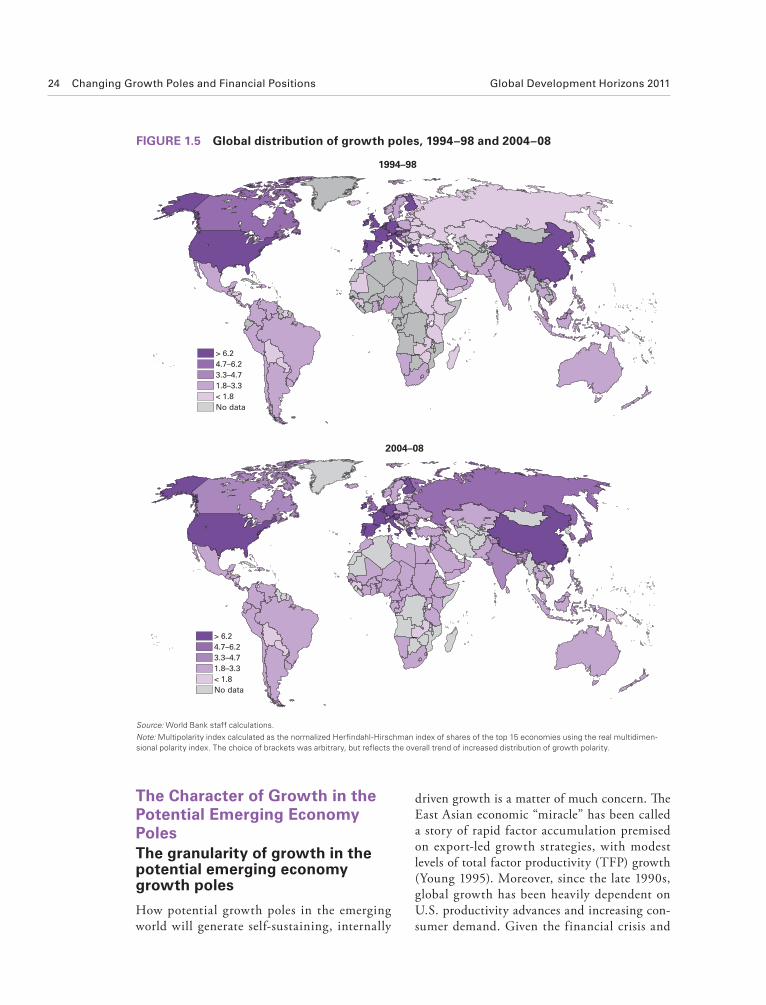
24 Changing Growth Poles and Financial Positions Global Development Horizons 2011
driven growth is a matter of much concern. Th e
East Asian economic “miracle” has been called
a story of rapid factor accumulation premised
on export-led growth strategies, with modest
levels of total factor productivity (TFP) growth
(Young 1995). Moreover, since the late 1990s,
global growth has been heavily dependent on
U.S. productivity advances and increasing con-
sumer demand. Given the financial crisis and
The Character of Growth in the Potential Emerging Economy PolesThe granularity of growth in the potential emerging economy growth poles
How potential growth poles in the emerging
world will generate self-sustaining, internally
> 6.24.7–6.23.3–4.71.8–3.3< 1.8No data
2004–08
FIGURE 1 .5 Global distribution of growth poles, 1994–98 and 2004–08
Source: World Bank staff calculations.
Note: Multipolarity index calculated as the normalized Herfi ndahl-Hirschman index of shares of the top 15 economies using the real multidimen-sional polarity index. The choice of brackets was arbitrary, but refl ects the overall trend of increased distribution of growth polarity.
> 6.2
1994–98
4.7–6.2
3.3–4.7
1.8–3.3
< 1.8
No data
Global Development Horizons 2011 Changing Growth Poles and Financial Positions 25
The evolution of total factor productivity in the potential emerging economy poles
Th e distinct trends in technological and resource
utilization, effi ciency, and innovation among the
potential emerging economy poles belie the broad
advances that have been made in terms of growth
by the group as a whole. China (and, to a lesser
extent, India) has seen substantial contributions
from TFP to its growth since the mid-1960s, and,
during their recent histories, so have Poland and
Russia. Similar contributions have not prevailed
in Latin American economies, however, and also
have been relatively modest in emerging econo-
mies such as Indonesia, Malaysia, and South
Africa (fi gure 1.6). In Argentina and Brazil, con-
tributions of TFP to growth have routinely tipped
into negative territory (with contributions over
the entire period averaging −8 percent and −37
percent, respectively). In Indonesia and Malaysia,
the growth rate of TFP was relatively low over
most of the period.10 Th e laggard contribution
of TFP in many of these fast-growing emerging
markets has been repeatedly pointed out in the
literature (Cole et al. 2005; Young 1995).11
To better understand the disparate TFP per-
formance of emerging economies, it is useful to
draw a distinction between technological innova-
tion and technological adoption. In the context
of growth, innovation is probably best under-
stood as advances in science and technology that
enhance productivity and growth by moving the
production possibilities frontier outward. Th e sort
of innovation typically produced by scientists and
engineers often generates spillover eff ects to the
larger economy and, as such, is well captured by
measures of research activity. In contrast, adop-
tion of innovations involves the use of existing
technologies that induce improvements in techni-
cal effi ciency. Adoption generally falls within the
domain of entrepreneurs and businesses, and usu-
ally has aggregate growth benefi ts only when it is
suffi ciently widespread across the economy (when
diff usion is high).12 Technological adoption and
diff usion are likely better measured by the dis-
tance between the economywide deployment of a
given technology to the research frontier, whether
subsequent recession in the United States, how-
ever, U.S. consumers are unlikely to sustain
this pattern of strong demand in the foreseeable
future.
In the long run, an economy will continue
to be a growth pole only if it is able to nurture
its innovative and productive capacity—which
drives its growth process—while simultane-
ously developing its sources of internal demand,
so that its growth will also support growth else-
where. Consequently, sustainable growth in the
potential emerging economy growth poles will
require both that TFP make a signifi cant contri-
bution to growth and that domestic consump-
tion or investment be maintained at strong but
sustainable levels. Only when growth matures
in this balanced fashion can growth poles be
resilient to global shocks and continue to drive
the global economy forward during turbulent
times.
The task ahead of the potential emerging
economy poles is formidable. Between 2005 and
2009, the TFP contribution to growth in many of
the East Asian tiger economies has been modest
at best (and negative in some cases). Demand in
China, India, and Korea also appears to be more,
rather than less, reliant on external sources over
time; for example, the net export share of GDP
in China averaged 7 percent between 2005 and
2009, compared with 2.4 percent between 2000
and 2004.
Yet the historical data suggest that shift-
ing growth toward more domestically oriented
sources is possible. In India, gross fi xed capi-
tal formation was 24 percent of GDP in 1989;
by 2009, that share had increased to 35 per-
cent (moreover, the contribution of investment
growth to GDP growth over 2000–09 was
about one-half ). In Brazil, the consumption
contribution to output has been a robust 60
percent over the same period (remaining resil-
ient through the crisis). Even in China, rapid
growth did not preclude a substantial contri-
bution of consumption to growth over certain
periods: between 1990 and 1999, for example,
consumption represented about 42 percent of
growth, while exports represented about 46
percent.9

Argentina, 1966–2009
–15
–10
–5
0
5
10
15
19661971 1976 1981 1986 1991 1996 2001 2006
% g
row
th
–250–200–150–100–50050100150200250
con
trib
uti
on
, %
con
trib
uti
on
, %
% g
row
th
South Africa, 1966–2009
–8
–6
–4
–2
0
2
4
6
8
1966 1971 1976 1981 1986 1991 1996 2001 2006–50–40–30–20–1001020304050
1966 1971 1976 1981 1986 1991 1996 2001 2006
Indonesia, 1966–2009
–20
–15
–10
–5
0
5
10
15
% g
row
th
–120
–70
–20
30
80
con
trib
uti
on
, %
China, 1966–2009
–12
–7
–2
3
8
13
18
23
1966 1971 1976 1981 1986 1991 1996 2001 2006
% g
row
th
–25
–15
–5
5
15
25
35
45
55
con
trib
uti
on
, %
con
trib
uti
on
, %
Russian Federation, 1990–2009
–19
–14
–9
–4
1
6
11
16
21
1990 1995 2000 2005
% g
row
th
–100
–50
0
50
100
% g
row
th
con
trib
uti
on
, %
India, 1966–2009
–8
–3
2
7
12
17
1966 1971 1976 1981 1986 1991 1996 2001 2006–25
–15
–5
5
15
25
35
45
55
–15
–10
–5
0
5
10
15
1966 1971 1976 1981 1986 1991 1996 2001 2006
% g
row
th
Malaysia, 1966–2009
–50
–40
–30
–20
–10
0
10
20
30
4050
con
trib
uti
on
, %
–15
–10
–5
0
5
10
15
19661971 1976 1981 1986 1991 1996 2001 2006
% g
row
th
–250–200–150–100–50050100150200250
con
trib
uti
on
, %
Brazil, 1965–2009
TFP contribution (right axis) growth TFP growth
FIGURE 1.6 Total factor productivity contribution to growth, selected potential poles
Sources: World Bank staff calculations, from IMF IFS and World Bank WDI databases.
Note: The total factor productivity contribution is defi ned as the share of growth not attributable to either physical capital or human capital–adjusted labor inputs, assuming a Cobb-Douglas production function with constant returns, for 10-year periods. Depreciation, returns to education, and the income share of capital are assumed to be 0.06, 0.1, and 0.33, respectively, for all countries. Growth indicates growth rates calculated from GDP data measured in constant 2000 U.S. dollars. Because of data limitations, Indonesian TFP calculations begin only in the second period. The negative contributions for Argentina (1995–2004) and South Africa (1985–94) were −2,932 percent and −479 percent, respectively, but were not fully plotted because of the severe distortion to the presentation of the axes.

Global Development Horizons 2011 Changing Growth Poles and Financial Positions 27
in China, India, and Russia appears to be more
rapid than for equivalent Latin American econo-
mies (fi gure 1.8). Th e lag of technology adoption
in India relative to the United States, for exam-
ple, averaged 14.1 years between 1971 and 2001,
compared to lags of 16.2 years for Brazil and 20.7
years for Argentina. Th e relative adoption inten-
sity of technologies within these countries can
be even greater. After 1981, for instance, China
saw a sharp spike in the economic size-adjusted
use of technologies relative to the countries at the
leading edge of the technological frontier. More
generally, lags in technology usage and rates of
diff usion are likely to account for much of the
observed diff erences in cross-country TFP and,
hence, in growth performances (Comin and
Hobijn 2010; Comin, Hobijn, and Rovito 2008;
Eaton and Kortum 1999).
However, differential rates of adoption and
diff usion are insuffi cient to explain the relatively
low TFP growth rates in Southeast Asian econo-
mies. To understand this, one needs to look to the
reallocation of factors and resources stemming
from structural transformation in China (since
the period of economic reform beginning in the
late 1970s) and India (following the economic
reforms of the early 1990s), which explains the
distinct historical TFP performances of these two
potential emerging economy poles. Despite their
measured in terms of the time to uptake or the
margin of adoption.
Taking into account this distinction sug-
gests that China’s and India’s relatively strong
TFP contributions13 probably are due less to
pure innovative capacity than to a combination
of rapid adoption and diff usion of technologies
from global technological leaders, along with
the gains from factor reallocation within these
economies. Historically, measures of technologi-
cal innovation in those two potential poles have
consistently lagged those of Latin American
economies (measured in per capita terms),14
although the measures have shown a noticeable
uptick since the late 1990s (fi gure 1.7). Th is trend
is further corroborated by evidence that innova-
tive activity in China and India, to the extent
that it occurs, tends to be incremental in nature
(Puga and Trefl er 2010). If the relatively superior
TFP performances in China and India are to be
explained, the explanation is unlikely to be found
in technological innovation alone.
A much more likely reason for the relatively
superior TFP performance in China and India is
catch-up growth through technology adoption,
especially when accompanied by the movement of
resources from less productive to more productive
sectors of the economy. For many technologies,
the rate of technology adoption and diffusion
inte
nsi
ty
b. Scientific articles, 1981–2009
0
1
2
3
4
5
6
7
8
9
1981 1986 1991 1996 2001 2006
a. Patent approvals, 1967–2004
0
0.02
0.04
0.06
0.08
0.10
0.12
0.14
1967 1972 1977 1982 1987 1992 1997 2002
inte
nsi
ty
Venezuela, RB
Brazil
Argentina
China India
Argentina
Venezuela,RB
Brazil
China
India
FIGURE 1.7 Technological innovation, selected potential emerging economy poles
Sources: World Bank staff calculations, from World Bank WDI and WIPO Patentscope databases.
Note: Intensity of patent approvals and scientifi c articles published were measured as a share of 100,000 of population. Missing observations were dropped, and the series then were smoothed by taking the 5-year moving average of available annual data.
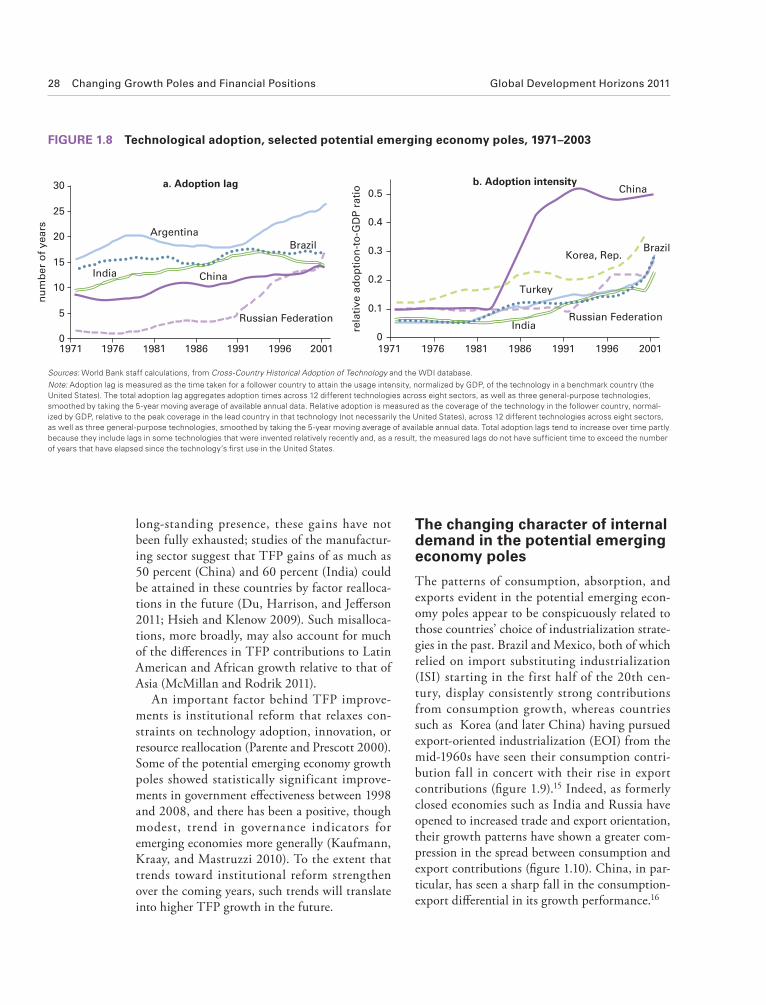
28 Changing Growth Poles and Financial Positions Global Development Horizons 2011
The changing character of internal demand in the potential emerging economy poles
The patterns of consumption, absorption, and
exports evident in the potential emerging econ-
omy poles appear to be conspicuously related to
those countries’ choice of industrialization strate-
gies in the past. Brazil and Mexico, both of which
relied on import substituting industrialization
(ISI) starting in the first half of the 20th cen-
tury, display consistently strong contributions
from consumption growth, whereas countries
such as Korea (and later China) having pursued
export-oriented industrialization (EOI) from the
mid-1960s have seen their consumption contri-
bution fall in concert with their rise in export
contributions (fi gure 1.9).15 Indeed, as formerly
closed economies such as India and Russia have
opened to increased trade and export orientation,
their growth patterns have shown a greater com-
pression in the spread between consumption and
export contributions (fi gure 1.10). China, in par-
ticular, has seen a sharp fall in the consumption-
export diff erential in its growth performance.16
long-standing presence, these gains have not
been fully exhausted; studies of the manufactur-
ing sector suggest that TFP gains of as much as
50 percent (China) and 60 percent (India) could
be attained in these countries by factor realloca-
tions in the future (Du, Harrison, and Jeff erson
2011; Hsieh and Klenow 2009). Such misalloca-
tions, more broadly, may also account for much
of the diff erences in TFP contributions to Latin
American and African growth relative to that of
Asia (McMillan and Rodrik 2011).
An important factor behind TFP improve-
ments is institutional reform that relaxes con-
straints on technology adoption, innovation, or
resource reallocation (Parente and Prescott 2000).
Some of the potential emerging economy growth
poles showed statistically significant improve-
ments in government eff ectiveness between 1998
and 2008, and there has been a positive, though
modest, trend in governance indicators for
emerging economies more generally (Kaufmann,
Kraay, and Mastruzzi 2010). To the extent that
trends toward institutional reform strengthen
over the coming years, such trends will translate
into higher TFP growth in the future.
a. Adoption lag
0
5
10
15
20
25
30
1971 1976 1981 1986 1991 1996 2001
nu
mb
er
of
years
BrazilArgentina
China
Russian Federation
India
b. Adoption intensity
0
0.1
0.2
0.3
0.4
0.5
1971 1976 1981 1986 1991 1996 2001re
lati
ve a
do
pti
on
-to
-GD
P r
ati
o
India
China
BrazilKorea, Rep.
Russian Federation
Turkey
FIGURE 1.8 Technological ado ption, selected potential emerging economy poles, 1971–2003
Sources: World Bank staff calculations, from Cross-Country Historical Adoption of Technology and the WDI database.
Note: Adoption lag is measured as the time taken for a follower country to attain the usage intensity, normalized by GDP, of the technology in a benchmark country (the United States). The total adoption lag aggregates adoption times across 12 different technologies across eight sectors, as well as three general-purpose technologies, smoothed by taking the 5-year moving average of available annual data. Relative adoption is measured as the coverage of the technology in the follower country, normal-ized by GDP, relative to the peak coverage in the lead country in that technology (not necessarily the United States), across 12 different technologies across eight sectors, as well as three general-purpose technologies, smoothed by taking the 5-year moving average of available annual data. Total adoption lags tend to increase over time partly because they include lags in some technologies that were invented relatively recently and, as a result, the measured lags do not have suffi cient time to exceed the number of years that have elapsed since the technology’s fi rst use in the United States.

Brazil, 1964–2006
–60
–40
–20
0
20
40
60
80
100
120
1964
1969
1974
1979
1984
1989
1994
1999
2004
con
trib
uti
on
s, %
–7
–2
3
8
13
% g
row
th
China, 1964–2006
–100
–50
0
50
100
150
1964
1969
1974
1979
1984
1989
1994
1999
2004
con
trib
uti
on
s, %
–15
–10
–5
0
5
10
15
20
% g
row
th
% g
row
th
India, 1964–2006
–250
–200
–150
–100
–50
0
50
100
150
1964
1969
1974
1979
1984
1989
1994
1999
2004
con
trib
uti
on
s, %
–30
–20
–10
0
10
20 Korea, Rep., 1964–2006
–67
–47
–27
–7
13
33
53
73
1964
1969
1974
1979
1984
1989
1994
1999
2004
con
trib
uti
on
s, %
–15
–10
–5
0
5
10
15
20
% g
row
th
Mexico, 1964–2006
–72
–52
–32
–12
8
28
48
68
88
108
1964
1969
1974
1979
1984
1989
1994
1999
2004
con
trib
uti
on
s, %
–10
–5
0
5
10
15
% g
row
th%
gro
wth
Russian Federation, 1988–2006
–360
–260
–160
–60
40
140
240
340
440
1988
1990
1992
1994
1996
1998
2000
2002
2004
2006
con
trib
uti
on
s, %
–15
–10
–5
0
5
10
15
20
Poland, 1989–2006
% g
row
th
–90
–40
10
60
110
160
1989
1991
1993
1995
1997
1999
2001
2003
2005
con
trib
uti
on
s, %
–10
–5
0
5
10
15
20
% g
row
th
Turkey, 1964–2006
–200
–150
–100
–50
0
50
100
150
1964
1969
1974
1979
1984
1989
1994
1999
2004
con
trib
uti
on
s, %
–20
–15
–10
–5
0
5
10
15
growth (right axis) consumption share export share
FIGURE 1.9 Export and consumption contribution to growth, selected potential poles
Sources: World Bank staff calculations, from IMF IFS and World Bank WDI databases.
Note: The consumption (export) contribution is defi ned as the annual change in consumption (export) divided by the annual change in output, smoothed by taking the 5-year moving average. Observations with a positive change in the numerator and a negative change in the denominator were dropped. Growth indicates growth rates cal-culated from GDP data measured in constant 2000 U.S. dollars. The anomalous patterns for India (1987–91) and Turkey (1989–94) were due to negative output growth as a result of severe economic disruptions (including fi nancial crises), before economic and fi nancial liberalization episodes.

30 Changing Growth Poles and Financial Positions Global Development Horizons 2011
of saving are likely to translate into observable
macroeconomic factors, such as the real interest
rate, income growth rate, and demographic struc-
ture of the economy (Attanasio and Weber 2010;
Loayza, Schmidt-Hebbel, and Servén 2000;
Schmidt-Hebbel, Webb, and Corsetti 1992).
In contrast to household saving, decisions
about optimal corporate saving are deeply inter-
woven with decisions about optimal corporate
fi nancing. In a perfectly frictionless world, stan-
dard theory asserts that the capital structure of a
fi rm is irrelevant (Modigliani and Miller 1958).
In reality—and especially in developing coun-
tries—real and fi nancial frictions are likely to be
pervasive, and so the mode of fi nancing indeed
may be important (Dailami 1992). In turn, the
mode of fi nancing often is aff ected by the pre-
existing business, fi nancial, and macroeconomic
environment. Th e relatively immature fi nancial
structure and widespread agency problems in
developing-country fi nancial markets, for exam-
ple, may induce a greater reliance on internal
funding, thus increasing the incentive for fi rms to
save (Allen et al. 2010).
Moderating the saving rat e in the potential
emerging economy growth poles is a nontrivial
problem, especially given the steady rise in sav-
ing in these poles in recent years. China, in par-
ticular, has seen its private and public saving rise
from, respectively, 33.3 percent and 5.7 percent
of GDP in 1992 to an estimated 44.7 percent and
6.7 percent in 2008 (figure 1.11).19 The causes
of China’s high saving rates, however, have been
the subject of much debate, with literature point-
ing to structural concerns such as a weak social
safety net and underdeveloped fi nancial sector,
life-cycle smoothing in response to the current
high growth rate, industrialization policies that
are biased against consumer spending, and even
signaling motives as a result of its highly competi-
tive marriage market (Bayoumi, Tong, and Wei
2010; Blanchard and Giavazzi 2006; Horioka
and Wan 2007; Kuijs 2006; Modigliani and Cao
2004; Wei and Zhang 2009).
China is not alone. India also possesses high
and rising levels of national saving, and since the
start of the 21st century, India’s growth has been
accompanied by a doubling of corporate saving
(from 3.1 percent of GDP in 2002 to 7.8 percent
of GDP in 2008). Th is is somewhat worrisome,
Such patterns do not necessarily constitute a
case for or against the use of EOI or ISI strat-
egies,17 and there is nothing in these historical
choices that constrains an open economy from
reducing its reliance on export-led growth.18
Indeed, a case can be made for reorienting
growth in the EOI countries toward higher,
albeit sustainable, levels of internal demand, after
these economies have suffi ciently matured. Th is
reorientation would require raising the share of
consumption and investment in output growth,
which would result from, respectively, a reduction
in the saving rate or the user cost of capital. Th us,
an understanding of the deeper, structural deter-
minants of high saving and investment, both at
the household and corporate level, is necessary.
Consumption and saving behavior in emerg-
ing economies. Consumption theory, either
along the traditional lines of a permanent income
life-cycle model or a more modern intertem-
poral consumption- leisure interpretation, sug-
gests that factors such as disposable income
and private wealth can aff ect household saving
behavior. Moreover, for developing countries,
liquidity constraints can come into play. At the
macroeconomic level, these microdeterminants
–0.2
0
0.2
0.4
0.6
0.8
1977
1979
1981
1983
1985
1987
1989
1991
1993
1995
1997
1999
2001
2003
2005
con
sum
pti
on
–exp
ort
sh
are
dif
fere
nti
al
Mexico
China
Korea, Rep.
Brazil
India
FIGURE 1.10 Dominance of consumption to exports in growth, selected potential emerging economy poles, 1977–2006
Sources: World Bank staff calculations, from IMF IFS and World Bank WDI databases.
Note: The consumption–export differential is defi ned as the difference between consumption and export shares of output growth. Observations with a positive change in the numerator and a negative change in the denominator were dropped, and the series then were smoothed by taking the 15-year moving average of available annual data.

Global Development Horizons 2011 Changing Growth Poles and Financial Positions 31
GDP in 2008. Russia also has seen a rise in sav-
ing since 2002, although to a lesser extent. Much
of the increase in Russia has been due to govern-
ment rather than private saving, however, with
the share of government saving accounting for
more than half of all national saving since 2005.
Korea appears to be an exception to this trend
among the potential growth poles, demonstrat-
ing falling national saving over time, especially
among households. This downward trend in
Korea is likely due to expansion of household
contributions to the social safety net, the aging
population, deteriorating terms of trade, and
expansion of credit available to households at low
interest rates (IMF 2010d).
In China, too, demographic change in the
coming decades—namely, a rising old-age depen-
dency ratio—will aff ect the household saving rate.
As working-age adults account for a shrinking
because India’s high corporate saving is less likely
to be due to optimal household responses to the
introduction of new saving instruments than it is
to be an indication of possible dysfunction in the
development of fi nancial markets, especially with
regard to the ease of access of fi rms to fi nancing.
Nevertheless, higher overall saving in India may
actually be optimal for its stage of development, if
investment opportunities are present and fi nanc-
ing constraints are otherwise binding.
In other potential emerging economy poles,
the shares of saving in GDP are more modest
and are of less concern—indeed, fi nancing the
increasing number of investment opportuni-
ties in these countries may even call for higher
domestic saving, especially if access to inter-
national finance is uncertain. In Mexico, for
example, saving has steadily crept up since 2001,
increasing by 42 percent to top 16 percent of
China, 1992–2009
0
10
20
30
40
50
60
199219941996199820002002200420062008
pe
rce
nt
householdsenterprisesgovernment
householdsenterprisesgovernment
householdscorporationsgovernment
India, 1992–2008
–5
0
5
10
15
20
25
30
35
40
1992 1994 1996 1998 2000 2002 2004 2006 2008
pe
rce
nt
Mexico, 1992–2008
0
5
10
15
20
25
1992 1994 1996 1998 2000 2002 2004 2006 2008
pe
rce
nt
totalprivategovernment
Korea, Rep., 1990–2007
–5
0
5
10
15
20
25
30
1990 1992 1994 1996 1998 2000 2002 2004 2006
pe
rce
nt
FIGURE 1.11 Evolution of s aving, selected potential growth poles, by sector
Sources: World Bank staff calculations, from All China Data Center database (China), Organisation for Economic Co-operation and Development StatExtracts database (Korea, Mexico), and Central Statistical Organisation, National Accounts Statistics (India).
Note: For China, 2009 household and enterprise saving are imputed from their respective 2008 shares of 2009 total private saving. For India, 2007 data are provisional and 2008 are estimates, and household saving is defi ned as the sum of household fi nancial saving and household physical saving.

32 Changing Growth Poles and Financial Positions Global Development Horizons 2011
the reason for this lies in the fact, discussed in the
previous section, that the TFP changes explain
a much larger share of the realized growth path.
Furthermore, economies also may diff er in their
effi ciency of capital usage, as proxied by the incre-
mental capital-output ratio (ICOR).22 In some
cases, this ratio may be even higher than in China
and India, the TFP leaders among the potential
emerging economy poles (figure 1.12). Indeed,
this heterogeneity underscores the possibility that
countries have exploited several diff erent paths to
supporting their historical growth patterns.
As a consequence, long swings in the contribu-
tion of investment to growth—as are evident for
China and Malaysia, for example—generally are
more diffi cult to reconcile with standard business
cycle movements and may not always be translated
into growth (fi gure 1.13). Nevertheless, it is impor-
tant to recognize that the growth spurts in China
since 1990 and in Malaysia in the 1980s and 1990s,
for example, can in fact be heavily attributed to
gross fi xed capital formation (a phenomenon fi rst
observed by Young 1995 and more recently empha-
sized by Bardhan 2010). Owing to diminishing
returns, however, growth reliant on capital accu-
mulation alone ultimately is not sustainable.
Implications of different growth patterns for sustained future global growth
Th e diff ering historical nature of growth among
the potential emerging economy growth poles, on
both the supply and demand sides, hold diff ering
implications for whether their growth patterns
are sustainable into the future. In particular, the
ability to develop indigenous innovative capacity
and the ability to successfully transition toward
greater internal sources of demand constitute the
primary risks to strong future emerging-market
growth performance.
Future TFP growth must rely more on techno-
logical innovation, not adoption. With gradual
technological catch-up, the gains to TFP growth
from technological adoption cannot continue
indefinitely. What, then, are the prospects for
the potential emerging economy poles to begin
innovating in the future? Enhancing innovative
share of the population, there should be a syn-
chronous decline in China’s household saving
rate. India is experiencing a similar demographic
shift, although its relatively young working-age
population suggests that the country may still
reap a demographic dividend in the years ahead.20
Investment and capital usage ef ficiency in
emerging economies. Of course, the charac-
ter of growth is aff ected not only by consump-
tion and saving trends, but also by investment.
Undeniably, investment trends tend to be much
more volatile than consumption trends. Yet both
theory (capital accumulation is at the heart of
classical and endogenous growth models) and
empirics (that investment is strongly pro-cyclical
with output in most countries is a stylized fact)
point to the central role that investment plays in
the growth process.
Even so, the relationship between changes in
investment and growth is much weaker, at least in
the short run. Indeed, in some potential emerg-
ing economy growth poles, such as Korea and
Mexico, such investment changes are correlated
only moderately with income growth.21 Part of
–15
–10
–5
0
5
10
15
20
25
30
1965 1970 1975 1980 1985 1990 1995 2000 2005
ICO
R
Venezuela, RBBrazil China PolandIndia
FIGURE 1.12 Incremental capital-output ratios, selected potential emerging economy poles, 1965–2008
Sources: World Bank staff calculations, from IMF IFS and World Bank WDI databases.
Note: The ICOR is defi ned as investment in the previous period, divided by the annual change in output. Observations for which investment and growth differ by more than two orders of magnitude, and persist for only one year, were treated as outliers and dropped; the series then were smoothed by taking the 5-year moving average of available annual data. ICORs for Brazil, China, India, Mexico, Poland, and the Republica Bolivariana de Venezuela, for the full period are 5.69, 2.80, 3.86, 5.14, and 5.12, respectively.

Global Development Horizons 2011 Changing Growth Poles and Financial Positions 33
This trend is likely to continue, as global
income inequality is generally forecast to fall
in the future (Sala-i-Martin 2006; Wilson and
Dragusanu 2008; World Bank 2007). Because
as well as adoptive capacity requires investment
in both human capital and research and develop-
ment (R&D) (Eaton and Kortum 1996; Griffi th,
Redding, and van Reenen 2004), coupled with
enhancing the institutional environment that,
among other things, supports TFP growth via
these channels. Both investments are linked
closely to per capita incomes, especially when
countries approach high-income status (figure
1.14).23 As incomes rise in such economies, it is
very likely that their ability to develop indigenous
technological advances will rise. Indeed, as dis-
cussed in chapter 2, evidence for increased inno-
vative activity in emerging economies can already
be seen at the fi rm level.
Investment in R&D also holds the prom-
ise of being an engine for endogenous growth
(Aghion and Howitt 1997; Romer 1986, 1990).
Furthermore, growth premised on such knowl-
edge accumulation can spill over to other coun-
tries; as such, potential emerging economy
growth poles that rely on such mechanisms will
serve to further strengthen their positions as
growth poles. This is especially true for China
and India, but also for Russia; all three countries
have demonstrated strengths in various aspects
of R&D related to information and communica-
tions technology.
Future internal demand growth will need to
be supported by a growing middle class. To the
extent that there are concerns about successfully
increasing the contribution of consumption to
growth in developing countries excessively reliant
on export-oriented growth, several medium- and
long-term trends could facilitate such a switch.
One important supporting trend is the rise of the
so-called global middle class, which in turn could
be a source of sustained growth and a strong
channel for poverty reduction at the global level
(Banerjee and Dufl o 2008; Doepke and Zilibotti
2005; Easterly 2001; World Bank 2007).24
Among emerging markets, this expansion of the
middle class has thus far been led by China and
India, which—together with the rest of East and
South Asia—collectively accounted for about 970
million new entrants to the global middle class
between 1990 and 2005.25
R&Dexpenditure
dollars
R&D researchers(right axis)
00.010.020.030.040.050.060.070.080.09
< 45
9
460–
995
996–
2,28
0
2,28
1–3,
945
3,94
6–5,
880
5,88
1–12
,195
12,1
96–3
0,00
0
> 30
,000
GD
P s
hare
, %
0
5
10
15
20
25
30
po
pu
lati
on
sh
are
('0
00,0
00)
FIGURE 1.14 Global distribution of research and develop-ment expenditure and researcher shares, average over 2004–08
Source: World Bank staff calculations, from World Bank WDI database.
Note: The fi gure depicts R&D expenditure share of GDP and R&D researcher share of popula-tion, weighted respectively by GDP and population within each respective bracket. Brackets are given in gross national income (GNI) per capita, calculated using the Atlas method, and chosen to yield two groups within each of the World Bank’s 2009 income categories (low income, $995 or less; lower middle income, $996–$3,945; upper middle income, $3,946–$12,195; and high income, $12,196 or more).
0
0.10
0.20
0.30
0.40
0.50
0.60
1972
1974
1976
1978
1980
1982
1984
1986
1988
1990
1992
1994
1996
1998
2000
2002
2004
2006
invest
men
t sh
are
of
gro
wth
Malaysia
Korea, Rep.
China
IndiaTurkey
FIGURE 1.13 Investment shares of growth, selected potential emerging economy poles, 1972–2006
Sources: World Bank staff calculations, from IMF IFS and World Bank WDI databases.
Note: The investment share is defi ned as the annual change in investment divided by the annual change in output. Observations with a positive change in the numerator and a negative change in the denominator were dropped, and the series then were smoothed by taking the 10-year moving average of available annual data.

34 Changing Growth Poles and Financial Positions Global Development Horizons 2011
are spent on not just domestic but also foreign
goods and services, expanding middle classes in
the potential emerging economy growth poles can
raise demand for exports from LDCs.
Ultimately, rising levels of per capita income
are likely to consolidate the transition to greater
consumption-driven growth in developing
countries (fi gure 1.15, panel a),26 as has been
the case for high-income countries on average,
even in Asia (fi gure 1.15, panel b). Some devel-
oping countries have in fact made such success-
ful transitions, and their experiences suggest
that transitions can be stable and sustainable
(box 1.4).
How long it will take for this transition to
play out, however, remains unclear. In China,
at least, steps are under way to address the struc-
tural challenges that may have artifi cially held
down consumption growth.27 But for developing
countries in general, ushering in such transitions
has taken on a new urgency due to the slowdown
of demand in the United States and Europe as a
result of the fi nancial crisis.
The f lip side of increased consumption is
reduced saving and—owing to the Feldstein-
Horioka observation that domestic saving and
investment are highly correlated—reduced
investment. Consequently, any shift toward con-
sumption-driven growth is likely to be accompa-
nied by a reduction in investment levels. Whether
investment continues to be an important driver
of growth then depends on the likelihood that,
going forward, these lower levels of investment
can nevertheless increase labor productivity.
This outcome, in turn, depends on whether
such investments are channeled toward the appro-
priate sectors of the economy. While the litera-
ture has begun to explore systematic methodolo-
gies for selecting sectors that would be benefi cial
targets for investment (Lin 2010), considerable
uncertainty remains about the growth outcomes
that would result from such directed investments.
Investment in green technology production, for
example, could lead to productivity gains for a
broader segment of the labor force, compared to
investment in an economy based on knowledge
products. Moreover, the implications of such
investment choices for the rest of the world will
also be diff erent. Th is is especially important for
the middle class typically stands at the forefront
of consumption demand, a larger middle class
will tend to reinforce changes in consumption
patterns. Th is, in turn, will lead to a stronger con-
sumer in the emerging economies, thereby increas-
ing the contribution of consumption to growth
within the potential emerging economy growth
poles. Multiplier effects from increases in the
size of the middle class could lead to GDP levels
of 8 to 15 percent higher than otherwise, as has
been estimated for China (Woetzel et al. 2009).
Furthermore, if rising incomes and consumption
0102030405060708090
100
< 45
9
460–
995
996–
2,28
0
2,28
1–3,
945
3,94
6–5,
880
5,88
1–12
,195
12,1
96–3
0,00
0
>30,
000
GD
P s
hare
, %
householdgovernment
China
Korea, Rep.
India
JapanTaiwan, China
United States
40
50
60
70
80
90
100
0
5,00
0
10,0
00
15,0
00
20,0
00
25,0
00
30,0
00
35,0
00
40,0
00
45,0
00
GDP per capita, $
con
sum
pti
on
sh
are
, %
a. Global distribution of consumption share, 2004–08 period average
dollars
b. Selected evolution of consumption share, 1960–2009
FIGURE 1.15 Global distribution and se lected evolution of consumption share by per capita income
Sources: World Bank staff calculations, from IMF IFS and World Bank WDI databases.
Note: Household and government consumption shares are measured as shares of GDP, and weighted by GDP in U.S. dollars within each respective bracket. Brackets are given in GNI per capita, calculated using the Atlas method, and chosen to yield two groups within each of the World Bank’s 2009 income categories (low income, $995 or less; lower middle income, $996–$3,945; upper middle income, $3,946–$12,195; and high income, $12,196 or more). Total consumption share is the sum of household and government consumption, measured as a share of GDP, and GDP per capita is measured in constant 2000 U.S. dollars.

Global Development Horizons 2011 Changing Growth Poles and Financial Positions 35
Many countries have experienced export-led growth
in the recent decades, but very few of these have
subsequently transitioned to consumption-driven
growth. Even in the cases in which such a transi-
tion appears in the data, the switch to consumption-
led growth has occurred because of slowdowns in
growth or sharp deteriorations in export perfor-
mances, or are too brief to justify a permanent struc-
tural change. Two African success stories, however,
appear to provide a tantalizing glimpse of how such
a transition may be realized: Botswana and Mauritius
(fi gure B1.4.1).
Following independence in 1968, Mauritius has
undergone two major transformations—first from a
sugar-based economy to an industrial exporter of tex-
tiles and apparel, and then from an industrial exporter to
a mainly service-based economy (services accounted
for roughly 67 percent of GDP as of 2009). Sustained
economic growth brought gross national income (GNI)
per capita from $1,112 in 1984 to $6,340 in 2009. In the
early 1980s, the export share of GDP began to rise and
the consumption share began to fall, setting the stage
for a period of export-driven accelerated growth from
the mid-1980s through the 1990s. But in 2001 or 2002,
a switch occurred, with exports falling from 64 percent
to 56 percent of GDP by 2009 and private consumption
rising from 61 percent to 73 percent of GDP. This con-
sumption-driven phase of growth occurred simultane-
ously with a further acceleration of economic growth
and was accompanied by rapid expansion of domestic
credit, development of fi nancial markets more broadly,a
and growth of the service sector.
In Botswana, diamond mining has played a leading
role in Botswana’s economy throughout its period of
growth, during which GNI per capita rose from $88 at
independence in 1966 to $6,280 in 2009. Between
the late 1960s and the 1980s, Botswana experienced
export-driven growth, driven almost exclusively by dia-
monds, with exports rising as a fraction of GDP and the
consumption share falling. A transition began in the late
1980s, however, with Botswana’s export share falling
from a high of 70 percent and eventually leveling off at
less than 50 percent. Meanwhile, in the 2000s, con-
sumption rose steadily, from 26 percent in 2002 to 41
percent in 2009. As in Mauritius, this rise in Botswana’s
consumption occurred during a period of not only rapid
economic growth, but also of signifi cant fi nancial mar-
ket development, expansion of domestic credit, and
growth of the services sector.
Outside of Africa, three economies have transi-
tioned to consumption-driven growth in the past several
decades, although the evidence in these cases is more
BOX 1. 4 Suggestive evidence of successful transitions to consumption-driven growth
FIGURE B1.4.1 Evolution of consumption and export shares, Botswana and Mauritius
Sources: World Bank staff calculations, from World Bank WDI database.
a. Botswana
0
0.1
0.2
0.3
0.4
0.5
0.6
0.7
0.8
0.9
196019
6319
6619
6919
7219
7519
7819
8119
8419
8719
9019
9319
9619
9920
0220
0520
080
1,000
2,000
3,000
4,000
5,000
6,000
7,000
do
llars
b. Mauritius
0.40
0.45
0.50
0.55
0.60
0.65
0.70
0.75
197419
7619
7819
8019
8219
8419
8619
8819
9019
9219
9419
9619
9820
0020
0220
0420
0620
08
share
share
0
1,000
2,000
3,000
4,000
5,000
6,000
7,000d
ollars
GNI/capita (right axis) X/YC/Y
(continued)

36 Changing Growth Poles and Financial Positions Global Development Horizons 2011
Dynamics of New Growth Poles: Implications for Domestic Output, Trade Flow Patterns, and Global Payments ImbalancesCharting the future of the growth poles
Seen from the contemporary perspective of
global markets, shifting drivers of global eco-
nomic growth will induce structural changes
in key industries. This outcome suggests that
balance-of-payments measurements will need to
be approached in the context of a much-longer-
run structural global growth perspective that
integrates the real and financial dimensions of
external account balances in a coherent way,
while recognizing that persistent large imbalances
inevitably will translate into a huge buildup of
commodity-exporting LDCs, whose exports and
terms of trade are critically dependent on the spe-
cifi c raw materials demanded.
Caution must be exercised in outlining the
strategy for moving toward higher levels of
domestic absorption. Importantly, the expan-
sion of domestic consumption and investment
in the emerging East Asian growth poles should
not fall into the trap of purely shifting factor
inputs into the (typically) less productive ser-
vice sector, but rather should ensure that the
internal reallocation of resources goes toward
high-productivity sectors, whether at the pri-
mary, secondary, or tertiary level. In this regard,
the shifts of greatest concern are those that are
channeled inordinately toward construction or
fi nance, which increases the risk of fueling asset
price bubbles.
tenuous. Oman and Saudi Arabia appeared to have
experienced such a transition in the 1970s, although
they subsequently reverted to export-reliant growth.
The Syrian Arab Republic, as well, now shows some
tentative signs of making a transition from export-driven
to consumption-driven growth. Like Botswana and
Mauritius, Syria’s transition appears to have occurred
alongside an expansion of domestic credit and growth
of the service sector, following economic liberalization.
It would be premature to draw strong conclusions
from these few cases; nonetheless, they do provide
some corroborative evidence that transitions from
export- to consumption-driven growth are associated
with fi nancial market development, credit expansion,
and growth in the service sector. During the periods
when the transition occurred, these countries’ govern-
ments all undertook programs to liberalize and diversify
their economies, and this has included fi nancial market
liberalization.
How might such a transition play out in the export-
dependent emerging economies, especially China? If
the historical evidence is anything to go by, a central
part of the story would be the continued development
of domestic fi nancial markets, especially with regard to
consumer credit and fi nancing for small and medium
enterprises (SMEs), both of which tend to lead to
expansion of the service sector from the demand and
supply sides. There is certainly room for such develop-
ments. China’s consumer credit access, at 13 percent
of GDP, currently lags behind other East Asian econo-
mies, such as Malaysia (48 percent) and Korea (70 per-
cent) (Woetzel et al. 2009). Regulations surrounding
access to credit for SMEs place China at 65 out of 183
economies globally, behind comparator countries such
as India (32), Korea (15), and Mexico (46) (World Bank
2010a). Finally, gradual real exchange rate appreciation
will also likely play a role in expanding consumers’ pur-
chasing power and will facilitate the overall transition
process.
a. It is important to draw a distinction between pro-moting fi nancial market development versus liberal-ization. While greater competition and innovation in the fi nancial sector can certainly support its growth, liberalization should be accompanied by a strength-ening of the relevant regulatory institutions and legal frameworks, so that the sector does not outrun the capacity of host governments to monitor abuse and limit excesses.
BOX 1. 4 (continued)

Global Development Horizons 2011 Changing Growth Poles and Financial Positions 37
Eastern Europe is expected to average 6.1 percent
growth for 2012) (World Bank 2011).
Whether such a two-track world persists
depends, in part, on the speed of the deleverag-
ing cycle in developed countries and the extent to
which the eff ects of the 2007–08 fi nancial crisis
and the sovereign debt and fi scal crises in several
European countries are absorbed. Avoiding an
ongoing two-track global economy also depends
on whether developing countries are able to man-
age rising inf lationary pressures—originating
both from pipeline commodity-related demand
pressures and from the imported eff ects of loose
monetary policy in several major advanced econo-
mies—while maintaining productivity advances,
alongside a redirection of externally driven to
internally generated growth.
In this book, the baseline scenario adopted
is one in which (1) stabilization and restructur-
ing policies are successfully implemented in both
advanced economies and the developing economies
of Eastern Europe; (2) absent further exogenous
shocks, the cyclical downturn in these economies
fades away by the end of 2012;28 and (3) develop-
ing economies other than those in Eastern Europe,
especially the potential emerging economy growth
poles, successfully manage the surge in capital
infl ows and infl ation in the short run. Th e baseline
scenario also assumes that current policy tensions
over exchange rates and trading arrangements do
not erupt into economic confl ict.
In the medium to long run—through 2025,
the end of this book’s modeling horizon—this
book assumes a convergence of each economy
toward its respective potential output in all
countries. Th is convergence is premised on the
assumption that structural reforms in advanced
economies are successful in the medium term,
and that institutional and structural changes
occur in developing economies that lead to
realignment of growth away from external to
internal sources. Scenario projections from 2013–
25 are generated on the assumption that econo-
mies operate on the trend path of their respective
levels of potential output.
In addition to these internal adjustments, the
baseline scenario also envisions external adjust-
ments that are consistent with a likely medium-
term (through 2015) path of fiscal balances,
gross external asset and liability positions of sur-
plus and defi cit countries. Such fi nancial account
positions also will interact with growth dynamics
to change the pattern of gross trade fl ows.
Much of the existing literature, however, either
focuses on the real side aspects—trade balances,
along with their domestic macroeconomic coun-
terparts, investment-saving balances—or has
taken an asset market approach, assessing the
prospects for foreign fi nancing of accumulating
external debt or the opportunities for investment
of accumulating assets. Diff erent global growth
scenarios, however, will imply different global
macroeconomic equilibrium and external pay-
ments imbalance scenarios (Caballero, Farhi, and
Gourinchas 2008). Moreover, changes in growth
paths and external balances are likely to affect
exchange rate outcomes (McDonald 2007), which
in turn will mean changes in the fl ow of exports
and imports. Indeed, the shift in trade toward
potential emerging economy growth poles is well
under way and is likely to intensify in the future
with China as the hub (Wang and Whalley 2010).
Keeping in mind these important interactions, the
baseline scenario provided here off ers a lens into
the future evolution of the global economy.
The baseline scenario for the future of the global macroeconomy
In the wake of the fi nancial crisis, the global mac-
roeconomy seems poised to follow a two-track
course in the short term, with developed coun-
tries growing at a much more sluggish pace than
developing countries. Low- and middle-income
countries are expected to contribute about half
(49 percent) of all global growth in 2010. Owing
to postcrisis drag, economic activity in the high-
income economies, as well as in many of the
developing economies of Eastern Europe, will
remain sluggish in 2011, only reaching their long-
run averages in 2012 (2.8 percent and 4.4 percent
for high-income economies and Eastern Europe,
respectively). In contrast, economic performance
among the developing countries, which had been
robust until 2010, likely will moderate as demand
stimuli are retracted and output gaps trend
toward zero (the developing world excluding

38 Changing Growth Poles and Financial Positions Global Development Horizons 2011
This baseline scenario, along with the sce-
nario analyses to follow, relies on a combination
of a medium-term current account model and a
long-term growth model (described in detail in
box 1.5).
Output and growth patterns. Under the base-
line scenario, emerging economies’ share of
global output will expand, in real terms, from
36.2 percent to 44.5 percent between 2010 and
2025 (fi gure 1.16). Th is impressive rise will be led
by China. A simultaneous decline in investment
and rise in consumption means that China will
foreign asset accumulation, and energy needs.
Th e resulting medium-term fl uctuations in the
current account will then give way to a long-run
path of external imbalances that gradually adjust
toward globally sustainable levels. Th is (linear)
10-year glide path is one where, by 2025, non-
energy-exporting countries adopt a ±3 percent
surplus/defi cit target if their 2015 current account
balances exceed these bounds (countries within
this ±3 percent band are assumed to simply
maintain their 2015 levels).29 Energy-exporting
countries, owing to their generally larger export
patterns, will instead target a current account
surplus ceiling of 10 percent of GDP.
The baseline scenario outlined in this book relies on
two separate models: a current account model that
generates medium-term balance of payments projec-
tions, and a growth model that generates long-term
growth projections, based in part on input from the
current account model.
The current account model (described in detail in
annex 1.5) deployed relies on the strand of the litera-
ture concerned with the medium-term structural deter-
minants of saving-investment differentials (Chinn and
Ito 2007; Chinn and Prasad 2003; Gagnon 2010; Gruber
and Kamin 2007). The main explanatory variables are
the fi scal balance, offi cial fi nancial fl ows, net foreign
assets, and net energy exports. Using fi ve-year aver-
ages across 145 countries for the period 1970–2008,
the current account model estimates region-specifi c
coeffi cients for six country groupings: advanced econ-
omies; developing Asia, Africa, Latin America, and
Middle East economies; and transition economies.
The model-predicted estimates are then compared
with historical data and further adjusted to match
actual 2004–08 current account balances. Initial cur-
rent account projections for 2011 through 2015 then
are obtained by using annual forecast data obtained
from other sources, such as the International Monetary
Fund’s Fiscal Monitor (fi scal balance forecasts) and the
International Energy Agency’s World Energy Outlook
(energy forecasts). Current account numbers from
2016 onward are simple linear projections of the path of
current account balances to the 2025 value implied by
a given scenario. These projections were then fed into
the World Bank’s Linkage model (World Bank 2007) to
develop the growth numbers.
The Linkage growth model (described in detail in
van der Mensbrugghe 2005) was designed to captures
the complex growth dynamics behind a large set of
countries of interest. The model is a dynamic, global
computable general equilibrium (CGE) growth model
that allows for this fl exibility, while using the current
account scenarios developed as a key input. The model
includes 22 country-regions, eight sectors, and as
many as eight possible factors and intermediate inputs
to production. The growth process is an augmented
Solow-style neoclassical production function, taking as
given labor force evolution, productivity processes, and
saving- investment decisions (themselves a function of
demographic factors).
Finally, model-generated trade flow patterns and
consumption-investment patterns are used to obtain
baseline numbers corresponding to each scenario.
Variations to the baseline result are obtained from chang-
ing the parameters that govern the behavior of major
variables, such as the rate of growth of factor and energy
productivity, population, and labor supply. Given the
emphasis of this chapter on growth, however, the path
taken by TFP for a given country is especially important,
and alternatives to the growth baseline alter parameters
that would generate meaningful variations in TFP.
BOX 1.5 Mo deling the current account and growth process
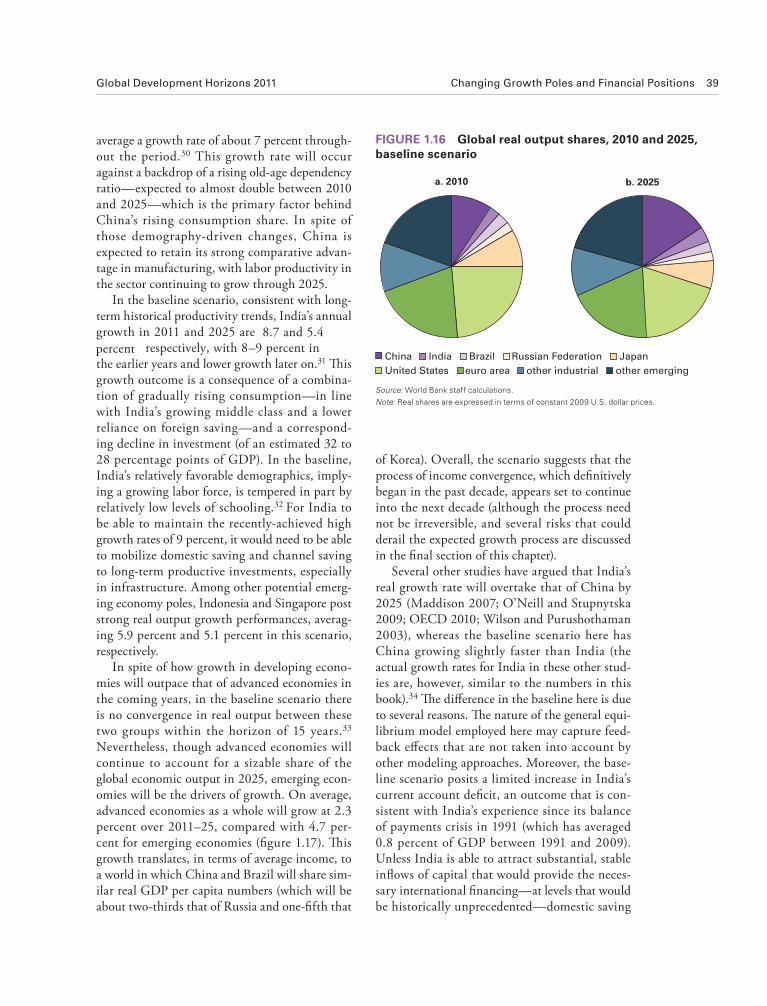
Global Development Horizons 2011 Changing Growth Poles and Financial Positions 39
of Korea). Overall, the scenario suggests that the
process of income convergence, which defi nitively
began in the past decade, appears set to continue
into the next decade (although the process need
not be irreversible, and several risks that could
derail the expected growth process are discussed
in the fi nal section of this chapter).
Several other studies have argued that India’s
real growth rate will overtake that of China by
2025 (Maddison 2007; O’Neill and Stupnytska
2009; OECD 2010; Wilson and Purushothaman
2003), whereas the baseline scenario here has
China growing slightly faster than India (the
actual growth rates for India in these other stud-
ies are, however, similar to the numbers in this
book).34 Th e diff erence in the baseline here is due
to several reasons. Th e nature of the general equi-
librium model employed here may capture feed-
back eff ects that are not taken into account by
other modeling approaches. Moreover, the base-
line scenario posits a limited increase in India’s
current account defi cit, an outcome that is con-
sistent with India’s experience since its balance
of payments crisis in 1991 (which has averaged
0.8 percent of GDP between 1991 and 2009).
Unless India is able to attract substantial, stable
infl ows of capital that would provide the neces-
sary international fi nancing—at levels that would
be historically unprecedented—domestic saving
average a growth rate of about 7 percent through-
out the period.30 This growth rate will occur
against a backdrop of a rising old-age dependency
ratio—expected to almost double between 2010
and 2025—which is the primary factor behind
China’s rising consumption share. In spite of
those demography-driven changes, China is
expected to retain its strong comparative advan-
tage in manufacturing, with labor productivity in
the sector continuing to grow through 2025.
In the baseline scenario, consistent with long-
term historical productivity trends, India’s annual
growth in 2011 and 2025 are
the earlier years and lower growth later on.31 Th is
growth outcome is a consequence of a combina-
tion of gradually rising consumption—in line
with India’s growing middle class and a lower
reliance on foreign saving—and a correspond-
ing decline in investment (of an estimated 32 to
28 percentage points of GDP). In the baseline,
India’s relatively favorable demographics, imply-
ing a growing labor force, is tempered in part by
relatively low levels of schooling.32 For India to
be able to maintain the recently-achieved high
growth rates of 9 percent, it would need to be able
to mobilize domestic saving and channel saving
to long-term productive investments, especially
in infrastructure. Among other potential emerg-
ing economy poles, Indonesia and Singapore post
strong real output growth performances, averag-
ing 5.9 percent and 5.1 percent in this scenario,
respectively.
In spite of how growth in developing econo-
mies will outpace that of advanced economies in
the coming years, in the baseline scenario there
is no convergence in real output between these
two groups within the horizon of 15 years.33
Nevertheless, though advanced economies will
continue to account for a sizable share of the
global economic output in 2025, emerging econ-
omies will be the drivers of growth. On average,
advanced economies as a whole will grow at 2.3
percent over 2011–25, compared with 4.7 per-
cent for emerging economies (fi gure 1.17). Th is
growth translates, in terms of average income, to
a world in which China and Brazil will share sim-
ilar real GDP per capita numbers (which will be
about two-thirds that of Russia and one-fi fth that
China India Brazil Russian Federation Japan
United States euro area other industrial other emerging
a. 2010 b. 2025
FIGURE 1.16 Global real o utput shares, 2010 and 2025, baseline scenario
Source: World Bank staff calculations.
Note: Real shares are expressed in terms of constant 2009 U.S. dollar prices.
GD01_13-72.indd 39GD01_13-72.indd 39 5/13/2011 2:50:39 PM5/13/2011 2:50:39 PM
8.7 and 5.4 respectively, with 8–9 percent in percent

40 Changing Growth Poles and Financial Positions Global Development Horizons 2011
economies, anticipated demographic changes—
especially an uptick in the old-age dependency
ratio in many of these countries—will mean that
increased consumption is a largely inexorable pro-
cess. Indeed, the consumption-output share in
the East Asian poles could even exceed that of the
United States by 2022, owing in part to increas-
ing pressure on the latter to raise savings to meet
debt obligations, as well as accommodate a likely
decline in its current account defi cit.35
Th is increased consumption will occur along-
side a fall in investment, again most notably
among East Asian economies (fi gure 1.18, panel
b). China’s investment will decline modestly
(from 45 percent of GDP to 39 percent). This
decreasing trend is likely to be echoed by other
East Asian economies; however, such declines
will be somewhat more limited than the declines
experienced in some other potential emerging
economy poles, such as Russia (where investment
will fall by more than 9 percent of GDP). The
concern here is that in some emerging economies,
the decline in investment may be more than is
optimal, given their stage of development.
will be inadequate for achieving growth rates sig-
nifi cantly higher than the baseline.
The baseline scenario also has a relatively
slower-growing Russia over 2011–25. Thus, in
spite of anticipated improvements to Russian
labor productivity and expected robust global
energy demand, domestic political economy con-
cerns in Russia—including eroding confi dence
in the rule of law and property rights—will hold
back an otherwise solid growth picture.
Consumption, investment , and current
account patterns. In the baseline scenario, con-
sumption and investment trends will demon-
strate signifi cant shifts over the 15-year modeling
horizon (fi gure 1.18, panel a). East Asian econo-
mies, especially China, will raise their consump-
tion shares in national output to levels close to
those of the United States and India. For China,
in particular, this increased consumption share
will be noteworthy: a rise from 41 percent to 55
percent of GDP. Although it is presently diffi-
cult to imagine such a sharp rise in consumption
by the chronically underconsuming East Asian
0
1
2
3
4
5
6
7
emerging advanced emerging advanced
% g
row
th1996–2010 2011–2025
FIGURE 1.17 Output growth for emerging and advanced economies, 15-year average, 1996–2010 (historical) and 2011–25 (baseline scenario)
Source: World Bank staff calculations, from model projections and World Bank WDI database.
Note: Fifteen-year averages reported could signifi cantly understate projected growth rates for any given year, with additional uncertainty from modeling errors. To emphasize the wide range of possible outcomes surrounding the baseline scenario, average growth rates are accompanied by error bars corresponding to the historical 95 percent confi dence interval.
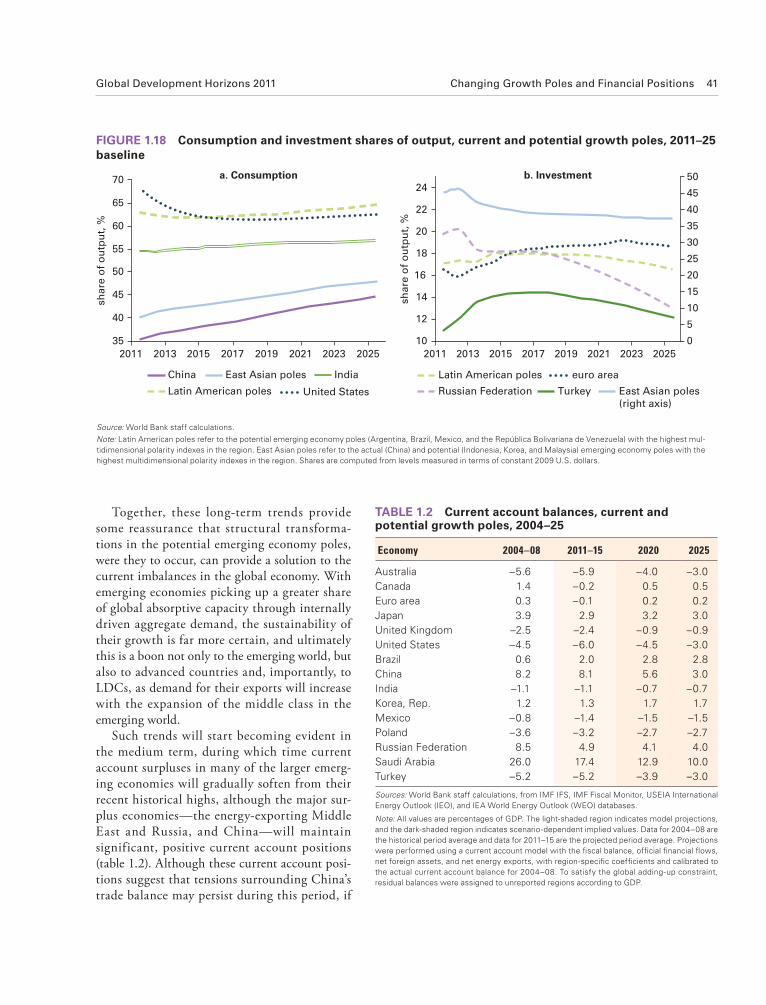
Global Development Horizons 2011 Changing Growth Poles and Financial Positions 41
Together, these long-term trends provide
some reassurance that structural transforma-
tions in the potential emerging economy poles,
were they to occur, can provide a solution to the
current imbalances in the global economy. With
emerging economies picking up a greater share
of global absorptive capacity through internally
driven aggregate demand, the sustainability of
their growth is far more certain, and ultimately
this is a boon not only to the emerging world, but
also to advanced countries and, importantly, to
LDCs, as demand for their exports will increase
with the expansion of the middle class in the
emerging world.
Such trends will start becoming evident in
the medium term, during which time current
account surpluses in many of the larger emerg-
ing economies will gradually soften from their
recent historical highs, although the major sur-
plus economies—the energy-exporting Middle
East and Russia, and China—will maintain
significant, positive current account positions
(table 1.2). Although these current account posi-
tions suggest that tensions surrounding China’s
trade balance may persist during this period, if
35
40
45
50
55
60
65
70
2011 2013 2015 2017 2019 2021 2023 2025
share
of
ou
tpu
t, %
10
12
14
16
18
20
22
24
2011 2013 2015 2017 2019 2021 2023 2025
share
of
ou
tpu
t, %
0
5
15
25
35
45
10
20
30
40
50a. Consumption b. Investment
Latin American poles United States
East Asian polesChina India euro area
Turkey
Latin American poles
East Asian poles(right axis)
Russian Federation
FIGURE 1.18 Consumption and investment shares of output, current and potential growth poles, 2011–25 baseline
Source: World Bank staff calculations.
Note: Latin American poles refer to the potential emerging economy poles (Argentina, Brazil, Mexico, and the República Bolivariana de Venezuela) with the highest mul-tidimensional polarity indexes in the region. East Asian poles refer to the actual (China) and potential (Indonesia, Korea, and Malaysia) emerging economy poles with the highest multidimensional polarity indexes in the region. Shares are computed from levels measured in terms of constant 2009 U.S. dollars.
TABLE 1.2 Current account balances, current and potential growth poles, 2004–25
Economy 2004–08 2011–15 2020 2025
Australia –5.6 –5.9 –4.0 –3.0
Canada 1.4 –0.2 0.5 0.5
Euro area 0.3 –0.1 0.2 0.2
Japan 3.9 2.9 3.2 3.0
United Kingdom –2.5 –2.4 –0.9 –0.9
United States –4.5 –6.0 –4.5 –3.0
Brazil 0.6 2.0 2.8 2.8
China 8.2 8.1 5.6 3.0
India –1.1 –1.1 –0.7 –0.7
Korea, Rep. 1.2 1.3 1.7 1.7
Mexico –0.8 –1.4 –1.5 –1.5
Poland –3.6 –3.2 –2.7 –2.7
Russian Federation 8.5 4.9 4.1 4.0
Saudi Arabia 26.0 17.4 12.9 10.0
Turkey –5.2 –5.2 –3.9 –3.0
Sources: World Bank staff calculations, from IMF IFS, IMF Fiscal Monitor, USEIA International Energy Outlook (IEO), and IEA World Energy Outlook (WEO) databases.
Note: All values are percentages of GDP. The light-shaded region indicates model projections, and the dark-shaded region indicates scenario-dependent implied values. Data for 2004–08 are the historical period average and data for 2011–15 are the projected period average. Projections were performed using a current account model with the fi scal balance, offi cial fi nancial fl ows, net foreign assets, and net energy exports, with region-specifi c coeffi cients and calibrated to the actual current account balance for 2004–08. To satisfy the global adding-up constraint, residual balances were assigned to unreported regions according to GDP.
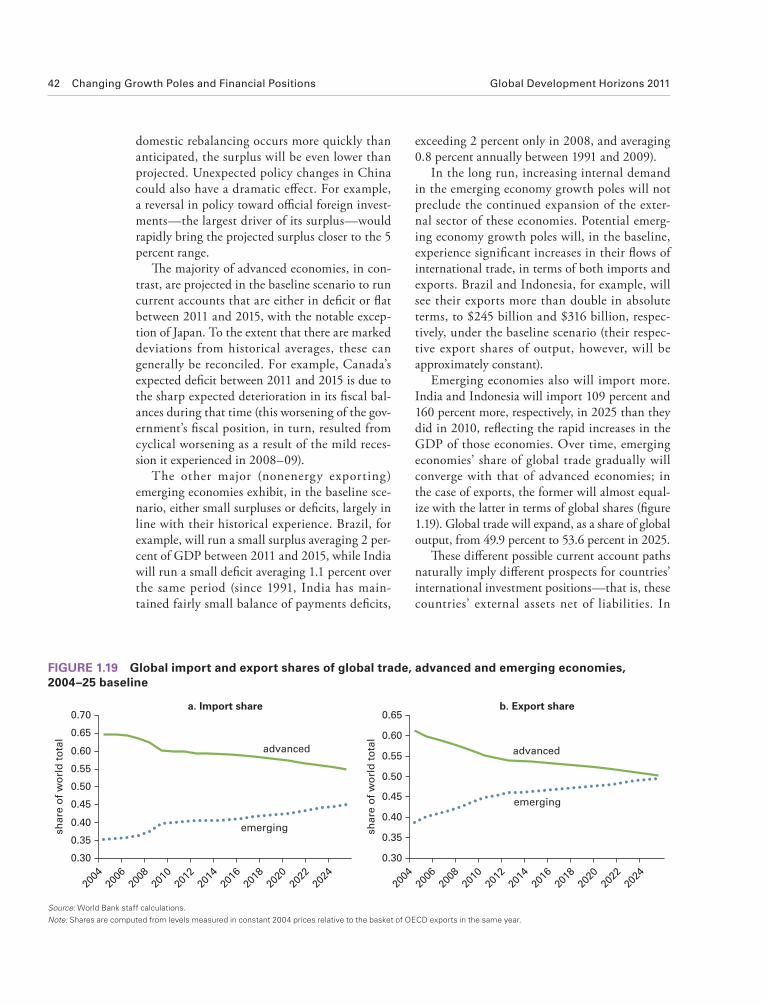
42 Changing Growth Poles and Financial Positions Global Development Horizons 2011
0.30
0.35
0.40
0.45
0.50
0.55
0.60
0.65
0.70
2004
2006
2008
2010
2012
2014
2016
2018
2020
2022
2024
share
of
wo
rld
to
tal
0.30
0.35
0.40
0.45
0.50
0.55
0.60
0.65
2004
2006
2008
2010
2012
2014
2016
2018
2020
2022
2024
share
of
wo
rld
to
tal
emerging
emerging
advanced advanced
a. Import share b. Export share
FIGURE 1.19 Global import and export shares of global trade, advanced and emerging economies, 2004–25 baseline
Source: World Bank staff calculations.
Note: Shares are computed from levels measured in constant 2004 prices relative to the basket of OECD exports in the same year.
domestic rebalancing occurs more quickly than
anticipated, the surplus will be even lower than
projected. Unexpected policy changes in China
could also have a dramatic eff ect. For example,
a reversal in policy toward offi cial foreign invest-
ments—the largest driver of its surplus—would
rapidly bring the projected surplus closer to the 5
percent range.
Th e majority of advanced economies, in con-
trast, are projected in the baseline scenario to run
current accounts that are either in defi cit or fl at
between 2011 and 2015, with the notable excep-
tion of Japan. To the extent that there are marked
deviations from historical averages, these can
generally be reconciled. For example, Canada’s
expected defi cit between 2011 and 2015 is due to
the sharp expected deterioration in its fi scal bal-
ances during that time (this worsening of the gov-
ernment’s fi scal position, in turn, resulted from
cyclical worsening as a result of the mild reces-
sion it experienced in 2008–09).
The other major (nonenergy exporting)
emerging economies exhibit, in the baseline sce-
nario, either small surpluses or defi cits, largely in
line with their historical experience. Brazil, for
example, will run a small surplus averaging 2 per-
cent of GDP between 2011 and 2015, while India
will run a small defi cit averaging 1.1 percent over
the same period (since 1991, India has main-
tained fairly small balance of payments defi cits,
exceeding 2 percent only in 2008, and averaging
0.8 percent annually between 1991 and 2009).
In the long run, increasing internal demand
in the emerging economy growth poles will not
preclude the continued expansion of the exter-
nal sector of these economies. Potential emerg-
ing economy growth poles will, in the baseline,
experience signifi cant increases in their fl ows of
international trade, in terms of both imports and
exports. Brazil and Indonesia, for example, will
see their exports more than double in absolute
terms, to $245 billion and $316 billion, respec-
tively, under the baseline scenario (their respec-
tive export shares of output, however, will be
approximately constant).
Emerging economies also will import more.
India and Indonesia will import 109 percent and
160 percent more, respectively, in 2025 than they
did in 2010, refl ecting the rapid increases in the
GDP of those economies. Over time, emerging
economies’ share of global trade gradually will
converge with that of advanced economies; in
the case of exports, the former will almost equal-
ize with the latter in terms of global shares (fi gure
1.19). Global trade will expand, as a share of global
output, from 49.9 percent to 53.6 percent in 2025.
Th ese diff erent possible current account paths
naturally imply diff erent prospects for countries’
international investment positions—that is, these
countries’ external assets net of liabilities. In
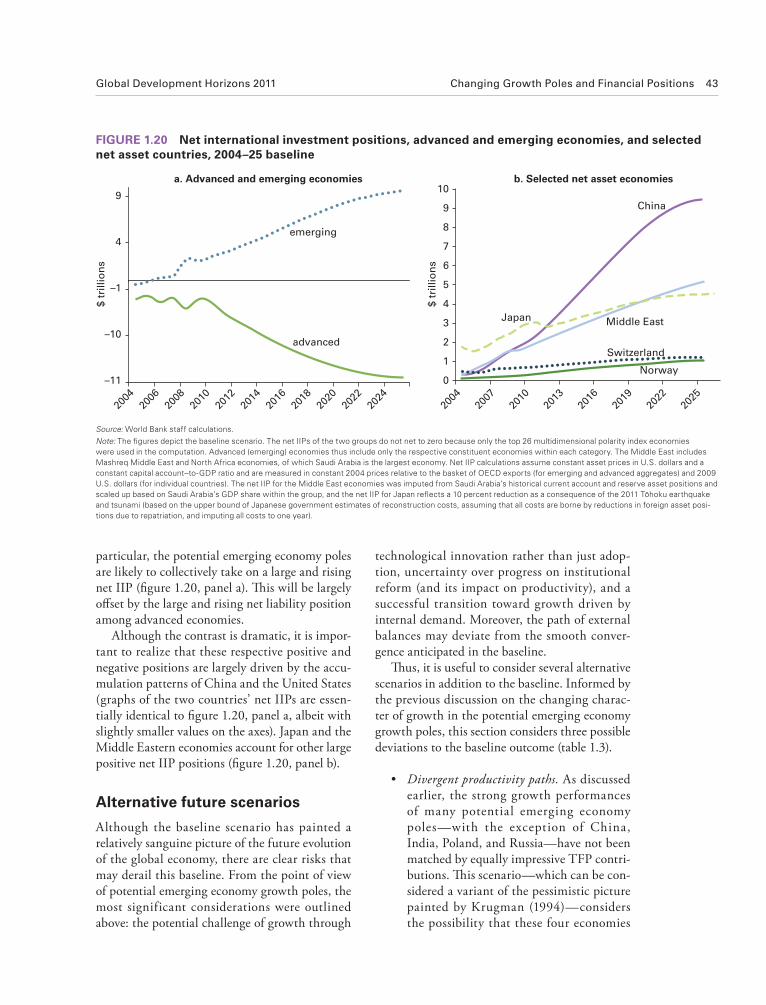
Global Development Horizons 2011 Changing Growth Poles and Financial Positions 43
technological innovation rather than just adop-
tion, uncertainty over progress on institutional
reform (and its impact on productivity), and a
successful transition toward growth driven by
internal demand. Moreover, the path of external
balances may deviate from the smooth conver-
gence anticipated in the baseline.
Th us, it is useful to consider several alternative
scenarios in addition to the baseline. Informed by
the previous discussion on the changing charac-
ter of growth in the potential emerging economy
growth poles, this section considers three possible
deviations to the baseline outcome (table 1.3).
• Divergent productivity paths. As discussed
earlier, the strong growth performances
of many potential emerging economy
poles—with the exception of China,
India, Poland, and Russia—have not been
matched by equally impressive TFP contri-
butions. Th is scenario—which can be con-
sidered a variant of the pessimistic picture
painted by Krugman (1994)—considers
the possibility that these four economies
particular, the potential emerging economy poles
are likely to collectively take on a large and rising
net IIP (fi gure 1.20, panel a). Th is will be largely
off set by the large and rising net liability position
among advanced economies.
Although the contrast is dramatic, it is impor-
tant to realize that these respective positive and
negative positions are largely driven by the accu-
mulation patterns of China and the United States
(graphs of the two countries’ net IIPs are essen-
tially identical to fi gure 1.20, panel a, albeit with
slightly smaller values on the axes). Japan and the
Middle Eastern economies account for other large
positive net IIP positions (fi gure 1.20, panel b).
Alternative future scenarios
Although the baseline scenario has painted a
relatively sanguine picture of the future evolution
of the global economy, there are clear risks that
may derail this baseline. From the point of view
of potential emerging economy growth poles, the
most significant considerations were outlined
above: the potential challenge of growth through
–11
–10
–1
4
9
2004
2006
2008
2010
2012
2014
2016
2018
2020
2022
2024
$ t
rillio
ns
$ t
rillio
ns
2004
2007
2010
2013
2016
2019
2022
2025
0
1
2
3
4
5
6
7
8
9
10b. Selected net asset economiesa. Advanced and emerging economies
emerging
advanced
Middle East
China
Japan
Switzerland
Norway
FIGURE 1.20 Net international investment positions, advanced and emerging economies, and selected net asset countries, 2004–25 baseline
Source: World Bank staff calculations.
Note: The fi gures depict the baseline scenario. The net IIPs of the two groups do not net to zero because only the top 26 multidimensional polarity index economies were used in the computation. Advanced (emerging) economies thus include only the respective constituent economies within each category. The Middle East includes Mashreq Middle East and North Africa economies, of which Saudi Arabia is the largest economy. Net IIP calculations assume constant asset prices in U.S. dollars and a constant capital account–to-GDP ratio and are measured in constant 2004 prices relative to the basket of OECD exports (for emerging and advanced aggregates) and 2009 U.S. dollars (for individual countries). The net IIP for the Middle East economies was imputed from Saudi Arabia’s historical current account and reserve asset positions and scaled up based on Saudi Arabia’s GDP share within the group, and the net IIP for Japan refl ects a 10 percent reduction as a consequence of the 2011 To- hoku earthquake and tsunami (based on the upper bound of Japanese government estimates of reconstruction costs, assuming that all costs are borne by reductions in foreign asset posi-tions due to repatriation, and imputing all costs to one year).

44 Changing Growth Poles and Financial Positions Global Development Horizons 2011
languish in lower levels of TFP growth. In
eff ect, the emerging world fractures into a
“two-speed” world, with four economies
continuing to grow rapidly in economic
size and infl uence and the others settling
into a lower growth path.
manage to attain high levels of TFP
growth (and, implicitly, make the transi-
tion from technological adoption to greater
innovative capacity), whereas other emerg-
ing economies exhaust the gains from fac-
tor accumulation and reallocation, and
TABLE 1.3 Key perturbations for a l ternative growth and external balance scenarios
Economy 2004–08 2020 2025 2004–08 2020 2025
Divergent productivity
(productivity growth, %)Unbalanced growth
(domestic saving, % GDP)
Euro area 0.4 1.8 0.8 22.0 23.8 22.8
Japan 0.6 1.1 1.1 27.0 22.7 22.2
United States −0.1 0.1 −0.1 13.0 21.3 20.5
United Kingdom 0.6 2.7 1.2 14.5 9.9 9.1
Brazil 3.1 0.7 1.2 19.1 19.0 17.3
China 6.1 4.1 6.0 49.5 46.8 47.1
India 4.2 2.0 4.4 29.0 28.9 28.1
Korea, Rep. 1.2 2.6 2.3 30.8 24.0 24.0
Malaysia 1.8 0.3 −0.5 41.1 33.4 33.4
Mexico 1.4 0.5 −0.3 20.2 17.1 14.7
Poland 5.1 4.7 5.4 16.3 10.3 8.5
Russian Federation 10.1 3.5 4.5 29.1 20.1 15.7
Singapore 6.5 2.7 1.7 44.2 35.6 35.9
Thailand 3.6 7.5 11.4 30.8 20.5 20.7
Continued imbalances Total rebalancing
(current account balance, % GDP)
Australia −4.6 −4.9 −4.9 −4.6 −2.5 0.0
Canada 0.4 0.5 0.5 0.4 0.3 0.0
Euro area 1.3 0.2 0.2 1.3 0.1 0.0
Japan 3.9 3.4 3.4 3.9 1.7 0.0
United Kingdom −1.5 −0.9 −0.9 −1.5 −0.4 0.0
United States −4.5 −5.4 −5.9 −4.5 −2.9 0.0
Brazil 0.6 2.8 2.8 0.6 1.4 0.0
China 8.2 8.2 8.2 8.2 4.0 0.0
India −1.1 −0.7 −0.7 −1.1 −0.4 0.0
Korea, Rep. 1.2 1.7 1.7 1.2 0.8 0.0
Mexico −0.3 −1.5 −1.5 −0.3 −0.7 0.0
Poland −2.6 −2.7 −2.7 −2.6 −1.3 0.0
Russian Federation 8.5 4.1 4.1 8.5 2.0 0.0
Saudi Arabia 26.0 15.7 15.8 26.0 7.8 0.0
Turkey −5.2 −4.7 −4.8 −5.2 −2.4 0.0
Source: World Bank staff calculations.
Note: Productivity is measured as the growth rate of (services) labor productivity, rather than TFP directly. This is because TFP is defi ned as the residual in a growth decomposition, but a computable general equilibrium model does not generally embed such residuals, so productivity changes are typically attributed to labor instead. It can be shown that there is a close link between TFP growth and labor productivity growth (Barro 1999), especially if labor quality and the return on capital do not vary much. The (baseline) unperturbed productivity growth rates for China, India, Poland, and Russia are 2.9, 0.9, 3.5, and 2.3 percent for 2020, respectively, and 3.7, 2.1, 3.1, and 2.2 percent for 2025, respectively. The (baseline) unper-turbed saving rates for China, Korea, Malaysia, Singapore, and Thailand are 42.6, 22.0, 32.0, 29.0, and 16.4 percent for 2020, respectively, and 39.1, 20.0, 29.9, 20.5, and 12.0 percent for 2025, respectively.

Global Development Horizons 2011 Changing Growth Poles and Financial Positions 45
trading relations break down, forcing exter-
nal accounts toward autarky.
A detailed analysis of these scenar ios is under-
taken in annex 1.7. The main lessons are as
follows:
• Th e divergent productivity scenario suggests
that the two-track global economy may
fracture even further, into a slowly divergent
path for growth between advanced econo-
mies, low-productivity developing econo-
mies, and high- productivity developing
economies. Whether this occurs depends
on whether economies such as Argentina,
Brazil, Indonesia, and Korea are able per-
manently to raise their TFP performances.
• The unbalanced internal growth scenario
suggests that successfully navigating
the int ernal realignment process toward
domestic sources of growth depends not
only on internal structural adjustment
policies, but also on successful external
accounts management. This interdepen-
dence points to the need for surplus nations
to eff ect internal and external rebalancing
eff orts simultaneously.
• The global external balances scenarios
suggest that the evolution of domestic
investment, in particular, depends on
the manner by which global imbalances
unfold. Imposing total rebalancing on sur-
plus economies (such as China, Russia, and
the oil-exporting economies of the Middle
East) tends to lead to a relatively slower rate
of decline (or an actual increase) in those
countries’ investment shares, with the con-
verse holding true for deficit economies
such as India, Poland, and Turkey.
Growth Poles and Multipolarity in the Future World EconomyTh e world of 2025 truly will be multipolar. Using
the baseline numbers for 2021–25, it appears
that the current three growth poles will be
joined by India (table 1.4). Indeed, the top seven
economies—China, the euro area, the United
• Unbalanced internal growth. As mentioned
previously, a transition to strong, sus-
tainable absorption among the emerging
economy potential growth poles is central
to realigning these economies away from
external sources of growth. Th is scenario
considers the possibility that internal
reforms designed to support higher levels
of internal demand in outward-oriented
economies—China, Korea, Malaysia,
Singapore, and Thailand—do not result
in a substantive increase in consump-
tion shares, and the scenario explores the
implications of such continued high saving
on investment. To incorporate the pos-
sible eff ects of capital leakage, the scenario
allows for external accounts to either fol-
low the baseline path or to hold constant at
2015 levels from 2016 onward.
• Global external balances. A fi nal set of sce-
narios traces the two polar outcomes for
global imbalances. The first possibility
is a situation in which imbalances per-
sist, resulting in a continuation of current
account balances along the medium-term
path (the assumption imposes 2015 lev-
els of the current account through 2025).
Th is could be due to policy inaction, such
as unwillingness to undertake major fi scal
adjustments. Under this scenario, finan-
cial development in developing economies
remains sluggish, while advanced econo-
mies maintain their comparative advan-
tage in investment opportunities (Dooley,
Folkerts-Landau, and Garber 2009).
Under the second external balance sce-
nario, a major reversal in the pattern of
global external balances occurs, with a
total rebalancing by 2025, when all cur-
rent account balances reach zero (the
actual adjustment path to zero is assumed
to be linear). This reversal could result
from distinct improvements in the invest-
ment opportunities available in surplus
emerging economies, occurring in concert
with rapid fi nancial market development,
along with acute fiscal consolidation in
advanced economies. Another, admittedly
extreme, possibility is that international

46 Changing Growth Poles and Financial Positions Global Development Horizons 2011
spite of its smaller size relative to advanced econo-
mies such as Japan and the United Kingdom,
India’s robust growth through the end of 2025
will mean that its contribution to global growth
will surpass that of any individual advanced
economy (except the United States). Together, the
simple polarity indexes of China and India will be
nearly twice that of the United States and the euro
area by 2025.
Th e remainder of the potential growth poles
is likely to be a mix of advanced and emerging
economies. Japan and the United Kingdom, for
example, will play important supporting roles in
global growth dynamics, alongside Indonesia and
Brazil. Indonesia’s prominence in growth polarity
is somewhat of a surprise, appearing higher in the
indexes than Brazil, Canada, or Russia (econo-
mies that will be almost twice Indonesia’s size).
Depending on the index, there is some movement
in and out of the top 15 countries closer to the
bottom.
Current discussions often assert that the world
of the future will be more multipolar. Insofar
as the distribution of economic activity is con-
cerned, this undoubtedly will be the case. An
States, India, Japan, the United Kingdom, and
Indonesia—are the same whether measured by
the simple polarity index (table 1.4, fi fth column),
or if computed from an alternative measure that
better captures the trade channel of growth spill-
overs (table 1.4, sixth column).36 Th is mix, com-
prising both advanced and emerging economies,
underscores how diff erent the distribution of eco-
nomic power is likely to be in the future, com-
pared to just a decade ago, or even today.
China tops both polarity indexes in 2025, a
refl ection of the expected continued dynamism of
its economy and its increasingly large relative eco-
nomic size. China will contribute about one-third
of global growth at the end of the period, far more
than any other economy. Nevertheless, advanced
economies, especially the United States and the
euro area, will continue to serve as engines for the
global economy. Th is outcome is likely to occur
even in the presence of a decline in the consump-
tion share of the United States (and, to a lesser
extent, the euro area) and modest growth rates
relative to emerging economies.
Under the baseline scenario, India will join
China as an emerging economy growth pole. In
TABLE 1.4 Measures of growth poles, top 15 countries, 2021–25 baseline average
EconomyOutput (constant 2009 $, trillions)
Contribution to global growth (%)
Simple growth polarity index
Alternate growth polarity index
China 13.9 6.6 0.94 96.46 72.96
Euro area 18.3 1.9 0.38 38.95 37.93
United States 18.8 1.2 0.24 24.36 29.56
India 3.0 5.4 0.17 17.26 13.21
Japan 6.3 1.3 0.09 9.15 10.01
United Kingdom 3.4 2.0 0.07 7.53 8.68
Indonesia 1.2 5.8 0.07 7.46 6.46
Brazil 2.4 2.4 0.06 6.21 4.57
Russian Federation 2.0 1.9 0.04 4.12 2.94
Canada 2.1 1.8 0.04 4.01 3.91
Korea, Rep. 1.4 2.6 0.04 4.00 5.55
Australia 1.5 2.1 0.03 3.50 4.55
Middle East 1.8 1.6 0.03 3.16 1.88
Sweden 0.8 3.7 0.03 3.08 3.37
Turkey 1.0 2.3 0.03 2.64 1.73
Source: World Bank staff calculations.
Note: The shaded region indicates poten tial poles, with the cutoff determined by the fi rst signifi cant break on the index (from below). The simple index was generated from size-weighted GDP growth rates normalized to the maximum and minimum of the full 1968–2025 period. The alternate index was generated from the absorption-weighted growth share and normalized to the maximum and minimum of the 2006–25 period. Both indexes use output levels calculated from data in constant 2009 U.S. dollars. The Middle East includes Mashreq Middle East and North Africa economies, of which Saudi Arabia is the largest economy. The top 15 countries in the alternate index exclude the Middle East and Turkey, but include Argentina (2.19) and South Africa (2.12).
GD01_13-72.indd 46GD01_13-72.indd 46 5/13/2011 2:50:47 PM5/13/2011 2:50:47 PM

Global Development Horizons 2011 Changing Growth Poles and Financial Positions 47
of the nonindustrialized nations from the fi nan-
cial crisis may well attest to the start of a trend
decoupling that is likely to grow stronger as the
emerging world continues to mature (Canuto and
Giugale 2010). Such diversifi cation bodes well for
the new multipolar world.
Policy Challenges and the Development AgendaChallenges and risks to sustained growth in the potential emerging economy poles
The forward march of the potential emerging
economy growth poles is likely to be accompa-
nied by the continued evolution of productive
capacity and internal demand, which in turn is
reliant on domestic developments in these econo-
mies. Th e recent strong growth performance in
the emerging economies may, however, mask
the signifi cant domestic development challenges
of any given potential pole. Th ese challenges are
quite real and, as such, pose risks that can derail
a potential growth pole’s otherwise robust growth
performance. Such challenges are closely related
to the underlying factors that inf luence their
growth polarities: institutions, demographics,
and human capital.
The f irst set of challenges involves suc-
cessful institutional reform in the different
index of multipolarity that is based on economic
size clearly points to a world that has gradually
become more multipolar since 1968, and will
become even more so in the future (fi gure 1.21):
the normalized concentration index calculated
from shares of GDP falls steadily by more than
40 percent from 1968 to 2025. In a signifi cant
way, then, the trend of increasing multipolarity is
likely to continue.
However, a more diffused distribution of
global economic activity does not in fact imply a
more balanced distribution of economic growth
contributions. While growth polarity in the
2021–25 period will continue to be more dif-
fused than in the 20th century—the normalized
concentration index based on the simple polarity
measure in 2025 is 0.046, compared with 0.059
at the end of the 1990s and more than twice that
in the early 1970s (fi gure 1.21)—the declining
trend in the index reaches a minimum of 0.030
around 2008, pointing to the likelihood that the
global economic impact of growth spillovers in
2025 may in fact emanate from fewer countries
than today (at least by this measure).37
Th e notion that the postcrisis global economic
environment will be fundamentally different
from the environment of the past has gained con-
siderable ground in some academic and policy
circles. Th e reality of the multipolar world of the
future is likely to be somewhat more nuanced.
Advanced countries will continue to play a cen-
tral role in the global economy in 2025, and
while they are expected to grow more sluggishly
than developing countries, the economic size of
advanced countries (in real terms) will counter-
balance this slower rate of growth. Still, size is
not everything, and the economic infl uence of
the large emerging economies will be increas-
ingly palpable.38 Th e fi nancial crisis could well
have marked a certain turning point in interna-
tional economic relations, paving the way for a
larger role for developing countries as the global
economy becomes more multipolar.
Th us, in spite of the severe pain caused by the
global fi nancial crisis, the event may well have
consolidated transformations in the global econ-
omy that will ensure its future resilience. A more
diffuse distribution of growth poles will mean
a world that better weathers shocks and is more
resilient to crises; indeed, the fairly rapid recovery
0.122
Herfindahl-Hirschman(simple index) 0.059
0.030
0.046
0.169
0.154
Herfindahl-Hirschman(economic size)
0.1230.103
0
0.02
0.04
0.06
0.08
0.10
0.12
0.14
0.16
0.18
0.20
1968
1972
1976
1980
1984
1988
1992
1996
2000
2004
2008
2012
2016
2020
2024
mu
ltip
ola
rity
in
dex
FIGURE 1.21 Evolution of multipolarity, economic size and simple polarity index, 1968–2025 (projected)
Source: World Bank staff calculations.
Note: Multipolarity index calculated as the normalized Herfi ndahl-Hirschman index of GDP and simple polarity index shares of the top 15 economies, computed over rolling 5-year averages.

48 Changing Growth Poles and Financial Positions Global Development Horizons 2011
further enhance human capital and stimulate
domestic technological adaptation, innovative
capacity, and knowledge generation. Successfully
negotiating these changes also holds the potential
to spur the growth of other economies—in Latin
America, South Asia, and elsewhere.
Development impacts and LDCs
Although the multipolar world is ultimately
about the realignment of economic poles away
from advanced economies and toward develop-
ing economies, some countries nonetheless will
remain in the periphery of the system. This is
especially the case for LDCs, which have strug-
gled to sustain growth in a global economy over
which the LDCs have little infl uence or control.
It is important to recognize, therefore, that the
new multipolar world may raise a new set of
development issues that are unique to the fact
that many of the new major drivers of the world
economy are also developing economies.
In and of itself, multipolarity should be posi-
tive for economies that are not growth poles. A
more diff use distribution of global growth should
help mitigate volatility from idiosyncratic shocks
experienced in any given pole. Consequently,
economies that are not growth poles can enjoy
greater stability of external demand. Moreover,
some LDCs may well benefi t from having new
external drivers (from emerging economies)
stimulating their domestic growth. Such growth
will ultimately accrue to the poor living in those
LDCs (Dollar and Kraay 2002), as well as to the
poor within the potential emerging economy
growth poles.
Such growth spillovers are likely to occur via
the trade channel. Th e expansion of South-South
trade in the future will continue the consolidation
of trade-induced growth. Over the past decade,
the economic complementarities between the
large potential emerging economy growth poles
and LDCs—the former tend to have compara-
tive advantage in manufactures, and the latter in
commodity inputs—have undergirded both ris-
ing intensity in bilateral trade (fi gure 1.22) and
rapid growth (IMF 2011). Such complementa-
rities, which are clearly evident from the distinct
dominant categories of LDC imports and exports
potential emerging economy poles. In order for
these emerging economies to adapt to the changes
inherent in their new global roles, domestic insti-
tutions—broadly defi ned to include governance
structures in the economic, fi nancial, and social
sectors—will need to refl ect the new economic
realities. China, India, Indonesia, and Russia all
face distinct institutional and governance chal-
lenges, and maintaining f lexibility in terms of
institutional reform is critical for establishing and
consolidating their positions as growth poles.
Several of the potential emerging economy
growth poles also face demographic concerns.
This is especially the case for China, Korea, and
Singapore, all of which will face a rising old-age
dependency ratio in the years ahead. Absent produc-
tivity improvements, especially in the development
of indigenous innovative capacity, the burden of
older populations will likely be a drag on the vitality
of their economies. Th is point has not been lost on
policy makers in these three countries, as evidenced
by the very high levels of R&D expenditure under-
taken in recent years, along with national initiatives
aimed at enhancing domestic innovation.
Finally, human capital is a concern in some
potential growth poles, particularly in Brazil,
India, and Indonesia. Reducing educational gaps
and ensuring access to education is central, since
promoting such an enabling environment would
0
10
20
30
40
50
60
1991 1993 1995 1997 1999 2001 2003 2005 2007 2009
perc
en
t
G-3
BRIICK
FIGURE 1.22 Shares of total LDC bilateral trade, selected advanced and emerging economies, 1991–2010
Source: World Bank staff calculations, from IMF DOT database.
Note: LDCs include all LDCs except Bhutan, Eritrea, Lesotho, and Timor-Leste (due to data limitations). G-3 economies are the euro area, Japan, and the United States; BRIICK econo-mies are Brazil, Russia, India, Indonesia, China, and Korea.

Global Development Horizons 2011 Changing Growth Poles and Financial Positions 49
a. Exports, mineral fuels (SITC3)
export share,SITC3 (right axis)
exports, SITC3
0
2
4
6
8
10
12
1991 1993 1995 1997 1999 2001 2003 2005 2007 2009
$ b
illio
ns
0
10
20
30
40
50
60
70
80
90
exp
ort
sh
are
, %
b. Imports, manufactured goods (SITC6) and machinery (SITC7)
import share,SITC6+7 (right
axis)
imports,SITC6+7
0
2
4
6
8
10
12
1991 1993 1995 1997 1999 2001 2003 2005 2007 2009
$ b
illio
ns
0
10
20
30
40
50
60
70
imp
ort
sh
are
, %
FIGURE 1.23 Dominant LDC merchandise exports to and imports from selected emerging economies
Source: World Bank staff calculations, from UN COMTRADE database.
Note: SITC = Standard International Trade Classifi cation. The selected emerging economies are Brazil, China, India, Indonesia, Korea, and Russia. Dominant fl ow selected on the basis of export/import share rank for the majority of years.
vis-à-vis the major emerging economies (fi gure
1.23), suggest that the resulting impact on LDCs’
terms of trade has been an overall improvement.
Th e fi nancing channel can also be important,
especially in terms of South-South FDI f lows.
As discussed in detail in chapter 2, merger and
acquisition and greenfi eld activity can spur natu-
ral resource (and some manufacturing) produc-
tion capacity in LDCs, stimulate local employ-
ment, and promote technology transfer. Since
the sectoral composition of FDI outfl ows from
the potential emerging economy poles is likely to
diff er from those of the advanced economy poles,
LDCs could benefi t from the diversifi cation of
their economies that results from such direct
investment fl ows.
Multipolarity could also have a tangible
impact on international foreign aid patterns.
Offi cial development assistance (ODA) to LDCs
from Development Assistance Committee (DAC)
countries has been fairly static since the 1980s,
fl uctuating between 4.5 and 8.5 percent of LDC
GDP (fi gure 1.24). Over time, increased ODA
disbursements by the potential emerging econ-
omy poles may well push ODA to greater shares.
Bilateral ODA from Saudi Arabia, for example,
increased by a factor of almost thirty in the
decade between 1998 and 2009, rising from $107
million to $2.9 billion. Turkey’s bilateral ODA
has similarly increased by an order of magnitude
0
1
2
3
4
5
6
7
8
9
1960 1964 1968 1972 1976 1980 1984 1988 1992 1996 2000 2004 2008
% G
DP
Source: World Bank staff calculations, from OECD DAC and World Bank WDI databases.
Note: ODA disbursements from OECD DAC member countries to LDCs, shown as a percent-age of total LDC GDP.
FIGURE 1.24 Net ODA from DAC countries to LDCs as share of LDC GDP, 1960–2008
over the same period. China’s LDC aid in 2009
constituted about 40 percent of their total dis-
bursements, with the largest share of this des-
tined for Sub-Saharan Africa.
However, there is considerable nuance in the
actual impact for a given country. For instance,
the nature of global demand for the main exports
from many LDCs—typically commodities and
mineral resources—could change substantially,
and LDCs that are net importers of those goods
may face rising global prices (box 1.6). Even when
an LDC possesses a comparative advantage in the

50 Changing Growth Poles and Financial Positions Global Development Horizons 2011
The causes of high commodities prices are multifac-
eted and interact in complicated ways. The combina-
tion of changes in the global climate (and associated
weather-related shocks), increased financialization
in commodities markets, energy policy (especially
with regard to biofuels such as ethanol), and rising
incomes in developing countries all play a role in
inducing price spikes in commodities markets. Rising
price pressures can also be compounded by govern-
ment policies: food and oil subsidies, export bans,
tariff barriers, precautionary hoarding, and even mac-
roeconomic policies (such as monetary and exchange
rate policies).
Historically, high prices have not been persistent
across time. Most past episodes of rising commodities
prices have often been relieved as geopolitical shocks
fade and supply responses—such as increased explora-
tion, technological innovation, and expanded inputs—
react to high prices (fi gure B1.6.1, panel a). Moreover,
previous cases of high commodity prices had led to
peaks for certain commodity classes that were higher, in
real terms, than they are today.
However, the nature of multipolarity may mean that
the traditional mechanisms that have relieved price
pressure in the past may not be operative, at least for
some commodity classes. The run-up in commodi-
ties prices from 2003–08 was both more sustained
and much more broad-based than in the past. This
may well have been due to a much more persistent
demand component (especially in extractive commodi-
ties)—owing to the rise of potential emerging economy
poles—and, hence, raises questions of whether supply
responses can keep up.
This is especially the case for metals. While sub-
stantial yield gaps exist for agricultural outputs—espe-
cially in African economies—the ability to raise mineral
extraction rates may be more limited, especially if ris-
ing energy prices render marginal extractions from the
resource base economically infeasible. The commod-
ity intensity of metal use has steadily increased since
BOX 1.6 Mul tipolarity and commodities
FIGURE B1.6.1 Commodities price index, 1948–2010, and commodity intensity of demand, 1971–2010
Sources: World Bank staff calculations, using FAOSTAT, IEA World Energy Outlook (WEO), and WBMS World Metal Statistics databases.
Note: The respective commodities indexes are real, manufactures unit value–defl ated aggregates, with 2000 prices as the base year. The commodity inten-sity of demand is defi ned as commodity use per unit of GDP, each respectively normalized to 1971 values as the base year.
0
50
100
150
200
250
300
com
mo
dit
y i
nd
ex
1973 Arab-Israeli War
Islamic RepublicRevolution
a. Commodities price index b. Commodity intensity of demandCommodities boomKorean War
0.65
0.70
0.75
0.80
0.85
0.90
0.95
1.00
1.05
1.10
com
mo
dit
y i
nte
nsi
ty o
f d
em
an
d
1948
1960
1954
1966
1972
1978
1984
1990
1996
2002
2008
1971
1974
1977
1980
1983
1986
1989
1992
1995
1998
2001
2004
2007
agriculture energymetals agriculture energymetals

Global Development Horizons 2011 Changing Growth Poles and Financial Positions 51
1994 (fi gure B1.6.1, panel b), primarily due to demand
from China (World Bank 2009a).
As economies such as India undergo structural
transformations of their own, their demand for met-
als may well follow a similar pattern, thus maintaining
upward price pressures in those commodities, even as
demand from China eases as a result of moderations
in both its investment rate and manufacturing capacity
growth.
More generally, the rise in real metals prices may
reflect a supercycle phenomenon (Cuddington and
Jerrett 2008) that has occurred several times before
over the past 150 years, resulting from large econo-
mies undergoing major structural transformations due
to mass industrialization and urbanization. To the extent
that China, India, and other potential emerging economy
poles will undergo such structural changes in the future,
high metals prices may be more persistent than prices
for agricultural or energy commodities (which also dis-
play more substitutability over the longer run).
The bottom line is that, in a more multipolar world,
the large, fast-growing emerging economies will be
more important participants in global commodity mar-
kets. Principally, this means that demand pressures
from such economies may matter more at the mar-
gin. Rapid growth in emerging economies may also
have secondary effects, possibly through their impact
on the environment (and thus affecting supply). As a
result, policy approaches of the past—such as chang-
ing government policies with respect to ethanol, or lim-
iting hoarding behavior—may have less of an impact
on future commodity prices.
BOX 1.6 (continued)
export of a given commodity or resource in high
global demand, if its future growth is export-
biased, its terms of trade could deteriorate and,
in the worst case, that LDC could suffer from
immiserizing growth.
Moreover, the actual long-term market impact
of such rising demand depends on global supply
responses. If other potential emerging economy
poles increase their production of these goods—
for example, if Argentina, Brazil, and Russia
raise their agricultural output to cater to higher
demand—LDCs may fi nd themselves unable to
capitalize on the spillover eff ects of growth in, say,
China and India. Th is inability is compounded
by the fact that the eff ect of reduced growth vola-
tility from trade openness is conditioned by the
degree of export diversifi cation (Haddad, Lim,
and Saborowski 2010). Th us, economies that are
relatively open but not well diversifi ed, such as
Malawi or Zambia, may in fact experience greater
volatility of output as their trade with the poten-
tial emerging economy growth poles intensifi es.
AnnexesAnnex 1.1: Growth pole computation
Th e most stra ightforward measure of a growth
pole is a given economy’s contribution to global
growth:
Δ=
-1
,itit
t
yP
Y
where yit is the GDP of country i at time t; Yt is
global GDP, which is an aggregation of GDP for
all countries in the same period; and Δyit ≡ yit −
yit-1 is the change in the output of economy i. Th e
above equation can be rewritten as follows:
−= 1 ,. ,it it y itP s g
where sit ≡ yit/Yt is the global share of economy i at time t and gy,it is its GDP growth rate, which
means that a growth pole as defi ned above is sim-
ply the size-adjusted growth rate of the economy.
52 Changing Growth Poles and Financial Positions Global Development Horizons 2011
where fdiit is total FDI (infl ows and outfl ows) for
country i at time t, and FDIt is total global FDI.
Th e use of bidirectional FDI fl ows is consistent
with the empirical evidence that FDI promotes
technology transfer, regardless of its direction.
Growth poles can have a spillover inf lu-
ence through labor movement, especially (but
not limited to) the migration of skilled workers.
The migration channel not only serves to alle-
viate potential labor supply shortages—while
equilibrating domestic wages with global levels
through factor price equalization—but also can
carry valuable human capital and embedded
knowledge across borders. Migration-weighted
poles are defi ned as follows:
= ,. ,M it
it y itt
emP g
IM
where emit is the net emigration from country i at time t, and IMt is the sum of net immigration
across countries. Alternatively, it is possible to
focus on only the stock of migrants—as a proxy
for knowledge spillovers and network eff ects ema-
nating from a pole country to the migrants’ home
country—in which case the relevant measure
would use, as a weight, the country’s immigrant
stock share instead:
= ,. ,M it
it y itt
P g′ πΠ
where πit is the immigrant stock resident in coun-
try i at time t, and ∏t is the sum of all migrants
worldwide.
Finally, it is possible to attempt to directly
measure the effect of technological spillovers
from a pole:
= ,. ,A it
it y itt
aP g
A
where ait is a measure of technological spillovers
by country i at time t, and At is technological
spillovers for the world as a whole. By and large,
Tit is not directly observable. Nonetheless, it can
be proxied by various indicators of innovation
and technology.
The simple polarity measure used in this
book uses only relative GDP share as a weight,
which serves as a proxy for all the diff erent spill-
over channels. Th e benchmark multidimensional
Although the above defi nition is the most intui-
tive and direct approach to decomposing the
relative contribution of each country to global
growth, such a measure is incomplete, as it fails
to embody the manner by which growth poles
exert their polarity, in the sense of capturing the
transmission and spillover mechanisms for the
country’s growth to others in its economic space.
Th e natural extension is then to allow for such
alternative channels of growth transmission.
This includes poles that capture trade-related
spillovers:
= ,. ,it
it y itt
mP g
X
Τ
where mit is the total imports of country i at
time t, and Xt is total global exports. Such a pole
would not only have the direct eff ect of increas-
ing their trading partners’ growth through export
expansion, but would also have an indirect eff ect
of facilitating technology transfer through trade
linkages. A broader measure of demand would be
premised on domestic absorption:
= ,. ,it
it y itt
dP g
X
Τ′
where absorption dit = cit + iit + git is composed
of consumption c, investment i, and government
spending g, all for country i at time t.Th e natural counterpart to a trade-weighted
growth measure is to utilize financial f lows as
weights instead:
,. ,F it
it y itt
foP g
FI=
where foit is the capital outfl ows from country i at
time t, and FIt is aggregate global capital infl ows.
In this case, a country serves as a growth pole by
sending investment capital abroad, which serves to
directly ease liquidity constraints in recipient econ-
omies, while also providing indirect benefi ts from
increased leverage along with technology transfer.
Given the importance of foreign direct invest-
ment fl ows in knowledge and technology trans-
fer, however, a natural (albeit narrower) alterna-
tive measure to the above is as follows:
,. ,F it
it y itt
fdiP g
FDI=′

Global Development Horizons 2011 Changing Growth Poles and Financial Positions 53
a framework suffer from three shortcomings.
First, the methodology identifi es correlations;
a country whose growth cycles strongly com-
move with that of a large, infl uential country
may be erroneously identifi ed as a growth driver.
So while the approach is valuable for case stud-
ies motivated by a priori driver countries, it is
less useful for agnostic identifi cation of growth
poles. Second, it is much more diffi cult to fl ex-
ibly incorporate multiple spillover channels,
especially when bilateral f low data are not
available. Th ird, the methodology is more data
intensive and so is less useful for forecasting
purposes, in which case estimates of the future
values of variables are typically much more dif-
fi cult to come by.
Another class of models adopts the tools of
spatial econometrics to study growth spillovers
(see Rey and Janikas 2005 for a recent review).
However, these studies tend to limit their
focus to physical rather than economic space.
Many papers (such as Keller 2002) tend to be
focused mainly on one or, at most, two chan-
nels. Finally, many studies focus on negative,
rather than positive, spillovers—for example,
the negative economic eff ects of civil wars on
neighboring countries (Murdoch and Sandler
2002).
Annex 1.2: Alternative measures of concentrat ion
Th e fi elds of political science and international
relations have long been interested in the study
of the distribution of power. Within economics,
the subfi elds of development, industrial relations,
and international trade also have developed sev-
eral measures of economic concentration and
inequality, which can be applied to approximate
the distribution of power as well.
There are three common measures of eco-
nomic concentration, or resource-based power.
The most popular of these is the Herfindahl-
Hirschman index (Hirschman 1964), which is a
sum of the squared market shares:
= ∑ 2 ,t itN
H s
polarity measure used in this book introduces
separate weights for the trade, f inance, and
technology channels, measured respectively by
imports as a share of global exports, capital out-
fl ows as a share of global infl ows, and patents as a
share of global patents. Th e imports measure cor-
rects for reexports for the major entrepôt econo-
mies of Hong Kong SAR, China; Singapore;
and the United Arab Emirates, and also nets out
intramonetary union trade using bilateral trade
fl ows data. Th e capital outfl ows measure includes
FDI and portfolio capital but excludes derivative
transactions. Th e patents measure utilizes patent
approvals to all national patent bodies reporting
to the World Intellectual Property Organization.
The expanded polarity measure additionally
includes weights for the migration channel, as
measured by immigrant stock as a share of global
immigrants.
Th e three alternative growth measures relied
on GDP data adjusted in three diff erent ways: (1)
real, (2) adjusted to account for Harrod-Balassa-
Samuelson effects by removing U.S. inf lation
from countries’ nominal growth rates, and (3)
adjusted for purchasing power parity across coun-
tries. Th e cyclical component of the growth series
then was removed by taking only the trend com-
ponent after application of a Hodrik-Prescott fi lter
(l = 6.25).
To provide more defi nitiveness to the selection
of growth poles (and reduce overreliance on a sin-
gle dimension), the fi rst principal component for
the collection of measures described above was
used to compute a composite index. Th is index
was normalized to a scale of 0–100 for each of the
three GDP variants, and is reported in table 1A.1.
Th e bottom panel of the table shows these growth
poles calculated without the inclusion of migra-
tion.39 Here, the measure including and exclud-
ing migration is reported.
Other measures of growth spillover effects
have been proposed in the literature. One class
of studies incorporates third-country variables
into growth regressions to identify the infl uence
of these third countries on growth elsewhere
(see, for example, Arora and Vamvakidis 2005,
2010a, 2010b). In principle, estimated coeffi-
cients can be aggregated to obtain a country’s
global spillover eff ect. Studies employing such

54 Changing Growth Poles and Financial Positions Global Development Horizons 2011
is the Ray-Singer concentration index (Ray and
Singer 1973), popularized by Mansfi eld (1993).
Th e index is actually an application of the nor-
malized Herfindahl-Hirschman index to the
measurement of the share of aggregate capabili-
ties, cit, held by major power i at time t:
2 1
11
N it
t
cNC
N
=∑ −
−,
where N is the total number of powers in
consideration.
The technical diff iculties associated with
the concentration measures are well known.40
Moreover, the share of state capabilities, cit, often
is not very well defi ned. Finally, even if reasonable
where sit is the market share of fi rm i at time t, and N is the total number of fi rms operating in
the market. Th is index may be normalized so that
the index is bound by [0, 1] by applying the fol-
lowing formula:
*
1
11
t
HNH
N
=−
−,
Th e two other related concentration/distribu-
tion indexes are the Th eil, which weights market
shares relative to the mean market share, and the
Gini, which captures the relative mean diff erence
in shares between two fi rms selected randomly
from the market.
In international relations, the most well-
known measure of interstate power distribution
TABLE 1A.1 Principal components index (with a nd without migration subindex) for growth poles, top 10 economies, 2004–08 average
Economy Real Index Economy HBS Index Economy PPP Index
Without migrationChina 26.20 Euro area 47.34 China 63.70
United States 20.33 China 41.54 United States 51.26
Euro area 10.86 United States 30.51 Euro area 40.15
Japan 5.59 Russian Federation 25.60 Japan 28.15
United Kingdom 5.51 Canada 22.61 Russian Federation 26.02
Korea, Rep. 5.41 United Kingdom 22.49 Korea, Rep. 24.57
Russian Federation 4.79 Korea, Rep. 20.49 United Kingdom 24.01
India 4.62 Australia 20.26 India 23.38
Singapore 4.30 Brazil 19.48 Singapore 22.95
Canada 4.08 Norway 19.25 Canada 22.92
With migrationChina 27.63 Euro area 49.88 China 62.94
United States 26.12 China 36.73 United States 59.41
Euro area 17.52 Russian Federation 35.89 Euro area 44.42
Russian Federation 15.11 United States 29.38 Russian Federation 32.80
India 13.61 Canada 22.11 India 25.71
United Kingdom 11.56 Ukraine 22.05 Japan 25.06
Japan 11.09 United Kingdom 20.77 United Kingdom 22.26
Korea, Rep. 11.01 Saudi Arabia 20.67 Saudi Arabia 21.44
Saudi Arabia 10.92 Australia 20.20 Canada 21.44
Singapore 10.90 India 19.78 Korea, Rep. 21.41
Sources: World Bank staff calculations, from IMF DOT, IMF IFS, World Bank WDI, and WIPO Patentscope databases.
Note: The index was generated from the share-weighted combination of the fi rst two principal components of trade, fi nance, and technology-weighted growth shares, with and without migration-weighted growth shares, normalized to the maximum and minimum of the 1969–2008 period. Real, HBS, and PPP-adjusted indicate growth rates calculated, respectively, from GDP data in real 2000 U.S. dollars, nominal local currency con-verted to U.S. dollars at current exchange rates and defl ated by U.S. prices, and 2005 international PPP-adjusted dollars.
Global Development Horizons 2011 Changing Growth Poles and Financial Positions 55
1971–2005. The dependent variable was the
growth polarity index, measured with real GDP
growth rates, excluding the migration subindex.
This was rescaled with support [0, 100], using
the maximum and minimum of the series, and
subsequently log transformed. The indepen-
dent variables were sourced variously from the
World Bank’s World Development Indicators (World Bank 2010b) and the IMF’s Direction of Trade Statistics and International Financial Statistics (IMF 2010a, 2010c) databases (proxi-
mate economic variables); Barro and Lee
(2010) and Lindert (2004) (education); Rodrik,
Subramanian, and Trebbi (2004) (fundamen-
tal economic variables); ICRG (International Country Risk Guide; PRS Group 2010) (institu-
tions); Alesina and colleagues (2003) (ethnolin-
guistic diversity); and WVSA (2009) (social capi-
tal). Natural logarithms were also taken for all
the independent variables.
Population growth is the rate of population,
investment share is investment as a share of GDP,
and education attainment is the average years of
schooling in the population aged 25 and older
(the measure of human capital utilizes the same
indicator). Infrastructure is proxied by mobile
cellular subscriptions per 100 people (replacing
this with the percentage of paved roads yields
qualitatively similar results, but halves the sam-
ple size); poor health is proxied by the under-5
mortality rate (using life expectancy switches the
sign of the coeffi cients on the health variable, as
expected, but yields qualitatively similar results
for the other variables); the dependency ratio is
the population above age 65 as a share of work-
ing-age population; and government size is gov-
ernment consumption as a share of GDP.42
Trade exposure is total imports and exports as
a share of GDP, geography is a country’s distance
from the equator, and institutional quality is an
index generated from the share-weighted combi-
nation of the fi rst three principal components of
11 institutional variables from the ICRG (exclud-
ing democratic accountability). Ethnolinguistic
fractionalization is an index calculated as the
simple average of ethnic and linguistic fraction-
alization (substituting this with ethno-linguistic-
religious fractionalization yields qualitatively
similar results), and democracy is the democratic
proxies for economic power were chosen (such
as export share in global exports, for example),
concentration indexes based on power shares per
se do not capture the effect of a state’s relative
growth rate or its infl uence on other states.
In positive political theory, two classical power
indexes are used to measure infl uence over vot-
ing, or bargaining power. Th e Penrose-Banzhaf
index (Banzhaf 1965; Penrose 1946) is the share
of the total swing votes, vit, held by an entity i at
time t:
,itit
itN
vB
v=
∑where N is the total number of voting members.
In contrast to the concept of swing votes, the
Shapley-Shubik index (Shapley and Shubik 1954)
is based on that of pivotal votes and is given by
the a priori probability that a given entity is in a
pivotal position:
= ,!
itit
pS
n
where vit is the number of pivotal votes held by
entity i at time t, and n! is the number of possible
permutations of voting members.
Voting indexes have technical problems of their
own, which likewise are well recognized.41 In the
context of international economic relations, how-
ever, the biggest drawback is that voting indexes
require a voting mechanism to be operational
or relevant, which may not be the case in many
forms of international interactions. Like concen-
tration indexes, voting indexes likewise do not
capture relative growth rate or spillover eff ects.
A third form of power distribution would
involve a measure of indirect or sociocultural infl u-
ence, or “soft” power (Nye 2004). However, soft
power is (almost by defi nition) diffi cult to quantify.
Although proxies may be available—such as the
global spread of a country’s language, education
institutions, or national values and philosophy—no
systematic measure has emerged from the literature.
Annex 1.3: Growth polarity regression details
Th e data set for the regressions were country-level data for f ive-year averages over the period

56 Changing Growth Poles and Financial Positions Global Development Horizons 2011
2001–05 period; estimates for other periods were
qualitatively similar. IV instruments used were set-
tler mortality (IV-1) and fraction of European lan-
guage–speaking population (IV-2) (institutions),
gravity-predicted trade volume (integration), his-
torical enrollment data from 1900 (human capi-
tal), and predicted level of democracy (democracy).
Th ese regressions are reported in table 1A.3, which
includes the relevant key diagnostic tests.
Annex 1.4: Business cycle stylized facts
Table 1 A.4 tabulates correlation coeffi cients for
consumption (C), investment (I), exports (X),
and output (Y), along with changes in these vari-
ables, for 15 economies with high values of the
multidimensional polarity index.
accountability variable from the ICRG (using the
Polity IV measure of democracy yields qualita-
tively similar results).
Th e proximate determinants regressions were
performed using both error components (EC) and
linear generalized method of moments (GMM).
Random effects (RE) were chosen over fixed
eff ects (FE) if justifi ed by a Hausman test, or if FE
estimates were precluded due to the presence of
time-invariant variables. Similarly, system GMM
was chosen over diff erence GMM if Hansen tests
suggest that the instruments are valid, otherwise
diff erence GMM was implemented. Th ese regres-
sions are reported in table 1A.2, which includes
the relevant key diagnostic tests.
The fundamental determinants regressions
were run using instrumental variables (IV)
and system GMM. Th e IV estimates are for the
TABLE 1A.2 Estimates for proximate determinants of growth polarity
(1) (2) (3) (4) (5)
EC GMM EC GMM EC GMM EC GMM EC GMM
Population
growth
0.043
(0.89)
2.627
(3.02)
0.169
(0.51)
1.664
(1.85)
0.017
(0.91)
4.168
(3.89)
−0.055
(0.86)
2.466
(3.18)
−0.484
(1.02)
2.744
(2.69)
Investment
share
1.052
(0.56)*
−0.774
(1.00)
0.908
(0.23)***
−0.620
(0.73)
1.073
(0.57)*
1.486
(0.71)**
0.922
(0.50)*
0.130
(0.80)
0.994
(0.53)*
0.476
(0.53)
Schooling 0.124
(0.07)*
0.220
(0.14)*
0.103
(0.04)***
0.070
(0.10)
0.132
(0.07)*
0.072
(0.08)
0.077
(0.06)
0.151
(0.12)
0.107
(0.07)
0.180
(0.10)*
Additional controls
Infrastructure −0.002
(0.00)
−0.001
(0.00)
Poor health 0.012
(0.08)
−0.143
(0.06)**
Dependency
ratio
−0.401
(0.17)***
−0.324
(0.16)**
Government size −0.118
(0.08)
0.110
(0.07)*
R2 0.160 0.121 0.163 0.205 0.089
F 1.69* 1.52 1.45 2.02** 1.83*
Hansen J 34.53 38.42 40.85 43.95 41.55
AR(2) z −1.14 −1.02 −1.04 −1.28 −1.16
Observations 526 439 479 392 523 523 526 439 526 439
Sources: World Bank staff calculations, from IE Singapore, IMF DOT, IMF IFS, World Bank WDI, and WPIO Patentscope databases.
Note: GMM = generalized method of movements. Logarithms were applied to all variables. All error component models were estimated with fi xed effects, except for specifi cation (2), which was estimated with random effects. All linear GMM models were estimated as difference GMM, with the exception of specifi cation (3), which was estimated as system GMM. Standard errors robust to heteroskedasticity (all specifi cations) and autocor-relation (GMM only) are reported in parentheses. A lagged dependent variable (GMM only), period dummies, and a constant term (all specifi cations) were included in the specifi cations, but not reported.* indicates signifi cance at the 10 percent level, ** indicates signifi cance at the 5 percent level, and *** indicates signifi cance at the 1 percent level.
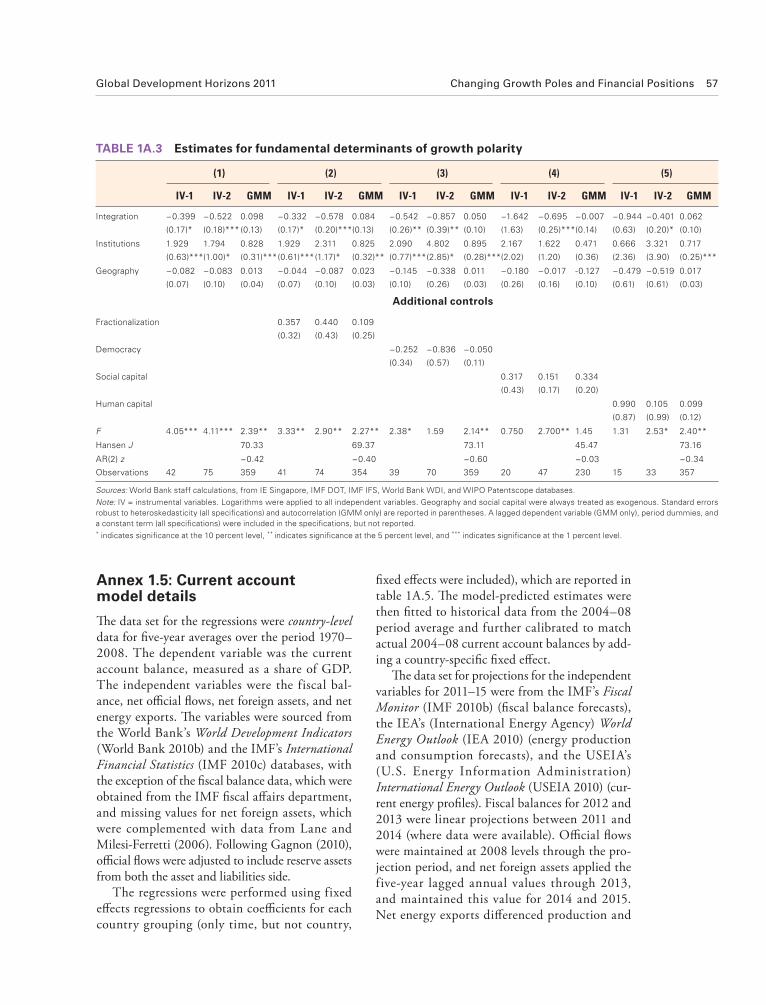
Global Development Horizons 2011 Changing Growth Poles and Financial Positions 57
fi xed eff ects were included), which are reported in
table 1A.5. Th e model-predicted estimates were
then fi tted to historical data from the 2004–08
period average and further calibrated to match
actual 2004–08 current account balances by add-
ing a country-specifi c fi xed eff ect.
Th e data set for projections for the independent
variables for 2011–15 were from the IMF’s Fiscal Monitor (IMF 2010b) (fi scal balance forecasts),
the IEA’s (International Energy Agency) World Energy Outlook (IEA 2010) (energy production
and consumption forecasts), and the USEIA’s
(U.S. Energy Information Administration)
International Energy Outlook (USEIA 2010) (cur-
rent energy profi les). Fiscal balances for 2012 and
2013 were linear projections between 2011 and
2014 (where data were available). Offi cial fl ows
were maintained at 2008 levels through the pro-
jection period, and net foreign assets applied the
five-year lagged annual values through 2013,
and maintained this value for 2014 and 2015.
Net energy exports diff erenced production and
Annex 1.5: Current account model details
Th e data set for the regressions were country-level data for fi ve-year averages over the period 1970–
2008. The dependent variable was the current
account balance, measured as a share of GDP.
The independent variables were the fiscal bal-
ance, net offi cial fl ows, net foreign assets, and net
energy exports. Th e variables were sourced from
the World Bank’s World Development Indicators (World Bank 2010b) and the IMF’s International Financial Statistics (IMF 2010c) databases, with
the exception of the fi scal balance data, which were
obtained from the IMF fi scal aff airs department,
and missing values for net foreign assets, which
were complemented with data from Lane and
Milesi-Ferretti (2006). Following Gagnon (2010),
offi cial fl ows were adjusted to include reserve assets
from both the asset and liabilities side.
The regressions were performed using fixed
eff ects regressions to obtain coeffi cients for each
country grouping (only time, but not country,
TABLE 1A.3 Estimates for fundamental determinants of growth polarity
(1) (2) (3) (4) (5)
IV-1 IV-2 GMM IV-1 IV-2 GMM IV-1 IV-2 GMM IV-1 IV-2 GMM IV-1 IV-2 GMM
Integration −0.399
(0.17)*
−0.522
(0.18)***
0.098
(0.13)
−0.332
(0.17)*
−0.578
(0.20)***
0.084
(0.13)
−0.542
(0.26)**
−0.857
(0.39)**
0.050
(0.10)
−1.642
(1.63)
−0.695
(0.25)***
−0.007
(0.14)
−0.944
(0.63)
−0.401
(0.20)*
0.062
(0.10)
Institutions 1.929
(0.63)***
1.794
(1.00)*
0.828
(0.31)***
1.929
(0.61)***
2.311
(1.17)*
0.825
(0.32)**
2.090
(0.77)***
4.802
(2.85)*
0.895
(0.28)***
2.167
(2.02)
1.622
(1.20)
0.471
(0.36)
0.666
(2.36)
3.321
(3.90)
0.717
(0.25)***
Geography −0.082
(0.07)
−0.083
(0.10)
0.013
(0.04)
−0.044
(0.07)
−0.087
(0.10)
0.023
(0.03)
−0.145
(0.10)
−0.338
(0.26)
0.011
(0.03)
−0.180
(0.26)
−0.017
(0.16)
-0.127
(0.10)
−0.479
(0.61)
−0.519
(0.61)
0.017
(0.03)
Additional controls
Fractionalization 0.357
(0.32)
0.440
(0.43)
0.109
(0.25)
Democracy −0.252
(0.34)
−0.836
(0.57)
−0.050
(0.11)
Social capital 0.317
(0.43)
0.151
(0.17)
0.334
(0.20)
Human capital 0.990
(0.87)
0.105
(0.99)
0.099
(0.12)
F 4.05*** 4.11*** 2.39** 3.33** 2.90** 2.27** 2.38* 1.59 2.14** 0.750 2.700** 1.45 1.31 2.53* 2.40**
Hansen J 70.33 69.37 73.11 45.47 73.16
AR(2) z −0.42 −0.40 −0.60 −0.03 −0.34
Observations 42 75 359 41 74 354 39 70 359 20 47 230 15 33 357
Sources: World Bank staff calculations, from IE Singapore, IMF DOT, IMF IFS, World Bank WDI, and WIPO Patentscope databases.
Note: IV = instrumental variables. Logarithms were applied to all independent variables. Geography and social capital were always treated as exogenous. Standard errors robust to heteroskedasticity (all specifi cations) and autocorrelation (GMM only) are reported in parentheses. A lagged dependent variable (GMM only), period dummies, and a constant term (all specifi cations) were included in the specifi cations, but not reported.* indicates signifi cance at the 10 percent level, ** indicates signifi cance at the 5 percent level, and *** indicates signifi cance at the 1 percent level.

58 Changing Growth Poles and Financial Positions Global Development Horizons 2011
consumption of only oil and coal (due to data
limitations) and scaled this upward by the ratio
of total energy consumption to oil and coal con-
sumption. Countries with no forecast energy data
were imputed from regional aggregate forecasts,
using their current energy profi les. Values were
calculated with commodity price projection data
from the World Bank’s Development Prospects
Group (World Bank 2011).
In addition to the 15 economies reported in
table 1.2, current account balances were esti-
mated for an additional 13 countries with high
values of the multidimensional polarity index.
Th ese are reported in table 1A.6 (for projections
only).
Annex 1.6: Hypothetical nominal output scenarios
Th e GDP projections in the main text are pre-
sented in terms of real GDP (measured by using
2009 U.S. dollars as the numeraire). Although
this presentation provides an accurate depiction
of the evolution of output after correcting for the
possible distortionary eff ects arising from infl a-
tion, exchange rate valuation differences, and
the ambiguity of estimating Harrod-Balassa-
Samuelson eff ects, readers may be more accus-
tomed to the GDP comparisons in terms of the
nominal values often presented in the press. To
the extent that monetary units in a common cur-
rency are an accurate representation of potential
global economic power and inf luence, such a
presentation may off er a slightly diff erent picture
from that presented in the main text.
Indeed, undertaking such an exercise suggests
that, after adjusting the implied real growth rates
from the growth model to account for reasonable
assumptions regarding inf lation and exchange
rate appreciation, China potentially could over-
take the United States in nominal terms by 2020
if a limited, gradual revaluation of the renminbi
were to occur, and by 2024, if the exchange rate
remains stable at 2009 levels (fi gure 1A.1, panel
a). By a similar token, India could overtake both
Japan and the United Kingdom in 2014 and
2020, respectively.
It is important to stress that such overtaking
scenarios are meant to be illustrative, and should
TABL E 1A.4 Correlations for consumption, investment, and exports with output, and changes in consumption, investment, and exports with change in output, current and potential pole
Economy
Correlations
C,Y I,Y X, Y ΔC, ΔY ΔI, ΔY ΔX, ΔY
Euro area 0.999 0.998 0.982 0.503 0.490 0.719
United States 0.999 0.997 0.992 0.961 0.537 0.586
China 0.990 0.997 0.994 0.870 0.953 0.910
Russian
Federation 0.995 0.983 0.926 0.853 0.879 0.459
United Kingdom 0.999 0.997 0.996 0.515 0.361 0.695
Japan 0.999 0.985 0.952 0.120 −0.002 0.373
Brazil 0.998 0.985 0.932 0.562 0.538 0.736
Canada 0.999 0.993 0.979 0.758 0.689 0.684
Australia 0.999 0.993 0.994 0.700 0.711 0.818
India 0.996 0.987 0.969 0.597 0.738 0.832
Korea, Rep. 0.999 0.991 0.975 0.368 0.294 0.790
Turkey 0.999 0.990 0.991 0.690 0.534 0.874
Mexico 0.999 0.996 0.984 0.541 0.556 0.727
Poland 0.999 0.986 0.992 0.865 0.858 0.926
Saudi Arabia 0.915 0.978 0.961 0.664 0.645 0.619
Sources: World Bank staff calculations, IMF IFS, and World Bank WDI databases.
Note: Cross-correlations reported for the full time period for which data are available, typi-cally between 1965 and 2008 for most countries.
TABLE 1A.5 Estimates for empirical current account balances model, by country group
Advanced
economies
Developing
Asia Africa
Latin
America
Middle
East
Transition
economies
Fiscal balance 0.400
(0.13)***
0.240
(0.18)
0.300
(0.08)***
0.430
(0.18)**
0.640
(0.22)***
0.340
(0.27)
Offi cial fl ows 0.210
(0.37)
0.690
(0.24)***
0.370
(0.08)***
0.390
(0.12)***
0.240
(0.16)
0.210
(0.25)
Net foreign
assets
0.070
(0.01)***
0.037
(0.01)***
0.037
(0.01)***
0.035
(0.01)***
0.019
(0.01)
0.001
(0.02)
Net energy
exports
0.060
(0.10)
0.100
(0.10)
0.130
(0.03)***
0.280
(0.05)***
0.040
(0.06)
0.100
(0.06)
R2 0.51 0.66 0.76 0.77 0.87 0.58
Observations 105 59 83 88 40 62
Sources: World Bank staff calculations, from IMF IFS, IMF Fiscal Affairs, and World Bank WDI databases.
Note: All variables are measured as percentages of GDP. All variables are in 5-year averages, with the exception of net foreign assets, which are the end-of-period values for the previous 5-year period. Standard errors robust to heteroskedasticity are reported in parentheses. Time fi xed effects were included, but not reported.* indicates signifi cance at the 10 percent level, ** indicates signifi cance at the 5 percent level, and *** indicates signifi cance at the 1 percent level.

Global Development Horizons 2011 Changing Growth Poles and Financial Positions 59
on the productivity paths of China and India.
Furthermore, with China and India still relatively
far away from the technological frontier, catch-
up growth through technological adoption still
may be possible within the 15-year forecast hori-
zon. But the divergence raises a cautionary tale
be interpreted with caution. Th e Linkage model
used in the growth forecasts does not account
for differential growth rates in nominal vari-
ables, nor for policy choices that could lead to
changes in these nominal variables. Measurement
difficulties in national price data also mean
that Harrod-Balassa-Samuelson effects may be
underestimated.
Annex 1.7: Detailed analysis of growth and external balance scenarios
Even under the baseline scenario, some fractur-
ing between the growth rates among the high-
and low-productivity potential growth poles is
expected to occur (fi gure 1A.2).43 Th is separation
will be even more evident when compared against
growth rates in the advanced economies, which
not only have been historically lower, but also are
facing possible headwinds from postfinancial-
crisis malaise (Reinhart and Rogoff 2009). Th e
divergent productivity scenario suggests that a two-
track global economy is more than a possibility;
indeed, if productivity diff erentials were to per-
sist, a slowly divergent path for growth between
advanced, low-productivity developing, and high-
productivity developing economies could emerge.
The impact of this divergence on the over-
all shape of the multipolar world, however,
will be limited, as this shape mostly depends
TABLE 1 A .6 Additional current account balances, potential poles, 2004–15
Country 2004–08 2011
Argentina 1.8 0.0
Indonesia 1.2 1.2
Norway 16.3 14.3
Israel 2.7 2.0
Switzerland 11.0 10.7
Malaysia 15.3 14.2
Venezuela, RB 13.5 12.9
Singapore 20.9 19.1
Thailand 0.8 1.1
South Africa −5.7 –6.8
Ukraine 0.2 0.6
Sweden 7.7 7.1
Czech Republic −3.1 –4.0
Sources: World Bank staff calculations, from IMF IFS, IMF Fiscal Monitor, USEIA IEO, and IEA WEO databases.
Note: All figures are percentages of GDP. The light-shaded region indicates projections; 2004–08 data are the historical period aver-age, and 2011–15 data are the projected period average. Projections were performed using a current account model with the fi scal balance, offi cial fi nancial fl ows, net foreign assets, and net energy exports, with region-specifi c coeffi cients and calibrated to the actual current account balance for 2004–08.
05
101520253035404550
2009 2011 2013 2015 2017 2019 2021 2023 2025
$ t
rill
ion
s
02
46
810
1214
1618
2009 2011 2013 2015 2017 2019 2021 2023 2025
$ t
rill
ion
s
United States
China (no appreciation)
China
Japan
United Kingdom
India
a. China and the United States b. India, Japan, and the United Kingdom
FIGURE 1A.1 Nominal GDP overtaking scenarios, selected emerging and advanced economy poles, 2009–25
Source: World Bank staff calculations, using the World Bank WDI database.
Note: 2009 nominal GDP values are values measured in terms of U.S. dollars. Real GDP growth rates from 2010 onward are based on forecasts from the baseline sce-nario. Infl ation is assumed to be constant at 0 percent for Japan, 2 percent for the United States, 4 percent for both China and the United Kingdom, and 7 percent for India. Exchange rate appreciation, relative to the U.S. dollar, is assumed to be constant at 0 percent for China (no appreciation case), 2 percent for Japan, and 3 percent for China (appreciation case) and India.
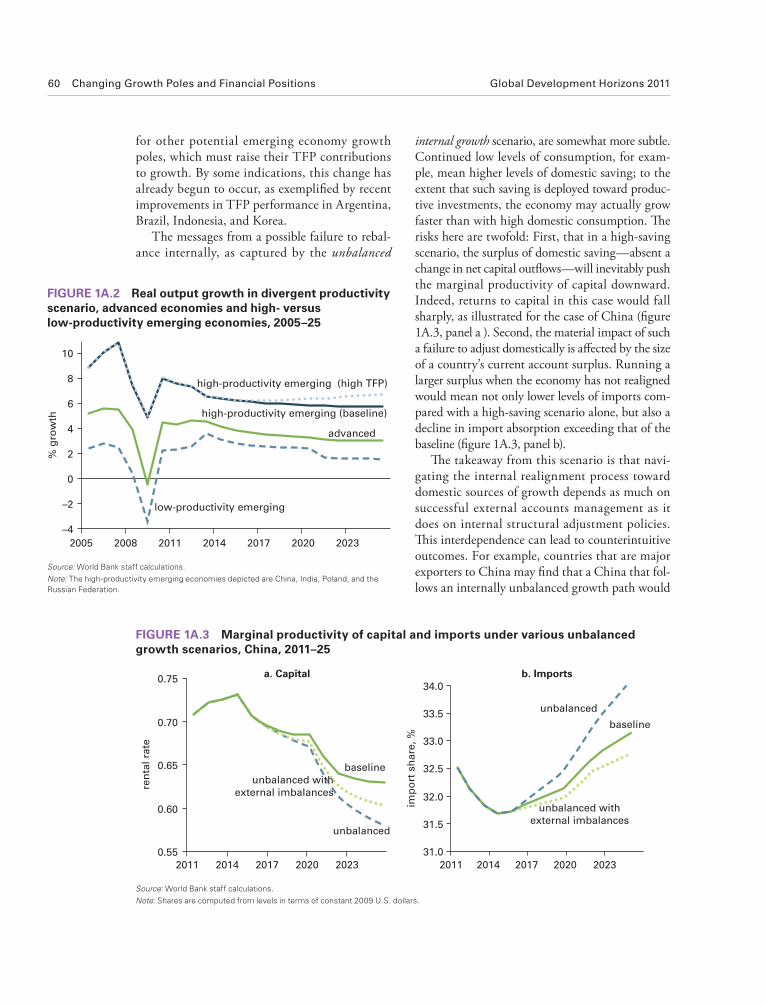
60 Changing Growth Poles and Financial Positions Global Development Horizons 2011
internal growth scenario, are somewhat more subtle.
Continued low levels of consumption, for exam-
ple, mean higher levels of domestic saving; to the
extent that such saving is deployed toward produc-
tive investments, the economy may actually grow
faster than with high domestic consumption. Th e
risks here are twofold: First, that in a high-saving
scenario, the surplus of domestic saving—absent a
change in net capital outfl ows—will inevitably push
the marginal productivity of capital downward.
Indeed, returns to capital in this case would fall
sharply, as illustrated for the case of China (fi gure
1A.3, panel a ). Second, the material impact of such
a failure to adjust domestically is aff ected by the size
of a country’s current account surplus. Running a
larger surplus when the economy has not realigned
would mean not only lower levels of imports com-
pared with a high-saving scenario alone, but also a
decline in import absorption exceeding that of the
baseline (fi gure 1A.3, panel b).
Th e takeaway from this scenario is that navi-
gating the internal realignment process toward
domestic sources of growth depends as much on
successful external accounts management as it
does on internal structural adjustment policies.
Th is interdependence can lead to counterintuitive
outcomes. For example, countries that are major
exporters to China may fi nd that a China that fol-
lows an internally unbalanced growth path would
for other potential emerging economy growth
poles, which must raise their TFP contributions
to growth. By some indications, this change has
already begun to occur, as exemplifi ed by recent
improvements in TFP performance in Argentina,
Brazil, Indonesia, and Korea.
The messages from a possible failure to rebal-
ance internally, as captured by the unbalanced
–4
–2
0
2
4
6
8
10
2005 2008 2011 2014 2017 2020 2023
% g
row
th
high-productivity emerging (high TFP)
low-productivity emerging
advanced
high-productivity emerging (baseline)
FIGURE 1A.2 Real output growth in divergent productivity scenario, advanced economies and high- versus low-productivity emerging economies, 2005–25
Source: World Bank staff calculations.
Note: The high-productivity emerging economies depicted are China, India, Poland, and the Russian Federation.
0.55
0.60
0.65
0.70
0.75
2011 2014 2017 2020 2023
ren
tal
rate
2011 2014 2017 2020 202331.0
31.5
32.0
32.5
33.0
33.5
34.0
imp
ort
sh
are
, %
baseline
unbalanced
unbalanced withexternal imbalances
unbalanced withexternal imbalances
baseline
unbalanced
unbalanced withexternal imbalances
a. Capital b. Imports
FIGURE 1A.3 Marginal productivity of capital and imports under various unbalanced growth scenarios, China, 2011–25
Source: World Bank staff calculations.
Note: Shares are computed from levels in terms of constant 2009 U.S. dollars.

Global Development Horizons 2011 Changing Growth Poles and Financial Positions 61
Th ese global external balances scenarios point
to how the evolution of investment depends on
the manner by which global imbalances unfold
(figure 1A.4).44 Several features are notable.
import more, relative to the baseline. In contrast,
when external imbalances are allowed to persist
in tandem with internally unbalanced growth,
imports are actually lower relative to the baseline.
China
10
15
20
25
30
35
40
45
50
2004 2008 2012 2016 2020 2024
invest
men
t/ G
DP
, %
Middle East
0
5
10
15
20
25
30
35
40
2004 2008 2012 2016 2020 2024
invest
men
t/ G
DP
, %
Turkey
8
10
12
14
16
18
20
22
24
2004 2008 2012 2016 2020 2024
invest
men
t/ G
DP
, %
rebalancing
baseline
imbalances
rebalancingbaseline
imbalances
rebalancing
baseline
imbalances
India
18
20
22
24
26
28
30
32
34
36
2004 2008 2012 2016 2020 2024
invest
men
t/ G
DP
, %
rebalancing
baseline/imbalances
Poland
8
10
12
14
16
18
20
22
24
2004 2008 2012 2016 2020 2024
invest
men
t/ G
DP
, %
rebalancing
baseline/imbalances
Russian Federation
0
5
10
15
20
25
2004 2008 2012 2016 2020 2024
invest
men
t/ G
DP
, %
rebalancing
baseline/imbalances
FIGURE 1A.4 In vestment share of output under various external balance scenarios, selected potential emerging economy poles, 2004–25
Source: World Bank staff calculations.
Note: The baseline and continued imbalances scenarios overlap (as in the case of India) if current account balances in 2015 fall within the ±3 percent band. The kink in the investment path for the rebalancing scenario in Poland is due to a model-imposed fl oor of 10 percent of GDP for investment (which is nonbinding if investment is below 10 percent to begin with).

62 Changing Growth Poles and Financial Positions Global Development Horizons 2011
economy. Th is measure essentially treats a coun-
try’s economic size as a proxy for its channels of
infl uence.
5. Th is correction accounts for the Harrod-Balassa-
Samuelson eff ect of rising real exchange rates as a
country’s income level rises over time. Hence, a
country experiencing a real depreciation (as was
the case of in Japan in the 2000s) will have a rela-
tively lower real growth rate; similarly, the real
appreciation of the euro in the 2000s means that
the euro area’s real growth was actually higher
over the period.
6. Th e measurement of concentration has vari-
ous possible approaches, and this book uses the
Herfi ndahl-Hirschman index as its measure. Th e
reasons for this choice, and several alternatives,
are discussed in greater detail in annex 1.2.
7. Th e minimum for the Herfi ndahl-Hirschman
computed from the real and purchasing power
parity indexes occurred in 1992, when the G-3
economies underwent a severe recession, signifi -
cantly reducing their growth infl uence relative to
the larger economies of the emerging world.
8. Th e sharp decline in the early 1970s deserves
some comment. Th is fall is a function of several
factors. Most crucially, the industrial economies
underwent major recessions resulting from the
fi rst oil shock in 1973 (which was reinforced by
the second in 1979). Th is negative shock was
felt worldwide by all countries (apart from oil
exporters), but the slowdown was more severe for
the industrial world, which had relatively larger
economies at the time. Th is resulted in a signifi -
cant reduction in their respective growth polari-
ties, and hence, a corresponding decrease in the
multipolarity index. A secondary reason is that
data coverage in the earlier years was not as com-
prehensive, and to the extent that higher polarity
countries are omitted, the polarity share calcula-
tions used to compute the Herfi ndahl-Hirschman
would have been aff ected. An examination of the
distribution of the polarity index during this time
suggests, however, that this latter concern is likely
to be less of an issue, because the decline in the
Herfi ndahl-Hirschman appears to be driven more
by a signifi cant reduction in the polarity value for
the euro area and the United States than by the
introduction of high-polarity economies as the
sample coverage improved.
9. Th e consumption contribution fell to about
one third for the period 2000–08 (consump-
tion growth was 4.1 percent while GDP growth
was 10.2 percent). Moreover, a signifi cant
share of this consumption growth was from the
First, the baseline tends to fall between the polar
cases (of total rebalancing and continued imbal-
ances). This outcome is to be expected, given
that the baseline scenario adopts a compromise
approach to the path of global external balances.
Second, imposing a scenario of total rebalancing
on surplus economies (such as China, Russia,
and the oil-exporting economies of the Middle
East) tends to result in a relatively slower rate
of decline (or an actual increase) in the invest-
ment share. Th is outcome is also to be expected,
as forcing a large surplus to zero, while holding
saving constant, would induce reinvestment in
the domestic economy. Th e converse holds true
for defi cit economies such as India, Poland, and
Turkey; that is, the rebalancing scenario tends to
exacerbate declines in investment. Th ird, while
suppressing capital fl ight in this manner could,
in principle, increase domestic investment in
the surplus countries, there is a danger of also
increasing either capital misallocation (into
unproductive investments) or reducing consumer
welfare (by limiting intertemporal consumption
smoothing).
Notes 1. Th e formal defi nitions and calculations are
described in detail in annex 1.1.
2. Th e most well known among these are the
Herfi ndahl-Hirschman and Ray-Singer (Ray and
Singer 1973) indexes, which are measures of power
concentration, and the Penrose-Banzhaf (Banzhaf
1965; Penrose 1946) and Shapley-Shubik (Shapley
and Shubik 1954) indexes, which are measures of
voting power. Th ese two classes of power measures
present their own drawbacks. Th e share of eco-
nomic power, which is necessary for computing
concentration indexes, often is not well defi ned.
Voting indexes require a voting mechanism, and
in many international economic interactions, this
institution may not be operational or relevant.
3. Although these economies accounted for a large
contribution to global growth, the extremely low
rates of global growth between the years 1 and
1820 mean that the polarity index, which is nor-
malized to the full 1–2001 time period, will tend
to be lower for China and India, despite their rela-
tively large contributions.
4. More precisely, the simple polarity index is cal-
culated as the size-weighted growth rate of an
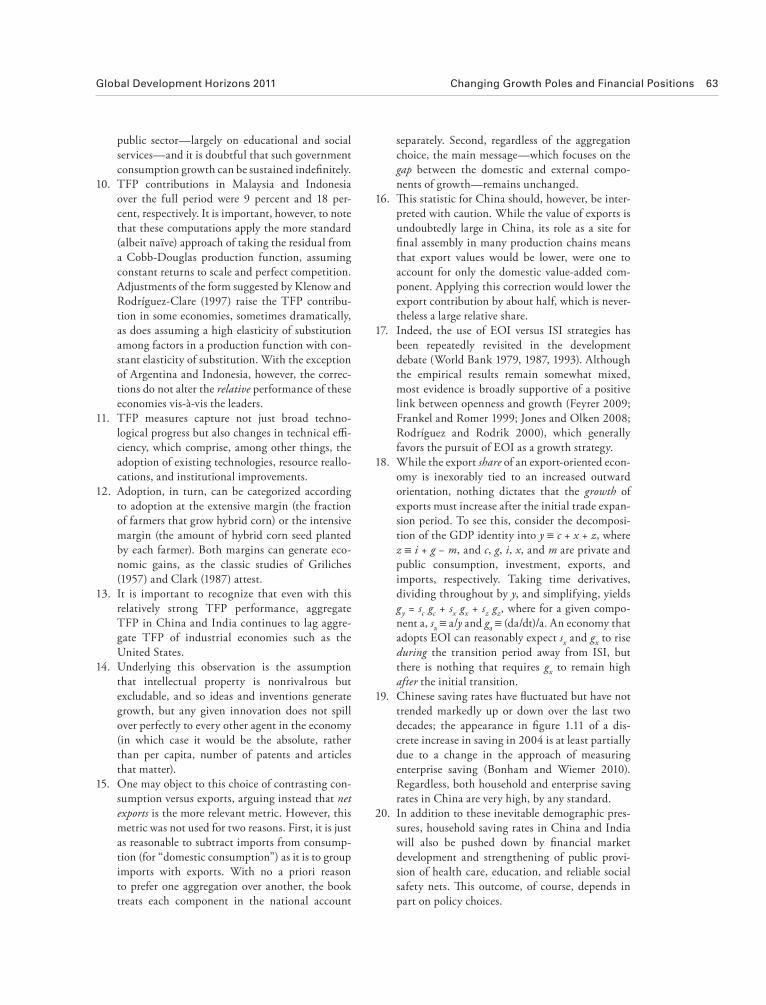
Global Development Horizons 2011 Changing Growth Poles and Financial Positions 63
separately. Second, regardless of the aggregation
choice, the main message—which focuses on the
gap between the domestic and external compo-
nents of growth—remains unchanged.
16. Th is statistic for China should, however, be inter-
preted with caution. While the value of exports is
undoubtedly large in China, its role as a site for
fi nal assembly in many production chains means
that export values would be lower, were one to
account for only the domestic value-added com-
ponent. Applying this correction would lower the
export contribution by about half, which is never-
theless a large relative share.
17. Indeed, the use of EOI versus ISI strategies has
been repeatedly revisited in the development
debate (World Bank 1979, 1987, 1993). Although
the empirical results remain somewhat mixed,
most evidence is broadly supportive of a positive
link between openness and growth (Feyrer 2009;
Frankel and Romer 1999; Jones and Olken 2008;
Rodríguez and Rodrik 2000), which generally
favors the pursuit of EOI as a growth strategy.
18. While the export share of an export-oriented econ-
omy is inexorably tied to an increased outward
orientation, nothing dictates that the growth of
exports must increase after the initial trade expan-
sion period. To see this, consider the decomposi-
tion of the GDP identity into y ≡ c + x + z, where
z ≡ i + g − m, and c, g, i, x, and m are private and
public consumption, investment, exports, and
imports, respectively. Taking time derivatives,
dividing throughout by y, and simplifying, yields
gy = sc gc + sx gx + sz gz, where for a given compo-
nent a, sa ≡ a/y and ga ≡ (da/dt)/a. An economy that
adopts EOI can reasonably expect sx and gx to rise
during the transition period away from ISI, but
there is nothing that requires gx to remain high
after the initial transition.
19. Chinese saving rates have fl uctuated but have not
trended markedly up or down over the last two
decades; the appearance in fi gure 1.11 of a dis-
crete increase in saving in 2004 is at least partially
due to a change in the approach of measuring
enterprise saving (Bonham and Wiemer 2010).
Regardless, both household and enterprise saving
rates in China are very high, by any standard.
20. In addition to these inevitable demographic pres-
sures, household saving rates in China and India
will also be pushed down by fi nancial market
development and strengthening of public provi-
sion of health care, education, and reliable social
safety nets. Th is outcome, of course, depends in
part on policy choices.
public sector—largely on educational and social
services—and it is doubtful that such government
consumption growth can be sustained indefi nitely.
10. TFP contributions in Malaysia and Indonesia
over the full period were 9 percent and 18 per-
cent, respectively. It is important, however, to note
that these computations apply the more standard
(albeit naïve) approach of taking the residual from
a Cobb-Douglas production function, assuming
constant returns to scale and perfect competition.
Adjustments of the form suggested by Klenow and
Rodríguez-Clare (1997) raise the TFP contribu-
tion in some economies, sometimes dramatically,
as does assuming a high elasticity of substitution
among factors in a production function with con-
stant elasticity of substitution. With the exception
of Argentina and Indonesia, however, the correc-
tions do not alter the relative performance of these
economies vis-à-vis the leaders.
11. TFP measures capture not just broad techno-
logical progress but also changes in technical effi -
ciency, which comprise, among other things, the
adoption of existing technologies, resource reallo-
cations, and institutional improvements.
12. Adoption, in turn, can be categorized according
to adoption at the extensive margin (the fraction
of farmers that grow hybrid corn) or the intensive
margin (the amount of hybrid corn seed planted
by each farmer). Both margins can generate eco-
nomic gains, as the classic studies of Griliches
(1957) and Clark (1987) attest.
13. It is important to recognize that even with this
relatively strong TFP performance, aggregate
TFP in China and India continues to lag aggre-
gate TFP of industrial economies such as the
United States.
14. Underlying this observation is the assumption
that intellectual property is nonrivalrous but
excludable, and so ideas and inventions generate
growth, but any given innovation does not spill
over perfectly to every other agent in the economy
(in which case it would be the absolute, rather
than per capita, number of patents and articles
that matter).
15. One may object to this choice of contrasting con-
sumption versus exports, arguing instead that net
exports is the more relevant metric. However, this
metric was not used for two reasons. First, it is just
as reasonable to subtract imports from consump-
tion (for “domestic consumption”) as it is to group
imports with exports. With no a priori reason
to prefer one aggregation over another, the book
treats each component in the national account

64 Changing Growth Poles and Financial Positions Global Development Horizons 2011
to the retail and service infrastructure, or increas-
ing the uptake of consumer credit; these will
have a direct eff ect via increasing the incentive to
consume. Improvements to social protection and
improving the effi ciency of the fi nancial system
will also have an indirect eff ect via reducing the
incentive to save.
28. Implicit in this assumption is also the fact that
the current pursuit of divergent policy paths in
the United States (stimulative at the expense of
increased defi cits and debt) and the euro area
(austerity at the risk of economic malaise) do not
generate wildly divergent medium and long-term
economic outcomes between these two sets of
economies.
29. Th is is consistent with the proposal for resolving
global imbalances outlined in Goldstein (2010)
and is similar to the ±4 percent bands proposed by
the U.S. Treasury.
30. Historically, China’s growth rate has fl uctuated
with a 3.5 percent standard deviation. It is impor-
tant to recognize that these projected growth rates
depend on the assumptions of the baseline sce-
nario and, hence, should not be interpreted liter-
ally as forecasts.
31. With a historical annual standard deviation of 3.1
percent.
32. India’s average years of schooling for the popula-
tion aged 15 and older was 5.1 in 2010 (Barro and
Lee 2010).
33. It is important to note that these level output
numbers are computed in real terms (using 2009
GDP as a base). Taking into account infl ation and
exchange rate adjustments presents a very diff er-
ent alternative picture, including several overtak-
ing possibilities. Th ese alternatives are explored in
annex 1.6.
34. Th e projections are, however, consistent with fore-
casts from other potential output-based models,
such as Jorgenson and Vu (2010).
35. Th is secular downward shift in consumption in
the industrial economies more generally, driven
primarily by demographic changes, is also implied
by the extended period of deleveraging that typi-
cally follows major fi nancial crises.
36. Data limitations in the projections preclude the
computation of the full multidimensional polarity
index. However, as the trade channel contributes
the most to the direction of the multidimensional
polarity index (as measured by the eigenvector
loadings corresponding to the fi rst principal com-
ponent), the alternate index presented here may
nonetheless serve as a reasonable proxy.
21. Correlations between consumption, investment,
and exports with output are documented in annex
1.4 for current and potential poles.
22. Th e ICOR is a potentially controversial concept,
relying on a somewhat dated Harrod-Domar
model of the growth process. Rather than relying
on the concept to describe growth in its entirety,
ICOR is used here in a diff erent sense, to provide
a sense of the effi ciency with which capital deploy-
ment supports growth.
23. Some caution should be exercised in the inter-
pretation of this fi gure. R&D expenditures are
likely to be endogenous to per capita incomes.
Furthermore, the nonlinear distribution of expen-
diture and researcher shares at the cross-section
is heavily infl uenced by the large mass of poorer
countries at the low end of the distribution, and
the large weights placed on China, India, and
the United States, which raises the shares in their
respective income brackets.
24. It is important to recognize that there is no con-
sensual defi nition for what constitutes a global
middle class, and the classifi cation of any given
household as middle class often depends on the
specifi c defi nition employed. One central distinc-
tion is between a middle class measured relative
to the distribution of the population of the entire
world versus a middle class measured relative to
the population distribution within each country.
Because the focus of the analysis here is on growth
polarities at the global level, the discussion is
premised on the former defi nition, with incomes
between $2 and $13 a day.
25. Th is fairly large number stems from the assump-
tion that the global middle class is defi ned in the
context of what constitutes a middle class in devel-
oping countries (Ravallion 2010). A more conser-
vative defi nition, using the U.S. poverty line of
$13 a day as a lower bound, has 80 million people
in the developing world joining the global middle
class over the same time period.
26. It is important not to overstate the conclusions
from this result. Analogous to the case for R&D
expenditure and researcher shares, the nonlinear
distribution of consumption shares at the cross-
section is heavily infl uenced by the large mass of
poorer countries at the low end of the distribu-
tion, and the large weights placed on China and
the United States, which lower and raise the
consumption shares in their respective income
brackets.
27. Th is includes enabling consumer spending
through policies, such as making improvements

Global Development Horizons 2011 Changing Growth Poles and Financial Positions 65
with Worldwide Governance Indicators measures)
were performed, but not reported. Th e results for
these regressions were qualitatively similar and are
available on request.
43. Undoubtedly, this is a simplifi cation, because any
aggregation inevitably introduces the possibility
that there may be outliers within a group. For exam-
ple, Indonesia and Singapore are both forecast to
grow in excess of 5 percent over the 2011–25 period,
which exceeds the equivalent growth rates of Poland
and Russia at their growth peaks. Nevertheless, the
message—that divergent TFP growth patterns can
lead to divergent growth outcomes—remains.
44. Th e broader macroeconomic paths are qualita-
tively similar, but investment, in particular, var-
ied according to the external balance scenario
being considered. Th is is hardly surprising given
the fact that structural factors are likely to drive
growth in the long run (with external balances
playing only a secondary role), whereas the cur-
rent account identity, cab ≡ s − i, necessitates a
relationship between external balances and the
patterns of saving and investment. Because saving
is determined mainly by the demographic struc-
ture of the economy, investment changes bear the
brunt of the adjustments required by the diff erent
scenarios.
ReferencesAcemoglu, K. Daron, Simon Johnson, and James A.
Robinson. 2005. “Institutions as a Fundamental
Cause of Long-Run Economic Growth.” In
Handbook of Economic Growth, vol. 1, ed. Philippe
Aghion and Steven N. Durlauf, 385–472.
Amsterdam: Elsevier.
Aghion, Philippe, and Peter W. Howitt. 1997. Endogenous
Growth Th eory. Cambridge, MA: MIT Press.
Alesina, Alberto F., William R. Easterly, Arnaud
Devleeschauwer, Sergio Kurlat, and Romain
Wacziarg. 2003. “Fractionalization.” Journal of
Economic Growth 8 (2): 155–94.
Allen, Franklin, Rajesh Chakrabarti, Sankar De, Jun
Qian, and Meijun Qian. 2010. “Law, Institutions,
and Finance in China and India.” In Emerging Giants:
China and India in the World Economy, ed. Barry J.
Eichengreen, Poonam Gupta, and Rajiv Kumar, 135–
83. Oxford, U.K.: Oxford University Press.
Arora, Vivek, and Athanasios Vamvakidis. 2005. “Th e
Impact of U.S. Economic Growth on the Rest of
the World: How Much Does It Matter?” Journal of
Economic Integration 21 (1): 21–39.
37. Caution is advised in directly comparing these
numbers to the multipolarity index computed
earlier. Because data limitations in the forecasts
prevent a computation using all the channels
comprising the full polarity index, the multipolar-
ity values obtained from the forecast period diff er
from ones calculated earlier. Th e analysis that fol-
lows is based on a multipolarity index calculated
entirely based on the simple polarity indexes,
which can be extended back to 1968.
38. One cannot also rule out the possibility of the
gradual emergence of a new unipolar or bipolar
world. If the trend of the Herfi ndahl-Hirschman
using the simple index were to continue beyond
2025, such an outcome seems to be a distinct
possibility.
39. Operationalizing the migration channel is prob-
lematic for three reasons, which justifi es the selec-
tive inclusion. First, there are signifi cant data
limitations. Emigration fl ow data currently are
available only for two years, 2005 and 2010, and
immigration data are end-of-period stock values,
rather than in-period fl ows. Second, measure-
ment issues abound. Because migrant stocks are
aff ected by depreciation (through death), these
stocks may change even if actual fl ows remain
constant. Foreign-born residents often are classi-
fi ed as migrants, which is especially problematic
for countries that have broken up over time. Th ird,
migration may capture not only positive spillover
eff ects from a sending nation but also other fac-
tors. Emigration may be due to the possibility of
negative shocks in the sending nation, such as war,
natural disasters, or economic crises, while the
immigrant stock may refl ect not only contempora-
neous infl uences, but also the cumulative eff ect of
migration decisions over all past periods (with the
major changes perhaps having occurred long ago).
40. For example, the Herfi ndahl (Th eil) index tends
to be more sensitive to changes in larger (smaller)
markets, and the Gini is a unidimensional mea-
sure of inequality in distribution.
41. For example, a coalition with very few members
or a very large number of members will tend to
dominate in the calculation of the Shapley-Shubik
index, while the Penrose-Banzhaf index is criti-
cized on the grounds that it treats voting behavior
probabilistically rather than strategically.
42. Additional robustness checks, using additional
variables (the initial level of development, military
expenditure share, and regional dummies) as well
as alternative measures of key variables (geography
with malaria incidence, and institutional quality

66 Changing Growth Poles and Financial Positions Global Development Horizons 2011
Canuto, Otaviano, and Marcelo Giugale, eds. 2010.
Th e Day after Tomorrow: A Handbook on the
Future of Economic Policy in the Developing World.
Washington, DC: World Bank.
Chinn, Menzie D., and Hiro Ito. 2007. “Current
Account Balances, Financial Development, and
Institutions: Assaying the World ‘Saving Glut.’ ”
Journal of International Money and Finance 26 (4):
546–69.
Chinn, Menzie D., and Eswar S. Prasad. 2003.
“Medium-Term Determinants of Current Accounts
in Industrial and Developing Countries: An
Empirical Exploration.” Journal of International
Economics 59 (1): 47–76.
Clark, Gregory. 1987. “Why Isn’t the Whole World
Developed? Lessons from the Cotton Mills.”
Journal of Economic History 47 (1): 141–73.
Cole, Harold L., Lee E. Ohanian, Alvaro J. Riascos,
and James A. Schmitz Jr. 2005. “Latin America
in the Rearview Mirror.” Journal of Monetary
Economics 52 (1): 69–107.
Comin, Diego A., 2010. “An Exploration of
Technology Diff usion.” American Economic Review
100 (5): 2031–59.
Comin, Diego A., Bart Hobijn, and Emilie Rovito.
2008. “Technology Usage Lags.” Journal of
Economic Growth 13 (4): 237–56.
Cuddington, John T., and Daniel Jerrett. 2008. “Super
Cycles in Real Metals Prices?” IMF Staff Papers 55
(4): 541–65.
Dailami, Mansoor. 1992. “Optimal Corporate Debt
Financing and Real Investment Decisions under
Controlled Banking Systems.” In Business Finance
in Less Developed Capital Markets, ed. Klaus P.
Fischer and George J. Papaioannou, 229–49.
Westport, CT: Greenwood Press.
Decker, Jessica Henson, and Jamus Jerome Lim. 2008.
“What Fundamentally Drives Growth? Revisiting
the Institutions and Economic Performance
Debate.” Journal of International Development 20
(5): 698–725.
Doepke, Matthias, and Fabrizio Zilibotti. 2005.
“Social Class and the Spirit of Capitalism.” Journal
of the European Economic Association 3 (2–3):
516–24.
Dollar, David, and Aart C. Kraay. 2002. “Growth Is
Good for the Poor.” Journal of Economic Growth 7
(3): 195–225.
Dooley, Michael P., David Folkerts-Landau, and Peter
M. Garber. 2009. “Bretton Woods II Still Defi nes
the International Monetary System.” Pacific
Economic Review 14 (3): 297–311.
Du, Luosha, Ann E. Harrison, and Gary H. Jeff erson.
2011. “Do Institutions Matter for FDI Spillovers? Th e
———. 2010a. “China’s Economic Growth:
International Spillover.” IMF Working Paper
WP/10/165, International Monetary Fund,
Washington, DC.
———. 2010b. “South Africa in the African Economy:
Growth Spillovers.” Global Journal of Emerging
Market Economies 2 (2): 153–71.
Attanasio, Orazio P., and Guglielmo Weber.
2010. “Consumption and Saving: Models of
Intertemporal Allocation and Th eir Implications
for Public Policy.” Journal of Economic Literature 48
(3): 693–751.
Banerjee, Abhijit V., and Esther Dufl o. 2008. “What
Is Middle Class about the Middle Classes around
the World?” Journal of Economic Perspectives 22 (2):
3–28.
Banzhaf, John F. 1965. “Weighted Voting Doesn’t
Work: A Mathematical Analysis.” Rutgers Law
Review 19 (2): 317–43.
Bardhan, Pranab K. 2010. Awakening Giants, Feet of
Clay: Assessing the Economic Rise of China and India.
Princeton, NJ: Princeton University Press.
Barro, Robert J. 1999. “Notes on Growth Accounting.”
Journal of Economic Growth 4 (2): 119–37.
Barro, Robert J., and Jong-Wha Lee. 2010. “A New
Data Set of Educational Attainment in the
World, 1950–2010.” NBER Working Paper
15902, National Bureau of Economic Research,
Cambridge, MA.
Bayoumi, Tamim, Hui Tong, and Shang-Jin Wei. 2010.
“Th e Chinese Corporate Savings Puzzle: A Firm-
Level Cross-Country Perspective.” IMF Working
Paper WP/10/275, International Monetary Fund,
Washington, DC.
Beck, Th orsten, and Ross Levine. 2005. “Legal
Institutions and Financial Development.” In
Handbook of New Institutional Economics, eds.
Claude Ménard and Mary M. Shirley, 251–80.
Dordrecht, Netherlands: Springer.
Bils, Mark, and Peter J. Klenow. 2000. “Does Schooling
Cause Growth?” American Economic Review 90 (5):
1160–83.
Blanchard, Olivier J., and Francesco Giavazzi. 2006.
“Rebalancing Growth in China: A Th ree-Handed
Approach.” China and World Economy 14 (4): 1–20.
Bonham, Carl M., and Calla Wiemer. 2010. “Chinese
Saving Dynamics: Th e Impact of GDP Growth
and the Dependent Share.” UHERO Working
Paper 2010-11, University of Hawaii at Manoa,
Honolulu.
Caballero, Ricardo J., Emmanuel Farhi, and Pierre-
Olivier Gourinchas. 2008. “An Equilibrium Model
of ‘Global Imbalances’ and Low Interest Rates.”
American Economic Review 98 (1): 358–93.

Global Development Horizons 2011 Changing Growth Poles and Financial Positions 67
Glaeser, Edward L., Rafael La Porta, Florencio
López-de-Silanes, and Andrei Shleifer. 2004. “Do
Institutions Cause Growth?” Journal of Economic
Growth 9 (3): 271–303.
Goldstein, Morris. 2010. “Confronting Asset Bubbles, Too
Big to Fail, and Beggar-Th y-Neighbor Exchange Rate
Policies.” PIIE Policy Brief 10-3, Peterson Institute for
International Economics, Washington, DC.
Griffi th, Rachel, Stephen J. Redding, and Helen
Simpson. 2004. “Foreign Ownership and
Productivity: New Evidence from the Service Sector
and the R&D Lab.” Oxford Review of Economic
Policy 20 (3): 440–56.
Griffi th, Rachel, Stephen J. Redding, and John M. van
Reenen. 2004. “Mapping the Two Faces of R&D:
Productivity Growth in a Panel of OECD Industries.”
Review of Economics and Statistics 86 (4): 883–95.
Griliches, Zvi. 1957. “Hybrid Corn: An Exploration
in the Economics of Technological Change.”
Econometrica 25 (4): 501–22.
Grossman, Gene M., and Elhanan Helpman. 1991a.
Innovation and Growth in the Global Economy.
Cambridge, MA: MIT Press.
———. 1991b. “Trade, Knowledge Spillovers, and
Growth.” European Economic Review 35 (2–3):
517–26.
Gruber, Joseph W., and Steven B. Kamin. 2007.
“Explaining the Global Pattern of Current Account
Imbalances.” Journal of International Money and
Finance 26 (4): 500–522.
Haddad, Mona E., Jamus J. Lim, and Christian
Saborowski. 2010. “Trade Openness Reduces
Growth Volatility When Countries Are Well
Diversifi ed.” Policy Research Working Paper 5222,
World Bank, Washington, DC.
Hallward-Driemeier, Mary, Giuseppe Iarossi,
and Kenneth L. Sokoloff . 2002. “Exports and
Manufacturing Productivity in East Asia: A
Comparative Analysis with Firm-Level Data.”
NBER Working Paper 8894, National Bureau of
Economic Research, Cambridge, MA.
Haskel, Jonathan E., Sonia C. Pereira, and Matthew
J. Slaughter. 2007. “Does Inward Foreign Direct
Investment Boost the Productivity of Domestic
Firms?” Review of Economics and Statistics 89 (3):
482–96.
Hatton, Timothy J. 2010. “The Cliometrics of
International Migration: A Survey.” Journal of
Economic Surveys 24 (5): 941–69.
Hirschman, Albert O. 1964. “Th e Paternity of an
Index.” American Economic Review 54 (5): 761.
Horioka, Charles Yuji, and Jumin Wan. 2007. “Th e
Determinants of Household Saving in China:
Implications of China’s ‘Special Characteristics.’ ”
NBER Working Paper 16767, National Bureau of
Economic Research, Cambridge, MA.
Easterly, William R. 2001. “The Middle Class
Consensus and Economic Development.” Journal
of Economic Growth 6 (4): 317–35.
Eaton, Jonathan, and Samuel S. Kortum. 1996.
“Trade in Ideas: Patenting and Productivity in
the OECD.” Journal of International Economics 40
(3–4): 251–78.
———. 1999. “International Technology Diff usion:
Th eory and Measurement.” International Economic
Review 40 (3): 537–70.
———. 2002. “Technology, Geography, and Trade.”
Econometrica 70 (5): 1741–79.
El-Erian, Mohamed A. 2009. “A New Normal.”
Economic Outlook, May. Newport Beach, CA:
Pacifi c Investment Management Company.
Ethier, Wilfred J. 1986. “Th e Multinational Firm.”
Quarterly Journal of Economics 101 (4): 805–33.
FAO (Food and Agriculture Organization). 2010.
FAOSTAT. Rome: FAO.
Felsenthal, Dan S., and Moshé Machover. 1998. Th e
Measurement of Voting Power: Th eory and Practice,
Problems and Paradoxes. Cheltenham, U.K.:
Edward Elgar.
Feyrer, James D. 2009. “Trade and Income—Exploiting
Time Series in Geography.” NBER Working Paper
14910, National Bureau of Economic Research,
Cambridge, MA.
Findlay, Ronald, and Kevin H. O’Rourke. 2007. Power
and Plenty: Trade, War, and the World Economy in
the Second Millennium. Princeton, NJ: Princeton
University Press.
Fosfuri, Andrea, Massimo Motta, and Th omas Rønde.
2001. “Foreign Direct Investment and Spillovers
through Workers’ Mobility.” Journal of International
Economics 53 (1): 205–22.
Frankel, Jeff rey A., and David H. Romer. 1999. “Does
Trade Cause Growth?” American Economic Review
89 (3): 379–99.
Fujita, Masahisa, Paul R. Krugman, and Anthony
J. Venables. 1999. Th e Spatial Economy: Cities,
Regions, and International Trade. Cambridge, MA:
MIT Press.
Gagnon, Joseph E. 2010. “Current Account Imbalances
in the Global Recovery: Major Policy Changes
Needed.” Unpublished paper, Peterson Institute for
International Economics, Washington, DC.
Gallup, John Luke, Jeff rey D. Sachs, and Andrew
D. Mellinger. 1999. “Geography and Economic
Development.” International Regional Science
Review 22 (2): 179–232.
68 Changing Growth Poles and Financial Positions Global Development Horizons 2011
Kerr, William R., and William F. Lincoln. 2010. “Th e
Supply Side of Innovation: H-1B Visa Reforms and
U.S. Ethnic Invention.” Journal of Labor Economics
28 (3): 473–508.
Kim, Jinyoung, Sangjoon John Lee, and Gerald
R. Marschke. 2009. “International Knowledge
Flows: Evidence from an Inventor-Firm Matched
Data Set.” In Science and Engineering Careers
in the United States: An Analysis of Markets and
Employment, ed. Richard B. Freeman and Daniel
Goroff , 321–48. Chicago: University of Chicago
Press.
Klenow, Peter J., and Andrés Rodríguez-Clare. 1997.
“Th e Neoclassical Revival in Growth Economics:
Has It Gone Too Far?” In NBER Macroeconomics
Annual 1997, vol. 12, ed. Ben S. Bernanke and
Kenneth S. Rogoff , 73–114. Cambridge, MA: MIT
Press.
Knack, Stephen, and Philip E. Keefer. 1997. “Does
Social Capital Have an Economic Payoff ? A Cross
Country Investigation.” Quarterly Journal of
Economics 112 (4): 1251–88.
Krugman, Paul R. 1979. “Increasing Returns,
Monopolistic Competition, and International
Trade.” Journal of International Economics 9 (4):
469–79.
———. 1994. “Th e Myth of Asia’s Miracle.” Foreign
Aff airs 73 (6): 62–78.
Kuijs, Louis. 2006. “How Will China’s Saving-
Investment Balance Evolve?” Policy Research
Working Paper 3958, World Bank, Washington,
DC.
Lane, Philip R., and Gian Maria Milesi-Ferretti. 2006.
“Th e External Wealth of Nations Mark II: Revised
and Extended Estimates of Foreign Assets and
Liabilities, 1970–2004.” Journal of International
Economics 73 (2): 223–50.
Larraín, Felipe B., Luis F. López-Calva, and Andrés
Rodríguez-Clare. 2001. “Intel: A Case Study of
Foreign Direct Investment in Central America.” In
Economic Development in Central America: Growth
and Internationalization, ed. Felipe B. Larraín, 195–
250. Cambridge, MA: Harvard University Press.
Lin, Justin Yifu. 2010. “New Structural Economics:
A Framework for Rethinking Development.”
Policy Research Working Paper 5197, World Bank,
Washington, DC.
Lindert, Peter H. 2004. Growing Public: Social Spending
and Economic Growth since the Eighteenth Century.
Cambridge, U.K.: Cambridge University Press.
Loayza, Norman V., Klaus Schmidt-Hebbel, and Luis
Servén. 2000. “What Drives Private Saving across
A Dynamic Panel Analysis of Provincial Data.”
Journal of Money, Credit, and Banking 39 (8):
2077–96.
Hovhannisyan, Nune, and Wolfgang Keller. 2010.
“International Business Travel: An Engine of
Innovation?” CEPR Discussion Paper 7829, Centre
for Economic Policy Research, London.
Hsieh, Chang-Tai, and Peter J. Klenow. 2009.
“Misallocation and Manufacturing TFP in China
and India.” Quarterly Journal of Economics 124 (4):
1403–48.
IE (International Enterprise) Singapore. 2010. StatLink
Singapore Trade Statistics. Singapore: IE Singapore.
IEA (International Energy Agency). 2010. World
Energy Outlook. Paris: IEA.
IMF (International Monetary Fund). 2010a. Direction
of Trade Statistics. Washington, DC: IMF.
———. 2010b. Fiscal Monitor. Washington, DC: IMF.
———. 2010c. International Financial Statistics.
Washington, DC: IMF.
———. 2010d. Republic of Korea: Selected Issues.
Washington, DC: IMF.
———. 2011. New Growth Drivers for Low-Income
Countries: Th e Role of BRICs. Washington, DC:
IMF.
Javorcik, Beata Smarzynska. 2004. “Does Foreign
Direct Investment Increase the Productivity of
Domestic Firms? In Search of Spillovers through
Backward Linkages.” American Economic Review
94 (3): 605–27.
Jones, Benjamin F., and Benjamin A. Olken. 2008.
“Th e Anatomy of Start-Stop Growth.” Review of
Economics and Statistics 90 (3): 582–87.
Jorgenson, Dale W., and Khuong M. Vu. 2010.
“Potential Growth of the World Economy.” Journal
of Policy Modeling 32 (5): 615–31.
Kaufmann, Daniel, Aart C. Kraay, and Massimo
Mastruzzi. 2010. “Th e Worldwide Governance
Indicators: Methodology and Analytical Issues.”
Policy Research Working Paper 5430, World Bank,
Washington, DC.
Keller, Wolfgang. 2002. “Geographic Localization of
International Technology Diff usion.” American
Economic Review 92 (1): 120–42.
Keller, Wolfgang, and Stephen R. Yeaple. 2009.
“Multinational Enterprises, International Trade,
and Productivity Growth: Firm-Level Evidence
from the United States.” Review of Economics and
Statistics 91 (4): 821–31.
Kerr, William R. 2008. “Ethnic Scientifi c Communities
and International Technology Diff usion.” Review of
Economics and Statistics 90 (3): 518–37.
Global Development Horizons 2011 Changing Growth Poles and Financial Positions 69
BRICs?” Global Economics Paper 134, Goldman
Sachs, London.
OECD (Organisation for Economic Co-operation
and Development). 2010. Perspectives on Global
Development 2010: Shif ting Wealth. Paris:
OECD.
Oettl, Alexander, and Ajay K. Agrawal. 2008.
“International Labor Mobility and Knowledge
Flow Externalities.” Journal of International Business
Studies 39 (8): 1242–60.
Parente, Stephen L., and Edward C. Prescott. 2000.
Barriers to Riches. Cambridge, MA: MIT Press.
Patentscope Database. World Intellectual Property
Organization. http:/www.wipro.int/pctdb/en/.
Penrose, Lionel S. 1946. “Th e Elementary Statistics
of Majority Voting.” Journal of the Royal Statistical
Society 109 (1): 53–57.
PRS Group. 2010. International Country Risk Guide.
East Syracuse, NY: PRS Group.
Puga, Diego, and Daniel Trefl er. 2010. “Wake Up
and Smell the Ginseng: International Trade and
the Rise of Incremental Innovation in Low-Wage
Countries.” Journal of Development Economics 91
(1): 64–76.
Quinn, Dennis P., and A. Maria Toyoda. 2008. “Does
Capital Account Liberalization Lead to Growth?”
Review of Financial Studies 21 (3): 1403–49.
Rauch, James E. 2001. “Business and Social Networks
in International Trade.” Journal of Economic
Literature 39 (4): 1177–203.
Ravallion, Martin. 2010. “Th e Developing World’s
Bulging (but Vulnerable) Middle Class.” World
Development 38 (4): 445–54.
Ray, James Lee, and J. David Singer. 1973. “Measuring the
Concentration of Power in the International System.”
Sociological Methods and Research 1 (4): 403–37.
Reinhart, Carmen M., and Kenneth S. Rogoff.
2009. This Time Is Different: Eight Centuries
of Financial Folly. Princeton, NJ: Princeton
University Press.
Rey, Sergio J., and Mark V. Janikas. 2005. “Regional
Convergence, Inequality, and Space.” Journal of
Economic Geography 5 (2): 155–76.
Rivera-Batiz, Luis A., and Paul M. Romer. 1991.
“Economic Integration and Endogenous Growth.”
Quarterly Journal of Economics 106 (2): 531–55.
Rodríguez, Francesco R., and Dani Rodrik. 2000.
“Trade Policy and Economic Growth: A Skeptic’s
Guide to the Cross-National Evidence.” In NBER
Macroeconomics Annual, vol. 15, ed. Ben S. Bernanke
and Kenneth S. Rogoff , 261–338. Cambridge, MA:
MIT Press.
the World?” Review of Economics and Statistics 82
(2): 165–81.
Maddison, Angus. 2003. Th e World Economy: Historical
Statistics. Paris: Organisation for Economic
Co-operation and Development.
———. 2007. Contours of the World Economy 1–2030
AD: Essays in Macro-economic History. Oxford,
U.K.: Oxford University Press.
Mankiw, N. Gregory, David Romer, and David N.
Weil. 1992. “A Contribution to the Empirics of
Economic Growth.” Quarterly Journal of Economics
107 (2): 407–37.
Mansfi eld, Edward D. 1993. “Concentration, Polarity,
and the Distribution of Power.” International
Studies Quarterly 37 (1): 105–28.
Markusen, James R. 2004. Multinational Firms and
the Th eory of International Trade. Cambridge, MA:
MIT Press.
McCraw, Th omas K. 2010. “Immigrant Entrepreneurs
in U.S. Financial History, 1775–1914.” Capitalism
and Society 5 (1): art 3. http://www.bepress.com/
cas/vol5/iss1/art3.
McDonald, Ronald. 2007. Exchange Rate Economics:
Th eory and Evidence. London: Routledge.
McMillan, Margaret S., and Dani Rodrik. 2011.
“Globalization, Structural Change, and
Productivity Growth.” Unpublished paper, Harvard
Kennedy School, Cambridge, MA.
Melitz, Marc J. 2003. “Th e Impact of Trade on Intra-
industry Allocations and Aggregate Industry
Productivity.” Econometrica 71 (6): 1695–725.
Modigliani, Franco, and Shi Larry Cao. 2004. “Th e
Chinese Saving Puzzle and the Life-Cycle Hypothesis.”
Journal of Economic Literature 42 (1): 145–70.
Modigliani, Franco, and Merton H. Miller. 1958. “Th e
Cost of Capital, Corporation Finance, and the
Th eory of Investment.” American Economic Review
48 (3): 261–97.
Murdoch, James C., and Todd Sandler. 2002. “Economic
Growth, Civil Wars, and Spatial Spillovers.” Journal
of Confl ict Resolution 46 (1): 91–110.
Nye, Joseph S. 2004. Soft Power: Th e Means to Success in
World Politics. New York: PublicAff airs.
O’Neill, Jim. 2001. “Building Better Global Economic
BRICs.” Global Economics Paper 66, Goldman
Sachs, London.
O’Neill, Jim, and Anna Stupnytska. 2009. “Th e Long-
Term Outlook for the BRICs and N-11 Post Crisis.”
Global Economics Paper 192, Goldman Sachs,
London.
O’Neill, Jim, Dominic Wilson, Roopa Purushothaman,
and Anna Stupnytska. 2005. “How Solid Are the

70 Changing Growth Poles and Financial Positions Global Development Horizons 2011
Rising Sex Ratios and Savings Rates in China.”
NBER Working Paper 15093, National Bureau of
Economic Research, Cambridge, MA.
Wilson, Dominic, and Raluca Dragusanu. 2008. “Th e
Expanding Middle: Th e Exploding World Middle
Class and Falling Global Inequality.” Global
Economics Paper 170, Goldman Sachs, New York.
Wilson, Dominic, and Roopa Purushothaman. 2003.
“Dreaming with BRICs: Th e Path to 2050.” Global
Economics Paper 99, Goldman Sachs, New York.
Woetzel, Jonathan, Janamitra Devan, Richard Dobbs,
Adam Eichner, Stefano Negri, and Micah Rowland.
2009. If You’ve Got It, Spend It: Unleashing the
Chinese Consumer. Beijing: McKinsey Global
Institute.
World Bank. 1979. World Development Report 1979:
Structural Change and Development Policy. New
York: Oxford University Press.
———. 1987. World Development Report 1987:
Industrialization and Foreign Trade. New York:
Oxford University Press.
———. 1993. Th e East Asian Miracle: Economic Growth
and Public Policy. New York: Oxford University
Press.
———. 2007. Global Economic Prospects 2007:
Managing the Next Wave of Globalization.
Washington, DC: World Bank.
———. 2009a. Global Economic Prospects 2009:
Commodities at the Crossroads. Washington, DC:
World Bank.
———. 2009b. World Development Report 2009:
Reshaping Economic Geography. Washington, DC:
World Bank.
———. 2010a. Doing Business 2010: Reforming through
Diffi cult Times. Washington, DC: World Bank.
———. 2010b. World Development Indicators.
Washington, DC: World Bank.
———. 2011. Global Economic Prospects January 2011:
Navigating Strong Currents. Washington, DC:
World Bank.
WVSA (World Values Survey Association). 2009.
World Values Survey 1981–2008 Offi cial Aggregate
v.20090901. Madrid: WVSA.
Young, Alwyn. 1995. “Th e Tyranny of Numbers:
Confronting the Statistical Realities of the East
Asian Growth Experience.” Quarterly Journal of
Economics 110 (3): 641–80.
Rodríguez-Clare, Andrés. 1996. “Multinationals,
Linkages, and Economic Development.” American
Economic Review 86 (4): 852–73.
Rodrik, Dani, Arvind Subramanian, and Francesco
Trebbi. 2004. “Institutions Rule: Th e Primacy
of Institutions over Geography and Integration
in Economic Development.” Journal of Economic
Growth 9 (2): 131–65.
Romer, Paul M. 1986. “Increasing Returns and Long-
Run Growth.” Journal of Political Economy 94 (5):
1002–37.
———. 1990. “Endogenous Technological Change.”
Journal of Political Economy 98 (5): S71–102.
Sala-i-Martin, Xavier X. 2006. “Th e World Distribution
of Income: Falling Poverty and . . . Convergence,
Period.” Quarterly Journal of Economics 121 (2):
351–97.
Sala-i-Martin, Xavier X., Gernot Doppelhofer, and
Ronald I. Miller. 2004. “Determinants of Long-
Term Growth: A Bayesian Averaging of Classical
Estimates (BACE) Approach.” American Economic
Review 94 (4): 813–35.
Schmidt-Hebbel, Klaus, Steven B. Webb, and Giancarlo
Corsetti. 1992. “Household Saving in Developing
Countries: First Cross-Country Evidence.” World
Bank Economic Review 6 (3): 529–47.
Shapley, Lloyd S., and Martin Shubik. 1954. “A
Method for Evaluating the Distribution of Power
in a Committee System.” American Political Science
Review 48 (3): 787–92.
Solow, Robert M. 1956. “A Contribution to the
Th eory of Economic Growth.” Quarterly Journal of
Economics 70 (1): 65–94.
USEIA (United States Energy Information
Administration). 2010. International Energy
Outlook. Washington, DC: USEIA.
van der Mensbrugghe, Dominique. 2005. Linkage
Technical Reference Document, version 6.1.
Washington, DC: World Bank.
Wang, Jing, and John Whalley. 2010. “China’s Trade
and Investment with the South: Pre- and Post-crisis.”
In Managing Openness: Trade and Outward-Oriented
Growth after the Crisis. Ed. Mona Haddad and Ben
Shepherd, 119–34. Washington, DC: World Bank.
WBMS (World Bureau of Metal Statistics). 2010.
World Metal Statistics. Hertfordshire, U.K.: World
Bureau of Metal Statistics.
Wei, Shang-Jin, and Xiaobo Zhang. 2009. “Th e
Competitive Saving Motive: Evidence from


Global Development Horizons 2011 73
The Changing Global Corporate Landscape
THE SHIFT IN ECONOMIC AND
financial power toward the developing
world is having important implications for
the global corporate environment. As they pur-
sue growth opportunities outside the borders of
their home countries, corporate players based in
emerging markets are redefi ning the landscape
of global investment and production. Emerging-
market firms have become an important force
behind new foreign direct investment (FDI)
fl ows, in terms of both cross-border acquisitions
and greenfi eld investments, and are growing par-
ticipants in international capital markets. The
transformation of fi rms based in Brazil, China,
India, Malaysia, Mexico, the Russian Federation,
and other major emerging economies into impor-
tant foreign investors offers remarkable oppor-
tunities and challenges for the global economy.
Moving forward, multinational firms based in
emerging markets will become important agents
of change on a global scale, pushing for more
open policies at home and abroad and posing
greater competition to advanced-country fi rms
for natural resources, technology, and access
to capital markets. At the same time, advanced
economies will need to become more accustomed
to receiving investments from countries with
income levels and social practices very diff erent
from their own.
More than half a century of precedent defi nes
the rise of modern multinational firms. Rapid
overseas expansion of multinationals based in
advanced countries in the postwar era had its
origins in the technological superiority and sup-
portive institutional environment of home coun-
tries, including ready access to fi nancing for such
expansion. In addition to technological and insti-
tutional strength, political power—whether exer-
cised through gunboat diplomacy, as in colonial
times, or through economic diplomacy—also
played an important role in expanding the foot-
print of advanced-country multinational fi rms.
A voluminous body of interdisciplinary litera-
ture weaving together insights from international
business, economics, sociology, and international
politics has documented how multinational fi rms
strategically locate themselves to exploit the rela-
tive technological advantages of home and host
countries, how the firms serve as conduits for
technology transfers, and how they infl uence the
pace of globalization. The literature—from the
infl uential product life-cycle hypothesis (Vernon
1966) to recent advances in the context of interna-
tional fragmentation of production (Antràs 2005;
Harrison and Scorse 2010)—has focused on the
experiences of advanced-economy fi rms, with lit-
tle attention paid to the behavior of multinational
fi rms from emerging markets. But with emerging-
market fi rms progressively gaining more political
power and fi nancing ability, this focus is set to
change in the future.
Th is chapter provides a corporate perspective
on the global trajectory toward increasing multi-
polarity. As the growth and institutional environ-
ments facing emerging-market fi rms change along
this trajectory, the fi rms’ behavior—namely, their
strategic investment in global expansion, their
choice of foreign investment in advanced econo-
mies versus in emerging economies, and the ways
in which such fi rms access and use cross-border
fi nancing—signals both the changing status of
their home countries and their evolving business
and fi nancing strategies. Th e main messages of
chapter 2 are as follows:
• As they pursue growth opportunities at a
global level, emerging-market fi rms increas-
ingly are becoming more prominent in the
2
74 The Changing Global Corporate Landscape Global Development Horizons 2011
international arena, and are an important
force behind global FDI f lows. Between
1997 and 2003, companies based in
emerging economies engaged in cross-
border investment through merger and
acquisition (M&A) deals worth $189 bil-
lion, or 4 percent of the value of all global
M&A investment. From 2004 to 2010,
that amount increased to $1.1 trillion—17
percent of the global total. Emerging-
market f irms made 12,516 greenf ield
investments worth $1.72 trillion between
January 2003 and June 2010. As they
expand, emerging-market fi rms are deep-
ening their reach in international capital
markets through an increasing number
of equity cross-listings, syndicated loans,
and issues on international bond markets.
As of 2008, the foreign affi liates of the top
100 multinational fi rms based in emerg-
ing economies held foreign assets of $907
billion (of $2.68 trillion total assets) and
had a foreign sales volume of $997 billion
(UNCTAD 2009).
In the years ahead, emerging-market
fi rms are likely to press for economic poli-
cies that will strengthen their investment
climates at home. Emerging-market fi rms
will serve as a force for increased integra-
tion of their home countries into the global
economy, which provides additional sup-
port for open trading and investment
regimes. But the firms will also serve as
a growing source of competition. One
illustration of this trend is that emerging-
market fi rms are increasingly being driven
by resource-seeking and effi ciency-seeking
motives in undertaking new cross-border
investments—motives traditionally con-
sidered the preserve of advanced-country
firms. Emerging-market firms will also
challenge advanced-country fi rms’ preemi-
nence in developing new technologies and
industrial processes. In some cases, leading
emerging-market fi rms have already begun
overtaking their industrial-country com-
petitors in terms of the priority accorded
to research and development (R&D): 114
firms based in emerging economies now
rank among the top 1,000 fi rms worldwide
by R&D spending, double the number
fi ve years earlier—a particularly notewor-
thy change, given that the private sector
traditionally has not been the main fi nan-
cier of R&D in developing countries. And
as emerging-market f irms increasingly
draw on their relative advantage over their
advanced-country counterparts in dealing
with the often-difficult policy environ-
ments in other developing countries, the
emerging-market firms are becoming a
potent force for globalization in their own
right.
Econometric investigations establish a
statistically signifi cant relationship between
bilateral cross-border investment by emerg-
ing-market fi rms in countries with strong
growth potential, sound institutions, and
strong trade links. Moreover, the analysis
confirms the hypothesis that emerging-
market companies tend to expand abroad
to exploit growth opportunities that are
not present in their home economies, or in
order to escape an unfavorable economic
climate at home. Variables such as bilat-
eral trade links and geographic distance,
which represent the economic relationship
between home and host countries, are also
closely associated with bilateral investment
f lows—although the latter appear only
in the case of South-South investments.
Cross-border investments into advanced
economies are more prevalent in the case
of fi rms based in larger, more open econo-
mies, and in economies with more mature
equity markets.
• An increasing number of developing countries
will be able to gain increased access to inter-
national bond and equity markets—and on
better terms than at the present—to fi nance
strategic investments in the global expan-
sion of their operations. Nearly two-thirds
of emerging-market fi rms that have been
active acquirers since the late 1990s (those

Global Development Horizons 2011 The Changing Global Corporate Landscape 75
that have undertaken 10 or more M&A
deals) have accessed one or more forms of
cross-border capital—through syndicated
loans, bond issues, and equity listings. As
evidence of the mutually reinforcing link-
ages between commercial and financial
globalization, a considerable proportion of
those emerging-market fi rms are undertak-
ing cross-border acquisitions within two
years of having raised fi nance on interna-
tional capital markets. International bond
issuance by borrowers based in emerging
markets has grown dramatically since the
mid-1990s and has come to represent one
of the main sources of capital infl ows for
these companies. A comparison of bor-
rowing trends over the past 15 years by
emerging-market fi rms and fi rms based in
advanced countries points to significant
scope for further improvement of emerging
market companies’ access to international
capital markets.
• Th e growing importance of developing-coun-try multinationals also could increase sup-port for establishing an eff ective multilateral regulatory framework for foreign invest-ment—a goal which has remained elusive since the 1920s. Bilateral investment trea-
ties (BITs), the dominant mechanism gov-
erning cross-border investment fl ows over
the past several decades (numbering more
than 2,275 in 2007, up from just 250 in
the mid-1980s), have proved a suboptimal
approach to the management of cross-bor-
der investment oversight, as the growing
number of BITs has led to an increasingly
complex web of agreements. But the rising
prominence of developing countries as a
source of FDI—in addition to their tra-
ditional role as a destination—soon may
facilitate agreement on multilateral cross-
border investment rules. Longstanding
and cogent arguments suggest that an
effective multilateral framework would
enhance the stability and predictability
of cross-border investment fl ows, thereby
increasing the supply of productive and
development-enhancing FDI.
Emerging-Market Multinationals: Agents of Change in a Multipolar WorldThe rise of emerging-market multinationals
Encouraged by improved regulatory treatment and
steadily maturing fi nancial systems in their home
countries, corporations based in emerging markets
are playing an increasingly prominent role in global
business. Th e number of emerging-market corpo-
rations listed among the Fortune Global 500, an
annual ranking, by revenues, of the world’s largest
corporations, rose from 47 fi rms in 2005 to 95 in
2010. Companies based in emerging markets have
become the new engines of growth in the global
M&A market, with the number of cross-border
acquisitions undertaken by such companies rising
from 661 acquisitions in 2001 (9 percent of global
cross-border M&A transactions) to 2,447 (22 per-
cent) in 2010 (fi gure 2.1). Of the total of 11,113
cross-border M&A deals announced worldwide in
2010, 5,623 deals involved emerging-market com-
panies either as buyers or as takeover targets by
advanced-country fi rms.
Greenfield investment by emerging- market
fi rms, which represents internal, organic cor porate
0
200
400
600
800
1,000
1,200
1,400
1,600
1,800
1997 1999 2001 2003 2005 2007 2009
va
lue
, $ b
illi
on
s
0
2,000
4,000
6,000
8,000
10,000
12,000
nu
mb
er
of
de
als
value (EM) value (advanced) number of deals (right axis)
FI GURE 2.1 Total cross-border M&A deals by fi rms from advanced economies and emerging-market economies, 1997–2010
Source: World Bank staff estimates based on Thomson-Reuters SDC Platinum.
Note: EM = emerging markets.
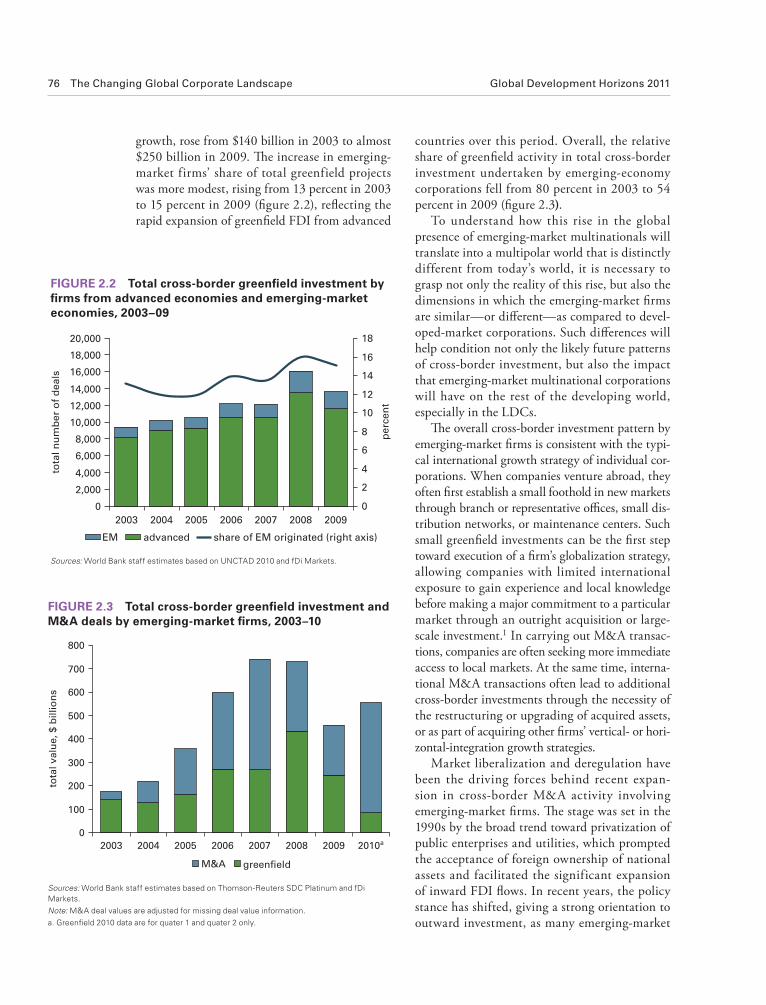
76 The Changing Global Corporate Landscape Global Development Horizons 2011
growth, rose from $140 billion in 2003 to almost
$250 billion in 2009. Th e increase in emerging-
market firms’ share of total greenfield projects
was more modest, rising from 13 percent in 2003
to 15 percent in 2009 (fi gure 2.2), refl ecting the
rapid expansion of greenfi eld FDI from advanced
countries over this period. Overall, the relative
share of greenfi eld activity in total cross-border
investment undertaken by emerging- economy
corporations fell from 80 percent in 2003 to 54
percent in 2009 (fi gure 2.3).To understand how this rise in the global
presence of emerging-market multinationals will
translate into a multipolar world that is distinctly
different from today’s world, it is necessary to
grasp not only the reality of this rise, but also the
dimensions in which the emerging-market fi rms
are similar—or diff erent—as compared to devel-
oped-market corporations. Such diff erences will
help condition not only the likely future patterns
of cross-border investment, but also the impact
that emerging-market multinational corporations
will have on the rest of the developing world,
especially in the LDCs.
Th e overall cross-border investment pattern by
emerging-market fi rms is consistent with the typi-
cal international growth strategy of individual cor-
porations. When companies venture abroad, they
often fi rst establish a small foothold in new markets
through branch or representative offi ces, small dis-
tribution networks, or maintenance centers. Such
small greenfi eld investments can be the fi rst step
toward execution of a fi rm’s globalization strategy,
allowing companies with limited international
exposure to gain experience and local knowledge
before making a major commitment to a particular
market through an outright acquisition or large-
scale investment.1 In carrying out M&A transac-
tions, companies are often seeking more immediate
access to local markets. At the same time, interna-
tional M&A transactions often lead to additional
cross-border investments through the necessity of
the restructuring or upgrading of acquired assets,
or as part of acquiring other fi rms’ vertical- or hori-
zontal-integration growth strategies.
Market liberalization and deregulation have
been the driving forces behind recent expan-
sion in cross-border M&A activity involving
emerging-market fi rms. Th e stage was set in the
1990s by the broad trend toward privatization of
public enterprises and utilities, which prompted
the acceptance of foreign ownership of national
assets and facilitated the significant expansion
of inward FDI fl ows. In recent years, the policy
stance has shifted, giving a strong orientation to
outward investment, as many emerging-market
0
2,000
4,000
6,000
8,000
10,000
12,000
14,000
16,000
18,000
20,000
2003 2004 2005 2006 2007 2008 2009
tota
l n
um
ber
of
deals
0
2
4
6
8
10
12
14
16
18
perc
en
t
advancedEM share of EM originated (right axis)
FIG URE 2.2 Total cross-border greenfi eld investment by fi rms from advanced economies and emerging-market economies, 2003–09
Sources: World Bank staff estimates based on UNCTAD 2010 and fDi Markets.
0
100
200
300
400
500
600
700
800
2003 2004 2005 2006 2007 2008 2009 2010a
tota
l v
alu
e,
$ b
illi
on
s
M&A greenfield
Sources: World Bank staff estimates based on Thomson-Reuters SDC Platinum and fDi Markets.
Note: M&A deal values are adjusted for missing deal value information.
a. Greenfi eld 2010 data are for quater 1 and quater 2 only.
FIGU RE 2.3 Total cross-border greenfi eld investment and M&A deals by emerging-market fi rms, 2003–10

Global Development Horizons 2011 The Changing Global Corporate Landscape 77
governments have taken steps to ease restric-
tions on outfl ows of foreign investment, both to
improve the ability of domestic fi rms to compete
in global markets and to limit the accumulation
of foreign exchange reserves from trade surpluses
and capital infl ows. For example, since the late
1990s, China has gradually reduced restrictions
on outward investment by decentralizing author-
ity for project approval and easing controls on
foreign exchange outfl ows used for foreign invest-
ment; China has also actively promoted outward
investment through loans and diplomatic support,
focusing first on large state-owned enterprises
(SOEs) and later on small and private fi rms. After
the recent fi nancial crisis, Argentina, Kazakhstan,
the Philippines, and South Africa further boosted
support to outward FDI through simplifying
administrative procedures, providing business
consulting service for enterprises, and relaxing
exchange controls on residents. Some emerging-
market governments have also helped to reduce
the political risks involved in outward investment
by signing BITs with host-country governments.
The rise of emerging-market firms is also
apparent in their greater participation in
innovation. Although the majority of corporate
R&D spending still comes from G-3 econo-
mies (fi gure 2.4), the relative G-3 advantage is
eroding, and the number of emerging-market
fi rms included in the top 1,000 fi rms ranked by
R&D expenditure rose from 57 fi rms in 2004
to 114 in 2009 (U.K. Department for Business,
Innovation and Skills 2010). Th is is especially
remarkable given that, in developing countries,
the private sector traditionally has not been
the main fi nancier of local R&D eff orts.2 Even
more impressive than the increased spending on
R&D by emerging-market fi rms is the growing
tendency of emerging-market residents to obtain
patents from countries other than their home
countries (fi gure 2.5).3
The intended technological development
outcomes of increased R&D spending and the
granting of additional patents can occur through
innovation, absorption of existing technolo-
gies that are new to a particular market, or dis-
semination of technologies throughout a market
(World Bank 2008). Although the creation of
entirely new technologies remains an activity
dominated by advanced economies, the pace at
which developing countries absorb new technol-
ogy has increased rapidly in recent years, deter-
mined by improvements in property rights and
macroeconomic stability on one hand, and on the
other hand, by the extent to which countries are
exposed to foreign technology through FDI and
0
5
10
15
20
25
30
35
1995
1996
1997
1998
1999
2000
2001
2002
2003
2004
2005
2006
2007
2008
tho
usa
nd
s
0
2
4
6
8
10
12
pe
rce
nt
number of patents (left axis)
percent of worldwide patents (right axis)
FIGURE 2.5 Cross-border patents granted worldwide to residents of emerging economies, 1995–2008
Source: World Bank staff estimates based on World Intellectual Property Organization (WIPO).
a. 2004 b. 2009
42% 34%
12%6%
Japaneuro area EM United Kingdom Switzerlandother developed Sweden Denmark United States
FIGUR E 2.4 Geographic distribution of the top 1,000 fi rms by R&D spending
Source: U.K. Department for Business, Innovation, and Skills 2005, 2010.
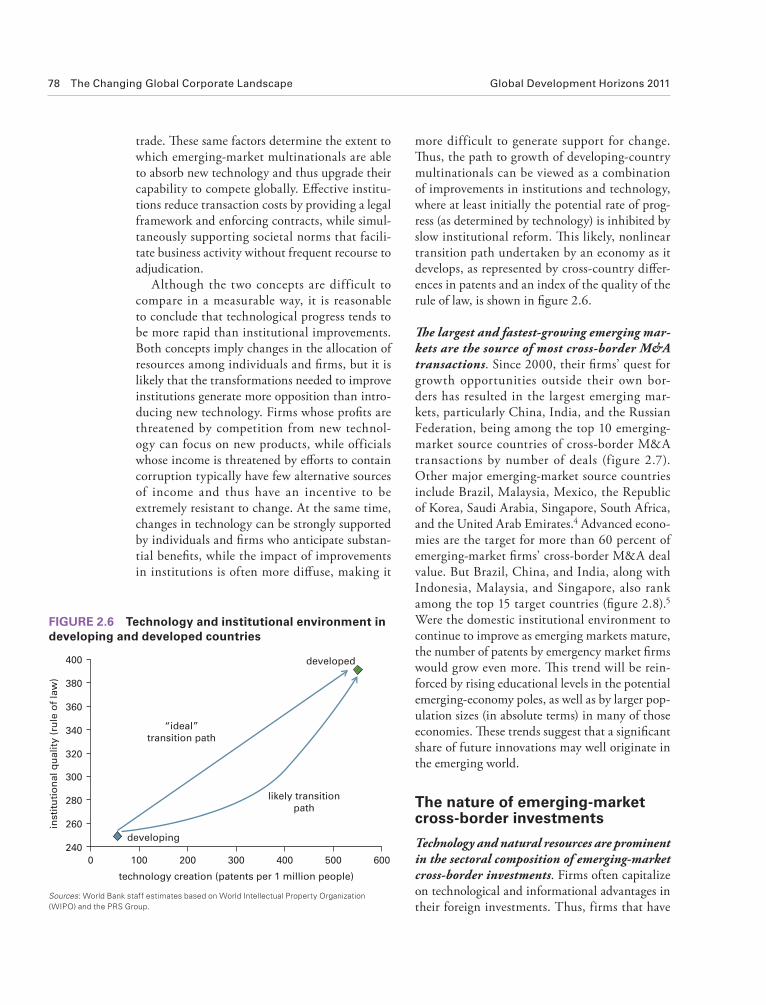
78 The Changing Global Corporate Landscape Global Development Horizons 2011
more difficult to generate support for change.
Th us, the path to growth of developing-country
multinationals can be viewed as a combination
of improvements in institutions and technology,
where at least initially the potential rate of prog-
ress (as determined by technology) is inhibited by
slow institutional reform. Th is likely, nonlinear
transition path undertaken by an economy as it
develops, as represented by cross-country diff er-
ences in patents and an index of the quality of the
rule of law, is shown in fi gure 2.6.
Th e largest and fastest-growing emerging mar-
kets are the source of most cross-border M&A
transactions. Since 2000, their fi rms’ quest for
growth opportunities outside their own bor-
ders has resulted in the largest emerging mar-
kets, particularly China, India, and the Russian
Federation, being among the top 10 emerging-
market source countries of cross-border M&A
transactions by number of deals (figure 2.7).
Other major emerging-market source countries
include Brazil, Malaysia, Mexico, the Republic
of Korea, Saudi Arabia, Singapore, South Africa,
and the United Arab Emirates.4 Advanced econo-
mies are the target for more than 60 percent of
emerging-market fi rms’ cross-border M&A deal
value. But Brazil, China, and India, along with
Indonesia, Malaysia, and Singapore, also rank
among the top 15 target countries (fi gure 2.8).5
Were the domestic institutional environment to
continue to improve as emerging markets mature,
the number of patents by emergency market fi rms
would grow even more. Th is trend will be rein-
forced by rising educational levels in the potential
emerging-economy poles, as well as by larger pop-
ulation sizes (in absolute terms) in many of those
economies. Th ese trends suggest that a signifi cant
share of future innovations may well originate in
the emerging world.
The nature of emerging-market cross-border investments
Technology and natural resources are prominent
in the sectoral composition of emerging-market
cross-border investments. Firms often capitalize
on technological and informational advantages in
their foreign investments. Thus, firms that have
trade. Th ese same factors determine the extent to
which emerging-market multinationals are able
to absorb new technology and thus upgrade their
capability to compete globally. Eff ective institu-
tions reduce transaction costs by providing a legal
framework and enforcing contracts, while simul-
taneously supporting societal norms that facili-
tate business activity without frequent recourse to
adjudication.
Although the two concepts are difficult to
compare in a measurable way, it is reasonable
to conclude that technological progress tends to
be more rapid than institutional improvements.
Both concepts imply changes in the allocation of
resources among individuals and fi rms, but it is
likely that the transformations needed to improve
institutions generate more opposition than intro-
ducing new technology. Firms whose profi ts are
threatened by competition from new technol-
ogy can focus on new products, while officials
whose income is threatened by eff orts to contain
corruption typically have few alternative sources
of income and thus have an incentive to be
extremely resistant to change. At the same time,
changes in technology can be strongly supported
by individuals and fi rms who anticipate substan-
tial benefi ts, while the impact of improvements
in institutions is often more diff use, making it
240
260
280
300
320
340
360
380
400
0 100 200 300 400 500 600
inst
itu
tio
nal
qu
ali
ty (
rule
of
law
)
developing
developed
technology creation (patents per 1 million people)
“ideal”transition path
likely transitionpath
FIGURE 2.6 Technology and institutional environment in developing and developed countries
Sources: World Bank staff estimates based on World Intellectual Property Organization (WIPO) and the PRS Group.

Global Development Horizons 2011 The Changing Global Corporate Landscape 79
expertise in a particular sector but face decreasing
returns as that sector matures in their home coun-
try can apply this expertise to the same industries
abroad. Th e same concept applies to the institu-
tional environments in which firms operate. As
such, emerging-market fi rms with expertise over-
coming the diffi cult institutional environment in
their home countries can apply this information to
similar environments in other emerging markets.
Th is application is refl ected in the prominence of
mainly high-value, nontradable service sectors in
emerging-market M&A transactions, where the
ability to navigate political sensitivities can be a
significant competitive advantage: telecommu-
nications (the top sector for cross-border M&A
transactions by emerging-market fi rms),6 fi nancial
services, computer and electronic products, and
professional, scientifi c, and technical services.
Similarly, the top sectors for greenfi eld invest-
ment are fi nancial services and software and infor-
mation technology (IT). Th e IT sector illustrates
FIGURE 2. 7 Top source countries of emerging-market fi rms’ cross-border M&A deals in emerging economies and advanced economies
Source: World Bank staff estimates based on Thomson-Reuters SDC Platinum.Note: EAP = East Asia and the Pacifi c; LAC = Latin America and the Caribbean; MENA = Middle East and North Africa; SSA = Sub-Saharan Africa.
China China
Singapore
SingaporeMalaysia
India
India
RussianFederation
RussianFederation
United ArabEmirates
United Arab Emirates
MexicoMexico
other MENA
other MENAother LAC
other EAPother EAP
otherother
Brazil
SSA
South-South South-North
0
50
100
150
200
250
300
350
400
450
$ b
illio
ns
0
150
300
450
600
750
$ b
illio
ns
a. Emerging b. Advanced
the importance of technological expertise in foreign
investment. Having long been important suppliers
of outsourced services and contract R&D in the
software and IT industry, such emerging-market
companies have become important players in their
own right, establishing operations in the countries
of their erstwhile partners to be close to fi nal cus-
tomers and to compete directly with their former
clients. There may be a bias in emerging-market
fi rms toward greenfi eld investments in knowledge-
intensive sectors, in which intellectual property,
process engineering, and technological innovation
are key competitive advantages. Greenfi eld invest-
ment allows companies to protect these advantages
better than does M&A investment.
Th e importance of technological and institu-
tional environment advantages does not mean,
however, that most firms’ cross-border invest-
ments are in the predominant industry of their
home operations. Indeed, nearly 60 percent of
emerging-market fi rms’ M&A deals occur outside

80 The Changing Global Corporate Landscape Global Development Horizons 2011
The sectoral composition of cross-border
investment also refl ects the rising prices of and
growing competition for natural resources. Th us,
oil and gas extraction is the second-largest sector,
by value, of emerging-market fi rms’ cross-border
M&A transactions.7 Mining, nonmetallic mineral
production, and mining support activities also fea-
ture prominently among the top 15 target indus-
tries by value.8 Similarly, metal, chemical, and
food manufacturing activities—the downstream
value-adding counterparts to the commodity-pro-
ducing industries—are prominent target sectors
of emerging-market fi rms’ M&A eff orts. Energy
and metals also fi gure prominently in emerging
markets’ greenfi eld investments.9
South-South FDI is more likely to be green-
fi eld, whereas South-North FDI is more likely
to be acquisitive. Emerging-market fi rms show a
distinct preference for greenfi eld investments over
M&A transactions in other emerging markets
and for M&A transactions over greenfi eld invest-
ments in advanced economies. Greenfi eld invest-
ments accounted for 72 percent of emerging-mar-
ket fi rms’ investment in other emerging markets
over 2003–09, and accounted for the majority of
South-South FDI fl ows even during the height of
the expansion (fi gure 2.9).
the acquirer’s industry, as defi ned by broad three-
digit North American Industry Classification
System codes. This proportion has been stable
over time and is similar in both advanced-country
and emerging-market targets. Mining, energy,
telecommunications, food and beverage produc-
tion, chemical manufacturing, and credit inter-
mediation rank among the least diversifi ed sectors.
Among the most diversifi ed industries are comput-
ers and electronic products; primary metals manu-
facturing; professional, scientific, and technical
services; machinery manufacturing; publishing;
heavy and civil engineering construction; wholesal-
ing; and the brokerage sector. Economies of scale
and industry-specifi c know-how are likely determi-
nants of the degree of diversifi cation; the more spe-
cialized their requisite technological expertise and
the larger the scope for economies of scale, the less
fi rms tend to stray from their own sector. In terms
of country of origin, East Asian fi rms, especially
those based in China, Indonesia, Korea, Malaysia,
and Singapore, are the most diversifi ed among the
economies with the most acquisitive corporate sec-
tors (in excess of 60 percent diversifying transac-
tions). Brazil, India, Mexico, and South Africa are
home to fi rms with a sharper corporate focus—in
those countries, diversifying deals range between
40 percent and 52 percent.
FIGURE 2. 8 Top destination countries for emerging- market fi rms’ cross-border M&A deals in emerging economies and advanced economies
0
50
100
150
200
250
300
350
400
450
South-South South-North
$ b
illi
on
s
0
150
300
450
600
750
$ b
illi
on
s
a. Emerging b. Advanced
China
Singapore
Brazil
IndonesiaTurkey
MENA
other South
United States
United Kingdom
Canada
Australia
ItalyGermany
other North
other EAP
other LAC
India
Source: World Bank staff estimates based on Thomson-Reuters SDC Platinum.
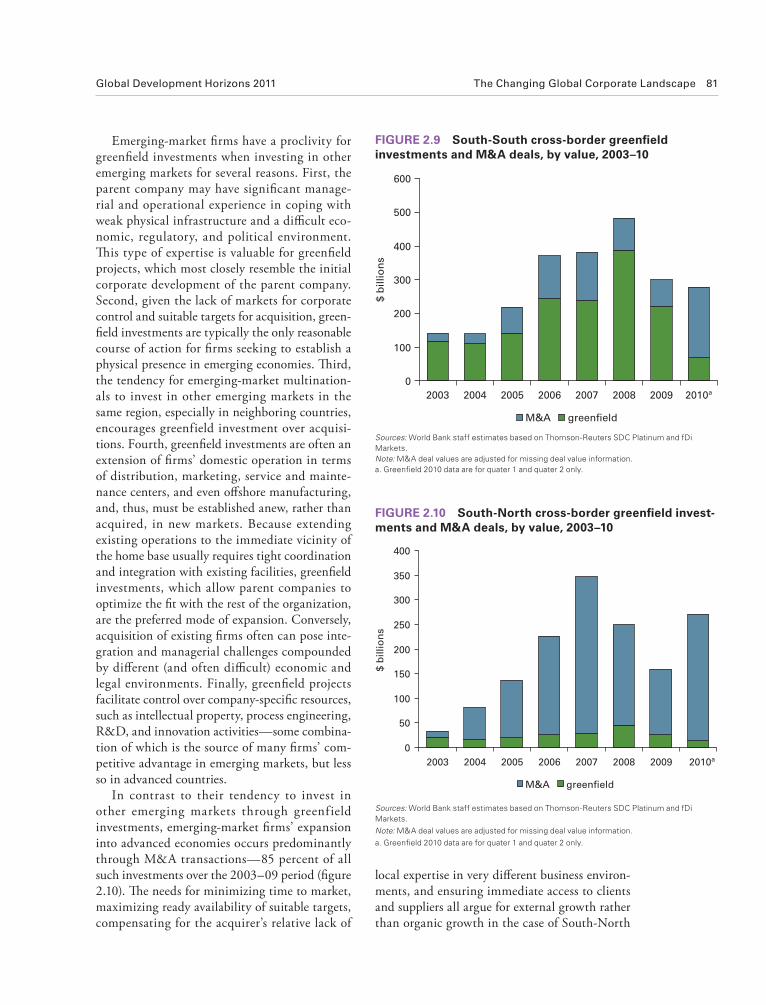
Global Development Horizons 2011 The Changing Global Corporate Landscape 81
Emerging-market fi rms have a proclivity for
greenfi eld investments when investing in other
emerging markets for several reasons. First, the
parent company may have signifi cant manage-
rial and operational experience in coping with
weak physical infrastructure and a diffi cult eco-
nomic, regulatory, and political environment.
Th is type of expertise is valuable for greenfi eld
projects, which most closely resemble the initial
corporate development of the parent company.
Second, given the lack of markets for corporate
control and suitable targets for acquisition, green-
fi eld investments are typically the only reasonable
course of action for fi rms seeking to establish a
physical presence in emerging economies. Th ird,
the tendency for emerging-market multination-
als to invest in other emerging markets in the
same region, especially in neighboring countries,
encourages greenfield investment over acquisi-
tions. Fourth, greenfi eld investments are often an
extension of fi rms’ domestic operation in terms
of distribution, marketing, service and mainte-
nance centers, and even off shore manufacturing,
and, thus, must be established anew, rather than
acquired, in new markets. Because extending
existing operations to the immediate vicinity of
the home base usually requires tight coordination
and integration with existing facilities, greenfi eld
investments, which allow parent companies to
optimize the fi t with the rest of the organization,
are the preferred mode of expansion. Conversely,
acquisition of existing fi rms often can pose inte-
gration and managerial challenges compounded
by diff erent (and often diffi cult) economic and
legal environments. Finally, greenfi eld projects
facilitate control over company-specifi c resources,
such as intellectual property, process engineering,
R&D, and innovation activities—some combina-
tion of which is the source of many fi rms’ com-
petitive advantage in emerging markets, but less
so in advanced countries.
In contrast to their tendency to invest in
other emerging markets through greenfield
investments, emerging-market fi rms’ expansion
into advanced economies occurs predominantly
through M&A transactions—85 percent of all
such investments over the 2003–09 period (fi gure
2.10). Th e needs for minimizing time to market,
maximizing ready availability of suitable targets,
compensating for the acquirer’s relative lack of
FIGURE 2.9 South-South cross-border greenfi eld investments and M&A deals, by value, 2003–10
0
100
200
300
400
500
600
2003 2004 2005 2006 2007 2008 2009 2010a
$ b
illio
ns
M&A greenfield
Sources: World Bank staff estimates based on Thomson-Reuters SDC Platinum and fDi Markets.Note: M&A deal values are adjusted for missing deal value information.a. Greenfi eld 2010 data are for quater 1 and quater 2 only.
0
50
100
150
200
250
300
350
400
2003 2004 2005 2006 2007 2008 2009 2010a
$ b
illio
ns
M&A greenfield
FIGURE 2.10 South-North cross-border greenfi eld invest-ments and M&A deals, by value, 2003–10
Sources: World Bank staff estimates based on Thomson-Reuters SDC Platinum and fDi Markets.
Note: M&A deal values are adjusted for missing deal value information.
a. Greenfi eld 2010 data are for quater 1 and quater 2 only.
local expertise in very diff erent business environ-
ments, and ensuring immediate access to clients
and suppliers all argue for external growth rather
than organic growth in the case of South-North

82 The Changing Global Corporate Landscape Global Development Horizons 2011
cross-border emerging-market M&A transac-
tions primarily target companies located in the
same region, in terms of both value and number
of deals (table 2.1). Similarly, emerging-market
fi rms’ expansion into advanced economies also
ref lects geographical proximity and economic
relationships. Th us, fi rms based in Europe and
Central Asia and in the Middle East and North
Africa show a marked preference for acquisitions
in European countries, while fi rms based in Latin
America tend to acquire fi rms in North America.
Target regions for investments by emerging-mar-
ket fi rms in East Asia are more diversifi ed.10
In devising and implementing their expansion
strategies, fi rms face a trade-off between manage-
rial and operational ease on one hand and diver-
sification gains from an imperfectly correlated
global business cycle on the other. Investing in
countries in their own region typically has sev-
eral major advantages over investing in other
regions—it facilitates communication with the
foreign unit, permits firms to transplant busi-
ness models and operational procedures more
readily, and necessitates less product adaptation
and differentiation. Similarly, operational and
geographic proximity allow fi rms greater oppor-
tunity to supervise the foreign units, to monitor
local and regional competitors, and to study mar-
kets at the levels of the parent and the acquired
subsidiary. Vertically integrated f irms must
weigh all of these operational benefits against
the higher correlation in cash fl ows across foreign
units within the same region. To the degree that
business cycles are not perfectly correlated across
countries, but are more correlated within regions
than between regions, investing outside the home
region can off er acquiring fi rms important gains
through geographic diversifi cation. If emerging-
market firms forgo such interregional diversi-
fi cation opportunities, the operational benefi ts
from intraregional integration must outweigh the
greater stability of cash fl ows in terms of lower
overall volatility.
The profi le of emerging-market acquirers
Emerging-market acquirers tend to avoid bid-
ding wars. The overwhelming majority of the
FDI. Th us, the amount of greenfi eld investment
by emerging-market fi rms in advanced economies
is very small relative to that of South-South FDI,
and probably serves only as a stepping-stone for
future external growth. Another reason M&A
is the preferred mode of emerging-market fi rms’
expansion into advanced economies may be that
the well-developed institutional infrastructure in
advanced economies typically reduces the legal,
fi nancial, and regulatory risks involved in take-
overs. At the same time, the fact that the cor-
porate and industrial environment in developed
countries can be radically diff erent from that in
the acquirers’ home countries means that access
to local managerial and operational expertise is
important.
Th e experience gained by fi rms in their home
economies translates more easily to other emerg-
ing markets with often similar economic and
legal structures—where it gives emerging-market
fi rms a distinct competitive advantage over fi rms
not used to competing in challenging institu-
tional environments—more so than in advanced
countries. Although it is possible, over time, for
emerging-market companies to build up the skills
required to operate effi ciently and profi tably in
advanced economies, it often is more effi cient for
an emerging-market company to acquire such
skills through a takeover. Nonetheless, the sub-
sequent integration of newly acquired assets and
expertise into existing operations poses its own
challenges and costs, which need to be weighed
against the benefi ts of an acquisition.
Taken together, historical trends point to the
prominence of high-value-added, knowledge-
intensive sectors in both greenfield and M&A
investments. Th us, acquisitions such as those of the
$1.4 billion stake by UAE SWF Mubadala in the
Carlyle Group, and Indian software fi rm Satyam’s
multiple research-center investments in China,
may well become more common in the future.
M&A deals originating in emerging markets
refl ect geographical proximity and economic
ties. When emerging-market fi rms venture into
other emerging-market countries, the fi rms prefer
to acquire assets in their immediate geographic
vicinity. Regional patterns show that, with the
exception of deals originating in South Asia,
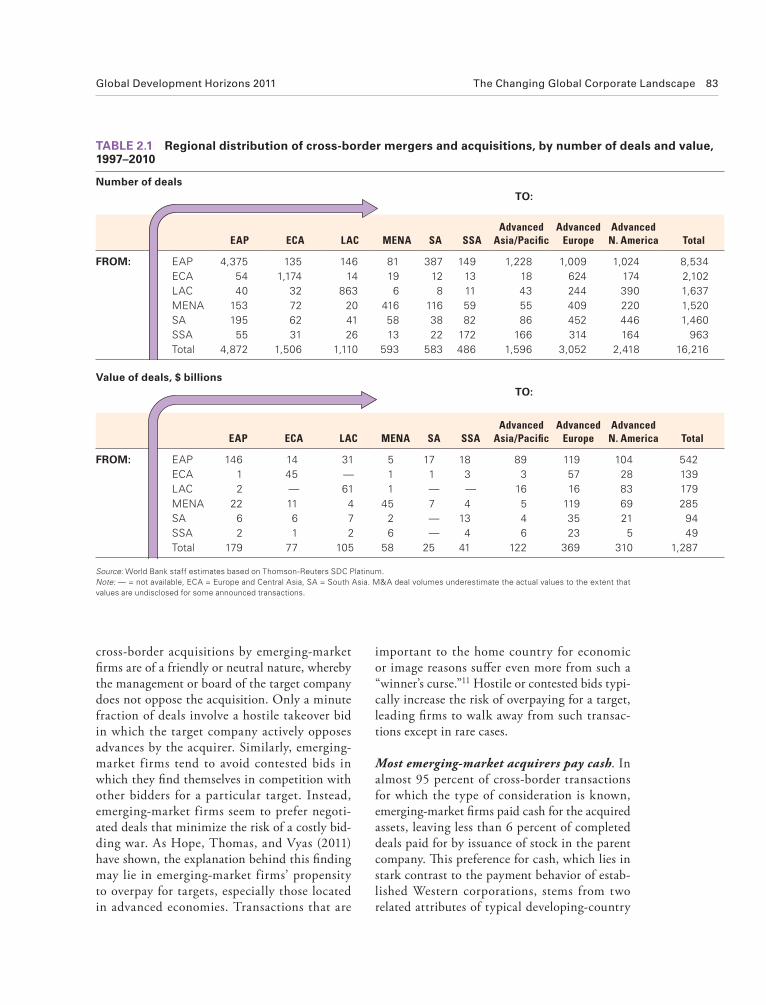
Global Development Horizons 2011 The Changing Global Corporate Landscape 83
important to the home country for economic
or image reasons suff er even more from such a
“winner’s curse.”11 Hostile or contested bids typi-
cally increase the risk of overpaying for a target,
leading fi rms to walk away from such transac-
tions except in rare cases.
Most emerging-market acquirers pay cash. In
almost 95 percent of cross-border transactions
for which the type of consideration is known,
emerging-market fi rms paid cash for the acquired
assets, leaving less than 6 percent of completed
deals paid for by issuance of stock in the parent
company. Th is preference for cash, which lies in
stark contrast to the payment behavior of estab-
lished Western corporations, stems from two
related attributes of typical developing-country
cross-border acquisitions by emerging-market
fi rms are of a friendly or neutral nature, whereby
the management or board of the target company
does not oppose the acquisition. Only a minute
fraction of deals involve a hostile takeover bid
in which the target company actively opposes
advances by the acquirer. Similarly, emerging-
market firms tend to avoid contested bids in
which they fi nd themselves in competition with
other bidders for a particular target. Instead,
emerging-market firms seem to prefer negoti-
ated deals that minimize the risk of a costly bid-
ding war. As Hope, Thomas, and Vyas (2011)
have shown, the explanation behind this fi nding
may lie in emerging-market firms’ propensity
to overpay for targets, especially those located
in advanced economies. Transactions that are
TABLE 2.1 Reg ional distribution of cross-border mergers and acquisitions, by number of deals and value, 1997–2010
Number of deals
TO:
EAP ECA LAC MENA SA SSAAdvanced
Asia/Pacifi cAdvanced
EuropeAdvanced
N. America Total
FROM: EAP 4,375 135 146 81 387 149 1,228 1,009 1,024 8,534
ECA 54 1,174 14 19 12 13 18 624 174 2,102
LAC 40 32 863 6 8 11 43 244 390 1,637
MENA 153 72 20 416 116 59 55 409 220 1,520
SA 195 62 41 58 38 82 86 452 446 1,460
SSA 55 31 26 13 22 172 166 314 164 963
Total 4,872 1,506 1,110 593 583 486 1,596 3,052 2,418 16,216
Value of deals, $ billions
TO:
EAP ECA LAC MENA SA SSAAdvanced
Asia/Pacifi cAdvanced
EuropeAdvanced
N. America Total
FROM: EAP 146 14 31 5 17 18 89 119 104 542
ECA 1 45 — 1 1 3 3 57 28 139
LAC 2 — 61 1 — — 16 16 83 179
MENA 22 11 4 45 7 4 5 119 69 285
SA 6 6 7 2 — 13 4 35 21 94
SSA 2 1 2 6 — 4 6 23 5 49
Total 179 77 105 58 25 41 122 369 310 1,287
Source: World Bank staff estimates based on Thomson-Reuters SDC Platinum.Note: — = not available, ECA = Europe and Central Asia, SA = South Asia. M&A deal volumes underestimate the actual values to the extent that values are undisclosed for some announced transactions.

84 The Changing Global Corporate Landscape Global Development Horizons 2011
of the funds necessary to repay the credit facility
in global bond markets.
Second, dependence on cash focuses the choice
of acquisitions on low-risk transactions. In the
case of a stock acquisition, the realized synergies
will be shared with the incumbent shareholders
of the target, who continue to have a stake in the
combined company after the completion of the
takeover. As a result, companies uncertain about
the capture of synergies tend to opt for payment
in stock to share future operational and fi nancial
risks with existing target shareholders. By con-
trast, incumbent shareholders cannot share in the
gains from the takeover when payment is in cash
because the shareholders cease to have a stake in
the fi rm after the deal. Acquisition through cash
payments requires a high degree of confi dence in
the existence and future realization of synergy
gains by emerging-market acquirers.
Finally, the cost of cash payments means that
the acquirer’s management has a relatively stron-
ger incentive to devote the necessary time, eff ort,
and fi nancial resources to successfully integrating
the acquired assets. Several studies by manage-
ment consultancies on the factors determining
M&A success and failure have shown that fl awed
execution and lack of integration after comple-
tion of the deal are the most frequent causes for
failure and the destruction of shareholder wealth.
Careful target screening and selection, avoidance
of a bidding war, and a high level of confi dence in
the existence of synergies are necessary conditions
for the success of acquisitions, which then justify
a cash payment. Good execution and successful
integration of the acquired assets are suffi cient
conditions for capturing synergies. The gover-
nance structure of emerging-market fi rms, which
often includes dominant shareholders, also helps
through typically higher monitoring of acquirer
management during the bidding, negotiation,
and execution phases.
Implications of emerging-market FDI fl ows for low-income countries
Low-income countries have, in general, benefi ted
from the growth in South-South FDI f lows.
Low-income countries have received $93 billion
acquirers. First, many emerging-market firms
cannot effectively issue large amounts of stock
because the fi rms are privately owned, are listed
in equity markets lacking sufficient depth for
signifi cant secondary off erings, or are not cross-
listed on any major exchange. Second, emerging-
market firms tend to be privately held or con-
trolled companies with one or more dominant
shareholders (such as family-controlled fi rms or
state-owned enterprises), which typically attach a
lot of value to retaining control of the company
and are reluctant to dilute that control through
share issuance pursuant to acquisitions. For
example, the top 20 Chinese fi rms undertaking
foreign acquisitions are state enterprises that rely
entirely on cash transactions.
Th e dependence on cash transactions has sev-
eral implications for acquisitions by emerging-
market fi rms. First, cash as an acquisition cur-
rency is expensive, and thus reduces the potential
number and size of acquisitions. Emerging-
market acquirers typically must arrange for the
necessary funding upfront unless they have suf-
ficient cash reserves available. As a result, the
acquirers often negotiate standby agreements in
the syndicated loan market that are contingent
on approval of the acquisition by the target com-
pany. In essence, the acquirers arrange for credit
facilities that the acquirers can draw down to
make cash payments to incumbent sharehold-
ers. Because such credit facilities are typically
expensive—they represent options on loans—
acquirers often refi nance the debt in global bond
markets after completion of the deal. Although
the cost advantage of public debt seems to argue
for its extensive use in cross-border acquisitions,
acquirers typically do not tap bond markets at
the time of the off er because failure to complete
the deal would mean a prohibitively high cost of
carriage for unneeded funds. Tata Steel’s cash
acquisition of the Dutch steelmaker Corus, for
example, was funded by syndicated loans. Given
the contested nature of the deal and the uncer-
tainty about the ultimate acquisition price, bond
fi nancing would have represented a signifi cant
fi nancial risk to the bidders if they had been out-
bid by the opposition. A year after the comple-
tion of the deal, while still seeking to lower its
repayment costs, Tata raised a signifi cant portion

Global Development Horizons 2011 The Changing Global Corporate Landscape 85
value into low-income countries; the top acquir-
ing countries in the sector were the United
Kingdom, France, the United States, Vietnam,
and South Africa. Greenfi eld investments were
dominated by the same sectors.
In spite of the continuing importance of tele-
communications and the combined mining, oil,
and gas sectors, the degree of sectoral concentra-
tion among companies acquiring assets in LICs
has generally declined over the past decade.
However, the specifi c concentration pattern var-
ies widely from one destination country to the
next. As the top target (by number of deals) of
cross-border M&A among LICs, Tanzania pro-
vides a good example of very low concentration
among the group of acquiring sectors, which
has included fi nance, mining, professional ser-
vices, food, and transportation. Investments into
Bangladesh, another important low-income des-
tination country, have also been characterized
by some degree of diversifi cation among acquir-
ing sectors, as well as among the source coun-
tries of those investments. Such diversifi cation is
not limited to the larger LICs. Despite a much
smaller aggregate deal volume, Cambodia has
also attracted a diverse group of investors, both at
the sectoral and source country levels.
A very diff erent situation can be observed in
countries where the majority of all value invested
came from one or two big deals, as was the case
in FDI from emerging markets since 1997. In
2010 alone, FDI fl ows to low-income countries
amounted to $13.3 billion. Throughout this
period, firms located in low-income countries
were the targets of 767 cross-border M&A deals
(figure 2.11) that originated in a very diverse
group of countries. The largest investor from
1997–2010 was the United Kingdom, with 33
percent of the total deal value, followed by China
(14 percent), France (7 percent), South Africa (5
percent), and Canada (4 percent).12 Emerging-
market firms’ FDI in low-income countries is
on the rise, albeit from a very low initial level.
Although only 1.9 percent of M&A (and 5.0 per-
cent of greenfi eld) outbound transactions origi-
nating in emerging economies were directed at
low-income countries, the acquisition volume
signifi cantly increased between 2003 and 2010.
Furthermore, the recovery of cross-border M&A
in low-income countries after the fi nancial cri-
sis of 2008 is primarily due to the activities of
emerging-market fi rms, which in 2009 and 2010
were responsible for more than half of all cross-
border M&A deal value. To put this contribution
to FDI in low-income countries into perspec-
tive, emerging-market fi rms have accounted for
41 percent of cross-border deals into low-income
countries since 1997, but for only 14 percent of
global M&A transactions in the same period.
Besides China and South Africa, other impor-
tant sources of South-South FDI into low-income
countries were India and Malaysia, for M&A
transactions, and for greenfield investments,
India, the United Arab Emirates, and Vietnam.
Most emerging-market firms invest in low-
income countries located in the same region, espe-
cially in Sub-Saharan Africa, where South Africa
is the largest regional source of both cross-border
M&A and greenfi eld transactions. In Asia, virtu-
ally all of Vietnamese greenfi eld investments in
low-income countries went to Cambodia, the Lao
People’s Democratic Republic, and Myanmar.
Companies undertaking M&A and greenfi eld
investments were predominantly in the metal and
mining, oil and gas, and telecommunications sec-
tors. However, mining companies played a larger
role within North-South acquisitions than within
South-South acquisitions. Telecommunications
fi rms accounted for 20 percent of all M&A deal
0
20
40
60
80
100
120
140
1997
1998
1999
2000
2001
2002
2003
2004
2005
2006
2007
2008
2009
2010
nu
mb
er
of
deals
emerging advanced
FIGURE 2.11 Cross-border M&A investment to low-income countries, 1997–2010
Source: World Bank staff estimates based on Thomson-Reuters SDC Platinum.
86 The Changing Global Corporate Landscape Global Development Horizons 2011
in Guinea and Myanmar. In the fi rst case, the
announced $1.35 billion investment by Chinalco
in the Simandou project will represent more than
90 percent of all deal value invested in Guinea
since 1997. Furthermore, the second largest cross-
border deal recorded—by BHP Billiton in the
Guinea Alumina Project—was in the same sector.
A similar pattern can be observed in Myanmar,
where close to 90 percent of all inbound M&A
value was concentrated in two deals, both in nat-
ural resource–related sectors.
In between these two well-defi ned patterns,
cross-border investment into LICs can exhibit a
combination of diff erent characteristics, depend-
ing on whether one analyzes the origin of the
investing fi rms, their industry, or the size of their
investments. As a destination country, for exam-
ple, Uganda combines a relatively large volume
of accumulated inbound investment ($2 billion)
and many deals (45) with an intermediate degree
of sectoral concentration, but with a very narrow
group of acquiring countries: South Africa and
the United Kingdom combined were responsible
for 96 percent of all deal value. But British com-
panies engaged in acquisitions spread across very
diff erent sectors, such as food, fi nance, oil, and
wholesale trade.
Understanding cross-border acquisitions from emerging economies
Th ere has been little empirical analysis of the fac-
tors driving fi rms domiciled in developing coun-
tries to venture abroad. To fill this gap in the
literature, this report undertakes an economet-
ric investigation of the determinants of bilateral
M&A fl ows between acquirers’ home countries
and their targets’ countries (“host countries”)
(box 2.1). Th is analysis is guided by the existing
literature, which off ers several hypotheses as to
why fi rms venture abroad.
Th e fi rst set of hypotheses posit that compa-
nies seek growth opportunities abroad as they
outgrow their home markets—a problem that
is particularly acute in developing countries.
As a result, relative growth in home and desti-
nation countries, both overall and by industry,
should aff ect deal fl ow, which is tested by using
variables that measure GDP and sector growth.
Companies also may pursue economies of scale
or scope in their global expansion. Th is rationale
can be investigated by examining the degree to
which companies are diversifying their invest-
ments, as opposed to targeting fi rms within their
own narrowly defi ned industries.
A second group of hypotheses revolves around
structural economic characteristics of the home
and host countries, such as economic openness,
access to fi nance, the speed of diff usion of techno-
logical advances, and managerial and operational
expertise. Indeed, one of the most frequently
cited rationales for companies’ global expansion
is the export of innovations in the pursuit of
enhancing returns to R&D activities. Given that
emerging economies have become important con-
tributors to the advancement of science and tech-
nology, one can test this group of hypotheses by
including variables related to the home country’s
investment in science and technology, such as the
number of domestic and overseas patents granted,
the level of education investment, the percentage
of the population attaining a tertiary education,
and the number of engineering graduates.
At the same time, emerging-market firms
may have specialized managerial and opera-
tional expertise, which the fi rms can export to
markets similar to their home markets. To test
this hypothesis, variables capturing operating
effi ciency, such as unit labor costs and capital or
R&D efficiency, are investigated to determine
whether the variables have a diff erent impact on
investment activity in emerging economies ver-
sus advanced economies. Th is class of hypotheses
also includes the role of easy access to financ-
ing, for M&A activity in particular. To assess
the importance of fi nancing factors, the model
includes variables capturing the cost of fi nance
and the ease with which emerging-market fi rms
can raise funds globally, such as through corpo-
rate bond spreads, the number of bond issues by
fi rms from the country of origin, or the level of
domestic fi nancial development (as represented
by the ratio of private credit or stock-market capi-
talization to GDP), among other factors.
A fi nal set of hypotheses concern the economic
relationship between home and host countries,
which are commonly used in the bilateral trade

Global Development Horizons 2011 The Changing Global Corporate Landscape 87
such as global commodity prices and interest rates,
aff ect M&A activity, these macroeconomic condi-
tions are included as additional controls.
The results show that firms clearly try to
exploit diff erential growth opportunities abroad,
although growth in a firm’s home country is
important, as well. Indeed, the effect of GDP
growth is twice as large for growth in host coun-
tries compared to growth in home countries.
Th us, having built up cash reserves for investment
literature employing gravity models. Economic
factors in such hypotheses include geographic
determinants, such as bilateral country dis-
tances—the quality of an investor’s or acquirer’s
knowledge and ability to obtain information about
a potential acquisition target may well decrease as
the distance between the two countries increases—
as well as economic and policy variables, such as
existing bilateral trade fl ows and BITs. Finally, to
the extent that global macroeconomic conditions,
BOX 2.1 Empirica l analysis of cross-border bilateral M&A fl ows from emerging economies
In analyzing the key determinants of the cross-border
acquisition behavior by emerging-market-based fi rms
(described in detail in annex 2.3), various linear and log-
linear models of the bilateral M&A activity were speci-
fi ed for a large (unbalanced) panel of emerging econo-
mies, drawing on a comprehensive database developed
for this book. The various specifi cations relate bilateral
deal flows from 61 “home” countries to 80 “host”
countries to a large range of explanatory and control vari-
ables. Throughout the analysis, the model distinguishes
between deal fl ow to other emerging economies and
deal fl ow to advanced countries, so that each set of esti-
mates is allowed to take on a distinct coeffi cient.
The model’s dependent variable is defined as the
total number of cross-border M&A deals originating in
emerging economies (the “home” country), for targets
in either an emerging economy or advanced country,
for a given year (the accompanying fi gure provides an
example). The model controls for home- and host-coun-
try characteristics, bilateral characteristics for a given
home-host pair, and global macroeconomic variables, as
described in the text.
The cross-border investment database compiled for
this book comprised explanatory variables drawn from a
variety of sources. These sources cover macroeconomic
conditions (World Bank World Development Indicators
[WDI], IMF International Financial Statistics); fi nancial
factors (Dealogic DCM Analytics, U.S. Federal Reserve,
MSCI, JP Morgan); commodity prices (Goldman Sachs,
World Bank Development Economics Prospects Group);
bilateral investment treaties (United Nations Conference
on Trade and Development); country risk and institutions
indicators (PRS Group’s International Country Risk
Guide); technology and innovation (World Intellectual
Property Organization); and the sectoral structure of
economies (World Bank WDI). Depending on the speci-
fication, each dataset includes between 21,884 and
34,730 observations.
TotalDeals
207
66
52
16
Host•• Home
• India
• South Africa
• Brazil
• Indonesia
United States 65231110
United KingdomGermanyAustralia
United Kingdom 101044
United StatesGermanyNamibia
Argentina 161233
United StatesColombiaMexico
Singapore 8111
AustraliaChinaIndia
FIGURE B2.1.1 Selected bilateral M&A fl ows from home to host economies, 2007

88 The Changing Global Corporate Landscape Global Development Horizons 2011
pay in cash, facilitates the transaction. Similarly,
large reserve holdings refl ect a country’s partici-
pation in the global economy, which allows its
fi rms to gain prior experience in international
business valuable for later M&A deals. In con-
trast, fi rms based in high-reserve economies are
less likely to acquire assets in other emerging
markets, presumably because they concentrate
their operational and M&A eff orts in the coun-
tries with which they trade, that is, predomi-
nantly advanced economies. Regarding fi nancial
development, countries with larger stock mar-
kets engage in more acquisitions in both emerg-
ing and developed countries since the countries
with larger markets can more easily raise funds
at home and abroad.
More generally, an acquirer’s home economy
needs to have attained a certain level of insti-
tutional development before its firms start to
engage in cross-border M&A transactions.
Economic instability in the home country, for
example, will increase M&A activity in devel-
oped economies, as fi rms attempt to escape the
vagaries of their home economy by expanding
into more stable frontiers; by contrast, fi rms in
stable emerging economies tend to be more will-
ing to expand their M&A activities into other
emerging markets. In a similar vein, emerging-
economy fi rms actively seek to lower their politi-
cal risk exposure through more acquisitions in
politically stable developed economies. Similarly,
more stable emerging-market home economies
tend to acquire less in other emerging markets,
possibly because growth opportunities remain
attractive at home, thus negating the need for for-
eign acquisitions.
Structural factors such as technological
achievements and managerial expertise do not
seem to have a pronounced impact on M&A,
regardless of whether the home country’s econ-
omy is emerging or advanced. By contrast, geo-
graphic distance appears to have a negative eff ect,
as expected. Th is negative eff ect implies that the
cost of bilateral transactions—including the costs
of communicating, coordinating, and monitor-
ing information and maintaining a database of
local knowledge—tends to matter, especially in
developing countries, where informational asym-
metries are particularly acute.
and acquisition purposes through rapid growth
at home, firms pursue growth opportunities
through M&A deals in the better-performing
advanced economies. Another possible reason
why home-country growth may be related to out-
bound M&A activity is that fi rms with higher
productivity tend to be the engines of both
domestic growth and FDI expansion abroad.
Acquisition activity is also inf luenced by
economic size. The effect of home GDP levels
is twice as large in transactions with developed
economies as in transactions with emerging econ-
omies, which suggests that only fi rms from rela-
tively large or mature emerging economies have
the means to pursue expansion in advanced econ-
omies through M&A. Finally, the level of host-
country development, as measured by per capita
GDP, is negatively associated only with acquisi-
tions in emerging destination countries; the vari-
able is statistically insignifi cant for acquisitions in
advanced countries. Firms appear to seek targets
in emerging economies that have not yet attained
a certain level of development, and, therefore,
off er even more growth potential. Taken together,
these fi ndings suggest that emerging-market mul-
tinationals expand abroad through M&A trans-
actions to exploit growth opportunities that are
not present in their home economies, mainly by
seeking out fast-growing economies—especially
among industrial countries, but also in relatively
less developed economies.
In terms of structural features, a country’s
participation in the global economy is also an
important determinant of bilateral M&A fl ows,
whether measured in terms of trade or fi nancial
integration. Firms in countries that are more inte-
grated into the global trading system tend to be
more acquisitive in other emerging markets, often
because the fi rms’ operations are more interna-
tionalized through their prior export and import
activities. In the same vein, greater bilateral trade
fl ows are associated with higher M&A activity,
which further suggests that existing trade ties
facilitate acquisitions.
Outbound M&A activity is also infl uenced
by the home country’s reserve holdings and capi-
tal market development. Reserve holdings are a
sign of access to foreign currency which, given
the propensity of emerging-market acquirers to
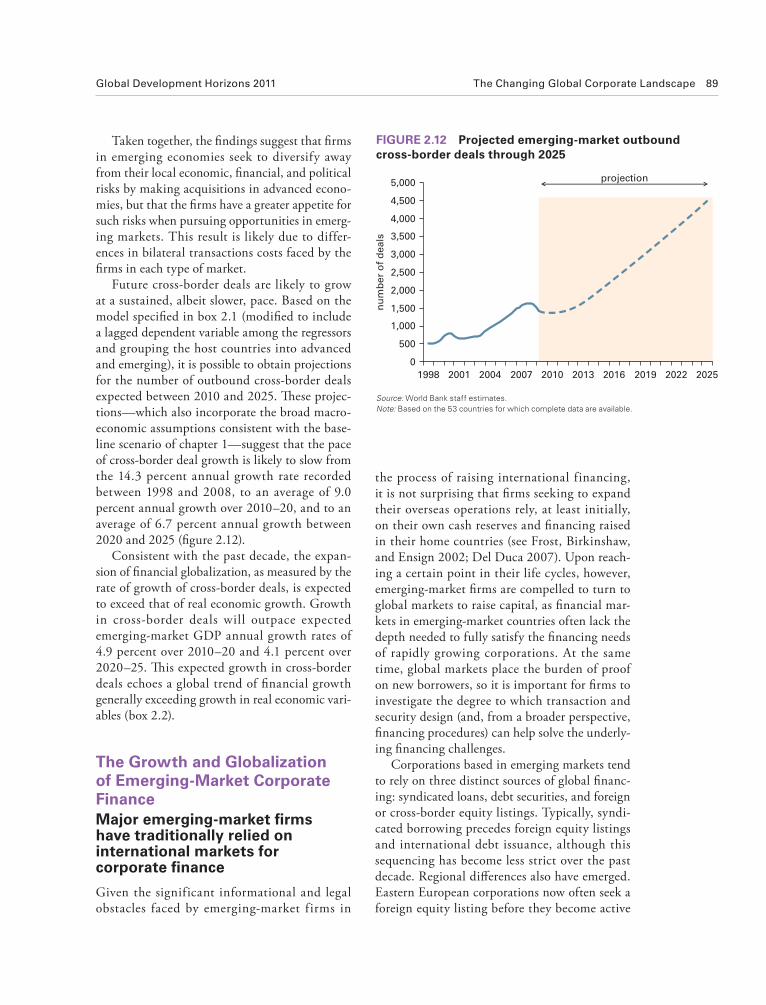
Global Development Horizons 2011 The Changing Global Corporate Landscape 89
Taken together, the fi ndings suggest that fi rms
in emerging economies seek to diversify away
from their local economic, fi nancial, and political
risks by making acquisitions in advanced econo-
mies, but that the fi rms have a greater appetite for
such risks when pursuing opportunities in emerg-
ing markets. This result is likely due to differ-
ences in bilateral transactions costs faced by the
fi rms in each type of market.
Future cross-border deals are likely to grow
at a sustained, albeit slower, pace. Based on the
model specifi ed in box 2.1 (modifi ed to include
a lagged dependent variable among the regressors
and grouping the host countries into advanced
and emerging), it is possible to obtain projections
for the number of outbound cross-border deals
expected between 2010 and 2025. Th ese projec-
tions—which also incorporate the broad macro-
economic assumptions consistent with the base-
line scenario of chapter 1—suggest that the pace
of cross-border deal growth is likely to slow from
the 14.3 percent annual growth rate recorded
between 1998 and 2008, to an average of 9.0
percent annual growth over 2010–20, and to an
average of 6.7 percent annual growth between
2020 and 2025 (fi gure 2.12).
Consistent with the past decade, the expan-
sion of fi nancial globalization, as measured by the
rate of growth of cross-border deals, is expected
to exceed that of real economic growth. Growth
in cross-border deals will outpace expected
emerging-market GDP annual growth rates of
4.9 percent over 2010–20 and 4.1 percent over
2020–25. Th is expected growth in cross-border
deals echoes a global trend of fi nancial growth
generally exceeding growth in real economic vari-
ables (box 2.2).
The Growth and Globalization of Emerging-Market Corporate FinanceMajor emerging-market fi rms have traditionally relied on international markets for corporate fi nance
Given the significant informational and legal
obstacles faced by emerging-market firms in
0
500
1,000
1,500
2,000
2,500
3,000
3,500
4,000
4,500
5,000
1998 2001 2004 2007 2010 2013 2016 2019 2022 2025n
um
ber
of
deals
projection
FIGURE 2.12 Projected emerging-market outbound cross-border deals through 2025
Source: World Bank staff estimates.Note: Based on the 53 countries for which complete data are available.
the process of raising international financing,
it is not surprising that fi rms seeking to expand
their overseas operations rely, at least initially,
on their own cash reserves and fi nancing raised
in their home countries (see Frost, Birkinshaw,
and Ensign 2002; Del Duca 2007). Upon reach-
ing a certain point in their life cycles, however,
emerging-market fi rms are compelled to turn to
global markets to raise capital, as fi nancial mar-
kets in emerging-market countries often lack the
depth needed to fully satisfy the fi nancing needs
of rapidly growing corporations. At the same
time, global markets place the burden of proof
on new borrowers, so it is important for fi rms to
investigate the degree to which transaction and
security design (and, from a broader perspective,
fi nancing procedures) can help solve the underly-
ing fi nancing challenges.
Corporations based in emerging markets tend
to rely on three distinct sources of global fi nanc-
ing: syndicated loans, debt securities, and foreign
or cross-border equity listings. Typically, syndi-
cated borrowing precedes foreign equity listings
and international debt issuance, although this
sequencing has become less strict over the past
decade. Regional diff erences also have emerged.
Eastern European corporations now often seek a
foreign equity listing before they become active

90 The Changing Global Corporate Landscape Global Development Horizons 2011
The world economy is taking on an increasingly trans-
national character, facilitated by a distinct increase
in cross-border economic transactions and arrange-
ments over the past two decades. On the real side,
international trade fl ows have risen from 17.8 percent
of global output in 1983 to 27.7 percent in 2007, with
emerging-economy growth poles becoming increas-
ingly active participants in this expansion. The grow-
ing presence of China in global trade has been espe-
cially conspicuous, driven by domestic reforms in the
late 1970s and early 1980s and, since the country’s
accession to the organization in 2001, by reductions
in barriers to trade made in accordance with the stan-
dards of the World Trade Organization. As a result,
trade accounted for a high of 72 percent of China’s
GDP in 2006. Brazil and India experienced similar
trade surges following their own economic liberaliza-
tion efforts in the early 1990s.
Cross-border fi nancial fl ows have likewise expanded
dramatically in recent decades. FDI—the largest
and most stable component of international fi nancial
fl ows—has increased as a ratio to GDP by almost an
order of magnitude worldwide since the early 1980s.
A signifi cant part of this increase is due to the rise of
South-North, South-South, and North-South merg-
ers and acquisitions. But the increase in cross-border
fi nancial fl ows is also evident in more traditional areas
of international fi nance, such as bonds and commercial
credit (see accompanying fi gure). The foreign exposure
of international banks, for example, rose from an aver-
age of one-quarter of GDP in the 1983–88 and 1993–
98 periods to about one-third of GDP in the 2003–08
period. Similarly, foreign currency reserve accumulation
by central banks almost tripled during the same period,
rising from 4 percent of GDP to almost 10 percent of
GDP in the 2003–08 period.
BOX 2.2 The global expansion of cross-border fi nancial transactions
FIGURE B2.2.1 Global expansion of cross-border economic transactions, 1983–2008
Sources: World Bank staff calculations using the Bank for International Settlements (BIS) consolidated banking statistics, World Bank WDI, and IMF IFS databases.
Note: Trade is measured as global exports, FDI is measured as net investment by foreign entities in the domestic economy, loans are measured as global foreign claims of (BIS-reporting) banks, debt is measured as global foreign bond issuance, and reserves are measured as global international reserve holdings, all as a share of global GDP. For loans, country coverage only includes those with BIS reporting banks across all three time periods, with the value of global GDP adjusted accordingly. Year ranges indicate averages of annual data for the respective period. Note that loans and reserves are stocks (as opposed to the fl ows of the other three dimensions) and are reported as a share of GDP mainly for analytical convenience and to provide a sense of proportion.
1983–88 1993–98 2003–08
% GDP
0
5
10
15
20
25
30
35reserves
loans
FDItrade
bonds

Global Development Horizons 2011 The Changing Global Corporate Landscape 91
in global debt markets, whereas Latin American
corporations increasingly issue debt on interna-
tional capital markets without cross-listing their
shares. Such changes in corporate financing
behavior have implications for the emergence of
regional fi nancial centers and for the segment of
global capital markets that they represent. Nearly
two-thirds of the emerging-market firms that
have been active acquirers since the late 1990s
(defined as those firms that have undertaken
more than 10 acquisitions over the 1997–2010
period) have accessed international capital mar-
kets; see table 2.2). Although cross-border syn-
dicated lending predominated as the main way
in which these active acquiring firms accessed
cross-border fi nancing, more than 10 percent of
these fi rms tapped all three of the main sources of
global fi nancing.
By and large, the growth of internationally traded
fi nancial assets has proceeded much more rapidly than
the expansion of real trade fl ows: indeed, fi nancial asset
accumulation grew at more than twice the rate of trade
expansion, on average, between 1987 and 2008 (see
accompanying fi gure). The same fi gure shows how dra-
matically the total value of internationally traded assets
has increased over the past two decades, from $6.5
trillion in 1987 to $28.2 trillion in 2000, and to $95.3
trillion in 2008. The three main components of interna-
tional fi nancial assets—bank loans, bonds, and portfolio
equity—grew in tandem from the 1980s through 2007,
when all three dipped as a result of the global fi nancial
crisis. Although fi nancial derivatives have comprised
a fourth major component of international investment
since about 2005, derivatives attained the same order
of magnitude as portfolio equity by 2008. The dramatic
expansion in the movement of fi nancial assets across
international borders over the past two decades has
given rise to a massive foreign exchange market and
has raised concerns about what such large foreign
exchange turnovers may mean for currency volatility.
BOX 2.2 (continued)
Sources: IMF IFS database and World Bank staff calculations.
Note: The ratio of fi nancial to trade fl ows was computed as the ratio of global portfolio fi nancial fl ows to global imports, smoothed by taking a 3-year moving average of the series.
FIGURE B2.2.2 Stronger growth in international trade of fi nancial assets than in goods trade, 1987–2008
0
10
20
30
40
50
60
70
80
90
198719
8819
8919
9019
9119
9219
9319
9419
9519
9619
9719
9819
9920
0020
0120
0220
0320
0420
0520
0620
0720
08
$ t
rillio
ns
0
0.1
0.2
0.3
0.4
0.5
0.6
0.7
0.8
0.9
fin
an
ce-t
o-t
rad
e r
ati
o
internationally traded assetsratio of financial to trade flows (right axis)

92 The Changing Global Corporate Landscape Global Development Horizons 2011
TABLE 2.2 Top emerging-market multinationals in cross-border mergers and acquistions, by number of deals, 1997–2010
Access to international capital market
Acquirer nameAcquirer
home economy
Acquirerparent
home economy Sector of the dealDeal
number
Foreign equity market
International bank lending
marketInternational bond market
Flextronics International
Singapore Singapore Computer and Electronic Product Manufacturing
45 Yes Yes
Temasek Holdings(Pte)Ltd
Singapore Singapore 32
GIC Real Estate Pte Singapore Singapore 31 Investcorp Bank
BSCBahrain Bahrain 30 Yes
Dimension Data Holdings PLC
South Africa South Africa Professional, Scientifi c, and Technical Services
28
Telmex Mexico Mexico Telecommunications 28 Yes Datatec South Africa South Africa Professional, Scientifi c, and
Technical Services26 Yes
CDC Software Corp Hong Kong SAR, China
Hong Kong SAR, China
Publishing Industries (except Internet)
25 Yes
America Movil SA de CV
Mexico Mexico Telecommunications 22 Yes Yes Yes
GIC Singapore Singapore 19 Olam International Singapore Singapore Merchant Wholesalers,
Nondurable Goods19 Yes Yes
CP Foods(UK)Ltd United Kingdom
Thailand Food Manufacturing 17
CEMEX SA DE CV Mexico Mexico Nonmetallic Mineral Product Manufacturing
16 Yes Yes Yes
Evraz Group SA Russian Federation
Russian Federation
Primary Metal Manufacturing 16 Yes Yes
HCL Technologies India India Publishing Industries (except Internet)
16 Yes
Petrobras Brazil Brazil Petroleum and Coal Products Manufacturing
16 Yes Yes Yes
Datacraft Asia Singapore South Africa Professional, Scientifi c, and Technical Services
15
ENIC PLC United Kingdom
Costa Rica Securities, Commodity Contracts, and Other Financial Investments and Related Activities
15
Gazprom Russian Federation
Russian Federation
Oil and Gas Extraction 15 Yes Yes Yes
Istithmar PJSC United Arab Emirates
United Arab Emirates
15 Yes
Vimpelkom Russian Federation
Russian Federation
Telecommunications 15 Yes Yes
Asia Pacifi c Breweries
Singapore Singapore Beverage and Tobacco Product Manufacturing
14
CEZ AS Czech Republic Czech Republic
Utilities 14 Yes Yes

Global Development Horizons 2011 The Changing Global Corporate Landscape 93
TABLE 2.2 (continued)
Access to international capital market
Acquirer nameAcquirer
home economy
Acquirerparent
home economy Sector of the dealDeal
number
Foreign equity market
International bank lending
marketInternational bond market
Fraser & Neave Holdings Bhd
Malaysia Singapore Beverage and Tobacco Product Manufacturing
14 Yes
Noble Group Hong Kong SAR, China
Hong Kong SAR, China
Merchant Wholesalers, Nondurable Goods
14
Abu Dhabi National Energy Co
United Arab Emirates
United Arab Emirates
Utilities 13 Yes Yes
ETISALAT United Arab Emirates
United Arab Emirates
Telecommunications 13 Yes
OAO Vneshtorgbank Russian Federation
Russian Federation
Credit Intermediation and Related Activities
13
Richter Gedeon Nyrt Hungary Hungary Chemical Manufacturing 13 Teledata Informatics India India Computer and Electronic
Product Manufacturing13 Yes
UOB Singapore Singapore Securities, Commodity Contracts, and Other Financial Investments and Related Activities
13 Yes Yes
Cobalt Holding Co St. Lucia El Salvador Furniture and Related Product Manufacturing
12
OTP Bank Nyrt Hungary Hungary Credit Intermediation and Related Activities
12 Yes Yes
PETRONAS Malaysia Malaysia Oil and Gas Extraction 12 YesPosco Co Korea, Rep. Korea, Rep. Primary Metal Manufacturing 12 Yes Yes YesSingTel Singapore Singapore Telecommunications 12 Yes Abraaj Capital United Arab
EmiratesUnited Arab
EmiratesSecurities, Commodity
Contracts, and Other Financial Investments and Related Activities
11
Alexander Forbes South Africa South Africa Securities, Commodity Contracts, and Other Financial Investments and Related Activities
11
China Investment Corp{CIC}
China China 11
Grupo Bimbo SAB de CV
Mexico Mexico Food Manufacturing 11 Yes Yes
Intl Microcomputer Software
United States Hong Kong SAR, China
Computer and Electronic Product Manufacturing
11
Jinchuan Group China China Mining (except Oil and Gas) 11
NK LUKOIL Russian Federation
Russian Federation
Oil and Gas Extraction 11
Nova Ljubljanska Banka dd
Slovenia Slovenia Credit Intermediation and Related Activities
11 Yes Yes
OAO "Severstal'" Russian Federation
Russian Federation
Primary Metal Manufacturing 11 Yes
Samsung Electronics Co
Korea, Rep. Korea, Rep. Computer and Electronic Product Manufacturing
11 Yes Yes
(continued)
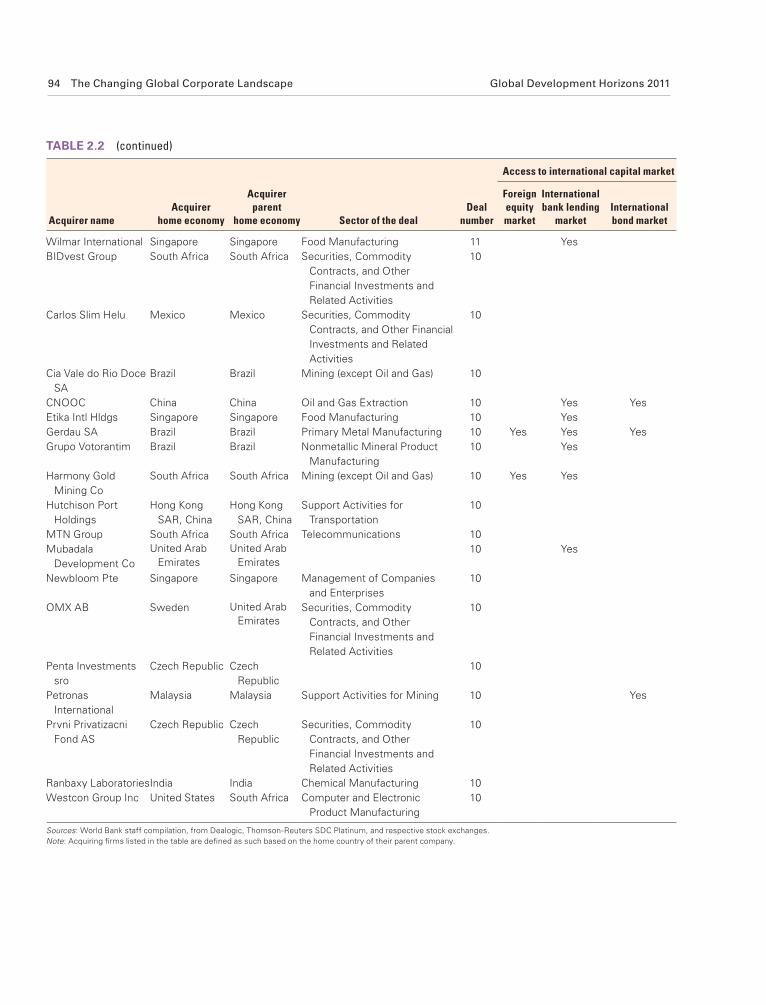
94 The Changing Global Corporate Landscape Global Development Horizons 2011
TABLE 2.2 (continued)
Access to international capital market
Acquirer nameAcquirer
home economy
Acquirerparent
home economy Sector of the dealDeal
number
Foreign equity market
International bank lending
marketInternational bond market
Wilmar International Singapore Singapore Food Manufacturing 11 Yes
BIDvest Group South Africa South Africa Securities, Commodity
Contracts, and Other
Financial Investments and
Related Activities
10
Carlos Slim Helu Mexico Mexico Securities, Commodity
Contracts, and Other Financial
Investments and Related
Activities
10
Cia Vale do Rio Doce
SA
Brazil Brazil Mining (except Oil and Gas) 10
CNOOC China China Oil and Gas Extraction 10 Yes Yes
Etika Intl Hldgs Singapore Singapore Food Manufacturing 10 Yes
Gerdau SA Brazil Brazil Primary Metal Manufacturing 10 Yes Yes Yes
Grupo Votorantim Brazil Brazil Nonmetallic Mineral Product
Manufacturing
10 Yes
Harmony Gold
Mining Co
South Africa South Africa Mining (except Oil and Gas) 10 Yes Yes
Hutchison Port
Holdings
Hong Kong
SAR, China
Hong Kong
SAR, China
Support Activities for
Transportation
10
MTN Group South Africa South Africa Telecommunications 10
Mubadala
Development Co
United Arab Emirates
United Arab Emirates
10 Yes
Newbloom Pte Singapore Singapore Management of Companies
and Enterprises
10
OMX AB Sweden United Arab Emirates
Securities, Commodity
Contracts, and Other
Financial Investments and
Related Activities
10
Penta Investments
sro
Czech Republic Czech
Republic
10
Petronas
International
Malaysia Malaysia Support Activities for Mining 10 Yes
Prvni Privatizacni
Fond AS
Czech Republic Czech
Republic
Securities, Commodity
Contracts, and Other
Financial Investments and
Related Activities
10
Ranbaxy LaboratoriesIndia India Chemical Manufacturing 10
Westcon Group Inc United States South Africa Computer and Electronic
Product Manufacturing
10
Sources: World Bank staff compilation, from Dealogic, Thomson-Reuters SDC Platinum, and respective stock exchanges.Note: Acquiring fi rms listed in the table are defi ned as such based on the home country of their parent company.

Global Development Horizons 2011 The Changing Global Corporate Landscape 95
sectors including media services, telecoms, fi nan-
cial services, renewable energy (Chinese fi rms),
and banking and information technology (Indian
fi rms).16
Emerging-market fi rms accounted for 32 per-
cent of new cross-border equity listings by foreign
companies on U.S. and European international
exchanges from January 2005 to May 2010 (fi g-
ure 2.13).13 In addition, many of the companies
incorporated in off shore jurisdictions have their
operational base in developing countries, which
means that the actual proportion of new cross-
listings by fi rms operating in emerging markets
is likely higher than 32 percent. For their part,
in recent years, major international exchanges
have increasingly been competing to attract fi rms
domiciled in emerging-market countries. The
New York Stock Exchange (NYSE), NASDAQ,
and London Stock Exchange (LSE) all opened
representative offi ces in Beijing in 2007–08, for
example. Deutsche Börse has set up staff teams
that are responsible for attracting listings from
China, India, Russia, and other countries in
Eastern Europe—targeting, in particular, engi-
neering fi rms and companies seeking to raise cap-
ital for renewable energy projects and ventures.
As is the case for growing international fi rms
domiciled in developed countries, one of the
main motivations for emerging-market fi rms to
list on international exchanges is to raise capi-
tal—including to fi nance the expansion of their
cross-border operations. Th e LSE, in particular,
has attracted a large number of cross-listings by
emerging-market fi rms that have been active in
expanding their international operations through
acquisitions (fi gure 2.14): one-third of the emerg-
ing-market firms that have cross-listed on the
LSE since 2005 acquired foreign fi rms over the
two-year period following their listing.
Th e NYSE and NASDAQ also remain popu-
lar destinations for emerging-market fi rms seek-
ing to raise financing through initial public
offerings and subsequent issues for financing
cross-border acquisitions. A total of almost $47
billion in fi nancing has been raised since 1995
by emerging-market fi rms that have undertaken
cross-border acquisitions and are cross-listed
on the LSE, NYSE, or NASDAQ,14 with nearly
three-quarters of this financing ($33.4 billion)
raised on the New York stock exchanges (fi gure
2.15). China and India rank as the top fi rm domi-
cile countries in terms of the amount of fi nanc-
ing raised on these exchanges,15 with prominent
0
5
10
15
20
25
30
35
LSE LuxSEEuronext NYSE/Nasdaq
perc
en
t
within 1 yr within 2 yrs
FIGURE 2.14 Share of cross-listed fi rms that announced acquisitions of foreign fi rms
Sources: World Bank staff estimates based on data from national stock exchanges and Thompson Reuters.
0
50
100
150
200
250
300
350
2005 2006 2007 2008 2009 Jan.–May2010
nu
mb
er
of
firm
semerging market firms
firms incorporated in offshore jurisdictionshigh-income country firms
FIGURE 2.13 New cross-listings by foreign fi rms on U.S. and European international stock exchanges, 2005–10
Source: World Bank staff estimates based on data from national stock exchanges.Note: Tallies for foreign company listings on the London Stock Exchange (main list and Alternative Investment Market [AIM]), Euronext, Deutsche Börse (Regulated Offi cial and Regulated Unoffi cial Markets), Luxembourg Stock Exchange; and American Depository Receipts on the New York Stock Exchange and NASDAQ. Offshore jurisdictions include fi rms incorporated in Barbados, Bermuda, the British Virgin Islands, the Cayman Islands, Gibraltar, Guernsey, and the U.S. Virgin Islands.
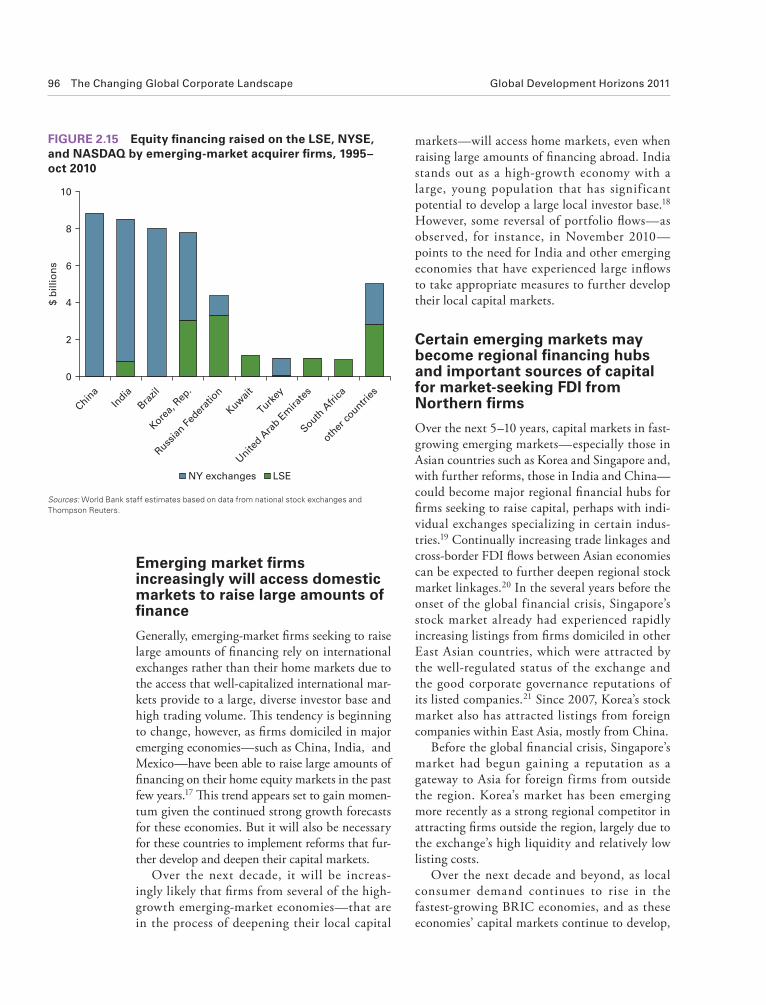
96 The Changing Global Corporate Landscape Global Development Horizons 2011
markets—will access home markets, even when
raising large amounts of fi nancing abroad. India
stands out as a high-growth economy with a
large, young population that has significant
potential to develop a large local investor base.18
However, some reversal of portfolio fl ows—as
observed, for instance, in November 2010—
points to the need for India and other emerging
economies that have experienced large infl ows
to take appropriate measures to further develop
their local capital markets.
Certain emerging markets may become regional fi nancing hubs and important sources of capital for market-seeking FDI from Northern fi rms
Over the next 5–10 years, capital markets in fast-
growing emerging markets—especially those in
Asian countries such as Korea and Singapore and,
with further reforms, those in India and China—
could become major regional fi nancial hubs for
fi rms seeking to raise capital, perhaps with indi-
vidual exchanges specializing in certain indus-
tries.19 Continually increasing trade linkages and
cross-border FDI fl ows between Asian economies
can be expected to further deepen regional stock
market linkages.20 In the several years before the
onset of the global financial crisis, Singapore’s
stock market already had experienced rapidly
increasing listings from fi rms domiciled in other
East Asian countries, which were attracted by
the well-regulated status of the exchange and
the good corporate governance reputations of
its listed companies.21 Since 2007, Korea’s stock
market also has attracted listings from foreign
companies within East Asia, mostly from China.
Before the global fi nancial crisis, Singapore’s
market had begun gaining a reputation as a
gateway to Asia for foreign firms from outside
the region. Korea’s market has been emerging
more recently as a strong regional competitor in
attracting fi rms outside the region, largely due to
the exchange’s high liquidity and relatively low
listing costs.
Over the next decade and beyond, as local
consumer demand continues to rise in the
fastest-growing BRIC economies, and as these
economies’ capital markets continue to develop,
Emerging market fi rms increasingly will access domestic markets to raise large amounts of fi nance
Generally, emerging-market fi rms seeking to raise
large amounts of fi nancing rely on international
exchanges rather than their home markets due to
the access that well-capitalized international mar-
kets provide to a large, diverse investor base and
high trading volume. Th is tendency is beginning
to change, however, as fi rms domiciled in major
emerging economies—such as China, India, and
Mexico—have been able to raise large amounts of
fi nancing on their home equity markets in the past
few years.17 Th is trend appears set to gain momen-
tum given the continued strong growth forecasts
for these economies. But it will also be necessary
for these countries to implement reforms that fur-
ther develop and deepen their capital markets.
Over the next decade, it will be increas-
ingly likely that fi rms from several of the high-
growth emerging-market economies—that are
in the process of deepening their local capital
0
2
4
6
8
10
China
India
Brazil
Korea,
Rep
.
Russia
n Fed
erat
ion
Kuwai
t
Turkey
Unite
d Ara
b Em
irate
s
South A
frica
other
countri
es
$ b
illio
ns
LSENY exchanges
FIGURE 2.15 Equity fi nancing raised on the LSE, NYSE, and NASDAQ by emerging-market acquirer fi rms, 1995–oct 2010
Sources: World Bank staff estimates based on data from national stock exchanges and Thompson Reuters.

Global Development Horizons 2011 The Changing Global Corporate Landscape 97
multinational manufacturing and consumer
goods firms based in Europe and the United
States can be expected to increasingly cross-list on
these economies’ capital markets. It is only natu-
ral that cross-listings by fi rms from high-income
countries in Europe and the United States, at fi rst
motivated solely by aims to raise their brand rec-
ognition in emerging markets, would be followed
over the next 10–15 years by equity issues that tap
emerging economies’ capital markets for signifi -
cant amounts of fi nancing, assuming that further
progress is made on fi nancial market regulatory
and institutional reforms.
India stands out among the BRICs and other
fast-growing emerging-market growth poles as
being likely to lead this expected trend. In 2010,
the fi rst Indian depositary receipts (IDRs) were
issued simultaneously by the United Kingdom’s
Standard Chartered Bank on India’s National
Stock Exchange and the Bombay Stock Exchange
to raise the bank’s visibility in India’s banking
sector. In addition, the Bombay Stock Exchange
struck a cooperation agreement with Deutsche
Börse that paves the way for future cross-listings
on India’s market by German fi rms.22
Market-seeking FDI sourced from Northern
manufacturing and consumer goods fi rms seek-
ing closer access to potentially large new con-
sumer markets in India could be expected to
increasingly seek to raise capital locally in India
to fi nance new subsidiaries, assuming that three
developments occur. First, further progress would
be needed on local capital market reforms toward
a soundly functioning national fi nancial system
supported by macroeconomic policies that eff ec-
tively manage private capital fl ows to avoid desta-
bilizing eff ects of overheating and the formation
of asset bubbles. Second, the Indian government’s
plans to double spending on transport and power
infrastructure improvements to $1 trillion in the
fi ve years to 2017 would need to go forward and
bear fruit. Th ird, market-seeking FDI in retail
sectors would be able to set up new subsidiaries
and finance them locally only if India’s policy
makers remove existing barriers to FDI in the
economy’s retail sectors. Notably, this Northern-
sourced FDI would be distinguished from the
Northern-sourced FDI of earlier decades in
that the new FDI likely would be primarily
market-seeking, rather than resource-seeking and
effi ciency-seeking.
Emerging markets are also becoming important sources of bank lending to low-income countries
Just as cross-border FDI from emerging econ-
omies is becoming more prominent in invest-
ment f lows to low-income countries, there is
some evidence that portfolio capital f lows to
low-income countries are a lso increasingly
ref lecting the growing inf luence of emerging
economies. While overall portfolio fl ows from
the South to LICs remain low as compared to
FDI f lows, international bank lending with
the participation of emerging economy banks
has grown signifi cantly in absolute terms since
2004 (figure 2.16), increasing by an order of
magnitude from $1.3 billion in 2003 to more
than $10 billion in 2010. Overall, much of this
lending activity was directed toward private
corporations in LICs, comprising 78 percent of
all loans in 2010.
Banks in South Africa have played an impor-
tant role in bilateral and syndicated lending to
LICs, especially in Sub-Saharan Africa. In 1995,
for example, South African banks participated in
deals valued at $305 million, and by 2010 this
had increased to $2.3 billion. Chinese banks are
another important source of cross-border lending
to LICs. Although their involvement in the inter-
national bank loan market is relatively recent—
beginning only in 2007—by 2010 they had
participated in deals valued cumulatively at $7.6
billion. With the exception of China, however,
most cross-border bank lending has, like cross-
border FDI, refl ected regional ties.
Emerging-market fi rms’ access to international bond markets continues to expand
International bond issuance by borrowers based
in emerging markets has grown dramatically since
the mid-1990s (fi gure 2.17) and now represents
a major source of capital for companies based in
emerging-market countries. Between 2003 and

98 The Changing Global Corporate Landscape Global Development Horizons 2011
in debt. Even though the amount of international
bond issues by these fi rms has grown in recent
years, emerging-market private fi rms accounted
for only 3.4 percent of the total value of global
corporate bond issues between 2003 and 2009.
Syndicated loans remain the primary source of
financing for globally active emerging-market
fi rms (fi gure 2.18).
The past decade has put a spotlight on the
diffi culties that emerging-market fi rms face in
accessing international bond markets. During
the global boom that preceded the 2008 fi nan-
cial crisis, emerging-market fi rms faced higher
borrowing costs than their counterparts in EU
countries (fi gure 2.19; see box 2.3 for data cal-
culations). For bonds issued in euros, private
emerging-market firms faced average spreads
over German government bonds of 110 basis
points, as compared with spreads of 58 basis
points for issues by fi rms from EU countries. For
bonds issued in U.S. dollars, emerging-market
fi rms paid a spread of 315 basis points over U.S.
Treasury securities, while euro area companies
paid only 55 basis points.23
A cross-sectional comparison of spreads on
corporate bonds versus the per capita income
FIGURE 2.17 International bond issues emanating from emerging economies, 1998–2010
Source: Dealogic DCM Analytics.
25
58
43
0
50
100
150
200
250
300
1998
1999
2000
2001
2002
2003
2004
2005
2006
2007
2008
2009
2010
$ b
illi
on
s
0
10
20
30
40
50
60
70
pe
rce
nt
private corporate public corporate
government share of private corporate(right axis)
19950
2
4
6
8
10
12
14
16$
bil
lio
ns
1996 1997 1998 1999 2000 2001 2002 2003 2004 2005 2006 2007 2008 2009 2010
with emerging economybank participation
without emerging economybank participation
Source: World Bank staff calculations, from Dealogic database.
Note: Any deals with at least one emerging economy bank listed as a lender were classifi ed as with emerging economy bank participation. Bank lending was calculated from all cross-border bank lending, both bilateral and syndicated, to private corporations, public corporations, and governments.
FIGURE 2.16 International bank lending to low income countries, 1995–2010
September 2010, 851 privately owned emerging-
market fi rms raised a collective $502 billion in
international bond markets, while 165 state-
owned emerging-market fi rms issued $261 billion

Global Development Horizons 2011 The Changing Global Corporate Landscape 99
of home countries also shows that private fi rms
based in developed economies pay signifi cantly
lower spreads on their bonds than do private
fi rms based in emerging economies (fi gure 2.20).
As can be expected, fi rms in countries with low
sovereign risk ratings (that is, with market per-
ceptions that sovereign risk is relatively high)
tend to face higher spreads (figure 2.21). This
suggests that countries with high sovereign risk
impose a negative externality on their corporate
sector, underlining the importance of policies to
enhance macroeconomic stability and improve
market confi dence.
Emerging-market fi rms also appeared to be
more vulnerable to credit conditions during
the global fi nancial crisis. Although the crisis
led to a widening of corporate bond spreads in
both emerging and developed economies, the
impact of the crisis was particularly great on
investment-grade bonds issued by fi rms based in Source: Dealogic DCM Analytics and Loan Analytic s.
FIGURE 2.18 International debt fi nancing by emerging-market fi rms, 2000–10
0
100
200
300
400
500
600
700
2000
2001
2002
2003
2004
2005
2006
2007
2008
2009
2010
$ b
illi
on
s
0
5
10
15
20
25
30
35
40
45
perc
en
t
syndicated bank lending bond
share of bonds over total (right axis)
FIGURE 2.19 Averag e at-issue spreads of international private corporate bonds, by currency, 2003–07
Source: World Bank staff estimates based on data from Dealogic DCM.
315
5577
48
178
4
102
332
370 372
425 429
110
58
26 15 17
61
21
225
102 100
69
294
221198
0
50
100
150
200
250
300
350
400
450
500
EM countri
es
euro
are
a
Unite
d Sta
tes
Norw
ay
Austra
lia
Canad
a
Japan
Korea,
Rep
.
South A
frica
Mex
ico
China
Brazil
Russia
n Fed
erat
ion
basi
s p
oin
ts
denominated in U.S. dollars denominated in euros
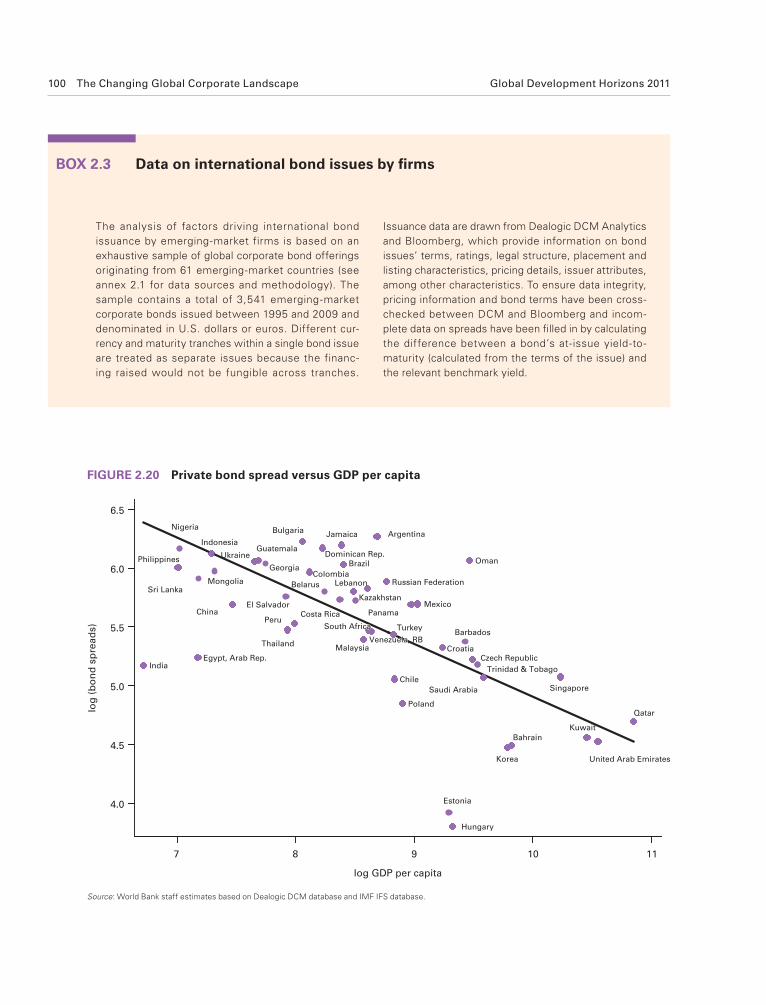
100 The Changing Global Corporate Landscape Global Development Horizons 2011
The analysis of factors driving international bond
issuance by emerging-market firms is based on an
exhaustive sample of global corporate bond offerings
originating from 61 emerging-market countries (see
annex 2.1 for data sources and methodology). The
sample contains a total of 3,541 emerging-market
corporate bonds issued between 1995 and 2009 and
denominated in U.S. dollars or euros. Different cur-
rency and maturity tranches within a single bond issue
are treated as separate issues because the financ-
ing raised would not be fungible across tranches.
Issuance data are drawn from Dealogic DCM Analytics
and Bloomberg, which provide information on bond
issues’ terms, ratings, legal structure, placement and
listing characteristics, pricing details, issuer attributes,
among other characteristics. To ensure data integrity,
pricing information and bond terms have been cross-
checked between DCM and Bloomberg and incom-
plete data on spreads have been fi lled in by calculating
the difference between a bond’s at-issue yield-to-
maturity (calculated from the terms of the issue) and
the relevant benchmark yield.
BOX 2.3 Data on int ernational bond issues by fi rms
FIGURE 2.20 Private bond spread versus GDP per capita
Source: World Bank staff estimates based on Dealogic DCM database and IMF IFS database.
Argentina
Bahrain
Barbados
Belarus
Brazil
Bulgaria
Chile
China
Colombia
CroatiaCzech Republic
Dominican Rep.
Egypt, Arab Rep.
El Salvador
Georgia
GuatemalaUkraine
India
IndonesiaJamaica
Kazakhstan
Korea
Estonia
Hungary
Kuwait
Lebanon
Malaysia
Mexico
Mongolia
Nigeria
Oman
PanamaPeru
Philippines
PolandQatar
Russian Federation
Saudi Arabia Singapore
Venezuela
Sri Lanka
Thailand
Trinidad & Tobago
Turkey
United Arab Emirates
4.0
4.5
5.0
5.5
6.0
6.5
log
(b
on
d s
pre
ad
s)
7 8 9 10 11
log GDP per capita
Venezuela, RB
Costa RicaCosta Rica
South AfricaSouth Africa

Global Development Horizons 2011 The Changing Global Corporate Landscape 101
FIGURE 2.21 Private b ond spread versus sovereign risk rating
Source: World Bank staff estimates based on Dealogic DCM database.
Argentina
Bahrain
Barbados
Bulgaria
Chile
Colombia
Croatia
Czech Republic
Dominican Republic
Egypt, Arab Rep.
El Salvador
Estonia
Guatemala
Hungary
India
Jamaica
Kazakhstan
Korea, Rep.
Kuwait
Latvia
China Lebanon
Malaysia
Mexico
Mongolia
Nigeria
Oman
Panama
Peru
Poland
Qatar
RussianFederation
Saudi ArabiaSingapore
Sri Lanka
Trinidad & Tobago
Turkey
United Arab Emirates
Venezuela, RB
4.0
4.5
5.0
5.5
6.0
6.5
log
(b
on
d s
pre
ad
s)
AAA A BB+ B–
sovereign risk rating
IndonesiaIndonesia
Brazil
GeorgiaUkraine
South AfricaSouth AfricaThailand
Philippines
Costa RicaCosta Rica
emerging markets, for which the average spread
jumped by 260 basis points from 2007 to 2009,
while the spread on investment-grade bonds
issued by U.S. companies rose only by 73 basis
points (figure 2.22). In contrast, the average
spread on non-investment-grade bonds issued
by emerging-market fi rms rose by less than the
spread on non-investment-grade bonds issued
by U.S. firms, although this was most likely
because the least creditworthy emerging-market
borrowers tended to be shut out of the market
entirely.
A lthough these simple comparisons of
spreads on emerging-market and advanced-
country bonds and economic variables are
useful, econometric analysis provides deeper
insights into the determinants of bond spreads
(box 2.4). Because investors’ risk perceptions,
issue design, and placement process aff ect the
pricing of debt securities, fi ve groups of variables
typically determine bond offerings’ at-issue
credit spreads, as follows:
• Debt security terms and design attributes,
including maturity, amount, seniority, cou-
pon, offering terms and legal provisions,
listing, applicable law and jurisdiction, and
bond risk rating
• Macroeconomic factors for each issuer’s
home country24
• Variables capturing the degree of finan-
cial, legal, and institutional development of
each issuer’s home country
• Global economic and f inancial condi-
tions, such as market volatility, liquidity
supply and demand, global business cycle
• Industry sector of the issuers
Th is analysis presented in box 2.4 shows that
higher GDP per capita or GDP growth in the

102 The Changing Global Corporate Landscape Global Development Horizons 2011
The econometric analysis of corporate bond spreads
relies on fi ve groups of explanatory variables to explain
the determinants of the at-issue spreads for various
linear specifi cations. The estimation is carried out by
ordinary least squares with country and sector fi xed
effects, and clustered standard errors adjusted for
heteroskedasticity across countries. For readability, all
country and sector fi xed effects are suppressed from
the tabulated results. The estimated system of linear
equations for emerging markets is specifi ed as follows:
jt= + +
+ + +
α β ϕ
η λ ε
I
.ijt j jt
i t it
Y X
Z G
In this model, Yijt is the at-issue credit spread over
the yield of a maturity-matched U.S. Treasury security
(or, in case of a euro issue, a maturity-matched German
government bond) of bond i, issued by a company domi-
ciled in country j at time t. Xjt denotes macroeconomic
factors of the issuer’s home-country economic indica-
tors, including the log of per capita GDP, log of infl ation,
real growth, and the home country’s level of fi nancial
development (stock market capitalization or turnover and
private credit, all as a percentage of GDP); Ijt denotes
institutional factors, which capture the quality of the
issuer’s home-country legal, political, financial, and
economic institutions, measured by composite indexes
(constructed from principal components analysis) of
the Worldwide Governance Indicators (WGI) or the
International Country Risk Guide (ICRG) indexes of eco-
nomic, fi nancial, and political stability. Zi denotes bond-
specifi c features, including a set of variables relating to
the issue’s marketing choice, such as binary variables for
the market segment (that is, Eurobond, 144A issue, or
global bond), currency of denomination (U.S. dollars ver-
sus euros), the applicable law and jurisdiction (New York,
United Kingdom, or other governing law), listing choice,
and a set of control variables pertaining to the terms of
the issue [coupon, log(amount), log(maturity), rating,
seniority, call or put, common covenant provisions, and
guarantees]. Gt denotes global risk factors, including
market volatility (compiled by World Bank staff), the dif-
ference between 10-year and 2-year U.S. Treasury bond
yields, and growth of the world industrial production
index. aj is the country dummy; eit is the error term. The
results are reported in table B2.4.1.
BOX 2.4 Econometric es timations of corporate bond spreads
TABLE B2.4.1 Detailed econometric results for regressions on spread determinants
ICRG model WGI model
Bond attributes (selected variables)Floating-rate notes −117.453*** −114.375***
(0.000) (0.000)
Euro-denominated −3.46 0.408
(0.799) (0.976)
Log (maturity) 8.102 4.896
(0.166) (0.404)
Log (value, $ millions) −25.682*** −25.881***
(0.000) (0.000)
Credit rating at launch 25.606*** 25.276***
(0.000) (0.000)
Macroeconomic variablesGDP growth (annual %) −4.135* −6.617***
(0.026) (0.000)
Log (GDP per capita) 52.880** 15.611
(0.005) (0.388)
Log (1+infl ation) 304.538** 452.670***
(0.004) (0.000)
Stock market turnover as
% of GDP
0.318* 0.492**
(0.042) (0.002)
Private credit as % of GDP −1.266** −1.265**
(0.005) (0.007)
Institutional factorsICRG composite index −10.439***
(0.000)
Worldwide Governance
Indicator (WGI)
−93.138*
(0.014)
Global factorsCountry crisis dummy 4.97 16.506
(0.804) (0.405)
Volatilitya 39.232*** 40.193***
(0.000) (0.000)
Difference between
10-year and 2-year U.S.
Treasury bond yields
31.431*** 34.648***
(0.000) (0.000)
World industry production
index (%)
−9.013*** −9.442***
(0.000) (0.000)
Pseudo R2 0.66 0.65
Observations 1,623 1,623
Source: World Bank staff estimates.
Note: The models are estimated with country fi xed effect; sector dum-mies and country dummies are not reported; p-values are shown in parentheses.
a. Volatility is the monthly average of the predicted daily common volatil-ity of eight variables: VIX, $/euro, $/yen, $/sterling, agriculture com-modities price index, energy price index, industrial metals price index, and the TED spread.
* p < 0.05, ** p < 0.01, *** p < 0.001.

Global Development Horizons 2011 The Changing Global Corporate Landscape 103
seem to disregard whether the issuer’s home coun-
try experienced a fi nancial or economic crisis in
their pricing of emerging-market corporate debt.
Th is result is probably due to selectivity eff ects:
only fi rms with good economic prospects are able
to access global debt markets, but such borrowers
typically tend to have less exposure to their home
economies than to the global business cycle.
Emerging-market borrowers that are willing
to retain certain risks by issuing f loating-rate
debt appear to benefi t by signifi cantly lowering
their borrowing costs. Floating-rate debt often
contains a rating trigger that adjusts the spread
over the reference interest rate at the next reset
date in case the issue is downgraded by one of
the major rating agencies, partly compensating
investors for their credit exposure. For purchas-
ers of emerging-market debt, this mechanism can
be quite valuable, as emerging-market fi rms are
often perceived as more vulnerable to changes in
economic and business conditions and, hence,
riskier investment propositions. Similarly, inves-
tors often are willing to pay a liquidity premium
for larger issues, which are more easily traded and
thus enable investors to adjust their portfolios in
case of changes in the economic prospects of the
issuer, the home country or region of the issuer,
or global conditions. And it is not surprising
that the absence of negative pledge causes, which
reinforce creditor rights over collateral and pro-
vides assurances over the seniority of their claims,
home country of emerging-market fi rms is signif-
icantly associated with lower spreads. As domes-
tic economic conditions improve, fi rms’ growth
opportunities improve, reducing credit risk and
thereby lowering borrowing costs. However, cor-
porate borrowers from emerging markets pay a
signifi cant infl ation premium. Th is result is con-
sistent with the notion that international inves-
tors treat the level of home-country infl ation as a
signal of economic and fi nancial stability. Since
infl ation distorts economic decision making and
imposes signifi cant economic costs on fi rms, the
fi nding suggests that prudent monetary and fi scal
policies can reduce the borrowing costs of fi rms
in emerging markets.
Th e quality of institutions (as measured by the
ICRG [International Country Risk Guide] com-
posite country index—the higher, the better) sig-
nifi cantly reduces credit spreads. Th e more devel-
oped a country’s institutions are and the more
reliable its legal system is, the lower international
borrowing costs typically are for that country’s
firms. The quality of the legal system is espe-
cially important in the case of fi nancial distress
and restructuring, which often requires recourse
to the home country’s legal system to enforce
liens, guarantees, and security interests. Analysis
using the six dimensions of governance measured
by the World Governance Indicator (WGI) also
fi nds a signifi cant impact of institutional quality
on bond spreads.25 Interestingly, global investors
FIGURE 2.22 U.S. dollar corporate bond spread to benchmarks, 2000–10, average by year
Source: World Bank staff calculations based on Dealogic database.
b. Noninvestment grade
0
100
200
300
400
500
600
700
800
2000
2001
2002
2003
2004
2005
2006
2007
2008
2009
2010
basi
s p
oin
ts
a. Investment grade
0
50
100
150
200
250
300
350
400
2000
2001
2002
2003
2004
2005
2006
2007
2008
2009
2010
basi
s p
oin
ts
emerging market United States others

104 The Changing Global Corporate Landscape Global Development Horizons 2011
the various failures diff er, of course, but largely
ref lect the difficulties in achieving consensus
across governments at diff erent levels of economic
development, different views and interests in
the defi nition of investor rights and protections,
and disagreements over the extent to which such
codes should be binding.
In the absence of a multilateral framework
on cross-border investment, bilateral investment
treaties have emerged as the dominant mecha-
nism governing cross-border investment f lows.
Th e fi rst BIT was signed between Germany and
Pakistan in 1959. By the mid-1980s, the num-
ber of BITs had increased to 250, and their use
continued to expand rapidly (figure 2.23). By
2007, BITs had increased to more than 2,275 in
number, covering some 170 countries. Over the
entire period, a majority of BITs were concluded
between an advanced and a developing economy.
Among advanced economies, European countries
have signed more than 90 percent of all BITs,
with Germany, Switzerland, the Netherlands,
France and the United Kingdom leading the way
(fi gure 2.24).
While provisions within each BIT diff er, the
BITs generally provide for most favored nation
treatment, grant protection for investors’ con-
tractual rights, allow the repatriation of profi ts,
restrict the use of performance requirements, and
provide international arbitration in the case of a
dispute between an investor and the host country
(Elkins, Guzman, and Simmons 2006).
BITs indicate a credible commitment to a
liberal investment regime on the part of a host
country, and thus can serve as a means of attract-
ing foreign investment. Though some econo-
metric analysis fi nds that BITs have only a weak
role, or no role in encouraging greater foreign
investment in developing countries, on aver-
age (UNCTAD 1998b; Hallward-Driemeier
2003), others have found that BITs with stron-
ger investment provisions, especially those that
guarantee market access for FDI, have in fact
been associated with stronger cross-border invest-
ment f lows (Berger et al. 2010; Salacuse and
Sullivan 2005). Nevertheless, it is important to
recognize that BITs have important costs. BITs
can require governments to restrict the scope of
sovereign economic policy making in areas such
increase borrowing costs. Investors are willing to
compensate borrowers, who will not pledge any
of its assets if doing so gives the lenders less secu-
rity, through lower spreads.
Th ese fi ndings have two important implica-
tions for emerging-market fi rms. First, as emerg-
ing economies continue to grow more rapidly
than developed countries, and as emerging
economies achieve continued improvements in
their domestic institutions, their access to inter-
national bond markets will continue to improve.
As time goes by, emerging-market fi rms will see
their bond spreads fall closer to their advanced-
country counterparts, and will suff er a smaller
reduction in access during global recessions.
Second, this process is not automatic.
Governments can play an active role in improv-
ing access to finance for their corporate sec-
tors by investing in institutional development
and providing a stable business environment.
Improvements in the quality of institutions, eco-
nomic stability, and the reliability of the legal sys-
tem can play a critical role in reducing the spreads
faced by emerging-market fi rms. For borrowers
from advanced countries, investors typically take
the existence of a stable business environment
and well-functioning legal systems for granted.
Th e goal for emerging markets is to achieve the
increases in income and improvements in institu-
tions that will provide similar levels of investor
confi dence.
Devising an Effective Framework for Cross-Border InvestmentThe proliferation of bilateral investment treaties
Th e rapid increase in global FDI fl ows since the
1970s has underlined the importance of a frame-
work that governs cross-border investment fl ows.
As emerging-market corporations play a growing
role in global investment and fi nance, the need
for a formal framework, especially one that pro-
vides adequate legal protection for foreign inves-
tors, has increased.26 Unfortunately, unlike the
case for international trade, eff orts to agree on
a multilateral framework for investment have a
long history of failure (box 2.5). Th e reasons for

Global Development Horizons 2011 The Changing Global Corporate Landscape 105
The first attempt to design an international frame-
work for investment was through the 1929 League of
Nations conference, which was held in response to
the nationalization and protectionism that increasingly
characterized international economic relations through
the 1920s. That conference failed to reach consensus
on an international agreement on the treatment of
foreign enterprises and foreigners (UNCTAD 1998a;
Woolcock 2007).
Twenty years later, the Havana Charter for an
International Trade Organization (ITO), signed by more
than 50 countries in 1948, sought to “encourage the
international flow of private capital for investment”
and to provide a multilateral framework for addressing
the activities of foreign fi rms. As envisaged, the ITO
would have been endowed with the role of developing
and promoting the “adoption of a general agreement
or statement of principles regarding the conduct, prac-
tices and treatment of foreign investment,” and would
have incorporated a formal mechanism for addressing
violations of its charter. However, the Havana Charter
never came into force, largely due to the inability of the
U.S. Congress to support its ratifi cation. Lack of pro-
visions for protection or compensation of investors in
the event of expropriation was an important reason for
opposition to the treaty (Metzger 1968).
As cross-border investment flows between
advanced economies surged in the 1980s and early
1990s, there was a revival of the international debate
on whether an effective multilateral FDI framework
should (or could) be established. Multilateral codes
that dominated the debate during this era, such as
the Organization for Economic Co-operation and
Development (OECD) Guidelines for Multilateral
Enterprises and the draft United Nations Code of
Conduct for Transnational Corporations (the UN Code),
were voluntary and not enforceable. In fact, the UN
Code never went into effect and was abandoned in the
early 1990s after nearly two decades of unsuccess-
ful negotiations. The OECD Guidelines were formally
adopted, but they are essentially a set of recommen-
dations governing the activities of multinational com-
panies in OECD member countries and, like the draft
UN Code of Conduct, focused mainly on the activities
of the corporations rather than on the obligations and
responsibilities of nation states.
Although the Uruguay Round of the GATT (1986–94)
adopted an agreement that banned the imposition of
Trade-Related Investment Measures (TRIMS) that were
inconsistent with GATT’s Article III on national treatment
or Article XI on the elimination of quantitative restric-
tions (Salacuse and Sullivan 2005), its purpose was to
avoid the imposition of local content and trade balanc-
ing requirements for approval or operation of a foreign
investment project. Until the Uruguay Round, the GATT
did not address cross-border investment issues at all,
and the limited negotiations on cross-border investment
fl ows within the context of the Uruguay Round did not
move the international community closer to a compre-
hensive set of rules on FDI. The General Agreement on
Trade in Services (GATS) also has some provisions that
affect investment, although it is limited in scope to cover
services sectors. Moreover, while governments can
make commitments under the GATS concerning national
treatment and the stability of the policy framework for
foreign investment in particular services sectors, there is
no requirement that they do so. All parties to the GATS
do commit to providing most-favored-nation treatment
to investors from other parties. But this implies no com-
mitment concerning the treatment of investors in gen-
eral, and also does not exclude the granting of conces-
sions to particular investors (Molinuevo 2006).
BOX 2.5 The long history of faile d negotiations over a multilateral investment framework
Toward a multilateral investment framework
Building on the progress achieved in creating
a multilateral legal framework for the settle-
ment of international investment disputes under
the International Center for the Settlement of
as discriminatory taxation, performance agree-
ments, local content requirements, and expro-
priation. In addition, the commitment to inter-
national arbitration means that virtually any legal
or regulatory provision that aff ects foreign inves-
tors is potentially subject to review by a foreign
tribunal.

106 The Changing Global Corporate Landscape Global Development Horizons 2011
FIGURE 2.23 Total number of active bilateral investment treaties, 1980–2007
Source: International Centre for the Settlement of Investment Disputes, Database of Bilateral Investment Treaties.
0
500
1,000
1,500
2,000
2,500
1980 1982 1984 1986 1988 1990 1992 1994 1996 1998 2000 2002 2004 2006
nu
mb
er
of
BIT
s
FIGURE 2.24 Number of bilateral investment treaties signed by advanced economy countries, as of 2007
0 20 40 60 80 100 120 140 160
Germany
Switzerland
Netherlands
France
United Kingdom
Italy
Belgium-Luxembourg
Sweden
Austria
Finland
Spain
United States
Portugal
Denmark
Slovak Republic
Greece
Slovenia
Canada
Malta
Australia
Norway
Cyprus
Japan
signed with emergingmarket countries
signed with advancedeconomy countries
Source: International Centre for the Settlement of Investment Disputes, Database of Bilateral Investment Treaties.

Global Development Horizons 2011 The Changing Global Corporate Landscape 107
solutions to a multilateral system,29 as the large
number of active BITs has increased the complex-
ity of cross-border investment rules, and thus the
costs of complying with those rules30 (akin to
the “spaghetti bowl” problem of an increasingly
complicated global network of preferential trad-
ing arrangements). And, setting rules on a bilat-
eral basis has eroded the negotiating position of
the capital-importing countries, which bear the
vast majority of obligations in these treaties but
have become party to them in order to attract
foreign capital (Woolcock, 2007)—despite hav-
ing rejected less onerous terms for investor pro-
tection when acting as a group in earlier decades
(Guzman, 1998). Moreover, constraints on
policies inherent in BITs may have undermined
development eff orts. Th e evidence suggests that
BITs have not only had little positive eff ect on
economic growth and societal well-being in
host countries, but may also even have had net
negative eff ects, such as increasing uncertainty
for host countries (Stiglitz 2008). In competing
among themselves to sign BITs, developing host
countries may have reduced the total gains to
developing countries as a group.
To the extent that a multilateral mechanism
could enhance the stability and predictability of
cross-border investment fl ows, delineate clearer
and more balanced lines of responsibility between
host countries and investor fi rms (and their home
countries), and provide a more fair means of
resolving cross-border disputes, a multilateral
investment framework would increase the supply
of productive and development-enhancing foreign
investment (Drabek 1998). But current trends
off er a confl icting picture on the prospects for the
legal framework for international investment.
Several recent studies fi nd evidence of rising
FDI protectionism in national polices, which
may jeopardize even the imperfect rules-based
approach to cross-border investment currently
in existence, of which BITs form a core com-
ponent.31 On the other hand, in the Uruguay
Round and the recent negotiations over the Doha
Round, developing countries have been the major
roadblocks to progress in establishing a multi-
lateral investment framework. With developing
countries having become an important source of
foreign investment, opposition to a multilateral
Investment Disputes (ICSID) Convention, the
time is ripe to move ahead with the establishment
of a multilateral framework for managing cross-
border investment fl ows. Such a framework will
help improve investment climate and bring to
fruition a goal that has eluded the international
community since the 1920s.
Th e recent proliferation of BITs with relatively
strong investor protection provisions is something
of a puzzle, since many countries had, in earlier
decades, rejected less onerous terms for inves-
tor protection when acting as a group (Guzman
1998). One possibility is that while governments
are reluctant to make such concessions to all
countries, governments are nonetheless willing
to selectively enter into BITs that allow the gov-
ernments to retain some control over the specifi c
terms (Woolcock 2007). It is also possible that
governments face considerable domestic pressures
to make concessions on investor protections to a
particular country that is (or could be) a major
source of investment, while domestic incentives
to make multilateral commitments may not be as
strong (Elkins, Guzman, and Simmons 2006).27
Another possible factor that may have given rise
to the surge of BITs is competitive pressure.
Countries acting in concert may block a multilat-
eral accord, but may feel compelled to grant simi-
lar provisions in individual negotiations because
of their desire to gain a competitive edge—or
because of their fear of other countries doing so—
in attracting FDI. Indeed, evidence suggests that
host countries are more likely to sign BITs when
their competitors already have done so (Elkins,
Guzman, and Simmons 2006). Consequently,
BITs are more common in countries that attract
FDI in light manufacturing, where the investor
has considerable choice in location, but less com-
mon in countries where FDI primarily targets oil
and minerals sectors, where geographic choice is
more restricted.
Whether this proliferation of BITs ultimately
contributes to or detracts from the multilateral
agenda is an open question. Th ere is a large lit-
erature in international trade that suggests that
bilateral arrangements can have trade creating or
diverting eff ects, and therefore may be building
or stumbling “blocs” for greater multilateralism.28
Nevertheless, BITs are likely to be second-best

108 The Changing Global Corporate Landscape Global Development Horizons 2011
those nations and others, and hence make the
investment-constrained economies more likely
to accede to a multilateral platform. Finally,
BITs may also change the domestic political
economy by weakening interests arrayed against
foreign investment fl ows. Th e existence of a for-
mal multilateral institution—a world invest-
ment organization analogous to the World Trade
Organization—may also be an important step
forward, especially if such a multilateral forum
enhances access by developing countries, espe-
cially LICs, to global investment capital.
AnnexesAnnex 2.1: Database on the primary market for emerging-market international corporate bonds
Th e value of bonds issued by emerging countries
on international markets has grown dramatically
since the 1990s, making bond issuance one of
the largest sources of capital infl ows for develop-
ing countries. Although JP Morgan’s Emerging
Markets Bond Index provides dynamic informa-
tion about the performance of emerging-market
bonds on secondary markets, primary market
information, which typically is more comprehen-
sive, is essential for researchers to investigate the
characteristics of these bonds and their implica-
tions for emerging countries and international
financial markets. The World Bank’s Database
on the Primary Market for Emerging-Country
International Corporate Bonds compiles data on
3,541 international corporate bond off erings (in
tranches) issued by 61 emerging countries issued
between 1995 and 2009 and denominated in
either U.S. dollars or euros. Table 2A.1 shows the
summary statistics of the key variables. Th e data-
base off ers consistent information on bond nation-
ality, value, maturity, pricing, off er terms, legal
provisions, applicable laws, credit rating, indus-
tries, and other areas (table 2A.2 contains descrip-
tions of all the variables) obtained from Dealogic
DCM Analytics and Bloomberg. Missing fi gures
on the key spread-to-benchmark variable are care-
fully fi lled in by World Bank staff , making the
database uniquely complete and consistent for
studying emerging-market bond trends.
framework that protects investor rights may
decline. Th e proliferation of new BITs between
developing countries during the 1990s and early
2000s (fi gure 2.25) provides some evidence that
developing countries are becoming more inter-
ested in forging rules for cross-border investment,
as at least some provisions that are common
across BITs could become viewed as generally
accepted principles of international law (Salacuse
and Sullivan 2005). Th is point is a controversial
one, however. But as BITs with common provi-
sions become even more widespread, and increas-
ingly become integrated into the legal framework
of participating countries, a case can be made
that BITs deserve the same recognition of other
principles that have become part of customary
international law.
A more intriguing possibility is that BITs may
themselves serve as stepping-stones to a more
comprehensive multilateral investment frame-
work. Th e elimination of investment restrictions
via BITs may complement multilateral liberaliza-
tion eff orts. BITs may also facilitate the gradual
building of a coalition of nations ultimately
interested in a multilateral system. If BITs do
indeed promote economic growth in otherwise
investment-constrained economies, such growth
may reduce economic asymmetries between
FIGURE 2.25 The number of newly sig ned South-South BITs rose rapidly in the 1990s, ahead of the actual surge in South-South investment
Source: World Bank staff estimates based on data sourced from the International Centre for the Settlement of Investment Disputes, Database of Bilateral Investment Treaties.
0
50
100
150
200
250
1990 1992 1994 1996 1998 2000 2002 2004 2006
nu
mb
er
of
treati
es
tallies of new South-South treaties signedtallies of new non-South-South treaties signed

Global Development Horizons 2011 The Changing Global Corporate Landscape 109
TABLE 2A.1 Summary statistics of corporate bond issuance by emerging-market countries, 1995–2009
Number of tranches
Total vol-ume raised ($ billions)
Volume raised in U.S.
dollars ($ billions)
Volume raised in euro
($ billions)
Average amount
($ millions)
Average spread
(basis points)
Average maturity
(number of years)
Average rating
Emerging countries 3,541 896.9 784.0 112.9 253.3 300.7 7.4 BBB–
Public corporate 765 290.2 239.3 50.9 379.3 220.6 7.7 BBB+
Private corporate 2,776 606.7 544.7 62.0 218.6 322.8 7.3 BBB–
Source: World Bank staff estimates.
the yield of closest long-term Treasury bonds, and
x is the weight of years to maturities of the closest
long-term and short-term available government
bond, calculated as follows:
−=
−1
2 1
( )
( )
g
g g
M MM
M M
where M is the emerging bond’s years to maturi-
ties, Mg1 is the term of closest short-term Treasury
bonds, and Mg2 is the term of closest long-term
Treasury bonds.
If no long-term or short-term Treasury bond is
available, the yield of the Treasury bond with the
most similar term is used as the benchmark.
2. For bonds issued in euros:
German government bond (GGB) yields with
same issue dates and terms are used as bench-
marks for emerging bonds denominated in euros.
Th e emerging bond’s spread-to-benchmark is the
diff erence between the emerging-bond yield-to-
maturity at issuance and the benchmark GGB
yield-to-maturity.
The same interpolation method is used for
bonds issued in euros as for bonds issued in U.S.
dollars when the same issue dates and terms for
GGB yields are not available. When the short-
term GGBs are unavailable, one-year euro inter-
bank rates are used for interpolation.
With yield-to-maturity not available:When bond yield-to-maturity is not available,
the yield-to-maturity is fi rst calculated with cou-
pon and payment information and then the same
method described in part is applied to obtain the
spread-to-benchmark.
Methodology for filling in missing data. Of
the universe of 3,541 emerging-country corpo-
rate bond observations included in the database,
1,413 (1,270 bonds issued in U.S. dollars and
143 bonds issued in euros) do not have spread-
to-benchmark information available in the
Dealogic DCM Analytics database. Th e miss-
ing spreads of these observations are calculated
by the World Bank staff using bond pricing
information from Dealogic or Bloomberg. Th e
methodology for fi lling in the missing data is as
follows:
Fixed-rate bonds
With yield-to-maturity available:When an emerging bond’s yield-to-maturity
is available, a proper benchmark needs to be
identifi ed.
1. For bonds issued in U.S. dollars:
U.S. Treasury bond yields with the same issue
dates and terms are used as a benchmark. The
bond’s spread-to-benchmark is the difference
between the emerging bond’s yield-to-maturity
rate at issuance and the benchmark Treasury
bond yield-to-maturity.
For instances in which the same terms and
issuance dates for U.S. Treasury bonds are not
available, the benchmark yield-to-maturity is
interpolated by calculating the weighted aver-
age of closest long-term and short-term Treasury
bond yields by year, as follows:
= + −2 1. .(1 )b g gY x y x y
where Yb is the benchmark yield, Yg1 is the yield
of closest short-term U.S. Treasury bonds, Yg2 is

110 The Changing Global Corporate Landscape Global Development Horizons 2011
TABLE 2A.2 Defi nitions of key variables included in the database
Variable name Defi nition
Bond pricing variablesSpread-to-benchmark/
discount (BP)Spread between coupon rate of the security and government bonds or benchmark, expressed in
basis points (the methodology for fi lling in missing data for this variable is shown in the notes)Coupon (%) Coupon rate of the security (%)Offer price (%) Percent of the face value of a tranche that is offered to publicBenchmark The government bond spread over which the spread of the security at launch Yield-to-maturity Rate of return on a security assuming it is held until maturity
Basic bond characteristic variables Total deal value $ (face) Total value (in $) offered of all tranches of a dealTotal deal value $ (proceeds) Total proceeds (in $) offered of all tranches of a dealTranche value $ (face) Principal amount of a tranche (in $)
Tranche value $ (proceeds) Face value of a tranche multiplied by offer price percentage (in $)Deal pricing date Date the security is pricedMaturity date Legal maturity date of a trancheYears to maturity Number of years from settlement date to legal maturity dateDeal type Type of security being sold in the offering Currency code “USD” for a security denominated in U.S. dollars or “EUR” for a security denominated for eurosFloat (Y/N) Indicates whether coupon rate is a fl oating rate
Covenant and legal fi eldsGoverning laws National, state, or provincial laws under which terms of a new issue are agreedAmortization (Y/N) For asset-backed and mortgage-backed securities, indicates whether a given tranche of a security
has been amortized (gradual repayment over time) Callable (Y/N) Indicates whether the issue is callable by the issuer Collateralized (Y/N) Indicates whether a given tranche on a security is backed by collateral Cross-default issuer (Y/N) Indicates whether the issue contract contains a clause for cross default by the issuerCross-default guarantor (Y/N) Indicates whether the issue contract contains a clause for cross default by the guarantorExtendible (Y/N) Identifi es whether a bond’s maturity can be lengthened at the option of the issuerRule 144A (Y/N) Indicates whether tranche is marketed in the United States via Rule 144ASEC registered (Y/N) Identifi es whether an issue has been sold in the United States under SEC rulesNegative pledge issuer (Y/N) Indicates whether the issue contract contains a negative pledge issuer clauseMarket type Code of the market in which the issue is sold
Risk informationEffective rating (current) Calculated rating based on available ratings from Standard & Poor’s, Moody’s, and Fitch at time of
downloading (March 2010)Effective rating (launch) Calculated rating based on available ratings from Standard & Poor’s, Moody’s, and Fitch at launch High yield (Y/N) Indicates if a tranche has a credit rating below investment gradeInvestment grade (Y/N) Indicates if a tranche is rated at or above investment grade Issuer Name of the issuing companyIssuer business description Business description of the issuerIssuer type Code representing the general description of issuerIssuer parent Name of the parent company if the issuer is a subsidiaryGuarantor Name of the guarantor companyGuarantor type Code representing the general description of the guarantorSpecifi c industry group Specifi c industry of the issuerGeneral industry group General industry of the issuerUse of proceeds Description of the issuer’s intended use for the capital raised on a tranche
Nationality informationDeal nationality Business nationality of the issuing entity (guarantor nationality, issuer parent nationality of opera-
tions, or nationality of risk)
Source: World Bank and Dealogic DCM database.Note: SEC = U.S. Securities and Exchange Commission.
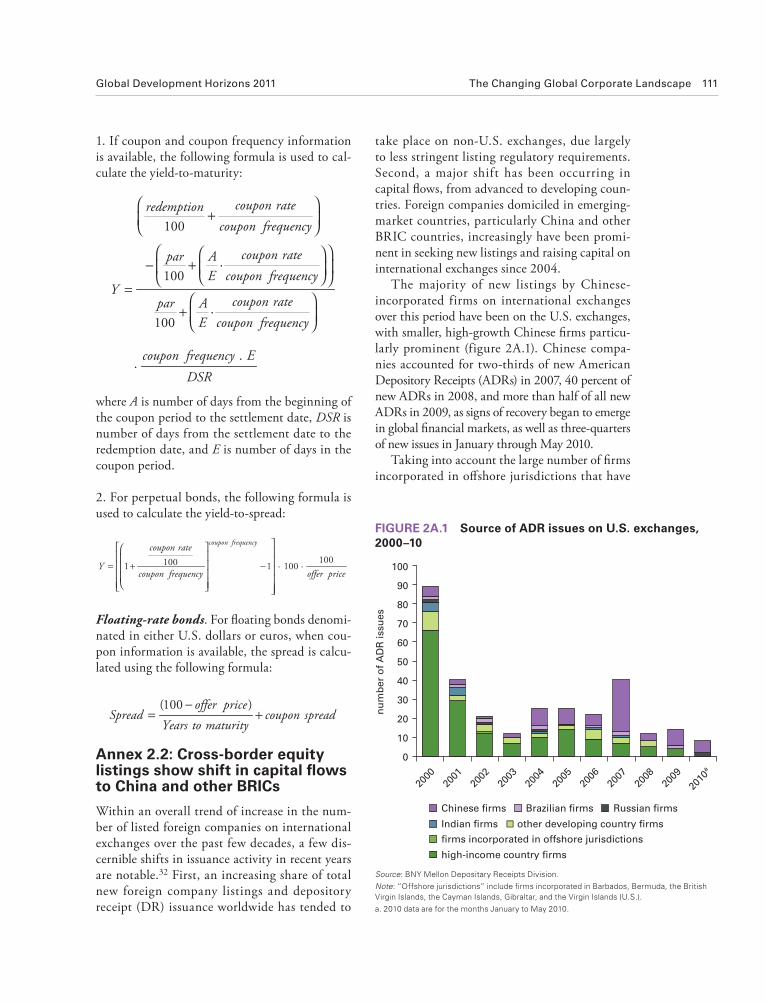
Global Development Horizons 2011 The Changing Global Corporate Landscape 111
take place on non-U.S. exchanges, due largely
to less stringent listing regulatory requirements.
Second, a major shift has been occurring in
capital fl ows, from advanced to developing coun-
tries. Foreign companies domiciled in emerging-
market countries, particularly China and other
BRIC countries, increasingly have been promi-
nent in seeking new listings and raising capital on
international exchanges since 2004.
The majority of new listings by Chinese-
incorporated firms on international exchanges
over this period have been on the U.S. exchanges,
with smaller, high-growth Chinese fi rms particu-
larly prominent (figure 2A.1). Chinese compa-
nies accounted for two-thirds of new American
Depository Receipts (ADRs) in 2007, 40 percent of
new ADRs in 2008, and more than half of all new
ADRs in 2009, as signs of recovery began to emerge
in global fi nancial markets, as well as three-quarters
of new issues in January through May 2010.
Taking into account the large number of fi rms
incorporated in off shore jurisdictions that have
1. If coupon and coupon frequency information
is available, the following formula is used to cal-
culate the yield-to-maturity:
100
.100
.100
..
coupon rateredemption
coupon frequency
coupon ratepar A
E coupon frequencyY
coupon ratepar A
E coupon frequency
coupon frequency E
DSR
⎛ ⎞+⎜ ⎟⎝ ⎠
⎛ ⎞⎛ ⎞− +⎜ ⎟⎜ ⎟⎝ ⎠⎝ ⎠
=⎛ ⎞
+ ⎜ ⎟⎝ ⎠
where A is number of days from the beginning of
the coupon period to the settlement date, DSR is
number of days from the settlement date to the
redemption date, and E is number of days in the
coupon period.
2. For perpetual bonds, the following formula is
used to calculate the yield-to-spread:
⎤⎡ ⎤⎛ ⎥⎢ ⎥⎜ ⎥= ⎢ + ⎥ −⎜ ⎥⎢ ⎥⎜ ⎥⎝⎢ ⎥⎣ ⎦ ⎥⎦
100100 . .1 1 100
coupon frequencycoupon rate
Ycoupon frequency offer price
Floating-rate bonds. For fl oating bonds denomi-
nated in either U.S. dollars or euros, when cou-
pon information is available, the spread is calcu-
lated using the following formula:
−= +
(100 )offer priceSpread coupon spread
Years to maturity
Annex 2.2: Cross-border equity listings s how shift in capital fl ows to China and other BRICs
Within an overall trend of increase in the num-
ber of listed foreign companies on international
exchanges over the past few decades, a few dis-
cernible shifts in issuance activity in recent years
are notable.32 First, an increasing share of total
new foreign company listings and depository
receipt (DR) issuance worldwide has tended to
0
10
20
30
40
50
60
70
80
90
100
2000
2001
2002
2003
2004
2005
2006
2007
2008
2009
2010
a
nu
mb
er
of
AD
R iss
ue
s
Chinese firms Brazilian firms Russian firms
Indian firms other developing country firms
firms incorporated in offshore jurisdictions
high-income country firms
Source: BNY Mellon Depositary Receipts Division.
Note: “Offshore jurisdictions” include fi rms incorporated in Barbados, Bermuda, the British Virgin Islands, the Cayman Islands, Gibraltar, and the Virgin Islands (U.S.).
a. 2010 data are for the months January to May 2010.
FIGURE 2A.1 Source of ADR issues on U.S. exchanges, 2000–10

112 The Changing Global Corporate Landscape Global Development Horizons 2011
Russian firms Indian firms
other developing country firms
firms incorporated in offshore jurisdictions
other high-income country firms
0
20
40
60
80
100
120
140
2000
2001
2002
2003
2004
2005
2006
2007
2008
2009
2010
a
nu
mb
er
of
ne
w l
isti
ng
s
FIGURE 2A.2 Breakdown of tallies for new foreign com-pany listings on the LSE AIM, 2000–10
Source: World Bank staff estimates.
Note: Offshore jurisdictions include fi rms incorporated in Barbados, Bermuda, the British Virgin Islands, the Cayman Islands, Gibraltar, and the U.S. Virgin Islands.
a. 2010 data are for the months January to May 2010.
European markets, as well as to raise capital to
finance these market expansion plans. Newly
listed Chinese companies accounted for 45 per-
cent of the total capital raised by newly listed for-
eign fi rms on Euronext in the fi rst fi ve months
of 2010. Germany’s Deutsche Börse is actively
seeking out listings by fi rms in China, as well
as India and the Russian Federation, although
high-income country firms have continued to
predominate. Several notable issues in 2007–09
by Chinese firms resulted from engineering,
biotech, agricultural processing, and a variety
of other sectors, including at the height of the
global fi nancial crisis.
Annex 2.3: Database construction and analy sis of emerging-market cross-border investment
The analysis of M&A activities of firms based
in emerging-market countries draws on a new,
comprehensive database that covers all publicly
disclosed cross-border deals undertaken between
1997 and 2010. Th e database covers some 10,000
companies from 61 emerging-market econo-
mies. Th e data were drawn from a larger data set
compiled by Thomson-Reuters SDC Platinum
and cover all known transactions for which the
ultimate acquiring company was based in an
emerging-market country and the immediate tar-
get company was located in a country other than
that of the ultimate acquirer. Th ose transactions
involve either two or more companies pooling
their assets to form a new entity (merger), or a
foreign company gaining a portion of a domestic
company (acquisition). Th e data include histori-
cal information on acquirer and target countries
(both immediate and ultimate), status, sector,
and consideration off ered. Completed and par-
tially completed deals were included, as well as
intended and pending deals announced after
September 1, 2009. When no deals were recorded
for any country and year, the dependent variable
was coded as zero.
This list of some 10,000 emerging market
acquirer companies was then matched with data
and information on their cross-border financ-
ing activities from the following sources: cross-
border listings provided by major international
cross-listed on the LSE, however, this exchange
is likely to have attracted the largest to tal num-
ber of cross-listings by fi rms based in China.33
Although no Chinese-incorporated firms have
newly listed on the LSE since 2007, more than
half of all new foreign company listings on the
LSE Alternative Investment Market (AIM) in
2008 and two-thirds of such listings in 2009
were by fi rms that have incorporated in off shore
jurisdictions, with many of these firms having
their actual operations base in China and other
developing countries (fi gure 2A.2).
In recent years, in continental Europe,
Euronext al so has been seeking to attract com-
panies from rapidly growing emerging markets
to its four market entry points in Amsterdam,
Brussels, Paris, and Lisbon, and six of the eight
emerging-market firms that have newly listed
on Euronext since 2007 have been domiciled
in China. Th ese Chinese fi rms have been listing
on Euronext to raise their visibility in specifi c

Global Development Horizons 2011 The Changing Global Corporate Landscape 113
year t. The coefficients are allowed to vary by
host-country class (developed markets, DM,
or emerging markets, EM ), so that k = {DM,
EM}. X is the set of home-country characteris-
tics, while Z represents host-country variables.
R contains variables representing the economic
relationship between home and host countries,
such as bilateral investment treaties and bilat-
eral trade. G represents global macroeconomic
variables.34 All specifi cations were estimated by
ordinary least squares. The reported p-values
are computed on the basis of standard errors
that are clustered both in the country and time
dimension to correct for heteroskedasticity
across countries and for serial correlation within
countries. Including these additional variables
resulted in an unbalanced panel of between
21,884 and 34,730 observations, depending on
the specifi cation.
The results are reported in table 2A.3, for
two alternative specifications: a parsimonious
model with variables representing only the major
hypotheses of interest, and a fully specifi ed model
with all variables of interest included. Th e table
shows that fi rms clearly try to exploit diff eren-
tial growth opportunities abroad. The results
are consistent with the first set of hypotheses:
host- country GDP growth as a proxy for further
growth opportunities signifi cantly and positively
infl uences acquisitions in advanced economies. In
this case, the eff ect is twice as large for growth
in host countries as in home countries, where
the eff ect also matters for acquisition activities.
Having attained certain growth rates at home,
which allow fi rms to build up cash reserves for
investment and acquisition purposes, the fi rms
pursue growth opportunities through M&A deals
in the better-performing advanced economies,
thereby explaining the large positive growth coef-
fi cient. Th e size of home GDP as a proxy for eco-
nomic maturity also infl uences acquisition activi-
ties. Interestingly, the eff ect is twice as large for
acquisitions in developed economies as for acqui-
sitions in emerging economies. Only fi rms from
relatively large or mature emerging economies
have the means to pursue expansion in advanced
economies through M&A.
The level of host-country development, as
measured by per capita GDP, negatively aff ects
stock exchanges (New York Stock Exchange,
NASDAQ, London Stock Exchange, Euronext,
Luxembourg Stock Exchange, and Deutsche
Börse); cross-border loan transactions (Dealogic
Loanware); and international bond issues
(Dealogic DCM). Of the emerging-market com-
panies that undertook cross-border M&A deals,
some 1,020 had directly accessed international
capital markets through cross-listings of shares or
DRs (185 companies), borrowing on international
lending markets (809 companies), or bond issues
on international bond markets (310 companies).
The cross-border greenfield investment data
are sourced from the OCO Monitor (now fDi
Markets) database. Our data cover new outbound
FDI projects and expansions of existing FDI proj-
ects by 5,000 companies from the same group
of 61 emerging-market countries, undertaken
between January 2003 and June 2010. Greenfi eld
investment data include historical information on
source and destination countries and on sector for
each investment project. Th e same data sources
also have been used by other researchers, includ-
ing Mattoo and Subramanian (2010).
The definition used for cross-border M&A
covers deals that involve an acquisition of any
equity stake. Th is grouping includes those invest-
ments that resulted in an acquisition of less than
10 percent of a fi rm’s voting shares. Additionally,
both M&A and greenfi eld data include transac-
tions with a target in any of the 35 tax-haven juris-
dictions listed by the Organisation for Economic
Co-operation and Development (OECD 2000).
Th ese tax-haven jurisdictions were the destination
of 2.3 percent of all M&A deals and 1.4 percent
of all greenfi eld projects.
Th e econometric model distinguishes between
deal fl ow to other emerging economies and deal
fl ow to advanced countries by allowing for host
country-specifi c coeffi cients:
Yijt = α + βkXit + γkZjt + δkRijt + ηkGt + εint
Th e dependent variable, Yijt, is the total num-
ber of cross-border M&A deals originating in
country i (“home”), defi ned as a country from
the sample of 61 emerging countries, with tar-
gets in country j (“host”), which is either an
emerging country or an advanced country, in

114 The Changing Global Corporate Landscape Global Development Horizons 2011
TABLE 2A.3 Determinants of cross-border outboun d M&A investments
Emerging to emerging Emerging to advanced
Fully specifi ed Parsimonious Fully specifi ed Parsimonious
Home-country characteristicsGDP per capita –0.325 –0.832 –1.851 –1.066
–0.786 –0.332 –0.267 –0.101
GDP 4.929*** 2.956*** 9.592*** 5.121***
–0.001 –0.003 –0.004 0.000
GDP growth –0.654 –0.426 2.425** 0.829
–0.273 –0.373 –0.016 –0.173
International reserves –2.560*** –1.490*** 2.711** 1.725***
0.000 –0.004 –0.021 0.000
Economic risk rating 1.533** 0.740** –2.664* –0.432
–0.019 –0.044 –0.097 –0.372
Political risk rating –1.114* –0.690 –0.847 –0.272
–0.054 –0.103 –0.179 –0.332
Financial risk rating –0.784 1.676
–0.123 –0.253
Participation in global trade 5.815** 5.431** 2.539 1.947
–0.013 –0.010 –0.369 –0.180
Market capitalization (% GDP) 2.065*** 1.942*** 6.895*** 4.831***
–0.002 0.000 –0.005 –0.003
Domestic credit to private sector
(% GDP)
–0.836 3.558
–0.484 –0.221
Private capital fl ows (% GDP) 0.158 –0.929
–0.677 –0.117
Stocks traded, turnover ratio (%) –0.309 –0.485
–0.166 –0.402
Number of corporate bonds issued –0.853 –5.201
–0.798 –0.444
Sovereign risk rating –9.679 –23.133
–0.201 –0.181
Number of patents per million people –5.045* –2.217
–0.069 –0.339
Host-country characteristicsGDP per capita –2.039*** –2.556*** 0.626 0.527
–0.007 –0.004 –0.275 –0.152
GDP 1.419 3.671* 0.380 0.781*
–0.056 –0.484 –0.067
GDP growth 0.503 –0.093 5.698* 3.653*
–0.566 –0.826 –0.060 –0.059
International reserves 0.648 –0.763** –0.908** –0.844***
–0.572 –0.012 –0.012 –0.010
Economic risk rating 0.133 0.661 2.158 –2.590
–0.886 –0.214 –0.377 –0.101
Political risk rating –0.498* –0.269 2.421*** 1.375***
–0.099 –0.251 –0.003 0.000
Financial risk rating –0.570 –2.161*
–0.233 –0.087

Global Development Horizons 2011 The Changing Global Corporate Landscape 115
effect is statistically and economically highly
signifi cant.35
Th e results also show that a country’s partici-
pation in the global economy, as measured by its
level of foreign currency reserves, also matters
for bilateral M&A fl ows. Specifi cally, high lev-
els of home-country reserves in emerging coun-
tries are positively associated with acquisitions
in advanced countries, but negatively associated
for other emerging countries. A country whose
firms trade with advanced economies tends to
build up foreign reserves faster, and the country’s
companies are more likely to engage in acquisi-
tions in their target markets. Hence, underlying
acquisitions in emerging destination countries
but not in advanced countries (for which the
variable is statistically insignifi cant). Firms only
seek targets in emerging economies that have
not yet attained a certain level of development,
as measured by per capita GDP, and, there-
fore, offer even more growth potential. Taken
together, these fi ndings suggest that emerging-
market multinationals expand abroad through
M&A transactions to exploit growth opportu-
nities that are not present in their home econo-
mies. Trying to escape the confi nes of their home
markets, fi rms seek out fast-growing economies,
especially among the advanced countries. The
TABLE 2A.3 (continued)
Emerging to emerging Emerging to advanced
Fully specifi ed Parsimonious Fully specifi ed Parsimonious
Participation in global trade 2.524** 2.864*** –11.420** –2.237**
–0.02 –0.007 –0.044 –0.045
Market capitalization (% GDP) –0.489 –0.014 1.025* 0.930**
–0.617 –0.980 –0.092 –0.050
Domestic credit to private sector
(% GDP)
1.571 –0.015
–0.285 –0.229
Private capital fl ows (% GDP) 0.104 1.633**
–0.603 –0.040
Stocks traded, turnover ratio (%) –0.910** 3.026***
–0.027 –0.004
Home-host relationship Distance –1.488* –1.602** –1.205 0.301
–0.088 –0.029 –0.460 –0.638
Number of BITs 1.125 0.590 1.063 0.388
–0.126 –0.292 –0.417 –0.556
Bilateral trade (exports + imports) 3.010*** 2.567*** 0.464*** 0.553***
–0.003 –0.005 –0.002 –0.001
Global variablesU.S. 10-year Treasury rate –3.595** –1.189*** 3.942 –2.220
–0.026 –0.005 –0.625
Energy prices –1.192* –0.858*** –0.556 –1.440***
–0.090 0.000 –0.546 –0.008
Agricultural prices 1.740* 1.208* 3.131* –0.066 –0.062 –0.063 –0.068 –0.948
Observations 21,884 34,730 21,884 34,730
R2 0.298 0.280 0.298 0.280
Source: World Bank staff calculations, based on Thomson-Reuters SDC Platinum, World Bank World Development Indicators (WDI), IMF International Financial Statistics (IFS), Bloomberg, Dealogic, Federal Reserve System, International Country Risk Guide, UNCTAD, and World Intellectual Property Organization.Note: Time and country-clustered p -values for standard errors (robust to heteroskedasticity and autocorrelation) are reported in parentheses. The fully specifi ed specifi cation includes only variable families with at least one statistically signifi cant coeffi cient, although an even more comprehensive specifi cation was used for exploratory purposes.* indicates signifi cance at the 10 percent level, ** indicates signifi cance at the 5 percent level, and *** indicates signifi cance at the 1 percent level.

116 The Changing Global Corporate Landscape Global Development Horizons 2011
acquisitive its corporate sector tends to be, espe-
cially in pursuing targets in other emerging coun-
tries. The coefficients for host countries reveal
that trade and FDI in the form of cross-border
M&A may be either substitutes or complements.
In the case of advanced economies, the more the
host country participates in global trade, the
fewer acquisitions from emerging-market fi rms
the country tends to experience. Hence, trade
and acquisitions are substitutes (negative coef-
fi cient), which is in line with the lower barriers
to the movement of goods, services, and capital
in advanced economies. In contrast, trade and
M&A activity seem to be complements in emerg-
ing-host countries where barriers to the fl ow of
goods and services tend to be higher. Hence,
instead of exporting their products, fi rms export
capital by establishing an operational presence in
such countries, which explains the positive asso-
ciation between host trade and acquisitions.
Similarly, one would expect private capital
f lows to be associated with cross-border M&A
activity. However, the results show that the vari-
able is statistically signifi cant only in the equa-
tion for advanced host countries. Th e more capi-
tal inf lows an emerging-market home country
receives, the less likely its fi rms are to engage in
acquisitions in developed economies. Conversely,
the more capital fl ows an advanced host country
receives, the more likely it is to be the target of
M&A activities by emerging-market fi rms. Th is
finding suggests that emerging economies are
either recipients or providers of global capital,
but not both—in contrast to the case in many
advanced economies.
A closely related eff ect is the positive correla-
tion between bilateral trade and M&A f lows.
Trade not only signals the importance of a par-
ticular host country to fi rms in a given emerg-
ing economy but also serves as a stepping-stone
for direct expansion of operations in the future.
Firms exploit the relative expertise and the
international competitive advantage which they
gain through their participation in the global
economy, by seeking more permanent ties with
their trading partners, which the firms either
integrate into their own operations or decide to
serve locally through acquisitions. Th e quickest
avenue for establishing a direct presence in an
trade f lows explain not only the correlation
between reserves and M&A activity but also the
large positive coeffi cient for advanced economies,
whose level of economic exchange generates more
reserves and acquisitions for emerging coun-
tries. At the same time, the orientation of trade
and capital fl ows means that fi rms based in such
countries focus on their operations in advanced
countries to the detriment of acquisitions in other
emerging economies, explaining the negative cor-
relation between reserves and M&A activity in
emerging countries.
Th e more its fi rms participate in global trade
and, especially, in exports, the higher a country’s
foreign reserves, which are typically held in cur-
rencies of major importing countries, tend to be.
At the same time, participation in global trade
leads fi rms, over time, to acquire assets abroad as
the logical consequence of their operations’ inter-
nationalization. Hence, high foreign currency
reserves are positively associated with trade with
major reserve-currency countries. Having gained
experience in international business through for-
eign trade, the next step is for fi rms to establish
a more permanent presence abroad in order to
facilitate corporate growth outside the home base.
As a result, a country experiences the following
positive feedback eff ect: a growing corporate pres-
ence of its fi rms abroad leads to new (intrafi rm)
trade and dividend remittances so that its foreign
reserves rise even further. For acquisitions in other
emerging countries, this pattern does not hold.
As a country’s foreign reserves rise with its matur-
ing economy, with its focus often on export-led
growth, its corporate sector increasingly engages
in M&A in the developed world to the detriment
of other emerging economies, thereby explaining
the negative association between home-country
reserves and acquisitions in other emerging mar-
kets. Th e negative coeffi cient of the host-country
reserves in the advanced host-country equation is
presumably a refl ection of the structural fi nancial
account surplus (current account defi cit) run by
many of the most prominent target economies.
Th e results for a country’s overall participa-
tion in the world economy, as measured by the
country’s ratio of trade (exports plus imports) to
GDP, corroborate this interpretation. Th e higher
a country’s proportion of trade to GDP, the more

Global Development Horizons 2011 The Changing Global Corporate Landscape 117
positively inf luences M&A activity in other
emerging countries but negatively inf luences
M&A activity in advanced economies. When
domestic economic conditions are risky (that is,
if the ICRG index is low), fi rms will try to escape
the vagaries of their home economy by expanding
in developed countries. Th is fi nding is also con-
sistent with the notion that cross-border acquisi-
tions by emerging-market fi rms are partly driven
by geographic diversifi cation considerations. By
investing in advanced economies with deep mar-
kets off ering good corporate growth opportuni-
ties, fi rms can diversify away from their exposure
to economic risks at home, while at the same time
capturing scale economies.
Given that political stability is, in many
respects, a prerequisite for economic and fi nan-
cial development, the absence of political stabil-
ity stimulates cross-border M&A activity because
fi rms strive to reduce their exposure to domestic
risk factors and to diversify away from high lev-
els of risk in their home countries. Consistent
with this interpretation, the positive and sig-
nificant effect of political stability on acquisi-
tions in advanced countries seems to suggest
that fi rms actively seek to lower their political-
risk exposure through their M&A activities in
developed economies. It seems counterintuitive,
therefore, that lower political risk in emerging-
market host economies is also associated with
less cross-border acquisition activity. However,
fi rms in stable emerging economies may see less
need to acquire abroad, especially when growth
opportunities are abundant at home; this likeli-
hood may explain the negative coeffi cient in this
case. Financial development and stability as mea-
sured by the ICRG fi nancial risk index is not a
factor, presumably because the direct measures of
fi nancial development in home and host econo-
mies capture the associated eff ects. All in all, the
findings suggest that political, economic, and
fi nancial development signifi cantly aff ect M&A
activity in other emerging economies but not in
advanced countries. Given the insuffi cient legal
and economic infrastructure in many emerging
countries, such stability is particularly important
for acquisitions in other emerging economies. In
contrast, advanced economies, with their vast
markets and well-developed legal systems, are
export market is therefore through the outright
acquisition of assets in that country. Cross-border
M&A activity therefore tends to increase with
greater bilateral trade, which serves as a proxy for
the importance of the host economy for a home
country’s corporate sector, in addition to the par-
ticipation of a country’s fi rms in the global econ-
omy. To further test this hypothesis, the specifi ca-
tion includes the number of bilateral investment
treaties that a particular home country has signed
with advanced and emerging destination coun-
tries, respectively, although the variable is not sta-
tistically signifi cant. Th us, economic ties such as
trade matter more for cross-border M&A patterns
than do legal ties such as treaties.
Th e fi ndings regarding foreign reserves suggest
that the home country’s fi nancial development
also matters for its corporate sector’s cross-border
acquisitions. In particular, the effects are also
consistent with the notion that foreign acquisi-
tions are positively related to emerging-market
fi rms’ access to funds, for which reserve levels can
also proxy. To further explore this hypothesis,
the specifi cations include measures of stock and
credit market development in acquirers’ home
countries. The results show that, indeed, more
developed home capital markets—which facili-
tate raising the requisite fi nancing, as measured
by the ratio of stock-market capitalization to
GDP—increase deal fl ow both in developed and
emerging host countries. By contrast, the ratio
of private credit to GDP as a measure of credit-
market development is statistically not signifi-
cant. Th e extensive funding in global markets by
emerging-market fi rms later explored in the third
section of this chapter might provide an explana-
tion. Once a fi rm is suffi ciently mature to con-
template expanding abroad through acquisitions,
the fi rm typically also has access to syndicated
loan markets or other forms of global funding.
To test the proposition that an acquirer’s home
economy needs to have attained a certain level of
institutional development before its fi rms start
to engage in cross-border M&A transactions,
the analysis relies on the ICRG (International Country Risk Guide) indexes of political, eco-
nomic, and financial risk. The results in table
2A.4 show that a home country’s economic sta-
bility as measured by the ICRG economic index

118 The Changing Global Corporate Landscape Global Development Horizons 2011
sector, which can lead to the important positive
feedback eff ects further enhancing growth pros-
pects at home.
Finally, technological achievements—as
measured by the number of patents granted to
a particular originating country—do not seem
to have a pronounced impact on M&A, regard-
less of whether the home country is emerg-
ing or advanced. Acquisitions of fi rms located
in advanced economies tend to aim at vertical
integration; that is, the deals involve acquisition
of either upstream or downstream assets. As a
result, firms typically master the technologies
so that innovation activities and the diffusion
of technological advances have little impact on
emerging M&A patterns, thus explaining the
statistical insignifi cance of the patents variable
in the advanced-country equation. In fact, tech-
nological achievement has a negative impact on
acquisitions in emerging markets. Th is fi nding
suggests that firms venture abroad for reasons
other than their technological ability, such as to
gain operational and managerial skills required
to run large, vertically integrated operations on
a global scale.
Notes 1. Th e literature on globalization strategy empha-
sizes the real-option aspects of such staged invest-
ments. Th e initial greenfi eld investment is a
stepping-stone to understanding a local economy.
Assuming demand, technological, geological, and
other uncertainties are positively resolved over
time, follow-up investments then create a perma-
nent presence in the foreign market by extending
the scope and reach of the initial unit. Lukas and
Gilroy (2006) provide theoretical analysis on this
phenomenon, while Brouthers and Dikova (2010)
establish empirical evidence.
2. In member countries of the Organisation for
Economic Co-operation and Development
(OECD), by contrast, the private sector has funded
51 to 63 percent of R&D in each year since the
early 1980s (OECD Stats).
3. “Residents” are broadly defi ned here as businesses,
individuals, universities, and governments.
4. Th e picture is very similar for greenfi eld invest-
ments, with minor variations in the composition
of the top 10 countries.
worthwhile destinations regardless of an origi-
nating country’s level of institutional developTh e
models also include the distance between coun-
tries’ capitals as a proxy for transaction costs,36
as prior research has shown that the quality of an
investor’s or acquirer’s information about a poten-
tial acquisition target decreases as the distance
between the two countries increases, whereas the
costs of communication, coordination, and mon-
itoring all increase with distance. At the same
time, fi rms tend to be more knowledgeable about
the political, legal, and fi nancial environments
of economies in close geographical proximity
to their own. Better information should reduce
the cost of acquiring and operating subsidiaries.
Hence, one would expect that the greater the
physical distance between home and host coun-
try, the less bilateral M&A activity will occur. In
fact, results of the analysis show that acquisition
activity decreases in distance, but only for deal
fl ow to other emerging countries. Th e transac-
tion-cost conjecture is not borne out for advanced
host countries for which the distance variable is
statistically insignifi cant.
Th is fi nding also suggests that emerging-mar-
ket fi rms investing in other emerging markets do
so only in the vicinity of their home base. Th e
diffi culties of acquiring, integrating, and operat-
ing foreign assets in other emerging economies
are such that any additional complications aris-
ing from obstacles to information acquisition or
transmission reduce the attractiveness of acqui-
sitions farther away. In contrast, acquisitions in
advanced economies do not seem to be inf lu-
enced by distance-related eff ects such as informa-
tion or transaction costs. Not only are the legal
and economic environment sufficiently devel-
oped, but managerial expertise also tends to be
related to the operation of complex international
business, and the requisite information is readily
available in advanced markets. All these factors
make it easier to overcome obstacles to acquir-
ing and integrating firms located in advanced
host countries. Taken together, the institutional
and distance-related fi ndings suggest that invest-
ment in economic, legal, and financial infra-
structure—in itself a sign of a rapidly maturing
economy—significantly enhances the interna-
tionalization of an emerging country’s corporate
Global Development Horizons 2011 The Changing Global Corporate Landscape 119
shareholders and on the other hand, you did not
want to lose.” (Leahy 2007)
12. Historically, most M&A investment into LICs has
come from advanced economies. Many relatively
large targets of M&A investment (the Democratic
Republic of the Congo, Ghana, Kenya, Tanzania,
and Uganda) have typically relied on fl ows origi-
nating mostly in the North. In contrast, regional
sources have played a greater role in smaller mar-
kets (such as Malawi, Myanmar, Kyrgyzstan, and
Zimbabwe).
13. Th is shift is documented in more detail in annex
2.2.
14. A total of 352 of the nearly 9,000 emerging-market
fi rms or their affi liates that undertook acquisitions
in the period between 1997 and the fi rst half of
2010 are currently cross-listed on major interna-
tional exchanges in the United States and Europe.
15. Brazil and Korea rank third and fourth, respec-
tively, but the fi nancing was raised by just a few
fi rms in each country’s case.
16. Russia has been the most common domicile coun-
try for fi rms raising fi nancing on the LSE since
1995, with iron and steel manufacturing and min-
ing (a sector in which the LSE has a longstanding
international reputation as a market for raising
fi nance) as the two most popular sectors in which
the fi rms operate.
17. Some $172 billion was raised on China’s exchanges
by Chinese fi rms in the fi rst 10 months of 2010,
up from $100 billion in all of 2008.
18. In 2007, according to the World Federation of
Exchanges, India’s National Stock Exchange was
the second-fastest-growing stock exchange world-
wide, albeit starting from a low base, as it was
established in 1993.
19. Stock exchanges in India and Singapore signed
a memorandum of understanding in 2010 under
which the exchanges will explore future areas for
collaboration including ways to promote cross-
border investment on their exchanges.
20. A number of new and expanded free trade agree-
ments between Asian economies (including India
and China) in recent years point to increased trade
linkages between countries in the region.
21. In October 2010, the Singapore Stock Exchange
(SGX) made an approved bid to acquire the
Australia Securities Exchange (ASX) motivated,
on the part of both exchanges, by a desire to com-
pete against the Hong Kong SAR Stock Exchange,
and based on their mutual intentions to benefi t
from synergies in revenue generation (drawing
on the ASX’s relative strength in bonds and the
5. Unlike the data on the country of origin, the des-
tinations of greenfi eld investments diff er consid-
erably from destinations of M&A transactions.
Given that investments in developing countries
dominate this type of FDI, it is unsurprising to
fi nd that BRIC countries (Brazil, Russia, India,
and China) also are prominent destinations.
Other emerging economies that have attracted a
lot of greenfi eld investments in recent years, as
measured by either value or number of invest-
ments, are the Arab Republic of Egypt, Indonesia,
Kazakhstan, Libya, Malaysia, Nigeria, Saudi
Arabia, Th ailand, Tunisia, Ukraine, and Vietnam.
6. Recent representative deals in this sector include
India’s Bharti Airtel purchasing Zain Africa
from the Kuwait Investment Authority, its larg-
est shareholder; the Russian government buying
a stake in Sistema Shyam TeleServices of India;
and state-owned China Mobile Communications
acquiring Pakistan’s Paktel.
7. In 2010, state-owned Korea National Oil Corp
launched the country’s fi rst cross-border hostile
takeover, of U.K. oil group Dana Petroleum, with
fi nancing provided by fi ve local banks. Similarly,
CNOOC, a state-owned Chinese energy com-
pany, recently purchased 50 percent of Argentina’s
Bridas.
8. For instance, as of July 2010, Chinalco of China
had plans to purchase a 50 percent stake in Rio
Tinto’s Simandou iron ore project in Guinea for
$1.35 billion, while Vale, Brazil’s iron and steel
company, is paying $2.5 billion for 51 percent of
another portion of the same Guinean deposit.
9. By category, the major divergence between green-
fi eld and M&A transactions is the importance
of real estate, which represents 25 percent of the
total value of greenfi eld investments and a neg-
ligible amount of the value of M&A deals. Th e
prominence of the sector is a refl ection of real
estate investments by Middle Eastern and Asian
companies in emerging economies—particularly
in economies in their own regions.
10. Greenfi eld investments by emerging-market fi rms
also occur primarily within the same geographic
region, although most greenfi eld investments go
to other emerging markets.
11. When Tata Steel acquired Dutch steelmaker
Corus in a hotly contested bidding war against
Brazil’s CSN Ratan Tata, the chairman of Tata
group, explained, “We all felt that to lose would
go beyond the group and it would be an issue of
great disappointment in the country. So on the
one hand, you want to do the right thing by your

120 The Changing Global Corporate Landscape Global Development Horizons 2011
generally unwarranted (Estevadeordal, Freund,
and Ornelas 2008).
29. Alternatively, a world where BITs are widespread
may actually be the only politically feasible form
of multilateralism, and a second-best outcome that
is welfare-superior to fi nancial autarky (Ornelas
[2008] makes the analogous case for trade). While
this is certainly a possibility, the discussion here con-
centrates on the economically effi cient fi rst-best out-
come (which may or may not be politically effi cient).
30. Two decades ago, Salacuse (1990) referred to what
was already an “increasingly dense network of
treaty relationships,” albeit, at the time, between
capital-exporting industrial countries and devel-
oping countries. Eff orts to standardize BITs have
largely been unsuccessful.
31. Sauvant (2009) fi nds that countries that revised
their national rules governing inbound FDI in
such a way as to render the overall set of interna-
tional regulations for investment less welcoming
were the destination of some 40 percent of FDI
infl ows worldwide.
32. Th e overall trend of increase in foreign company list-
ings on major exchanges over the past few decades
refl ects advances in trading technology, competi-
tion among exchanges, and companies’ desire to list
on major exchanges to boost international recogni-
tion and fund future M&A transactions.
33. One-third of the 285 foreign fi rms that cross-
listed from 2005 to the second quarter of 2010 on
the LSE’s AIM, a market with less stringent regu-
latory and disclosure requirements for small-cap,
growing companies, were incorporated off shore.
34. To address, albeit in a limited fashion, endogene-
ity concerns, the specifi cation was also performed
with one-period lagged explanatory variables. Th e
results were qualitatively similar for almost all
coeffi cients and are available on request.
35. To assess the fi ndings’ robustness, the model
was also estimated with growth rates for spe-
cifi c sectors rather than GDP, but the results
are not statistically signifi cant and therefore not
tabulated.
36. For country pairs involving dependent territories,
the analysis uses the capital of the territory.
ReferencesAghion, Philippe, Pol Antràs, and Elhanan Helpman.
2007. “Negotiating Free Trade.” Journal of
International Economics 73 (1): 1–30.
SGX’s wide range of derivative products) and to
encourage currently listed fi rms to cross-list on the
partner exchange.
22. Th e German and Indian stock exchanges agreed
in 2008 to simplify access to their exchanges for
companies in their respective markets. Th e links
between the two exchanges were also tightened
via Deutsche Börse’s purchase of 5 percent stakes
in the Bombay Stock Exchange.
23. Th e wider divergence between emerging-market
corporates and euro area corporates in the U.S.
market could in part refl ect the impact of inves-
tor preferences on the composition of borrowers.
If U.S. investors weight return more heavily than
quality compared to European investors, then
U.S. investors may be willing to lend to more risky
companies, albeit at higher spreads.
24. Th e data are collected from a variety of sources
and match the bond issuance by month, quarter,
or year based on the available frequency. Note that
the home country of a bond issuance is defi ned
as the nationality of the issuer’s parents or the
nationality of the guarantor for guaranteed bonds.
25. Th e WGI, constructed by the World Bank
Institute, includes indicators of six dimensions
of governance: voice and accountability, politi-
cal stability and absence of violence, government
eff ectiveness, regulatory quality, rule of law, and
control of corruption. Th e six indicators are mea-
sured in units ranging from about −2.5 to 2.5,
with higher values corresponding to better gover-
nance performance.
26. Cross-border portfolio capital fl ows and banking
fl ows raise other issues not considered here, such
as the long-standing proposal to discourage short-
term speculative fl ows by imposing a “Tobin tax”
and whether capital controls should be imposed in
a crisis situation.
27. In either case, it is clear that negotiating a BIT
with a single country, or a treaty with a similar
format with several countries, is less complicated
than participating in multilateral negotiations.
28. Whether such arrangements enhance or under-
mine multilateralism depends on a host of fac-
tors, including the chosen structure of protection
(Aghion, Antràs, and Helpman 2007; Kemp and
Wan 1976), country asymmetries (Goyal and Joshi
2006; Saggi and Yildiz 2010), multilateral institu-
tional support (Maggi 1999), and political econ-
omy considerations (Ornelas 2005). Th e empirical
evidence fi nds that concerns that preferential lib-
eralization may undermine multilateralism are

Global Development Horizons 2011 The Changing Global Corporate Landscape 121
Hope, Ole-Kristian, Wayne B. Thomas, and
Dushyantkumar Vyas. 2011. “Th e Cost of Pride:
Why Do Firms from Developing Countries Bid
Higher?” Journal of International Business Studies
42 (1): 128–51.
Kemp, Murray C., and Henry Y. Wan Jr. 1976. “An
Elementary Proposition Concerning the Formation
of Customs Unions.” Journal of International
Economics 6 (1): 95–97.
Leahy, Joe. 2007. “Tata Warns Corus Jobs Not
Guaranteed.” Financial Times, Febrauary 2.
Lukas, Elmar, and Bernard Michael Gilroy. 2006. “Th e
Choice between Greenfi eld Investment and Cross-
Border Acquisition: A Real Option Approach.”
Quarterly Review of Economics and Finance 46
(3): 447–65.
Maggi, Giovanni. 1999. “Th e Role of Multilateral
Institutions in International Trade Cooperation.”
American Economic Review 89 (1): 190–214.
Mattoo, Aaditya, and Arvind Subramanian. 2010.
“Crisscrossing Globalization: Th e Phenomenon of
Uphill Skill Flows.” Annual World Bank Conference
on Development Economics 2009, Gobal: People
Politics, and Globalization. Ed. Justin Lin and Boris
Pleskovic. Washington, DC: World Bank.
Metzger, Stanley. 1968. “Private Foreign Investment
and International Organizations.” International
Organization 22 (1): 288–309.
Molinuevo, Martin. 2006. “WTO Disciplines on
Foreign Investment: Wasn’t the GATS about
Trade in Services?” Universidad de Bolonia,
Buenos Aires. http://phase1.nccr-trade.org/
images/stories/ publications/Molinuevo.Tesis%20
UniBo.Wasnt%20the%20GATS%20about%20
trade.pdf.
OECD (Organisation for Co-operation and
Development). 2000. “Towards Global Tax
Co-operation: Report to the 2000 Ministerial
Council Meeting and Recommendations by
the Committee on Fiscal Affairs—Progress
in Identifying and Eliminating Harmful Tax
Practices.” OECD, Paris.
Ornelas, Emanuel. 2005. “Trade Creating Free Trade
Areas and the Undermining of Multilateralism.”
European Economic Review 49 (7): 1717–35.
———. 2008. “Feasible Multilateralism and the Eff ects
of Regionalism,” Journal of International Economics
74 (1): 202–24.
Saggi, Kamal, and Halis Murat Yildiz. 2010.
“Bilateralism, Multilateralism, and the Quest
for Global Free Trade.” Journal of International
Economics 81 (1): 26–37.
Antràs, Pol. 2005. “Incomplete Contracts and the
Product Cycle.” American Economic Review 95 (4):
1054–73.
Berger, Axel, Matthias Busse, Peter Nunnenkamp,
and Martin Roy. 2010. “More Stringent BITs, Less
Ambiguous Eff ects on FDI? Not a Bit!” Working
Paper 1621, Kiel Institute for the World Economy,
Kiel, Germany.
Brouthers, Keith D., and Desislava Dikova. 2010.
“Acquisitions and Real Options: Th e Greenfi eld
Alternative.” Journal of Management Studies 47 (6):
1048–71.
Del Duca, Louis F. 2007. “Developing Global
Transnational Harmonization Procedures for the
Twenty-First Century: Th e Accelerating Pace of
Common and Civil Law Convergence.” Texas
International Law Journal 42 (3): 625–60.
Drabek, Zdenek. 1998. “A Multilateral Agreement
on Investment: Convincing the Skeptics.” WTO
Staff Working Paper, ERAD-98-05, World Trade
Organization, Geneva.
Elkins, Zachary, Andrew T. Guzman, and Beth
Simmons. 2006. “Competing for Capital: Diff usion
of Bilateral Investment Treaties, 1960–2000.”
International Organization 60 (3): 811–46.
Estevadeordal, Antoni, Caroline L. Freund, and
Emanuel Ornelas. 2008. “Does Regionalism
A f fect Trade Libera l i zat ion toward
Nonmembers?” Quarterly Journal of Economics
123 (4): 1531–75.
Frost, Tony S., Julian M. Birkinshaw, and Prescott
C. Ensign. 2002. “Centers of Excellence in
Multinational Corporations.” Strategic Management
Journal 23 (11): 997–1018.
Goyal, Sanjeev, and Sumit Joshi. 2006. “Bilateralism
and Free Trade.” International Economic Review 47
(3): 749–78.
Guzman, Andrew T. 1998. “Why LDCs Sign Treaties
Th at Hurt Th em: Explaining the Popularity of
Lateral Investment Treaties.” Virginia Journal of
International Law 38 (Summer): 639–88.
Hallward-Driemeier, Mary. 2003. “Do Bilateral
Investment Treaties Attract FDI? Only a Bit and
Th ey Could Bite Back.” Working Paper 3121,
World Bank, Washington, DC.
Harrison, Ann, and Jason Scorse. 2010. “Multinationals
and Anti-sweatshop Activism.” American Economic
Review 100 (1): 247–73.
“Havana Charter for an International Trade
Organization.” Final act of the United Nations
Conference on Trade and Employment held at
Havana, Cuba. November 21, 1947–March 24, 1948.
122 The Changing Global Corporate Landscape Global Development Horizons 2011
UNCTAD (United Nations Conference on Trade
and Development). 1998a. Bilateral Investment
Treaties in the Mid-1990s. New York: United
Nations.
———. 1998b. “Existing Regional and Multilateral
Investment Agreements and Th eir Relevance to a
Possible Multilateral Framework on Investment:
Issues and Questions.” United Nations, New York.
———. 2009. World Investment Report: Transnational
Corporations, Agricultural Production, and
Development. Geneva: United Nations.
———. 2010. World Investment Report: Investing in a
Low-Carbon Economy. Geneva: United Nations.
Vernon, Raymond. 1966. “International Investment
and International Trade in the Product Cycle.”
Quarterly Journal of Economics 80 (2): 190–207.
Woolcock, Stephen. 2007. “Multi-level Economic
Diplomacy: Th e Case of Investment.” In Th e New
Economic Diplomacy, ed. Nicholas Bayne and
Stephen Woolcock, 141–61. Aldershot, Hampshire,
U.K.: Ashgate.
World Bank. 2008. Global Economic Prospects 2008:
Technology Diff usion in the Developing World.
Washington, DC: World Bank.
Salacuse, Jeswald W. 1990. “BIT by BIT: Th e Growth
of Bilateral Investment Treaties and Th eir Impact
on Foreign Investment in Developing Countries.”
International Lawyer 24 (3): 655–75.
Salacuse, Jeswald W., and Nicholas P. Sullivan. 2005.
“Do BITS Really Work? An Evaluation of Bilateral
Investment Treaties and their Grand Bargain.”
Harvard International Law Journal 46 (1):68–129.
Sauvant, Karl P. 2009. “Driving and Countervailing
Forces: A Rebalancing of National FDI Policies?”
In Yearbook on International Investment Law and
Policy 2008–2009, ed. Karl P. Sauvant, 215–72.
New York: Oxford University Press.
Stiglitz, Joseph E. 2008. “Regulating Multinational
Corporations: Towards Principles of Cross-Border
Legal Frameworks in a Globalized World Balancing
Rights with Responsibilities” (Th e Ninth Annual
Grotius Lecture). American University International
Law Review 23 (3): 451–558.
U.K. Department for Business, Innovation, and Skills.
2005. R&D Scoreboard. London: U.K. Department
for Business, Innovation, and Skills.
———. 2010. R&D Scoreboard. London: U.K.
Department for Business, Innovation and Skills.


institutional mechanisms to advance interna-
tional cooperation, while reducing the risks
of protectionism, currency wars, and political
confl ict; and third, distributional equity in pro-
moting the particular developmental needs and
objectives of low-income developing countries.
Though all of these elements have long been
intrinsic to international monetary policy making
and discourse, the signifi cance of these elements
has increased in recent years as globalization of
markets and industries has deepened policy link-
ages among countries.
This chapter maps out the implications of
ongoing changes in the dynamics of global
growth and wealth for the future course of inter-
national monetary and fi nancial arrangements.
In anticipating future trends, the chapter focuses
on how and why currencies other than the U.S.
dollar may become international reserve, invoic-
ing, payment, and intervention currencies in the
decades ahead. Although the hurdles that policy
makers and markets must clear for a currency to
gain international status are high, overcoming
such challenges is increasingly within the realm
of possibilities for selected economies in the
emerging world. At present, the euro is a grow-
ing source of international competition to the
U.S. dollar. Among emerging economies, China’s
renminbi is likely to take on a more important
international role in the long term as part of a
multicurrency international currency system,
given the size and dynamism of China’s economy
and the rapid globalization of its corporations
and banks into global trade and fi nance.
Th e main messages of the analysis presented in
this chapter are as follows:
• Looking ahead, the most likely scenario for the international monetary system is a
Global Development Horizons 2011 125
Multipolarity in International Finance
THE M A NNER IN W HICH THE
international monetary system evolves
matters crucially for development policy
and practice. It has direct implications for devel-
oping countries’ access to international capital
and the stability of their currencies. Th e 2008–
09 fi nancial crises exposed some of the structural
weaknesses of the current international monetary
system and underscored the need for reform.
Big issues are on the table, ranging from
capital account convertibility and a choice of
exchange rate regime in major emerging-mar-
ket economies to methods of governance of
the international monetary system, including
the mechanisms for global liquidity creation,
balance-of-payments adjustment, and decisions
regarding the types of international reserve
assets. At the core of these issues is the question of
whether the current international monetary sys-
tem will remain intact with periodic tweaking,
or whether it will be fundamentally overhauled
to accommodate the new realities of multiple
growth centers, the growing role of transnational
actors, and the increasing assertiveness by leading
emerging-market economies on the global stage.
With such transformations in the making, calls
for “cooperative incrementalism” (Cooper 1976),
as were common in the past, may not suffi ce in
addressing the monetary challenges of a multi-
polar world economic order.
As the second decade of the 21st century
unfolds, three fundamental considerations are
emerging as central to the debate on the future
shape of the international monetary system: fi rst,
the system’s capacity to accommodate the grow-
ing economic power and active participation of
leading emerging-market economies, including
a possible global role for their currencies; sec-
ond, the system’s embodiment of the necessary
3

126 Multipolarity in International Finance Global Development Horizons 2011
currencies manage global liquidity consis-
tently with global growth and investment,
that the same countries stabilize their bilat-
eral exchange rates, and that those countries
devise mechanisms for sharing the benefi ts
of international currency status with other
countries. Such benefi ts, including seignior-
age income, lower costs of international bor-
rowing, macroeconomic autonomy, and the
privilege of running current account defi cits
with limited restraint, are potent. Estimates
of seigniorage income for the United States
arising from foreign residents’ holdings of
dollar notes alone have averaged around $15
billion per year since the early 1990s; the
corresponding estimate for the euro area
is in the order of $4 billion per year since
2002. In 2010, the United States is esti-
mated to have benefi ted from a discount in
its borrowing costs of $80 billion as a result
of the dollar’s international status.
• Two opposing forces are affecting interna-tional monetary cooperation: on one hand, the contemporary international political sys-tem has broadened the scope for monetary cooperation across borders; on the other hand, the increasingly diff use global distribution of economic power associated with multipolar-ity will render monetary cooperation more difficult. In contemporary international
politics—in which numerous national
concentrations of power exist but no single
center dominates—the deep connection
between politics and currency arrange-
ments that existed during the Cold War
era has been replaced by an international
monetary system ruled by economic inter-
ests. The prospect of successful interna-
tional policy coordination in a multipolar
world economic order, then, rests on the
argument that economic interdependence
has deepened with globalization, requiring
strengthening of policy linkages. Th e fea-
sibility of policy coordination depends on
governments’ ability to overcome the col-
lective action problems of burden sharing
and system maintenance.
In the years leading up to the 2008–09
financial crisis, the role of international
multicurrency system centered around the U.S. dollar, the euro, and the renminbi. Under that scenario, the dollar would lose
its position as the unquestioned principal
international currency by 2025, making
way for an expanded international role for
the euro and a burgeoning international
role for the renminbi. The probability of
this scenario playing out is buttressed by
the likelihood, as outlined in chapter 1, that
the United States, the euro area, and China
will constitute the three major growth poles
by 2025, providing stimulus to other coun-
tries through trade, fi nance, and technology
channels, and thereby creating interna-
tional demand for the U.S., European, and
Chinese currencies. Th is scenario is contin-
gent upon China and the euro area success-
fully implementing fi nancial and structural
reforms and managing their fiscal and
monetary policies in a way consistent with
the international status of their currencies.
For euro area authorities, the incentive to
undertake such reforms will be the desire
to safeguard the gains of the long-running
single-market project, while China will be
motivated by the need to mitigate the sig-
nifi cant risk of currency mismatch to which
the country is currently exposed, as China’s
transactions with the rest of the world are
denominated predominantly in dollars.
An international monetary regime
anchored to three national currencies may
off er the prospect of greater stability than
does the present dollar-centered system,
through better distribution of lender-of-last-
resort responsibility and better provision of
liquidity during times of distressed market
conditions. In addition, diversifying the
source of foreign exchange reserve supply
may permit developing countries to meet
their reserve accumulation objectives more
easily, making their stocks of reserves less
exposed to the risk of depreciation by any
one of the reserve currencies. A multicur-
rency regime would also have the potential
to command great legitimacy, but only if
certain conditions were satisfi ed—namely,
that countries issuing the main international

Global Development Horizons 2011 Multipolarity in International Finance 127
economic policy making was confi ned to
managing the symptoms of incompatible
macroeconomic policies, such as exchange
rate misalignments and payments imbal-
ances. As capital markets have been lib-
eralized and exchange rates made more
fl exible, balance of payments constraints on
national economies have been considerably
eased, thus shifting policy coordination
toward the more politically sensitive sphere
of domestic monetary and fi scal policies.
Moving forward, countries with globally
inf luential economies must be willing to
accept the fact that their policy actions have
important spillover eff ects on other coun-
tries. Th us, monetary policy initiatives that
emphasize increased collaboration among
central banks to achieve fi nancial stability
and sustainable growth in global liquidity
would be particularly welcome. Agreeing on goals in such areas and communicating
those goals to market participants would
help anchor market expectations, reduce
speculative capital movements, and bring
about greater stability of exchange rates—
the latter as the natural outcome, rather
than the intermediate target, of enhanced
international coordination.
• The majority of developing countries, par-ticularly the poorest countries, will continue to use foreign currencies to carry out trans-actions with the rest of the world, and thus will remain exposed to exchange rate fl uctua-tions in a multicurrency international mon-etary system. A multipolar global economy
will not eliminate currency f luctuations,
which disproportionately aff ect low-income
countries with limited hedging possibili-
ties. In fact, in the absence of coordinated
efforts on behalf of the leading-currency
economies, exchange rate movements may
intensify, potentially leaving developing
countries no better off than they are at
present and continuing the great dispar-
ity between developing countries’ growing
strength in international trade and fi nance
and their lack of infl uence in international
monetary aff airs. Alliance with one of the
leading-currency countries, via a currency
peg or a monetary union, may reduce the
risk for developing countries, however.
In a best-case scenario, the evolving mul-
ticurrency regime would put into place
mechanisms for limiting currency volatility
through increased central bank coordina-
tion and the creation of instruments that
facilitate hedging—for instance, through
enhanced central bank swaps and the
development of private markets for special
drawing rights (SDRs). It is also impor-
tant that the gains from international cur-
rency use be shared across countries of all
income levels and that the adjustment of
payments imbalances be made more even-
handed—that is, that such adjustments not
fall mainly on the poorest countries, which
are forced to conduct international transac-
tions in currencies other than their own.
International Currency UseFor a national currency to serve an international
role, the currency must garner demand beyond
its own borders. Th e demand for an international
currency, in turn, is related to its ability to sat-
isfy the role of an international money with low
transaction costs, while maintaining the confi -
dence of private and official users in its value.
A key property of fi nancial markets is that the
more the currency is used, the lower the transac-
tion costs and the greater the liquidity associated
with that currency become. Th us, there is a posi-
tive externality that tends to produce equilibria
with only one or a few currencies in widespread
international use (Hartmann 1998). Moreover,
this externality can produce multiple equilibria,
in which the circumstances of history lead to one
currency being dominant for a number of years
or decades (as the pound sterling was from 1860
to 1914), after which a triggering event may lead
to a shift to another currency playing a domi-
nant role (as the dollar has done from 1920 to
the present). Th e property that currency use is
reinforcing is more generally the property of net-
works in which there are economies of scale, and
this property has been termed “network external-
ities” (Kiyotaki and Wright 1989). Th is property
also helps to explain the continuing international

128 Multipolarity in International Finance Global Development Horizons 2011
of world trade (and by implication, of world
output).1 Th e fi rst and third factors are easy to
measure, but the second factor is not, although
market status is potentially no less important
in determining whether a currency becomes an
international currency.2 Furthermore, the fact
that infl ation and trade tend to infl uence inter-
national currency use is by no means a new phe-
nomenon; box 3.1 tracks those connections over
more than 2,000 years.
From the perspective of an individual or entity
holding an international asset, the attractive-
ness of a currency depends on both its ability to
retain its value in terms of other currencies and
its purchasing power. In addition, an interna-
tional currency must be usable in the sense that
offi cial or privately held balances are easily con-
vertible into other currencies through a variety
of financial instruments with low transaction
costs. Economic size is also linked to the devel-
opment of international currencies, for at least
two reasons. First, having a large economy gives
a country market power and allows that country
to denominate its trade in its own currency, forc-
ing foreigners to absorb the impact of currency
fl uctuations; second, a large economy typically
enhances the breadth and depth of domestic
financial markets. Thus, the various economic
factors are interdependent and reinforcing. By
some accounts, wider political considerations
(including military alliances and security) also
play a role in determining international demand
for a currency.
Measuring the importance of international currencies
At the present, the U.S. dollar remains the
world’s dominant currency. But since 2000,
the euro has taken on a growing role in various
international fi nance settings, most prominently
as an issuing currency in global credit and debt
markets (figure 3.1). The euro also represents
an increasing proportion of the world’s foreign
exchange reserves (table 3.1) and more fre-
quently serves as a vehicle currency for foreign
exchange transactions than in the past (fi gure
3.2). Global Development Finance 2006 (World
use of the British pound even after the relative
decline of the United Kingdom in the world
economy: once a currency is widely used, it
retains incumbency advantages that make it hard
to displace.
International currency use parallels the
domestic functions of money as the numéraire
for establishing prices, serving as a means of
payment, and providing a store of value (Cohen
1970; Kenen 1983). An international currency
serves to invoice imports and exports, to anchor
the exchange rate of currencies pegged to it, to
eff ectuate cross-border payments, and to denom-
inate international assets and liabilities (offi cial
foreign exchange reserves, private claims, and
sovereign debt). In addition, just as domestic
money serves as an alternative to bartering, an
international currency can serve as a “vehicle
currency” for trading between pairs of currencies
for which the liquidity of the bilateral market is
limited. Such uses are reinforcing, because cur-
rencies used for pricing are also likely to serve as
means of payment.
Th e supply of international currencies is infl u-
enced by the actions of governments to allow
international use and to provide the institutional
and policy underpinnings that encourage the
development of fi nancial markets and produce
macroeconomic stability (Tavlas 1991). Without
the existence of markets in various financial
instruments and a reasonable amount of inves-
tor confi dence in accessing them, the currency’s
usefulness in the international realm is limited.
But if those underpinnings exist, the supply of
international currencies can be considered to be
close to perfectly elastic: demand can be satisfi ed
through facilities off ered by banks and by issu-
ance of domestic and foreign securities denomi-
nated in the currency. Conversely, attempts to
stimulate international use of a particular cur-
rency will be unsuccessful in the absence of
demand.
Several factors are correlated with the like-
lihood that a currency will become an inter-
national currency. In general, international
currencies are issued by countries that have (1)
low and stable inf lation; (2) open, deep, and
broad financial markets; and (3) a large share

Global Development Horizons 2011 Multipolarity in International Finance 129
Historical records indicate that the silver drachma,
issued by ancient Athens in the fi fth century B.C.E. was
likely the fi rst currency that circulated widely outside its
issuing state’s borders, followed by the gold aureus and
silver denarius coins issued by Rome, even though the
Athenian and Roman currencies circulated simultane-
ously for some time (see fi gure B3.1.1). The dominance
of the Roman-issued coins was brought to an end as
the long cycle of infl ation that characterized the econ-
omy of the Roman Empire from the fi rst century C.E.
through the early fourth century led to a continuous
devaluation of the Roman-issued currency, causing it to
become increasingly less accepted outside the Roman
Empire. Ultimately, the aureus became valued accord-
ing to its weight rather than its imputed “face value,”
trading more as a commodity than a currency outside
the Roman Empire and making way for the Byzantine
Empire’s heavy gold solidus coin to become the domi-
nant currency in international trade in the sixth century.
By the seventh century, the Arabian dinar had partially
replaced the solidus in this role, although the solidus
continued to circulate internationally at a debased value
(refl ecting the high fi nancing needs of the Byzantine
Empire) into the 11th century. Large fi scal costs also led
to a gradual devaluation of the Arabian dinar starting at
the end of the 10th century.
By the 13th century, the fiorino, issued by
Florence, was widely used in the Mediterranean
region for commercial transactions, only to be sup-
planted by the ducato of Venice in the 15th century.
In the 17th and 18th centuries, the dominant inter-
national currency was issued by the Netherlands,
reflecting that country’s role as a leading financial
and commercial power at the time. At that point,
paper bills began replacing coins as the international
currency of circulation, even though they were not
backed by the Dutch government or any other entity
under sole sovereign control.
It was only when national central banks and trea-
suries began holding gold as reserves, beginning in
the 19th century, that bills and interest-bearing deposit
claims that could be substituted for gold also began to
be held as reserves. This development coincided with
the rise of Great Britain as the leading exporter of man-
ufactured goods and services and the largest importer
of food and industrial raw materials. Between the early
1860s and the outbreak of World War I in 1914, some
60 percent of the world’s trade was invoiced in British
pounds sterling.
As U.K. banks expanded their overseas business,
propelled by innovations in communications technology
such as the telegraph, the British pound was increas-
ingly used as a currency of denomination for commer-
cial transactions between non-U.K. residents—that is,
the pound sterling became a more international cur-
rency. This role for the pound was further enhanced
BOX 3.1 Historically, one national currency has played a global role—or at most, a few national currencies
(continued)
FIGURE B3.1.1 Historical Timeline of Dominant International Currencies
Source: Classical Numismatic Group, Inc., http://www.engcoms.com.
dollar(United States)
|
||gulden
(Netherlands)
|solidus
(Byzantium)
aureus(Rome)
|1st c. (BCE)
–4th c.4th–
12th c.17th–18th c.
20th c.
fiorino(Florence)
|13th–
15th c.
real de a ochoor Spanish
dollar (Spain)
|18th–19th c.
19th–20th c.
pound(BritishEmpire)

130 Multipolarity in International Finance Global Development Horizons 2011
by London’s emergence as the world’s leading shipper
and insurer of traded goods and as a center for orga-
nized commodities markets, as well as by the growing
amount of British foreign investment, of which a large
share was in the form of long-term securities denomi-
nated in pounds sterling.
At the beginning of the 20th century, however,
the composition of foreign exchange holdings by the
world’s monetary authorities began to shift, as ster-
ling’s share declined and the shares of the French
franc and the German mark increased. The beginning
of World War I in 1914 is widely viewed as signaling the
end of Great Britain’s leading role in the international
economy and the breakdown of economic interdepen-
dence. Despite attempts to revive the gold exchange
standard after World War I and to restore an interna-
tional monetary order based on fi xed exchange rates,
the restored system lasted only a few years.
The U.S. dollar’s use internationally as a unit of
account and means of payment increased during the
interwar period, particularly during the 1920s, refl ecting
the growing role of the U.S. economy in international
trade and finance. Although gold was officially the
reserve asset (and the anchor) of the international mon-
etary system following World War II, under the Bretton
Woods system of fixed exchange rates, the dollar
took on the mantle of dominant international reserve
currency. By the early 1970s, however, following the
breakdown of the system because of its inherent Triffi n
dilemma, the major economies moved to implement
fl oating exchange rates.
During the 1980s, the global economy showed indi-
cations that it was moving to a multicurrency system in
which the Deutsche mark was taking on an expanded
role as a key currency, both in Europe and globally. This
was due to a combination of factors—low and stable
German infl ation; credible government policies; deep,
broad, and open financial markets; and a relatively
high share of differentiated manufactured exports in
Germany’s trade. The introduction of the euro in 1999
and its adoption by a growing number of EU countries
in the intervening years has only revived the debate
about the dollar’s future role as the dominant interna-
tional currency.
BOX 3.1 (continued)
a. Banks’ international assets
0
10
20
30
40
50
60
70
80
90
100
1999
2000
2001
2002
2003
2004
2005
2006
2007
2008
2009
June
2010
1999
2000
2001
2002
2003
2004
2005
2006
2007
2008
2009
June
2010
perc
en
t
pound sterling Swiss franc euro yen U.S. dollar others
b. International bonds outstanding
0
10
20
30
40
50
60
70
80
90
100
perc
en
t
FIGURE 3.1 Currency denominations of banks’ international assets and international bonds outstanding, by percentage, 1999–2010
Source: World Bank staff calculations, based on Bank for International Settlements (BIS) Banking Statistics and BIS Securities Statistics.
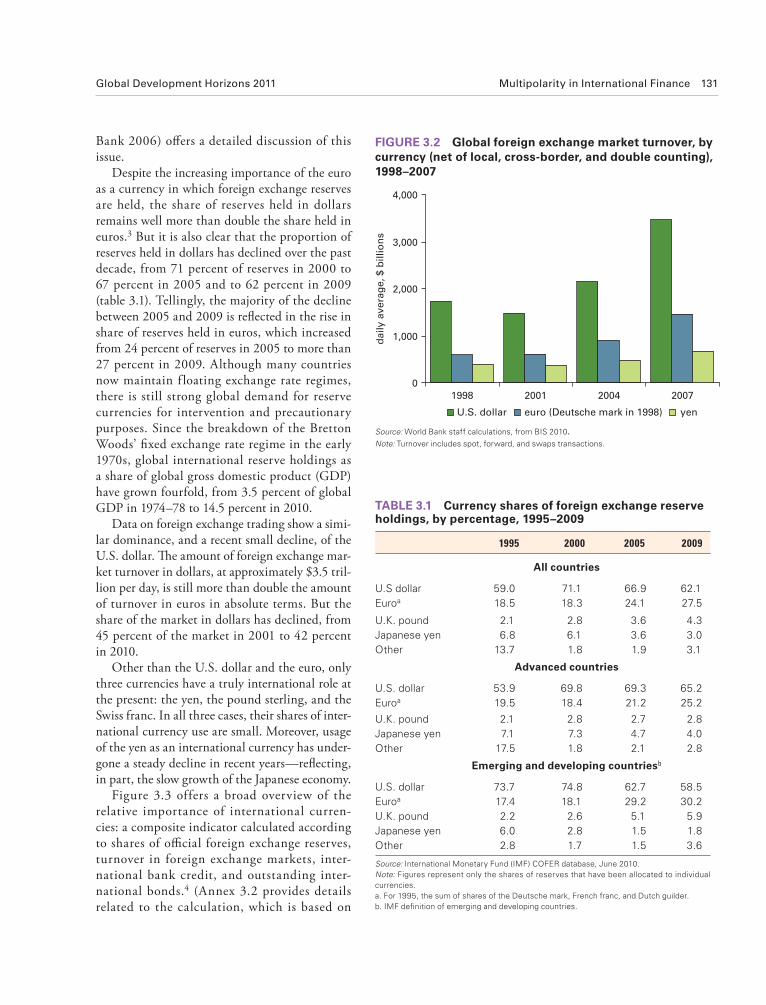
Global Development Horizons 2011 Multipolarity in International Finance 131
Bank 2006) off ers a detailed discussion of this
issue.
Despite the increasing importance of the euro
as a currency in which foreign exchange reserves
are held, the share of reserves held in dollars
remains well more than double the share held in
euros.3 But it is also clear that the proportion of
reserves held in dollars has declined over the past
decade, from 71 percent of reserves in 2000 to
67 percent in 2005 and to 62 percent in 2009
(table 3.1). Tellingly, the majority of the decline
between 2005 and 2009 is refl ected in the rise in
share of reserves held in euros, which increased
from 24 percent of reserves in 2005 to more than
27 percent in 2009. Although many countries
now maintain f loating exchange rate regimes,
there is still strong global demand for reserve
currencies for intervention and precautionary
purposes. Since the breakdown of the Bretton
Woods’ fi xed exchange rate regime in the early
1970s, global international reserve holdings as
a share of global gross domestic product (GDP)
have grown fourfold, from 3.5 percent of global
GDP in 1974–78 to 14.5 percent in 2010.
Data on foreign exchange trading show a simi-
lar dominance, and a recent small decline, of the
U.S. dollar. Th e amount of foreign exchange mar-
ket turnover in dollars, at approximately $3.5 tril-
lion per day, is still more than double the amount
of turnover in euros in absolute terms. But the
share of the market in dollars has declined, from
45 percent of the market in 2001 to 42 percent
in 2010.
Oth er than the U.S. dollar and the euro, only
three currencies have a truly international role at
the present: the yen, the pound sterling, and the
Swiss franc. In all three cases, their shares of inter-
national currency use are small. Moreover, usage
of the yen as an international currency has under-
gone a steady decline in recent years—refl ecting,
in part, the slow growth of the Japanese economy.
Figure 3.3 offers a broad overview of the
relative importance of international curren-
cies: a composite indicator calculated according
to shares of offi cial foreign exchange reserves,
turnover in foreign exchange markets, inter-
national bank credit, and outstanding inter-
national bonds.4 (Annex 3.2 provides details
related to the calculation, which is based on
0
1,000
2,000
3,000
4,000
1998 2001 2004 2007
daily a
vera
ge, $ b
illio
ns
U.S. dollar euro (Deutsche mark in 1998) yen
FI GURE 3.2 Global foreign exchange market turnover, by currency (net of local, cross-border, and double counting), 1998–2007
Source: World Bank staff calculations, from BIS 2010.
Note: Turnover includes spot, forward, and swaps transactions.
TABLE 3.1 Currency shares of foreign exchange reserve holdings, by percentage, 1995–2009
1995 2000 2005 2009
All countries
U.S dollar 59.0 71.1 66.9 62.1
Euroa 18.5 18.3 24.1 27.5
U.K. pound 2.1 2.8 3.6 4.3
Japanese yen 6.8 6.1 3.6 3.0
Other 13.7 1.8 1.9 3.1
Advanced countries
U.S. dollar 53.9 69.8 69.3 65.2
Euroa 19.5 18.4 21.2 25.2
U.K. pound 2.1 2.8 2.7 2.8
Japanese yen 7.1 7.3 4.7 4.0
Other 17.5 1.8 2.1 2.8
Emerging and developing countriesb
U.S. dollar 73.7 74.8 62.7 58.5
Euroa 17.4 18.1 29.2 30.2
U.K. pound 2.2 2.6 5.1 5.9
Japanese yen 6.0 2.8 1.5 1.8
Other 2.8 1.7 1.5 3.6
Source: International Monetary Fund (IMF) COFER database, June 2010.Note: Figures represent only the shares of reserves that have been allocated to individual currencies. a. For 1995, the sum of shares of the Deutsche mark, French franc, and Dutch guilder.b. IMF defi nition of emerging and developing countries.

132 Multipolarity in International Finance Global Development Horizons 2011
analysis confi rm that trend growth of global trade
and capital fl ows in excess of global GDP growth
has a diff erent eff ect on the four major interna-
tional currencies (the same currencies included in
the SDR basket). In particular, demand for M2
in the euro area appears to be positively aff ected
by trade and capital fl ows, whereas demand for
M2 in Japan appears to be negatively aff ected by
trade.
The global currency role of emerging-market economies lags their shares of trade and economic activity
Consi derable inertia exists in international cur-
rency use. It is thus not surprising that changes
in the shares of reserve currencies lag behind
changes in countries’ shares of international trade
and world output. Nevertheless, the disparity
between currency use and countries’ importance
in trade and output is substantial. Figure 3.4,
which shows the percentages of global foreign
exchange reserves and turnover accounted for by
the currencies of eight major industrial and devel-
oping countries, demonstrates this proposition
powerfully. Despite the fact that the global share
of U.S. exports is currently less than the global
share of exports from China, whose currency
essentially has no international role, the U.S.
dollar scores much higher in measures of both
reserves and turnover.
Even though the shares of turnover accounted
for by several emerging-market currencies—the
Brazilian real, the Indian rupee, the Korean
won, and the Russian ruble—have grown in
recent years, their roles in global currency mar-
kets remain extremely limited. In assessing the
prospects for internationalization of leading
emerging-market currencies, in addition to the
general factors explaining international currency
use discussed above, one also needs to consider
each government’s own policy stance and strat-
egy in promoting the international use of its
currency.
With a few exceptions, such as Japan in 1999
under its “Internationalization of the Yen for the
21st Century” plan, governments have not tra-
ditionally pursued deliberate policies to foster
0
10
20
30
40
50
60
70
1999 2000 2001 2002 2003 2004 2005 2006 2007 2008 2009
perc
en
t sh
are
yen pound sterling Swiss francU.S. dollar euro
FIGURE 3.3 Composite indicator of international currency shares, 1999–2009
Source: World Bank staff calculations, based on BIS security statistics and IMF International Financial Statistics (IFS) database.
principal components analysis.5) Th e composite
indicator shows an increase in the euro’s impor-
tance by about 10 percent since its creation,
the counterpart to a 6 percent decline for the
dollar and a 5 percent decline for the yen. Th e
pound sterling rose slightly over the same time
period. Th e composite indicator also confi rms
the minor roles of the pound sterling, yen, and
Swiss franc.
Another approach to gauging trends in global
currency use is based on the idea that the vari-
ous international uses of individual currencies
contribute to global currency demand, where
currency demand includes both domestic and
international use.6 Conventional money demand
equations (for real money balances) capture
domestic money demand by including explana-
tory variables such as domestic real GDP and
interest rates. International transactions taking
the form of exports and capital fl ows, however,
may add to that demand for money. By including
measures that drive global international transac-
tions, one should be able to gauge demand for
international currency use, regardless of whether
the increased money balances are held by domes-
tic or foreign residents. Th is is further discussed
in annex 3.1, which applies such an approach to
demand for M2 in G-20 countries. Results of the

Global Development Horizons 2011 Multipolarity in International Finance 133
Moving to a Multicurrency International Monetary SystemThe U.S. dollar remains the preeminent inter-
national currency, as the British pound was
before the U.S. dollar, for several main reasons:
the size of the U.S. economy, the global inf lu-
ence of U.S. monetary policy, the breadth and
depth of U.S. fi nancial markets (table 3.2), and
the fact that oil and other major commodities are
priced in dollars on international markets. U.S.
monetary policy has set the tone for global mon-
etary conditions for most of the postwar era—at
times, driving large, rapid fl ows of capital into or
out of the United States. U.S. markets are also
extremely liquid, meaning that assets can be
sold with low transaction costs and liquidated in
emergencies with little penalty. For such reasons,
assets denominated in dollars, particularly U.S.
Treasury securities, have for decades been viewed
as safe by international investors.
The ability to issue a currency that is used
internationally confers obvious benefits to the
issuing country. In particular, since the dollar is
a pure fi at currency—that is, its nominal value
results from the fiat of the government rather
than from being backed by a particular amount
a global role for their currencies.7 Th e Japanese
experience is illuminating. Despite growing
capital transactions between Japan and other
East Asian countries and the yen’s infl uence on
the exchange rate policies in the region, the yen
has become less internationalized over the past
decade. In fact, the dollar remains the most used
currency in East Asia. Part of the explanation
for why the international use of the yen remains
muted in relation to Japan’s economic size resides
with the behavior of Japanese manufacturing
fi rms, which have been reluctant to make full use
of the yen so that they can avoid currency risks,
preferring in many cases to use the same currency
as their competitors for transactions—the U.S.
dollar. Ito et al. (2010) fi nd that Japan’s produc-
tion networks in East Asia have reinforced U.S.
dollar invoicing of Japanese exports to other East
Asian countries in large part because of country-
specific foreign exchange regulations in those
countries. Th e experience of Japan suggests that
governments acting alone face great obstacles in
promoting international use of their currencies,
and that expanding the international role of a
currency is likely to require enhanced regional
cooperation, such as agreements concerning
invoicing and settlement.
a. Trade share
UnitedStates
euro area
India
UK
Japan
Brazil
ChinaIndia RussianFederation
0
10
20
30
40
50
60
70
0 3 6 9 12 15
glo
bal cu
rren
cy s
hare
, %
reserves turnover
% of world exports
b. Economic size
UnitedStates
UKJapan
Brazil
India
0
10
20
30
40
50
60
70
0 5 10 15 20 25 30
glo
bal
curr
en
cy s
hare
, %
% of world GDP
euro area
RussianFederation
RussianFederation
ChinaChina
FIGURE 3.4 Global currency shares relative to trade share and economic size
Sources: World Bank staff calculations, using data from IMF Direction of Trade Statistics, IMF Currency Composition of Offi cial Foreign Exchange Reserves, Bank for International Settlements, and World Bank World Development Indicators.

134 Multipolarity in International Finance Global Development Horizons 2011
ability of issuers of international currencies to
avoid the painful adjustment of macroeconomic
policies in response to balance of payments defi -
cits. But this advantage also carries costs, since
allowing fi nancial imbalances to build up may
also sow the seeds of a more serious crisis down
the road.
Over time, the ease and security involved with
investing in U.S. markets has led the rest of the
world to take on massive levels of fi nancial expo-
sure to the United States: the value of foreign resi-
dents’ investments in U.S. companies, real estate,
capital markets, and government debt was nearly
half of non–U.S. global GDP as of end-2008 (fi g-
ure 3.5). Changes in U.S. monetary policy thus
have a direct wealth impact on foreign residents,
of gold or other assets—the acquisition of dol-
lar currency is, in eff ect, an interest-free loan to
the U.S. government. In addition, because for-
eign governments acquire interest-earning U.S.
dollar assets in the form of reserves, they lower
the interest rate faced by U.S. borrowers. A care-
ful analysis of these two advantages to the issu-
ers of an international currency (the U.S. dollar
and the euro) suggests that the advantages are
non-negligible, but not enormous. In recent
years, the seigniorage revenue of the United
States from having an international currency has
totaled roughly $90 billion per year (since 2007),
and approximately $20 billion for the euro area
(box 3.2). An additional potential advantage,
though much more diffi cult to quantify, is the
TABLE 3.2 Importance of selected national fi nancial markets
Stock markets Capital markets
Growth pole country/region
Market capitalization (2009)Capital market
turnovera
Value traded (12-month
cumulative)
Domestic debt securities, amount
outstandingb
International bonds, amounts
outstandingc
$ billions RankCapitalization as % of GDP % Rank $ billions Rank $ billions $ billions
Euro area — — — — — — — — —
United States 15,077 1 106.8 348.6 1 46,736 1 24,978 6,675
China 5,008 2 107.9 229.6 3 8,956 2 1,478 52
Russian Federation 861 14 69.8 108.5 18 683 15 51 136
United Kingdom 2,796 4 128.4 146.4 6 3,403 4 1,194 2,853
Japan 3,378 3 66.6 128.8 11 4,193 3 9,764 364
Brazil 1,167 12 73.0 73.9 32 649 16 787 151
Canada 1,681 7 125.1 92.4 22 1,240 10 952 590
Australia 1,258 10 126.5 78.8 30 762 14 901 523
India 1,179 11 91.4 119.3 12 1,089 11 652 44
Korea, Rep. 836 15 99.5 237.6 2 1,582 6 1,141 125
Turkey 226 27 36.6 141.7 8 244 24 225 52
Mexico 341 20 38.8 26.9 53 77 31 394 103
Poland 135 33 31.1 49.5 41 56 35 190 55
Saudi Arabia 319 21 81.3 119.3 13 337 21 — 13
Argentina 49 >40 16.0 5.4 72 3 >40 57 50
Indonesia 178 31 32.7 83.3 23 115 28 105 35
Norway 227 26 59.2 140.3 9 248 23 — 180
Switzerland 1,071 13 216.8 82.3 25 796 13 255 428
Malaysia 256 25 132.4 32.9 49 73 32 203 37
Sources: World Bank staff calculations, Bank for International Settlements, and Global Stock Markets Fact book, Standard & Poor’s. Notes: — = not available.a. Ratios for each market are calculated by dividing total 2009 US$ value traded by average US$ market capitalization for 2008 and 2009.b. Bonds, medium-term notes, commercial paper, treasury bills, and other short-term notes issued by residents in local currency on local market as of March 2010.c. Issues of international bonds and notes in foreign markets and foreign currency based on nationality of issuer as of June 2010.

Global Development Horizons 2011 Multipolarity in International Finance 135
Economies that have currencies with international
status—at present, mainly the United States and the
euro area—have the benefi t of deriving income from
that status. In particular, the circulation of an issuer’s
currency abroad provides seigniorage to the issuer,
while at the same time demand for reserve assets by
foreigners lowers the interest costs for the country’s
borrowers. Estimates of the value of these benefi ts
are shown in fi gure B3.2.1. Other benefi ts that are not
quantifi ed here include the lower uncertainty resulting
from being able to price exports and imports, and to
hold assets and liabilities, in the domestic currency.
The value of seigniorage to the United States can
be calculated as the savings from the Federal Reserve
holding non-interest-bearing currency (instead of
interest-bearing securities) on the liability side of its
balance sheet, less the cost of maintaining the cur-
rency in circulation (Goldberg 2010). Detailed data on
the composition of the debt securities portfolio held by
the Federal Reserve show that the average maturity of
debt securities was about three years in the period pre-
ceding the crisis, rising to about fi ve years since 2009.
Applying the corresponding U.S. Treasury yields to
the stock of U.S. currency held abroad (64 percent of
the total), one can conclude that since 1990, U.S. sei-
gniorage income derived from the dollar’s international
currency status has averaged $15 billion per year ($12
billion for 2010).
Another benefi t derived from the international sta-
tus of the dollar is the lower cost of capital enjoyed
by borrowers in the United States as a consequence
of foreign demand for dollar assets. A recent study by
McKinsey & Company estimates the advantage that
results from foreign offi cial purchases of U.S. Treasury
securities at 50 to 60 basis points (Dobbs et al. 2009).
Applying the lower end of this range to the stock of
U.S. interest-bearing liabilities with the rest of the
world, the annual cost of capital advantage accrued to
U.S. borrowers between 1990 and 2010 is estimated to
be $33 billion ($81 billion for 2010).
Similarly calculated, the seigniorage gains from the
international status of the euro averaged $4 billion per
year for the euro area from 2000 to 2009. Just as in the
U.S. case, seigniorage income for the euro area was
lower in 2010 due to the fall in interest rates, amount-
ing to $2.3 billion in 2010. For these calculations, cen-
tral banks in the euro area are assumed to hold bonds
with an average maturity of three years, and 20 percent
of the stock of euro currency is estimated to circulate
outside the euro area (ECB 2010). The annual cost of
capital advantage for the euro area averaged $9 billion
from 2000 to 2009.
BOX 3.2 Benefi ts from currency internationalization
FIGURE B3.2.1 Gains from the international status of currency
Sources: World Bank staff calculations, based on data from Bloomberg, the Board of Governors of the Federal Reserve System, and the European Central Bank.
a. United States, 1990–2010
0
10
20
30
40
50
60
70
80
90
100
1990 1992 1994 1996 1998 2000 2002 2004 2006 2008 2010
$ b
illio
ns
seigniorage revenue cost of capital advantage seigniorage revenue cost of capital advantage
b. Euro area, 2000–09
0
5
10
15
20
25
2000 2001 2002 2003 2004 2005 2006 2007 2008 2009
$ b
illio
ns
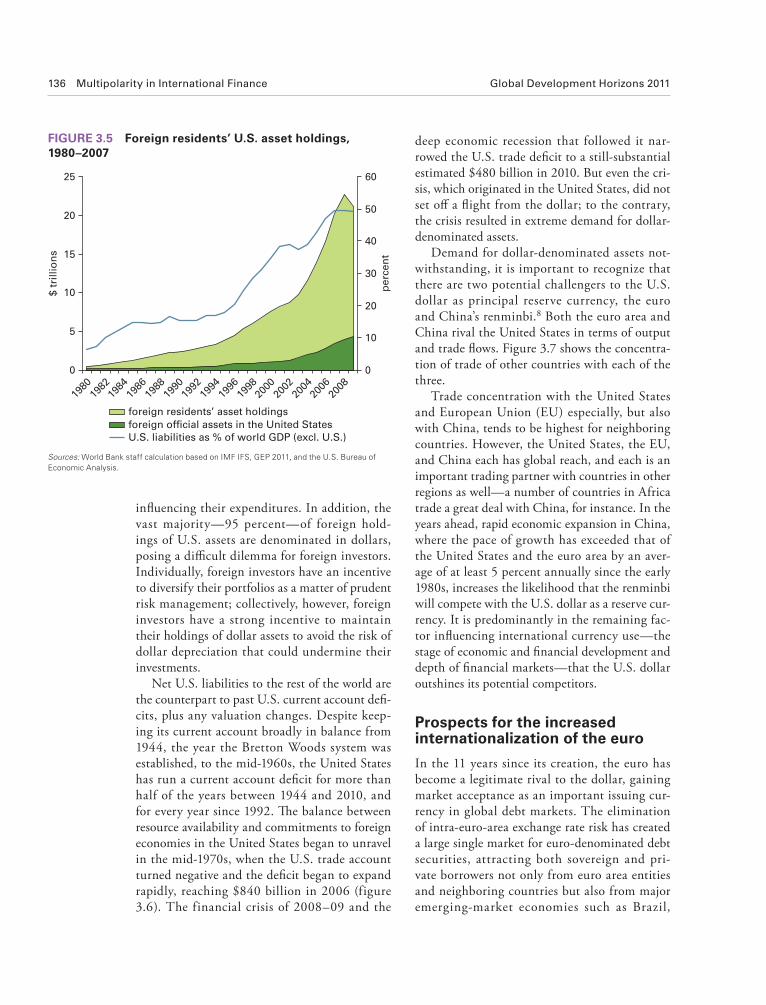
136 Multipolarity in International Finance Global Development Horizons 2011
deep economic recession that followed it nar-
rowed the U.S. trade defi cit to a still-substantial
estimated $480 billion in 2010. But even the cri-
sis, which originated in the United States, did not
set off a fl ight from the dollar; to the contrary,
the crisis resulted in extreme demand for dollar-
denominated assets.
Demand for dollar-denominated assets not-
withstanding, it is important to recognize that
there are two potential challengers to the U.S.
dollar as principal reserve currency, the euro
and China’s renminbi.8 Both the euro area and
China rival the United States in terms of output
and trade fl ows. Figure 3.7 shows the concentra-
tion of trade of other countries with each of the
three.
Trade concentration with the United States
and European Union (EU) especially, but also
with China, tends to be highest for neighboring
countries. However, the United States, the EU,
and China each has global reach, and each is an
important trading partner with countries in other
regions as well—a number of countries in Africa
trade a great deal with China, for instance. In the
years ahead, rapid economic expansion in China,
where the pace of growth has exceeded that of
the United States and the euro area by an aver-
age of at least 5 percent annually since the early
1980s, increases the likelihood that the renminbi
will compete with the U.S. dollar as a reserve cur-
rency. It is predominantly in the remaining fac-
tor infl uencing international currency use—the
stage of economic and fi nancial development and
depth of fi nancial markets—that the U.S. dollar
outshines its potential competitors.
Prospects for the increased internationalization of the euro
In the 11 years since its creation, the euro has
become a legitimate rival to the dollar, gaining
market acceptance as an important issuing cur-
rency in global debt markets. The elimination
of intra-euro-area exchange rate risk has created
a large single market for euro-denominated debt
securities, attracting both sovereign and pri-
vate borrowers not only from euro area entities
and neighboring countries but also from major
emerging-market economies such as Brazil,
infl uencing their expenditures. In addition, the
vast majority—95 percent—of foreign hold-
ings of U.S. assets are denominated in dollars,
posing a diffi cult dilemma for foreign investors.
Individually, foreign investors have an incentive
to diversify their portfolios as a matter of prudent
risk management; collectively, however, foreign
investors have a strong incentive to maintain
their holdings of dollar assets to avoid the risk of
dollar depreciation that could undermine their
investments.
Net U.S. liabilities to the rest of the world are
the counterpart to past U.S. current account defi -
cits, plus any valuation changes. Despite keep-
ing its current account broadly in balance from
1944, the year the Bretton Woods system was
established, to the mid-1960s, the United States
has run a current account defi cit for more than
half of the years between 1944 and 2010, and
for every year since 1992. Th e balance between
resource availability and commitments to foreign
economies in the United States began to unravel
in the mid-1970s, when the U.S. trade account
turned negative and the defi cit began to expand
rapidly, reaching $840 billion in 2006 (figure
3.6). The financial crisis of 2008–09 and the
FIGURE 3.5 Foreign residents’ U.S. asset holdings, 1980–2007
0
5
10
15
20
25
1980
1982
1984
1986
1988
1990
1992
1994
1996
1998
2000
2002
2004
2006
2008
$ t
rillio
ns
0
10
20
30
40
50
60
perc
en
t
foreign residents’ asset holdings foreign official assets in the United StatesU.S. liabilities as % of world GDP (excl. U.S.)
Sources: World Bank staff calculation based on IMF IFS, GEP 2011, and the U.S. Bureau of Economic Analysis.

Global Development Horizons 2011 Multipolarity in International Finance 137
dollar market. Although the governments of indi-
vidual countries within the euro area collectively
issue a large volume of debt, no single issuer is
nearly as large as the U.S. Treasury—an obstacle
to the increased internationalization of the euro
that has been exacerbated by the global fi nancial
crisis of 2008–09.
One of the most serious follow-on eff ects of
the fi nancial crisis has been rising sovereign debt
China, Colombia, Mexico, and Turkey. Such has
been the growth of the euro-denominated bond
market that it now rivals dollar-denominated
fi xed income markets in size, depth, and product
range. And the euro’s investor base is still expand-
ing. As of end-June 2010, outstanding interna-
tional bonds and notes issued in euros amounted
to $11.1 trillion, or 45 percent of the global total
(table 3.3), compared to $10.2 trillion for the U.S.
a. U.S. merchandise trade account and income fromasssets held abroad, five-year averages, 1946–90
–150
–100
–50
0
50
100
150
46–5
0
51–5
5
56–6
0
61–6
5
66–7
0
71–7
5
76–8
0
81–8
5
86–9
0
$ b
illio
ns
b. U.S. merchandise trade account and income fromasssets held abroad, 1991–2008
–1000
–800
–600
–400
–200
0
200
400
600
800
1000
1991
1993
1995
1997
1999
2001
2003
2005
2007
$ b
illio
ns
goods trade investment income
c. U.S. overseas private investment, foreign aid, andmilitary expenditure, five-year averages, 1946–90
–20
0
20
40
60
80
100
120
140
160
46–5
0
51–5
5
56–6
0
61–6
5
66–7
0
71–7
5
76–8
0
81–8
5
86–9
0
$ b
illio
ns
overseas military spending foreign aidoverseas investment and credit
d. U.S. overseas private investment, foreign aid, andmilitary expenditure, 1991–2008
–900
–600
–300
0
300
600
900
1200
1500
1991
1993
1995
1997
1999
2001
2003
2005
2007
$ b
illio
ns
overseas military spending foreign aidoverseas credit overseas investment
FIGURE 3.6 U.S. balance of payments, 1946–2008
Sources: World Bank staff calculations, from U.S. Department of Commerce (Bureau of Economic Analysis), USAID Greenbook, and Cambridge University (Historical Statistics of the United States).
Note: Overseas military spending data before 1960 represent net military transactions. Foreign aid data represent the years 1991–2007.

China
> 2010–205–10< 5No dataHighlight country
FIGURE 3.7 The geographic distribution of trade concentration relative to China, the European Union, and the United States, 2005–09 period average
Sources: World Bank staff calculation based on IMF Direction of Trade and the World Bank WDI database.
Note: The trade concentration of country i relative to country or area j is calculated as
( )ij
i
e xport of i to j im ports of i from jTC
Total trade
+= × 100,
where j = {China, European Union, U.S.}, and i = all other trade partner countries.
United States
> 2010–205–10< 5No dataHighlight country
European Union
> 2010–205–10< 5No dataHighlight country

Global Development Horizons 2011 Multipolarity in International Finance 139
EFSF is much smaller than the outstanding
amount of euro area government debt (about
€5.4 trillion as of mid-2010). As of early 2011, it
seemed likely that European governments would
be reluctant to draw on the bailout fund at all
(Reuters 2010),9 instead treating the fund as a last
resort, as Ireland did in November 2010. While
a European summit in March 2011 boosted the
eff ective lending capacity of the EFSF, the sum-
mit did not allow for the facility’s purchase of
government debt on secondary markets, as some
had called for, leaving the ECB to continue in
that role. In addition, the moral hazard created
by bailouts of heavily indebted governments may
well off set or reverse any favorable eff ect on the
euro’s international use. Th e ongoing process of
overall European integration, however, eventu-
ally may lead to reforms that reduce moral hazard
and enhance the attractiveness of the euro with
respect to the dollar.
Prospects for the internationalization of the renminbi
Starting from a modest base, the renminbi’s
international role is poised to grow in the future,
with prospects for internationalization depen-
dent on how aggressively Chinese authorities
pursue policy shifts promoting development of
local capital markets and how quickly currency
convertibility on the capital account is imple-
mented. In some respects, China already satisfi es
concerns in several European countries, which
have called into question the architecture sup-
porting the single currency and have highlighted
the need for greater coordination of fi scal policy
(Bénassy-Quéré and Boone 2010). Th e crisis has
led the EU to take steps considered extraordi-
nary, such as intervening in secondary markets
through the European Central Bank’s (ECB’s)
Securities Market Program to purchase the gov-
ernment debt of the troubled countries and estab-
lishing the European Financial Stability Facility
(EFSF), which provides country-level guaran-
tee commitments intended to temporarily assist
countries with budgetary needs and support the
financial stability of the euro area as a whole.
Such eff orts are contrary to the spirit, if not the
letter, of ECB statutes, which prohibit bailouts of
governments. Subject to conditions to be negoti-
ated with the European Commission, the EFSF
was crafted with the capacity to issue bonds guar-
anteed by euro area members for up to €440 bil-
lion for on-lending to euro area member states in
diffi culty. Th e available amounts under the EFSF
were intended to be complemented by those of
the European Financial Stability Mechanism
(EFSM) and of the International Monetary Fund
(IMF).
Together, the EFSF (which is to be wound
down in 2013) and the EFSM could create a
more liquid market for euro-denominated pub-
lic debt across a range of maturities, which in
turn may increase the attractiveness of the euro
as an international currency. But the size of the
TABLE 3.3 International debt securities outstanding, by currency, 1999–2010$ trillions
1999 2000 2001 2002 2003 2004 2005 2006 2007 2008 2009 2010 (June)
U.S. dollar 2.6 3.3 3.9 4.3 4.7 5.1 5.6 6.7 7.9 8.6 9.8 10.2
Euro 1.6 1.9 2.4 3.5 5.1 6.5 6.6 8.7 11.0 11.4 12.8 11.1
Yen 0.5 0.5 0.5 0.5 0.5 0.5 0.5 0.5 0.6 0.8 0.7 0.7
Pound sterling 0.4 0.5 0.6 0.7 0.9 1.1 1.2 1.6 1.9 1.9 2.2 2.1
Swiss franc 0.1 0.1 0.1 0.2 0.2 0.2 0.2 0.3 0.3 0.4 0.4 0.4
Others 0.2 0.2 0.2 0.2 0.3 0.5 0.6 0.7 1.0 0.9 1.1 1.1
Total 5.3 6.3 7.4 9.0 11.4 13.5 14.1 17.7 21.7 23.0 25.9 24.5
US$ as % of total 49.6 51.4 52.1 47.2 41.3 37.8 39.7 37.7 36.4 37.4 37.6 41.6
Euro as % of total 29.8 30.6 32.6 38.3 44.8 48.4 46.9 48.9 50.7 49.6 49.5 45.4
Source: Bank for International Settlements.

140 Multipolarity in International Finance Global Development Horizons 2011
Limitations in financial markets also curb use
of the renminbi as an international currency.
Domestic bond markets, except those for bonds
issued by governments and state-owned enter-
prises (SOEs), are still underdeveloped. China’s
banking system remains under the control of
the state, with deposit rates regulated adminis-
tratively and banks required to set their lending
rates within certain margins.
Although the capital market constraints to
the renminbi’s internationalization are undeni-
able, recent initiatives by Chinese authorities to
actively promote the international use of the ren-
minbi are beginning to have an eff ect. Th e envis-
aged strategy of “managed internationalization”
(McCauley 2011) involves actions on two fronts:
(1) development of an off shore renminbi market
and (2) encouraging the use of renminbi in trade
invoicing and settlement. Actions taken thus
far seem to suggest that the authorities’ initial
focus is at the regional level, starting with pro-
moting the renminbi’s role in cross-border trade
between China and its neighbors. To that end,
China began a pilot arrangement of cross-border
settlement of current account transactions in ren-
minbi in July 2009, focusing on the Association
of Southeast Asian Nations countries plus Hong
the underlying trade and macroeconomic criteria
required for its currency take on an international
role: a dominant role in world trade, a diversifi ed
merchandise trade pattern, and a macroeconomic
framework geared to low and stable inf lation.
From a historical perspective, China’s current
position in global manufacturing exports is simi-
lar to that of the United States in the interwar
period10, when the U.K. lead in manufacturing
exports was steadily eroding (figure 3.8). On
the remaining criterion—open, deep, and broad
fi nancial markets—the renminbi falls far short,
however.
Restrictions on currency convertibility in
China are one avenue by which the attractiveness
of the renminbi as an international currency is
constrained. Although the renminbi is convert-
ible for current account transactions (that is, for
payments for goods and services), capital infl ows
and outfl ows are subject to a wide range of restric-
tions. Renminbi balances acquired by foreigners
(for instance, through the operation of subsidiar-
ies located in China) or held by Chinese residents
may be freely changed into foreign currencies and
moved out of the country. But non-Chinese enti-
ties are restricted from freely acquiring Chinese
assets in exchange for their foreign currencies.
a. United States and United Kingdom, 1906–29
0
5
10
15
20
25
30
35
1906–1910 1913 1926–1929
perc
en
t
United States United Kingdom
b. China, 2000–09
0
5
10
15
20
25
30
35
2000 2005 2009p
erc
en
t
China
FIGURE 3.8 Share of global manufacturing exports
Sources: Hilgerdt 19 45; World Bank WDI database.
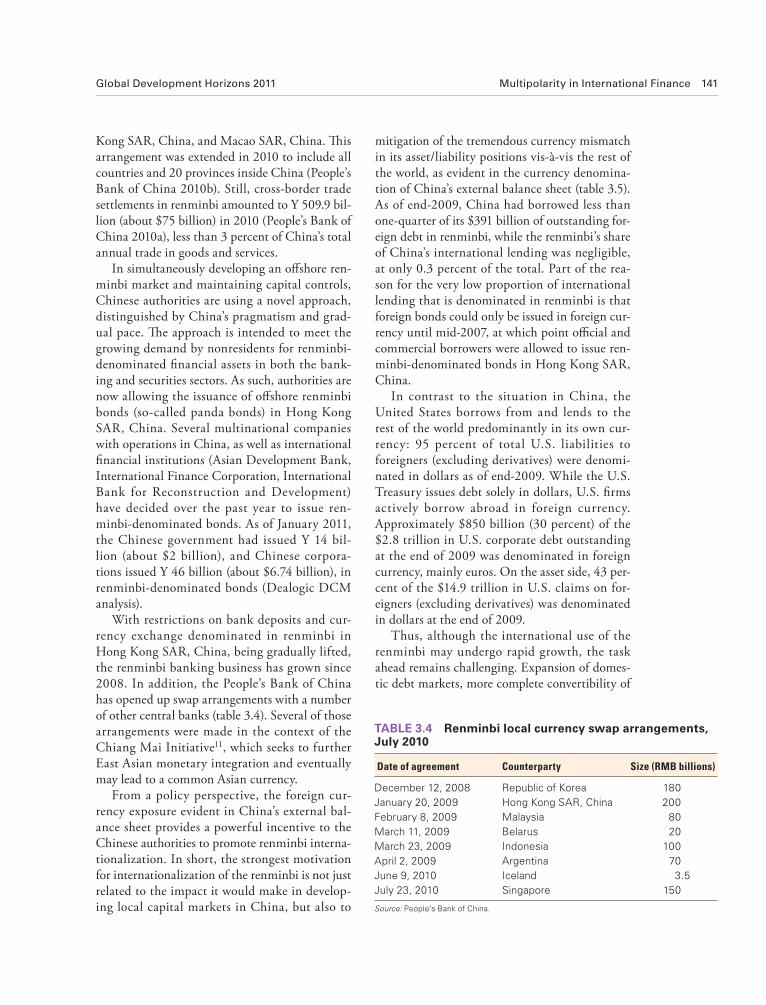
Global Development Horizons 2011 Multipolarity in International Finance 141
mitigation of the tremendous currency mismatch
in its asset/liability positions vis-à-vis the rest of
the world, as evident in the currency denomina-
tion of China’s external balance sheet (table 3.5).
As of end-2009, China had borrowed less than
one-quarter of its $391 billion of outstanding for-
eign debt in renminbi, while the renminbi’s share
of China’s international lending was negligible,
at only 0.3 percent of the total. Part of the rea-
son for the very low proportion of international
lending that is denominated in renminbi is that
foreign bonds could only be issued in foreign cur-
rency until mid-2007, at which point offi cial and
commercial borrowers were allowed to issue ren-
minbi-denominated bonds in Hong Kong SAR,
China.
In contrast to the situation in China, the
United States borrows from and lends to the
rest of the world predominantly in its own cur-
rency: 95 percent of total U.S. liabilities to
foreigners (excluding derivatives) were denomi-
nated in dollars as of end-2009. While the U.S.
Treasury issues debt solely in dollars, U.S. fi rms
actively borrow abroad in foreign currency.
Approximately $850 billion (30 percent) of the
$2.8 trillion in U.S. corporate debt outstanding
at the end of 2009 was denominated in foreign
currency, mainly euros. On the asset side, 43 per-
cent of the $14.9 trillion in U.S. claims on for-
eigners (excluding derivatives) was denominated
in dollars at the end of 2009.
Thus, although the international use of the
renminbi may undergo rapid growth, the task
ahead remains challenging. Expansion of domes-
tic debt markets, more complete convertibility of
Kong SAR, China, and Macao SAR, China. Th is
arrangement was extended in 2010 to include all
countries and 20 provinces inside China (People’s
Bank of China 2010b). Still, cross-border trade
settlements in renminbi amounted to Y 509.9 bil-
lion (about $75 billion) in 2010 (People’s Bank of
China 2010a), less than 3 percent of China’s total
annual trade in goods and services.
In simultaneously developing an off shore ren-
minbi market and maintaining capital controls,
Chinese authorities are using a novel approach,
distinguished by China’s pragmatism and grad-
ual pace. Th e approach is intended to meet the
growing demand by nonresidents for renminbi-
denominated fi nancial assets in both the bank-
ing and securities sectors. As such, authorities are
now allowing the issuance of off shore renminbi
bonds (so-called panda bonds) in Hong Kong
SAR, China. Several multinational companies
with operations in China, as well as international
fi nancial institutions (Asian Development Bank,
International Finance Corporation, International
Bank for Reconstruction and Development)
have decided over the past year to issue ren-
minbi-denominated bonds. As of January 2011,
the Chinese government had issued Y 14 bil-
lion (about $2 billion), and Chinese corpora-
tions issued Y 46 billion (about $6.74 billion), in
renminbi-denominated bonds (Dealogic DCM
analysis).
With restrictions on bank deposits and cur-
rency exchange denominated in renminbi in
Hong Kong SAR, China, being gradually lifted,
the renminbi banking business has grown since
2008. In addition, the People’s Bank of China
has opened up swap arrangements with a number
of other central banks (table 3.4). Several of those
arrangements were made in the context of the
Chiang Mai Initiative11, which seeks to further
East Asian monetary integration and eventually
may lead to a common Asian currency.
From a policy perspective, the foreign cur-
rency exposure evident in China’s external bal-
ance sheet provides a powerful incentive to the
Chinese authorities to promote renminbi interna-
tionalization. In short, the strongest motivation
for internationalization of the renminbi is not just
related to the impact it would make in develop-
ing local capital markets in China, but also to
TABLE 3.4 Renminbi local currency swap arrangements, July 2010
Date of agreement Counterparty Size (RMB billions)
December 12, 2008 Republic of Korea 180
January 20, 2009 Hong Kong SAR, China 200
February 8, 2009 Malaysia 80
March 11, 2009 Belarus 20
March 23, 2009 Indonesia 100
April 2, 2009 Argentina 70
June 9, 2010 Iceland 3.5
July 23, 2010 Singapore 150
Source: People’s Bank of China.

142 Multipolarity in International Finance Global Development Horizons 2011
in the decades ahead and in which there will be
an important shift in the distribution of global
wealth, international monetary relations will need
to accommodate an expanding role for major cur-
rencies other than the U.S. dollar (Dailami and
Masson 2010).
Th e decade leading up to the global fi nancial
crisis of 2008–09 was associated with a major
expansion in financial holdings and wealth in
emerging markets. Following a downturn dur-
ing the crisis, the upward trend is expected to
continue through the forecast horizon of this
book (box 3.3), bringing about changes in rela-
tive fi nancial power. Th e expansion of fi nancial
holdings and wealth in emerging markets is most
prominently refl ected on the offi cial side, in the
accumulation of foreign exchange reserves by
monetary authorities.12 High levels of reserve
holdings have, in turn, induced a buildup of
assets held in sovereign wealth funds (SWFs)13
and other state-controlled portfolios such as pen-
sion funds and fi nancial holdings of SOEs.
Informed by the analytical work on changing
growth poles and growth dynamics in chapter 1
and the previous discussion on international cur-
rency use and international policy coordination,
this book envisions three possible international
the renminbi, reinforced fi nancial sector supervi-
sion, a more transparent framework for monetary
policy, and increased fl exibility of the renminbi
are needed to make the renminbi an attractive
international (not just regional) currency. But
such reforms are far reaching and are likely to
take considerable time to complete. Furthermore,
even if such conditions were satisfi ed, network
externalities suggest that the renminbi would not
assume the role of international currency quickly.
Prospects for the renminbi also depend on the
direction of East Asian monetary integration—
namely, whether it leads to a regional currency
that will begin to replace national currencies,
including the renminbi.
The Shape of Things to Come: Some Scenarios for a Future International Monetary SystemOf the various aspects of contemporary interna-
tional economic relations, it is in the monetary
arena that the shift toward multipolarity is likely
to have the strongest impact. In the unfolding
multipolar order, in which several developing
countries will attain global growth pole status
TABLE 3.5 Currency denominations of the external balance sheets of the United States and China, end-2009$ trillions
United States China
Liabilities Assets Liabilities Assets
Debt & deposits 12.61 6.43 Debt & deposits 0.391 0.59
of which: in USD 11.75 5.54 of which: in CNY 0.09b 0.01c
FDI and portfolio equity 5.12 8.03 FDI and portfolio equity 1.17 0.28d
of which: in USD 5.12 0.86 of which: in CNY 1.17 —
International reserves 0.4 International reserves 2.45
of which: in USD — of which: in CNY —
Derivatives 3.38 3.51 Other 0.07 0.14
Total 21.12 18.38 Total 1.64 3.46
of which: in USDa 16.87 6.39 of which: in CNY 1.26 0.01
Share in USDa 95.1% 43.0% Share in CNY 76.9% 0.3%
Sources: World Bank staff calculations based on data from the Board of Governors of the Federal Reserve System, U.S. Bureau of Economic Analysis, U.S. Department of the Treasury, and IMF IFS. China State Administration of Foreign Exchange; government of Hong Kong SAR, China; BIS banking statistics; Dealogic DCM analysis.a. Excluding derivatives.b. An estimated $90 billion of China’s foreign debt was denominated in renminbi at end-2009 (about 5 percent of total foreign liabilities).c. Renminbi bank deposits outstanding in Hong Kong SAR, China, end-2009, which increased to about $42 billion at end-2010.d. Assuming that all of China’s foreign direct investment and portfolio equity outfl ows are in foreign currencies.

Global Development Horizons 2011 Multipolarity in International Finance 143
Years of structural reforms and improved macroeco-
nomic performance combined with capital market liber-
alization have resulted in a signifi cant improvement in
the external fi nancial position of developing countries,
with both the private and offi cial sectors now holding
large amounts of overseas assets and investments. In
1999, developed countries’ foreign exchange reserves
represented approximately $1.1 trillion (62 percent) of
the $1.8 trillion of global foreign exchange reserves and
developing countries’ reserves the remaining 38 per-
cent. One decade later, these proportions had reversed:
developing and emerging economies held approximately
$5.4 trillion (66 percent) of the total global reserve stock
of $8.1 trillion as of end-2010. At the same time, over-
seas asset accumulation by private fi rms in emerging
markets expanded dramatically, as evidenced by large
increases in cross-border mergers and acquisitions and
greenfi eld investments (see chapter 2).
This trend of rising wealth in the emerging mar-
kets is expected to continue through to the end of
the 2025 forecast horizon of this book. The base-
line scenario presented in chapter 1 suggests that
emerging economies are expected to accumulate
substantial international investment positions (see
fi gure B3.3.1), led by China (increasing from about 35
percent to 61 percent of GDP from 2009 to 2025), as
well as Middle Eastern and East Asian economies.
Malaysia and Singapore, for example, are expected
to hold net foreign assets in excess of 100 percent
of their GDP (with the United States, as the primary
debtor, expected to hold a net international invest-
ment position of −69 percent of GDP in 2025). Even
if policy rebalancing limits the widening of interna-
tional investment positions, the same qualitative con-
clusion will remain: The difference in emerging-mar-
ket net international investment positions between
the baseline and rebalancing scenarios is only about
$1.6 trillion in 2009 dollars (4.8 percent of emerging-
market GDP), or a modest slowdown in their pace of
asset accumulation.
BOX 3.3 The changing external fi nancial position of developing countries
FIGURE B3.3.1 Evolution o f net international investment positions, advanced and emerging economies, 2004–25
Sources: IMF IFS database and World Bank staff calculations.
Note: Developed countries included in the scenarios illustrated above are Australia, Canada, the euro area, Japan, Norway, Sweden, Switzerland, the United Kingdom, and the United States. Emerging countries and regions included in the scenarios are Argentina, Brazil, China, the Czech Republic, India, Indonesia, the Republic of Korea, Malaysia, the Mashreq economies, Mexico, Poland, the Russian Federation, Singapore, South Africa, Thailand, Turkey, Ukraine, and the República Bolivariana de Venezuela. Net international investment positions calculations assume constant asset prices in U.S. dollars, and a constant capital account/GDP ratio, and are depicted in constant 2004 prices relative to the basket of OECD exports.
a. Percentage of GDP
–25
–15
–5
50
15
25
35
45
55
2004 2007 2010 2013 2016 2019 2022 2025
% G
DP
b. U.S. dollars
–12
–8
–4
0
4
8
12
2004 2007 2010 2013 2016 2019 2022 2025
$ t
rillio
ns
emerging(baseline)
emerging(imbalances)
emerging(rebalancing)
advanced(baseline)
advanced(rebalancing)
advanced (imbalances)
emerging(baseline)
emerging(imbalances)
emerging(rebalancing)
advanced(baseline)
advanced(rebalancing)
advanced (imbalances)

144 Multipolarity in International Finance Global Development Horizons 2011
Under this scenario, the evolution of the
U.S. economy is assumed to follow that
outlined in the baseline scenario of chap-
ter 1, where the United States is successful
in gradually improving its fi scal position
in the medium and long run (current pro-
jections by the U.S. Congressional Budget
Office [CBO] place fiscal deficits at −9.8
percent in 2011, compared to the −8.2 per-
cent in the baseline scenario considered
here)15 and achieving a sustainable current
account balance (figure 3.9, panel a). In
this case, even with the multipolar world
of 2025, the output forecasts in chapter
1 point to the world’s largest economy
remaining that of the United States (in
real terms); this trend, along with inertia in
currency use, would be major justifi cations
behind the persistence of the dollar stan-
dard status quo.
• Multipolar international currencies. Th e dol-
lar loses its position as the dominant inter-
national currency at some point between
2011 and 2025, to be replaced by a global
system with three roughly equally impor-
tant currencies: the dollar, the euro, and an
currency scenarios. In each of the three scenarios,
it is assumed that the major currencies will con-
tinue to fl oat against each other (while allowing
for some degree of intervention) and that capital
accounts will continue to gradually liberalize.
Th e three scenarios are as follows:
• Dollar standard status quo. Th e U.S. dol-
lar retains its position as the dominant
international currency, at least until the
end of the forecast horizon of 2025. Th is
scenario is the result of a combination of
factors, including success by the United
States in curbing unsustainable fi scal def-
icits and a delay by China and the euro
area in making the reforms necessary to
expand the international use of their cur-
rencies.14 This scenario is reinforced by
the presence of considerable inertia with
regard to reserve currency switching and
continued broad political economy fac-
tors supportive of the use of the currency
of the predominant geopolitical and mili-
tary power—that is, the United States
(Drezner 2010; Eichengreen 2011; Posen
2008).
multipolar reserves(continued external imbalances)
CBO baseline dollar standard(sustainableexternalimbalances)
a. U.S. fiscal balances, 2011–25
–9
–8
–7
–6
–5
–4
–3
–2
–1
0
1
2011 2013 2015 2017 2019 2021 2023 2025
% G
DP
b. Global shares of GDP, 2005
euro area
United States
China
others
FIGURE 3.9 Implied U.S. fi scal balances and global economic sizes, dollar standard and multipolar currencies scenarios
Sources: World Bank staff calculations; CBO 2011.
Note: U.S. fi scal balance paths assume that only fi scal balances adjust to bring about current account changes, so that other elements that affect the current account (offi cial fl ows, net foreign assets, and net oil exports) do not deviate from their 2015 levels from 2016 onward. The chart for economic sizes in the dollar standard scenario is very similar to the multipolar currency scenario and, hence, omitted.

Global Development Horizons 2011 Multipolarity in International Finance 145
candidate to fi ll the role of such a reserve
currency (Stiglitz and Greenwald 2010), a
new monetary unit comprising a smaller
set of constituent currencies (or a redefi ni-
tion of the SDR) is another possibility, as
is a currency whose value is not defined
in terms of a basket of national currencies
but, rather, is issued by the equivalent of a
global central bank.
This scenario is consistent with the
analysis of increased policy coordination
discussed below, where it is argued that a
marked strengthening of multilateralism is
the necessary counterpart to increased eco-
nomic globalization. Th e international mon-
etary system thus would move away from
the “nonsystem” that has characterized the
global economy since 1973 and toward a
new system involving the management of a
multilateral, world currency.
Each of the three potential currency scenarios
presents policy challenges, and the three are not
equally likely. Under the dollar standard status quo scenario, the world would continue to exhibit
some of the features that contributed to the non-
system of the postwar era: inadequate incentives
for the reserve currency country to adjust, leading
to a skewed pattern of global demand, and inci-
dence of acute dollar shortage, as was experienced
during the recent crisis. The likelihood of this
scenario would derive as much from the draw-
backs of other currencies as from success by the
United States in addressing its policy challenges.
But the fundamental causes of global imbalances
would remain, meaning that the risks of fi nancial
crisis would persist.
Given current trends, the multipolar inter-national currencies scenario is the most likely to
play out, and could constitute a more stable and
symmetric global economic environment than
the fi rst scenario. However, this scenario, too,
would embody risks. Th e danger exists that the
existence of currency blocs might boost regional
integration at the expense of multilateral liber-
alization.16 In fact, during the postwar period,
trade within major regional groupings has
grown considerably faster than trade between
Asian currency. If current eff orts to inter-
nationalize the renminbi continue apace, it
will become the dominant Asian currency.
Financial markets in China would need to
expand in a manner supportive of an inter-
national currency, and successful efforts
would need to be made to broaden the
convertibility of the renminbi and access
to renminbi-denominated assets. Together,
these eff orts would allow China to elevate
its international monetary status to be on
a par with the country’s weight in global
trade and economic output. Th e multipo-
lar international currency scenario assumes
that the euro area successfully puts the
sovereign debt crisis to rest by instituting
meaningful reforms that strengthen eco-
nomic governance.
Th e likelihood of this second scenario
playing out is buttressed by the prob-
ability, as outlined in chapter 1, that the
United States, the euro area, and China
remain the major three growth poles in
2025—thus diminishing the possibil-
ity that the Swiss franc and pound ster-
ling expand beyond their currently small
roles in the international currency envi-
ronment. The expected GDP shares of
the largest three economies over 2011–25
lend additional credence to this tripo-
lar reserve scenario (fi gure 3.9, panel b).
Slow progress in fi scal adjustment in the
United States, which is consistent with the
continued imbalances scenario outlined
in chapter 1, also contributes to the likeli-
hood of this scenario.
• A single multilateral reserve currency. Here,
a single multilateral reserve currency, man-
aged jointly rather than by a single national
central bank, is at the center of the inter-
national currency system. Such an outcome
would result from the recognition that the
lower volatility aff orded by a multilateral
currency outweighs the potential costs
of policy coordination necessary to man-
age the reserve currency, or the diffi culty
of achieving that coordination. While the
current SDR would be the most likely

146 Multipolarity in International Finance Global Development Horizons 2011
The need for enhanced policy coordination in an increasingly multipolar world
Th e three scenarios for the future of the interna-
tional monetary system presented in this chapter
can help focus the attention of policy makers on
potential long-run outcomes and the type of inter-
national policy coordination responses that are
desirable in order to prevent negative spillovers
between countries that may result from major
shocks to the global economy. At the current
juncture of high uncertainty about medium-term
global growth prospects and the emergence of
competing power centers, coordination is essential.
Th at coordination could take several forms, with
varying degrees of diffi culty and eff ectiveness.
Coordination may involve ad hoc meetings
and occasional agreements to alter policy in the
global interest (what has been called “episodic
coordination”). On the other hand, coordina-
tion may lead to a formal revision of the workings
of the international fi nancial system to prevent
destabilizing competitive behavior—what Artis
and Ostry (1986) call “institutionalized coordi-
nation.” Since the 1940s, there has been a steady
rise in eff orts at institutionalized coordination,
as evidenced by a rise in the number of coun-
tries that participate in international organiza-
tions (fi gure 3.10). However, current disparities
among countries in terms of economic conditions
and policy objectives are likely to make reaching
agreement diffi cult, and the emergence of a mul-
tipolar world with new power centers may even
amplify impediments for achieving cooperation
at the very time it is most necessary.
Disparities among countries’ economic conditions and policy objectives that are likely to make reaching agreement diffi cult
In the abs ence of incentives for collective action,18
countries may choose to make decisions uni-
laterally, but the final outcome easily could be
one in which all countries are worse off . Under
the present circumstances, it would be desir-
able to strengthen the institutional basis for
cooperation—for instance, by expanding the
blocs. Th is feature may undercut multilateral-
ism by making cooperation to maintain a system
of global free trade seem less essential for eco-
nomic prosperity. Furthermore, in the second
scenario, the vast majority of developing coun-
tries, including those with the lowest incomes,
would continue to transact internationally in
currencies other than their own, and thus would
be exposed to the exchange rate risk. Only the
largest emerging-market countries/regions would
achieve the status of issuers of international cur-
rencies because of the liquidity advantages of
size. Th e third, or single multilateral reserve cur-rency scenario, is envisioned as a possible reac-
tion to the perceived defi ciencies of the other two
scenarios, which provide few checks on national
policies and may be associated with exchange
rate instability.
Th e single multilateral reserve currency scenario
is far less likely than the other two scenarios to
materialize over the next 15 years, as the multilat-eral reserve scenario would necessitate developing
a set of rules for managing international liquid-
ity and moderating exchange rate movements
and would require countries highly protective of
their national monetary policy to relinquish full
control.17
0
20
40
60
80
100
120
140
160
180
200
1945
1950
1955
1960
1965
1970
1975
1980
1985
1990
1995
2000
2005
2010
nu
mb
er
of
cou
ntr
ies
UN
IMF
GATT/WTO
FIGURE 3.10 Membership in major international organizations, 1945–2010
Sources: Membership rolls of General Agreement on Tariffs and Trade/World Trade Organization, the United Nations, and IMF, from their respective websites.
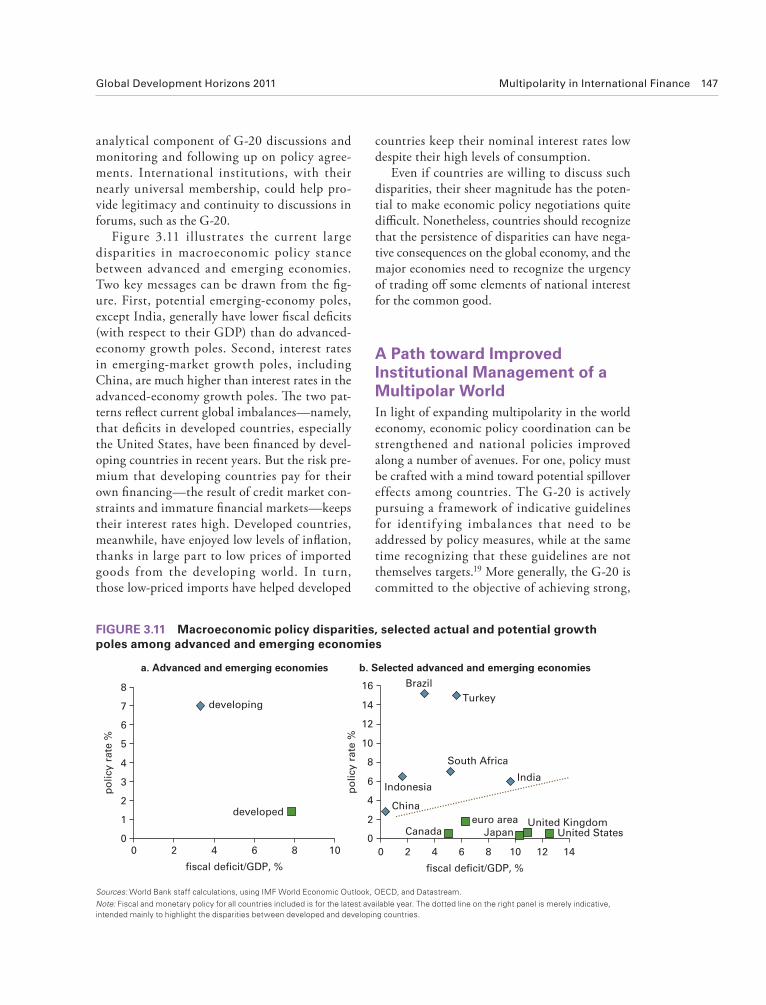
Global Development Horizons 2011 Multipolarity in International Finance 147
countries keep their nominal interest rates low
despite their high levels of consumption.
Even if countries are willing to discuss such
disparities, their sheer magnitude has the poten-
tial to make economic policy negotiations quite
diffi cult. Nonetheless, countries should recognize
that the persistence of disparities can have nega-
tive consequences on the global economy, and the
major economies need to recognize the urgency
of trading off some elements of national interest
for the common good.
A Path toward Improved Institutional Management of a Multipolar WorldIn light of expanding multipolarity in the world
economy, economic policy coordination can be
strengthened and national policies improved
along a number of avenues. For one, policy must
be crafted with a mind toward potential spillover
effects among countries. The G-20 is actively
pursuing a framework of indicative guidelines
for identifying imbalances that need to be
addressed by policy measures, while at the same
time recognizing that these guidelines are not
themselves targets.19 More generally, the G-20 is
committed to the objective of achieving strong,
analytical component of G-20 discussions and
monitoring and following up on policy agree-
ments. International institutions, with their
nearly universal membership, could help pro-
vide legitimacy and continuity to discussions in
forums, such as the G-20.
Figure 3.11 illustrates the current large
disparities in macroeconomic policy stance
between advanced and emerging economies.
Two key messages can be drawn from the fi g-
ure. First, potential emerging-economy poles,
except India, generally have lower fi scal defi cits
(with respect to their GDP) than do advanced-
economy growth poles. Second, interest rates
in emerging-market growth poles, including
China, are much higher than interest rates in the
advanced-economy growth poles. Th e two pat-
terns refl ect current global imbalances—namely,
that defi cits in developed countries, especially
the United States, have been fi nanced by devel-
oping countries in recent years. But the risk pre-
mium that developing countries pay for their
own fi nancing—the result of credit market con-
straints and immature fi nancial markets—keeps
their interest rates high. Developed countries,
meanwhile, have enjoyed low levels of infl ation,
thanks in large part to low prices of imported
goods from the developing world. In turn,
those low-priced imports have helped developed
Brazil
China
IndonesiaIndia
Turkey
South Africa
Canadaeuro area
Japan United StatesUnited Kingdom
0
2
4
6
8
10
12
14
16
0 2 4 6 8 10 12 14
fiscal deficit/GDP, %
po
licy
rate
%
developing
a. Advanced and emerging economies b. Selected advanced and emerging economies
developed
0
1
2
3
4
5
6
7
8
0 2 4 6 8 10
fiscal deficit/GDP, %
po
licy
rate
%
FIGURE 3.11 Macroeconomic policy disparities, selected actual and potential growth poles among advanced and emerging economies
Sources: World Bank staff calculations, using IMF World Economic Outlook, OECD, and Datastream.
Note: Fiscal and monetary policy for all countries included is for the latest available year. The dotted line on the right panel is merely indicative, intended mainly to highlight the disparities between developed and developing countries.
148 Multipolarity in International Finance Global Development Horizons 2011
many countries can benefi t. Th e initial successes
of the G-20 emphasized such common objectives
and resulted from the recognition by all coun-
tries that urgent action was needed—in the com-
mon interest—to avoid a global recession and to
address structural problems in the fi nancial sector.
Linkages between countries occur in the fi rst
instance through changes in countries’ external
payments positions. Hence, there is consider-
able interest at present in using some measure
of external payments disequilibrium as a trigger
for policy action by the country concerned (see,
for instance, the proposal to the G-20 by U.S.
Treasury Secretary Timothy Geithner20). Under
such an arrangement, a country’s current account
surplus or defi cit would be limited to some pro-
portion of its GDP, say, to 4 percent. If a coun-
try exceeded that threshold, that country would
be required to take policy measures to bring its
current account surplus or defi cit back within the
allowable range.
Earlier consideration of such rules, inspired in
part by U.S. current account defi cits and Japanese
surpluses in the early 1980s, highlighted the
importance of understanding the source of the
current account deficits and surpluses. In gen-
eral, imbalances are the outcome of the complex
interaction of government policies and private
sector behavior, and hence more robust analysis
is needed to make a judgment concerning the
causes and whether there is reason for concern.
Th e G-20’s current work program includes the
objective of establishing indicative guidelines—
not targets—for identifying unsustainable
imbalances.
Th e G-20’s attempt to exert peer pressure on
its members’ policies (the mutual assessment
process) defi nes the contemporary approach to
international policy coordination. But the cur-
rent dispute over exchange rate levels and current
account imbalances illustrates the problems of
reaching agreement on targets for variables that
are inherently zero-sum or the result of beggar-
thy-neighbor policies (Masson 2011). Th e Bretton
Woods regime ruled out such behavior, but no
similar mechanism exists in the 21st century.
Surveillance and ad hoc policy coordination are
thus only a partial substitute for a rules-based
sustainable, and balanced growth. In doing so,
the G-20 needs to continue its focus on shared
objectives rather than on instruments that lead
to a zero-sum game. The G-20 also needs to
institutionalize coordination, drawing on the in-
house expertise and the institutional memory of
offi cial international economic institutions.
The form of policy coordination can be an
important inf luence on its success in reaching
and sustaining agreement. It seems clear that ad
hoc coordination of policies, whether to inter-
vene in exchange markets (such as those embod-
ied in the 1985 Plaza Agreement) or occasional
bargains to modify macroeconomic or structural
policies (such as the 1978 Bonn Summit), have
not been suffi cient in preventing excesses such as
uncontrolled global expansion of liquidity and
global imbalances. Designing transparent, widely
accepted triggers for economic policy coordina-
tion thus would be desirable. Establishing such
triggers also would represent an important step
toward a more rules-based international mone-
tary system, but designing appropriate rules pres-
ents challenges.
At least three types of policy rules with auto-
matic triggers have been proposed or used in the
past to lessen negative spillovers on other coun-
tries: rules on allowable exchange rate behavior;
limits on balance of payments positions; and crite-
ria for proscribing beggar-thy-neighbor macroeco-
nomic policies (Masson forthcoming). Each rule
type has limitations, however, due to the need to
overcome confl ict among countries in their eff orts
to cooperate. If countries are concerned with
safeguarding their competitiveness, for instance,
each country will make eff orts to resist exchange
rate appreciation, but the results are zero sum:
depreciation for one country is appreciation for
another. Th e challenge for policy coordination is
therefore to fi nd evenhanded criteria for choosing
the appropriate values for the three variables listed
above. A complementary approach is for policy
coordination to emphasize targeting international
public goods—that is, focusing on variables that
refl ect shared objectives. Low global infl ation, sus-
tained economic growth, exchange rate stability,
and adequate global liquidity may draw the most
support, as all four refl ect objectives from which
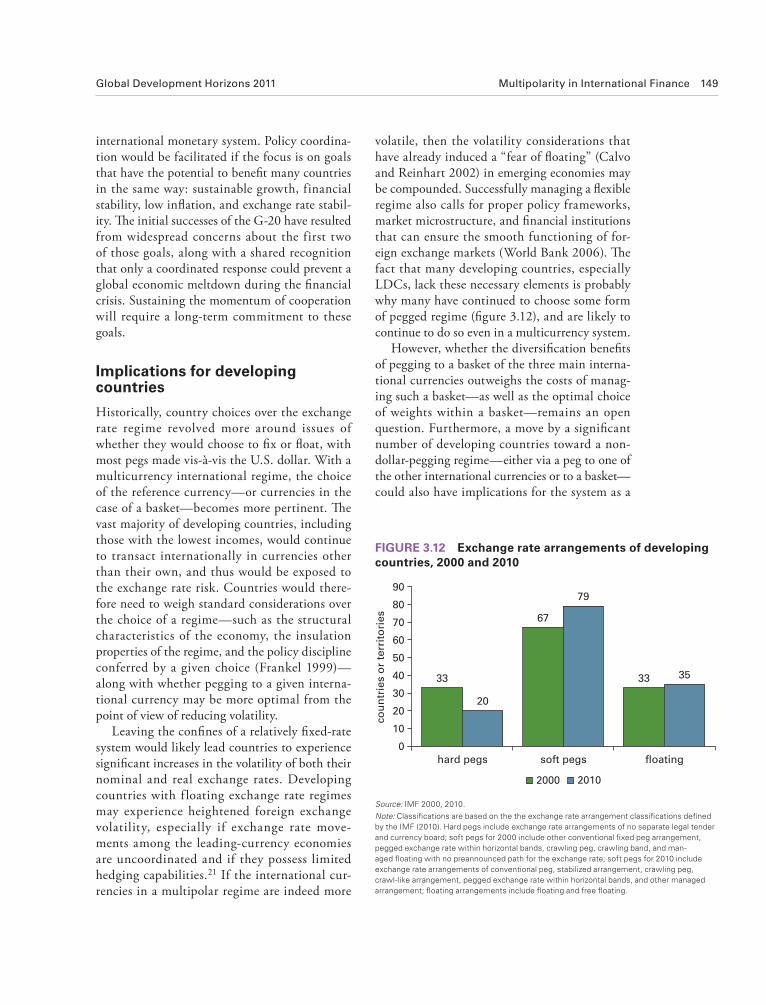
Global Development Horizons 2011 Multipolarity in International Finance 149
volatile, then the volatility considerations that
have already induced a “fear of fl oating” (Calvo
and Reinhart 2002) in emerging economies may
be compounded. Successfully managing a fl exible
regime also calls for proper policy frameworks,
market microstructure, and fi nancial institutions
that can ensure the smooth functioning of for-
eign exchange markets (World Bank 2006). Th e
fact that many developing countries, especially
LDCs, lack these necessary elements is probably
why many have continued to choose some form
of pegged regime (fi gure 3.12), and are likely to
continue to do so even in a multicurrency system.
However, whether the diversifi cation benefi ts
of pegging to a basket of the three main interna-
tional currencies outweighs the costs of manag-
ing such a basket—as well as the optimal choice
of weights within a basket—remains an open
question. Furthermore, a move by a signifi cant
number of developing countries toward a non-
dollar-pegging regime—either via a peg to one of
the other international currencies or to a basket—
could also have implications for the system as a
international monetary system. Policy coordina-
tion would be facilitated if the focus is on goals
that have the potential to benefi t many countries
in the same way: sustainable growth, financial
stability, low infl ation, and exchange rate stabil-
ity. Th e initial successes of the G-20 have resulted
from widespread concerns about the first two
of those goals, along with a shared recognition
that only a coordinated response could prevent a
global economic meltdown during the fi nancial
crisis. Sustaining the momentum of cooperation
will require a long-term commitment to these
goals.
Implications for developing countries
Historically, country choices over the exchange
rate regime revolved more around issues of
whether they would choose to fi x or fl oat, with
most pegs made vis-à-vis the U.S. dollar. With a
multicurrency international regime, the choice
of the reference currency—or currencies in the
case of a basket—becomes more pertinent. Th e
vast majority of developing countries, including
those with the lowest incomes, would continue
to transact internationally in currencies other
than their own, and thus would be exposed to
the exchange rate risk. Countries would there-
fore need to weigh standard considerations over
the choice of a regime—such as the structural
characteristics of the economy, the insulation
properties of the regime, and the policy discipline
conferred by a given choice (Frankel 1999)—
along with whether pegging to a given interna-
tional currency may be more optimal from the
point of view of reducing volatility.
Leaving the confi nes of a relatively fi xed-rate
system would likely lead countries to experience
signifi cant increases in the volatility of both their
nominal and real exchange rates. Developing
countries with f loating exchange rate regimes
may experience heightened foreign exchange
volatility, especially if exchange rate move-
ments among the leading-currency economies
are uncoordinated and if they possess limited
hedging capabilities.21 If the international cur-
rencies in a multipolar regime are indeed more
33
67
33
20
79
35
0
10
20
30
40
50
60
70
80
90
hard pegs soft pegs floating
cou
ntr
ies
or
terr
ito
ries
2000 2010
FIGURE 3.12 Exchange rate arrangements of developing countries, 2000 and 2010
Source: IMF 2000, 2010.
Note: Classifi cations are based on the the exchange rate arrangement classifi cations defi ned by the IMF (2010). Hard pegs include exchange rate arrangements of no separate legal tender and currency board; soft pegs for 2000 include other conventional fi xed peg arrangement, pegged exchange rate within horizontal bands, crawling peg, crawling band, and man-aged fl oating with no preannounced path for the exchange rate; soft pegs for 2010 include exchange rate arrangements of conventional peg, stabilized arrangement, crawling peg, crawl-like arrangement, pegged exchange rate within horizontal bands, and other managed arrangement; fl oating arrangements include fl oating and free fl oating.

150 Multipolarity in International Finance Global Development Horizons 2011
only about 4 percent of global foreign exchange
reserves (fi gure 3.13).
The International Monetary Fund (IMF)
periodically reviews the composition of the SDR
and the rules governing its use. Th e IMF staff
recently concluded that the SDR could play an
enhanced role in addressing some of the chal-
lenges facing the international monetary system
(IMF 2011).
Th e expansio n of global liquidity in recent
years has been accompanied by dramatic
changes in the distribution of reserves, further
undercutting the case for SDR allocations.
Comparing the distribution of all countries’
reserves-to-imports ratios at the end of 1999
(the year of the introduction of the euro) with
comparable fi gures for 2008 (the last year for
which relevant data are available for an adequate
number of countries), it is clear that the num-
ber of countries with reserves of less than three
months’ worth of import cover has declined sub-
stantially, while the number of countries with a
more comfortable cushion of three to six months
of import cover has increased (figure 3.14).22
Moreover, many of the countries with the lowest
reserve ratios are advanced countries, as these
countries intervene little in foreign exchange
markets and are able to borrow reserves when
needed. Th e proportion of advanced countries
with low reserve levels (less than three months of
import cover) actually increased over the decade
from 1999 to 2008, to 63 percent of the total.
The countries with the highest reserve ratios
are the emerging-market countries and Japan,
where fl exibility of exchange rates is limited to a
greater or lesser extent.
Although the objective of making the SDR the
primary reserve asset of the international mon-
etary system does not seem to be within sight in
the foreseeable future, greater focus on alternatives
to national currencies gradually may create the
preconditions for greater management of the mon-
etary system, with advantages for systemic stability
along the way. A liquid international asset could
also supplement dollar liquidity, minimizing the
problem of dollar liquidity shortage that occurred
during the recent crisis. Even in the absence of
major reforms, countries have the potential to col-
whole, especially with regard to global current
account imbalances. Such issues will require fur-
ther research and consideration.
Enhancing the role of the SDR
Over the years, numerous proposals to stimu-
late the attractiveness of the SDR (see Mussa,
Boughton, and Isard 1996; von Furstenberg
1983) have been made by academics and offi-
cials, some of whom have argued for changes in
the basket defi nition and the calculation of inter-
est rates paid to holders of SDRs and charged to
borrowers of SDRs. Th e proposal made by the
BRICs (Brazil, the Russian Federation, India,
and China) in 2008, for example, revived the
idea of making the SDR an important reserve
currency by encouraging its use by the private
sector. Th is process could involve linking private
and official SDRs and allowing central banks
to transact in SDRs with private holders—for
instance, when performing currency interven-
tion. Another option would be for governments
to issue marketable debt in SDRs, which would
enhance market liquidity for the SDRs in the
process. So far, however, no concrete actions
have increased the private use of the SDR, and
the current (2010) stock of off icial SDRs is
FIGURE 3.13 SDRs as a percentage of the world’s foreign exchange reserves, 1970–2010
Source: World Bank staff calculations, from IMF IFS database.
0
1
2
3
4
5
6
7
8
1970 1975 1980 1985 1990 1995 2000 2005 2010
perc
en
t
4%

Global Development Horizons 2011 Multipolarity in International Finance 151
also conceivably allowing the IMF to hold SDRs
in escrow and issuing or withdrawing them
when needed (IMF 2010c). Such reforms, how-
ever, would require an amendment to the IMF’s
Articles of Agreement.
ConclusionThe world economy is going through a trans-
formative change in its growth dynamics,
industrial landscape, and management of inter-
national monetary and financial affairs. How
the international monetary system evolves in
the future matters crucially for development
policy, agenda, and practice. In setting the con-
text for global growth and financial stability,
the international monetary system conditions
not only developing countries’ access to inter-
national sources of capital, but also the stability
laborate to encourage use of the SDR in a number
of ways:
• By issuing public debt linked to the value
of the SDR
• By encouraging the creation of clearing
mechanisms for private SDRs
• By changing the SDR basket, for instance,
to include the renminbi or other major
emerging-market currencies
• By expanding the set of prescribed holders
of offi cial SDRs
• By intervening directly in SDR-linked
instruments to develop the liquidity of the
private SDR market
In addition, the provisions for approving SDR
allocations could be modifi ed to make them more
fl exible and subject to less stringent conditions,
FIGURE 3.14 Distribution of foreign exchange reserves, 1999 and 2008
Source: World Bank staff calculations, from IMF IFS database.
0
10
20
30
40
Res.<3 3<Res.<6 6<Res.<9 9<Res.<12 12<Res.
a. Distribution of reserves (reserves/imports),all countries, 1999
% o
f co
un
trie
s
0
10
20
30
40
50
Res.<3 3<Res.<6 6<Res.<9 9<Res.<12 12<Res.
b. Distribution of reserves (reserves/imports),all countries, 2008
% o
f co
un
trie
s
0
10
20
30
40
50
60
70
Res.<3 3<Res.<6 6<Res.<9 9<Res.<12 12<Res.
c. Distribution of reserves (reserves/imports),advanced countries, 2008
% o
f co
un
trie
s

152 Multipolarity in International Finance Global Development Horizons 2011
emerging-market growth pole countries—in
terms of institutions, regional linkages, and mac-
roeconomic conditions—suggest that answers to
this question vary substantially according to the
country and region being considered.
In the meantime, it is the euro, rather than any
emerging-market currency, that has the potential
to rival the U.S. dollar as a true international cur-
rency—provided the euro area can strengthen its
institutions and overcome the severe fi scal crisis
affl icting several EU countries that is weakening
the credibility of the euro system as a whole. It
is also the case that large U.S. fi scal and current
account defi cits, and concerns about further dol-
lar depreciation, have dented the dominance of
the dollar as the main international currency.
Views are sharply contrasting, however, as to the
seriousness of the challenge posed by other cur-
rencies. Some believe that the euro will overtake
the dollar in importance quite soon and that the
renminbi will do the same at a more distant hori-
zon. But others believe that the dynamism of the
U.S. economy, the depth of U.S. fi nancial mar-
kets, and the position of the United States as the
world’s only superpower—as well as inertia in
currency use—make the dollar’s position at the
top of the currency pyramid unshakable in the
foreseeable future.
With such factors in mind, three possible
international currency scenarios for the period
2011–25 emerge. In the fi rst of those scenarios,
the U.S. dollar’s dominance remains without a
serious challenger. In the second, a more mul-
tipolar international monetary system emerges,
most likely with the dollar, euro, and renminbi
at the center of the system. In the third, dissat-
isfaction with an international currency system
based on national currencies leads to reforms
that make supply of the world’s currency the
result of multilateral decisions—a role intended
for the SDR when it was created. Th ese three
scenarios have diff erent costs and benefi ts and
are not equally likely to occur.
Th e creation of the G-20, and its development
into the primary forum for economic coopera-
tion among the world’s major economies, rec-
ognizes the importance of the challenges facing
the global economy, and the G-20 successes have
of their currencies. Th e 2008–09 fi nancial crisis
exposed some of the structural weaknesses of
the previous international monetary system, and
underscored the need for reform in line with the
growing roles of developing countries on the
global stage.
There remains a wide disparity, however,
between developing countries’ roles in interna-
tional trade and fi nance and their importance in
the international monetary system. Addressing
these disparities in the international monetary
system is an area in need of urgent attention, both
in terms of the management of the system—in
which the IMF continues to play a leading role—
as well as in the understanding of long-term
forces shaping the future working of the system.
International currency use has lagged the
increasing importance of emerging-market
economies. None of their currencies is used
internationally to any great extent. Th at situa-
tion may change in the coming decades, but the
shift will be limited by the inertia in currency
use explained by network externalities, which
dictate that a currency is most attractive if it is
already in widespread international use. Recent
moves by the Chinese authorities, for example,
to encourage international use of the renminbi
can be expected to gradually increase use of
that currency in East Asia. But to become a true
international currency, the renminbi would have
to be supported by capital account liberalization,
exchange rate fl exibility, and domestic reforms
that would encourage liquid and deep fi nancial
markets and transparent and eff ective fi nancial
regulation and supervision. Th e future interna-
tional role of the renminbi will depend impor-
tantly on whether the Chiang Mai Initiative multilateralization leads to the development of a
regional currency, and whether such a regional
currency is a new one issued by a regional central
bank or one of the existing currencies.
Emerging-market economies other than China
will need to evaluate whether internationaliza-
tion of their currencies is in their best interest.
Internationalization of currencies would impose
constraints on monetary policies, open up new
sources of fi nancing, and reduce exchange rate
risk. Th e very diff erent situations of the potential

Global Development Horizons 2011 Multipolarity in International Finance 153
rate i. Money holdings would adjust gradually to
their long run level:
− − − −
Δ + Δ + Δ+ + + − +1 1 2 1 3 1 1
m =
(a a a )
p y
i y p m u
α β σϕ
If some transactions are international, however,
then one should include variables that capture the
demand for money balances to carry out those
transactions, if that currency is in international
use. Globalization increases the volume of inter-
national transactions relative to GDP, and hence
the amount of money needed to carry them out,
holding the transactions technology constant. Let xs be the share of global exports in global GDP,
and ks be the corresponding share of (gross) capi-
tal fl ows in global GDP. Additionally, let coun-
try subscript j be used to distinguish countries.
Consistent with the pooled mean group (PMG)
estimator (Pesaran, Shin, and Smith 1999), the
long-run money demand coeffi cients (a1, a2, a3)
are constrained to be the same across countries,
while allowing the short-run adjustment and the
degree of internationalization (as well as the con-
stant term) to vary. Th e above equation then can
be augmented as follows:
− − − −
Δ + Δ + Δ + ++ + + − +1 , 1 2 , 1 3 , 1 , 1
m =
(a a a )
j j j j j j j j
j j j j j
p y xs ks
i y p m u
α β σ γ δϕ
where the coeffi cients αj, βj, σj, γj, δj, ϕj include a
country subscript to indicate that they vary across
countries. The variables xs and ks do not have
country subscripts, as they are measures of global
transactions. But their coeffi cients vary depend-
ing on the extent to which demand for the coun-
try’s currency refl ects global transactions.
Data issues. Annual data for G-20 countries
from 1990–2009 are used in the analysis, with
two major qualifi cations. First, the data begin in
1996 for Russia, 1992 for Argentina, and 1994
for Brazil in order to remove the eff ects of massive
structural changes and hyperinfl ation. Second,
the M2 of G-20 euro area countries (France,
Germany, and Italy) are included in the M2 of
the euro area rather than analyzed individually
(for years before 1999, the series is a composite
been the result of the shared objectives of limiting
the scope of the fi nancial crisis, reviving global
growth, and improving fi nancial regulation. Th e
G-20 needs not only to replace the G-8, but also
to improve on the G-8 when it comes to eff ec-
tive policy coordination, and the G-20 should
consider over the long term whether to move to a
more rules-based system in anticipation of trends
toward multipolarity.
More specifi cally, in the international mon-
etary arena, gains in central bank cooperation—
which have improved as a result of the fi nancial
crisis—need to be consolidated. Financial sta-
bility, it is now widely recognized, is a primary
responsibility of central banks. Because of a
high degree of financial interdependence, cen-
tral bank cooperation must be addressed through
enhanced exchange of information and coordi-
nation. Several decades of experience, however,
have shown the limitations of attempting to
coordinate policies around zero-sum variables,
such as exchange rates and balance of payments,
because of disagreements over appropriate levels:
one country’s depreciation corresponds to other
countries’ appreciation, and balance of payments
defi cits need to be matched by surpluses. It would
be more promising to emphasize coordination
around global public goods, such as sustained
growth, financial stability, low inf lation, and
exchange rate stability.
AnnexesAnnex 3.1: Using global money demand to determine the extent of international currency use
A simple model framework. Th e international
roles of a currency ultimately should lead to an
increase in the global demand for money of the
currency in question, where global demand is
defi ned as encompassing both international and
domestic demand. A conventional error-correc-
tion specifi cation for money demand for trans-
action purposes would postulate that nominal
money balances m (in logs) should depend posi-
tively on the price level p and real GDP y (both
in logs) and negatively on the short-term interest

154 Multipolarity in International Finance Global Development Horizons 2011
Indeed, research has found that Japanese export-
ers have a strong tendency to choose the import-
er’s currency when exporting to other industrial
countries and to use the dollar for invoicing when
exporting to Asia (Ito et al. 2010).
Annex 3.2: A composite indicator of shares of international currency use
To aggregate the four indicators reported in the
text—reserves, turnover, international bank
credit, and international securities issues—prin-
cipal factor analysis was used to generate the
weights on each to create a single series that
maximizes the common variance in the series.
The first factor calculated in such a manner
explains 93 percent of the variance (table 3A.2,
top panel). The remaining factors (which were
not retained) are orthogonal both to the fi rst fac-
tor and among themselves. Th ey explain little of
the variance, and one of the criteria for retention
of factors (only those with eigenvalue greater
than unity) strongly suggests that only the fi rst
factor is needed. Th e resulting weights (or factor
loadings) for the fi rst factor are almost equal for
the four series—slightly higher for reserves and
credit, with international bonds having the lowest
weight (table 3A.2, bottom panel). Using these
weights, the principal factor was calculated and
then renormalized to give proportions that sum
to unity for each of the years in the sample. Th e
series for the composite indicator based on the
principal factor are plotted in fi gure 3.3.
Annex 3.3: A short history of the SDR
The SDR is an international reserve asset that
was created by the IMF in the 1960s to palliate
a perceived shortage of reserves and to address
the so-called Triffi n dilemma, a potential confi -
dence problem associated with the use of the U.S.
dollar as the predominant reserve currency. Th e
dilemma resulted from the fact that the United
States needed to run a balance of payments defi cit
to provide adequate global liquidity, but the defi -
cit, in turn, undermined the attractiveness of the
dollar and the credibility of the U.S. commitment
M2 for the countries that joined the euro area
in 1999). Money holdings are measured as M2,
which includes notes and coins in circulation
(M1) plus, typically, checking accounts, savings
deposits, and time deposits. The interest rate
is that of three-month Treasury bills or similar
instruments.
The internationalization variables xs and ks are calculated as ratios of global exports to
global GDP, and the fi rst diff erence of Bank for
International Settlements international claims,
divided by global GDP, respectively.
Estimation results. Table 3A.1 summarizes the
results of preliminary estimation using PMG,
focusing on the long-run demand relationship,
which is constrained to be the same for all coun-
tries, and the eff ects of the globalization variables,
which are allowed to diff er. Results are reported
only for the U.S. dollar, euro, pound sterling, and
Japanese yen.
Assuming that both international trade and
asset fl ows continue to grow more strongly than
GDP, the results are suggestive of future trends
in currency use. International trade and capital
f lows would seem to favor the use of the euro
strongly, and trade growth to discourage use of
the yen and encourage that of the dollar.23 Th ese
trends are consistent with the reported decline in
use of the yen for foreign exchange reserves and in
currency turnover data (as discussed in the text).
TABLE 3A.1 Estimates of long-run global money demand for the U.S. dollar, euro, pound sterling, and yen
Coeffi cient United States Euro area Japan United Kingdom
a1 1.761
(0.0668)
1.761
(0.0668)
1.761
(0.0668)
1.761
(0.0668)
a2 −0.0003
(0.0022)
−0.0003
(0.0022)
−0.0003
(0.0022)
−0.0003
(0.0022)
a3 0.7179
(0.0663)
0.7179
(0.0663)
0.7179
(0.0663)
0.7179
(0.0663)
γj 0.0034
(0.0013)
0.0043
(0.0010)
−0.0084
(0.0046)
0.0021
(0.0011)
δj 0.0012
(0.0007)
0.0012
(0.0005)
0.0016
(0.0021)
−0.0000
(0.0007)
Source: World Bank staff estimates.Note: Standard errors are shown in parentheses below the estimated coeffi cients. Coeffi cients signifi cant at the 10 percent level or better are in bold.

Global Development Horizons 2011 Multipolarity in International Finance 155
According to the IMF’s articles, the SDR is
limited to offi cial users, namely, governments and
central banks, although for a time around 1980
there was considerable issuance of private SDR
deposits and bonds (these use the same basket
defi nition as the offi cial SDR, but interest rates
can diff er from the interest rates of offi cial SDR).
Th is private market was virtually nonexistent as of
2010. Th e SDR also has been used as an exchange
rate peg, allowing countries to avoid some of the
volatility associated with single currency pegs. By
2007, the use of basket pegs (including the SDR)
virtually had disappeared. Th e SDR’s current role
is mainly to serve as a unit of account for interna-
tional institutions.
Notes 1. Th is issue has been much researched (see Cohen
2000; Tavlas 1991; and references therein to ear-
lier literature).
2. Empirical work by Chinn and Frankel (2005)
shows that a currency’s share in world foreign
exchange reserves is linked to two main explana-
tory variables: the GDP share of the economy
(positive correlation) and the economy’s infl ation
rate relative to the world average (negative correla-
tion). Chinn and Frankel (2005) also fi nd a high
degree of inertia in currency use, refl ected in the
to maintain dollar convertibility into gold. By the
time of approval of the fi rst allocation of SDRs in
1969 (which occurred in three installments over
1970–72), the United States had in fact restricted
convertibility to foreign central banks; rather
than the perceived shortage of reserves, there was
now a glut of foreign dollar holdings. President
Nixon suspended gold convertibility completely
on August 15, 1971, to bring about a readjust-
ment of exchange rates. However, the new set of
parities that resulted from the December 1971
Smithsonian Agreement lasted less than two
years, and by March 1973 there was generalized
fl oating of exchange rates.
Th e First Amendment to the IMF’s Articles of
Agreement creating the SDR envisioned that it
would become “the principal reserve asset in the
international monetary system” (Art. XXII). Th is
has not occurred. Although the fi rst allocation of
SDRs was followed by a second general allocation
over 1979–81, no further allocations were made
until August/September 2009, when approval of
the Fourth Amendment authorized a special allo-
cation for countries that had joined the IMF after
1981 (as they had not benefited from previous
allocations); a general allocation also was made to
all members of SDR 161.2 billion. Between 1981
and 2009, however, SDRs fell from 7.3 percent
of nongold foreign exchange reserves to 0.4 per-
cent. Th e new allocations raised the proportion to
3.9 percent.
As the name implies, the SDR is not really an
asset, but rather the unconditional right to obtain
usable currencies through the IMF.24 Th e SDR’s
attractiveness is greatest for countries that have
limited ability to borrow reserve currencies (or
only at a high interest rate). For countries that
have market access, the SDR has limited appeal
either as an asset or as a source of credit. The
interest rate charged on the use of SDRs and its
valuation are related to those of the component
currencies of the basket that defi ne it—currently,
the dollar, the euro, the pound sterling, and the
yen.25 Until 2009, agreement on new SDR alloca-
tions has foundered on the need to prove “a long-
term global need [for reserves]” (Article XVIII),
which has been diffi cult to provide given the tre-
mendous expansion in holdings in reserve curren-
cies, especially U.S. dollars.
TABLE 3A.2 Principle factor analysis of international currency use
Factor Eigenvalue Difference Proportion Cumulative
1 3.69331 3.42583 0.9349 0.9349
2 0.26748 0.27014 0.0677 1.0026
3 −0.00267 0.00508 −0.0007 1.002
4 −0.0077 −0.0020 1
Observations 55
Factor loadings (fi rst factor)
Variable Factor 1 Uniqueness
Reserves 0.96285 0.07291
Turnover 0.95806 0.08212
Credit 0.98433 0.0311
Bonds 0.93778 0.12056
Source: World Bank staff estimates.
156 Multipolarity in International Finance Global Development Horizons 2011
countries as a group (especially those that are com-
modity exporters) are now stockpiling reserves at
a far greater rate and on a much larger scale than
advanced economies. Some of this refl ects the self-
insurance motives of emerging countries in the
aftermath of the East Asian fi nancial crisis in the
late 1990s, and some refl ects their desire to limit
the fl exibility of their exchange rates. For further
discussion of the demand for reserves, see Lin and
Dailami (2010) and Obstfeld, Shambaugh, and
Taylor (2010).
13. Despite the substantial debate that has raged
over the motivations and investment behavior of
SWFs, their mere existence does not, in itself,
pose a threat to the international fi nancial system.
For example, SWFs likely played a valuable sta-
bilizing role during the fi nancial crisis, as SWFs
acquired stakes in U.S. fi nancial institutions that
provided capital injections at a time of scarce
global liquidity and may have contributed to U.S.
institutions’ continued viability. Nevertheless, if
emerging-market governments attempt to take
large positions in sectors viewed as sensitive, these
concerns may come to the fore once again; thus,
agreement on a multilateral framework governing
cross- border investment fl ows, as elaborated in
chapter 2, becomes all the more important.
14. Chinn and Frankel (2005) maintain that this
scenario is consistent with the likely case where
no exits from the European Monetary Union
occur, while smaller Eastern European economies
meet the Maastricht criteria and choose to join
the European Monetary Union. However, they
assume that the United Kingdom retains its cur-
rency independence and dismiss the possibility of
the renminbi becoming an international currency.
In a later paper, Chinn and Frankel (2008) argue
that since much of London’s business is done in
euros, the importance of that fi nancial center
would provide a further boost to the euro.
15. It should also be noted that the scenarios here
anticipate somewhat slower short and medium-
term adjustment in U.S. fi scal balances, compared
to projections in 2011 by the CBO. However, it is
clear that the CBO baseline for fi scal adjustment
falls neatly between the two international cur-
rency scenarios considered.
16. Th e danger of greater currency instability is based
on both historical experience and analytical mod-
els. Giavazzi and Giovannini (1989), for exam-
ple, suggest that greater symmetry in the size of
countries or economic blocs will produce greater
global instability. Th is is consistent with political
slow eff ect of changes in the explanatory variables
on currency use.
3. Th e proportions relate to allocated reserves only
and exclude those countries (China, in particular)
that do not report the currency composition of
their reserves.
4. Th e components were fi rst converted to shares of
the total for the fi ve currencies, and the fi rst prin-
cipal component was normalized so that shares
summed to unity across the fi ve.
5. A similar approach is reported in ECB (2010,
55–58).
6. An alternative methodology suggested by Th imann
(2008) is to broaden the defi nition of international
use beyond bonds issued to international investors
to include foreigners’ purchases of domestic instru-
ments, as well as measures of the size and stage of
development of fi nancial markets. Th e latter ele-
ments, however, raise measurement problems and
require one to weight together very diff erent quali-
tative variables.
7. In some periods, however, the status of an inter-
national currency has been maintained by nego-
tiation, in particular within the sterling zone
following World War II and during the 1960s,
when the United States introduced various con-
trols to discourage exchanging dollars for gold (see
Helleiner 2009).
8. To quote a recent paper discussed at the IMF’s
Executive Board (IMF 2010b, 18), “As the world
becomes more multipolar in terms of GDP, the
drive for a multicurrency system that mimics
global economic weights is likely to increase—e.g.,
a dominant dollar zone, euro zone, and a formal or
informal Asian currency zone.”
9. Th e euro area and IMF rescue package for Greece,
agreed on in April 2010, is covered by a separate
facility.
10. In terms of total exports, China’s share of world
trade, despite its rapid growth, has not yet reached
the corresponding fi gure for the United States a
century ago. Th e United States already accounted
for 12.2 percent of global merchandise exports in
1906–10, and 12.5 percent in 1913–20. During
the second part of the 1920s, this U.S. share
was already 15.5 percent (surpassing the United
Kingdom’s) and by 1950, the U.S. share was at an
all-time high, at 20.6 percent.
11. See http://www.mof.go.jp/english/if/regional_
fi nancial_cooperation.htm#CMI for more infor -
mation.
12. Th e extent of reserve accumulation has attracted
much attention in recent years. Developing

Global Development Horizons 2011 Multipolarity in International Finance 157
21. High level of exchange rate volatility can deter
exports (see Mundaca 2011).
22. A traditional rule of thumb was that holding
reserves equal to six months’ imports gave an
adequate cushion for trade-related shocks, but a
more complete analysis of reserve adequacy needs
to account for exposure to short-term debt (Jeanne
and Rancière 2006). Th e Greenspan-Guidotti
rule suggests that reserves should be at least equal
to debt maturing within the coming year; see
Greenspan (1999) and Guidotti (1999).
23. While international payments should only
increase, not decrease, total currency use, the
negative coeffi cient should be interpreted as being
relative to the average behavior displayed by all
international currencies and embodied in the
common coeffi cients.
24. Th us diff ering from the conditional credit
extended by the IMF through its various lending
facilities.
25. Th e composition of the SDR has evolved over
time. Originally it was valued in terms of gold,
and then it was defi ned as a basket of 16 curren-
cies, which was reduced to fi ve currencies in 1980
and to four in 1999, with the creation of the euro.
ReferencesArtis, Michae l J., and Sylvia Ostry. 1986. International
Economic Policy Co-ordination. London: Routledge.
Axelrod, Robert, and Robert Keohane. 1985.
“Achieving Cooperation under Anarchy: Strategies
and Institutions.” World Politics 38 (1): 226–54.
Bénassy-Quéré, Agnès, and Laurence Boone. 2010.
“Eurozone Crisis: Debts, Institutions, and Growth.”
La Lettre du CEPII 300 (June).
BIS (Bank of International Settlements). 2010.
“Triennial Central Bank Survey: Foreign Exchange
and Derivatives Market Activity in April 2010:
Preliminary Results.” Basel, Switzerland: BIS.
Calvo, Guillermo A., and Carmen M. Reinhart. 2002.
“Fear of Floating.” Quarterly Journal of Economics
107 (2): 379–408.
Cambridge University Press, 2006. “Historical
Statistics of the United States.” Millennial edi-
tion online. Ed. Susan B. Carter, Scott Sigmund
Gartnerm, Michael R. Haines, Alan L. Olmstead,
Richard Stuch, and Gavin Wright.
CBO (Congressional Budget Offi ce). 2010. “Th e Long-
Term Budget Outlok.” Washington, DC: CBO.
Chinn, Menzie, and Jeff rey Frankel. 2005. “Will the
Euro Eventually Surpass the Dollar as Leading
economy models of hegemonic stability, in which
a single dominant country has the incentive and
means to make the system work smoothly (Cohen
1998; Kindleberger 1973). Assuming, as does the
second scenario, that the ability of the United
States to guide the evolution of the international
monetary system continues to decline, the result-
ing lack of a hegemon likely will lead to attempts
by other major powers to assert their infl uence.
From a historical perspective, the experience
between the two world wars suggests that rivalry
between fi nancial centers can exacerbate exchange
rate instability (Eichengreen 1987).
17. Some of the same concerns facing the economic
policy-making community today—namely, the
potential instability of a multiple currency sys-
tem, the unchecked expansion of global liquidity,
the trade-off s between fi nancing and adjustment,
and the asymmetric position of reserve currency
countries—also motivated extensive discussions
of reform of the international monetary system
in the late 1960s (see, among many proposals for
reform, Cohen 1970; Hawkins 1965; Machlup
1968; Triffi n 1964) and led to the creation of the
SDR. At the time of its creation, the SDR was
intended to become the main reserve currency of
the international monetary system—a role it never
assumed (annex 3.3).
18. Th ere is considerable scholarship on coop-
eration theory in international relations. Th e
main insights emphasize the role of three fac-
tors aff ecting the willingness of governments to
cooperate: mutuality of interest, the shadow of
the future, and the number of actors involved in
the cooperation (see Axelrod and Keohane 1985;
Fearon 1998). Th e G-20, for example, as a vehicle
of international coordination, needs to reconcile
the tension between effi ciency in its decision-
making processes, which argues for a small num-
ber of members, and the legitimacy imparted
by wider participation. Although the G-20 does
not satisfy the universality principle of multi-
lateralism entrenched in the postwar economic
order, the G-20 comes much closer to meeting
the universality principle than did its predeces-
sor, the G-7, as the G-20 also includes emerging
countries in Africa, Asia, Latin America, and the
Middle East.
19. Communiqué, Meeting of Finance Ministers and
Central Bank Governors, Paris, February 18–19,
2011, G-20 website.
20. See http://graphics8.nytimes.com/packages/pdf/
10222010geithnerletter.pdf.
158 Multipolarity in International Finance Global Development Horizons 2011
Goldstein, Morris. 2002. “Managed Floating Plus.” Policy
Analysis in International Economics 66, Institute for
International Economics, Washington, DC.
Greenspan, Alan. 1999. “Currency Reserves and Debt.”
Remarks before the World Bank Conference Recent
Trends in Reserve Management, Washington
DC, April 29. http://www.federalreserve.gov/
BoardDocs/Speeches/1999/19990429.htm.
Guidotti, Pablo. 1999. Remarks to the G-33 Seminar,
Bonn, Germany, March 11.
Hartmann, Philipp. 1998. Currency Competition and
Foreign Exchange Markets: Th e Dollar, the Yen, and
the Euro. Cambridge, U.K.: Cambridge University
Press.
Hawkins, Robert G., ed. 1965. A Compendium of
Plans for International Monetary Reform. New
York: C. J. Devine Institute of Finance, New York
University.
Helleiner, Eric. 2009. “Enduring Top Currency, Fragile
Negotiated Currency: Politics and the Dollar’s
International Role.” In Th e Future of the Dollar,
ed. Eric Helleiner and Jonathan Kirshner, 69–87.
Ithaca, NY: Cornell University Press.
Hilgerdt, Folke. 1945. Industrialization and Foreign
Trade. Geneva: League of Nations.
IMF (International Monetary Fund). 2000. Annual
Report on Exchange Rate Arrangements and Exchange
Restrictions. Washington, DC: IMF.
———. 2010a. Annual Report on Exchange Rate
Arrangements and Exchange Restrictions. Wash ing-
ton, DC: IMF.
———. 2010b. “Reserve Accumulation and
International Monetary Stability.” Strategy, Policy
and Review Department, IMF, Washington, DC.
———. 2010c. “Reserve Accumulation and
International Monetary Stability: Supplementary
Information.” Strategy, Policy and Review
Department, IMF, Washington, DC.
———. 2011. “Enhancing International Monetary
Stability—A Role for the SDR?” Strategy, Policy,
and Review Department, IMF, Washington, DC.
Ito, Takatoshi, Satoshi Koibuchi, Kiyotaka Sato, and
Junko Shimizu. 2010. “Why Has the Yen Failed
to Become a Dominant Invoicing Currency in
Asia? A Firm-Level Analysis of Japanese Exporters’
Invoicing Behavior.” NBER Working Paper
16231, National Bureau of Economic Research,
Cambridge, MA.
Jeanne, Olivier, and Romain Rancière. 2006. “Th e
Optimal Level of International Reserves for
Emerging Market Countries: Formulas and
Applications.” IMF Working Paper WP/06/229,
International Monetary Fund, Washington, DC.
International Reserve Currency?” NBER Working
Paper 11510, National Bureau of Economic
Research, Cambridge, MA.
———. 2008. “Why the Euro Will Rival the Dollar.”
International Finance 11 (1): 49–73.
Cohen, Benjamin J. 1998. Th e Geography of Money.
Ithaca, NY: Cornell University Press.
———. 2000. “Life at the Top: International
Currencies in the Twenty-First Century.” Princeton
Essay in International Finance 221, International
Economics Section, Department of Economics,
Princeton University, Princeton, NJ.
Cohen, Stephen D. 1970. International Monetary
Reform: Th e Political Dimension, 1964–69. New
York: Praeger.
Cooper, Richard N. 1976. “International Monetary
Reform after Th ree Years.” Trialogue 10: 2–3.
Dailami, Mansoor, and Paul Masson. 2010. “Toward
a More Managed International Monetary System?”
International Journal 65 (2): 393–409.
Dobbs, Richard, Susan Lund, James Manyika,
and Charles Roxburgh. 2009. “An Exorbitant
Privilege? Implications of Reserve Currencies
for Competitiveness.” Discussion Paper,
McKinsey Global Institute. http://whatmatters.
mc k i n s e yd i g i t a l . c om /f i l e _ dow n loa d /11/
McKinsey_MGIReserve_Currency.pdf.
Drezner, Daniel W. 2010. “Will Currency Follow the
Flag?” International Relations of the Asia-Pacifi c
10 (3): 389–414.
ECB (European Central Bank). 2010. Th e International
Role of the Euro, July 2010. Frankfurt: ECB.
Eichengreen, Barry. 1987. “Conducting the International
Orchestra: Bank of England Leadership under the
Classical Gold Standard.” Journal of International
Money and Finance 6 (1): 5–20.
———. 2011. Exorbitant Privilege: Th e Rise and Fall of
the Dollar and the Future of the International Monetary
System. New York: Oxford University Press.
Fearon, James D. 1998. “Bargaining, Enforcement,
and International Cooperation.” International
Organization 52 (2): 269–305.
Frankel, Jeff rey A. 1999. “No Single Currency Regime
is Right for All Countries or at All Times.” Essays in
International Finance 215 (December 1998).
Giavazzi, Francesco, and Alberto Giovannini. 1989.
“Can the EMS Be Exported? Lessons from Ten
Years of Monetary Policy Coordination in Europe.”
CEPR Discussion Papers 285, Centre for Economic
Policy Research, London.
Goldberg, Linda S. 2010. “Is the International Role of
the Dollar Changing?” Current Issues in Economics
and Finance 16 (1): 1–7.

Global Development Horizons 2011 Multipolarity in International Finance 159
———. 2010b. “Supporting Pilot Program for RMB
Settlement of Cross-Border Trade Transactions to
Facilitate Trade and Investment.” People’s Bank of
China, Beijing. http://www.pbc.gov.cn/publish/
english/955/2010 /20101216101630952838958/20
101216101630952838958_.html.
Pesaran, M. Hashem, Yongcheol Shin, and Ronald
P. Smith. 1999. “Pooled Mean Group Estimation
of Dynamic Heterogeneous Panels.” Journal of
the American Statistical Association 94 (446):
621–34.
Posen, Adam S. 2008. “Why the Euro Will Not Rival
the Dollar.” International Finance 11 (1): 75–100.
Stiglitz, Joseph E., and Bruce Greenwald. 2010.
“Towards a New Global Reserve System.” Journal
of Globalization and Development 1 (2). http://www.
bepress.com/jgd/vol1/iss2/art10.
Tavlas, George S. 1991. “On the International Use
of Currencies: Th e Case of the Deutsche Mark.”
Princeton Essays in International Finance 181,
International Economics Section, Department of
Economics, Princeton University, Princeton, NJ.
Thimann, Christian. 2008. “Global Roles of
Currencies.” International Finance 11 (3): 211–45.
Triffi n, Robert. 1964. Th e Evolution of the International
Monetary System: Historical Reappraisal and Future
Perspectives. Princeton Studies in International
Finance 12, International Economics Section,
Department of Economics, Princeton University,
Princeton, NJ.
USAID (U.S. Agency for International Development).
“U.S. Overseas Loans and Grants, Obligations and
Loan Authorizations (Greenbook).” July 1, 1995–
September 30, 2009.
von Furstenberg, George, ed. 1983. International
Money and Credit: Th e Policy Roles. Washington,
DC: International Monetary Fund.
Williamson, John. 1993. “Exchange Rate
Management.” Economic Journal 103 (416): 188–97.
World Bank. 2006. Global Development Finance 2006:
Th e Development Potential of Surging Capital Flows.
Washington, DC: World Bank.
Kenen, Peter. 1983. Th e Role of the Dollar as an
International Currency. Washington, DC: Group
of Th irty.
Kindleberger, Charles P. 1973. Th e World in Depression,
1929–39. Berkeley, CA: University of California
Press.
Kiyotaki, Nobuhiro, and Randall Wright. 1989. “On
Money as a Medium of Exchange.” Journal of
Political Economy 97 (4): 927–54.
Lin, Justin Yifu, and Mansoor Dailami. 2010.
“Comments on Dealing with Global Imbalances.”
In Reconstructing the World Economy, ed. Olivier
Blanchard and Il SaKong, 111–20. Washington,
DC: International Monetary Fund and Korea
Development Institute.
Machlup, Fritz. 1968. Remaking the International
Monetary System: Th e Rio Agreement and Beyond.
Baltimore, MD: Johns Hopkins Press.
Masson, Paul. Forthcoming. “The Evolution of
Exchange Rate Regimes and Some Future
Perspectives.” In Th e Handbook of Exchange Rates,
ed. Jessica James, Ian W. Marsh, and Lucio Sarno.
New York: Wiley.
McCauley, Robert N. 2011. Th e Internationalisation
of the Renminbi. Basel, Switzerland: Bank for
International Settlements.
Mundaca, Gabriela. 2011. “Exchange Rate Uncertainty
and Optimal Participation in International Trade,”
Policy Research Working Paper Series 5593, World
Bank, Washington, DC.
Mussa, Michael, James Boughton, and Peter Isard, eds.
1996. Th e Future of the SDR in the Light of Changes
in the International Financial System. Washington,
DC: International Monetary Fund.
Obstfeld, Maurice, Jay C. Shambaugh, and Alan M.
Taylor. 2010. “Financial Stability, the Trilemma,
and International Reserves.” American Economic
Journal: Macroeconomics 2 (2): 57–94.
People’s Bank of China. 2010a. China Monetary
Policy Report, Quarter Four. Beijing: People’s
Bank of China http://www.pbc.gov.cn/publish/
english/3511/index.html.
