


Languages
Pages
Legal

ADSORPTION AND TRANSPORT PROPERTIES OF OXIDIZED MULTI-
WALLED CARBON NANOTUBES
by
Jin Yang
A dissertation submitted to Johns Hopkins University in conformity with the
requirements for the degree of Doctor of Philosophy
Baltimore, Maryland
March 2014
© 2014 Jin Yang
All Rights Reserved
ii
ABSTRACT
This work established quantitative relationships between the surface composition
of oxidized multi-walled carbon nanotubes (O-MWCNTs) and their adsorption and
transport properties under varying aquatic chemical conditions.
The effects of aquatic and surface chemistry on adsorption properties of O-
MWCNTs for Zn2+
and Ni2+
were found consistent with expectations based on prior study,
and were similar to aggregated and dispersed O-MWCNTs. New studies revealed,
however, a significant effect of O-MWCNT solid-to-liquid ratio on measured adsorption
isotherms. Although causes of such effects remain poorly understood, these results have
important environmental implications.
Transport of various O-MWCNTs through silica glass bead media was studied in
columns under conditions of steady flow and pulse inputs. These studies revealed that O-
MWCNT transport was affected by aquatic and surface chemistry in ways generally
consistent with theories of electrostatic interactions between surfaces. Dissolved Ca2+
destabilized O-MWCNTs more than Na+ and diminished the impact of O-MWCNT
surface chemistry on transport. NOM at low concentrations (<4 mg-C/L) significantly
stabilized O-MWCNTs under most conditions, including high ionic strength (IS) (10 mM
Ca2+
or 100 mM Na+).
For experiments when clean-bed filtration (CBF) dominated removal (i.e., pulse-
input injections), the mathematical relationship between kd and approach velocity
followed expectations of interception theory and suggested that CNT length is the
relevant length scale for prediction of collisions. For step-input conditions and
considering both breakthrough curves and in-situ concentrations of O-MWCNTs, models
iii
based on CBF and incorporating additional mechanisms of straining, site-blocking, and
multilayer deposition (ripening) were developed. Model sensitivity studies revealed that
at IS < 40 mM, site-blocking and straining were more important to model than other
mechanisms. At higher IS (≥ 60 mM), CBF and ripening were the only important
mechanisms to consider. At IS = 40 mM, site-blocking, straining and ripening were all
important to consider. Thus, IS is a key variable controlling which mechanisms must be
considered when modeling O-MWCNT interactions with silica-based porous media.
Overall, findings from this study have furthered the understanding of O-
MWCNTs in terms of their transport and adsorption properties. The results and
associated model development can improve interpretation and simulation of O-MWCNTs
behavior in aquatic systems.
Dissertation Readers:
Dr. William Ball, Johns Hopkins University (advisor)
Dr. Edward Bouwer, Johns Hopkins University
Dr. Kai Loon Chen, Johns Hopkins University
Dr. Howard Fairbrother, Johns Hopkins University
Dr. Alan Stone, Johns Hopkins University

iv
ACHNOWLEDGEMENTS
First and foremost, I would like to express my deepest gratitude to my advisor Dr.
William Ball, who has always been supportive and helpful. Bill has constantly
encouraged me to think independently and critically. Every time I thought I have found
answers to a problem, Bill asked questions that I could not answer right away. Bill has
also helped me with my writing skill with great patience.
I would also like to thank my committee members. Dr. Howard Fairbrother
provided me the opportunity to work in his lab for more than two years. Howard acted as
a second advisor during my dissertation research and provided tremendous help in
experimental design and data processing. I appreciate him for always being available
when I had questions or came across obstacles in my experiments. Dr. Kai Loon Chen
also helped me in many ways in my research, especially colloidal related theories. Dr.
Alan Stone was always the one to turn to when I had questions regarding aquatic
chemistry and he always had inspiring answers in return. Dr. Edward Bouwer gave me
valuable advises in our weekly Ball/Bouwer meetings and provided generous help when I
came across problems. I appreciate all the committee members for devoting their time for
my committee meeting, defense and thesis reading.
Other current and previous faculty members of DoGEE also helped me a lot. The
late Dr. Charlie O’Melia provided useful suggestions on my transport experiments. Dr.
Markus Hilpert answered a lot of my questions in hydrology. Dr. Lynn Roberts nicely
granted me the opportunity to TA for her where I learnt much. Dr. Seth Guikema and his
postdoc Allison Reilly helped me improve my skill with modeling and coding.

v
In addition to faculty members from DoGEE, I also want to express my sincere
gratitude to Dr. Stephane Ngueleu Kamangou and his advisors Prof. Olaf Cirpka and
Prof. Peter Grathwohl from University of Tuebingen in Germany, Dr. Kenneth Livi from
Departments of Earth and Planetary Sciences and Biology, and Professor Nathalie
Tufenkji from McGill University for their help and suggestions on my experiments and
simulation.
Friends and colleagues from DoGEE and Dr. Fairbrother’s group all deserve and
are with my sincere gratitude. Dr. Hyunhee Cho taught me how to do adsorption
measurements in an accurate way. Dr. Billy Smith initially set up the column system. Dr.
Julie Bitter helped me a lot in lab and has edited my writing for numerous times. David
Goodwin helped me with both the column and adsorption experiments. Zhifeng Yan, Dr.
Zhi Shi, Dr. Nathan Boland, Dr. Kevin Wepasnick, Mike Barkley, Dr. Chip Elliot, Dr.
Yongseok Hong, Dr. Amar Wadhawan, Dr. Katie Parry, Dr. Yaqi You, Dr. Phillip
Flanders, Dr. Samantha Rosenberg, Dr. Peng Yi, Li Tang, Dr. An Huynh, and Pavlo
Bohutskyi have all provided me lots of help with my experiments. Laura McDonald,
Dano Wilusz, Chris Kelly, and Miranda Gallagher helped me a lot with my writing. My
lab assistants Hannah Kim, Alex Dang, Chenqi Xie, Debjani Mallick, Peter Mellott, Gene
Patrick Geronimo, and Cynthia Chambers have also contributed significantly to my
research.
I would also like to thank current and previous front office staff Keith Ritchie
Adena Rojas, Christine Kavanagh, Robert Francisco, Denise Nowlin, Vicky Moreira, and
Joyce Moody. My research would not go so smoothly without their help and my lab
would not last for a month without help from Keith.

vi
Especially, I want to express my gratitude to DoGEE family for the anonymous
donation for my cat Daidai (Tara) when she had a severe accident and big surgery. I was
caught by surprise and was so touched by their great kindness and compassion.
I also want to thank my other friends and colleagures Dr. Yuqi Li, Dr. Meredith
Erb, Stephanie Lau, Xiaomeng Xia, Dr. Jing Chen, Dr. Shawn Li, Xin Tang, Dr. Chang
Lang, Dr. Lijun Xia, Dr. Yang Li, Man Li, XinXing Zhang, Jing Li, Dr. Yajing Zhang,
Yao Li, Ting Zhang, Ying Zhang, and Dr. Jun Zhong for making my Ph.D. Journey fun.
Last but not the least, I would like to thank my family. My parents, Daquan Yang
and Xiaojuan Zhu, have raised me and supported me all these years. Their constant
encouragement and stimulation propelled me through my early education, and ultimately
resulted in my pursuit of a scientific career today. I would not be the person I am without
their devotion. They also generously provided me with funds for my first year of studies
as a Master’s student here at Johns Hopkins. I also want to thank my husband Xiaolei
Zhu. Xiaolei is beside me and absolutely supportive at all times. My Ph.D. journey was
sometimes stressful and he was always there when I could not handle the situation on my
own. I would not have gained the PhD without him.

vii
TABLE OF CONTENTS
Chapter 1 . Introduction 1
1.1 Properties and Applications of Carbon Nanotubes 1
1.2 Production of CNTs 2
1.3 Possible Risks to the Environment from CNT Production and Use 3
1.4 Motivation for This Research 4
1.4.1 The Need to Study the Fate and Transport of CNTs 4
1.4.2 The Need to Study the Interactions of CNTs with Other Contaminants 6
1.5 Recent Studies of the Aggregation, Transport and Adsorption Properties of
CNTs 7
1.5.1 Homo-Aggregation of CNTs 7
1.5.2 Hetero-Aggregation of CNTs 8
1.5.3 Deposition and Transport of CNTs 9
1.5.4 Adsorption Properties of CNTs 11
1.6 Research Questions 12
1.7 Objectives and Outline 13
1.8 Cited References 14
Chapter 2 . Adsorption of Zn2+
and Ni2+
onto Oxidized Multi-Walled
Carbon Nanotubes: Effects of Aquatic and Surface
viii
Chemistry, O-MWCNT Aggregation State and Solid-to-
Liquid Ratio 21
2.1 Introduction 22
2.2 Experimental Methods 28
2.2.1 Preparation of Adsorbents 28
2.2.2 Characterization of Adsorbents 29
2.2.3 Preparation of dispersed and non-disaggregated O-MWCNTs 30
2.2.4 Preparation of Adsorbates 30
2.2.5 Adsorption Experiments 31
2.2.6 Measurement of Adsorbate Concentrations 35
2.2.7 Mathematical Modeling of Adsorption Isotherms 36
2.3 Results and Discussions 37
2.3.1 Characterization of O-MWCNTs 37
2.3.2 Kinetic Study of O-MWCNT Adsorption 38
2.3.3 Effects of pH and ionic strength 39
2.3.4 Effect of Competing Organic Compound 42
2.3.5 Effect of Surface Chemistry 44
2.3.6 Effect of Aggregation States 49
2.3.7 Effect of Solid-to-Liquid Ratio in the System 51
2.4 Implication of the Study 58
2.5 Cited References 58

ix
Chapter 3 . Transport of Oxidized Multi-Walled Carbon Nanotubes
through Silica Based Porous Media: Influences of Aquatic
Chemistry, Surface Chemistry and Natural Organic Matter 62
3.1 Introduction 63
3.2 Experimental Methods 67
3.2.1 Surface Oxidation of MWCNTs 67
3.2.2 Characterization of O-MWCNTs 68
3.2.3 Preparation of O-MWCNT Dispersion 69
3.2.4 Preparation of Suwannee River Natural Organic Matter (SRNOM) 71
3.2.5 Preparation of Glass Beads 71
3.2.6 Preliminary Study of Cleaning Effects on Reproducibility 75
3.2.7 Wet Packing of the Columns 77
3.2.8 Transport Experiments 79
3.2.9 Quantitative Analysis of Column Effluent Data 83
3.3 Results and Discussion 85
3.3.1 Importance of Appropriately Preparing Porous Media 85
3.3.2 O-MWCNT Transport in the Absence of Deposition 86
3.3.3 Evaluation of O-MWCNT Aggregation during Transport 88
3.3.4 Effect of IS 90
3.3.5 Effect of pH 96
3.3.6 Effect of Surface Oxygen on O-MWCNTs 98
3.3.7 Effect of Natural Organic Matter (NOM) 101

x
3.4 Acknowledgements 107
3.5 Cited References 107
Chapter 4 . Transport of Oxidized Multi-Walled Carbon Nanotubes
through Silica Based Porous Media: Investigation of
Removal Mechanisms and Mathematical Modeling 113
4.1 Introduction 114
4.2 Experimental Methods 119
4.2.1 Surface Oxidation, Characterization, and Preparation of Colloidal O-
MWCNTs. 119
4.2.2 Preparation of Glass Beads and Packed Columns. 120
4.2.3 Transport Experiments 121
4.2.4 Dissection of Columns 124
4.3 Interpretive Models and Quantitative Analysis 128
4.3.1 Estimation of Dispersion in the Column System 128
4.3.2 Estimations of O-MWCNT Deposition Mechanism for Experiments Using
Pulse-Input Method 130
4.3.3 Quantitative Analysis for Results Obtained from Transport Experiments
Using Step-Input Method 133
4.4 Results and Discussion 138
4.4.1 Estimation of Dispersion 138
4.4.2 Effect of Approach Velocity on the Deposition Rate Coefficient 141

xi
4.4.3 Analysis of Breakthrough Curves and Retention Profiles 144
4.4.4 Numerical Simulation Using Traditional CBF Model and Additional
Models 145
4.5 Conclusions 154
4.6 Cited References 154
Chapter 5 . Sensitivity Analysis of Simulations Conducted for
Experimental Results Obtained Using Step-Input Method
under Varied Ionic Strengths. 159
5.1 Introduction 159
5.2 Methodological Approach to Sensitivity Analysis 160
5.3 Results and Discussions 161
5.3.1 Contribution of “Clean-Bed” Deposition 161
5.3.2 Contribution of Site-Blocking Removal Mechanism 164
5.3.3 Contribution of the Limited Smax 168
5.3.4 Contribution of Straining Removal Mechanism 171
5.3.5 Contribution of Ripening Removal Mechanism 173
5.3.6 Contributions of all effects at varied background IS 177
5.4 Conclusion 180
Chapter 6 . Summary, Application, and Future Work 181
6.1 Summary 181

xii
6.1.1 Sorption Properties of O-MWCNTs 181
6.1.2 Transport Properties of O-MWCNTs 183
6.2 Application 186
6.3 Future Work 188
6.3.1 Investigation on Physical Meaning of Solid-to-Liquid Effect 189
6.3.2 Investigation of O-MWCNT Transport Properties under More
Environmentally Relevant Conditions 190
6.3.3 Further Improvement and Testing of the Developed Model 190
6.4 Cited References 191
Curriculum Vitae 194
xiii
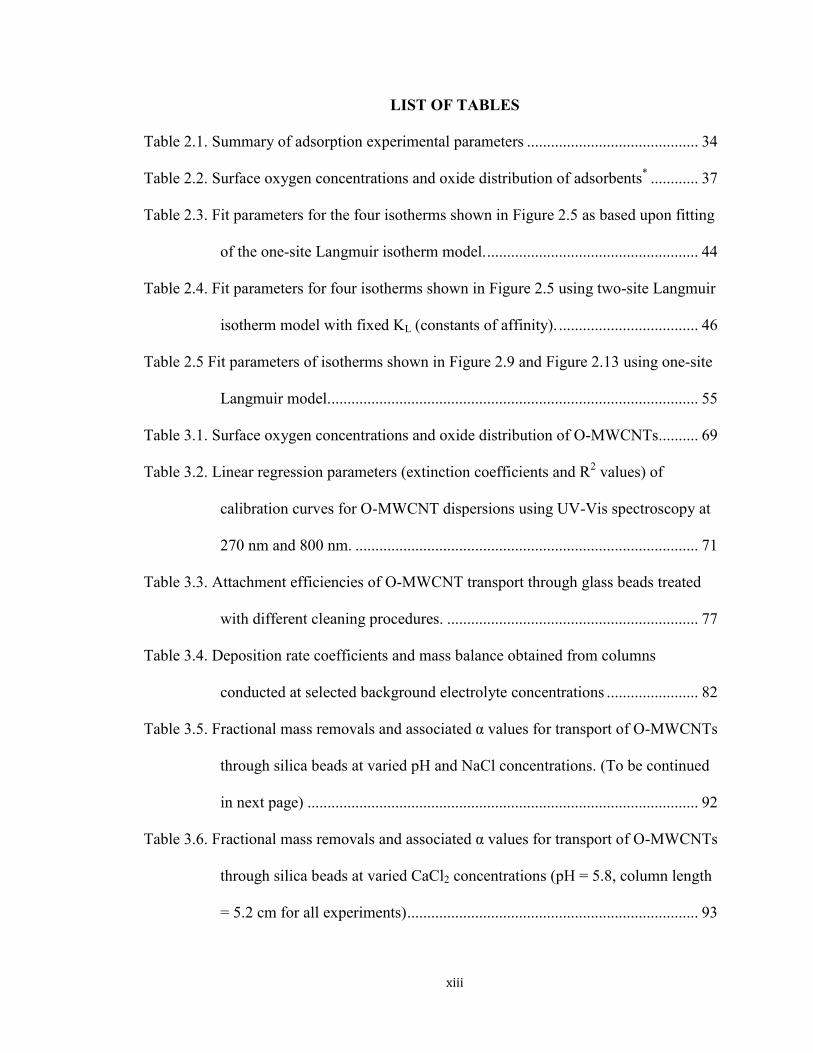
LIST OF TABLES
Table 2.1. Summary of adsorption experimental parameters ........................................... 34
Table 2.2. Surface oxygen concentrations and oxide distribution of adsorbents* ............ 37
Table 2.3. Fit parameters for the four isotherms shown in Figure 2.5 as based upon fitting
of the one-site Langmuir isotherm model. ..................................................... 44
Table 2.4. Fit parameters for four isotherms shown in Figure 2.5 using two-site Langmuir
isotherm model with fixed KL (constants of affinity). ................................... 46
Table 2.5 Fit parameters of isotherms shown in Figure 2.9 and Figure 2.13 using one-site
Langmuir model. ............................................................................................ 55
Table 3.1. Surface oxygen concentrations and oxide distribution of O-MWCNTs .......... 69
Table 3.2. Linear regression parameters (extinction coefficients and R2 values) of
calibration curves for O-MWCNT dispersions using UV-Vis spectroscopy at
270 nm and 800 nm. ...................................................................................... 71
Table 3.3. Attachment efficiencies of O-MWCNT transport through glass beads treated
with different cleaning procedures. ............................................................... 77
Table 3.4. Deposition rate coefficients and mass balance obtained from columns
conducted at selected background electrolyte concentrations ....................... 82
Table 3.5. Fractional mass removals and associated α values for transport of O-MWCNTs
through silica beads at varied pH and NaCl concentrations. (To be continued
in next page) .................................................................................................. 92
Table 3.6. Fractional mass removals and associated α values for transport of O-MWCNTs
through silica beads at varied CaCl2 concentrations (pH = 5.8, column length
= 5.2 cm for all experiments) ......................................................................... 93

xiv
Table 3.7. Fractional mass removals and associated α values for transport of O-MWCNTs
through silica beads in the presence of SRNOM (pH = 5.8 for all
experiments) (To be continued in next page) ................................................ 94
Table 4.1. Mass balance of transport experiments with BTCs and retention profiles .... 127
Table 4.2 Summary of dispersion coefficient D and deposition rate coefficient kd at varied
approach velocity v for transport experiments conducted using 5.2 cm
columns at pH 5.8 ± 0.2 and 30 mM NaCl as shown in Figure 4.5. ............ 141
Table 4.3. Simulated results using traditional CBFT, CBFT and site-blocking model,
CBFT and straining model, CBFT and ripening model and all four models.
..................................................................................................................... 146
xv
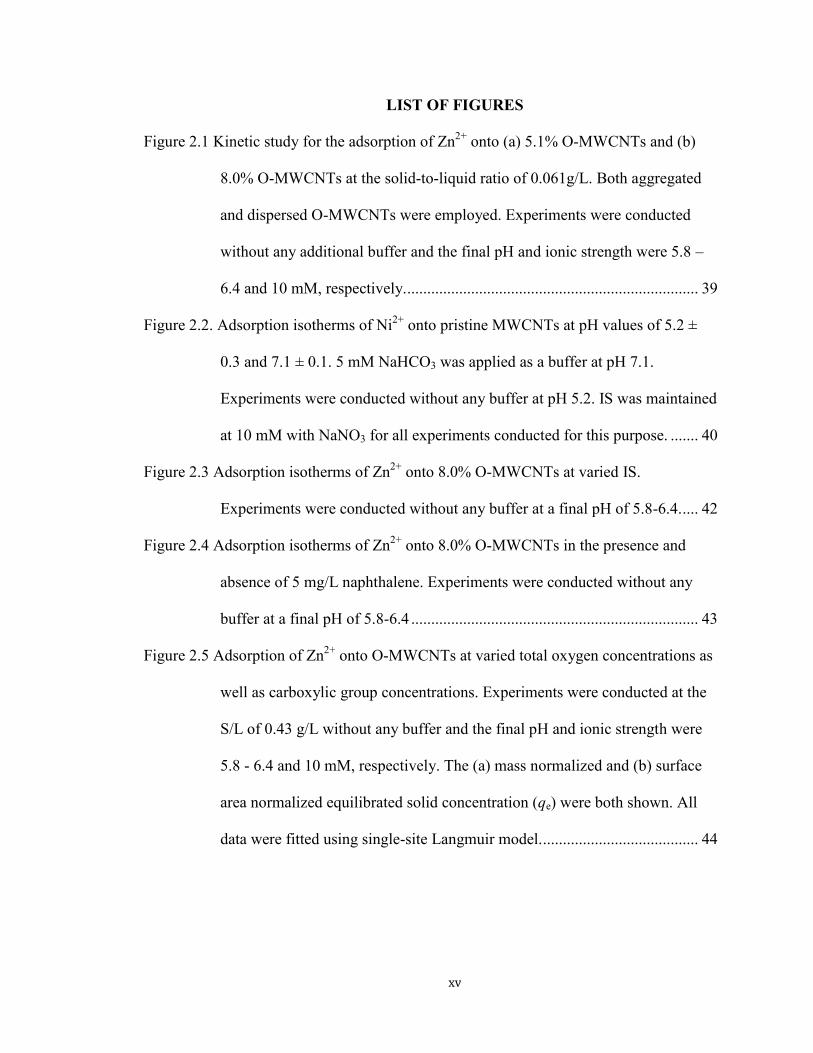
LIST OF FIGURES
Figure 2.1 Kinetic study for the adsorption of Zn2+
onto (a) 5.1% O-MWCNTs and (b)
8.0% O-MWCNTs at the solid-to-liquid ratio of 0.061g/L. Both aggregated
and dispersed O-MWCNTs were employed. Experiments were conducted
without any additional buffer and the final pH and ionic strength were 5.8 –
6.4 and 10 mM, respectively. ......................................................................... 39
Figure 2.2. Adsorption isotherms of Ni2+
onto pristine MWCNTs at pH values of 5.2 ±
0.3 and 7.1 ± 0.1. 5 mM NaHCO3 was applied as a buffer at pH 7.1.
Experiments were conducted without any buffer at pH 5.2. IS was maintained
at 10 mM with NaNO3 for all experiments conducted for this purpose. ....... 40
Figure 2.3 Adsorption isotherms of Zn2+
onto 8.0% O-MWCNTs at varied IS.
Experiments were conducted without any buffer at a final pH of 5.8-6.4. .... 42
Figure 2.4 Adsorption isotherms of Zn2+
onto 8.0% O-MWCNTs in the presence and
absence of 5 mg/L naphthalene. Experiments were conducted without any
buffer at a final pH of 5.8-6.4 ........................................................................ 43
Figure 2.5 Adsorption of Zn2+
onto O-MWCNTs at varied total oxygen concentrations as
well as carboxylic group concentrations. Experiments were conducted at the
S/L of 0.43 g/L without any buffer and the final pH and ionic strength were
5.8 - 6.4 and 10 mM, respectively. The (a) mass normalized and (b) surface
area normalized equilibrated solid concentration (qe) were both shown. All
data were fitted using single-site Langmuir model. ....................................... 44

xvi
Figure 2.6 Two-site Langmuir isotherm fit of adsorption isotherms shown in Figure 2.5.
The isotherms shown were obtained using (a) 5.1% O-MWCNTs, (b) 5.4%
O-MWCNTs, (c) 6.4% O-MWCNTs and (d) 7.1% O-MWCNTs. ............... 47
Figure 2.7 Adsorption of Zn2+
onto dispersed O-MWCNTs at varied total oxygen
concentrations. Experiments were conducted at the S/L of (a) 0.061 g/L and
(b) 0.016 g/L. No buffer was employed and the final pH and ionic strength
were 5.8 ± 0.2 and 10 mM, respectively. ....................................................... 48
Figure 2.8 Adsorption of Zn2+
onto (a) 5.1% O-MWCNTs and (b) 8.0% O-MWCNTs at
S/L of 0.061 g/L. Both aggregated and dispersed O-MWCNTs were used as
sorbents. No buffer was used in the experiments and the final pH and ionic
strength were 5.8 ± 0.2 and 10 mM, respectively. ......................................... 50
Figure 2.9 Adsorption of Zn2+
onto (a) 5.1% O-MWCNTs and (b) 8.0% O-MWCNTs at
varied solid-to-liquid ratios as well as aggregation states. Experiments were
conducted without any buffer, and the final pH and ionic strength were 5.8 ±
0.2 and 10 mM, respectively. ......................................................................... 52
Figure 2.10 Adsorption of Zn2+
onto dispersed (a) 5.1% O-MWCNTs and (b) 8.0% O-
MWCNTs at varied solid-to-liquid ratios. Experiments were conducted
without any buffer, and the final pH and ionic strength were 5.8 – 6.4 and 10
mM, respectively. .......................................................................................... 53
Figure 2.11 Adsorption of Zn2+
onto 8.0% O-MWCNTs at the solid-to-liquid ratios of (a)
0.429 g/L and lower S/L and (b) 0.031 g/L. Experiments were conducted
without any buffer and the final pH and ionic strength were 5.8 - 6.4 and 10
mM, respectively. .......................................................................................... 54
xvii
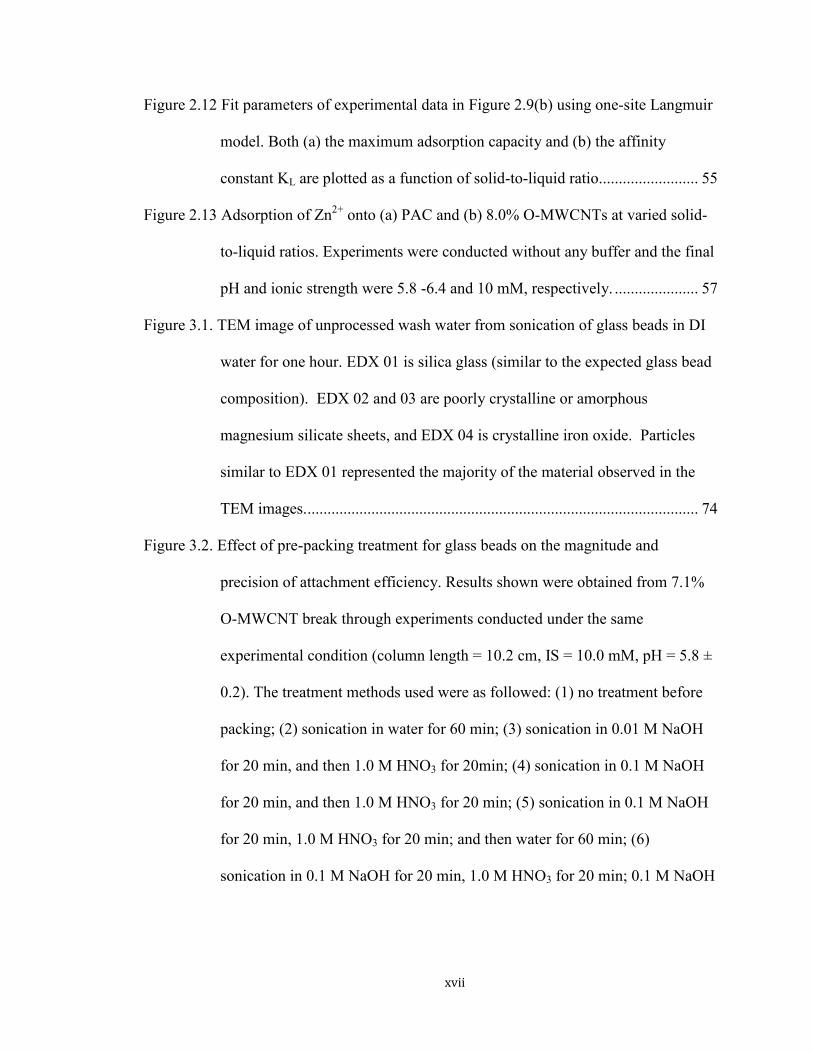
Figure 2.12 Fit parameters of experimental data in Figure 2.9(b) using one-site Langmuir
model. Both (a) the maximum adsorption capacity and (b) the affinity
constant KL are plotted as a function of solid-to-liquid ratio......................... 55
Figure 2.13 Adsorption of Zn2+
onto (a) PAC and (b) 8.0% O-MWCNTs at varied solid-
to-liquid ratios. Experiments were conducted without any buffer and the final
pH and ionic strength were 5.8 -6.4 and 10 mM, respectively. ..................... 57
Figure 3.1. TEM image of unprocessed wash water from sonication of glass beads in DI
water for one hour. EDX 01 is silica glass (similar to the expected glass bead
composition). EDX 02 and 03 are poorly crystalline or amorphous
magnesium silicate sheets, and EDX 04 is crystalline iron oxide. Particles
similar to EDX 01 represented the majority of the material observed in the
TEM images. .................................................................................................. 74
Figure 3.2. Effect of pre-packing treatment for glass beads on the magnitude and
precision of attachment efficiency. Results shown were obtained from 7.1%
O-MWCNT break through experiments conducted under the same
experimental condition (column length = 10.2 cm, IS = 10.0 mM, pH = 5.8 ±
0.2). The treatment methods used were as followed: (1) no treatment before
packing; (2) sonication in water for 60 min; (3) sonication in 0.01 M NaOH
for 20 min, and then 1.0 M HNO3 for 20min; (4) sonication in 0.1 M NaOH
for 20 min, and then 1.0 M HNO3 for 20 min; (5) sonication in 0.1 M NaOH
for 20 min, 1.0 M HNO3 for 20 min; and then water for 60 min; (6)
sonication in 0.1 M NaOH for 20 min, 1.0 M HNO3 for 20 min; 0.1 M NaOH

xviii
again for 20 min, 1.0 M HNO3 again for 20 min; and then water for 60 min.
....................................................................................................................... 76
Figure 3.3. The schematic (a) and picture (b) of the packed-bed columns used in this
study. .............................................................................................................. 78
Figure 3.4. Dual-pump column filtration system with in-line mixer, column, and UV-Vis
detection source for pulse-input method. ....................................................... 79
Figure 3.5. UV-Vis spectra of solutions containing 2.0 mg/L O-MWCNTs in water (red
dashed line), 4.2 mg DOC/L NOM (blue dash-dot line) and 2.0 mg/L O-
MWCNTs plus 4.2 mg DOC/L NOM (solid black line). The inset shows the
region between 800-900 nm where NOM does not has absorption. Most
results in experiments were obtained at λ = 270 nm (with subtraction of the
background absorption due to NOM). However, comparisons of results were
also made at λ = 800 nm where there is no interference from NOM. ........... 81
Figure 3.6. Breakthrough curves of 7.1% O-MWCNTs passing through 5.2 cm length
columns at pH 5.8 ± 0.2, plotted as a function of NaCl concentration. The
normalized concentration is determined as C/C0, where C0 is as defined in the
text. ................................................................................................................ 87
Figure 3.7. Change in attachment efficiency as a function of injected particle
concentration for O-MWCNTs with total oxygen concentration of 7.1% at (a)
pH 4.0 and 5.0 mM NaCl, and (b) pH 5.8 and 40 mM NaCl. ....................... 89
Figure 3.8. Aggregation profile of (a) 7.1% O-MWCNTs at pH 5.8 ± 0.2, (b) 7.1% O-
MWCNTs at pH 4.0 ± 0.2, and (c) 3.0% O-MWCNTs at pH 5.8 ± 0.2 under
varied NaCl concentrations as indicated by legends at the unit of mM. The

xix
aggregation profiles were obtained following method described in Smith et
al.1 All experiments were conducted under pH 6.0 ± 0.2 with O-MWCNT
concentration of 0.8 mg/L. ............................................................................. 89
Figure 3.9. Critical deposition curves for O-MWCNTs with total oxygen concentrations
of (a) 3.0% and (b) 7.1% measured at pH 10 (filled blue circles), pH 5.8
(open red triangles), and pH 4 (filled black squares). .................................... 96
Figure 3.10. Zeta potential of 7.1% O-MWCNTs at varied pH and at the NaCl
concentration of 1 mM. The zeta potential profile obtained for 7.1% O-
MWCNTs is similar to those obtained in our previous studies1 using O-
MWCNTs from the same supplier (Nanolab) and prepared with identical
functionalization method. .............................................................................. 98
Figure 3.11. Critical deposition curves of O-MWCNTs with varied surface oxygen
concentration at pH 5.8 ± 0.2 in the presence of (a) NaCl and (b) CaCl2 as
background electrolytes. .............................................................................. 100
Figure 3.12. Breakthrough curves of 7.1% O-MWCNTs passing through 5.2 cm long
columns at 10 mM CaCl2 and pH 5.8 ± 0.2, plotted as a function of SRNOM
concentration (mg DOC/L). The dashed line shows a breakthrough curve of
O-MWCNTs (SRNOM was present at 0.82 mg DOC/L for this experiment.)
in the absence of any added background electrolyte. The normalized
concentration is determined as C/C0, where C0 is as defined in the text. .... 102
Figure 3.13. Attachment efficiencies obtained using 7.1% O-MWCNTs (filled red
triangles) and 8.3% O-MWCNTs (open blue squares) from breakthrough

xx
experiments conducted at pH 5.8 ± 0.2 and in the presence of (a) 5 mM CaCl2
and (b) 10 mM CaCl2 plotted as a function of SRNOM concentration. ...... 103
Figure 3.14. Attachment efficiencies of O-MWCNTs with a total surface oxygen
concentration of 5.1% as a function of SRNOM concentration at pH 5.8 ± 0.2
with 5mM CaCl2 (red triangles), and 10mM CaCl2 (blue diamonds). ........ 104
Figure 4.1. Dual-pump column filtration system with in-line mixer, column, and UV-vis
detection source for step-input method........................................................ 122
Figure 4.2. UV-vis spectra of solutions containing 5.2 mg/L O-MWCNTs in water (red
dashed line), 1% Triton X-100 (blue dash-dot line) and 5.2 mg/L O-
MWCNTs plus 1% Triton X-100 (solid black line). The inset shows the
region between 800 and 900 nm where Triton X-100 does not show
absorption. ................................................................................................... 126
Figure 4.3. Typical breakthrough curves obtained through 10.2 cm column using pulse-
input method before and after the correction for the effect of flow-through
cuvette using Eq. 4.5. ................................................................................... 139
Figure 4.4. Breakthrough curves obtained by passing 7.1% O-MWCNTs through a 10.2
cm column at the flow rate of 7 mL/min and IS of 0 mM. The BTC was fitted
using Eq. 4.7 to obtain the hydrodynamic dispersion coefficient D. ........... 140
Figure 4.5. Change of deposition rate coefficients of 7.1% O-MWCNTs as a function of
approach velocity. The O-MWCNTs were passed through 5.2 cm columns at
pH 5.8 ± 0.2 and 30 mM NaCl. ................................................................... 142

xxi
Figure 4.6. (a) Breakthrough curves and (b) retention profiles obtained by passing 7.1%
O-MWCNTs through 10.2 cm columns at varied NaCl concentrations (pH =
5.8± 0.2). ...................................................................................................... 144
Figure 4.7. Breakthrough curves and retention profiles obtained by passing 7.1% O-
MWCNTs through 10.2 cm columns at pH 5.8± 0.2 and NaCl concentrations
of (a) 5 mM, (b) 10 mM, (c) 40 mM (d) 60 mM and (e) 357 mM.
Experimental results were each fitted with four models as illustrated in text.
..................................................................................................................... 148
Figure 4.8. Simulation results of BTC obtained at IS = 40 mM. (Same as Figure 4.7(c1)).
..................................................................................................................... 150
Figure 4.9. Simulation results of retention profiles obtained at IS = 10 mM. (Same as
Figure 4.7(b2)). ............................................................................................ 152
Figure 5.1. Analysis of the contributions of CBF for experimental results obtained at pH
5.8± 0.2 and NaCl concentrations of (a) 5 mM, (b) 10 mM, (c) 40 mM, (d) 60
mM and (e) 357 mM. The CBF term kd under each condition was reduced to
10% and 50% of its original value to analyze its importance and contribution.
..................................................................................................................... 163
Figure 5.2. Analysis of the contributions of site-blocking removal mechanism for
experimental results obtained at pH 5.8± 0.2 and NaCl concentrations of (a) 5
mM, (b) 10 mM, (c) 40 mM, (d) 60 mM and (e) 357 mM. The blocking term
kb under each condition was reduced to 10% and 50% of its original value to
analyze its importance and contribution. ..................................................... 166

xxii
Figure 5.3. Analysis of the Smax effect on experimental results obtained at pH 5.8± 0.2
and NaCl concentrations of (a) 5 mM, (b) 10 mM, (c) 40 mM, (d) 60 mM and
(e) 357 mM. The Smax under each condition was increased to infinitely large
to analyze its importance and contribution. ................................................. 170
Figure 5.4. Analysis of the contributions of straining removal mechanism for
experimental results obtained at pH 5.8± 0.2 and NaCl concentrations of (a) 5
mM, (b) 10 mM, (c) 40 mM, (d) 60 mM and (e) 357 mM. The straining term
ks under each condition was reduced to 10% and 50% of its original value to
analyze its importance and contribution. ..................................................... 173
Figure 5.5. Analysis of the contributions of ripening removal mechanism for
experimental results obtained at pH 5.8± 0.2 and NaCl concentrations of (a) 5
mM, (b) 10 mM, (c) 40 mM, (d) 60 mM and (e) 357 mM. The ripening term
kr under each condition was reduced to 10% and 50% of its original value to
analyze its importance and contribution. ..................................................... 175
Figure 5.6. Relative contributions of CBF, site-blocking, straining, and ripening effects
on 8% O-MWCNT removal at varied ionic strength. .................................. 178
Figure 5.7. Amount of 8% O-MWCNT removed by CBF, site-blocking, straining, and
ripening effects at varied ionic strength. ...................................................... 179
1
Chapter 1. Introduction
1.1 Properties and Applications of Carbon Nanotubes
Carbon nanotubes (CNTs) are “needle-like hollow tubes” made of cylindrical
sheets of graphene.1 CNTs include both single-walled carbon nanotubes (SWCNTs),
which contain only one graphitic layer, and multi-walled carbon nanotubes (MWCNTs),
which contain two or more (often between 7-10) concentric layers of graphitic sheets
with an interlayer distance of ~3.4 Ǻ.1, 2
CNTs range from 2 to 30 nm in diameter and up
to 1 μm or more in length, as based on direct observation with TEM.1-5
Since their
discovery, CNTs have been well known for their unique seamless cylindrical structure
with nano-scale diameters and graphene rolls with three possible primary rolling
patterns.1-3
The unique structure leads to remarkable properties such as large surface area
to volume ratios, high aspect ratios, low densities, high mechanical and tensile strengths,
high electric and thermal conductivity, strong non-linear optical property, high hydrogen
storage potentials, high adsorbency and antimicrobial property compared to other
materials.3, 4, 6-9
For instance, the values of Young’s modulus for CNTs are exceptionally
high,10
and it has been reported that the strength-to-weight ratio of SWCNTs is 460 times
that of steel.8
The novel physicochemical properties of CNTs, as given by their unique structure
and overall chemical composition, have led to various commercial applications of CNTs
and their derivatives in a variety of fields. For instance, CNTs are used as proximal probe
tips of scanning tunneling microscope (STM) due to their small size, high electrical
conductivity and high modulus.11
They can also be used as nanotweezers to handle
2
nanoclusters by moving them as well as probing their electronic structure.12
CNTs not
only exhibit high electrical conductivity, but their electrical conductivity can also be
changed significantly by exposure to certain gases such as NO2 or NH3,13
making them an
excellent choice for chemical sensors. Moreover, CNTs have been added into composite
materials such as polymer matrices to either enhance the strength and modulus of the
composite materials14
or to serve as antimicrobial agents.15, 16
The high strength and
resilience of the resulting composite materials that contain CNTs have been used in fields
of plastic manufacture and automobile manufacture. Other composite materials, such as
membranes and polymers, have been used in water purification systems due to their
antimicrobial property. CNTs are also viable as candidates for the storage of H2, as
relevant to the promotion of H2 as a new fuel source.17-19
A high degree of H2 storage in
CNTs has been reported in experimental literature,17-19
although theoretical explanations
for such phenomena are still incomplete. 17-19
1.2 Production of CNTs
Because of their wide range of current and potential future applications,
production of CNTs has increased exponentially in recent years.17
According to a report
from Innovation Research and Products Inc. (iRAP), the production capacity for
nanocarbon products, including SWCNTs, MWCNTs, fullerenes, graphene, carbon
nanofibers and nanodiamonds, has increased from 996 tons in 2008 to 4065 tons in
2010.17
This number is expected to exceed 12,300 tons in 2015 with a production value
of roughly $1.3 billion.17
The production of SWCNTs and MWCNTs has been predicted
to increase at a compound annual growth rate of 32.5% starting in 2010 and reaching
14,110 tons by 2016.20
MWCNTs, with an annual production about two times higher than

3
SWCNTs, are expected to dominate the product market for at the least next two years
because of their lower production cost and availability in large quantities.21
1.3 Possible Risks to the Environment from CNT Production and Use
The rapid growth in CNT production is undoubtedly accompanied by elevated
potential risks for the natural environment, including surface and ground water systems.
Although pathways for release of CNTs are still under investigation,22-24
and accurate
detection and quantification in actual matrices is still not possible, it is reasonable to
assume that during the processes of production, application and disposal, CNTs can
access aqueous environments through municipal and industrial wastewater, solid waste
leachate, precipitation from the atmosphere following air pollution events, or from direct
input via spills or misuse.25
Aqueous contamination may also occur as the result of long-
term degradation of the commercial materials into which CNTs are embedded.22-24
As a
new material, the potential hazards of CNTs to humans, other organisms and the
ecosystem are not yet fully understood, but biomagnifications through aquatic
ecosystems is a concern, including the possibility of toxic accumulations. In fact, some
potentially harmful human health effects of MWCNTs have already been reported by
some investigators.26, 27
For instance, Sayes et al.26
reported that suspended SWCNTs
selectively deposited on the membranes of human dermal fibroblasts (HDF). Another
research group, Patlolla et al.,28
reported that MWCNTs induced the viability loss of
HDF through DNA damage.
Given these concerns, and the importance of transport as a potential exposure
pathway, CNT behavior in aquatic systems is important to understand. The so-called
pristine CNTs (i.e., CNTs whose surface have not been modified after initial production)

4
are mostly hydrophobic and unstable in water systems, limiting their ability to travel long
distances in natural environments.9, 29
On the other hand, however, CNT surfaces are
often subjected to oxidation through intentional functionalization processes.9, 29
The
existence of hydrophilic groups such as oxides on CNT surfaces have been shown to
dramatically influence their environmentally relevant properties, especially stability in
aqueous systems.29, 30
In addition to chemical incorporated oxygen functional groups,
adsorbed natural organic matter (NOM) has also been reported to significantly stabilize
CNTs in aqueous system.31-35
Such modifications can thus significantly increase the risk
of CNTs.
In addition, CNTs’ large specific surface area, which, together with surface oxides,
enhances their ability to strongly interact with other chemicals in their vicinity, creating
the possibility for their presence to substantially change the distribution, availability and
transport properties of other contaminants such as heavy metals and organic
compounds.26, 36
Previously established risk estimation of these other types of
contaminants may therefore need to be re-evaluated and possibly altered for situations
when CNTs are present.
Overall, the unknown effects of CNTs on the environment and on other
contaminants are concerns that need to be addressed through proper research.
1.4 Motivation for This Research
1.4.1 The Need to Study the Fate and Transport of CNTs
CNT fate and transport studies are necessary for the estimation of their potential
risks to environmental and human receptors. These studies are essential for the
establishment of a comprehensive understanding of overall risk, as needed to establish an
5
appropriate regulatory system. In this regard, it is important to recognize the fate of CNTs
is heavily dependent on their aggregation, deposition, and transport properties, all of
which will be strongly affected by CNT surface chemistry and the surrounding aquatic
chemistry.29-31, 34
As mentioned above, CNT surfaces are often oxidized in the process of
production to increase their stability in polar solvents37-42
or to improve their
bioavailability as drug delivery carriers.43
Surface oxides can also be introduced onto the
surface of CNTs inadvertently as a result of purification processes used in industry or due
to incidental exposure to oxidizing agents such as UV radiation and/or ozone.26, 29
The
degree of surface functionalization as well as the nature and different distribution of
functional groups grafted onto the surface of CNTs varies significantly with the type and
intensity of the oxidation processes, and these properties will in turn alter the aggregation
and transport properties of CNTs.26, 29
In the aqueous environment, MWCNTs with surface oxides such as hydroxyl and
carboxylic acid groups on their surface will be negatively charged under typical
environmental conditions, e.g. pH 6-8, which will affect their interactions with other
MWCNTs, particles in suspension or collector surfaces that they encounter. It is well
known that electrostatic repulsive forces between like-charged particles will be affected
by changes in pH and ionic strength (IS).29, 44
Changing these factors will either increase
(with increasing pH) or screen (with increasing IS) the negative charges on the CNT
surface and therefore change the nature and compressed thickness of the diffuse layer of
ions surrounding each particle. Early attempts to quantitatively describe such phenomena
were provided by Derjaguin-Landau45, 46
and Verwey-Overbeek47
and have been further

6
developed by others over time.48
The basic theory describing the balance of electrostatic
interactions and shorter-range chemical forces is now generally referenced as DLVO
theory, although more complex models have also been developed to supplement this
theory with regard to more complex and short-range interactions.49
The situation can be
especially complex in the presence of surfactant molecules or other polymeric or
macromolecular adsorbents such as NOM, which can attach to the particles or collectors
causing particles to experience additional steric and electrostatic interactions with each
other and other surfaces. Thus, the aggregation, deposition, and transport behavior of
colloidal particles will be significantly changed by the presence of such materials. 50, 51
In the past, colloidal aggregation and transport have been studied extensively
through both experimental and modeling approaches.52-55
However, because the
properties of CNTs are in many ways unique relative to other colloids, new studies are
needed to better understand their environmental fate in water.
1.4.2 The Need to Study the Interactions of CNTs with Other Contaminants
To fully investigate the potential risk of CNTs, we have to better understand not
only their environmental fate, but also their potential associations with other pre-existing
chemicals and the mutual impacts of such associations on the movements of both CNTs
and other chemicals. When considering their interactions with other contaminants,
sorption properties are important to understand, including the influences of both CNT
surface chemistry and the surrounding aquatic chemistry.56, 57
CNTs are now well known
to be good adsorbents for hydrophobic organic chemicals (HOCs) as well as heavy metal
contaminants.57-61
With the rapidly growing production of CNTs, there is an increased

7
likelihood of CNTs to adsorb those contaminants and therefore alter their distributions
and movement.
1.5 Recent Studies of the Aggregation, Transport and Adsorption
Properties of CNTs
1.5.1 Homo-Aggregation of CNTs
Homo-aggregation of CNTs has been studied intensively in the past several
years.34, 35, 62-64
Such studies have revealed a major impact of pH and IS on the
aggregation properties of CNTs in a manner that is qualitatively consistent with DLVO
theory.29
Calcium and NOM have also been shown to play an important role in affecting
the aggregation behavior of CNTs via specific ion interactions and the steric effect,
respectively.34, 64
The effect of surface chemistry on the homo-aggregation of oxidized-
MWCNTs (O-MWCNTs) has also been studied.29, 35
For example, Smith et al.29
studied
the effect of NaCl concentration, pH value and surface chemistry on the aggregation
kinetics of O-MWCNTs using time resolved dynamic light scattering (TR-DLS). The
authors reported accelerated aggregation of MWCNTs with increasing NaCl
concentration or decreasing pH, while O-MWCNTs at higher surface oxygen
concentration showed higher stability at identical aquatic conditions. Hyung et al.31
reported that for any given mass of added MWCNT powder, the concentration of well-
dispersed MWCNTs in solution increased systematically with concentration of Suwannee
River natural organic matter (SRNOM). Smith et al.35
discovered that NOM at
concentrations as low as 0.5 dissolved organic carbon/L (DOC/L) was able to enhance
the stability of O-MWCNT dispersions and that these effects occurred even in the

8
presence of Ca2+
and in a manner largely independent of O-MWCNT surface oxygen
concentration.35
1.5.2 Hetero-Aggregation of CNTs
In environments where multiple colloidal particles exist, hetero-aggregation may
take place.65
Because of the ubiquitous presence of naturally occurring colloidal particles,
the hetero-aggregation process plays a more important role in determining the fate and
transport of CNTs than homo-aggregation in natural environments.66
However, fewer
studies regarding hetero-aggregation were conducted compared to those for homo-
aggregation. Huynh et al.65
investigated the hetero-aggregation of MWCNTs (negatively
charged) with hematite nanoparticles (HemNPs, positively charged) with varied
CNT/HemNP mass concentration ratios (CNT/HemNP) using TR-DLS. They reported
that the rate of hetero-aggregation first increased with increasing CNT/HemNP untill the
ratio reached 0.0316, where the hetero-aggregation rate was 3.3 times of the HemNP
homo-aggregation rate.65
The further increase in the CNT/HemNP, on the other hand,
caused a dramatic drop in the hetero-aggregation rate, possibly due to a blocking
mechanism.65
The authors also reported that the maximum hetero-aggregation rate
decreased with increasing concentration of humic acid.65
Lin et al.67
investigated the
hetero-aggregation of amidine and sulfate latex particles and silica particles over a range
of varied IS and pH. Results indicated that the hetero-aggregation of opposite charged
colloidal particles increased slowly with decreasing IS, and the pH value of the system
did not show significant effect on the aggregation rate.67

9
1.5.3 Deposition and Transport of CNTs
Compared to homo-aggregation, deposition and transport of CNTs, like hetero-
aggregation, has been less thoroughly studied. In this context, deposition refers to the
process of colloidal attachment onto surfaces of a large material. Transport, on the other
hand, refers to a more general and complex set of processes that affect the movement of
colloidal particles in the solid environment. In this specific study, my focus is on O-
MWCNT transport through porous media.
For the direct study of colloidal particle deposition, Quartz Crystal Microbalance
with Dissipation Monitoring (QCM-D) has been widely applied. In experiments using
QCM-D, colloidal particles are deposited onto the surface of a piece of quartz crystal.
This approach isolates deposition of colloidal particles from other interactions and
therefore provides a more controllable system so that the mechanism may be tractable.
The oversimplified condition, however, also leads to relatively less practical results
compared to alternative approaches. Yi et al.68
studied the deposition of O-MWCNTs
with two different surface oxygen concentrations onto quartz crystals using QCM-D and
reported that O-MWCNTs with higher surface oxygen concentrations exhibited a lower
deposition rate onto quartz in the presence of only Na+. In the presence of Ca
2+, however,
MWCNTs with both high and low surface oxygen concentrations showed similar
deposition rates that were significantly higher than those observed in the presence of Na+.
For studies of CNT transport, packed columns are commonly used. This approach
better simulates many aspects of the actual subsurface aquifer and is therefore able to
provide information that is more directly relevant to real-world conditions than QCM-D.
Nevertheless, no direct and continuous measurement can be obtained in experiments

10
conducted using packed columns. Results obtained with this approach also have lower
accuracy due to the complexity of the media and the influence of relatively less well
controlled hydrodynamic processes compared to QCM-D. Prior investigations of CNT
transport through porous media have been conducted mostly with natural soil or quartz
sand systems, and none have quantified attachment efficiency as a function of both
surface and solution chemistry.63, 69-73
Wang et al.63
passed NOM-stabilized MWCNT
and SWCNT dispersions through sand packed columns at varied KCl and CaCl2
concentrations and observed that substantial mass fractions of CNTs passed through the
column at KCl concentrations up to 1 mM and CaCl2 up to 0.1 mM. Jaisi et al.69, 70
studied the transport of O-SWCNTs through quartz sand as a function of IS and found
that O-SWCNT transport followed predictions of conventional deposition theory under
most conditions for quartz sand70
, while straining was the primary means of O-SWCNT
deposition on soils under all conditions.69
The authors also reported that NOM presence
can substantially decrease rates of SWCNT deposition onto quartz sand in the presence
Ca2+
.70
Wang et al. 71
studied functionalized MWCNT tube-length effects on transport
through quartz sand and reported that straining played an important role. These
investigators observed spatial retention profiles that deviated substantially from
expectations based on simple first-order removal, and therefore attachment efficiencies
could not be estimated. O’Carroll et al.72
investigated and modeled the impact of
MWCNT tube diameter on transport through quartz sands. They reported that all tested
MWCNTs were readily mobile under typical conditions of subsurface aquifers, but
MWCNTs with smaller diameters were less mobile than their larger counterparts. Liu et
al.73
studied the effect of flow velocity on the transport of O-MWCNTs through columns
11
packed with soda-lime glass beads or quartz sands reporting that approach velocity had a
significant effect on O-MWCNT retention. Significant increase of O-MWCNT
breakthrough (20% - 30%) was observed when the approach velocity was increased from
0.42 m/d to 4 m/d.73
1.5.4 Adsorption Properties of CNTs
The adsorption of heavy metals as well as organic compounds onto CNTs has
been studied intensively in last decades.33, 34, 56, 60, 74-78
Studies on this issue have been
conducted for two primary reasons. The first of these is to evaluate if CNTs could serve
as strong adsorbents to remove organics and heavy metals from water and wastewater as
might be applicable, for example, to be incorporated in fixed bed, membranes, or other
unit processes of treatment facilities.79, 80
For example, Peng et al.61
and Lu et al.57
reported CNTs had the ability to effectively achieve the complete removal of 1,2-
dichlorobenzene and trihalomethanes from water at low application doses. Lu and Chiu 44
showed that the specific adsorption capacity of NaClO-treated CNTs for Zn2+
was higher
than that of powdered activated carbon. Cho et al.60
reported that the adsorption capacity
of MWCNTs (used as received) was higher than that of natural char and lower than
activated carbon. A second reason to study adsorption ability of CNTs for trace organics
and metals is to understand the implications of CNT presence on the fate, transport, and
risk associated with these other contaminants.56
The focus of this study is the adsorption
of heavy metals onto O-MWCNTs because of the ubiquitous presence and non-
degradable property of trace metals.44, 81
Prior studies have also reported research of O-MWCNTs as adsorbents for metals,
including studies on the effects of aquatic and surface chemistry. More specifically, Cho

12
et al.56
reported that IS, pH, and the co-presence of multiple metals all had strong effects
on adsorption properties of MWCNTs for Zn2+
and Cd2+
.56
Likewise, Cho et al.56
as well
as Li et al.82
showed that the surface oxidation degree of CNTs had significant effects on
their capacity to adsorb metallic contaminants, with increasing surface oxidation degree
leading to increasing adsorption capacity. In particular, carboxyl groups have been shown
to have a particularly strong adsorption ability for divalent metallic cations. Although
there have been numerous studies regarding CNT adsorption of heavy metals, most
studies have been conducted at CNT mass concentrations ranging from ~0.1 g/L to ~ 10
g/L.83
Considering that concentrations of CNTs in natural systems are not expected to be
greater than parts per million level (1 mg/L) or lower, there is need for more studies using
CNTs at environmentally relevant concentrations.
1.6 Research Questions
Given the assumption that CNTs will access aquatic environments, there is need
to better understand their potential impacts in these environments. In order to estimate the
environmental impacts that CNTs may have in water systems, it is important to
understand their fate and transport as well as their interactions with other contaminants,
which is the primary research question addressed in this work. More specifically, the
research questions in this work include:
What are the adsorption properties of O-MWCNTs for Ni2+
and Zn2+
and
effects of experimental conditions, including aquatic chemistry, surface chemistry, and
adsorbent concentration (solid-to-liquid ratio)?
What are the transport properties of O-MWCNTs through simulated
porous media (soda-lime spherical glass beads) and what are the effects of changes in
13
experimental conditions, including effects due to changes of pH, ionic strength, cation
species, and O-MWCNT surface oxygen concentration and functional group distribution?
What are the removal mechanisms of O-MWCNTs passing through
porous media and the contributions of each mechanism under varied experimental
conditions?
1.7 Objectives and Outline
The overall objectives of this work were to establish quantitative relationships
between the surface composition of MWCNTs and their sorption and transport properties
under varying aquatic chemical conditions. Both theoretical and experimental approaches
were used in order to better estimate these properties. Mathematical models and
computations were applied to test whether the hypothesized conceptual understanding
was useful for interpreting and predicting experimental observations. Specific objectives
are listed below by chapter.
Chapter 2 contains results from studies of the adsorption of MWCNTs for
divalent cations (Zn2+
and Ni2+
). The effects of surface chemistry and aquatic chemistry
on MWCNT adsorption properties were studied using both experimental approaches and
mathematical modeling. Adsorption experiments were also conducted at varied solid-to-
liquid ratios (S/L), including those usually used in prior research and in water treatment
facilities and those relevant to possible MWCNT concentrations in natural water systems.
The studies revealed a surprising effect of S/L on the adsorption property of MWCNTs,
and a possible explanation was proposed.
Chapter 3 contains methods and results relating to studies of the impacts of both
surface and solution chemistry on MWCNT deposition during transport through silica-

14
based media. In order to accurately measure deposition rates in the absence of blocking
or straining (i.e., to maintain “clean-bed” conditions), a well-defined system of uniform
spherical collectors was applied. Studies were conducted on O-MWCNTs with five
different oxygen contents in varied solution chemistries. Solution chemistry variables
include IS, pH, SRNOM concentration and type of cation in the feed solution (Na+ or
Ca2+
).
Chapter 4 contains methods and results relating to the investigation of the
transport mechanisms of MWCNTs on silica based porous media as conducted through
the analysis of both temporal breakthrough curves and retention profiles obtained after
completion of transport experiments. Mathematical models that combine a standard
formation of clean bed filtration model with additional models were composed to account
for other removal mechanisms such as site-blocking, ripening and straining are provided.
These models were applied to the interpretation of the experimental results.
In Chapter 5, the sensitivity of the mathematical models developed in Chapter 4 is
analyzed and the physical meaning of each term in the models is discussed in detail. The
advantages and disadvantages of each mathematical approach and the contributions of
each deposition mechanism are also analyzed.
Finally, Chapter 6 contains the major conclusions from this work as well as
discussion of the significance of the results toward a better understanding of the potential
environmental implication and application of this new nano-material. Possible directions
of future work are also suggested.
1.8 Cited References
1. Iijima, S., Helical Microtubules of Graphitic Carbon. Nature 1991, 354, (6348),
56-58.

15
2. Dresselhaus, M. S.; Dresselhaus, G.; Eklund, P. C., Science of Fullerenes and
Carbon Nanotubes. Academic Press: San Diego, 1996; p xviii, 965 p.
3. Ebbesen, T. W., Carbon Nanotubes. Annual Review of Materials Science 1994,
24, (1), 235-264.
4. Gallagher, M. J.; Chen, D.; Jacobsen, B. P.; Sarid, D.; Lamb, L. D.; Tinker, F.
A.; Jiao, J.; Huffman, D. R.; Seraphin, S.; Zhou, D., Characterization of Carbon
Nanotubes by Scanning Probe Microscopy. Surface Science 1993, 281, (3), L335-L340.
5. Ebbesen, T. W.; Hiura, H.; Fujita, J.; Ochiai, Y.; Matsui, S.; Tanigaki, K.,
Patterns in the Bulk Growth of Carbon Nanotubes. Chemical Physics Letters 1993, 209,
(1-2), 83-90.
6. Klaine, S. J.; Alvarez, P. J. J.; Batley, G. E.; Fernandes, T. F.; Handy, R. D.;
Lyon, D. Y.; Mahendra, S.; Mclaughlin, M. J.; Lead, J. R., Nanomaterials in the
Environment: Behavior, Fate, Bioavailability, and Effects. Environ Toxicol Chem 2008,
27, (9), 1825-1851.
7. Kreupl, F.; Graham, A. P.; Duesberg, G. S.; Steinhogl, W.; Liebau, M.; Unger,
E.; Honlein, W., Carbon Nanotubes in Interconnect Applications. Microelectron Eng
2002, 64, (1-4), 399-408.
8. Lekas, D. The Project on Emering Nanotechnologies; Washington D.C., 2005.
9. Sinnott, S. B.; Andrews, R., Carbon Nanotubes: Synthesis, Properties, and
Aplications. Taylor & Francis: London, 2010.
10. Treacy, M. M. J.; Ebbesen, T. W.; Gibson, J. M., Exceptionally High Young's
Modulus Observed for Individual Carbon Nanotubes. Nature 1996, 381, (6584), 678-680.
11. Dai, H. J.; Hafner, J. H.; Rinzler, A. G.; Colbert, D. T.; Smalley, R. E.,
Nanotubes as Nanoprobes in Scanning Probe Microscopy. Nature 1996, 384, (6605),
147-150.
12. Wong, S. S.; Woolley, A. T.; Odom, T. W.; Huang, J. L.; Kim, P.; Vezenov,
D. V.; Lieber, C. M., Single-Walled Carbon Nanotube Probes for High-Resolution
Nanostructure Imaging. Appl Phys Lett 1998, 73, (23), 3465-3467.
13. Kong, J.; Franklin, N. R.; Zhou, C. W.; Chapline, M. G.; Peng, S.; Cho, K. J.;
Dai, H. J., Nanotube Molecular Wires as Chemical Sensors. Science 2000, 287, (5453),
622-625.
14. Qian, D.; Dickey, E. C.; Andrews, R.; Rantell, T., Load Transfer and
Deformation Mechanisms in Carbon Nanotube-Polystyrene Composites. Appl Phys Lett
2000, 76, (20), 2868-2870.
15. Aslan, S.; Loebick, C. Z.; Kang, S.; Elimelech, M.; Pfefferle, L. D.; Van
Tassel, P. R., Antimicrobial Biomaterials Based on Carbon Nanotubes Dispersed in
Poly(Lactic-Co-Glycolic Acid). Nanoscale 2010, 2, (9), 1789-1794.
16. Ahmed, F.; Santos, C. M.; Vergara, R. a. M. V.; Tria, M. C. R.; Advincula,
R.; Rodrigues, D. F., Antimicrobial Applications of Electroactive Pvk-Swnt
Nanocomposites. Environ Sci Technol 2012, 46, (3), 1804-1810.
17. Parish, A. Production and Application of Carbon Nanotubes, Carbon
Nanofibers, Fullerenes, Graphene and Nanodiamonds: A Global Technology Survey and
Market Analysis; Innovative research and products (iRAP), Inc: 2011.
18. Rzepka, M.; Lamp, P.; De La Casa-Lillo, M. A., Physisorption of Hydrogen
on Microporous Carbon and Carbon Nanotubes. Journal of Physical Chemistry B 1998,
102, (52), 10894-10898.
16
19. Wang, Q.; Johnson, J. K., Molecular Simulation of Hydrogen Adsorption in
Single-Walled Carbon Nanotubes and Idealized Carbon Slit Pores. The Journal of
Chemical Physics 1999, 110, (1), 577-586.
20. Patel, V. Global Carbon Nanotubes Market - Industry Beckons.
http://www.nanowerk.com/spotlight/spotid=23118.php
21. Thayer, A. M., Carbon Nanotubes by the Metric Ton. Chemical &
Engineering News 2007, 85, (46), 29-35.
22. Mueller, N. C.; Nowack, B., Exposure Modeling of Engineered Nanoparticles
in the Environment. Environ Sci Technol 2008, 42, (12), 4447-4453.
23. Nowack, B.; Bucheli, T. D., Occurrence, Behavior and Effects of
Nanoparticles in the Environment. Environ Pollut 2007, 150, (1), 5-22.
24. Petosa, A. R.; Jaisi, D. P.; Quevedo, I. R.; Elimelech, M.; Tufenkji, N.,
Aggregation and Deposition of Engineered Nanomaterials in Aquatic Environments:
Role of Physicochemical Interactions. Environ Sci Technol 2010, 44, (17), 6532-6549.
25. Koelmans, A. A.; Nowack, B.; Wiesner, M. R., Comparison of Manufactured
and Black Carbon Nanoparticle Concentrations in Aquatic Sediments. Environ Pollut
2009, 157, (4), 1110-1116.
26. Sayes, C. M.; Liang, F.; Hudson, J. L.; Mendez, J.; Guo, W. H.; Beach, J. M.;
Moore, V. C.; Doyle, C. D.; West, J. L.; Billups, W. E.; Ausman, K. D.; Colvin, V. L.,
Functionalization Density Dependence of Single-Walled Carbon Nanotubes Cytotoxicity
in Vitro. Toxicology Letters 2006, 161, (2), 135-142.
27. Nemmar, A.; Hoet, P. H. M.; Vanquickenborne, B.; Dinsdale, D.; Thomeer,
M.; Hoylaerts, M. F.; Vanbilloen, H.; Mortelmans, L.; Nemery, B., Passage of Inhaled
Particles into the Blood Circulation in Humans. Circulation 2002, 105, (4), 411-414.
28. Patlolla, A.; Knighten, B.; Tchounwou, P., Multi-Walled Carbon Nanotubes
Induce Cytotoxicity, Genotoxicity and Apoptosis in Normal Human Dermal Fibroblast
Cells. Ethnicity & disease 20, (1 Suppl 1), S1-65-72.
29. Smith, B.; Wepasnick, K.; Schrote, K. E.; Cho, H. H.; Ball, W. P.;
Fairbrother, D. H., Influence of Surface Oxides on the Colloidal Stability of Multi-
Walled Carbon Nanotubes: A Structure-Property Relationship. Langmuir 2009, 25, (17),
9767-9776.
30. Yang, J.; Bitter, J. L.; Smith, B. A.; Fairbrother, D. H.; Ball, W. P., Transport
of Oxidized Multi-Walled Carbon Nanotubes through Silica Based Porous Media:
Influences of Aquatic Chemistry, Surface Chemistry, and Natural Organic Matter.
Environ Sci Technol 2013, 47, (24), 14034-14043.
31. Hyung, H.; Fortner, J. D.; Hughes, J. B.; Kim, J. H., Natural Organic Matter
Stabilizes Carbon Nanotubes in the Aqueous Phase. Environ Sci Technol 2007, 41, (1),
179-184.
32. Lin, D. H.; Tian, X. L.; Wu, F. C.; Xing, B. S., Fate and Transport of
Engineered Nanomaterials in the Environment. J Environ Qual 2010, 39, (6), 1896-1908.
33. Hou, L.; Zhu, D. Q.; Wang, X. M.; Wang, L. L.; Zhang, C. D.; Chen, W.,
Adsorption of Phenanthrene, 2-Naphthol, and 1-Naphthylamine to Colloidal Oxidized
Multiwalled Carbon Nanotubes: Effects of Humic Acid and Surfactant Modification.
Environ Toxicol Chem 2013, 32, (3), 493-500.

17
34. Hyung, H.; Kim, J. H., Natural Organic Matter (Nom) Adsorption to Multi-
Walled Carbon Nanotubes: Effect of Nom Characteristics and Water Quality Parameters.
Environ Sci Technol 2008, 42, (12), 4416-4421.
35. Smith, B.; Yang, J.; Bitter, J. L.; Ball, W. P.; Fairbrother, D. H., Influence of
Surface Oxygen on the Interactions of Carbon Nanotubes with Natural Organic Matter.
Environ Sci Technol 2012, 46, (23), 12839-12847.
36. Oberdorster, G.; Oberdorster, E.; Oberdorster, J., Nanotoxicology: An
Emerging Discipline Evolving from Studies of Ultrafine Particles. Environmental Health
Perspectives 2005, 113, (7), 823-839.
37. Marrs, B.; Andrews, R.; Pienkowski, D., Multiwall Carbon Nanotubes
Enhance the Fatigue Performance of Physiologically Maintained Methyl Methacrylate-
Styrene Copolymer. Carbon 2007, 45, (10), 2098-2104.
38. Breuer, O.; Sundararaj, U., Big Returns from Small Fibers: A Review of
Polymer/Carbon Nanotube Composites. Polymer Composites 2004, 25, (6), 630-645.
39. Vaisman, L.; Marom, G.; Wagner, H. D., Dispersions of Surface-Modified
Carbon Nanotubes in Water-Soluble and Water-Insoluble Polymers. Advanced
Functional Materials 2006, 16, (3), 357-363.
40. Sluzarenko, N.; Heurtefeu, B.; Maugey, M.; Zakri, C.; Poulin, P.;
Lecommandoux, S., Diblock Copolymer Stabilization of Multi-Wall Carbon Nanotubes
in Organic Solvents and Their Use in Composites. Carbon 2006, 44, (15), 3207-3212.
41. Bourlinos, A. B.; Georgakilas, V.; Zboril, R.; Dallas, P., Preparation of a
Water-Dispersible Carbon Nanotube-Silica Hybrid. Carbon 2007, 45, (10), 2136-2139.
42. Liu, P., Modifications of Carbon Nanotubes with Polymers. European
Polymer Journal 2005, 41, (11), 2693-2703.
43. Yusof, A. M.; Buang, N. A.; Yean, L. S.; Ibrahim, M. L., The Use of Multi-
Walled Carbon Nanotubes as Possible Carrier in Drug Delivery System for Aspirin. In
Nanoscience and Nanotechnology, Rusop, M.; Soga, T., Eds. 2009; Vol. 1136, pp 390-
394.
44. Stumm, W.; Morgan, J. J., Aquatic Cheistry: Chemical Equilibria and Rates in
Natural Waters. John Wiley & Sons, Inc: New York, 1996.
45. Derjaguin, B., On the Repulsive Forces between Charged Colloid Particles
and on the Theory of Slow Coagulation and Stability of Lyophobe Sols. Transactions of
the Faraday Society 1940, 35, (0), 203-215.
46. Derjaguin, B.; Landau, L., Theory of the Stability of Strongly Charged
Lyophobic Sols and of the Adhesion of Strongly Charged-Particles in Solutions of
Electrolytes. Prog Surf Sci 1941, 14, 633.
47. Verwey, E. J. W.; Overbeek, J. T. G., Theory of the Stability of Lyophobic
Colloids. Journal of Colloid Science 1948, 10, (2), 224-225.
48. Tufenkji, N.; Elimelech, M., Correlation Equation for Predicting Single-
Collector Efficiency in Physicochemical Filtration in Saturated Porous Media. Environ
Sci Technol 2004, 38, (2), 529-536.
49. Westall, J.; Hohl, H., Comparison of Electrostatic Models for the Oxide-
Solution Interface. Adv Colloid Interfac 1980, 12, (4), 265-294.
50. O'melia, C. R., Particle-Particle Interactions in Aquatic Systems. Colloid
Surface 1989, 39, (1), 255-271.
18
51. Au, K. K.; Penisson, A. C.; Yang, S.; O'melia, C. R., Natural Organic Matter
at Oxide/Water Interfaces: Complexation and Conformation. Geochimica et
Cosmochimica Acta 1999, 63, (19-20), 2903-2917.
52. Tobiason, J. E.; Omelia, C. R., Physicochemical Aspects of Particle Removal
in Depth Filtration. J Am Water Works Ass 1988, 80, (12), 54-64.
53. Elimelech, M.; Omelia, C. R., Effect of Particle Size on Collision Efficiency
in the Deposition of Brownian Particles with Electrostatic Energy Barriers. Langmuir
1990, 6, (6), 1153-1163.
54. Hahn, M. W.; O'melia, C. R., Deposition and Reentrainment of Brownian
Particles in Porous Media under Unfavorable Chemical Conditions: Some Concepts and
Applications. Environmental Science and Technology 2004, 38, (1), 210-220.
55. Veerapaneni, S.; Wiesner, M. R., Role of Suspension Polydispersivity in
Granular Media Filtration. Journal of Environmental Engineering 1993, 119, (1), 172-
190.
56. Cho, H. H.; Wepasnick, K.; Smith, B. A.; Bangash, F. K.; Fairbrother, D. H.;
Ball, W. P., Sorption of Aqueous Zn[Ii] and Cd[Ii] by Multiwall Carbon Nanotubes: The
Relative Roles of Oxygen-Containing Functional Groups and Graphenic Carbon.
Langmuir 2010, 26, (2), 967-981.
57. Lu, C.; Chung, Y. L.; Chang, K. F., Adsorption of Trihalomethanes from
Water with Carbon Nanotubes. Water Res 2005, 39, (6), 1183-1189.
58. Li, Q. L.; Yuan, D. X.; Lin, Q. M., Evaluation of Multi-Walled Carbon
Nanotubes as an Adsorbent for Trapping Volatile Organic Compounds from
Environmental Samples. J Chromatogr A 2004, 1026, (1-2), 283-288.
59. Bond, T. C.; Streets, D. G.; Yarber, K. F.; Nelson, S. M.; Woo, J. H.; Klimont,
Z., A Technology-Based Global Inventory of Black and Organic Carbon Emissions from
Combustion. Journal of Geophysical Research D: Atmospheres 2004, 109, (14).
60. Cho, H. H.; Smith, B. A.; Wnuk, J. D.; Fairbrother, D. H.; Ball, W. P.,
Influence of Surface Oxides on the Adsorption of Naphthalene onto Multiwalled Carbon
Nanotubes. Environ Sci Technol 2008, 42, (8), 2899-2905.
61. Peng, X.; Li, Y.; Luan, Z.; Di, Z.; Wang, H.; Tian, B.; Jia, Z., Adsorption of
1,2-Dichlorobenzene from Water to Carbon Nanotubes. Chemical Physics Letters 2003,
376, (1-2), 154-158.
62. Saleh, N. B.; Pfefferle, L. D.; Elimelech, M., Influence of Biomacromolecules
and Humic Acid on the Aggregation Kinetics of Single-Walled Carbon Nanotubes.
Environmental Science and Technology 2010, 44, (7), 2412-2418.
63. Wang, P.; Shi, Q.; Liang, H.; Steuerman, D. W.; Stucky, G. D.; Keller, A. A.,
Enhanced Environmental Mobility of Carbon Nanotubes in the Presence of Humic Acid
and Their Removal from Aqueous Solution. Small 2008, 4, (12), 2166-2170.
64. Saleh, N. B.; Pfefferle, L. D.; Elimelech, M., Aggregation Kinetics of
Multiwalled Carbon Nanotubes in Aquatic Systems: Measurements and Environmental
Implications. Environmental Science and Technology 2008, 42, (21), 7963-7969.
65. Huynh, K. A.; Mccaffery, J. M.; Chen, K. L., Heteroaggregation of
Multiwalled Carbon Nanotubes and Hematite Nanoparticles: Rates and Mechanisms.
Environ Sci Technol 2012, 46, (11), 5912-5920.
19
66. Chen, K. L.; Smith, B. A.; Ball, W. P.; Fairbrother, D. H., Assessing the
Colloidal Properties of Engineered Nanoparticles in Water: Case Studies from Fullerene
C-60 Nanoparticles and Carbon Nanotubes. Environ Chem 2010, 7, (1), 10-27.
67. Lin, W.; Kobayashi, M.; Skarba, M.; Nu, C. D.; Galletto, P.; Borkovec, M.,
Heteroaggregation in Binary Mixtures of Oppositely Charged Colloidal Particles.
Langmuir 2006, 22, (3), 1038-1047.
68. Yi, P.; Chen, K. L., Influence of Surface Oxidation on the Aggregation and
Deposition Kinetics of Multiwalled Carbon Nanotubes in Monovalent and Divalent
Electrolytes. Langmuir 2011, 27, (7), 3588-3599.
69. Jaisi, D. P.; Elimelech, M., Single-Walled Carbon Nanotubes Exhibit Limited
Transport in Soil Columns. Environ Sci Technol 2009, 43, (24), 9161-9166.
70. Jaisi, D. P.; Saleh, N. B.; Blake, R. E.; Elimelech, M., Transport of Single-
Walled Carbon Nanotubes in Porous Media: Filtration Mechanisms and Reversibility.
Environ Sci Technol 2008, 42, (22), 8317-8323.
71. Wang, Y. G.; Kim, J. H.; Baek, J. B.; Miller, G. W.; Pennell, K. D., Transport
Behavior of Functionalized Multi-Wall Carbon Nanotubes in Water-Saturated Quartz
Sand as a Function of Tube Length. Water Res 2012, 46, (14), 4521-4531.
72. O'carroll, D. M.; Liu, X.; Mattison, N. T.; Petersen, E. J., Impact of Diameter
on Carbon Nanotube Transport in Sand. J Colloid Interf Sci 2013, 390, 96-104.
73. Liu, X. Y.; O'carroll, D. M.; Petersen, E. J.; Huang, Q. G.; Anderson, C. L.,
Mobility of Multiwalled Carbon Nanotubes in Porous Media. Environ Sci Technol 2009,
43, (21), 8153-8158.
74. Bystrzejewski, M.; Pyrzynska, K., Kinetics of Copper Ions Sorption onto
Activated Carbon, Carbon Nanotubes and Carbon-Encapsulated Magnetic Nanoparticles.
Colloid Surface A 2011, 377, (1-3), 402-408.
75. Chen, C. L.; Wang, X. K., Adsorption of Ni(Ii) from Aqueous Solution Using
Oxidized Multiwall Carbon Nanotubes. Ind Eng Chem Res 2006, 45, (26), 9144-9149.
76. Chen, G. C.; Shan, X. Q.; Wang, Y. S.; Pei, Z. G.; Shen, X. E.; Wen, B.;
Owens, G., Effects of Copper, Lead, and Cadmium on the Sorption and Desorption of
Atrazine onto and from Carbon Nanotubes. Environ Sci Technol 2008, 42, (22), 8297-
8302.
77. Chen, W.; Duan, L.; Wang, L. L.; Zhu, D. Q., Adsorption of Hydroxyl- and
Amino-Substituted Aromatics to Carbon Nanotubes. Environ Sci Technol 2008, 42, (18),
6862-6868.
78. Gotovac, S.; Yang, C. M.; Hattori, Y.; Takahashi, K.; Kanoh, H.; Kaneko, K.,
Adsorption of Polyaromatic Hydrocarbons on Single Wall Carbon Nanotubes of
Different Functionalities and Diameters. J Colloid Interf Sci 2007, 314, (1), 18-24.
79. Lu, C. S.; Chiu, H.; Liu, C. T., Removal of Zinc(Ii) from Aqueous Solution by
Purified Carbon Nanotubes: Kinetics and Equilibrium Studies. Ind Eng Chem Res 2006,
45, (8), 2850-2855.
80. Wang, X.; Chen, C.; Hu, W.; Ding, A.; Xu, D.; Zhou, X., Sorption of
243am(Iii) to Multiwall Carbon Nanotubes. Environ Sci Technol 2005, 39, (8), 2856-
2860.
81. Akpor, O. B.; Muchie, M., Remediation of Heavy Metals in Drinking Water
and Wastewater Treatment Systems: Processes and Applications. Int J Phys Sci 2010, 5,
(12), 1807-1817.
20
82. Li, Y. H.; Wang, S.; Luan, Z.; Ding, J.; Xu, C.; Wu, D., Adsorption of
Cadmium(Ii) from Aqueous Solution by Surface Oxidized Carbon Nanotubes. Carbon
2003, 41, (5), 1057-1062.
83. Rao, G. P.; Lu, C.; Su, F., Sorption of Divalent Metal Ions from Aqueous
Solution by Carbon Nanotubes: A Review. Sep Purif Technol 2007, 58, (1), 224-231.

21
Chapter 2. Adsorption of Zn2+
and Ni2+
onto Oxidized Multi-
Walled Carbon Nanotubes: Effects of Aquatic and Surface
Chemistry, O-MWCNT Aggregation State and Solid-to-Liquid
Ratio
ABSTRACT
The interaction of heavy metals with oxidized multi-walled carbon nanotubes (O-
MWCNTs) is of great importance not only for the evaluation of O-MWCNTs as possible
sorbents in water and treatment facilities, but also for considering the implication of O-
MWCNTs as contaminants of emerging concern in natural environments where metal co-
contaminants may adsorb onto the surface of O-MWCNTs and have their transport be
either facilitated or retarded by association with mobile or retained CNTs, respectively.
Studies were conducted on the equilibrium adsorption relationships between O-
MWCNTs of varying surface chemistry for two divalent metallic cations, Zn2+
and Ni2+
.
Effects of aquatic chemistry, competing organic adsorbate, O-MWCNT aggregation state
and solid-to-liquid ratio (S/L) were all investigated. Results showed that the adsorption
capacity of O-MWCNTs for the metallic ions increased with increasing pH and
decreasing ionic strength (IS). O-MWCNTs with higher surface oxygen content exhibited
higher adsorption capacity for the two metals in a manner consistent with prior results of
others and also consistent with a two-site Langmuir adsorption model developed in
previous study.1 The presence of naphthalene did not substantially affect the adsorption
of Zn2+
onto O-MWCNTs as expected from our hypothesis that the two solutes sorb at

22
different locations on O-MWCNT surfaces. Comparative studies of adsorption with
previously dried O-MWCNT powders relative to carefully dispersed suspensions of
individual MWCNTs revealed no statistical difference between adsorption capacities,
suggesting that similar adsorption mechanisms were at play with either aggregation state.
The S/L, on the other hand, exhibited significant effect on the adsorption of Zn2+
onto O-
MWCNTs with greater impact on sorption affinity (i.e., isotherm slope at low
concentration) rather than on maximum sorption capacity. Although similar results have
been long reported in a variety of adsorbate-adsorbent systems, the reason for these
results in many systems (including this one) is yet to be understood.
2.1 Introduction
In order to better estimate the risk of hazardous dissolved solutes in water
systems, one needs to understand their fate, which is often very strongly affected by their
tendency to accumulate at solid-water interfaces.2 Heavy metals such as aluminum,
chromium, nickel, copper, zinc, cadmium, mercury and lead are common aquatic
contaminants3 and have been found to have significant effects on aquatic life and human
health because of their toxicity and carcinogeneicity.4 Properties of heavy metals and
their behavior in the environment have been extensively studied.2, 5
Although naturally
occurring concentrations of dissolved heavy metals in natural environments is usually
very low (10-11
- 10-7
M),2, 6
heavy metal fluxes to water resources have increased due to
human activities and incidents of high concentration are occurring with increasing
frequency.2
Carbon nanotubes (CNTs) have been found to have high adsorption capacity for
heavy metals, especially when the tubes’s surfaces are functionalized with more reactive
23
species, such as electron-donating (e.g., oxygen-containing) groups.1, 7-11
For example, Lu
et al.2 showed that the specific adsorption capacity of NaClO treated CNTs for Zn
2+ was
higher than that of powdered activated carbon (PAC). CNTs are therefore being viewed
as a new carbon based material that has substantial potential as adsorbents for the
removal of heavy metals in water and wastewater treatment.12, 13
In this context, it is
important to fully understand the interaction of CNTs of varying surface functionality
with the to-be treated contaminants.
The strong tendency of heavy metals to accumulate at the solid (CNT)-water
interfaces also has implications for the role of CNTs as contaminants of emerging
concern in natural environments. In aquatic systems where CNTs are present, additional
solid surfaces are available for the accumulation of heavy metals. Such surfaces can
serve to either facilitate or retard the movement of the metal adsorbates in a manner that
will depend on the relative mobility of the adsorbate species and the adsorbent solids
(CNTs).2 As discussed elsewhere in this dissertation (Chapters 3 and 4), such mobility
can depend on both the surface chemistry and aggregation state of the CNTs, as well as
on the chemical composition of the aqueous solution. Therefore, the addition of CNTs to
these matrices will add new challenges to the modeling and prediction of the fate of these
heavy metals.
In recent years, the adsorption of heavy metals onto CNTs has been studied for
both of the previously mentioned reasons – that is, (1) to estimate the ability of CNTs to
serve as alternative water treatment materials for removal of heavy metals12-14
and (2) to
predict the interactions of CNTs with heavy metals in natural aquatic systems to assess
the risk of CNTs as novel contaminants. Factors affecting metal adsorption onto CNTs

24
include the chemical properties of the dissolved metal species, the surface chemistry of
the CNTs, the presence of potentially competing co-adsorbates such as co-existing metal
cations or organic compounds, and general conditions of aquatic chemistry such as pH,
ionic strength (IS), and temperature.
General conditions of aquatic chemistry, including IS and pH, have been reported
to affect the adsorption capacity of CNTs for heavy metals in a way consistent with
theoretical prediction.1, 7, 8, 11, 15
Chen and Wang 7 investigated the adsorption of Ni
2+ onto
oxidized multi-walled CNTs (O-MWCNTs) as a function of pH and IS. Results indicated
the adsorption of Ni2+
was strongly affected by pH and slightly dependent on IS, where
the adsorbed amount of Ni2+
increased with increasing pH or decreasing IS.7 Li et al.
8
studied the effects of pH and IS on the adsorption of Pb2+
, Cu2+
, and Cd2+
onto CNTs and
also reported increasing adsorption capacity with decreasing IS and increasing pH.
Meanwhile, adsorbed amount of heavy metal is found to increase with increasing solution
temperature, indicating that the adsorption is an endothermic process.15-18
In addition to aquatic chemistry, CNT surface properties have also been shown to
significantly affect CNT adsorption of heavy metals.9, 14, 19, 20
Cho et al.19
quantified the
atomic oxygen concentration as well as the distribution of functional groups on the
surface of O-MWCNTs and reported that the adsorption capacity of O-MWCNTs for
Zn2+
was positively correlated to the surface oxygen content of O-MWCNTs, and
especially to the concentration of carboxylic groups. Li et al.9 studied the adsorption of
Cd2+
onto O-MWCNTs of various types and found that the adsorption capacity of the as-
grown CNTs was significantly lower than that of CNTs treated with H2O2, HNO3, or
KMnO4.
25
The existence of competing adsorbates is another factor that has been reported to
affect the adsorption capacity of CNTs for a given heavy metal species.8, 21-23
Li et al.8
reported that maximum capacity values (qm, mg/g) of CNTs for Pb2+
, Cu2+
and Cd2+
, as
estimated through the fitting of a Langmuir isotherm model, were 97.1, 28.5 and 10.9,
respectively in single-solute systems but these values decreased substantially to 34.1,
17.0 and 3.3 mg/g in tri-adsorbate systems, where all three adsorbates were
simultaneously present. Hsieh and Tsai23
conducted similar competitive adsorption study
for Pb2+
, Cu2+
and Cd2+
onto lab-grown CNTs and reported dramatic decrease of Pb2+
adsorption and slight decrease on Cu2+
and Cd2+
adsorption capacity in the tri-adsorbate
system compared to that in the single-adsorbate system. Such competitive effect among
cationic adsorbates can be explained by the ion-exchange adsorption mechanism
proposed by several researchers for adsorptions of metals onto CNTs.7, 21
On the other
hand, “organic adsorbates” are perhaps less likely to compete with cations. In regard to
polycyclic aromatic hydrocarbons (PAHs), for example, multiple studies have postulated
that π-π bonding is a dominant adsorption mechanism.19, 24
Because π-π bonding occurs at
non-functionalized sites and cation adsorption occurs at functionalized sites, we might
therefore expect little competition for adsorption sites to occur among PAHs and metal
cations. Very few studies, however, have been conducted on this topic.25
Chen et al.25
investigated the effect of metallic ions (Cu2+
, Pb2+
, Cd2+
) on the adsorption of atrazine
onto CNTs and reported the suppressing effect of metallic ions on the atrazine adsorption.
Competition between cations and compounds other than HOCs on adsorption onto CNTs
was also occasionally reported.22
Diaz-Flores et al.22
investigated the competitive
adsorption of Cd2+
and phenol on modified N-doped CNTs and found that increasing
26
concentration of Cd2+
decreases the phenol adsorption.22
The presence of phenol was
found to increase the adsorption of Cd2+
,22
presumably because of the addition of new
negatively charged functional groups.
Among the numerous studies regarding the adsorption of heavy metals onto CNTs,
very few studies have been carried out to investigate adsorption properties at
environmentally relevant (i.e., low) concentrations of O-MWCNTs or under conditions
where O-MWCNTs were in a highly dispersed (i.e., unaggregated) state in suspension.
Instead, most studies to date have been conducted at CNT mass concentrations ranging
from ~ 0.1 g/L to ~ 10 g/L with powdered (aggregated) CNTs and in the absence of any
deliberate efforts to disperse them.1, 26
Considering that concentrations of CNTs in natural
systems are not expected to be greater than 1 mg/L, and that CNTs may enter the
environment in a more highly dispersed state, there is need for more studies using
dispersed CNTs at environmentally relevant concentrations. To date, such studies have
been limited to adsorbates other than heavy metals. For example, Zhang et al. (2009)27
and Zhang et al.(2012)28
have shown that dispersed CNTs exhibit higher adsorption
capacity for synthetic organic chemicals (such as pyrene) than do CNTs added as bulk
powders.
To the best of our knowledge, however, the effect of CNT concentration on the
adsorption of metal ions has not been previously reported. Based on prior studies of metal
ion adsorption by clays, sands and other environmental materials, however, there are
good reasons to believe that the adsorbent concentration in solution (i.e., the so-called
solid-to-liquid ratio, or S/L) can have an important effect on metal adsorption
properties.29-31
In particular, much higher adsorption capacity has been observed when

27
low adsorbent concentrations were applied.29-31
Prior literature has described this as a
solid-to-liquid ratio (S/L) effect. Since this effect cannot be explained by current
thermodynamic equilibrium theory, previous studies have usually attributed it to artificial
interference (i.e., artifacts) in experimental methods. McKinley et al.31
have summarized
these as follows: (1) adsorption by colloids that have a much higher adsorption capacity
and remain suspended in the aqueous phase after centrifugation or filtration;32-35
(2)
competition for adsorbate by “complexing agents” (particularly organic carbon) desorbed
from the adsorbent;33-36
(3) competition of different species of adsorbates;36, 37
(4)
increased solid aggregation (e.g., flocculation) to produce a net decrease in readily
available adsorption sites;32, 37-40
and (5) uncounted chemical reactions such as
precipitation.41
In considering metal adsorption on CNTs, the fourth artifact considered above
seems to be the most likely, and would suggest that the issues of S/L effect and
aggregation (dispersion state) are intimately entwined. Irrespective of cause, however, the
presence of a real and important S/L effect on the measurement of metal adsorption onto
CNTs could have important environmental implications. More specifically, we would
expect that the adsorption capacity of CNTs at low concentrations in the environment
would be much higher than that estimated from isotherms obtained in the laboratory at
high S/L.
The purpose of the work described in this chapter was to investigate the
interaction between metallic ions and O-MWCNTs in well-mixed batch reactors. In this
study, equilibrium adsorption and kinetics studies were conducted using both as-received
(aggregated) O-MWCNT powders and O-MWCNTs that had been deliberately
28
disaggregated and dispersed in solution through controlled sonication, and with the level
of dispersion confirmed by independent means. Adsorption isotherms were obtained for
Zn2+
and Ni2+
on O-MWCNTs with surface oxygen concentrations ranging from 5.1% to
8.0%. Effects of surface chemistry and aggregation state of CNTs, aquatic chemistry (pH
and IS), competing adsorbate of organic compound (naphthanene), and S/L in
experimental systems were all studied. In order to independently study the effect of
aggregation state on O-MWCNT adsorption ability without the interference of an S/L
effect, adsorption experiments were conducted using both well-dispersed and non
disaggregated (powdered) O-MWCNTs (preparation method described below) at the
same solid-to-liquid ratio. On the other hand, experiments using either non disaggregated
or dispersed O-MWCNTs were conducted at multiple S/L to investigate the S/L effect.
F400 PAC was also studied to evaluate whether the S/L effect was present with this
larger and more traditionally well studied adsorbent material.
2.2 Experimental Methods
2.2.1 Preparation of Adsorbents
O-MWCNTs. MWCNTs powders (diameter = 15 ± 5 nm, length = 1 - 5 µm, < 5%
metal content according to thermogravimetric analysis, 95% carbon purity, provided by
manufacturer) were purchased from NanoLabs, Inc.. 18% w/w HNO3 as well as a
combination of KMnO4 and H2SO4 were used to oxidize MWCNTs in our own
laboratories, following previously described methods1, 42, 43
in order to obtain O-
MWCNTs at two different surface oxygen concentrations. In the functionalization
process, MWCNTs were mixed with oxidants (HNO3 or KMnO4-H2SO4 mixture), and
then sonicated, refluxed, purified and dried sequentially.43
KMnO4 and H2SO4 were

29
employed as oxidants because this method was known to produce O-MWCNTs with high
surface oxygen concentration within which carboxylic groups (-COO-) showed a
relatively higher concentration. All functionalized O-MWCNTs were purified using 4 M
NaOH and 1 M HCl solution sequentially after the acid treatment to remove amorphous
carbon generated in the oxidation process following the method described by Smith et
al.44
Activated carbon. Granular activated carbon (GAC, F400) purchased from Calgon
Carbon Corporation (Pittsburgh, PA) was pulverized and passed through a 200 (75 μm)
mesh sieve. These PAC particles with d ≤ 75 μm were then used as adsorbents in the
adsorption studies.
2.2.2 Characterization of Adsorbents
The total surface oxygen concentrations as well as the distributions of surface
oxygen functional groups of O-MWCNTs used in this work were determined using X-ray
photoelectron spectroscopy (XPS) (PHI 5400 system) in conjunction with chemical
derivatization methods.45, 46
All the measurements for O-MWCNTs used in this study
were conducted by colleagues from the Johns Hopkins University Department of
Chemistry (Kevin Wepasnick and David Goodwin). Specific surface areas of both
batches of O-MWCNTs were measured using BET surface area analyzer. The length
distributions of O-MWCNTs oxidized using the same methods as in this study, have been
reported in our prior publications.43, 44
No significant difference in length distribution was
found for O-MWCNTs with varied surface oxygen concentrations.43, 44
The total surface
oxygen concentrations and specific surface area (BET measurement) of F400 PAC used
in this study have been reported elsewhere.1
30
2.2.3 Preparation of dispersed and non-disaggregated O-MWCNTs
O-MWCNTs that were used in the powdered state obtained after the
functionalization and subsequent drying process are hereafter referred to as Aggregated
O-MWCNTs if they were used directly without disaggregation. In experiments involving
dispersed O-MWCNTs, suspensions of O-MWCNTs (at both surface oxygen
concentrations) were prepared using a method described in our prior publications,43, 44, 47
where O-MWCNTs (2 - 12 mg) were added to 200 mL of de-ionized (DI) water and then
sonicated (Branson 1510, 70 W) for 20 hours. For the O-MWCNTs with the lower
surface oxygen concentration, it was necessary to keep the pH value between 9 and 10 to
achieve a stable stock suspension. After sonication, the suspension was centrifuged at
1000 rpm for 5 minutes to remove any non-suspended O-MWCNTs bundles as well as
some colloidal glass particles that were found to have been etched from the wall of the
flask during sonication. The resulting suspensions (also referred to as “dispersions”
below) were collected and subjected to another 5 min sonication. The hydrodynamic
diameters (Dh) of the O-MWCNTs in all prepared stock solutions were measured using
dynamic light scattering (DLS). The final O-MWCNT concentration in a given
suspension was determined by measuring its absorbance at 270 nm. Preliminary
experiments showed good linear relationships (R2 > 0.999) between the absorbance at
270 nm and the mass concentrations for the O-MWCNTs used in this study.
2.2.4 Preparation of Adsorbates
Analytical-grade Zn(NO3)2·6H2O, Ni(NO3)2·6H2O, NaNO3 were purchased from
Sigma-Aldrich and used to prepare stock solutions. Naphthalene was also purchased from
Sigma-Aldrich and used together with Zn2+
in the preparation of several stock solutions
31
for competitive sorption experiments. 0.01 M NaOH or 0.01 M HNO3 were used to adjust
the pH of solutions. NaNO3 was used throughout the study for IS adjustment. For most
experiments, no pH-buffering agent was added to solutions in order to prevent possible
effects on aggregation of the MWCNT dispersions or on the adsorption process. It has
been reported previously that the pH value has negligible effect on the adsorption of Zn2+
onto O-MWCNTs – batch experiments showed that qe was steady to within ±15%
between pH 5.0 and pH 7.0, where carboxyl groups on the surface of adsorbents are all
deprotonated considering the pKa of carboxylic groups were mostly below 4.1, 48
In
experiments where the pH values needed to be precise, NaHCO3 were used to maintain
the pH of the solutions at pH 7.1 ± 0.1. The total concentrations of the adsorbate as well
as the aquatic chemistry of the stock solutions (IS, pH) varied in different experiments.
Details can be found in the following section.
2.2.5 Adsorption Experiments
In adsorption experiments where aggregated O-MWCNTs or PAC were used as
adsorbents, these materials were weighed using an analytical balance (Mettler Toledo
AT261). Extra care was taken to minimize the effect of static electricity by using
aluminum foil to cover all plastic surfaces of containers and waiting for a constant time
(3 min) for the analytical balance to stabilize at each reading. After weighing the
adsorbents, stock solutions containing Zn2+
or Ni2+
at varied concentrations and designed
IS were added into the containers. For experiments in which dispersed O-MWCNTs were
used as adsorbents, a secondary stock dispersion of O-MWCNTs was prepared by
diluting the O-MWCNTs stock solutions with Milli-Q water. Secondary stock solutions
were prepared with metal ion concentrations and IS that were 10 times the target values.

32
Prior study in our group has also revealed that the effect of pH on the adsorption of Zn2+
was negligible at pH > 6,1 so no buffer was applied in experiments involving Zn
2+ and the
initial pH of all solutions/dispersions were adjusted to 6.5 ± 0.3. For experiments with
Ni2+
, 5 mM NaHCO3 was used as buffer and pH was adjusted to be 7.0 ± 0.1. 0.01 – 1 M
NaOH and HNO3 were applied for pH adjustment and NaNO3 was applied for IS
adjustment. To initiate the adsorption experiments, secondary stock solutions of
adsorbate and secondary stock dispersions of O-MWCNTs were mixed in a 1:9 ratio.
Note that the pH and IS for all solutions and dispersions were adjusted right before the
mixing step. After the mixing step, the resulting mixtures of adsorbate solutions with
either aggregated or dispersed MWCNTs were shaken in dark at a constant temperature
of 23 ± 0.5 oC using an end-over-end rotator. Although the adsorption of Zn
2+ onto O-
MWCNTs reaches equilibrium quickly and is not believed to be light sensitive, all
experiments in the current study were nonetheless kept in the dark during the full course
of a 48-hour rotation, with the time chosen in order to keep the experimental conditions
consistent with those required for the PAC.6 In kinetic studies the shaking time was as
specified subsequently in this chapter. All experiments except the ones involving
naphthalene were conducted using polypropylene tubes. When naphthalene was
employed, borosilicate glass ampoules were used after acid wash (0.01 M HNO3).
Preliminary experiments were first conducted to test all of the containers used in this
study, which comprised both polypropylene tubes with nominal volumes of 5 mL, 15 mL,
and 50 mL, and borosilicate glass ampoules with nominal volumes of 5 mL. Results
showed that all containers had negligible adsorption of Zn2+
or Ni2+
.
33
a. Kinetics study of Zn2+
adsorption onto aggregated and dispersed O-MWCNTs
O-MWCNTs at O% of 5.1% and 8.0% were employed in the kinetics study. In
these experiments, mixtures of O-MWCNTs and Zn2+
solutions were prepared using the
methods described above and shaken for a designated amount of time, ranging from 5
minutes to 48 hours. For experiments in which dispersed O-MWCNTs were used, the
hydrodynamic diameters (Dh) of these diluted dispersions were also measured at the time
of final sampling using dynamic light scattering (DLS). DLS was conducted immediately
after sampling by diluting an aliquot of the mixture to ~ 0.1 mg/L O-MWCNT dispersion.
b. Adsorption experiments to investigate pH effect
3 mg Pristine MWCNTs or F400 PAC were added into 5 mL solutions to
investigate the effect of solution pH. Ni2+
at concentrations ranging from 0.1 – 3.0 mM
was used as a single adsorbate. 5 mM NaHCO3 was used as a buffer and the solution pH
was adjusted to be 7.1 ± 0.1 using 0.01 M NaOH or HNO3, with NaNO3 then added as
necessary to achieve the finally desired IS of 10 mM Experiments at a lower pH value
were conducted without any buffer and the final pH of those experiments was measured
to be 5.2 ± 0.2. IS was maintained at 10 mM for these experiments as well.
c. Adsorption experiments to investigate IS effect
Mixtures containing 0.427 g/L dispersed 8.0% O-MWCNT and Zn2+
at
concentrations ranging from 0.003 to 0.03 mM were used to investigate IS effects. The
total IS of those mixtures were adjusted to be 1 mM or 10 mM. The initial pH values
were adjusted to 6.5 ± 0.3 using 0.01 M NaOH or 0.01 M HNO3. The final pH of these
experiments ranged from pH 5.8 – pH 6.4.

34
d. Adsorption experiments to investigate O-MWCNT surface chemistry effect
Solutions containing Zn2+
ranging from 0.2 – 3 mM were mixed with O-
MWCNTs with total surface oxygen concentrations of 5.1%, 5.4%, 6.3% and 7.1% to
study the effects of O-MWCNT surface chemistry on adsorption. IS in this study was
kept at 10 mM. No buffer was used and the initial pH was adjusted to be 6.5 ± 0.3. Final
pH of this study ranged from pH 5.8 – pH 6.4.
e. Adsorption experiment to investigate S/L and aggregation effects
8.0% O-MWCNT and 5.1% O-MWCNT at both aggregated and dispersed forms
as well as PAC were all used as adsorbents to study Zn2+
sorption at varied S/L. Details
for the experimental setup are summarized in Table 2.1. The initial pH values for all
experiments in this section were adjusted to 6.5 ± 0.3. Final pH of these experiments
ranged from pH 5.8 – pH 6.4. Total IS was kept at 10 mM throughout the experiments.
Table 2.1. Summary of adsorption experimental parameters
adsorbent Aggregation state Solid-to-liquid ratios
(S/L), g/L
8.0% O-MWCNTs
Dispersed
0.016
0.031
0.061
Aggregated
0.061
0.143
0.429
0.714
5.1% O-MWCNTs
Dispersed
0.016
0.031
0.061
Aggregated 0.061
0.143
PAC Aggregated
0.143
0.429
0.714

35
As shown in Table 2.1, both aggregated and dispersed O-MWCNTs were applied
in experiments at the S/L of 0.061 g/L. This is the only solid-to-liquid ratio with
sufficiently large CNT mass for the aggregated O-MWCNTs powder to be accurately
measured out using an analytical balance (0.9 ± 0.1 mg per sample) and with a
sufficiently low solid concentration to allow the maintenance of stable O-MWCNT
dispersion that do not
2.2.6 Measurement of Adsorbate Concentrations
At the end of the specified equilibration period, all samples from the sorption
experiments were removed from the rotator and solutions were passed through a 0.20 µm
nylon filter (Corning Inc.). I then measured the pH as well as aqueous concentrations of
Zn2+
in the filtrate. Preliminary experiments were conducted in systems without CNT
addition and these results confirmed negligible (< 1%) uptake of Zn2+
by the filter. In
order to test the filtration efficiency of the filter, O-MWCNT dispersions were prepared
in pure Milli-Q water at the lowest (0.016 g/L) and highest (0.061 g/L) concentrations
used in this study. These were passed through the same nylon filter and the filtrate was
scanned from 200 nm to 800 nm using UV-Vis. Results showed that negligible amount of
O-MWCNTs in the dispersion passed through the filters (99.8% removal). The
concentrations of Zn2+
(Ce in equilibrium experiments and Ct in kinetic experiments) in
the filtrates were measured using inductively coupled plasma mass spectrometry (ICP-
MS, ELAN DRC II, PerkinElmer) or atomic absorption spectroscopy (AAS, AAnalyst
100, PerkinElmer). The solid (adsorbed) concentration of Zn2+
at equilibrium, qe
(mmol/g), was calculated using Eq. 2.1 below:

36
M
VCCq e
e
)(0
Eq. 2.1
where C0 is the initial aqueous concentration of Zn2+
(mM); V is the volume of solution
(L); and M is the mass of adsorbent (O-MWCNT or PAC, g).
In studies of kinetics, the instantaneous aqueous Zn2+
concentration at time t, Ct
was measured and the instantaneously adsorbed concentration of Zn2+
at time t, qt, was
calculated using Eq. 2.1 as well.
2.2.7 Mathematical Modeling of Adsorption Isotherms
The Langmuir isotherm model, as shown in Eq. 2.2, was used to fit all adsorption
isotherms and was the primary tool for quantitative comparison of results. The following
“single-site” form of the model was fit to data in a manner designed to minimize the sum
of unweighted squared errors between observed data and model values (solver in Excel):
eL
Le
eCK
qKCq
1
max Eq. 2.2
where qmax is the maximum sorption capacity (mmol/g) and KL is the adsorption affinity
(mM-1
). Because the regression results using linearization or least squared regression with
weighted squared errors were similar to the results obtained with the currently applied
method, these two methods were not applied in this study.
In addition to the traditional Langmuir isotherm, a two-site Langmuir isotherm
model as shown in Eq. 2.3 was also applied to fit the experimental results. Cho et al.1
eCOOHL
COOHCOOHLe
egrapheneL
graphenegrapheneLe
eCK
qKC
CK
qKCq
,
max,,
,
max,
11
, Eq. 2.3
have shown that the quantity of carboxylic groups on the surface of O-MWCNTs
correlates strongly with the adsorption capacity of O-MWCNTs, while the other

37
functional groups, i.e., carbonyl, hydroxyl and non-identified residue, show
comparatively negligible correlation. The correlation between carboxylic groups and the
adsorption capacity of O-MWCNTs also revealed a positive intercept, indicating
adsorption of Zn2+
onto the surface of O-MWCNTs where carboxylic groups were absent.
Graphene accounts for over 90% of the carbon on the surface of O-MWCNTs. Therefore,
we assumed that the graphene and carboxylic groups served as the two dominant types of
adsorption sites. Note that the contribution of the graphene surfaces is also significant
only because of their high relative contribution to surface area despite their low unit
adsorption ability for metal ions. On the other hand, although carboxylic groups have a
much lower relative surface concentration compared to that of the graphene sheet, but
show much stronger affinity to Zn2+
, leading to high adsorption capacity. More details
regarding the two-site Langmuir model have been provided previously by Cho et al.1
2.3 Results and Discussions
2.3.1 Characterization of O-MWCNTs
The total atomic oxygen concentrations on the surface of studied O-MWCNTs as
well as the relative percentages of different oxygen containing functional groups are
summarized in Table 2.2. Also included in Table 2.2 is the total surface oxygen
Table 2.2. Surface oxygen concentrations and oxide distribution of adsorbents*
Treatment
method OT% OCOOH% OC=O% OOH% Oothers%
18% HNO3 5.1 2.0 2.9 0.6 -0.5
25% HNO3 8.0 2.2 1.9 0.6 0.7
43% HNO3 8.0 2.6 1.4 0.7 1.6
53% HNO3 8.0 2.8 1.1 0.7 2.6
KMnO4/H2SO4 8.0 3.6 1.4 0.7 2.3
PAC 8.0 N/A N/A N/A N/A
* The XPS measurement in conjunction with chemical derivatization methods was
conducted in Chemistry Department by Kevin Wapasnick and David Goodwin.
38
concentration of PAC (sieved through mesh 200) applied in this study. The values of
surface oxygen in these O-MWCNTs were 5.1%, 5.4%, 6.3%, 7.1%, and 8.0%,
respectively. The surface oxygen concentration for PAC was 8.0%. For the 5.1% and
8.0% O-MWCNTs, the percentages of oxygen associated with carboxyl groups were
estimated to be 2.0% and 3.6%, respectively. The measured BET surface area for 8.0%
O-MWCNT and PAC were 228.4 ± 0.6 m2/g, and 1004.0 ± 0.1 m
2/g respectively. It has
been shown from our previous study that O-MWCNTs oxidized using HNO3 or
KMnO4/H2SO4 exhibited statistically identical surface area compared to their pristine
counterpart.1 Therefore, it is reasonable to assume that 5.1% O-MWCNT exhibits surface
area of 228 m2/g. DLS measurement showed that the hydration diameter Dh of the
dispersed O-MWCNTs involving in this study was 163 ± 5 nm, which was similar to
those measured in our previous studies, where the existence of individually dispersed
nanoparticles in solution was shown using TEM and AFM.43
2.3.2 Kinetic Study of O-MWCNT Adsorption
The adsorption kinetics of Zn2+
onto dispersed and aggregated O-MWCNTs is
shown in Figure 2.1. The adsorption of Zn2+
onto dispersed or aggregated O- MWCNTs
were both apparently complete within less than 30 minutes.. For the dispersed O-
MWCNTs, the adsorption kinetics figure reaches a plateau within 5 minutes. For the
aggregated O-MWCNTs, the time required to reach a plateau was relatively longer, but
still under 30 minutes. Due to the experimental limitation, quantitative analysis was not
conducted for the kinetic experiments. It is noteworthy, however, that pseudo-second
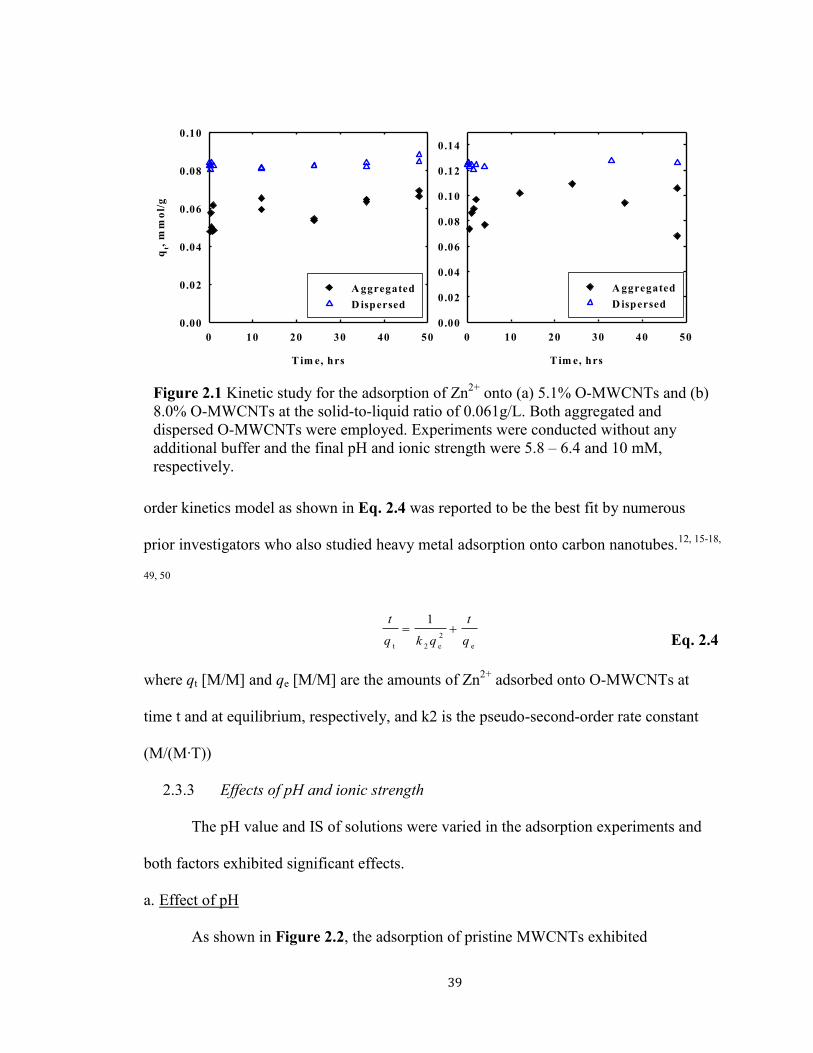
39
order kinetics model as shown in Eq. 2.4 was reported to be the best fit by numerous
prior investigators who also studied heavy metal adsorption onto carbon nanotubes.12, 15-18,
49, 50
e
2
e2t
1
q
t
qkq
t
Eq. 2.4
where qt [M/M] and qe [M/M] are the amounts of Zn2+
adsorbed onto O-MWCNTs at
time t and at equilibrium, respectively, and k2 is the pseudo-second-order rate constant
(M/(M·T))
2.3.3 Effects of pH and ionic strength
The pH value and IS of solutions were varied in the adsorption experiments and
both factors exhibited significant effects.
a. Effect of pH
As shown in Figure 2.2, the adsorption of pristine MWCNTs exhibited
Figure 2.1 Kinetic study for the adsorption of Zn2+
onto (a) 5.1% O-MWCNTs and (b)
8.0% O-MWCNTs at the solid-to-liquid ratio of 0.061g/L. Both aggregated and
dispersed O-MWCNTs were employed. Experiments were conducted without any
additional buffer and the final pH and ionic strength were 5.8 – 6.4 and 10 mM,
respectively.
T im e, hrs
0 10 20 30 40 50
qt,
mm
ol/
g
0 .00
0.02
0.04
0.06
0.08
0.10
A ggregated
D ispersed
T im e, hrs
0 10 20 30 40 50
0.00
0.02
0.04
0.06
0.08
0.10
0.12
0.14
A ggregated
D ispersed

40
significantly larger adsorption ability towards Ni2+
at pH 7.1 than at pH 5.2. At pH 7.1,
both the initial isotherm slope (affinity) and the ultimately approached plateau
(adsorption capacity) of the isotherm are larger than those at pH 5.2.
The extent of difference is larger than what was previously reported by Cho et
al.,1 who found that pH had negligible effect on the adsorption of Zn
2+ (<15% change in
qe) for both pristine and O-MWCNTs at pH 5.0 – 7.0. It is noteworthy, however, that pH
5.0 was the lower limit of the pH range in the study of Cho et al.1 and that this value is
Figure 2.2. Adsorption isotherms of Ni2+
onto pristine MWCNTs at pH values of 5.2 ±
0.3 and 7.1 ± 0.1. 5 mM NaHCO3 was applied as a buffer at pH 7.1. Experiments were
conducted without any buffer at pH 5.2. IS was maintained at 10 mM with NaNO3 for
all experiments conducted for this purpose.
C e, m M
0.0 0.5 1.0 1.5 2.0
qe
, m
mo
l/g
0 .00
0.02
0.04
0.06
0.08
0.10
pH 7.1
pH 5.2

41
within a pH range where high sensitivity to pH is likely and, in particular, at a pH where
significant decreases on Zn2+
adsorption with pH begin to occur. Given the different
species of cations being studied (Ni2+
here versus Zn2+
in Cho et al) and that there is
relatively large variation of pH value (± 0.3) in both studies owing to the absence of
buffer at pH 5.0, the noted differences of results are not especially surprising. Morever,
the large difference in adsorption capacity at these two pH values, as observed in this
study, is also consistent with expectations based on deprotonization of carboxylic groups
on the surface of MWCNTs at higher pH. In order to avoid the interference of pH in
subsequent studies, all experiments involving Ni2+
were conducted at pH 7.0. When Zn2+
was applied, no buffer was applied and the final pH lied between 5.8 to 6.4, where the pH
effect was observed to be negligible, as is consistent with the prior findings of Cho et al.1.
b. Effect of ionic strength
IS effects on the adsorption of metal cations by O-MWCNTs has been reported
previously mostly with aggregated CNTs 6-8, 11, 16
and these results were confirmed by our
studies for dispersed forms of O-MWCNTs. As shown in Figure 2.3, higher adsorption
capacity of dispersed O-MWCNTs for Zn2+
was observed at IS of 1 mM than that at IS of
10 mM.
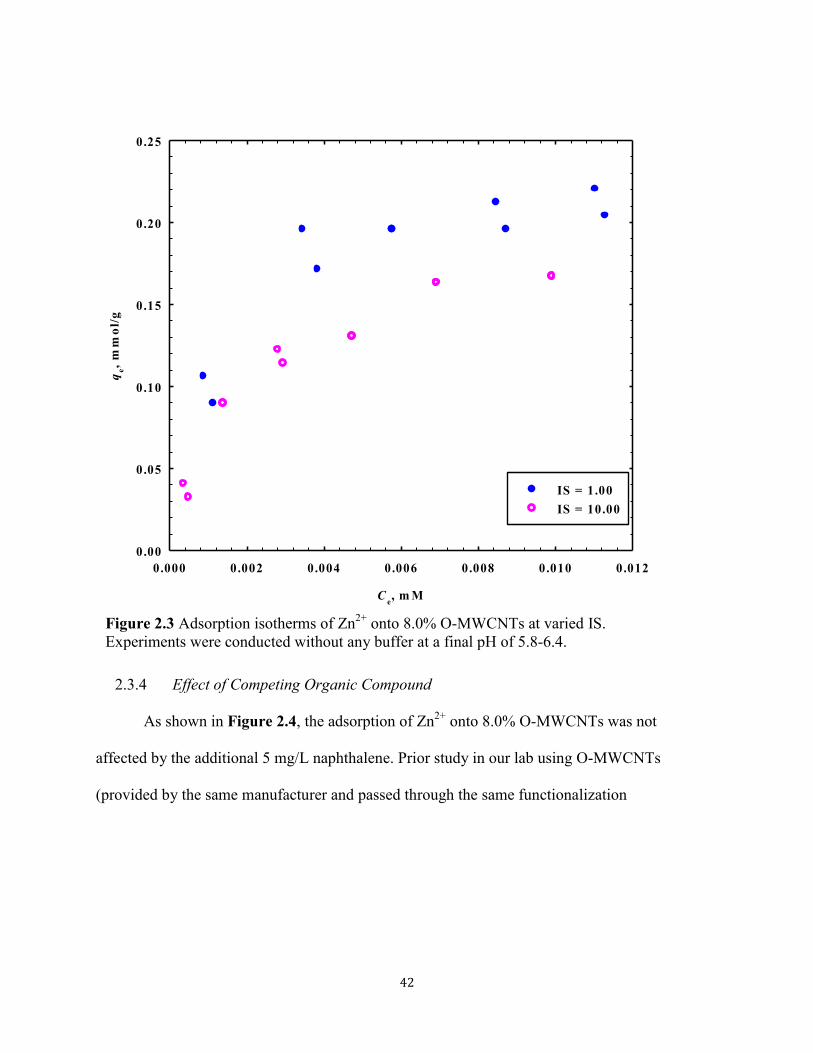
42
2.3.4 Effect of Competing Organic Compound
As shown in Figure 2.4, the adsorption of Zn2+
onto 8.0% O-MWCNTs was not
affected by the additional 5 mg/L naphthalene. Prior study in our lab using O-MWCNTs
(provided by the same manufacturer and passed through the same functionalization
Ce, m M
0.000 0.002 0.004 0.006 0.008 0.010 0.012
qe,
mm
ol/
g
0 .00
0.05
0.10
0.15
0.20
0.25
IS = 1.00
IS = 10.00
Figure 2.3 Adsorption isotherms of Zn2+
onto 8.0% O-MWCNTs at varied IS.
Experiments were conducted without any buffer at a final pH of 5.8-6.4.

43
process) showed that the equilibrated adsorbed naphthalene was~ 44 mg/g for 7.4% O-
MWCNTs and ~ 31 mg/g 8.9% O-MWCNTs in a single-solute system.19
Even if the
adsorbed amount of naphthalene was suppressed by the presence of Zn2+
, the presence of
naphthalene in the system should still have a noticeable effect on the adsorption capacity
of O-MWCNTs for Zn2+
. These results therefore may indicate that metallic ions and
hydrophobic organic compounds adsorb onto O-MWCNTs with different adsorption
mechanisms. This finding is consistent with those reported in previous studies where ion
Ce, m M
0.0 0.5 1.0 1.5 2.0
qe,
mm
ol/
g
0 .00
0.05
0.10
0.15
0.20
0.25
0.30
0.35
Pure Zn2+
Zn2+
+ N A P
Figure 2.4 Adsorption isotherms of Zn2+
onto 8.0% O-MWCNTs in the presence and
absence of 5 mg/L naphthalene. Experiments were conducted without any buffer at a
final pH of 5.8-6.4

44
exchange was found to be the primary mechanism for metallic ion adsorption and π -π
interaction was the primary mechanism for the adsorption of organic compounds.7, 19, 25, 51
2.3.5 Effect of Surface Chemistry
The concentration of oxygen functional groups on the surfaces of O-MWCNTs is
shown to have a significant effect on the adsorption of divalent ions(Figure 2.5).
O-MWCNTs with higher total oxygen concentrations and higher concentrations of
carboxylic groups exhibited higher adsorption capacity. All isotherms could be well fit by
the traditional Langmuir isotherm model. The parameters are summarized in Table 2.3.
Table 2.3. Fit parameters for the four isotherms shown in Figure 2.5 as based upon
fitting of the one-site Langmuir isotherm model.
OT% of O-MWCNTs qmax(mmol/g) qmax(mmol/m2) KL(mM
-1) R
2
5.1% 0.17 0.75 7.68 0.879
5.4% 0.24 1.05 11.25 0.989
6.3% 0.31 1.36 23.41 0.967
7.1% 0.37 1.63 27.21 0.983
Figure 2.5 Adsorption of Zn2+
onto O-MWCNTs at varied total oxygen concentrations
as well as carboxylic group concentrations. Experiments were conducted at the S/L of
0.43 g/L without any buffer and the final pH and ionic strength were 5.8 - 6.4 and 10
mM, respectively. The (a) mass normalized and (b) surface area normalized equilibrated
solid concentration (qe) were both shown. All data were fitted using single-site
Langmuir model.
C e, m M
0.0 0.5 1.0 1.5 2.0 2.5 3.0
qe
, m
mo
l/g
0 .0
0.1
0.2
0.3
0.4
5.1% :2.0%
5.4% :2.2%
6.3% :2.6%
7.1% :2.8%
OT
%:OC O O
%
C e, m M
0.0 0.5 1.0 1.5 2.0 2.5 3.0
qe
,
mo
l/m
2
0.0
0.2
0.4
0.6
0.8
1.0
1.2
1.4
1.6
1.8
5.1% :2.0%
5.4% :2.2%
6.3% :2.6%
7.1% :2.8%
OT
%:OC O O
%
(a) (b)
45
In Figure 2.5, the adsorbed concentration qe is shown in units of mmol/g as well as
µmol/m2. The former is more commonly seen in literature and can help researchers more
practically consider the required amount of adsorbent needed in a packed bed or batch
study to reach a specific equilibrium concentration. The latter (µmol/m2), on the other
hand, is more useful for considering the adsorption mechanism since the number of
adsorption sites will scale with the surface area of the adsorbent. Although the BET
measured surface area is an inexact measure of the actual contact area available for
adsorption in solution, normalization of the adsorbed concentration with the surface area
one can still provide a possibly better qualitative method for comparing the adsorption
ability per unit site among varied adsorbents.
In addition to the traditional Langmuir model, a two-site Langmuir model as
described above and in Cho et al.1 was also applied in this study to mathematically
analyze the role of carboxyl functional groups. As discussed previously, we hypothesize
that carboxylic groups and graphene are two primary site types on the surface of O-
MWCNTs interacting with Zn2+
based on the high correlation between carboxylic group
concentration and the adsorption capacity of O-MWCNTs in linear regression and the
positive intercepts of the regression.1 The four experimental data were then fitted
altogether with eight qmax (two for each type of O-MWCNTs) and two KL (one attributed
to graphene and the other to carboxylic groups for all O-MWCNTs employed). The fit
parameters are shown in Table 2.4 and the data were replotted with the two-site
Langmuir model in Figure 2.6.
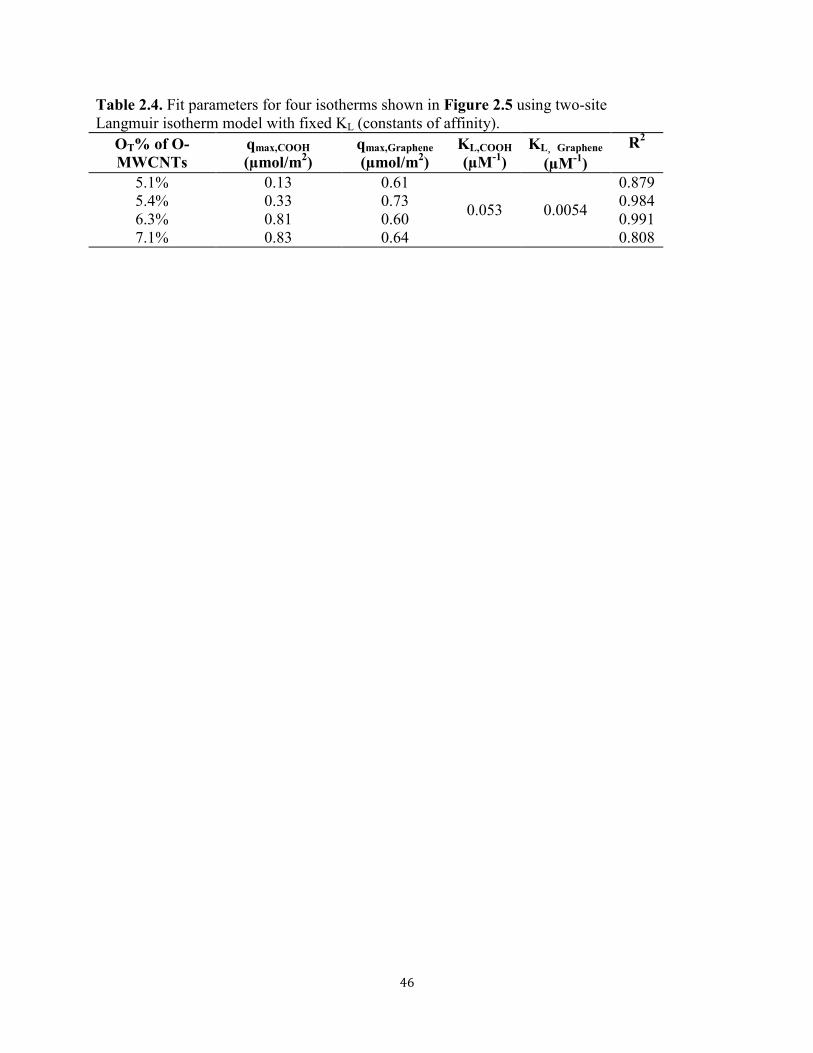
46
Table 2.4. Fit parameters for four isotherms shown in Figure 2.5 using two-site
Langmuir isotherm model with fixed KL (constants of affinity).
OT% of O-
MWCNTs
qmax,COOH
(µmol/m2)
qmax,Graphene
(µmol/m2)
KL,COOH
(µM-1
)
KL,Graphene
(µM-1
)
R2
5.1% 0.13 0.61
0.053 0.0054
0.879
5.4% 0.33 0.73 0.984
6.3% 0.81 0.60 0.991
7.1% 0.83 0.64 0.808

47
The two-site Langmuir model fit the experimental results reasonably well. These
results are consistent with the previous findings of Cho et al.1, who reported that the
adsorption capacity of O-MWCNTs comprises contributions primarily from graphene
Ce, m M
0.0 0.5 1.0 1.5 2.0 2.5 3.0
0.0
0.2
0.4
0.6
0.8
1.0
1.2(a) (b)
Ce, m M
0.0 0.5 1.0 1.5 2.0 2.5
0.0
0.2
0.4
0.6
0.8
1.0
1.2
1.4
1.6
1.8
(c) (d)Ce, m M
0.0 0.5 1.0 1.5 2.0
qe,
mo
l/m
2
0.0
0.2
0.4
0.6
0.8
1.0
Ce, m M
0.0 0.5 1.0 1.5 2.0 2.5
qe,
mo
l/m
2
0.0
0.2
0.4
0.6
0.8
1.0
1.2
1.4
1.6(c)
(a)
C ontribution of carboxylic groups
C ontribution of graphene groups
T otal fit
Figure 2.6 Two-site Langmuir isotherm fit of adsorption isotherms shown in Figure 2.5.
The isotherms shown were obtained using (a) 5.1% O-MWCNTs, (b) 5.4% O-MWCNTs,
(c) 6.4% O-MWCNTs and (d) 7.1% O-MWCNTs.
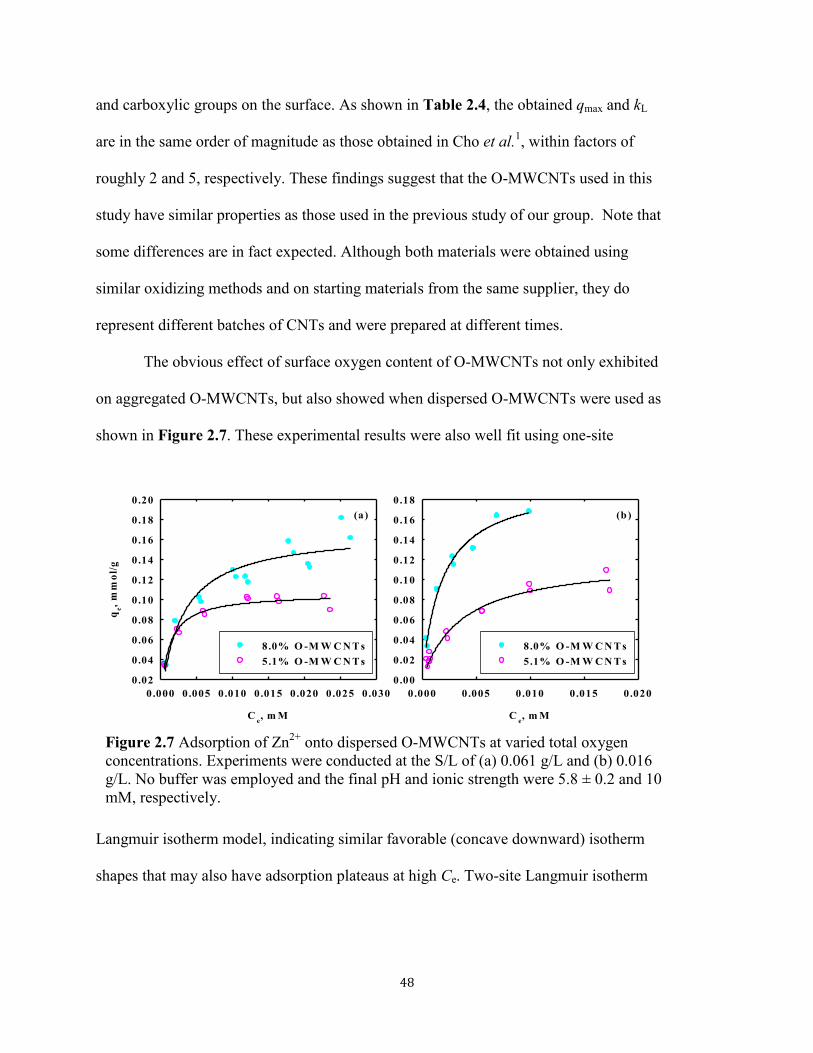
48
and carboxylic groups on the surface. As shown in Table 2.4, the obtained qmax and kL
are in the same order of magnitude as those obtained in Cho et al.1, within factors of
roughly 2 and 5, respectively. These findings suggest that the O-MWCNTs used in this
study have similar properties as those used in the previous study of our group. Note that
some differences are in fact expected. Although both materials were obtained using
similar oxidizing methods and on starting materials from the same supplier, they do
represent different batches of CNTs and were prepared at different times.
The obvious effect of surface oxygen content of O-MWCNTs not only exhibited
on aggregated O-MWCNTs, but also showed when dispersed O-MWCNTs were used as
shown in Figure 2.7. These experimental results were also well fit using one-site
Langmuir isotherm model, indicating similar favorable (concave downward) isotherm
shapes that may also have adsorption plateaus at high Ce. Two-site Langmuir isotherm
Ce, m M
0.000 0.005 0.010 0.015 0.020 0.025 0.030
qe,
mm
ol/
g
0 .02
0.04
0.06
0.08
0.10
0.12
0.14
0.16
0.18
0.20
8.0% O -M W C N T s
5.1% O -M W C N T s
Ce, m M
0.000 0.005 0.010 0.015 0.020
0.00
0.02
0.04
0.06
0.08
0.10
0.12
0.14
0.16
0.18
8.0% O -M W C N T s
5.1% O -M W C N T s
(a) (b)
Figure 2.7 Adsorption of Zn2+
onto dispersed O-MWCNTs at varied total oxygen
concentrations. Experiments were conducted at the S/L of (a) 0.061 g/L and (b) 0.016
g/L. No buffer was employed and the final pH and ionic strength were 5.8 ± 0.2 and 10
mM, respectively.
49
model was not applied on these results due to the relatively small pool of the data
reservoir.
2.3.6 Effect of Aggregation States
As mentioned above, it is important to investigate the possible differences
between the dispersed and aggregated O-MWCNTs in their interactions with divalent
cations. In the current study we tested the adsorption of Zn2+
ions onto 8% and 5% O-
MWCNTs at the solid-to-liquid ratio of 0.061 g/L in both completely dispersed and
aggregated form. Initial hydrodynamic particle sizes of O-MWCNTs dispersions were
tested to be ~160 nm for 5.1% O-MWCNTs and ~163 nm for 8.0% O-MWCNTs, which
are typical particle sizes for completely dispersed O-MWCNTs.44
Even at the low S/L
used, obvious aggregation was observed right after mixing the 5.1% O-MWCNT
dispersion with the Zn2+
testing solution. On the other hand, the 8.0% O-MWCNT
dispersion exhibited greater stability, with most material staying well dispersed
throughout the equilibrium time (48 hours) and with only a few aggregated particles
attached to the wall of containers. DLS measurement of the dispersions showed that the
majority of 8.0% O-MWCNT dispersion had the size of ~ 180 nm but the size of 5.1% O-
MWCNT dispersion increased to over 400 nm in 10 min.
Figure 2.8 shows the adsorption isotherms for both 5.1% and 8.0% O-MWCNT

50
in both dispersed and aggregated (powdered) forms. For O-MWCNTs at 5.1%O and
8.0%O, there is no statistical difference in their adsorption isotherms between aggregated
and dispersed forms at the same solid-to-liquid ratio. These results may indicate there is
no significant difference in adsorption mechanism between O-MWCNTs that are still in
their initial aggregated state and those being sonicated and well dispersed. These results
are also consistent with the observation in our previous study that the aggregation state of
O-MWCNTs, per se, does not appear to have a major effect on their adsorption abilities.1
One may notice that, within the lower equilibrium concentration range of 0.002 – 0.01
mM, the dispersed O-MWNTs exhibited slightly higher adsorbed concentration, which
was also shown in the kinetics study (Figure 2.1). However, this difference was no
longer obvious when Ce > 0.01 mM and therefore did not cause the estimated adsorption
capacity of the dispersed O-MWCNTs to be statistically higher than that of the
aggregated O-MWCNTs. These findings were different from those of Zhang et
Figure 2.8 Adsorption of Zn2+
onto (a) 5.1% O-MWCNTs and (b) 8.0% O-MWCNTs at
S/L of 0.061 g/L. Both aggregated and dispersed O-MWCNTs were used as sorbents.
No buffer was used in the experiments and the final pH and ionic strength were 5.8 ±
0.2 and 10 mM, respectively.
Ce, m M
0.000 0.005 0.010 0.015 0.020 0.025
qe,
mm
ol/
g
0 .00
0.02
0.04
0.06
0.08
0.10
0.12
0.14
A ggregated
D ispersed
Ce, m M
0.000 0.010 0.020 0.030 0.040
0.00
0.05
0.10
0.15
0.20
0.25
A ggregated
D ispersed
(a) (b)
51
al.(2012)28
and Zhang et al. (2009)27
, both of whom reported a significant increase of
adsorption capacity for CNTs while dispersed. It is noteworthy, however, that they
focused on adsorption of organic compounds onto CNTs and to the best of our
knowledge, no study has been conducted to investigate the effect of aggregation state on
heavy metal adsorption onto CNTs. We therefore postulate that aggregation state is of
great importance when the adsorption mechanism is π - π bonding because the effective
surface area increases when CNTs are dispersed. When ion exchange is the primary
mechanism, as in heavy metal adsorption, the aggregation state no longer plays an
important role in determining the adsorption capacity of CNTs because the availability of
carboxylic groups, which serve as ion exchange sites on CNT surfaces, is not limited by
CNT aggregation state.
2.3.7 Effect of Solid-to-Liquid Ratio in the System
As noted above, the aggregation state of the O-MWCNTs does not appear to have
any major effect on the adsorption capacity of O-MWCNTs for the conditions of this
study. The solid-to-liquid ratio, on the other hand, showed significant effect on the
adsorption characteristics of both types of O-MWCNTs. Figure 2.9 shows the adsorption
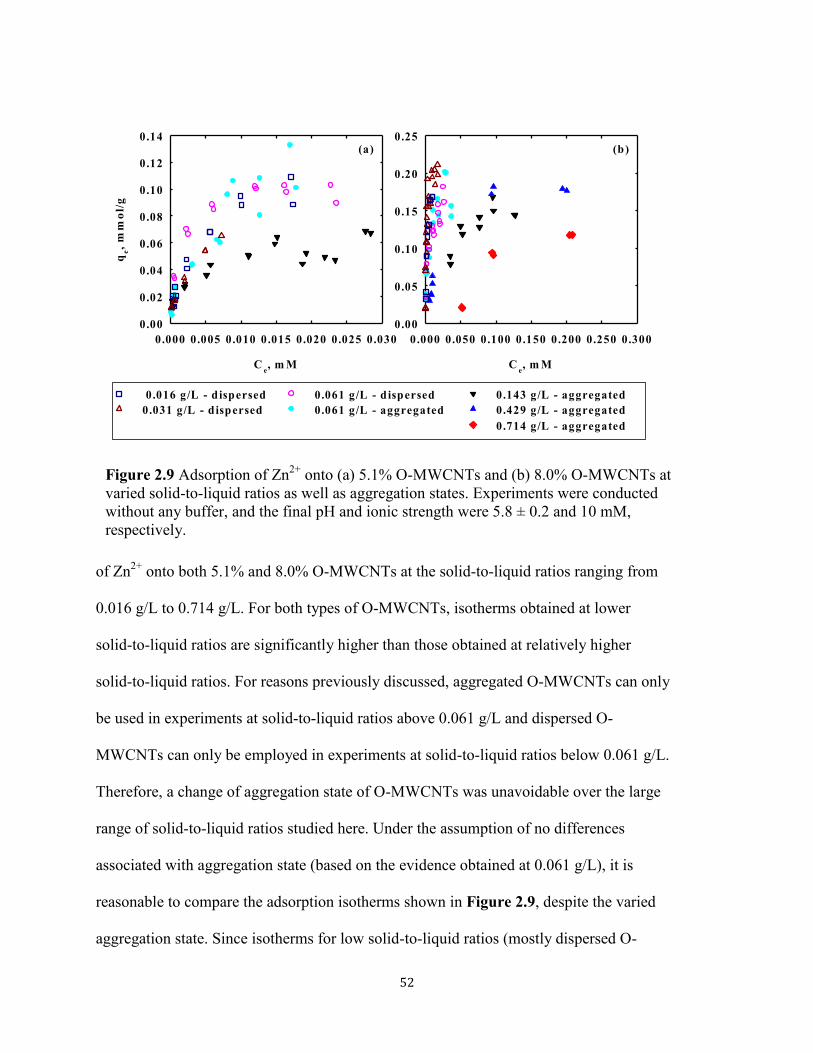
52
of Zn2+
onto both 5.1% and 8.0% O-MWCNTs at the solid-to-liquid ratios ranging from
0.016 g/L to 0.714 g/L. For both types of O-MWCNTs, isotherms obtained at lower
solid-to-liquid ratios are significantly higher than those obtained at relatively higher
solid-to-liquid ratios. For reasons previously discussed, aggregated O-MWCNTs can only
be used in experiments at solid-to-liquid ratios above 0.061 g/L and dispersed O-
MWCNTs can only be employed in experiments at solid-to-liquid ratios below 0.061 g/L.
Therefore, a change of aggregation state of O-MWCNTs was unavoidable over the large
range of solid-to-liquid ratios studied here. Under the assumption of no differences
associated with aggregation state (based on the evidence obtained at 0.061 g/L), it is
reasonable to compare the adsorption isotherms shown in Figure 2.9, despite the varied
aggregation state. Since isotherms for low solid-to-liquid ratios (mostly dispersed O-
Figure 2.9 Adsorption of Zn2+
onto (a) 5.1% O-MWCNTs and (b) 8.0% O-MWCNTs at
varied solid-to-liquid ratios as well as aggregation states. Experiments were conducted
without any buffer, and the final pH and ionic strength were 5.8 ± 0.2 and 10 mM,
respectively.
Ce, m M
0.000 0.005 0.010 0.015 0.020 0.025 0.030
qe,
mm
ol/
g
0 .00
0.02
0.04
0.06
0.08
0.10
0.12
0.14
Ce, m M
0.000 0.050 0.100 0.150 0.200 0.250 0.300
0.00
0.05
0.10
0.15
0.20
0.25
0.143 g/L - aggregated
0.429 g/L - aggregated
0.714 g/L - aggregated
0.061 g/L - aggregated
0.061 g/L - d ispersed
0.031 g/L - d ispersed
0.016 g/L - d ispersed
(a) (b)
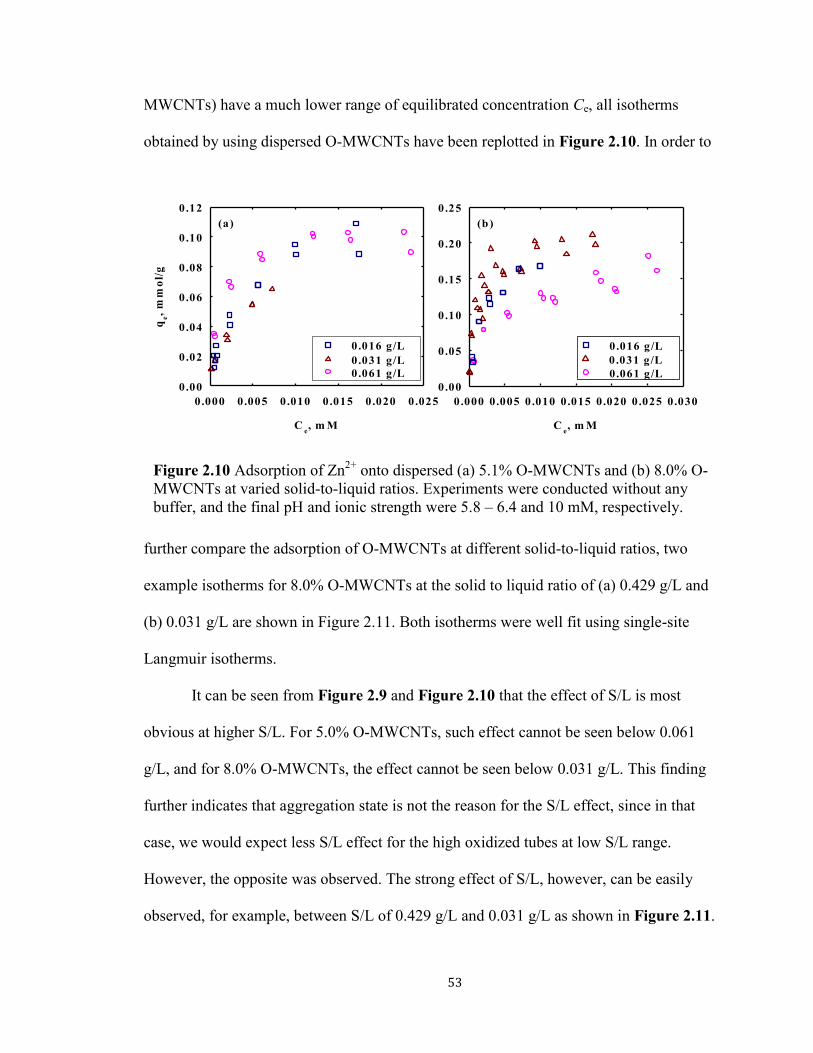
53
MWCNTs) have a much lower range of equilibrated concentration Ce, all isotherms
obtained by using dispersed O-MWCNTs have been replotted in Figure 2.10. In order to
further compare the adsorption of O-MWCNTs at different solid-to-liquid ratios, two
example isotherms for 8.0% O-MWCNTs at the solid to liquid ratio of (a) 0.429 g/L and
(b) 0.031 g/L are shown in Figure 2.11. Both isotherms were well fit using single-site
Langmuir isotherms.
It can be seen from Figure 2.9 and Figure 2.10 that the effect of S/L is most
obvious at higher S/L. For 5.0% O-MWCNTs, such effect cannot be seen below 0.061
g/L, and for 8.0% O-MWCNTs, the effect cannot be seen below 0.031 g/L. This finding
further indicates that aggregation state is not the reason for the S/L effect, since in that
case, we would expect less S/L effect for the high oxidized tubes at low S/L range.
However, the opposite was observed. The strong effect of S/L, however, can be easily
observed, for example, between S/L of 0.429 g/L and 0.031 g/L as shown in Figure 2.11.
Figure 2.10 Adsorption of Zn2+
onto dispersed (a) 5.1% O-MWCNTs and (b) 8.0% O-
MWCNTs at varied solid-to-liquid ratios. Experiments were conducted without any
buffer, and the final pH and ionic strength were 5.8 – 6.4 and 10 mM, respectively.
Ce, m M
0.000 0.005 0.010 0.015 0.020 0.025
qe,
mm
ol/
g
0 .00
0.02
0.04
0.06
0.08
0.10
0.12
Ce, m M
0.000 0.005 0.010 0.015 0.020 0.025 0.030
0.00
0.05
0.10
0.15
0.20
0.25
0.061 g/L
0.031 g/L
0.016 g/L
0.061 g/L
0.031 g/L
0.016 g/L
(a) (b)
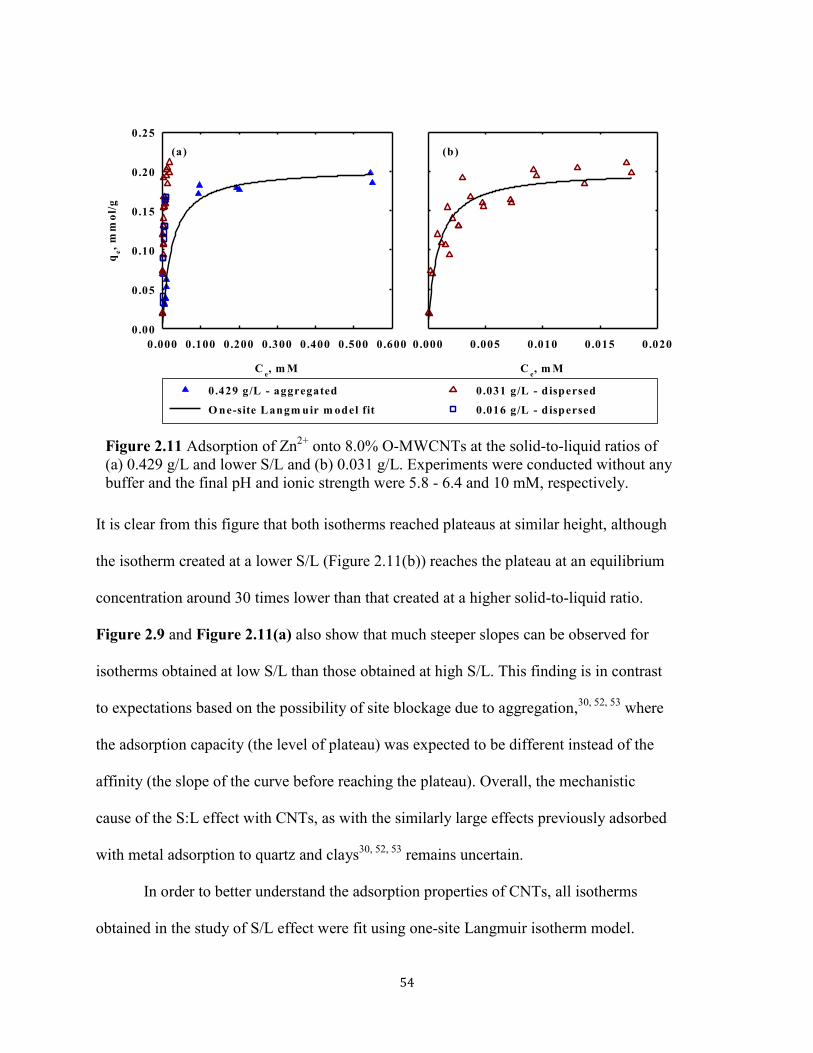
54
It is clear from this figure that both isotherms reached plateaus at similar height, although
the isotherm created at a lower S/L (Figure 2.11(b)) reaches the plateau at an equilibrium
concentration around 30 times lower than that created at a higher solid-to-liquid ratio.
Figure 2.9 and Figure 2.11(a) also show that much steeper slopes can be observed for
isotherms obtained at low S/L than those obtained at high S/L. This finding is in contrast
to expectations based on the possibility of site blockage due to aggregation,30, 52, 53
where
the adsorption capacity (the level of plateau) was expected to be different instead of the
affinity (the slope of the curve before reaching the plateau). Overall, the mechanistic
cause of the S:L effect with CNTs, as with the similarly large effects previously adsorbed
with metal adsorption to quartz and clays30, 52, 53
remains uncertain.
In order to better understand the adsorption properties of CNTs, all isotherms
obtained in the study of S/L effect were fit using one-site Langmuir isotherm model.
Ce, m M
0.000 0.005 0.010 0.015 0.020
Ce, m M
0.000 0.100 0.200 0.300 0.400 0.500 0.600
qe,
mm
ol/
g
0 .00
0.05
0.10
0.15
0.20
0.25
(a) (b)
0.429 g/L - aggregated
O ne-site L angm uir m odel fit
0.031 g/L - d ispersed
0.016 g/L - d ispersed
Figure 2.11 Adsorption of Zn2+
onto 8.0% O-MWCNTs at the solid-to-liquid ratios of
(a) 0.429 g/L and lower S/L and (b) 0.031 g/L. Experiments were conducted without any
buffer and the final pH and ionic strength were 5.8 - 6.4 and 10 mM, respectively.
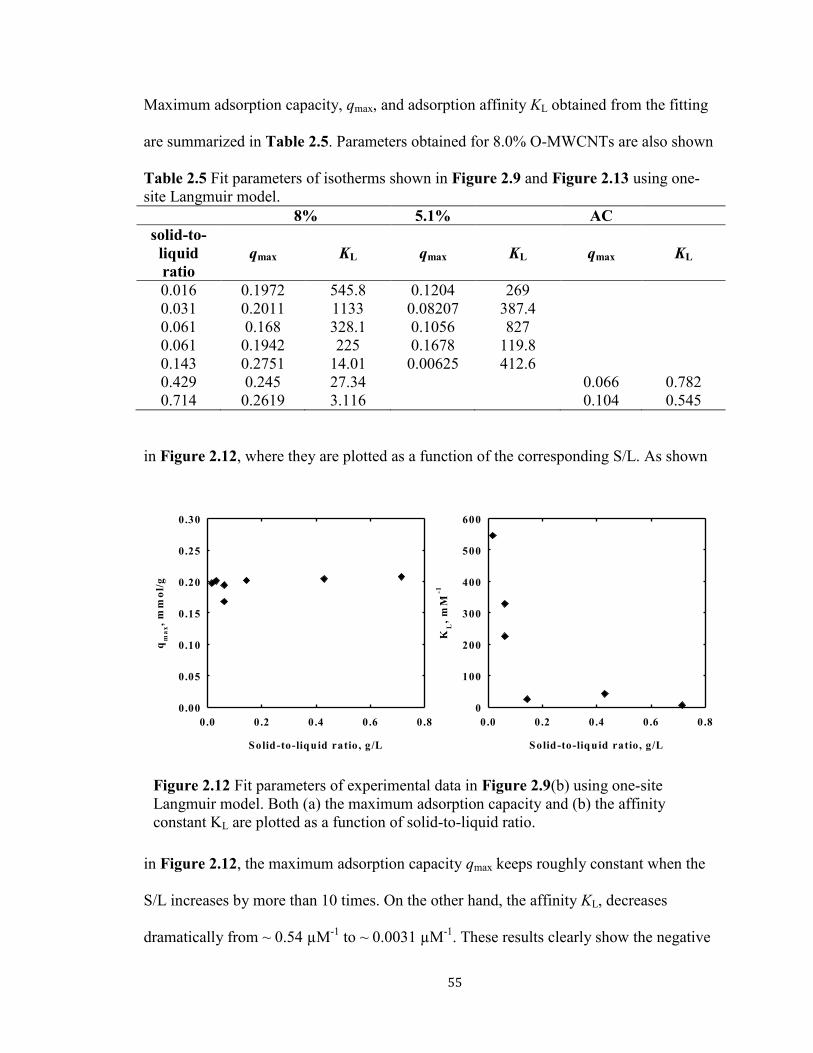
55
Maximum adsorption capacity, qmax, and adsorption affinity KL obtained from the fitting
are summarized in Table 2.5. Parameters obtained for 8.0% O-MWCNTs are also shown
Table 2.5 Fit parameters of isotherms shown in Figure 2.9 and Figure 2.13 using one-
site Langmuir model.
8% 5.1% AC
solid-to-
liquid
ratio
qmax KL qmax KL qmax KL
0.016 0.1972 545.8 0.1204 269
0.031 0.2011 1133 0.08207 387.4
0.061 0.168 328.1 0.1056 827
0.061 0.1942 225 0.1678 119.8
0.143 0.2751 14.01 0.00625 412.6
0.429 0.245 27.34 0.066 0.782
0.714 0.2619 3.116 0.104 0.545
in Figure 2.12, where they are plotted as a function of the corresponding S/L. As shown
in Figure 2.12, the maximum adsorption capacity qmax keeps roughly constant when the
S/L increases by more than 10 times. On the other hand, the affinity KL, decreases
dramatically from ~ 0.54 µM-1
to ~ 0.0031 µM-1
. These results clearly show the negative
Solid-to-liquid ratio, g/L
0.0 0.2 0.4 0.6 0.8
qm
ax,
mm
ol/
g
0 .00
0.05
0.10
0.15
0.20
0.25
0.30
Solid-to-liquid ratio, g/L
0.0 0.2 0.4 0.6 0.8
KL
, m
M-1
0
100
200
300
400
500
600
Figure 2.12 Fit parameters of experimental data in Figure 2.9(b) using one-site
Langmuir model. Both (a) the maximum adsorption capacity and (b) the affinity
constant KL are plotted as a function of solid-to-liquid ratio.

56
correlation between the affinity of the adsorption sites on the surface of O-MWCNTs to
Zn2+
and the solid-to-liquid ratio of the system. As previously noted, however, the
fundamental mechanism causing such strong inverse relationship remains unclear.
One concern in the above regard is that our work may somehow be affected by
experimental artifacts that cause an “appearance” of S:L effects where they do not exist.
In order to evaluate the possibility of such artifact, and under the assumption that S:L
effects should not affect sorption with a microporous material such as PAC, we
conducted additional studies of Zn2+
sorption with PAC at S:L values of 0.429 g/L and
0.714 g/L). Note that, since PAC cannot be dispersed into aqueous solution as O-
MWCNTs. It is not possible to accurately measure lower PAC mass additions, and
experiments at lower solid-to-liquid ratio were not possible without using impractically
large aqueous volumes. The isotherms obtained using PAC were therefore limited to the
S:L ranges as given above. The resulting data, as with the prior CNT results, were fit
using one-site Langmuir model. The fitted parameters are summarized in Table 2.5. As
evident from the values in this table and as shown in Figure 2.13, the S/L has negligible

57
effect on adsorption experiments using PAC as adsorbents. This is in direct contrast to
the strong inverse relationship previously discussed for the 8.0% O-MWCNTs. This
investigation indicates that the S/L effect is not a universal phenomenon throughout all
types of adsorbents and suggests against the possibility of experimentally artificial factors
causing our observations with CNTs. In addition, the results also suggest that the S/L
effect may indeed relate in some way to the fact that adsorption with O-MWCNTs occurs
on external surfaces of individual particles (with variable surface-volume ratios as
affected by solid-liquid ratio), whereas adsorption onto surfaces of PAC occurs on pore
walls that are internal to these microscopically porous materials, and which are, thus, less
likely to be affected by the proximity of other particles. Nonetheless, however – and as
already emphasized in prior discussion – we remain uncertain as to why adsorption
affinity to external surfaces is so heavily affected by solid-liquid ratio, even while
aggregated state (per se) seems to have relatively little effect.
Figure 2.13 Adsorption of Zn2+
onto (a) PAC and (b) 8.0% O-MWCNTs at varied solid-
to-liquid ratios. Experiments were conducted without any buffer and the final pH and
ionic strength were 5.8 -6.4 and 10 mM, respectively.
C e, m M
0.000 0.050 0.100 0.150 0.200
qe
, m
mo
l/g
0 .00
0.02
0.04
0.06
0.08
0.10
0.12
0.14
0.429 g/L
0.714 g/L
C e, m M
0.000 0.100 0.200 0.300 0.400 0.500
0.00
0.05
0.10
0.15
0.20
0.25
0.429 g/L
0.714 g/L
(a) (b)
58
2.4 Implication of the Study
The meaning of the results is twofold. First, this study investigated the potential
of CNTs as a new water treatment candidate. The large surface area and surface
functional groups make CNTs a good candidate as adsorbent for heavy metal removal.
Our study quantified the relationship between various functional groups, especially
carboxyl groups and unit-adsorbed amount of heavy metals on CNT surfaces. We also
developed a two-site Langmuir model for CNTs with varied surface oxygen
concentrations. These results, together with previous studies using traditional adsorbents,
such as PAC, provided quantitatively evaluation for CNT as a potential contaminant
treatment material. Second, this study has broadened our knowledge on the interactions
between CNTs, as novel materials, and heavy metals. O-MWCNTs at low concentrations
exhibited a significantly larger adsorption capacity for divalent metal ion adsorption. This
finding is of great importance in estimating the effect of CNTs on the transport and
distribution of heavy metals in the water and groundwater systems.
2.5 Cited References
1. Cho, H. H.; Wepasnick, K.; Smith, B. A.; Bangash, F. K.; Fairbrother, D. H.;
Ball, W. P., Sorption of Aqueous Zn[Ii] and Cd[Ii] by Multiwall Carbon Nanotubes: The
Relative Roles of Oxygen-Containing Functional Groups and Graphenic Carbon.
Langmuir 2010, 26, (2), 967-981.
2. Stumm, W.; Morgan, J. J., Aquatic Cheistry: Chemical Equilibria and Rates in
Natural Waters. John Wiley & Sons, Inc: New York, 1996.
3. Ipcs, International Programme on Chemical Safety. World Health Organization:
Geneva, 1988.
4. Purdom, P. W., Environmental Health. Academic Press: New York, 1980.
5. Moore, J. W.; Sutherland, D. J., Distribution of Heavy-Metals and
Radionuclides in Sediments, Water, and Fish in an Area of Great Bear Lake
Contaminated with Mine Wastes. Arch Environ Con Tox 1981, 10, (3), 329-338.
6. Jacques Buffle, R. R. D., Chemical and Biological Regulation of Aquatic
Systems. Lewis Publishers: Chelsea, 1991.
59
7. Chen, C. L.; Wang, X. K., Adsorption of Ni(Ii) from Aqueous Solution Using
Oxidized Multiwall Carbon Nanotubes. Ind Eng Chem Res 2006, 45, (26), 9144-9149.
8. Li, Y. H.; Ding, J.; Luan, Z. K.; Di, Z. C.; Zhu, Y. F.; Xu, C. L.; Wu, D. H.;
Wei, B. Q., Competitive Adsorption of Pb2+
, Cu2+
and Cd2+
Ions from Aqueous Solutions
by Multiwalled Carbon Nanotubes. Carbon 2003, 41, (14), 2787-2792.
9. Li, Y. H.; Wang, S.; Luan, Z.; Ding, J.; Xu, C.; Wu, D., Adsorption of
Cadmium(Ii) from Aqueous Solution by Surface Oxidized Carbon Nanotubes. Carbon
2003, 41, (5), 1057-1062.
10. Liao, Q.; Sun, J.; Gao, L., Adsorption of Chlorophenols by Multi-Walled
Carbon Nanotubes Treated with Hno3 and Nh3. Carbon 2008, 46, (3), 553-555.
11. Qiu, K. D.; Li, W. B., Adsorption of Hexavalent Chromium Ions on Multi-
Wall Carbon Nanotubes in Aqueous Solution. Acta Phys-Chim Sin 2006, 22, (12), 1542-
1546.
12. Lu, C. S.; Chiu, H.; Liu, C. T., Removal of Zinc(Ii) from Aqueous Solution by
Purified Carbon Nanotubes: Kinetics and Equilibrium Studies. Ind Eng Chem Res 2006,
45, (8), 2850-2855.
13. Wang, X.; Chen, C.; Hu, W.; Ding, A.; Xu, D.; Zhou, X., Sorption of
243am(Iii) to Multiwall Carbon Nanotubes. Environ Sci Technol 2005, 39, (8), 2856-
2860.
14. Wu, C. H., Studies of the Equilibrium and Thermodynamics of the Adsorption
of Cu2+
onto as-Produced and Modified Carbon Nanotubes. J Colloid Interf Sci 2007, 311,
(2), 338-346.
15. Vukovic, G. D.; Marinkovic, A. D.; Colic, M.; Ristic, M. D.; Aleksic, R.;
Peric-Grujic, A. A.; Uskokovic, P. S., Removal of Cadmium from Aqueous Solutions by
Oxidized and Ethylenediamine-Functionalized Multi-Walled Carbon Nanotubes. Chem
Eng J 2010, 157, (1), 238-248.
16. Lu, C. Y.; Liu, C. T.; Su, F. S., Sorption Kinetics, Thermodynamics and
Competition of Ni2+
from Aqueous Solutions onto Surface Oxidized Carbon Nanotubes.
Desalination 2009, 249, (1), 18-23.
17. Vukovic, G. D.; Marinkovic, A. D.; Skapin, S. D.; Ristic, M. D.; Aleksic, R.;
Peric-Grujic, A. A.; Uskokovic, P. S., Removal of Lead from Water by Amino Modified
Multi-Walled Carbon Nanotubes. Chem Eng J 2011, 173, (3), 855-865.
18. Luo, C.; Wei, R. Y.; Guo, D.; Zhang, S. F.; Yan, S. Q., Adsorption Behavior
of Mno2 Functionalized Multi-Walled Carbon Nanotubes for the Removal of Cadmium
from Aqueous Solutions. Chem Eng J 2013, 225, 406-415.
19. Cho, H. H.; Smith, B. A.; Wnuk, J. D.; Fairbrother, D. H.; Ball, W. P.,
Influence of Surface Oxides on the Adsorption of Naphthalene onto Multiwalled Carbon
Nanotubes. Environ Sci Technol 2008, 42, (8), 2899-2905.
20. Kuo, C. Y., Water Purification of Removal Aqueous Copper (Ii) by as-Grown
and Modified Multi-Walled Carbon Nanotubes. Desalination 2009, 249, (2), 781-785.
21. Gao, Z. M.; Bandosz, T. J.; Zhao, Z. B.; Han, M.; Qiu, J. S., Investigation of
Factors Affecting Adsorption of Transition Metals on Oxidized Carbon Nanotubes. J
Hazard Mater 2009, 167, (1-3), 357-365.
22. Diaz-Flores, P. E.; Lopez-Urias, F.; Terrones, M.; Rangel-Mendez, J. R.,
Simultaneous Adsorption of Cd2+
and Phenol on Modified N-Doped Carbon Nanotubes:
Experimental and Dft Studies. J Colloid Interf Sci 2009, 334, (2), 124-131.

60
23. Hsieh, S. H.; Horng, J. J.; Tsai, C. K., Growth of Carbon Nanotube on Micro-
Sized Al2o3 Particle and Its Application to Adsorption of Metal Ions. J Mater Res 2006,
21, (5), 1269-1273.
24. Ma, J. P.; Xiao, R. H.; Li, J. H.; Yu, J. B.; Zhang, Y. Q.; Chen, L. X.,
Determination of 16 Polycyclic Aromatic Hydrocarbons in Environmental Water
Samples by Solid-Phase Extraction Using Multi-Walled Carbon Nanotubes as Adsorbent
Coupled with Gas Chromatography-Mass Spectrometry. J Chromatogr A 2010, 1217,
(34), 5462-5469.
25. Chen, G. C.; Shan, X. Q.; Wang, Y. S.; Pei, Z. G.; Shen, X. E.; Wen, B.;
Owens, G., Effects of Copper, Lead, and Cadmium on the Sorption and Desorption of
Atrazine onto and from Carbon Nanotubes. Environ Sci Technol 2008, 42, (22), 8297-
8302.
26. Rao, G. P.; Lu, C.; Su, F., Sorption of Divalent Metal Ions from Aqueous
Solution by Carbon Nanotubes: A Review. Sep Purif Technol 2007, 58, (1), 224-231.
27. Zhang, S. J.; Shao, T.; Bekaroglu, S. S. K.; Karanfil, T., The Impacts of
Aggregation and Surface Chemistry of Carbon Nanotubes on the Adsorption of Synthetic
Organic Compounds. Environ Sci Technol 2009, 43, (15), 5719-5725.
28. Zhang, X.; Kah, M.; Jonker, M. T. O.; Hofmann, T., Dispersion State and
Humic Acids Concentration-Dependent Sorption of Pyrene to Carbon Nanotubes.
Environ Sci Technol 2012, 46, (13), 7166-7173.
29. Honeyman, B. D.; Balistrieri, L. S.; Murray, J. W., Oceanic Trace Metal
Scavenging: The Importance of Particle Concentration. Deep-Sea Res. 1988, 35, (2), 227
- 246.
30. Di Toro, D. M.; Mahony, J. D.; Kirchgraber, P. R.; O'byrne, A. L.; Pasquale,
L. R.; Piccirilli, D. C., The Effects of Nonreversibiliy, Particle Concentration, and Ionic
Strength on Heavy Metal Sorption. Environmental Science and Technology 1986, 20, (1),
55 - 61.
31. Mckinley, J. P.; Jenne, E. A., Experimental Investigation and Review of the
"Solids Concentration" Effect in Adsorption Studies. Environmental Science and
Technology 1991, 25, (12), 2082 - 2087.
32. Li, Y. H.; Burkhardt, L.; Buchholtz, M.; Ohara, P.; Santschi, P. H., Partition
of Radiotracers between Suspended Particles and Seawater. Geochimica Et
Cosmochimica Acta 1984, 48, (10), 2011-2019.
33. Gschwend, P. M.; Wu, S. C., On the Constancy of Sediment Water Partition-
Coefficients of Hydrophobic Organic Pollutants. Environ Sci Technol 1985, 19, (1), 90-
96.
34. Voice, T. C.; Rice, C. P.; Weber, W. J., Effect of Solids Concentration on the
Sorptive Partitioning of Hydrophobic Pollutants in Aquatic Systems. Environ Sci Technol
1983, 17, (9), 513-518.
35. Voice, T. C.; Weber, W. J., Sorbent Concentration Effects in Liquid Solid
Partitioning. Environ Sci Technol 1985, 19, (9), 789-796.
36. Higgo, J. J. W.; Rees, L. V. C., Adsorption of Actinides by Marine-Sediments
- Effect of the Sediment Seawater Ratio on the Measured Distribution Ratio. Environ Sci
Technol 1986, 20, (5), 483-490.
61
37. Chang, C. C. Y.; Davis, J. A.; Kuwabara, J. S., A Study of Metal-Ion
Adsorption at Low Suspended-Solid Concentrations. Estuar Coast Shelf S 1987, 24, (3),
419-424.
38. Grover, R.; Hance, R. J., Effect of Ratio of Soil to Water on Adsorption of
Linuron and Atrazine. Soil Sci 1970, 109, (2), 136-&.
39. Santschi, P. H., Factors Controlling the Biogeochemical Cycles of Trace-
Elements in Fresh and Coastal Marine Waters as Revealed by Artificial Radioisotopes.
Limnol Oceanogr 1988, 33, (4), 848-866.
40. Nyffeler, U. P.; Li, Y. H.; Santschi, P. H., A Kinetic Approach to Describe
Trace-Element Distribution between Particles and Solution in Natural Aquatic Systems.
Geochimica Et Cosmochimica Acta 1984, 48, (7), 1513-1522.
41. Avotins, P.; Jenne, E. A., Time Stability of Dissolved Mercury in Water
Samples .2. Chemical Stabilization. J Environ Qual 1975, 4, (4), 515-519.
42. Hiura, H.; Ebbesen, T. W.; Tanigaki, K., Opening and Purification of Carbon
Nanotubes in High Yields. Advanced Materials 1995, 7, (3), 275-276.
43. Smith, B.; Wepasnick, K.; Schrote, K. E.; Cho, H. H.; Ball, W. P.; Fairbrother,
D. H., Influence of Surface Oxides on the Colloidal Stability of Multi-Walled Carbon
Nanotubes: A Structure-Property Relationship. Langmuir 2009, 25, (17), 9767-9776.
44. Smith, B.; Wepasnick, K.; Schrote, K. E.; Bertele, A. H.; Ball, W. P.; O'melia,
C.; Fairbrother, D. H., Colloidal Properties of Aqueous Suspensions of Acid-Treated,
Multi-Walled Carbon Nanotubes. Environ Sci Technol 2009, 43, (3), 819-825.
45. Langley, L. A.; Fairbrother, D. H., Effect of Wet Chemical Treatments on the
Distribution of Surface Oxides on Carbonaceous Materials. Carbon 2007, 45, (1), 47-54.
46. Langley, L. A.; Villanueva, D. E.; Fairbrother, D. H., Quantification of
Surface Oxides on Carbonaceous Materials. Chem Mater 2006, 18, (1), 169-178.
47. Smith, B.; Yang, J.; Bitter, J. L.; Ball, W. P.; Fairbrother, D. H., Influence of
Surface Oxygen on the Interactions of Carbon Nanotubes with Natural Organic Matter.
Environ Sci Technol 2012, 46, (23), 12839-12847.
48. Haynes, W. M., Crc Handbook of Chemistry and Physics (92nd Edition).
CRC Press: 2011.
49. Salam, M. A.; Al-Zhrani, G.; Kosa, S. A., Simultaneous Removal of
Copper(Ii), Lead(Ii), Zinc(Ii) and Cadmium(Ii) from Aqueous Solutions by Multi-Walled
Carbon Nanotubes. Cr Chim 2012, 15, (5), 398-408.
50. Ramana, D. K. V.; Yu, J. S.; Seshaiah, K., Silver Nanoparticles Deposited
Multiwalled Carbon Nanotubes for Removal of Cu(Ii) and Cd(Ii) from Water: Surface,
Kinetic, Equilibrium, and Thermal Adsorption Properties. Chem Eng J 2013, 223, 806-
815.
51. Bohdziewicz, J.; Kaminska, G., Kinetics and Equilibrium of the Sorption of
Bisphenol a by Carbon Nanotubes from Wastewater. Water Science and Technology
2013, 68, (6), 1306-1314.
52. Di Toro, D. M., A Particle Interaction Model of Reversible Organic Chemical
Sorption. Chemosphere 1985, 14, (10), 1503 - 1538.
53. Di Toro, D. M.; Horzempa, L. M., Reversible and Resistant Components of
Pcb Adsorption-Desorption. Environmental Science and Technology 1982, 16, (9), 594 -
602.

62
Chapter 3. Transport of Oxidized Multi-Walled Carbon
Nanotubes through Silica Based Porous Media: Influences of
Aquatic Chemistry, Surface Chemistry and Natural Organic
Matter1
ABSTRACT
This chapter provides results from studies of the transport of oxidized multi-walled
carbon nanotubes (O-MWCNTs) of varying surface oxygen concentrations under a range
of aquatic conditions and through uniform silica glass bead media. In the presence of
Na+, the required ionic strength (IS) for maximum particle attachment efficiency (i.e., the
critical deposition concentration, or CDC) increased as the O-MWCNT’s surface oxygen
concentration or pH increased, following qualitative tenets of theories based on
electrostatic interaction. In the presence of Ca2+
, CDC values were lower than those with
Na+ present, but were no longer sensitive to surface oxygen content, suggesting that Ca
2+
impacts the interactions between O-MWCNTs and glass beads by mechanisms other than
electrostatic alone. The presence of Suwannee River natural organic matter (SRNOM)
decreased the attachment efficiency of O-MWCNTs in the presence of either Na+ or Ca
2+,
1 This chapter has been published as Yang, J.; Bitter, J. L.; Smith, B. A.; Fairbrother, D. H.; Ball,
W. P., Transport of Oxidized Multi-Walled Carbon Nanotubes through Silica Based Porous Media:
Influences of Aquatic Chemistry, Surface Chemistry, and Natural Organic Matter. Environ Sci Technol
2013, 47, (24), 14034-14043. Julie L. Bitter and Billy A. Smith helped with the collection of preliminary
data; D. Howard Fairbrother and William P. Ball helped with the data interpretation and editing.
63
but with more pronounced effects when Na+ was present. Nevertheless, low
concentrations of SRNOM (< 4 mg/L of dissolved organic carbon) were sufficient to
mobilize all O-MWCNTs studied at CaCl2 concentrations as high as10 mM. Overall, this
study reveals that NOM content, pH and cation type have more importance than surface
chemistry in affecting O-MWCNTs deposition during transport through silica-based
porous media.
3.1 Introduction
Carbon nanotubes (CNTs), with their unique structure and properties,1-5
have a
widespread range of current and potential applications6 and their production rates have
steadily increased over the past decade.7 Multi-walled CNTs (MWCNTs) cost less to
produce and are sold in much greater quantities than single-walled CNTs (SWCNTs),7
with correspondingly higher potential for environmental release. Although pathways for
release have not yet been well established,8-10
it is reasonable to assume that aqueous
contamination may occur as the result of direct emissions to air or water through spills or
misuse and also perhaps following long-term degradation of the commercial materials
into which CNTs are embedded.8-10
MWCNT surfaces are often oxidized during
production to increase their stability in polar solvents such as water or polar solvents used
with some polymeric resins,11-16
or to improve their properties for use as drug delivery
agents.17
Surface oxides can also be introduced onto MWCNTs inadvertently during
purification with acids or through exposure to UV radiation, reactive radicals, and/or
ozone.18-20
The existence of such oxides on MWCNT surfaces have been shown to
dramatically influence environmentally relevant properties, such as homo-aggregation
and sorption, in aquatic environments.21-23
64
To better understand MWCNT transport in groundwater or engineered processes
of filtration it is useful to consider well-studied physical and chemical principles of
colloid transport through porous media.24-46
Chemical interactions between suspended
particles and environmental collectors include London-van der Waals forces, electrostatic
interactions, hydration forces, and steric interactions24-36, 38-41
as well as some specific
short-range interactions, such as the so-called “bridging” effects of Ca2+
with carboxylic
groups.42-46
All of these interactions are intimately dependent on surface and solution
chemistry and have been extensively studied in prior work.44-50
In prior studies of particle
retention in porous media, researchers have found it useful to separately consider the case
of “clean bed filtration” in which particle interactions with the solid media (“collectors”)
are studied under conditions where (1) the volume of particles (colloids) removed is low
enough that collector surfaces have been negligibly covered, and (2) substantial amounts
of straining are avoided. Here, we follow numerous others by defining straining as the
“trapping of colloids in pore throats that are too small to allow their passage”.51
The
avoidance of substantial amounts of straining helps to ensure depth filtration and is
important for experimental studies where the goal is to isolate and understand the relative
roles of single collector contact efficiency η0 and attachment efficiency, α, as separate
components of a first-order deposition rate coefficient, kd that has been traditionally
formulated in terms of the product αη0 and other coefficients that are constant for a given
pore water velocity and porous media type.24, 25, 38
In such a formulation, η0 represents the
fraction of approaching particles that can theoretically result in collision (due to
interception, sedimentation and diffusion) and α represents the number of actual colloid-
collector attachments that occur for a given number of collision opportunities).

65
Given the unique structure of MWCNTs, especially their small diameters, high
aspect ratios, and varied surface chemistry, it is difficult to estimate η0 from theory or to
extrapolate its value from previous studies with other materials. Within this context, and
to the best of our knowledge, no prior studies have specifically addressed the issue of
surface oxygen and water chemistry impacts on deposition rate coefficients and
attachment efficiencies during O-MWCNT transport through clean beds. In the study
reported herein we focus on this issue through the estimation of attachment efficiencies
between the glass surfaces of spherical filter “collectors” and the surfaces of individual
O-MWCNTs of varying surface composition. Estimation on attachment efficiency is
made possible through well-controlled conditions of transport under conditions that were
designed to ensure so-called “clean bed filtration,” where first-order irreversible removal
rates apply for the majority of the observed fractional removal, as independently verified
through spatial retention profiles and model simulation.
Although several prior studies have investigated CNT transport through porous
media, most studies to date have been conducted with natural soil or quartz sand systems
and none have quantified attachment efficiency as a function of both surface and solution
chemistry. Moreover, given that size heterogeneity and surface roughness of the porous
media tend to enhance straining,51
it is not surprising that most prior work has been
influenced by straining effects. For example, in their studies of the transport of oxidized
SWCNTs through quartz sand as a function of ionic strength (IS), Jaisi et al.52, 53
found
that O-SWCNT transport followed predictions of conventional deposition theory under
most conditions for quartz sand52
but that straining was the primary means of O-SWCNT
deposition with soils under all conditions53
. In their study of functionalized MWCNT

66
tube-length effects on transport through quartz sand, Wang et al. 54
also reported that that
straining played an important role – these investigators observed spatial retention profiles
that deviated substantially from expectations based on simple first-order removal and
attachment efficiencies could not be estimated. Other researchers have investigated the
impact of CNT tube diameter55
and flow velocity56
on transport through quartz sand (and
glass beads for flow velocity test) but these studies also did not focus on quantifying
attachment efficiency.
Prior studies of solution chemistry effects on O-MWCNT surface properties in
water have primarily focused on homo-aggregation (see Chen et al. for a review57
), with
relatively few studies conducted in transport systems. The prior homo-aggregation work
has revealed a major impact of pH and ionic strength that is qualitatively consistent with
DLVO theory21, 58
as well as some important effects of calcium and natural organic
matter (NOM). The effect of surface chemistry on the homo-aggregation of O-MWCNTs
has also been studied.21, 42
For example, Hyung et al.59
reported that for any given mass
of added MWCNT powder, the concentration of well-dispersed MWCNTs in solution
increased systematically with concentration of Suwannee River natural organic matter
(SRNOM). Prior work in our own laboratory42
has revealed that NOM concentrations as
low as 0.5 mg of dissolved organic carbon (DOC) /L can significantly enhance the
stability of O-MWCNT dispersions and that these effects occur even in the presence of
Ca2+
and in a manner largely independent of O-MWCNT surface oxygen concentration.
Although the effect of aquatic chemistry and surface chemistry on CNT homo-
aggregation has been widely reported,25, 41, 42, 47, 48, 60-64
such effects on CNT attachment to
other media during transport have been less well studied. Wang et al.64
passed NOM-

67
stabilized MWCNT and SWCNT dispersions through sand packed columns at varied KCl
and CaCl2 concentrations and observed that substantial mass fractions CNTs passed
through the column at KCl concentrations up to 1 mM and CaCl2 up to 0.1 mM. Jaisi et
al.52
have reported that NOM presence can substantially decrease rates of SWCNT
deposition onto quartz sand in the presence Ca2+
. Yi et al.43
have studied deposition of
MWCNTs with two different surface oxygen concentrations on quartz crystals, but did
not study transport through packed columns.
In the study reported herein, we focused on quantifying the impacts of surface and
solution chemistry on O-MWCNT attachment efficiency with amorphous silica surfaces
during transport through porous media. It is noteworthy that our own focus was on
relative alpha values as a reflection of the effects of aquatic chemistry and O-MWCNT
surface chemistry, for a consistently reproducible media surface. In order to accurately
measure attachment efficiencies in the absence of substantial straining effects, we used a
well-defined system of uniformly sized spherical collectors and, to ensure “clean-bed”
filtration conditions, we used very small input masses of CNTs. To enhance experimental
reproducibility, we used rigorous and standardized methods of media cleaning. Studies
were conducted on O-MWCNTs with five different oxygen contents in varied solution
chemistry. Solution chemistry variables included ionic strength, pH, type of cations in
the feed solution (sodium or calcium), and concentration of SRNOM.
3.2 Experimental Methods
3.2.1 Surface Oxidation of MWCNTs
Non-functionalized MWCNTs with diameters of 15 ± 5 nm and lengths of 1 - 5
µm were purchased from NanoLabs, Inc., who report 95% carbon purity with < 5% metal
68
content according to thermo-gravimetric analysis. (Such non-modified MWCNTs have
sometimes been referred to as “pristine” MWCNTs in prior literature.) Oxidized
MWCNTs (O-MWCNTs) were then prepared by refluxing the purchased materials in
various acids using methods that have been described in detail elsewhere.21
In our
research, the conditions used were refluxing in HNO3-water solutions at three different
w/w concentrations (15%, 18%, and 53%) at 140 ºC for 1.5 h and refluxing in a 3:1
mixture of concentrated sulfuric and nitric acids at 70 ºC for 8 h.21
We were thus able to
create four O-MWCNT materials with different concentrations of oxygen-containing
functional groups grafted onto the MWCNT surface. The resulting O-MWCNTs were
subjected to an additional base purification process described elsewhere65
to help remove
amorphous carbon on the surface of the O-MWCNTs.
3.2.2 Characterization of O-MWCNTs
The length distribution of O-MWCNTs created by the methods described above
has been characterized and reported in prior publications from our laboratory.21, 66
Results
showed that the length distribution of O-MWCNTs were independent of the O-
MWCNTs’ surface oxygen concentration.21, 66
The total oxygen concentrations and
distributions of oxygen functional groups present on the surfaces of the specific O-
MWCNTs used in this work were determined using X-ray photoelectron spectroscopy
(XPS) (PHI 5400 system) in conjunction with chemical derivatization methods for
quantification of functional group concentrations.67, 68
Table 3.1 shows the total atomic
oxygen concentrations of the studied O-MWCNTs (reported as % of XPS-accessed
surface atoms). For the majority of the O-MWCNTs used, the percentages of surface
oxygen atoms associated with different functional groups are also shown, as calculated

69
by the method of Wepasnick et al.69
The total surface oxygen measured for O-MWCNTs
treated with 15% HNO3, 18% HNO3, and 53% HNO3 were 3.1%, 5.1%, and 7.1%,
respectively; O-MWCNTs treated using a 3:1 mixture of concentrated H2SO4 and HNO3
had the highest concentration at 11.5%. For the materials oxidized at JHU, concentrations
of the carboxylate functional group (COO-) also increased monotonically with % oxygen
(Table 3.1). In addition to O-MWCNTs prepared at JHU, we also studied MWCNTs that
had been oxidized (using 3:1 H2SO4 and HNO3) by the commercial supplier (NanoLabs,
Inc.). The purchased O-MWCNTs were also washed before use, using the previously
described cleaning procedure to help reduce amorphous carbon.65
The purchased O-
MWCNTs exhibit total surface atomic concentration of 8.3%.
Table 3.1. Surface oxygen concentrations and oxide distribution of O-MWCNTs
Treatment
method OT% OCOOH% OC=O% OOH% Oothers%
10% HNO3 3.0 1.5 0.6 0.8 0.1
18% HNO3 5.1 2.0 2.9 0.6 -0.5
53% HNO3 7.1 2.8 1.1 0.7 2.6
3:1 concentrated
H2SO4/HNO3 11.5 3.3 1.3 1.5 5.4
Purchased from
Nanolab a 8.3 3.8 1.2 0.6 2.7
a O-MWCNTs purchased from Nanolab were thoroughly cleaned using the same acid-
base cleaning procedure previously developed and used in our laboratory. See Smith et
al. for details.42
3.2.3 Preparation of O-MWCNT Dispersion
Suspensions of well-dispersed O-MWCNTs were prepared by adding a small
amount of MWCNTs (~ 4 mg) to 200 mL of de-ionized (DI) water and sonicating at low
energy (70 W, Branson 1510) for 20 hours. For MWCNTs that had low surface oxygen
concentrations (i.e., ≤ 5.1%), it was necessary to increase the pH to above 9 to maintain a
stable stock suspension. After sonication, the suspension was centrifuged at 1000 rpm for
5 minutes to remove any bundled O-MWCNTs that were not taken up into suspension.

70
The centrifugation also removed glass particles etched from the wall of the flask during
sonication. The centrifuged suspension was then transferred to a clean glass bottle and
sonicated for another 5 min to further disperse any bundled O-MWCNTs that may have
remained after the prior steps.
The hydrodynamic diameters of the O-MWCNTs in our prepared stock solutions
(as measured by Dynamic Light Scattering, DLS) were roughly 140 nm, which is
quantitatively similar to the 150 ± 40 nm values observed by Smith et al.21
who studied
similarly prepared samples using both DLS and TEM and AFM analysis. These authors
conducted their TEM analyses on samples that were carefully prepared by placing a drop
of their dilute dispersed MWCNT water suspension on a holey-carbon TEM grid.
Results were taken as evidence for the existence of individually dispersed nanoparticles
in solution.21
Prior to use in transport experiments, these well-dispersed stock
suspensions were further diluted with DI water to a concentration of ~2.0 mg/L and
adjusted to the designated pH of the transport experiment using either NaOH (for pH 10)
or HCl (for pH 4). The final O-MWCNT concentration in a given suspension was
determined by measuring its UV-Vis absorbance at 270 nm. Control studies showed good
linear relationships (R2 > 0.998) between absorbance at 270 nm and mass concentrations
for the O-MWCNTs used this study – see Table 3.2. Our previous studies have shown
that this approach creates a suite of O-MWCNTs which exhibit similar physical
properties (e.g., lengths, effective hydrodynamic diameters in solution) but different
surface chemistry.42, 70, 71

71
Table 3.2. Linear regression parameters (extinction coefficients and R2 values) of
calibration curves for O-MWCNT dispersions using UV-Vis spectroscopy at 270 nm and
800 nm.
Total oxygen
concentration of O-
MWCNT, %
λa = 270 nm λ = 800 nm
εb
Lmol-1cm
-1
R2
εb
Lmol-1cm
-1
R2
3.0 0.065 0.998 N/A N/A
5.1 0.116 0.999 0.034 0.998
7.1 0.072 0.998 0.021 0.999
8.3 0.098 0.999 0.031 0.998
11.5 0.074 0.999 N/A N/A
a. λ is the wavelength used in detecting MWCNT dispersion absorbance with UV-Vis.
b. ε is the extinction coefficient of MWCNT at corresponding wavelengths based on
Beer’s law.
3.2.4 Preparation of Suwannee River Natural Organic Matter (SRNOM)
SRNOM was purchased from the International Humic Substances Society. After
dissolution into DI water the SRNOM was passed through a 0.22 μm polyethersulfone
filter (EMD Millipore Corporation). The filtered stock solution was analyzed for total
organic carbon content (Dohrmann 8000). This stock solution was subsequently diluted
for calibration of DOC against UV absorbance at 254 nm and for preparation of various
column feed solutions containing SRNOM concentrations between 0 and 4.1 mg DOC/L.
3.2.5 Preparation of Glass Beads
Soda lime glass spheres (0.355 - 0.425 mm, MO-SCI Corporation) were used as
model collectors in transport experiments. Preliminary work showed that it was not
possible to obtain consistent and accurate results unless the glass beads were pre-treated
by a standardized process that involved multiple well-defined sonication steps, including
not only the initial treatment (prior to drying for later use) but also again under more
rigorous conditions immediately prior to use.
72
The initial preparation of glass beads involved sonication in mild base (0.1 M
NaOH) for 20 minutes (for removal of anionic organic polymers), decantation, sonication
in acid (1 M HNO3) for 20 minutes (for removal of acid-soluble metal oxides),
decantation, and final rinse with DI water until the resistance of the supernatant was
higher than 0.5 MΩ. Beads were then dried at 70 ºC and stored under dry conditions until
use.72
This initial preparation of glass beads is referred to as “initial cleaning procedure”
hereafter. For the studies presented in this manuscript, all columns were prepared using a
wet-pack approach for which the beads were also subjected to a second cleaning step
immediately prior to packing. To prepare a column, fixed and precisely measured
quantities of initially cleaned beads (39.5 g for short columns (5.2 cm) and 79.5 g for
long columns (10.2 cm)) were weighed out and again sonicated in the base and acid
solutions described above for 20 minutes each, followed by sonication in DI water in 5
minute cycles no less than 12 times. After treatment the beads were kept saturated at all
times before and during the column packing process.
This second cleaning step and a wet-pack approach were found to be necessary to
achieve reproducible results in O-MWCNT transport experiments. Preliminary work
showed that if these additional preparation steps were not taken, the observed results
were many times less precise than the experiments reported in our paper. Such
imprecision was evident as pronounced variability in either (1) plateau heights for
experiments with “step-change” in CNT input concentrations (i.e., those using a heavy-
side function for input concentration); or (2) mass recoveries for experiments with pulse
inputs of O-MWCNTs (i.e., those using a dirac function for input concentration). We
speculatively attribute such variability to the presence of varying amounts of fine

73
particulate material (silica and minor metal oxide particulates) and/or fine bubbles of air
on the glass bead surfaces. This speculation has been at least qualitatively confirmed by
Energy Dispersive X-ray (EDX) analysis of particles observed in the wash (rinse) water
following sonication of the pre-treated glass beads. These analyses were conducted by
Dr. Ken Livi (Director of the High-Resolution Analytical Electron Microbeam Facility of
the Integrated Imaging Center at Johns Hopkins University) using a Philips CM 300 field
emission gun TEM operating at 297 kV. Images were collected using a CCD camera
mounted on a GIF 200 electron energy loss spectrometer. Samples chosen for imaging
included both the uncentrifuged wash water and, for purposes of evaluating the potential
influence of vacuum-induced precipitates, supernatant of the same water following
centrifugation. (No evidence for such a confounding influence was observed.)
Figure 3.1 is an example image from the TEM analysis, showing some selected
particles for EDX evaluation. Particles chosen for evaluation were based on visual clues
of common morphology, with focus on those samples that dominated the fields of view.
The image shown in Figure 3.1 and other TEM images revealed that materials separated
from the glass beads surface during the sonication process consisted primarily of silicon
dioxide with variable amounts of Ca, Mg, and Na, together with lower quantities of other
materials, primarily comprising magnesium silicates, and iron and lead oxides. With the
exception of the lead, these materials were all expected based on the composition of the
soda-lime glass beads that had been reported by the supplier (MO-SCI Corporation):
65~75% SiO2, 0~5% Al2O3, 6~15% CaO, 1~5% MgO, 10~20% Na2O and < 0.8%
Fe2O3.) It is unclear whether the non-silica particles originated from either (a) dissolution

74
of surface impurities followed by re-precipitation upon drying or (b) dislodgement or
“breaking off” of small attached particles from the “as-received” glass beads. It is also
unclear as whether the quantities of such impurities on the glass surfaces were fully
eliminated by cleaning or whether they were merely “standardized” by the process. As
noted in the primary manuscript, however, this cleaning treatment is known to have
Figure 3.1. TEM image of unprocessed wash water from sonication of glass beads in
DI water for one hour. EDX 01 is silica glass (similar to the expected glass bead
composition). EDX 02 and 03 are poorly crystalline or amorphous magnesium
silicate sheets, and EDX 04 is crystalline iron oxide. Particles similar to EDX 01
represented the majority of the material observed in the TEM images.
75
contributed substantially to improvements in experimental reproducibility and, as also
noted in the manuscript, achieving such reproducibility was our primary aim. In
particular, we sought to create a reproducible media surface such that the relative alpha
values among the various experimental runs could be safely interpreted as a reflection of
only the effects of aquatic chemistry and O-MWCNT surface chemistry.
3.2.6 Preliminary Study of Cleaning Effects on Reproducibility
The selection of the final bead cleaning approach described above was based on
comparative results of transport experiments conducted with 7.1% O-MWCNTs and
using six different cleaning procedures for the glass beads. The six different cleaning
procedures are described in the caption to Figure 3.2. For all six methods, the glass
beads had been subjected previously to the initial cleaning and drying procedure
described in the prior section prior to the final cleaning and wet packing of beds. Table
3.3 and Figure 3.2 show the attachment efficiencies obtained from these experiments,
which were conducted under identical aquatic conditions and flow velocities. The results
show that both base/acid wash and subsequent water wash were imperative to obtain
reproducible results, and that a more diluted NaOH solution was not able to clean the
beads as effectively as the more concentrated solution. As shown in Figure 3.2 and
Table 3.3, results obtained using procedure 1, where no further treatment of glass beads
had been performed after initial cleaning, were comparatively irreproducible. In
particular, the results obtained under these less rigorous cleaning conditions suggested an
average α value of approximately 0.36 which was relatively high in comparison to that
finally obtained with more reproducible methods (α = 0.15) and with a comparatively
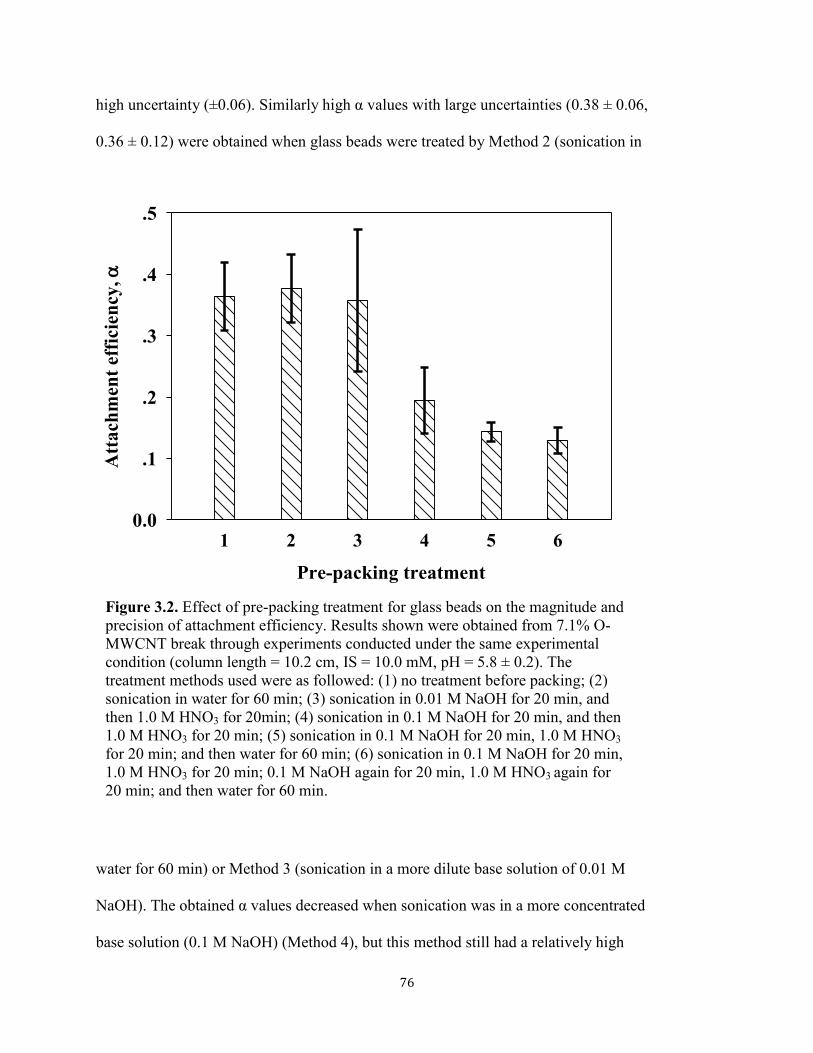
76
high uncertainty (±0.06). Similarly high α values with large uncertainties (0.38 ± 0.06,
0.36 ± 0.12) were obtained when glass beads were treated by Method 2 (sonication in
water for 60 min) or Method 3 (sonication in a more dilute base solution of 0.01 M
NaOH). The obtained α values decreased when sonication was in a more concentrated
base solution (0.1 M NaOH) (Method 4), but this method still had a relatively high
Figure 3.2. Effect of pre-packing treatment for glass beads on the magnitude and
precision of attachment efficiency. Results shown were obtained from 7.1% O-
MWCNT break through experiments conducted under the same experimental
condition (column length = 10.2 cm, IS = 10.0 mM, pH = 5.8 ± 0.2). The
treatment methods used were as followed: (1) no treatment before packing; (2)
sonication in water for 60 min; (3) sonication in 0.01 M NaOH for 20 min, and
then 1.0 M HNO3 for 20min; (4) sonication in 0.1 M NaOH for 20 min, and then
1.0 M HNO3 for 20 min; (5) sonication in 0.1 M NaOH for 20 min, 1.0 M HNO3
for 20 min; and then water for 60 min; (6) sonication in 0.1 M NaOH for 20 min,
1.0 M HNO3 for 20 min; 0.1 M NaOH again for 20 min, 1.0 M HNO3 again for
20 min; and then water for 60 min.
Pre-packing treatment
1 2 3 4 5 6
Att
ach
men
t ef
ficie
ncy
,
0.0
.1
.2
.3
.4
.5
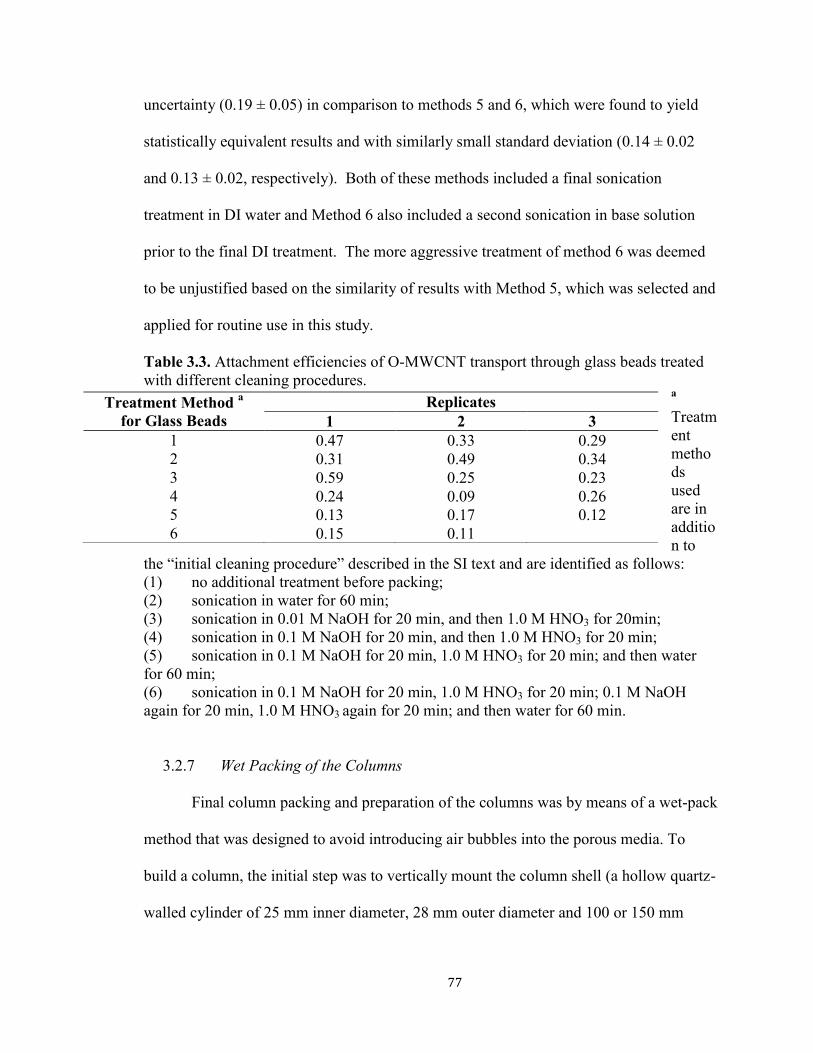
77
uncertainty (0.19 ± 0.05) in comparison to methods 5 and 6, which were found to yield
statistically equivalent results and with similarly small standard deviation (0.14 ± 0.02
and 0.13 ± 0.02, respectively). Both of these methods included a final sonication
treatment in DI water and Method 6 also included a second sonication in base solution
prior to the final DI treatment. The more aggressive treatment of method 6 was deemed
to be unjustified based on the similarity of results with Method 5, which was selected and
applied for routine use in this study.
Table 3.3. Attachment efficiencies of O-MWCNT transport through glass beads treated
with different cleaning procedures. a
Treatm
ent
metho
ds
used
are in
additio
n to
the “initial cleaning procedure” described in the SI text and are identified as follows:
(1) no additional treatment before packing;
(2) sonication in water for 60 min;
(3) sonication in 0.01 M NaOH for 20 min, and then 1.0 M HNO3 for 20min;
(4) sonication in 0.1 M NaOH for 20 min, and then 1.0 M HNO3 for 20 min;
(5) sonication in 0.1 M NaOH for 20 min, 1.0 M HNO3 for 20 min; and then water
for 60 min;
(6) sonication in 0.1 M NaOH for 20 min, 1.0 M HNO3 for 20 min; 0.1 M NaOH
again for 20 min, 1.0 M HNO3 again for 20 min; and then water for 60 min.
3.2.7 Wet Packing of the Columns
Final column packing and preparation of the columns was by means of a wet-pack
method that was designed to avoid introducing air bubbles into the porous media. To
build a column, the initial step was to vertically mount the column shell (a hollow quartz-
walled cylinder of 25 mm inner diameter, 28 mm outer diameter and 100 or 150 mm
Treatment Method a
for Glass Beads
Replicates
1 2 3
1 0.47 0.33 0.29
2 0.31 0.49 0.34
3 0.59 0.25 0.23
4 0.24 0.09 0.26
5 0.13 0.17 0.12
6 0.15 0.11

78
length), onto a stand. A silicone stopper (into which a length of silicone tubing had been
previously inserted through its center) was then attached to the bottom of cylinder. The
silicone tubing was clamped shut below the stopper, and the column was then filled with
DI water. After expelling all of the air bubbles from the tubing and the exposed upper
edge of the stopper by draining and pipetting, a water-saturated stainless steel mesh
screen was dropped onto the stopper to ensure that all of the beads remained within the
column. The previously hydrated and sonicated glass beads were then slowly added into
the cylinder through the open top, making sure that the water level was always higher
than the level of glass beads. During the filling process, the column was frequently
tapped to ensure tight packing of the glass beads. Once the column had been filled with
beads it was sealed at the top with another stainless steel screen and another silicone
stopper with pre-inserted silicone tubing. A steel template/scaffold was used to ensure
Figure 3.3. The schematic (a) and picture (b) of the packed-bed columns used in this
study.
(b) (a)
Quartz
column (ID =
2.5 cm, L =
5.2 or 10.2
cm) packed
with soda-
lime glass
beads (0.355 –
0.425 mm)
Stainless steel
scaffold used to
keep column at
constant length
Silicone
stopper with
silicone
tubing
Flow
direction
Stainless steel
screen (pore size
= 0.3 mm)
Silicone tubing

79
that the length of the column remained exactly the same among all of the short or long
columns used, with the lengths set to ensure that the porosity of the column was constant
at 0.38, as calculated from the known volume of beads and inner diameter of the column.
The pore volume of the packed columns was thus maintained at 9.73 cm3 for short (5.2
cm) columns and 18.67 cm3 for long (10.2 cm) columns. A schematic of the columns is
provided as Figure 3.3.
3.2.8 Transport Experiments
A dual-pump system was used for transport experiments (Figure 3.4). Two feed
solutions, one containing DI water (“DI line”) and the other containing a sodium chloride
or calcium chloride background electrolyte solution (“electrolyte line”) were used. For
most experiments these solutions were equilibrated with the ambient atmosphere without
further pH adjustment (pH = 5.8 ± 0.2), although some solutions were adjusted with
Figure 3.4. Dual-pump column filtration system with in-line mixer, column, and UV-
Vis detection source for pulse-input method.
Cout
Cin
Feed Solution
(NaCl, CaCl2, and/or
NOM at pH 4 – 10)
Peristaltic
pump A
3.5 ml/min
DI water
or DI water + NOM
(pH 4 – 10)
Peristaltic
pump B
3.5 ml/min
Polypropylene
syringe
MWCNTs dispersion
(0.6 mL at pH 4 – 10 with
background NOM conc.)
Mixer
Injection
loop
Flow through UV-Vis
Detector (5 cm path length)
pH
measurement
Waste
80
addition of 1.0 M HCl or 1.0 M NaOH to represent acidic (pH = 4.0 ± 0.2) or basic (pH =
10.0 ± 0.2) conditions, respectively. Buffers were avoided to eliminate their possible
effects on O-MWCNT attachment efficiency. DI and electrolyte solutions were pumped
at constant flow rate (each at 3.5 mL/min) by two peristaltic pumps operating in parallel.
Immediately prior to the column inlet, these lines were combined in a custom-built
Teflon® in-line mixing chamber of <1 mL internal volume that contains a tiny Teflon
coated stir bar. Before each experiment, the column was conditioned first with DI water
and then with background electrolyte, each for > 20 pore volumes. For experiments
involving NOM both DI and electrolyte lines included a predetermined concentration of
SRNOM.
To introduce O-MWCNTs into the feed solution we used a pulse-input approach.
Relative to a step feed, pulse-inputs use a much smaller total mass of O-MWCNT
particles so that conditions of clean bed filtration can be more easily maintained. During
the pulse-input experiment a 0.6 mL pulse of O-MWCNT dispersion at a concentration of
~2.0 mg/L was injected into the DI line through an injection loop (Figure 3.4). The
injection loop approach eliminates unwanted pressure spikes that can sometimes occur
with syringe injections. O-MWCNT dispersions at the appropriate pH and NOM
concentrations were then added into the DI line (as opposed to the electrolyte line) to
minimize any aggregation or deposition prior to entering the column. Mixing of the DI
and electrolyte lines occurred immediately prior to solution upflow through the column.
For selected columns, separate runs were conducted using pulses of sodium nitrate for an
independent measurement of a column’s residence time distribution and hydraulic
dispersivity.

81
To measure O-MWCNT concentrations in the column effluent, UV absorbance
(at λ = 270 nm for O-MWCNTs and 302 nm for NaNO3 tracer) was measured in real time
as the effluent passed through a 5-cm path-length flow-through quartz cell (Starna Cells,
Inc.) as shown in Figure 3.4. The advantage of the long-path-length cuvette (internal
volume 1.2 mL) is that O-MWCNT concentration can be more accurately measured at
lower and more environmentally relevant concentrations (< 0.25 ppb). For experiments
involving SRNOM, effluent concentrations of O-MWCNTs were quantified by
Figure 3.5. UV-Vis spectra of solutions containing 2.0 mg/L O-MWCNTs in water
(red dashed line), 4.2 mg DOC/L NOM (blue dash-dot line) and 2.0 mg/L O-MWCNTs
plus 4.2 mg DOC/L NOM (solid black line). The inset shows the region between 800-
900 nm where NOM does not has absorption. Most results in experiments were
obtained at λ = 270 nm (with subtraction of the background absorption due to NOM).
However, comparisons of results were also made at λ = 800 nm where there is no
interference from NOM.
Wavelength, (nm)
200 400 600 800
Ab
sorb
an
ce
0.0
.2
.4
.6
.8
1.0
Wavelength (nm)
800 820 840 860 880 900A
bso
rba
nce
0.00
.02
.04
.06
.08
.10

82
measuring absorption at 270 nm with subtraction of the constant background absorbance
of NOM at this wavelength. O-MWCNT concentration values in these experiments were
also verified using absorbance at 800 nm, where SRNOM does not absorb (Figure 3.5).
Absorbance at 270 nm was used for subsequent calculation due to the higher sensitivity
of UV response to concentration changes at this wavelength. The pH of the effluent was
also closely monitored (Accumet Engineering Corp.) in all column experiments to ensure
that it remained constant.
Prior to each O-MWCNT transport experiment, two preliminary control runs were
conducted using the same initial mass of injected O-MWCNTs. The first of these control
tests involved a “bypass” run (i.e., at the designated IS but with all flow bypassing the
column; Figure 3.4) in order to independently verify the injected mass. The mass
estimates from these bypass runs were used to represent injected mass in subsequent data
analysis. This mass was also used to calculate the “characteristic” concentration (C0) for
Table 3.4. Deposition rate coefficients and mass balance obtained from columns
conducted at selected background electrolyte concentrations
Background
electrolyte
concentrations,
NaCl (mM)
kd (s-1
)*
Percentage recovery (%)
Method 1
Method 2
DI-pulse
Pulse in the presence
of background
electrolyte
7 0.0013 0.0011 103.4 91.2
20 0.0094 0.0089 102.1 66.2
50 0.013 0.011 103.1 48.7
150 0.023 0.022 101.4 32.6
500 0.023 0.024 105.1 29.0
*kd for a specific transport experiment was obtained by fitting the breakthrough curve
using equation 2 (method 1) or by analyzing the percentage recovery of the breakthrough
curve using equation 3.
normalization of column effluent concentrations. The second control test involved the
removal of all electrolytes from the feed lines in order to confirm that the measured mass

83
recovered during DI water transport was reproducible and similar to that measured by the
accompanying column bypass experiment. Mass recovery relative to by-pass was
excellent (100% ± 5%;Table 3.4), thus confirming that we could reproducibly measure
= 0 under conditions unfavorable to attachment.
3.2.9 Quantitative Analysis of Column Effluent Data
As confirmed through subsequent experiments conducted using step inputs and
evaluation of spatial distributions of O-MWCNTs in our columns as described in
Chapter 5, our transport experiments were characterized by good penetration of O-
MWCNTs through-out the column depth. Although detailed numerical evaluation of the
spatial concentration data is beyond the scope of the present chapter (and the subject of
on-going analysis), our preliminary results are sufficient to show that the majority of
CNT removal can be well-characterized by irreversible first-order removal – see Chapter
5 for details.
With the above as justification and also given good fits of model simulations to
observed O-MWCNT concentration data (further described in Chapter 5), our
quantitative interpretation of transport results was based on an assumption of first-order
irreversible deposition, as appropriate for clean-bed filtration in the absence of straining.
More specifically, we applied the following one dimensional advection-dispersion
equation 73
toward the estimation of kd, a first-order coefficient for irreversible loss of O-
MWCNTs during transport:
Eq. 3.1
),(),(),(),(
2
2
txCkx
txCv
x
txCD
t
txCdP

84
where C(x, t) [M/L3] is aqueous O-MWCNT concentration at position x within the
column [L] and time t [T], D is the hydrodynamic dispersion coefficient [L2/T]; vp is the
pore water velocity in the x direction [L/T], and kd is the deposition rate coefficient [T-1
]
for irreversible first-order loss from the pore water. The solution of Eq. 3.1 for a column
with fixed length is:53
Eq. 3.2
where C0 is a characteristic concentration defined as M0/Vpore, [M/L3], M0 is the mass
recovery from the bypass experiment [M], Vpore is the aqueous pore volume within the
column [L3], τ is the mean hydraulic retention time (τ = Vpore/Q, [T], where Q is the
volumetric flow rate of the feed solution [L3/T]), and L is the column length [L]. For a
pulse-input method kd can be calculated from the fraction of O-MWCNTs that are
recovered, as follows:
Eq. 3.3
The deposition rate coefficient, kd, reaches a constant maximum value, kd, fast, at
high IS. We estimate this value from experiments conducted at the highest IS. The
attachment efficiency α for all other runs can then be calculated using Eq. 3.4:
Eq. 3.4
Note that the value used for τ does not affect the result so long as it is constant
during the experiments where kd, fast and kd are determined.
Dt
tvLtk
Dt
LCtC
P
d4
)(exp)exp(
2
)(
2
30
00
)(ln1
dttCM
Qk
d
a =kd
kd, fast
=ah0
h0

85
As an alternate approach, kd can also be obtained by fitting Eq. 3.2 to the effluent
concentration data using independent estimates of L, vp and D from prior analysis of
tracer data. The mass recovery method of Eq. 3.3 was used for the subsequently reported
results; however, we applied both methods of determining kd to five columns that
represented a wide range of kd values (Table 3.4). In all cases, the fits of the model to the
data were generally good (data not shown) and, more importantly, the fitted results were
approximately equivalent to those obtained on the basis of mass recovery (Table 3.4).
A plot of attachment efficiency () versus electrolyte concentration on a log-log
scale creates an “attachment efficiency curve” and the concentration at which
approaches 1.0 is commonly referred to as the critical deposition concentration (CDC).
A quantitative estimate of an approximate CDC can be made by applying the following
empirical equation:
Eq. 3.5
where Celctrolyte is the concentration of the background electrolyte (Na+ or Ca
2+) [mg/L]
and b is a fitted coefficient equal to the slope of the log-log curve in the reaction limited
regime, where Celctrolyte << CDC.
3.3 Results and Discussion
3.3.1 Importance of Appropriately Preparing Porous Media
As previously described, preliminary studies revealed that extensive and
standardized methods of glass bead cleaning and packing were required to obtain
reproducible column transport data. We hypothesize that this was because the ultrasonic
cleaning approach removed small air bubbles and other colloids from the glass bead
a =1
1+ (CDC
Celectrolyte)b
86
surfaces, significantly improving the homogeneity of the surface. The presence of
colloidal silica in the bead cleaning solution was confirmed using Energy Dispersive X-
Ray (EDX) on particle types that were most commonly observed in the wash solution, as
determined by visual observation of Transmission Electron Microscopy (TEM) images
(Figure 3.1).
3.3.2 O-MWCNT Transport in the Absence of Deposition
The O-MWCNT transport experiments in DI water exhibited similar shape and
average residence time as the NaNO3 tracer (see Figure 3.6). On the basis of the 100%
recovery of O-MWCNTs in DI water and identical values of τ to those determined from
tracer studies, we conclude that straining is negligible under the transport conditions
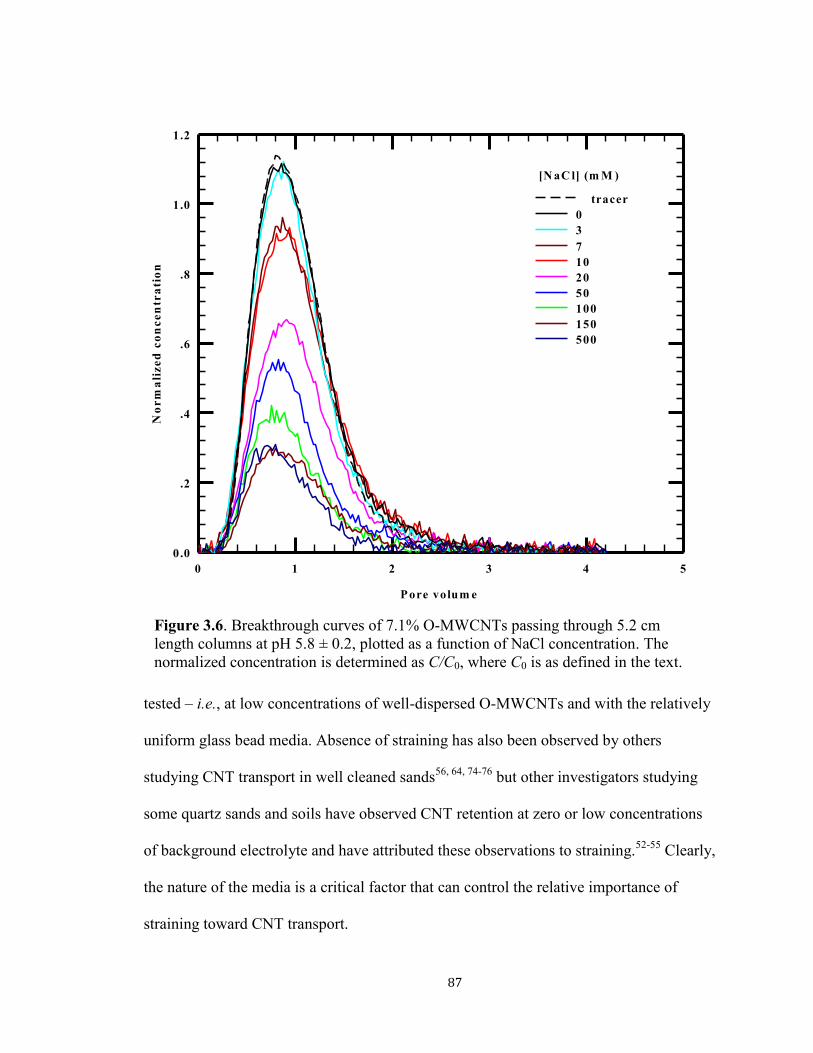
87
tested – i.e., at low concentrations of well-dispersed O-MWCNTs and with the relatively
uniform glass bead media. Absence of straining has also been observed by others
studying CNT transport in well cleaned sands56, 64, 74-76
but other investigators studying
some quartz sands and soils have observed CNT retention at zero or low concentrations
of background electrolyte and have attributed these observations to straining.52-55
Clearly,
the nature of the media is a critical factor that can control the relative importance of
straining toward CNT transport.
Figure 3.6. Breakthrough curves of 7.1% O-MWCNTs passing through 5.2 cm
length columns at pH 5.8 ± 0.2, plotted as a function of NaCl concentration. The
normalized concentration is determined as C/C0, where C0 is as defined in the text.
Pore volum e
0 1 2 3 4 5
No
rm
ali
ze
d c
on
ce
ntr
ati
on
0 .0
.2
.4
.6
.8
1.0
1.2
[N aC l] (m M )
100
50
10
20
7
3
0
tracer
150
500
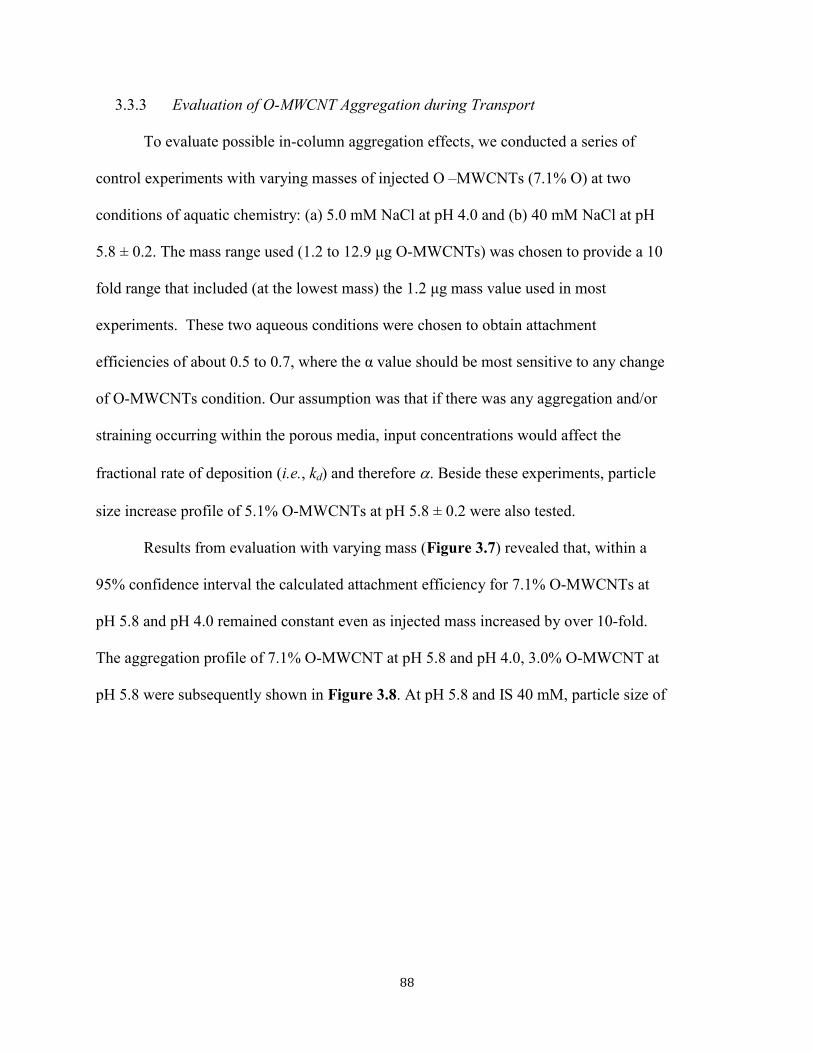
88
3.3.3 Evaluation of O-MWCNT Aggregation during Transport
To evaluate possible in-column aggregation effects, we conducted a series of
control experiments with varying masses of injected O –MWCNTs (7.1% O) at two
conditions of aquatic chemistry: (a) 5.0 mM NaCl at pH 4.0 and (b) 40 mM NaCl at pH
5.8 ± 0.2. The mass range used (1.2 to 12.9 μg O-MWCNTs) was chosen to provide a 10
fold range that included (at the lowest mass) the 1.2 μg mass value used in most
experiments. These two aqueous conditions were chosen to obtain attachment
efficiencies of about 0.5 to 0.7, where the α value should be most sensitive to any change
of O-MWCNTs condition. Our assumption was that if there was any aggregation and/or
straining occurring within the porous media, input concentrations would affect the
fractional rate of deposition (i.e., kd) and therefore . Beside these experiments, particle
size increase profile of 5.1% O-MWCNTs at pH 5.8 ± 0.2 were also tested.
Results from evaluation with varying mass (Figure 3.7) revealed that, within a
95% confidence interval the calculated attachment efficiency for 7.1% O-MWCNTs at
pH 5.8 and pH 4.0 remained constant even as injected mass increased by over 10-fold.
The aggregation profile of 7.1% O-MWCNT at pH 5.8 and pH 4.0, 3.0% O-MWCNT at
pH 5.8 were subsequently shown in Figure 3.8. At pH 5.8 and IS 40 mM, particle size of
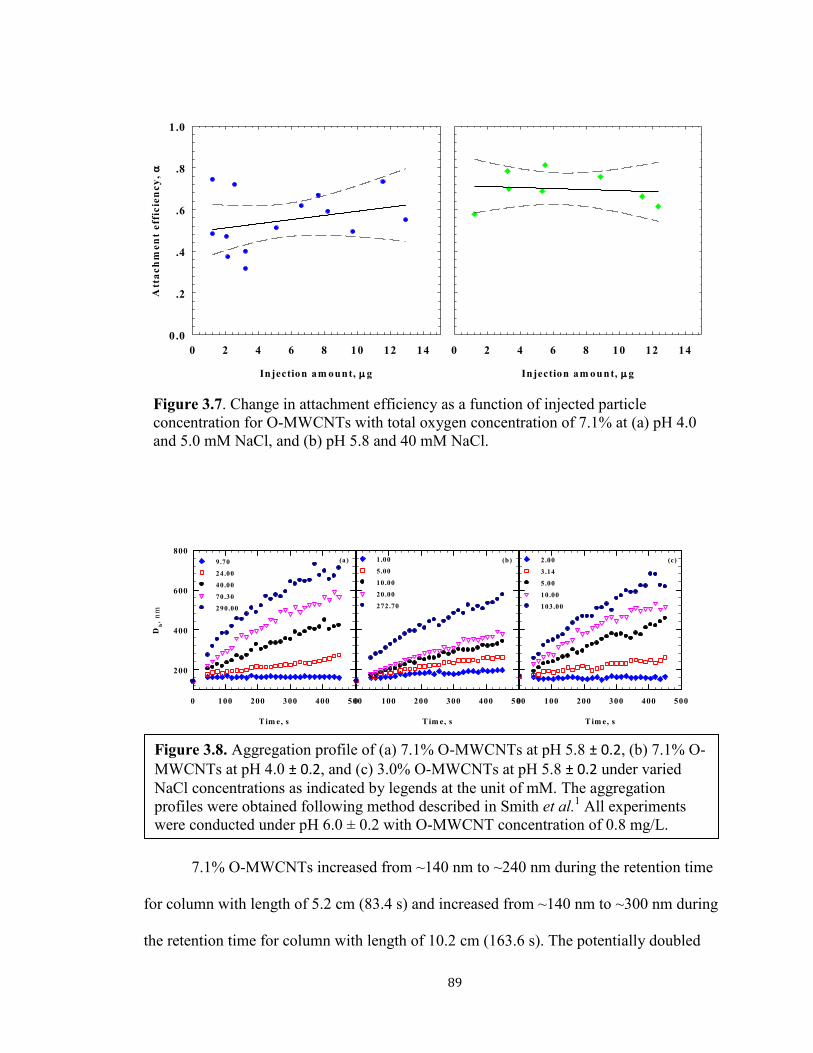
89
7.1% O-MWCNTs increased from ~140 nm to ~240 nm during the retention time
for column with length of 5.2 cm (83.4 s) and increased from ~140 nm to ~300 nm during
the retention time for column with length of 10.2 cm (163.6 s). The potentially doubled
Figure 3.8. Aggregation profile of (a) 7.1% O-MWCNTs at pH 5.8 ± 0.2, (b) 7.1% O-
MWCNTs at pH 4.0 ± 0.2, and (c) 3.0% O-MWCNTs at pH 5.8 ± 0.2 under varied
NaCl concentrations as indicated by legends at the unit of mM. The aggregation
profiles were obtained following method described in Smith et al.1 All experiments
were conducted under pH 6.0 ± 0.2 with O-MWCNT concentration of 0.8 mg/L.
T im e, s
0 100 200 300 400 500
2.00
3.14
5.00
10.00
103.00
T im e, s
0 100 200 300 400 500
Dh,
nm
200
400
600
800
9.70
24.00
40.00
70.30
290.00
T im e, s
0 100 200 300 400 500
1.00
5.00
10.00
20.00
272.70
(a) (b) (c)
Figure 3.7. Change in attachment efficiency as a function of injected particle
concentration for O-MWCNTs with total oxygen concentration of 7.1% at (a) pH 4.0
and 5.0 mM NaCl, and (b) pH 5.8 and 40 mM NaCl.
Injection am ount, g
0 2 4 6 8 10 12 14
Att
ac
hm
en
t e
ffic
ien
cy
,
0.0
.2
.4
.6
.8
1.0
Injection am ount, g
0 2 4 6 8 10 12 14
(
a)
(
b)
90
particle size did not to have a significant effect on their deposition onto the collectors.
Considering the results shown in both Figure 3.7 and Figure 3.8– and although the
results are less precise at pH 4.0 than 5.8 (Figure 3.7) – we conclude that the effects of
homo-aggregation and straining of O-MWCNTs is not substantial under either condition
during the full time periods of transport.
Although the mass injection tests at 0.5< < 0.7 do not confirm the complete
absence of aggregation (and perhaps straining) where values are higher, these results
provide important assurance that aggregation and straining are not confounding the
results in column experiments for 7.1% O-MWCNTs at the tested values and below.
This is significant because results under these conditions might be viewed as the principle
evidence for subsequent conclusions about the impacts of pH, ionic strength, calcium and
NOM. Moreover, these results, in combination with our independently conducted homo-
aggregation studies (Figure 3.8), also serve as evidence against significant effect of
aggregation and straining for other experiments at similar and lower -value. This is
certainly true for cases with O-MWCTs of higher surface oxygen content, since more
highly oxidized O-MWCNTs are more stable against aggregation.
3.3.4 Effect of IS
The effects of IS on O-MWCNT transport are consistent with tenets of Derjaguin-
Landau-Verwey-Overbeek (DLVO) theory and prior results observed by others.52, 53, 64
In
particular, the fractional mass recovery of O-MWCNTs in column effluent decreased
systematically with increasing NaCl concentration down to a minimum value as the IS
approached the CDC (≈ 150mM NaCl in Figure 3.6 for example). Fractional removals
and computed attachment efficiencies for these and all other reported experiments are
91
provided in Table 3.5 – Table 3.7. Above the CDC this minimum fractional mass
recovery was constant to within experimental error (± 5% of C/C0) as the NaCl
concentration continued to increase. This minimum fractional recovery (maximum
removal) corresponds to a maximum rate of O-MWCNT deposition in the regime where
attachment is favorable ( =1) and fractional rates of deposition are controlled only by
physical processes of diffusion and mass transfer. This is more clearly evident when data
are interpreted in terms of attachment efficiency as shown in Figure 3.9 for different O-
MWCNTs over a range of different pH values. In this figure, the open triangles in panel
(b) are derived from the transport effluent data shown in Figure 3.6 (7.1% O-MWCNTs
at pH 5.8). Within the unfavorable (below CDC) regime, Figure 3.9 shows that a 10-fold
increase in IS resulted in at least 5-fold increases in for all MWCNTs tested. This
observation is different from that of Jasi et al.52
, who observed that a 10-fold increase in
the ionic strength produced only a 2-fold increase in within the unfavorable deposition
regime. We believe that this difference can be ascribed to the presence of straining in the
results of Jasi et al. and to the fact that straining should be comparatively insensitive to
the effects of ionic strength. We also observed that results for 3.0% O-MWCNTs at lower
pH have greater uncertainty than other data in regard to the ionic strength required to
obtain given -- see Figure 3.9(a). The cause of this uncertainty is unknown, but may
relate to greater variability among samples at this lower oxidation extent.
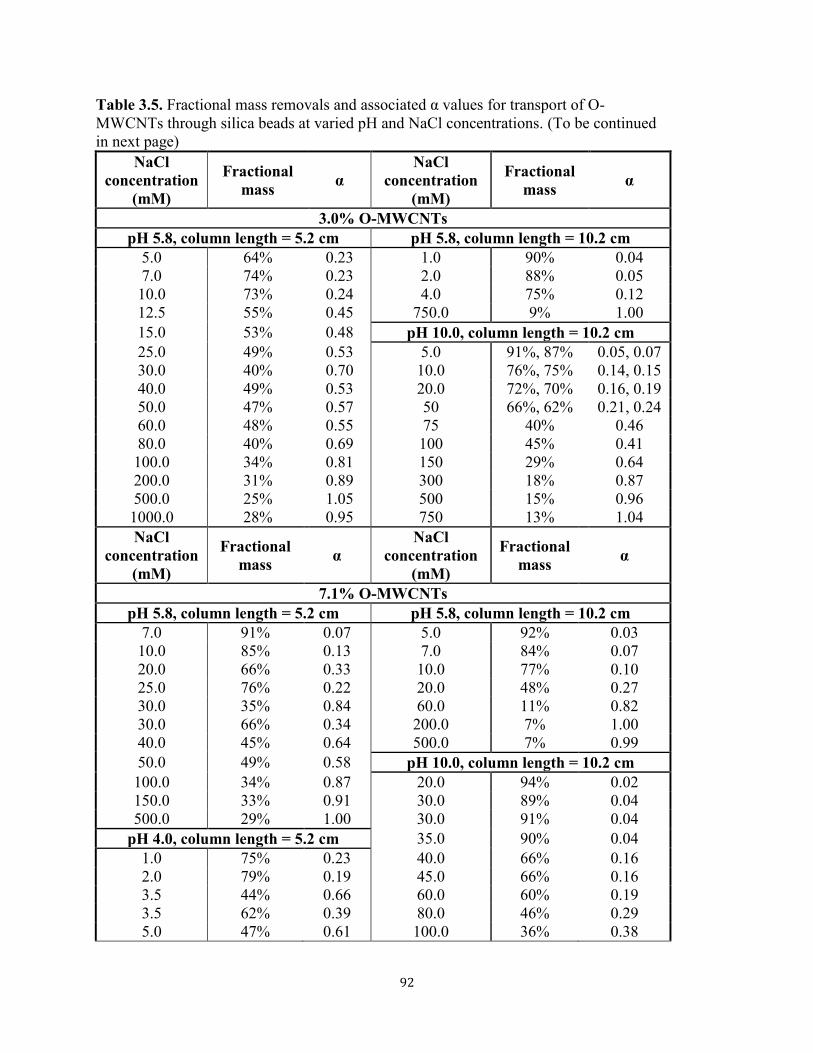
92
Table 3.5. Fractional mass removals and associated α values for transport of O-
MWCNTs through silica beads at varied pH and NaCl concentrations. (To be continued
in next page)
NaCl
concentration
(mM)
Fractional
mass α
NaCl
concentration
(mM)
Fractional
mass α
3.0% O-MWCNTs
pH 5.8, column length = 5.2 cm pH 5.8, column length = 10.2 cm
5.0 64% 0.23 1.0 90% 0.04
7.0 74% 0.23 2.0 88% 0.05
10.0 73% 0.24 4.0 75% 0.12
12.5 55% 0.45 750.0 9% 1.00
15.0 53% 0.48 pH 10.0, column length = 10.2 cm
25.0 49% 0.53 5.0 91%, 87% 0.05, 0.07
30.0 40% 0.70 10.0 76%, 75% 0.14, 0.15
40.0 49% 0.53 20.0 72%, 70% 0.16, 0.19
50.0 47% 0.57 50 66%, 62% 0.21, 0.24
60.0 48% 0.55 75 40% 0.46
80.0 40% 0.69 100 45% 0.41
100.0 34% 0.81 150 29% 0.64
200.0 31% 0.89 300 18% 0.87
500.0 25% 1.05 500 15% 0.96
1000.0 28% 0.95 750 13% 1.04
NaCl
concentration
(mM)
Fractional
mass α
NaCl
concentration
(mM)
Fractional
mass α
7.1% O-MWCNTs
pH 5.8, column length = 5.2 cm pH 5.8, column length = 10.2 cm
7.0 91% 0.07 5.0 92% 0.03
10.0 85% 0.13 7.0 84% 0.07
20.0 66% 0.33 10.0 77% 0.10
25.0 76% 0.22 20.0 48% 0.27
30.0 35% 0.84 60.0 11% 0.82
30.0 66% 0.34 200.0 7% 1.00
40.0 45% 0.64 500.0 7% 0.99
50.0 49% 0.58 pH 10.0, column length = 10.2 cm
100.0 34% 0.87 20.0 94% 0.02
150.0 33% 0.91 30.0 89% 0.04
500.0 29% 1.00 30.0 91% 0.04
pH 4.0, column length = 5.2 cm 35.0 90% 0.04
1.0 75% 0.23 40.0 66% 0.16
2.0 79% 0.19 45.0 66% 0.16
3.5 44% 0.66 60.0 60% 0.19
3.5 62% 0.39 80.0 46% 0.29
5.0 47% 0.61 100.0 36% 0.38

93
Table 3.5. (continued from previous page) Fractional mass removals and associated α
values for transport of O-MWCNTs through silica beads at varied pH and NaCl
concentrations. (To be continued in next page)
NaCl
concentration
(mM)
Fractional
mass α
NaCl
concentration
(mM)
Fractional
mass α
pH 4.0, column length = 5.2 cm pH 10.0, column length = 10.2 cm
5.0 55% 0.48 150.0 29% 0.46
7.0 36% 0.84 200.0 18% 0.63
10.0 26% 1.09 350.0 13% 0.94
10.0 28% 1.02 500 7% 1.00
20.0 35% 0.84 700 7% 0.99
30.0 30% 0.98 - - -
100.0 39% 1.00 - - -
11.5% O-MWCNTs
pH 5.8, column length = 5.2 cm
5.0 95% 0.03 100.0 49% 0.50
10.0 86% 0.11 150.0 34% 0.74
20.0 79% 0.16 200.0 33% 0.77
40.0 66% 0.28 300.0 37% 0.69
60.0 69% 0.26 500.0 21% 1.07
80.0 56% 0.41 1000.0 26% 0.93
Table 3.6. Fractional mass removals and associated α values for transport of O-
MWCNTs through silica beads at varied CaCl2 concentrations (pH = 5.8, column length
= 5.2 cm for all experiments)
CaCl2
concentration
(mM)
Fractional
mass α
CaCl2
concentration
(mM)
Fractional
mass α
5.1% O-MWCNTs
0.7 87% 0.11 13.2 33% 0.90
1.3 68% 0.32 40.0 25% 1.15
2.6 53% 0.52 132.5 27% 1.08
6.6 38% 0.78
7.1% O-MWCNTs
0.7 80% 0.20 13.2 42%, 42%,
37%
0.76,
0.76, 0.81
1.3 72%, 69%,
67%, 67%
0.29, 0.33,
0.36, 0.36 53.1 36%, 36% 0.92, 0.92
2.6 57% 0.46 132.5 32% 0.92
6.6 47%, 46% 0.68, 0.69 200.0 29% 1.00
8.3% O-MWCNTs
0.7 87% 0.11 13.2 31% 0.95
1.3 71% 0.28 40.0 31% 0.95
2.6 53% 0.52 132.5 31% 0.96
6.6 34% 0.87 200.0 30% 0.98
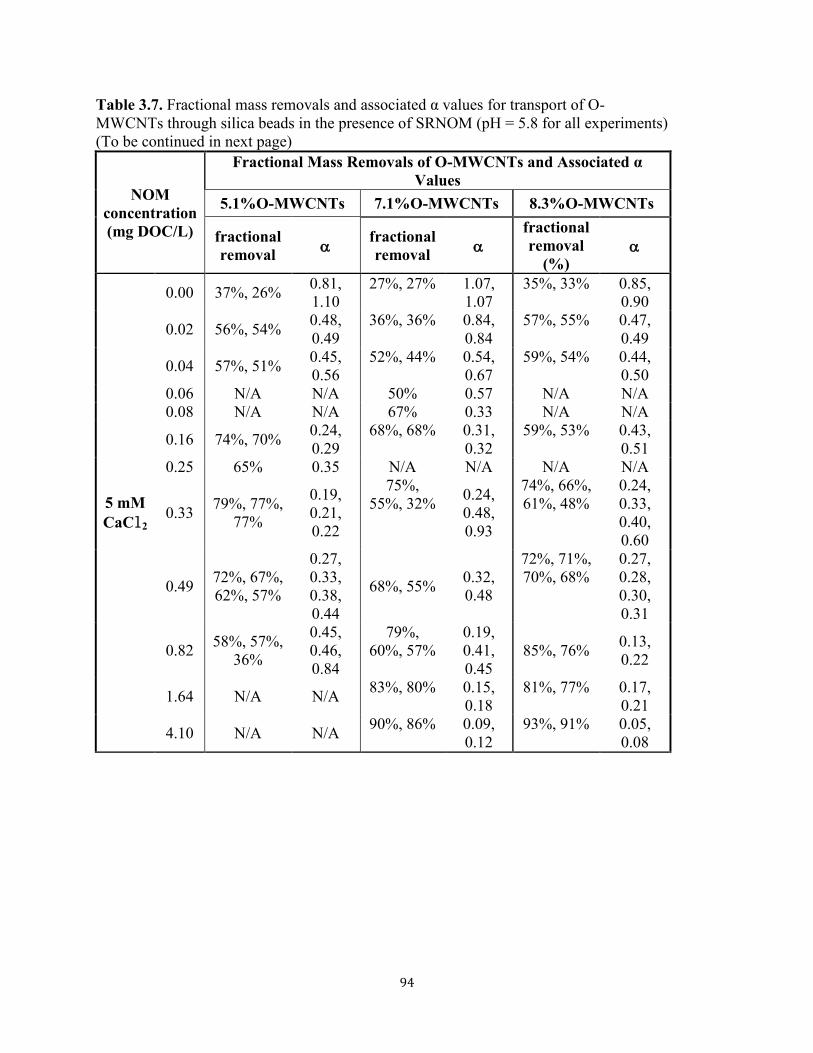
94
Table 3.7. Fractional mass removals and associated α values for transport of O-
MWCNTs through silica beads in the presence of SRNOM (pH = 5.8 for all experiments)
(To be continued in next page)
NOM
concentration
(mg DOC/L)
Fractional Mass Removals of O-MWCNTs and Associated α
Values
5.1%O-MWCNTs 7.1%O-MWCNTs 8.3%O-MWCNTs
fractional
removal
fractional
removal
fractional
removal
(%)
5 mM
CaCl2
0.00 37%, 26% 0.81,
1.10
27%, 27% 1.07,
1.07
35%, 33% 0.85,
0.90
0.02 56%, 54% 0.48,
0.49
36%, 36% 0.84,
0.84
57%, 55% 0.47,
0.49
0.04 57%, 51% 0.45,
0.56
52%, 44% 0.54,
0.67
59%, 54% 0.44,
0.50
0.06 N/A N/A 50% 0.57 N/A N/A
0.08 N/A N/A 67% 0.33 N/A N/A
0.16 74%, 70% 0.24,
0.29
68%, 68% 0.31,
0.32
59%, 53% 0.43,
0.51
0.25 65% 0.35 N/A N/A N/A N/A
0.33 79%, 77%,
77%
0.19,
0.21,
0.22
75%,
55%, 32% 0.24,
0.48,
0.93
74%, 66%,
61%, 48%
0.24,
0.33,
0.40,
0.60
0.49 72%, 67%,
62%, 57%
0.27,
0.33,
0.38,
0.44
68%, 55% 0.32,
0.48
72%, 71%,
70%, 68%
0.27,
0.28,
0.30,
0.31
0.82 58%, 57%,
36%
0.45,
0.46,
0.84
79%,
60%, 57%
0.19,
0.41,
0.45
85%, 76% 0.13,
0.22
1.64 N/A N/A 83%, 80% 0.15,
0.18
81%, 77% 0.17,
0.21
4.10 N/A N/A 90%, 86% 0.09,
0.12
93%, 91% 0.05,
0.08
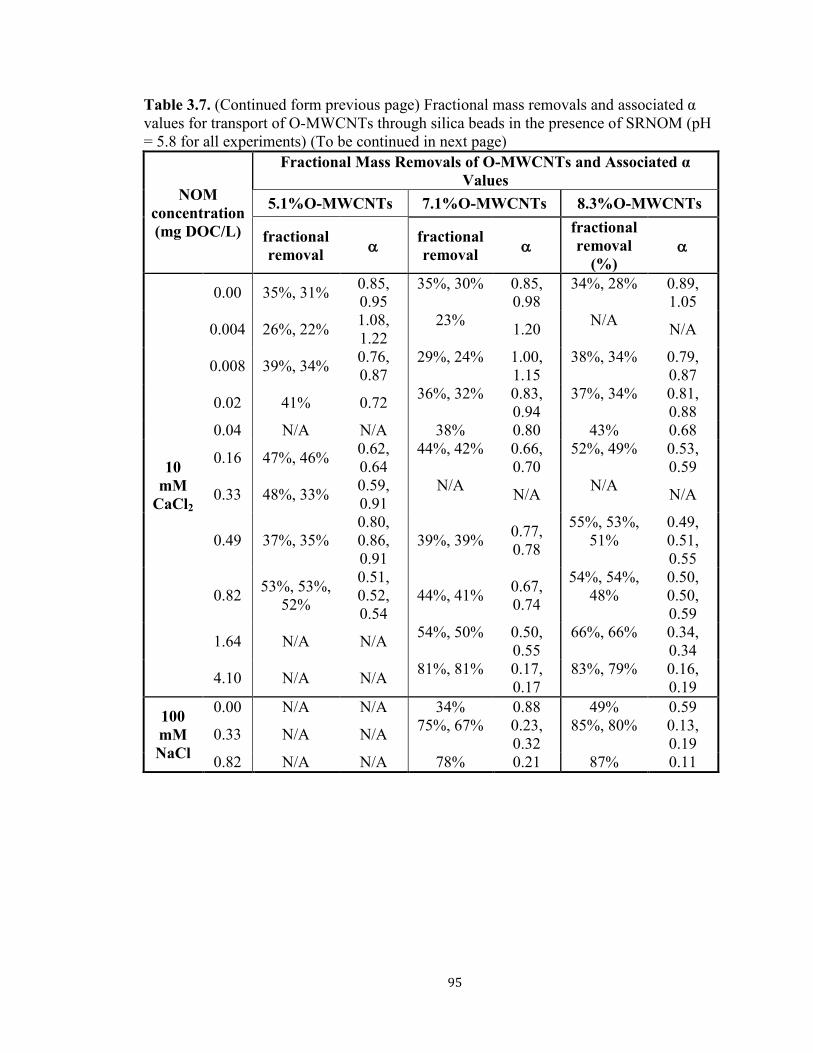
95
Table 3.7. (Continued form previous page) Fractional mass removals and associated α
values for transport of O-MWCNTs through silica beads in the presence of SRNOM (pH
= 5.8 for all experiments) (To be continued in next page)
NOM
concentration
(mg DOC/L)
Fractional Mass Removals of O-MWCNTs and Associated α
Values
5.1%O-MWCNTs 7.1%O-MWCNTs 8.3%O-MWCNTs
fractional
removal
fractional
removal
fractional
removal
(%)
10
mM
CaCl2
0.00 35%, 31% 0.85,
0.95
35%, 30% 0.85,
0.98
34%, 28% 0.89,
1.05
0.004 26%, 22% 1.08,
1.22
23% 1.20
N/A N/A
0.008 39%, 34% 0.76,
0.87
29%, 24% 1.00,
1.15
38%, 34% 0.79,
0.87
0.02 41% 0.72 36%, 32% 0.83,
0.94
37%, 34% 0.81,
0.88
0.04 N/A N/A 38% 0.80 43% 0.68
0.16 47%, 46% 0.62,
0.64
44%, 42% 0.66,
0.70
52%, 49% 0.53,
0.59
0.33 48%, 33% 0.59,
0.91
N/A N/A
N/A N/A
0.49 37%, 35%
0.80,
0.86,
0.91
39%, 39% 0.77,
0.78
55%, 53%,
51%
0.49,
0.51,
0.55
0.82 53%, 53%,
52%
0.51,
0.52,
0.54
44%, 41% 0.67,
0.74
54%, 54%,
48%
0.50,
0.50,
0.59
1.64 N/A N/A 54%, 50% 0.50,
0.55
66%, 66% 0.34,
0.34
4.10 N/A N/A 81%, 81% 0.17,
0.17
83%, 79% 0.16,
0.19
100
mM
NaCl
0.00 N/A N/A 34% 0.88 49% 0.59
0.33 N/A N/A 75%, 67% 0.23,
0.32
85%, 80% 0.13,
0.19
0.82 N/A N/A 78% 0.21 87% 0.11

96
3.3.5 Effect of pH
Few researchers have systematically studied the effect of pH on MWCNT
deposition.75
In this paper, the effect of pH on the transport of two different types of O-
MWCNTs (3.0% O and 7.1% O) was studied with NaCl as the electrolyte. As shown in
Figure 3.9, the data reveal that CDC values for O-MWCNTs increased systematically
with pH between 4.0 and 10.0 for both types of O-MWCNTs. All of the CDC curves
could be well fit by Equation 4, yielding estimated CDC values for 3.0% O-MWCNTs of
24.4 mM and 96.8 mM at pH 5.8 and 10.0, respectively. CDC values for 7.1% O-
MWCNTs were 3.4 mM, 27.3 mM, and 134.4 mM at pH 4.0, 5.8 and 10.0, respectively.
As with the previously described IS effects, these results are qualitatively consistent with
DLVO theory.32, 33, 39
More specifically, reduced barriers to attachment with decreasing
pH correspond to the fact that higher proton concentration in solution will lead to reduced
surface charge on both the collectors (glass beads) and particles (O-MWCNTs) due to
Figure 3.9. Critical deposition curves for O-MWCNTs with total oxygen
concentrations of (a) 3.0% and (b) 7.1% measured at pH 10 (filled blue circles), pH
5.8 (open red triangles), and pH 4 (filled black squares).
[N aC l], m M
.1 1 10 100 1000
Att
ac
hm
en
t E
ffic
ien
cy
,
.01
.1
1
[N aC l], m M
.1 1 10 100 1000
(a) (b)
pH 5.8
pH 4.0
pH 10.0
pH 5.8
pH 10.0

97
protonation of negatively charged functional groups – that is, principally carboxyl groups
on the O-MWCNTs and silanol groups on the amorphous silica beads. The effect of pH
on surface charge for the O-MWCNTs produced in our laboratories is well understood, as
previously reported by Smith et al.21, 66
– see Figure 2(a) in Ref 21 and Figure 5 in Ref 66
These materials were very similar to those used in our research and were produced by
identical methods. Moreover, we also confirmed the presence of more negative surface
charge at higher pH for one of our materials (7.1% O-MWCNTs) by means of zeta
potential measurement -- see Figure 3.10. Unfortunately, however, direct quantitative
testing of DLVO theory is not possible for O-MWCNTs owing to the complexities of
their shape and size and the unknown aspects of charge distribution on the various
interacting

98
surfaces.
3.3.6 Effect of Surface Oxygen on O-MWCNTs
O-MWCNTs with different total surface oxygen concentrations were selected to
investigate the effect that surface chemistry has on attachment efficiency during
transport. NaCl and CaCl2 were both used separately as background electrolytes in these
studies. For the NaCl based experiments, CDC curves for O-MWCNTs with 3.0% O,
Figure 3.10. Zeta potential of 7.1% O-MWCNTs at varied pH and at the NaCl
concentration of 1 mM. The zeta potential profile obtained for 7.1% O-MWCNTs is
similar to those obtained in our previous studies1 using O-MWCNTs from the same
supplier (Nanolab) and prepared with identical functionalization method.
pH
4 6 8 10
Ze
ta p
ote
nti
al,
mM
-60
-50
-40
-30
-20
-10
0
99
7.1% O and 11.5% O at pH 5.8 are shown in Figure 3.11(a). Fitting these stability curves
to Equation 4 yielded CDC values of 24.4, 27.3 and 93.7 mM NaCl, respectively. As
previously discussed in the context of Figure 3.9(a), data for 3.0% O-MWCNTs (Figure
3.11 (a)) show greater uncertainty than do other data, perhaps because of greater
variability among samples at this lower oxidation extent. This may also partially explain
observed overlap of -values among O-MWCNTs with 3.0% and 7.1% oxygen at higher
NaCl concentrations (Figure 3.11 (a)), although aggregation and/or straining of either
material could also be affecting results in this high region. In any case, however, the
more heavily oxidized O-MWCNTs are clearly more stable towards attachment for
conditions at <0.6 where the possible influence of aggregation and straining can be
reliably neglected. (See prior discussion of Figure 3.7). The data also reveal that CDC is
clearly less sensitive to changes in surface oxygen content than to solution pH. This is not
surprising in that pH has impacts on surface potential of both the O-MWCNTs and the
collectors whereas changes in surface oxygen only affect the O-MWCNTs.
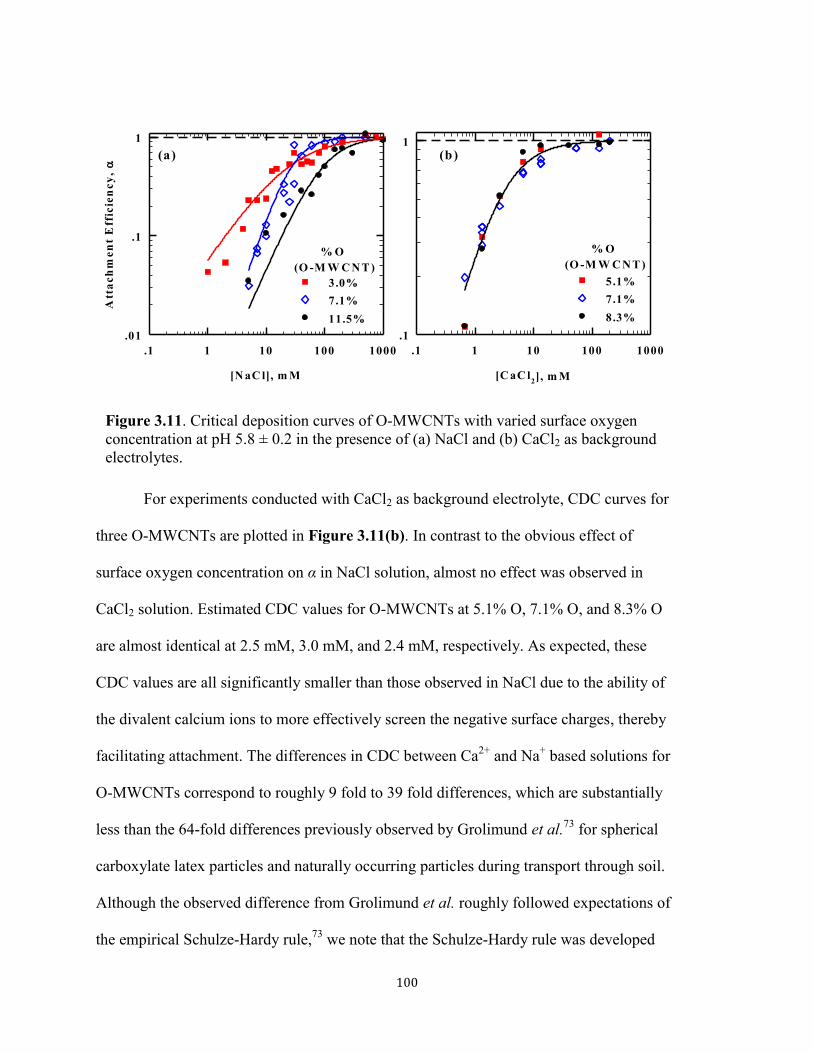
100
For experiments conducted with CaCl2 as background electrolyte, CDC curves for
three O-MWCNTs are plotted in Figure 3.11(b). In contrast to the obvious effect of
surface oxygen concentration on α in NaCl solution, almost no effect was observed in
CaCl2 solution. Estimated CDC values for O-MWCNTs at 5.1% O, 7.1% O, and 8.3% O
are almost identical at 2.5 mM, 3.0 mM, and 2.4 mM, respectively. As expected, these
CDC values are all significantly smaller than those observed in NaCl due to the ability of
the divalent calcium ions to more effectively screen the negative surface charges, thereby
facilitating attachment. The differences in CDC between Ca2+
and Na+ based solutions for
O-MWCNTs correspond to roughly 9 fold to 39 fold differences, which are substantially
less than the 64-fold differences previously observed by Grolimund et al.73
for spherical
carboxylate latex particles and naturally occurring particles during transport through soil.
Although the observed difference from Grolimund et al. roughly followed expectations of
the empirical Schulze-Hardy rule,73
we note that the Schulze-Hardy rule was developed
Figure 3.11. Critical deposition curves of O-MWCNTs with varied surface oxygen
concentration at pH 5.8 ± 0.2 in the presence of (a) NaCl and (b) CaCl2 as background
electrolytes.
[N aC l], m M
.1 1 10 100 1000
Att
ac
hm
en
t E
ffic
ien
cy
,
.01
.1
1
7.1%
3.0%
11.5%
(a)
[C aC l2], m M
.1 1 10 100 1000
.1
1
(b)
7.1%
5.1%
8.3%
% O
(O -M W C N T )
% O
(O -M W C N T )

101
from homo-aggregation studies and not deposition. Moreover, in light of the relative
complexity of O-MWCNT surface charge and morphology we would not necessarily
expect these materials to follow this simple rule. More surprising to us was the lack of
CDC dependence on O-MWCNT surface oxygen content when Ca2+
was present. Similar
effects of independence of CNT – silica CDC to O-MWCNT surface charge in the
presence of Ca2+
has also been observed by Yi et al. in their studies of O-MWCNT
deposition onto quartz crystal using QCM-D.43
We follow those authors in suggesting
that the existence of multiple Ca2+
binding energies with COO- functional groups on O-
MWCNTs (e.g., mono-dentate or multi-dentate) could cause a relative insensitivity of
CDC to O-MWCNT surface charge.43
Note that other authors have also discussed how
Ca2+
may participate in additional short-range interactions with anionic surfaces such as
silica,77
anionic polymers,45
and O-MWCNTs.23, 42, 78
3.3.7 Effect of Natural Organic Matter (NOM)
The results reported above suggest that O-MWCNTs’ attachment efficiencies
with amorphous silica can be quite high in clean (organic free) water systems that are
mildly brackish (NaCl > 30 mM) or with Ca2+
concentrations (> 5 mM) commonly found
in groundwater environments.79
Also relevant, however, will be the background dissolved
organic matter that is almost ubiquitously present in natural waters. In this regard, it is
now widely understood that the presence of NOM can substantially increase particle
stabilities and decrease rates of attachment.42, 52, 54

102
The present investigation builds on the above noted prior work by providing a
more quantitative estimate of fractional deposition rates of O-MWCNTs to amorphous
silica under conditions of varying NOM concentration. This was done under carefully
controlled conditions of pH and IS using both sodium and calcium chloride as
background electrolyte. By determining the deposition rate coefficient, kd, in the presence
of a known concentration of SRNOM and taking the ratio of this value to the previously
Figure 3.12. Breakthrough curves of 7.1% O-MWCNTs passing through 5.2
cm long columns at 10 mM CaCl2 and pH 5.8 ± 0.2, plotted as a function of
SRNOM concentration (mg DOC/L). The dashed line shows a breakthrough
curve of O-MWCNTs (SRNOM was present at 0.82 mg DOC/L for this
experiment.) in the absence of any added background electrolyte. The
normalized concentration is determined as C/C0, where C0 is as defined in the
text.
Pore volum e
0 1 2 3 4
No
rm
ali
ze
d c
on
ce
ntr
ati
on
0 .0
.2
.4
.6
.8
1.0
1.2
IS = 0
0
0.04
0.16
0.49
0.82
1.64
4.10
[SR N O M ]
(m g D O C /L )

103
calculated kd, fast (i.e., at the highest Na+ (500 mM) or Ca
2+ (132 mM) but in the absence
of SRNOM), our work provides a first quantitative metric regarding the effect of
SRNOM on α for different types of O-MWCNTs.
As expected, SRNOM was observed to facilitate the transport of O-MWCNTs
through glass beads for all three O-MWCNTs studied. Selected (typical) column effluent
data for one of the three materials are shown in Figure 3.12. These results were obtained
with 7.1% O-MWCNTs at pH 5.8 and 10 mM CaCl2 over a range of SRNOM
concentrations (0 – 4.1 mg DOC/L). Also shown for comparison is the O-MWCNT curve
obtained at 0.0 IS and a fixed SRNOM concentration of 0.84 mg DOC/L (dashed line).
The 0.0 IS curve is provided for purposes of comparison as a control that has 100% mass
recovery ( =0). The α values obtained through experiments of this type for two O-
MWCNTs are plotted as a function of SRNOM concentration (mg DOC/L) in Figure
Figure 3.13. Attachment efficiencies obtained using 7.1% O-MWCNTs (filled red
triangles) and 8.3% O-MWCNTs (open blue squares) from breakthrough experiments
conducted at pH 5.8 ± 0.2 and in the presence of (a) 5 mM CaCl2 and (b) 10 mM
CaCl2 plotted as a function of SRNOM concentration.
SR N O M conc. (m g D O C /L )
0 1 2 3 4 5
SR N O M conc. (m g D O C /L )
0 1 2 3 4 5
Att
ac
hm
en
t E
ffic
ien
cy
,
.2
.4
.6
.8
1.0 (a) (b)
% O
(O -M W C N T )
7.1%
8.3%
% O
(O -M W C N T )
7.1%
8.3%

104
3.13(a) and (b), using 5 mM Ca2+
and 10 mM Ca2+
background electrolyte, respectively.
Data for the third less oxidized material (5.1% O-MWCNTs) under these same conditions
are provided in Figure 3.14. The attachment coefficients under each condition and also
under a third electrolyte condition of 100 mM NaCl are detailed in Table 3.7.
For all three O-MWCNTs and under all aquatic conditions tested, increasing
SRNOM concentration led to decreasing α (i.e., decreasing rates of deposition). With 100
mM NaCl as the background electrolyte, deposition was sensitive to SRNOM as well as
Figure 3.14. Attachment efficiencies of O-MWCNTs with a total surface oxygen
concentration of 5.1% as a function of SRNOM concentration at pH 5.8 ± 0.2 with
5mM CaCl2 (red triangles), and 10mM CaCl2 (blue diamonds).
SRNOM conc. (mg DOC/L)
0.0 0.2 0.4 0.6 0.8 1.0
Att
ach
men
t E
ffic
ien
cy,
0.2
0.4
0.6
0.8
1.0
5 mM CaCl2
10 mM CaCl2

105
O-MWCNT surface oxygen – for example, 0.82 mg DOC/L of NOM causes a 4 fold
decrease in α (from 0.88 to 0.21) for 7.1% O-MWCNTs and a 3-fold decrease (from 0.59
to 0.11) for 8.3% O-MWCNTs (Table 3.7).
With CaCl2 as background electrolyte, deposition was sensitive to SRNOM but
not to O-MWCNT surface oxygen. For both O-MWCNTs shown in Figure 3.13 results
were almost identical. In the presence of 5 mM Ca2+
(Figure 3.13(a)), α values for two
O-MWCNTs tested decreased sharply for SRNOM concentrations between 0.02 and 0.82
mg DOC/L; however, the decline of α at higher concentrations of NOM was somewhat
more gradual. More specifically, α values dropped from 1.0 to 0.2 with addition of 0.82
mg DOC/L, but then gradually decreased thereafter, requiring 4.1 mg DOC/L for α ~ 0.1.
For the 10 mM Ca2+
scenarios (Figure 3.13(b)), the same trend was observed but with α
dropping only to 0.6 at very low values of SRNOM and then gradually decreasing only to
~ 0.2 at 4.1 mg DOC/L of added SRNOM. Results with the less oxidized 5.1% O-
MWCNTs (Figure 3.14) show similar trends as discussed above for low DOC values
although with much greater variability of results owing to the lower stability of these
materials. For these reasons, SRNOM concentrations above 0.82 DOC mg/L were not
studied for the 5.1% O-MWCNTs.
We postulate that the rapid drop in α at low NOM concentrations (< 0.82 mg
DOC/L) correspond monolayer coverage of all available O-MWCNT surfaces. Simple
calculations confirm that this is a realistic possibility – with roughly 1.2 μg of O-
MWCNTs injected (corresponding to C0 = M0/Vpore = 0.12 mg/L) and assume 283.3 m2
surface area per g MWCNT (based on BET measurement from Cho et al.23
) we estimate
that each mg of SRNOM DOC would need to occupy only 0.04 m2. This is much lower
106
than the value of 1 m2 that has been previously estimated as the amount needed to
achieve full monolayer coverage of a mineral surface by moderately sized organic
molecules.80
Thus, our postulation lies well within the realm of possibility. We further
postulate that the lower sensitivity of α to DOC at SRNOM concentrations above 0.2 mg
DOC/L reflects a change in dominant mechanism from one of surface charge screening
as DOC monolayer adsorption blocks O-MWCNT surfaces to steric interaction as the
adsorbed layer of SRNOM thickens.
Considering the effects of surface oxygen on attachment efficiencies in the
presence of SRNOM, the results show that such effects were much less substantial in
Ca2+
based than Na+ based electrolyte–see Table 3.5. These findings are qualitatively
similar to those found in the absence of SRNOM (Figure 3.11(b)). Moreover, similar
effects have been previously reported by Smith et al. who studied homo-aggregation in
the presence of SRNOM in both simple NaCl solution and in a “synthetic groundwater”
containing Ca2+
. In that work, as in this, SRNOM dramatically reduced attachment
efficiencies in both types of electrolyte, but the impact of surface oxygen was more
pronounced in the simple Na+ solution.
42
In natural environments where both Ca2+
and NOM are present, O-MWCNT
transport may be largely independent of O-MWCNT surface oxidation, with attachment
efficiencies of dispersed O-MWCNTs being instead controlled primarily by the amount
of adsorbed NOM and other aquatic conditions such as pH, ionic strength, and ionic
composition. Importantly, the results showed that the presence of even low
concentrations of natural organic matter caused low particle attachment efficiencies (α <
0.2) under all conditions tested. Together, these findings suggest that O-MWCNT
107
attachment efficiencies in porous media may be very low in many natural situations
where straining is not important, with commensurate implications for deposition. We
believe that these findings may be directly relevant for environmental transport under
some conditions, such as in subsurface sand and gravel aquifers where grain size and
uniformity are sufficient to exclude straining mechanisms.
3.4 Acknowledgements
We would like to express our acknowledge to professor Nathalie Tufenkji
(Department of Chemical Engineering, McGill University) for her advise and scientific
discussion regarding the experimental method of column dissection. We would also like
to thank Dr. Kenneth Livi (Department of Earth and Planetary Sciences and Biology,
Johns Hopkins University) for his help on TEM analysis. Financial support for this effort
was from the National Science Foundation (Grant # BES0731147) and the Environmental
Protection Agency (Grant # RD – 83385701-1). Its contents are solely the responsibility
of the grantee and do not necessarily represent the official views of the USEPA. Further,
USEPA does not endorse the purchase of any commercial products or services mentioned
in the publication.
3.5 Cited References
1. Ebbesen, T. W., Carbon Nanotubes. Annual Review of Materials Science 1994,
24, (1), 235-264.
2. Iijima, S., Helical Microtubules of Graphitic Carbon. Nature 1991, 354, (6348),
56-58.
3. Ebbesen, T. W.; Hiura, H.; Fujita, J.; Ochiai, Y.; Matsui, S.; Tanigaki, K.,
Patterns in the Bulk Growth of Carbon Nanotubes. Chemical Physics Letters 1993, 209,
(1-2), 83-90.
4. Dresselhaus, M. S.; Dresselhaus, G.; Eklund, P. C., Science of Fullerenes and
Carbon Nanotubes. Academic Press: San Diego, 1996; p xviii, 965 p.

108
5. Gallagher, M. J.; Chen, D.; Jacobsen, B. P.; Sarid, D.; Lamb, L. D.; Tinker, F.
A.; Jiao, J.; Huffman, D. R.; Seraphin, S.; Zhou, D., Characterization of Carbon
Nanotubes by Scanning Probe Microscopy. Surface Science 1993, 281, (3), L335-L340.
6. Klaine, S. J.; Alvarez, P. J. J.; Batley, G. E.; Fernandes, T. F.; Handy, R. D.;
Lyon, D. Y.; Mahendra, S.; Mclaughlin, M. J.; Lead, J. R., Nanomaterials in the
Environment: Behavior, Fate, Bioavailability, and Effects. Environ Toxicol Chem 2008,
27, (9), 1825-1851.
7. Parish, A. Production and Application of Carbon Nanotubes, Carbon
Nanofibers, Fullerenes, Graphene and Nanodiamonds: A Global Technology Survey and
Market Analysis; Innovative research and products (iRAP), Inc: 2011.
8. Mueller, N. C.; Nowack, B., Exposure Modeling of Engineered Nanoparticles
in the Environment. Environ Sci Technol 2008, 42, (12), 4447-4453.
9. Nowack, B.; Bucheli, T. D., Occurrence, Behavior and Effects of Nanoparticles
in the Environment. Environ Pollut 2007, 150, (1), 5-22.
10. Petosa, A. R.; Jaisi, D. P.; Quevedo, I. R.; Elimelech, M.; Tufenkji, N.,
Aggregation and Deposition of Engineered Nanomaterials in Aquatic Environments:
Role of Physicochemical Interactions. Environ Sci Technol 2010, 44, (17), 6532-6549.
11. Marrs, B.; Andrews, R.; Pienkowski, D., Multiwall Carbon Nanotubes
Enhance the Fatigue Performance of Physiologically Maintained Methyl Methacrylate-
Styrene Copolymer. Carbon 2007, 45, (10), 2098-2104.
12. Breuer, O.; Sundararaj, U., Big Returns from Small Fibers: A Review of
Polymer/Carbon Nanotube Composites. Polymer Composites 2004, 25, (6), 630-645.
13. Vaisman, L.; Marom, G.; Wagner, H. D., Dispersions of Surface-Modified
Carbon Nanotubes in Water-Soluble and Water-Insoluble Polymers. Advanced
Functional Materials 2006, 16, (3), 357-363.
14. Sluzarenko, N.; Heurtefeu, B.; Maugey, M.; Zakri, C.; Poulin, P.;
Lecommandoux, S., Diblock Copolymer Stabilization of Multi-Wall Carbon Nanotubes
in Organic Solvents and Their Use in Composites. Carbon 2006, 44, (15), 3207-3212.
15. Bourlinos, A. B.; Georgakilas, V.; Zboril, R.; Dallas, P., Preparation of a
Water-Dispersible Carbon Nanotube-Silica Hybrid. Carbon 2007, 45, (10), 2136-2139.
16. Liu, P., Modifications of Carbon Nanotubes with Polymers. European
Polymer Journal 2005, 41, (11), 2693-2703.
17. Yusof, A. M.; Buang, N. A.; Yean, L. S.; Ibrahim, M. L., The Use of Multi-
Walled Carbon Nanotubes as Possible Carrier in Drug Delivery System for Aspirin. In
Nanoscience and Nanotechnology, Rusop, M.; Soga, T., Eds. 2009; Vol. 1136, pp 390-
394.
18. Li, L.; Xing, Y., Pt-Ru Nanoparticles Supported on Carbon Nanotubes as
Methanol Fuel Cell Catalysts. Journal of Physical Chemistry C 2007, 111, (6), 2803-
2808.
19. Penza, M.; Cassano, G.; Aversa, P.; Antolini, F.; Cusano, A.; Cutolo, A.;
Giordano, M.; Nicolais, L., Alcohol Detection Using Carbon Nanotubes Acoustic and
Optical Sensors. Applied Physics Letters 2004, 85, (12), 2379-2381.
20. Savage, T.; Bhattacharya, S.; Sadanadan, B.; Gaillard, J.; Tritt, T. M.; Sun, Y.
P.; Wu, Y.; Nayak, S.; Car, R.; Marzari, N.; Ajayan, P. M.; Rao, A. M., Photoinduced
Oxidation of Carbon Nanotubes. Journal of Physics Condensed Matter 2003, 15, (35),
5915-5921.

109
21. Smith, B.; Wepasnick, K.; Schrote, K. E.; Cho, H. H.; Ball, W. P.; Fairbrother,
D. H., Influence of Surface Oxides on the Colloidal Stability of Multi-Walled Carbon
Nanotubes: A Structure-Property Relationship. Langmuir 2009, 25, (17), 9767-9776.
22. Cho, H. H.; Smith, B. A.; Wnuk, J. D.; Fairbrother, D. H.; Ball, W. P.,
Influence of Surface Oxides on the Adsorption of Naphthalene onto Multiwalled Carbon
Nanotubes. Environ Sci Technol 2008, 42, (8), 2899-2905.
23. Cho, H. H.; Wepasnick, K.; Smith, B. A.; Bangash, F. K.; Fairbrother, D. H.;
Ball, W. P., Sorption of Aqueous Zn[Ii] and Cd[Ii] by Multiwall Carbon Nanotubes: The
Relative Roles of Oxygen-Containing Functional Groups and Graphenic Carbon.
Langmuir 2010, 26, (2), 967-981.
24. Rajagopalan, R.; Tien, C., Trajectory Analysis of Deep-Bed Filtration with
Sphere-in-Cell Porous-Media Model. Aiche J 1976, 22, (3), 523-533.
25. Yao, K. M.; Habibian, M. M.; Omelia, C. R., Water and Waste Water
Filtration - Concepts and Applications. Environ Sci Technol 1971, 5, (11), 1105-1112.
26. Mccarthy, J. F.; Mckay, L. D., Colloid Transport in the Subsurface: Past,
Present, and Future Challenges. Vadose Zone J 2004, 3, (2), 326-337.
27. Tobiason, J. E.; Omelia, C. R., Physicochemical Aspects of Particle Removal
in Depth Filtration. J Am Water Works Ass 1988, 80, (12), 54-64.
28. Hahn, M. W.; O'melia, C. R., Deposition and Reentrainment of Brownian
Particles in Porous Media under Unfavorable Chemical Conditions: Some Concepts and
Applications. Environ Sci Technol 2004, 38, (1), 210-220.
29. Elimelech, M.; Omelia, C. R., Effect of Particle Size on Collision Efficiency
in the Deposition of Brownian Particles with Electrostatic Energy Barriers. Langmuir
1990, 6, (6), 1153-1163.
30. Veerapaneni, S.; Wiesner, M. R., Role of Suspension Polydispersivity in
Granular Media Filtration. J Environ Eng-Asce 1993, 119, (1), 172-190.
31. Frimmel, F. H.; Von Der Kammer, F.; Flemming, H.-C., Colloidal Transport
in Porous Media. Springer: Berlin, Heidelberg, 2007.
32. Derjaguin, B., On the Repulsive Forces between Charged Colloid Particles
and on the Theory of Slow Coagulation and Stability of Lyophobe Sols. Transactions of
the Faraday Society 1940, 35, (0), 203-215.
33. Derjaguin, B.; Landau, L., Theory of the Stability of Strongly Charged
Lyophobic Sols and of the Adhesion of Strongly Charged-Particles in Solutions of
Electrolytes. Prog Surf Sci 1941, 14, 633.
34. Elimelech, M.; Omelia, C. R., Kinetics of Deposition of Colloidal Particles in
Porous-Media. Environ Sci Technol 1990, 24, (10), 1528-1536.
35. Franchi, A.; O'melia, C. R., Effects of Natural Organic Matter and Solution
Chemistry on the Deposition and Reentrainment of Colloids in Porous Media. Environ
Sci Technol 2003, 37, (6), 1122-1129.
36. Mcdowell-Boyer, L. M.; Hunt, J. R.; Sitar, N., Particle Transport through
Porous Media. Water Resour Res 1986, 22, (13), 1901-1921.
37. Stumm, W., Chemistry of the Solid-Water Interface: Processes at the Mineral-
Water and Particle-Water Interface in Natural Systems. Wiley-Interscience: New York,
1992.
110
38. Tufenkji, N.; Elimelech, M., Correlation Equation for Predicting Single-
Collector Efficiency in Physicochemical Filtration in Saturated Porous Media. Environ
Sci Technol 2004, 38, (2), 529-536.
39. Verwey, E. J. W.; Overbeek, J. T., Theory of the Stability of Lyophobic
Colloids. Elsevier: Amsterdam, 1948.
40. Yao, K. M. Influence of Suspended Particle Size on the Transport Aspect of
Water Filtration. University of North Carolina at Chapel Hill, 1968.
41. Saleh, N. B.; Pfefferle, L. D.; Elimelech, M., Aggregation Kinetics of
Multiwalled Carbon Nanotubes in Aquatic Systems: Measurements and Environmental
Implications. Environ Sci Technol 2008, 42, (21), 7963-7969.
42. Smith, B.; Yang, J.; Bitter, J. L.; Ball, W. P.; Fairbrother, D. H., Influence of
Surface Oxygen on the Interactions of Carbon Nanotubes with Natural Organic Matter.
Environ Sci Technol 2012, 46, (23), 12839-12847.
43. Yi, P.; Chen, K. L., Influence of Surface Oxidation on the Aggregation and
Deposition Kinetics of Multiwalled Carbon Nanotubes in Monovalent and Divalent
Electrolytes. Langmuir 2011, 27, (7), 3588-3599.
44. Qu, X. L.; Hwang, Y. S.; Alvarez, P. J. J.; Bouchard, D.; Li, Q. L., Uv
Irradiation and Humic Acid Mediate Aggregation of Aqueous Fullerene (Nc(60))
Nanoparticles. Environ Sci Technol 2010, 44, (20), 7821-7826.
45. Li, Q. L.; Elimelech, M., Organic Fouling and Chemical Cleaning of
Nanofiltration Membranes: Measurements and Mechanisms. Environ Sci Technol 2004,
38, (17), 4683-4693.
46. Davis, C. J.; Eschenazi, E.; Papadopoulos, K. D., Combined Effects of Ca2+
and Humic Acid on Colloid Transport through Porous Media. Colloid Polym Sci 2002,
280, (1), 52-58.
47. Chen, K. L.; Elimelech, M., Interaction of Fullerene (C-60) Nanoparticles
with Humic Acid and Alginate Coated Silica Surfaces: Measurements, Mechanisms, and
Environmental Implications. Environ Sci Technol 2008, 42, (20), 7607-7614.
48. Chen, K. L.; Mylon, S. E.; Elimelech, M., Enhanced Aggregation of Alginate-
Coated Iron Oxide (Hematite) Nanoparticles in the Presence of Calcium, Strontium, and
Barium Cations. Langmuir 2007, 23, (11), 5920-5928.
49. Yoon, S. H.; Lee, C. H.; Kim, K. J.; Fane, A. G., Effect of Calcium Ion on the
Fouling of Nanofilter by Humic Acid in Drinking Water Production. Water Res 1998, 32,
(7), 2180-2186.
50. Iler, R. K., Coagulation of Colloidal Silica by Calcium-Ions, Mechanism, and
Effect of Particle-Size. J Colloid Interf Sci 1975, 53, (3), 476-488.
51. Auset, M.; Keller, A. A., Pore-Scale Visualization of Colloid Straining and
Filtration in Saturated Porous Media Using Micromodels. Water Resour Res 2006, 42,
(12).
52. Jaisi, D. P.; Saleh, N. B.; Blake, R. E.; Elimelech, M., Transport of Single-
Walled Carbon Nanotubes in Porous Media: Filtration Mechanisms and Reversibility.
Environ Sci Technol 2008, 42, (22), 8317-8323.
53. Jaisi, D. P.; Elimelech, M., Single-Walled Carbon Nanotubes Exhibit Limited
Transport in Soil Columns. Environ Sci Technol 2009, 43, (24), 9161-9166.
111
54. Wang, Y. G.; Kim, J. H.; Baek, J. B.; Miller, G. W.; Pennell, K. D., Transport
Behavior of Functionalized Multi-Wall Carbon Nanotubes in Water-Saturated Quartz
Sand as a Function of Tube Length. Water Res 2012, 46, (14), 4521-4531.
55. O'carroll, D. M.; Liu, X.; Mattison, N. T.; Petersen, E. J., Impact of Diameter
on Carbon Nanotube Transport in Sand. J Colloid Interf Sci 2013, 390, 96-104.
56. Liu, X. Y.; O'carroll, D. M.; Petersen, E. J.; Huang, Q. G.; Anderson, C. L.,
Mobility of Multiwalled Carbon Nanotubes in Porous Media. Environ Sci Technol 2009,
43, (21), 8153-8158.
57. Chen, K. L.; Smith, B. A.; Ball, W. P.; Fairbrother, D. H., Assessing the
Colloidal Properties of Engineered Nanoparticles in Water: Case Studies from Fullerene
C-60 Nanoparticles and Carbon Nanotubes. Environ Chem 2010, 7, (1), 10-27.
58. Hu, H.; Yu, A. P.; Kim, E.; Zhao, B.; Itkis, M. E.; Bekyarova, E.; Haddon, R.
C., Influence of the Zeta Potential on the Dispersability and Purification of Single-Walled
Carbon Nanotubes. J Phys Chem B 2005, 109, (23), 11520-11524.
59. Hyung, H.; Fortner, J. D.; Hughes, J. B.; Kim, J. H., Natural Organic Matter
Stabilizes Carbon Nanotubes in the Aqueous Phase. Environ Sci Technol 2007, 41, (1),
179-184.
60. Chen, K. L.; Elimelech, M., Envr 92-Influence of Humic Acid on the
Aggregation Kinetics of Fullerene Nanoparticles in Monovalent and Divalent Electrolyte
Solutions. Abstr Pap Am Chem S 2007, 234.
61. Chen, K. L.; Elimelech, M., Influence of Humic Acid on the Aggregation
Kinetics of Fullerene (C-60) Nanoparticles in Monovalent and Divalent Electrolyte
Solutions. J Colloid Interf Sci 2007, 309, (1), 126-134.
62. Saleh, N. B.; Pfefferle, L. D.; Elimelech, M., Influence of Biomacromolecules
and Humic Acid on the Aggregation Kinetics of Single-Walled Carbon Nanotubes.
Environ Sci Technol 2010, 44, (7), 2412-2418.
63. Hyung, H.; Kim, J. H., Natural Organic Matter (Nom) Adsorption to Multi-
Walled Carbon Nanotubes: Effect of Nom Characteristics and Water Quality Parameters.
Environ Sci Technol 2008, 42, (12), 4416-4421.
64. Wang, P.; Shi, Q.; Liang, H.; Steuerman, D. W.; Stucky, G. D.; Keller, A. A.,
Enhanced Environmental Mobility of Carbon Nanotubes in the Presence of Humic Acid
and Their Removal from Aqueous Solution. Small 2008, 4, (12), 2166-2170.
65. Smith, B. Y., Jin; Bitter, Julie; Ball, William; Fairbrother, D. Howard;,
Influence of Surface Oxygen on the Interactions of Carbon Nanotubes with Natural
Organic Matter. Environ Sci Technol 2012.
66. Smith, B.; Wepasnick, K.; Schrote, K. E.; Bertele, A. H.; Ball, W. P.; O'melia,
C.; Fairbrother, D. H., Colloidal Properties of Aqueous Suspensions of Acid-Treated,
Multi-Walled Carbon Nanotubes. Environ Sci Technol 2009, 43, (3), 819-825.
67. Langley, L. A.; Fairbrother, D. H., Effect of Wet Chemical Treatments on the
Distribution of Surface Oxides on Carbonaceous Materials. Carbon 2007, 45, (1), 47-54.
68. Langley, L. A.; Villanueva, D. E.; Fairbrother, D. H., Quantification of
Surface Oxides on Carbonaceous Materials. Chem Mater 2006, 18, (1), 169-178.
69. Wepasnick, K. A.; Smith, B. A.; Schrote, K. E.; Wilson, H. K.; Diegelmann, S.
R.; Fairbrother, D. H., Surface and Structural Characterization of Multi-Walled Carbon
Nanotubes Following Different Oxidative Treatments. Carbon 2011, 49, (1), 24-36.
112
70. Cho, H.-H.; Smith, B. A.; Wnuk, J. D.; Fairbrother, D. H.; Ball, W. P.,
Influence of Surface Oxides on the Adsorption of Naphthalene onto Multiwalled Carbon
Nanotubes. Environmental Science & Technology 2008, 42, (8), 2899-2905.
71. Smith, B.; Wepasnick, K.; Schrote, K. E.; Cho, H.-H.; Ball, W. P.; Fairbrother,
D. H., Influence of Surface Oxides on the Colloidal Stability of Multi-Walled Carbon
Nanotubes: A Structure-Property Relationship Langmuir 2009, 25, (17), 9767-9776.
72. Litton, G. M.; Olson, T. M., Colloid Deposition Rates on Silica Bed Media
and Artifacts Related to Collector Surface Preparation Methods. Environ Sci Technol
1993, 27, (1), 185-193.
73. Grolimund, D.; Elimelech, M.; Borkovec, M.; Barmettler, K.; Kretzschmar, R.;
Sticher, H., Transport of in Situ Mobilized Colloidal Particles in Packed Soil Columns.
Environ Sci Technol 1998, 32, (22), 3562-3569.
74. Kasel, D.; Bradford, S. A.; Simunek, J.; Heggen, M.; Vereecken, H.; Klumpp,
E., Transport and Retention of Multi-Walled Carbon Nanotubes in Saturated Porous
Media: Effects of Input Concentration and Grain Size. Water Res 2013, 47, (2), 933-944.
75. Tian, Y.; Gao, B.; Wang, Y.; Morales, V. L.; Carpena, R. M.; Huang, Q. G.;
Yang, L. Y., Deposition and Transport of Functionalized Carbon Nanotubes in Water-
Saturated Sand Columns. J Hazard Mater 2012, 213, 265-272.
76. Mattison, N. T.; O'carroll, D. M.; Rowe, R. K.; Petersen, E. J., Impact of
Porous Media Grain Size on the Transport of Multi-Walled Carbon Nanotubes. Environ
Sci Technol 2011, 45, (22), 9765-9775.
77. Sulpizi, M.; Gaigeot, M. P.; Sprik, M., The Silica-Water Interface: How the
Silanols Determine the Surface Acidity and Modulate the Water Properties. J Chem
Theory Comput 2012, 8, (3), 1037-1047.
78. Chen, C. L.; Wang, X. K., Adsorption of Ni(Ii) from Aqueous Solution Using
Oxidized Multiwall Carbon Nanotubes. Ind Eng Chem Res 2006, 45, (26), 9144-9149.
79. Briggs, J. C.; Ficke, J. F., Quality of Rivers of the United States, 1975 Water
Year: Based on the National Stream Quality Accounting Network (Nasqan). U.S.
Geological Survey: 1977.
80. Mayer, L. M., Extent of Coverage of Mineral Surfaces by Organic Matter in
Marine Sediments. Geochimica Et Cosmochimica Acta 1999, 63, (2), 207-215.
113
Chapter 4. Transport of Oxidized Multi-Walled Carbon
Nanotubes through Silica Based Porous Media: Investigation
of Removal Mechanisms and Mathematical Modeling
ABSTRACT
To better understand the nature of oxidized multi-walled carbon nanotube (O-MWCNT)
interaction with the surfaces of silica glass bead collectors, additional transport studies
were conducted with special focus on removal mechanism. These studies included both
investigations of velocity effects on deposition rate under pulse-input conditions and
investigations of spatial distribution of O-MWCNTs through column dissection under
step-input conditions. For studies of the effect of approach velocity on the estimated
deposition rate coefficient, kd, the mathematical relationship between kd and approach
velocity followed expectations of interception theory, which would be consistent with the
notion that, for purposes of collision prediction, O-MWCNTs effectively occupy a
spherical volume with a diameter on the order of the CNT length. Other experiments
were conducted with a step-input approach to allow examination of in-situ concentrations
of O-MWCNTs and better understand deviations from conventional clean-bed filtration
theory (CBFT). Both breakthrough curves (BTCs) and retention profiles at five different
ionic strengths (IS) were analyzed. Although the trends of the experimental observations
followed the general expectations from traditional theory based on electrostatic
interactions, the BTCs as well as retention profiles exhibited features that could not be
quantitatively well explained by simple CBFT, including BTC plateaus that either
114
increased (low IS) or decreased (high IS) with time as well as hypo-exponential decay in
spatial profiles of retained particles. Modified models incorporating terms for straining,
site-blocking, and multilayer deposition effects were applied to simulate experimental
results that deviated from simple CBFT and to investigate the mechanisms of O-
MWCNT removal. Results showed that all of the additional terms were needed in order
to explain the full set of data, although there were conditions under which one or more of
the terms could be neglected.
4.1 Introduction
As illustrated by the O-MWCNT transport studies described in Chapter 3,
observation of breakthrough curves in laboratory columns can be an effective approach to
study the movement of particulate and dissolved contaminants through porous media, and
thus to better understand their transport in groundwater systems.1-8
One important reason
for the widespread use of breakthrough curves in transport studies is that they are
comparatively straight forward to conduct and usually require less analytical effort than
other methods of observation, such as direct imaging of in-situ concentrations9, 10
or post-
experiment dissection for measurement of in-situ solid concentrations.4, 8, 11
Moreover, it
is also usually the case that aqueous-phase concentrations of contaminants can be
measured with greater sensitivity and accuracy than in-situ solid concentrations, which
facilitates quantitative interpretation of results. On the other hand, breakthrough
experiments provide no direct observation of the collector-contaminant interaction at the
physical locations of removal within the column, but only provide information regarding
the rate at which the contaminants enter and leave the porous media. By contrast, direct
observations of retained contaminants can provide valuable additional information

115
regarding their in-column distribution. Consequently, column dissection is sometimes
applied in conjunction with transport experiments to gather more information and enable
a more mechanistically based analysis of results.4, 8, 11-14
When the column dissection approach is used with colloidal transport experiments,
columns are cut into small segments, each of which is separately analyzed to obtain the
amount (usually mass) of deposited particles. The amount of particles for each segment is
usually normalized by the mass of the collectors in the segment to calculate a solid-phase
concentration (mass/mass), which is then plotted with respect to the distance of the
segment location from the column inlet. The resulting plot, called a retention profile or
spatial distribution profile, exhibits the distribution of deposited particles after the
completion of an experiment and can shed light on the deposition mechanism. Compared
to methods such as direct imaging, column dissection does not require advanced
detection instruments such as high resolution microscopy, but still provides abundant
information regarding the behavior of colloidal particles in the porous media.
Many prior publications have reported on investigations of the transport of
engineered nanomaterials through porous media, including some that were conducted
using column dissection.4, 8, 11, 13, 15
For example, Wang et al.8 analyzed retention profiles
of 4-ethoxybenzoic acid functionalized MWCNTs through saturated media composed of
quartz sands. The authors found that the amount of deposited MWCNTs was
exceptionally high at the column inlet and postulated that the effects of straining were
significant.8 Li et al.
11 used porous media composed of quartz sands to examine the
breakthrough curves and retention profiles of C60. They observed phenomena consistent
with their hypothesis of a site-blocking mechanism, i.e., that some of the most favorable
116
sites for deposition were of limited quantity and were blocked against further deposition
once they were initially occupied. Lanphere et al.13
investigated the fate of graphene
oxide nanoparticles (GONPs) through packed bed columns at varied ionic strengths (IS)
by using transport experiments. Mass balances and column dissections revealed that as
concentrations of KCl increased from 0.01 to 0.1 M, the portion of GONPs retained
within the media increased from 5% to 100%, the majority of which were retained within
the first centimeter of the column.
To more quantitatively interpret experimental results, test their understanding and
make predictions of as yet untested circumstances, investigators and engineers often use
mathematical representations (i.e., quantitative simulation models) of the underlying
physical and chemical processes of transport. Such models are usually solved through
computer-based analysis and can be used to obtain additional understanding of system
properties. Such computer modeling has been widely used in the interpretation of
colloidal particle transport.
In the context of aquatic particle transport through beds of porous media, Yao et
al.16
were among the first to apply clean-bed filtration theory (CBFT) to data
interpretation. Focus of the study was on physical mechanisms of collision in terms of
“single collector contact efficiencies” (η0). In addition, the authors also applied the
Derjaguin-Landau-Verwey-Overbeek (DLVO) theory17-19
in an effort to understand
particle-particle forces that were not incorporated into the physical collector efficiency
term. The effects of such interactions were instead lumped into a separate term, called
the “sticking probability” or “attachment efficiency” (α).

117
Since the early work of Yao et al.16
, numerous improvements of the clean bed
filtration (CBF) model have been proposed and applied to simulate the transport of
colloidal particles in porous media.5, 16, 20, 21
In their own work, Yao et al.16
, provided
individual analytical solutions for single collector contact efficiencies caused by diffusion
(ηD), interception (ηI), and sedimentation (ηG). They also proposed that the numerical
solution of the total single-collector contact efficiency (η0) can be approximated as the
sum of the solutions for the three primary mechanisms.16
In 1976, Rajagopalan and Tien
improved Yao’s equation by developing a semi-empirical correlation equation for η0.20
In
2004, Tufenkji and Elimelech further improved the equation by including additional
particle-removal mechanisms and interaction forces, such as the previously omitted
hydrodynamic and van der Waals interactions, into their calculation of η0, thereby
providing a more accurate solution.21
In addition to the traditional CBFT, other researchers have provided additional
mathematical expressions in efforts to mechanistically account for observations in
experiments where the clean bed assumption appeared not to hold.6, 7, 22-31
For example,
Bradford et al. 23
added a first order straining rate coefficient, kstr, together with a depth-
dependent term in the convection-diffusion equation to address the straining effect.
Tufenkji et al.24
developed a power law distribution of the deposition rate coefficient kd
into the CBFT to model a hyper-exponential retention profile of bacteria in glass beads.
Ryde et al.29, 31
applied a multilayer deposition model to study the transport of uniform
spherical hematite particles through glass beads, reporting that their model was successful
in fitting the breakthrough curves obtained at varied ionic strength (IS) and that
multilayer deposition was only significant at high IS conditions.

118
Despite abundant research on traditional colloidal particles such as soil-mobilized
colloids or latex particles22, 32-36
, it is still challenging to estimate the aquatic movement
of complex colloids including many engineered nanomaterials, such as carbon nanotubes
(CNTs), fullerenes, and quantum dots, owing to their unique shapes and/or extremely
high aspect ratios. In these cases, new modeling approaches are needed, as may be
obtained either by altering existing models or proposing new ones.
Several research groups have attempted to explain experimental results with
engineered nano-particles (ENPs) through modification of traditional models. Liu et al.5
applied traditional CBF model in conjunction with site-blocking and detachment terms to
model the breakthrough of sulfuric/nitric acid treated MWCNTs through quartz sand
columns. The authors also took the non-spherical shape of MWCNTs into consideration
and re-calculated the single collector efficiency by revising all three contact efficiencies
(ηI, ηG, and ηD).5 This calculation was conducted using the assumption that dispersed
MWCNTs existed in water flow in a form similar to cylindrically shaped rods that can
come into contact with collectors by means of end-on or side-on interactions.5 This model
was able to provide good agreement with the experimental observations, using only
attachment efficiency α and maximum solid concentration (or maximum adsorption
capacity of the solid phase according to the authors) as fitting parameters for the model.5
Wang et al.8 also successfully applied a modified CBF model to model their transport
experimental results for the transport of 4-ethoxybenzoic acid functionalized MWCNTs
through porous media composed of Ottawa sands, including breakthrough curves and
retention profiles. Their modified version included additional terms for a straining rate
coefficient and time-dependent site-blocking kinetics, as well as a nanotube shape factor.

119
Li et al.11
used a mathematical model incorporating non-equilibrium attachment kinetics
and a maximum retention capacity to simulate the effluent breakthrough curves and
retention profiles obtained by passing C60 through columns packed with quartz sands.
Their attachment efficiencies, estimated from fitted attachment rate coefficients, were
more than one order of magnitude larger than the theoretical attachment efficiencies
computed from DLVO theory.11
Similar issues had been observed previously with latex
particles by O’melia et al.[ref]. Li et al. followed Elemelech and O’melia to postulate that
this discrepancy was due to the patch-wise surface charge heterogeneity on the sand
grains.11
[ref] More investigations are still needed to better estimate the transport behavior
of engineered nanoparticles (ENPs) in porous media. In comparison with prior studies on
the transport of more traditional colloidal particles, there are as yet few studies focused
on ENPs.
In this work, transport of 7.1% O-MWCNTs through columns packed with glass
beads was investigated and analyzed by both of the previously discussed methods:
breakthrough curves and retention profiles. A conventional CBF model, as well as
modified models incorporating straining, site-blocking, and multilayer deposition terms
were applied to simulate experimental results and investigate the mechanisms of O-
MWCNT removal.
4.2 Experimental Methods
4.2.1 Surface Oxidation, Characterization, and Preparation of Colloidal O-
MWCNTs.
MWCNTs (15 ± 5 nm diameter, 1 - 5 µm length) purchased from NanoLabs, Inc.
(Waltham, MA) were used in this study. The oxidation and characterization processes for
120
these materials, as well as details for the preparation of O-MWCNT colloidal dispersions
have been described in previous work.37-44
To summarize, oxidized MWCNTs (O-
MWCNTs) were prepared by refluxing in 53% w/w HNO3, followed by an additional
base purification process. X-ray photoelectron spectroscopy (XPS) (PHI 5400 system) in
conjunction with chemical derivatization45, 46
was employed to characterize the resulting
O-MWCNTs and obtain total surface oxygen concentrations, as well as the distribution of
oxygen-containing functional groups. To prepare O-MWCNT stock dispersions, a small
amount of O-MWCNTs (~ 4 mg) was added into ~ 200 mL de-ionized (DI) water and
sonicated (Branson 1510, 70 W) for 20 hours. The suspension was then subjected to
repeated centrifugation cycles (1000 rpm, 5 min) to remove any un-dispersed O-
MWCNTs bundles and glass particles etched from the wall of the flask during sonication.
An additional sonication (5 min) of the supernatant was conducted afterward to further
disperse some bundled O-MWCNTs that may have remained suspended. Dynamic light
scattering (DLS) was employed to measure the hydrodynamic diameters of O-MWCNTs
in stock suspensions.
4.2.2 Preparation of Glass Beads and Packed Columns.
Columns with diameters of 2.5 cm and lengths of 5.2 cm or 10.2 cm were
prepared using soda lime glass spheres (0.355 - 0.425 mm, MO-SCI Corporation) as
model collectors. Details regarding preparation of glass beads and column packing were
the same as for the studies described in Chapter 3. The careful cleaning and preparation
were necessary in order to achieve good reproducibility. Mild sonication of glass spheres
in base (0.1 M NaOH), acid (1 M HNO3), and de-ionized (DI) water was performed both
upon receipt and again immediately prior to use. A wet-pack method was used during
121
column assembly, maintaining the porosity of columns at 0.38 and the pore volume at 9.7
cm3
(short column) or 19.0 cm3 (long columns). The porosity of the porous media in each
packed column was calculated based on the quartz column inner diameter, the weight of
packed glass beads, and the column length.
4.2.3 Transport Experiments
Transport experiments were conducted using a dual-pump system as described
earlier. (See Chapter 3) Pulse-input and step-input methods were used to study O-
MWCNTs deposition onto model collectors. Pulse-input experiments use a smaller total
mass of O-MWCNT particles so that the conditions for clean bed filtration can be more
easily maintained. Step-input experiments use a much greater volume of O-MWCNT
suspension and therefore more O-MWCNTs are retained in the column at a specific
background electrolyte concentration. A higher solid concentration of O-MWCNTs
within the column is necessary to obtain the retention profile within each column after
each transport experiment.
a. Pulse-input method.
The pulse-input method was employed in the study described in this chapter to
analyze the effect of flow-rate on O-MWCNT deposition. During a pulse-input
experiment, two separate feed solutions, one containing DI water (“line I”) and another
containing sodium chloride background electrolyte solution (“electrolyte line”) were
pumped into the column at a constant flow rate by two separate peristaltic pumps
operating in parallel. In each experiment, both feed lines were kept at identical and
constant flow-rates. Among the various experiments, these flows ranged between 0.5
mL/min and 7 mL/min to achieve a final total flow rate of 1 mL/min to 14 mL/min for
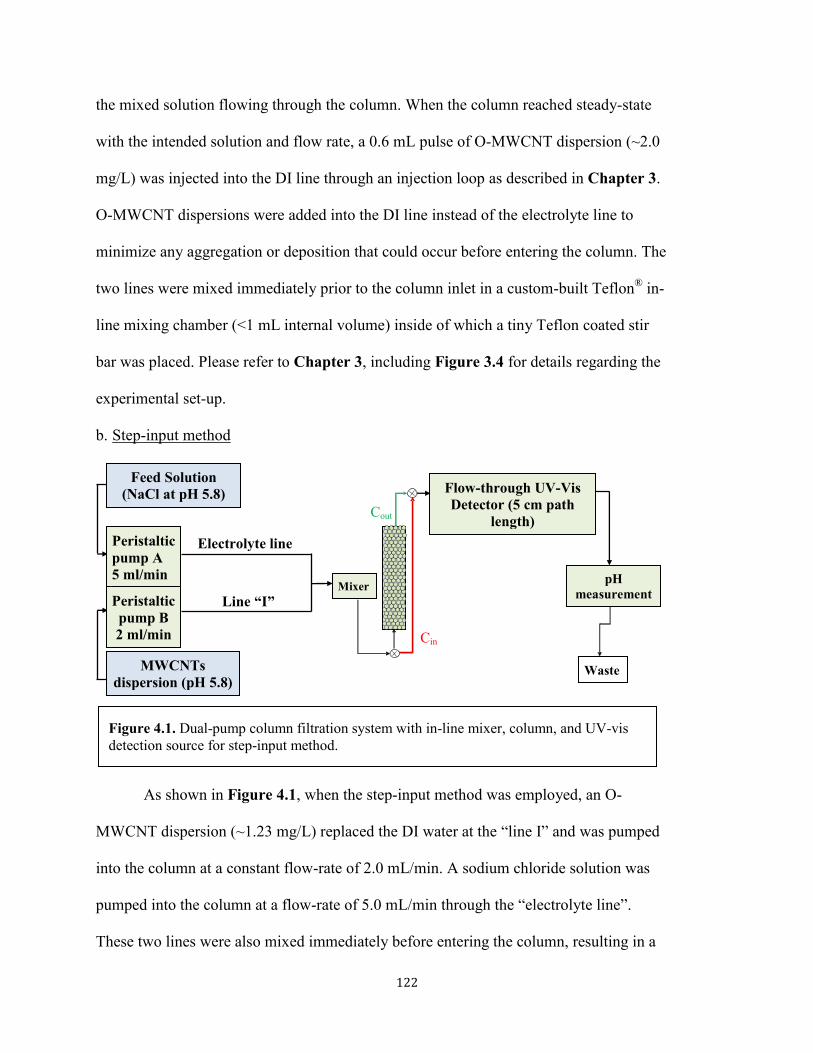
122
the mixed solution flowing through the column. When the column reached steady-state
with the intended solution and flow rate, a 0.6 mL pulse of O-MWCNT dispersion (~2.0
mg/L) was injected into the DI line through an injection loop as described in Chapter 3.
O-MWCNT dispersions were added into the DI line instead of the electrolyte line to
minimize any aggregation or deposition that could occur before entering the column. The
two lines were mixed immediately prior to the column inlet in a custom-built Teflon®
in-
line mixing chamber (<1 mL internal volume) inside of which a tiny Teflon coated stir
bar was placed. Please refer to Chapter 3, including Figure 3.4 for details regarding the
experimental set-up.
b. Step-input method
As shown in Figure 4.1, when the step-input method was employed, an O-
MWCNT dispersion (~1.23 mg/L) replaced the DI water at the “line I” and was pumped
into the column at a constant flow-rate of 2.0 mL/min. A sodium chloride solution was
pumped into the column at a flow-rate of 5.0 mL/min through the “electrolyte line”.
These two lines were also mixed immediately before entering the column, resulting in a
Electrolyte line
Line “I”
Figure 4.1. Dual-pump column filtration system with in-line mixer, column, and UV-vis
detection source for step-input method.
Flow-through UV-Vis
Detector (5 cm path
length)
pH
measurement
Waste
Feed Solution
(NaCl at pH 5.8)
Peristaltic
pump A
5 ml/min
MWCNTs
dispersion (pH 5.8)
Peristaltic
pump B
2 ml/min
Mixer
Cout
Cin
123
final concentration of 0.35 mg/L O-MWCNTs. The O-MWCNT dispersions were passed
through columns for a prescribed amount of time ranging from 10-28 pore volumes fed
(PVF). The length of the feeding time was chosen based on the availability of the O-
MWCNT stock dispersion and the background ionic strength. For BTCs with increasing
plateaus (low IS), the O-MWCNT dispersion was fed until a flat plateau was obtained or
the dispersion stock was emptied. For BTCs with decreasing plateaus (high IS), a lower
PVF was selected to avoid the plateaus from decreasing to the same level of system noise,
so that features of the BTCs could be better captured. Afterwards, DI water without O-
MWCNTs was pumped through “line I” at the same flow rate while electrolyte pumping
continued as before. This was maintained for another five pore volumes (PV).
All solutions or dispersions used in this study were equilibrated with ambient
atmosphere before use so as to keep the pH at 5.8 ± 0.2 without the addition of any
buffering agent. Before each experiment, columns were conditioned with DI water and
then background electrolyte, each for 20 pore volumes. As described previously
(Chapter 3), sodium nitrate was used as a pulse-input tracer for selected columns in
order to obtain independent information about residence time distribution and hydraulic
dispersivity.
O-MWCNT dispersions exiting the columns were passed through a 5 cm light
path flow-through quartz cell (Starna Cells, Inc.) and detected using UV-Vis (Cary 50) at
270 nm; NaNO3 tracers were measured at 302 nm. The pH of the effluent was measured
to be 5.8 ± 0.2 throughout all experiments. Two preliminary runs, one using only DI
water and no electrolyte (“DI” run) and another “bypass” run that circumvented the
column completely, were conducted prior to each O-MWCNT breakthrough experiment

124
as described in our previous study (see Chapter 3). For column experiments conducted
with the pulse-input method, “DI” and “bypass” runs were performed using identical
volumes of O-MWCNT dispersions to those used in the experimental runs under the
designated background electrolyte concentration and both preliminary test yielded 100%
mass balance (±5%) (see Chapter 3). For consistency, the mass of O-MWCNTs
estimated from “bypass” run (Mbypass) was used as the injected mass (MI) in the data
analysis. For column experiments conducted with the step-input method, however, both
“DI” and “bypass” runs were performed for only five PVF, i.e., the O-MWCNT
dispersion was passed through the system for 5 PVF before switching to DI water. The
injected mass (MI) for each experiment was then calculated by multiplying the mass
estimated from the corresponding bypass run (Mbypass) by the ratio of feed times (in PVF).
Details of the normalization are provided in Eq. 4.1 below,
bypass
expt
bypassIPVF
PVFMM
Eq. 4.1
where MI [M] is the injected mass of O-MWCNTs in the actual transport experiment;
Mbypass [M] is the mass of O-MWCNTs estimated from the bypass run; PVFex is the total
number of pore volumes fed in the actual experiment, and PVFbypass is the total number of
pore volumes fed in the bypass run.
For the pulse-input and step-input method, as with the pulse-input method, the
mass of O-MWCNTs recovered from the effluent in “DI” runs was reproducible and
similar to the mass obtained in bypass runs (mass balance is 95% - 105%).
4.2.4 Dissection of Columns
To promote further understanding of the deposition properties of O-MWCNTs,
the amount of O-MWCNTs deposited on each unit mass of glass spheres was obtained by

125
analyzing the O-MWCNT retention profile after each step-input transport experiment
through dissection of the column. As previously mentioned, the step-input method was
used in these experiments to increase the recoverable amount of deposited O-MWCNTs.
After completion of a transport experiment, the column was kept vertical while the
stopper and stainless steel screen at the bottom of the column was removed. The stopper
at the top of the column was kept in place during this process and a feed solution of the
same background electrolyte concentration as the one used during the transport
experiment was then pumped into the column from the top at a flow rate of 1 mL/min.
The in-flowing water did not flow through the porous media, but rather created a region
of high pressure at the top of the column that served to push the glass beads downward
without distorting their relative position or affecting the deposited O-MWCNTs’
locations relative to the beads. Glass beads pushed out of the column were collected in
0.25- to 0.5-cm increments as they emerged from the bottom end by slicing the beads
with a thin-edged razor blade. These samples were then stored in small 20-mL screw-cap
vials for analysis.
To determine the quantity of CNTs deposited during a transport experiment, the
collected samples of O-MWCNT-laden glass beads were first immersed in 3 mL of 1%
Triton X100 solution and shaken for 3 hours. The supernatant was then transferred into
another clean vial and sonicated for 10 min to ensure that all the O-MWCNTs were
dispersed. After sonication the solutions were injected into the 5-cm path-length cell and
scanned using UV-Vis over the wavelength range of 200 nm to 900 nm. As shown in
Figure 4.2, the O-MWCNT concentration in a
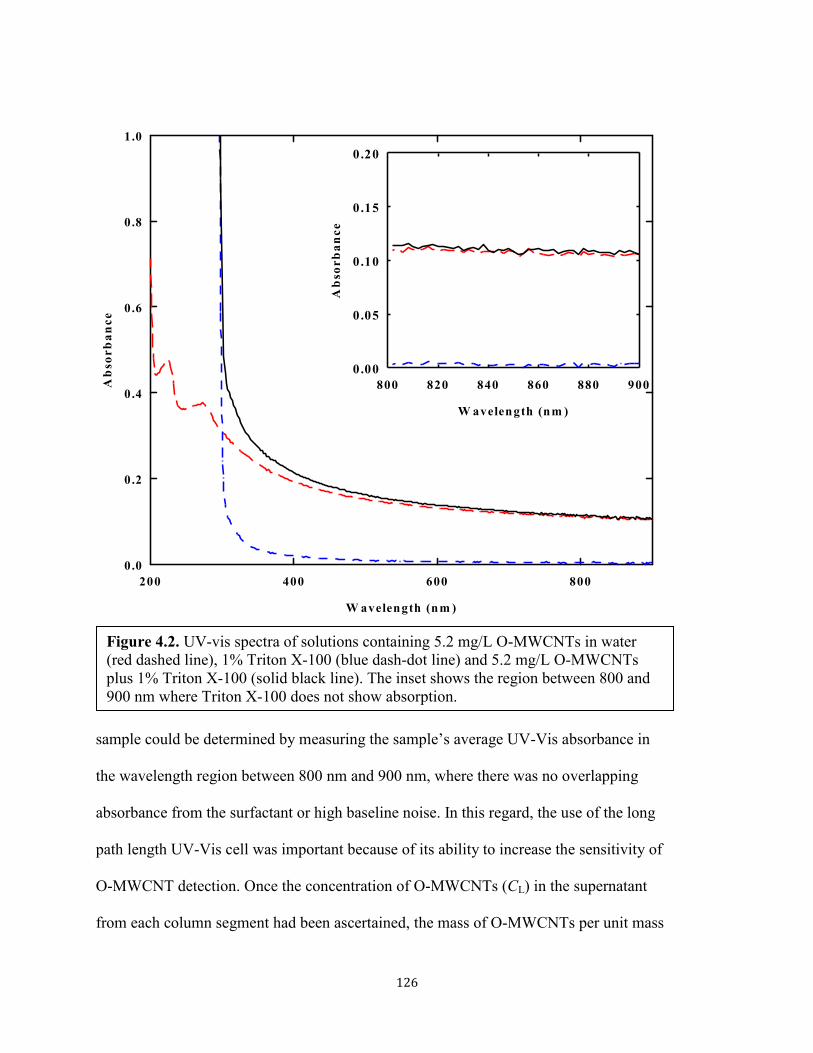
126
sample could be determined by measuring the sample’s average UV-Vis absorbance in
the wavelength region between 800 nm and 900 nm, where there was no overlapping
absorbance from the surfactant or high baseline noise. In this regard, the use of the long
path length UV-Vis cell was important because of its ability to increase the sensitivity of
O-MWCNT detection. Once the concentration of O-MWCNTs (CL) in the supernatant
from each column segment had been ascertained, the mass of O-MWCNTs per unit mass
Figure 4.2. UV-vis spectra of solutions containing 5.2 mg/L O-MWCNTs in water
(red dashed line), 1% Triton X-100 (blue dash-dot line) and 5.2 mg/L O-MWCNTs
plus 1% Triton X-100 (solid black line). The inset shows the region between 800 and
900 nm where Triton X-100 does not show absorption.
W avelength (nm )
200 400 600 800
Ab
so
rb
an
ce
0 .0
0.2
0.4
0.6
0.8
1.0
W avelength (nm )
800 820 840 860 880 900
Ab
so
rb
an
ce
0.00
0.05
0.10
0.15
0.20
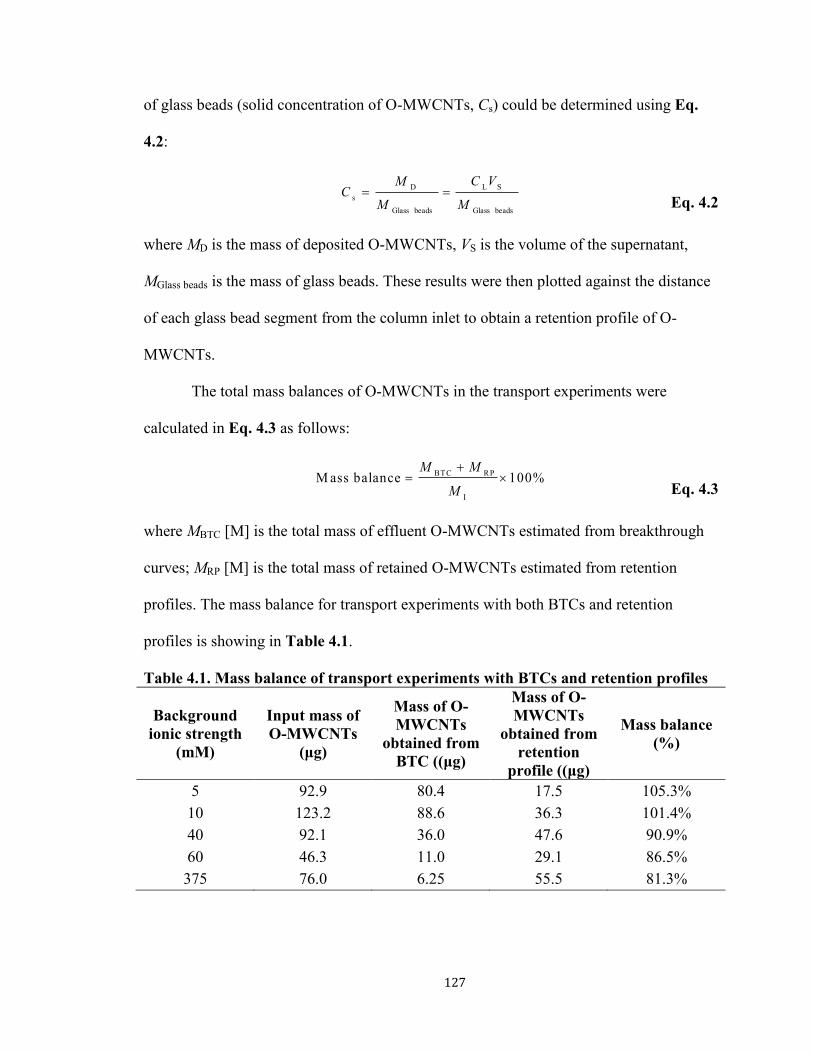
127
of glass beads (solid concentration of O-MWCNTs, Cs) could be determined using Eq.
4.2:
beads Glass
SL
beads Glass
D
sM
VC
M
MC
Eq. 4.2
where MD is the mass of deposited O-MWCNTs, VS is the volume of the supernatant,
MGlass beads is the mass of glass beads. These results were then plotted against the distance
of each glass bead segment from the column inlet to obtain a retention profile of O-
MWCNTs.
The total mass balances of O-MWCNTs in the transport experiments were
calculated in Eq. 4.3 as follows:
BTC RP
I
M ass balance 100%M M
M
Eq. 4.3
where MBTC [M] is the total mass of effluent O-MWCNTs estimated from breakthrough
curves; MRP [M] is the total mass of retained O-MWCNTs estimated from retention
profiles. The mass balance for transport experiments with both BTCs and retention
profiles is showing in Table 4.1.
Table 4.1. Mass balance of transport experiments with BTCs and retention profiles
Background
ionic strength
(mM)
Input mass of
O-MWCNTs
(μg)
Mass of O-
MWCNTs
obtained from
BTC ((μg)
Mass of O-
MWCNTs
obtained from
retention
profile ((μg)
Mass balance
(%)
5 92.9 80.4 17.5 105.3%
10 123.2 88.6 36.3 101.4%
40 92.1 36.0 47.6 90.9%
60 46.3 11.0 29.1 86.5%
375 76.0 6.25 55.5 81.3%
128
4.3 Interpretive Models and Quantitative Analysis
4.3.1 Estimation of Dispersion in the Column System
a. Exclusion of dispersion introduced by flow-through cuvette
Breakthrough curves in transport experiments were obtained by monitoring a
5-cm flow-through cuvette. The flow-through cuvette is a chamber with an inner volume
of ~1.2 mL. Given that the total flow-rate was 7 mL/min for all experiments except those
conducted to investigate velocity effects, it is reasonable to assume that the cuvette acted
as a completely mixed flow reactor. With the assumption that no dead space was present
in the reactor, the relationship between concentrations in the influent to the cuvette (Cin)
and the effluent from the cuvette (Ce) would be expressed by Eq. 4.4,
)()()(
ein
etQCtQCV
dt
tdC
Eq. 4.4
where Q [L3/T] is the volumetric flow-rate in experiments and V [L
3] is the volume in the
flow-through cuvette.
The effect of the flow-through cuvette on the breakthrough curves can then be
corrected using a numerical simulation method as shown in Eq. 4.5 as follows:
Vt
CQCQC
e
avee,avein,
Eq. 4.5
where 2
)()(,
ttCtCC
inin
avein
,
2
)()(,
ttCtCC
ee
avee
.
b. Estimation of diffusion coefficient using tracer breakthrough curves
As mentioned above, NaNO3 was occasionally employed as a tracer to explore the
hydrodynamic characteristics of the columns used in this study. Since O-MWCNT
breakthrough in the “DI” run were found to exhibit shapes identical to those in the tracer
runs (Figure 3.6 in Chapter 3) and since such DI runs were conducted prior to every

129
column experiment and showed excellent mass balance, breakthrough curves from these
“DI” runs were used to estimate the dispersion coefficient, D, for each column. The one-
dimensional convection-diffusion equation for inert compounds (i.e., no decay or
production processes during transport)36
used for the simulation is shown in Eq. 4.6,
x
txCv
x
txCD
t
txC
),(),(),(
2
2
Eq. 4.6
where C(x, t) [M/L3] stands for the aqueous concentration of O-MWCNT at time t [T] in
a water parcel whose distance from the column inlet is x [L]; D [L2/T] is the
hydrodynamic dispersion coefficient; and v [L/T] is the pore water velocity. The effluent
concentration of O-MWCNTs from a column with fixed length L at time t after a dirac
pulse-input method can then be expressed in Eq. 4.7 by solving for Eq. 4.6,47
Dt
vtL
Dt
LCtC
4
)exp)(
2
30
(
Eq. 4.7
where C0 [M/L3] is a characteristic concentration defined as M0/Vpore; M0 [M] is the
injected mass of O-MWCNTs in the transport experiment, which is recovery from the
bypass experiment; Vpore is the aqueous pore volume within the column [L3]; τ is the
mean hydraulic retention time (τ = Vpore/Q, [T], where Q is the volumetric flow rate of the
feed solution [L3/T]); and L is the column length [L]. The dispersion coefficient D for
transport experiments using pulse-input method can then be estimated by fitting
breakthrough curves from “DI” runs with Eq. 4.7. At a flow-rate of 7 mL/min, ten
breakthrough curves obtained from columns of each length (5.2 cm or 10.2 cm) were fit
to obtain the average value of D in order to ensure the most accuracy. Since the
hydrodynamic dispersion coefficient D is identical for columns with identical physical
characteristics at identical flow-rates, the values of D obtained from pulse-input method
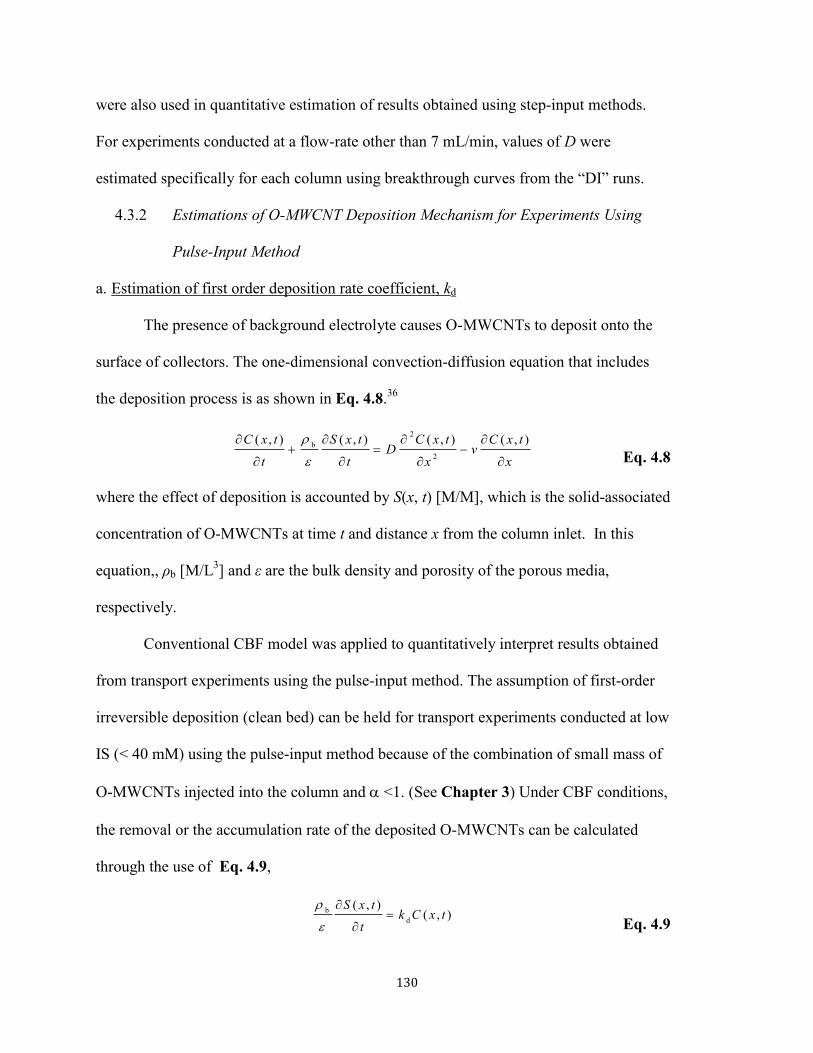
130
were also used in quantitative estimation of results obtained using step-input methods.
For experiments conducted at a flow-rate other than 7 mL/min, values of D were
estimated specifically for each column using breakthrough curves from the “DI” runs.
4.3.2 Estimations of O-MWCNT Deposition Mechanism for Experiments Using
Pulse-Input Method
a. Estimation of first order deposition rate coefficient, kd
The presence of background electrolyte causes O-MWCNTs to deposit onto the
surface of collectors. The one-dimensional convection-diffusion equation that includes
the deposition process is as shown in Eq. 4.8.36
x
txCv
x
txCD
t
txS
t
txC
),(),(),(),(
2
2
b
Eq. 4.8
where the effect of deposition is accounted by S(x, t) [M/M], which is the solid-associated
concentration of O-MWCNTs at time t and distance x from the column inlet. In this
equation,, ρb [M/L3] and ε are the bulk density and porosity of the porous media,
respectively.
Conventional CBF model was applied to quantitatively interpret results obtained
from transport experiments using the pulse-input method. The assumption of first-order
irreversible deposition (clean bed) can be held for transport experiments conducted at low
IS (< 40 mM) using the pulse-input method because of the combination of small mass of
O-MWCNTs injected into the column and <1. (See Chapter 3) Under CBF conditions,
the removal or the accumulation rate of the deposited O-MWCNTs can be calculated
through the use of Eq. 4.9,
),(),(
d
btxCk
t
txS
Eq. 4.9
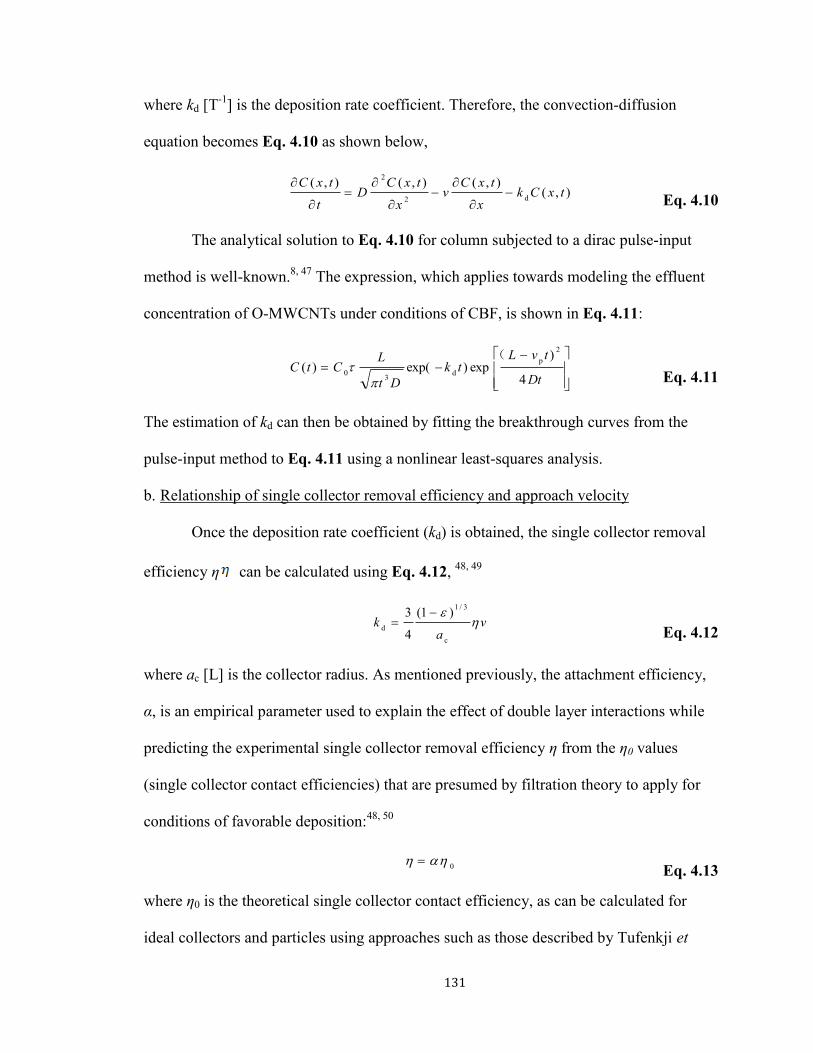
131
where kd [T-1
] is the deposition rate coefficient. Therefore, the convection-diffusion
equation becomes Eq. 4.10 as shown below,
),(),(),(),(
d2
2
txCkx
txCv
x
txCD
t
txC
Eq. 4.10
The analytical solution to Eq. 4.10 for column subjected to a dirac pulse-input
method is well-known.8, 47
The expression, which applies towards modeling the effluent
concentration of O-MWCNTs under conditions of CBF, is shown in Eq. 4.11:
Dt
tvLtk
Dt
LCtC
4
)exp)exp()(
2
p
d3
0
(
Eq. 4.11
The estimation of kd can then be obtained by fitting the breakthrough curves from the
pulse-input method to Eq. 4.11 using a nonlinear least-squares analysis.
b. Relationship of single collector removal efficiency and approach velocity
Once the deposition rate coefficient (kd) is obtained, the single collector removal
efficiency η can be calculated using Eq. 4.12, 48, 49
va
k
c
3/1
d
)1(
4
3
Eq. 4.12
where ac [L] is the collector radius. As mentioned previously, the attachment efficiency,
α, is an empirical parameter used to explain the effect of double layer interactions while
predicting the experimental single collector removal efficiency η from the η0 values
(single collector contact efficiencies) that are presumed by filtration theory to apply for
conditions of favorable deposition:48, 50
0
Eq. 4.13
where η0 is the theoretical single collector contact efficiency, as can be calculated for
ideal collectors and particles using approaches such as those described by Tufenkji et
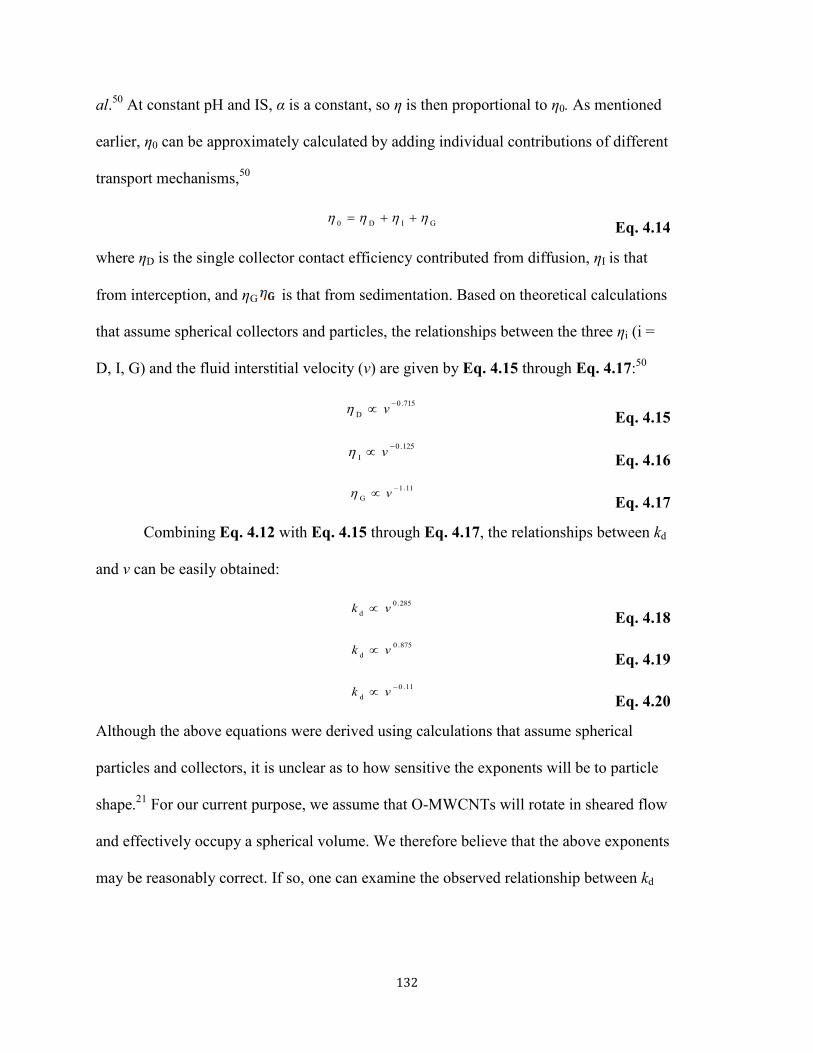
132
al.50
At constant pH and IS, α is a constant, so η is then proportional to η0. As mentioned
earlier, η0 can be approximately calculated by adding individual contributions of different
transport mechanisms,50
GID0
Eq. 4.14
where ηD is the single collector contact efficiency contributed from diffusion, ηI is that
from interception, and ηG is that from sedimentation. Based on theoretical calculations
that assume spherical collectors and particles, the relationships between the three ηi (i =
D, I, G) and the fluid interstitial velocity (v) are given by Eq. 4.15 through Eq. 4.17:50
715.0
D
v
Eq. 4.15
125.0
I
v
Eq. 4.16
11.1
G
v
Eq. 4.17
Combining Eq. 4.12 with Eq. 4.15 through Eq. 4.17, the relationships between kd
and v can be easily obtained:
285.0
dvk
Eq. 4.18
875.0
dvk
Eq. 4.19
11.0
d
vk
Eq. 4.20
Although the above equations were derived using calculations that assume spherical
particles and collectors, it is unclear as to how sensitive the exponents will be to particle
shape.21
For our current purpose, we assume that O-MWCNTs will rotate in sheared flow
and effectively occupy a spherical volume. We therefore believe that the above exponents
may be reasonably correct. If so, one can examine the observed relationship between kd

133
and v, to make a reasonable speculation in regard to the dominant mechanism(s) of the
transport behavior.
4.3.3 Quantitative Analysis for Results Obtained from Transport Experiments
Using Step-Input Method
When step-input methods are employed and injected amounts of O-MWCNTs are
much greater, the tenets of CBFT may no longer hold, even for the idealized and uniform
spherical beads used in this work. Under these circumstances, the mathematical
simulation of O-MWCNT removal can become much more complicated. In particular,
other mechanisms need to be taken into account and mathematically approximated in
order to explain the breakthrough curves and retention profiles obtained from
experiments using this method.
In this study, a numerical method was applied to quantitatively simulate and
analyze the breakthrough curves and retention profiles. Modification of the CBF model
involved applying additional terms to the transport equation (Eq. 4.10) and then using
numerically generated solutions under varied experimental conditions. Toward this end,
identical parameter sets were applied to the paired combinations of (1) temporal
breakthrough curve results and (2) final spatial profile of retained particles at the end of
the breakthrough test. As mentioned above, the value of D was obtained by analyzing
breakthrough curves obtained using pulse-input method at an identical flow-rate and
column lengths. The injected mass of O-MWCNTs was estimated from the “bypass” run
of each transport experiment.
Estimation of deposition rate and other mechanistic parameters of deposition were
then conducted by first simulating the BTC and retention profile with numerical

134
integration and then minimizing the combined errors between model simulations and data
for both the breakthrough and retention profile concentration results with optimization
routine. Optimization was achieved using the non-constrained optimization function fmin
in MATLAB, which achieves minimization based on golden section search parabolic
interpolation.51
Since the numbers of data points in breakthrough curves were much
greater than those in retention profiles, the objective function for optimization was the
sum of the weighted total error, in which the total relative squared error for breakthrough
curves and retention profiles were each divided by their sample sizes as a means of
weighting prior to combination.
a. CBF model
The conventional CBF model was the first one applied to analyze the step-based
breakthrough curves and retention profiles. The value of the deposition rate coefficient kd
was obtained by fitting Eq. 4.10 using the aforementioned weighted optimization method.
b. CBF model with additional site-blocking
As discussed subsequently, CBF modeling alone could only partially explain the
experimental results. One major case when the method failed was at low IS (< 40 mM),
where the BTCs showed increasing plateaus. The increasing plateaus seem to imply that
rates of deposition are decreasing over time, as might be associated with decreasing
availability of deposition sites. In this regard, it is possible that there is only limited
(finite) supply of the “preferred” cites at low IS. As previously discussed in Chapter 3,
the soda-lime glass beads used to simulate porous media contained ~15% impurities,
including magnesium oxides, calcium oxides, magnesium silicate, and other metal oxides
according to the manufacturer and shown in the TEM images (Figure 3.1). These

135
impurities are likely to be associated with heterogeneity of surface charge on the
collectors (glass beads), most of which are metal oxides as detected in the supernatant
after sonicating glass beads (Figure 3.1). In this regard, the intensive cleaning procedure
seemed to reduce the amount of metal oxides (Figure 3.1). and homogenize the collector
surface at least sufficiently for consistent results to be obtained for different batches of
collectors. Nonetheless, however, the relatively dilute acid was unable to completely
remove all impurity sites on the collector surface. A reasonable hypothesis may be that
experiments with the pulse-input method would be relatively less affected by these
heterogeneities than step-input experiments because of the much smaller amount of
injected O-MWCNTs with the pulse approach. In this regard, the hypothesis is that
deposition sites formed by metal oxides and silica could be mathematically simulated as
effectively “infinite” for the Dirac pulse experiment – that is, their concentrations are
sufficiently high as to be unaffected by “blocking.” With this reasoning, the assumption
of CBFT could be satisfied for the pulse experiments and a combined first-order
deposition rate coefficient would be obtained. By contrast, however, the step-input
method leads to injected amounts of O-MWCNTs that are 20 or more times greater than
those in the pulse-input methods such that the clean-bed assumption may no longer be
valid. In particular, one may speculate that the numbers of retained O-MWCNTs can be
sufficiently high as to effectively block some important fraction of the higher energy
deposition sites, as perhaps associated with iron and other metallic impurities on the
collector surface. This phenomenon has been reported in prior literature, some of which
has reported effective use of a site-blocking model to explain the effects.11, 22
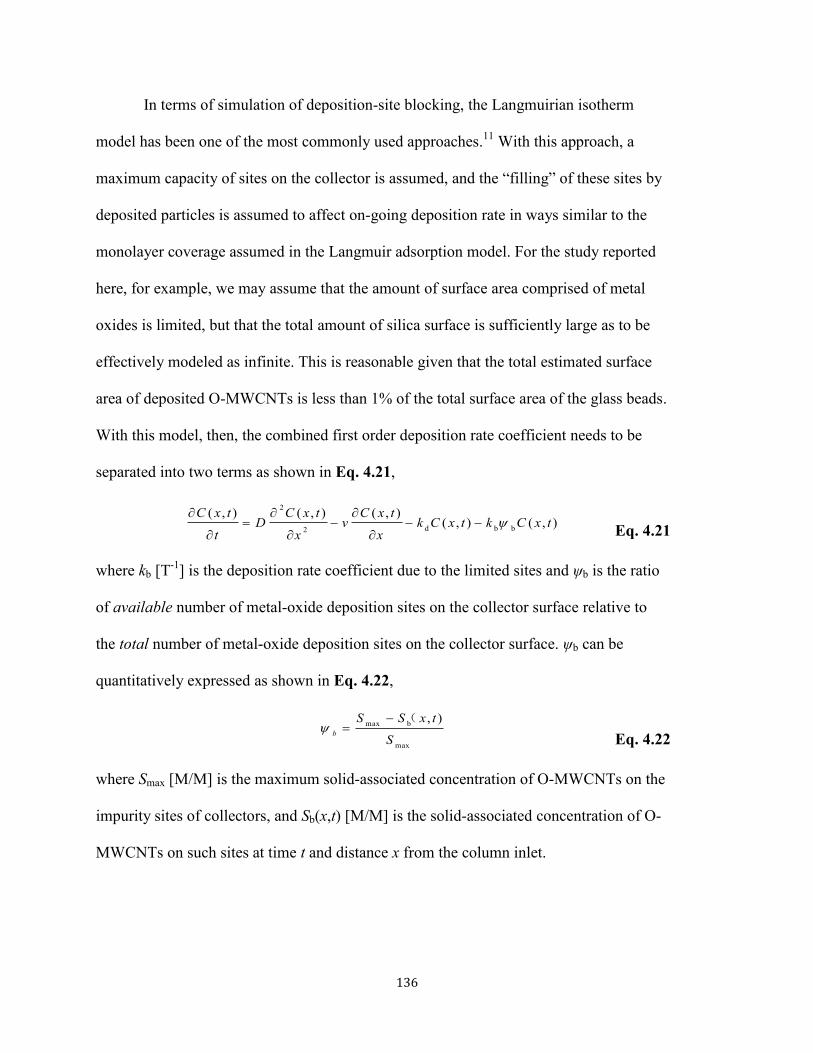
136
In terms of simulation of deposition-site blocking, the Langmuirian isotherm
model has been one of the most commonly used approaches.11
With this approach, a
maximum capacity of sites on the collector is assumed, and the “filling” of these sites by
deposited particles is assumed to affect on-going deposition rate in ways similar to the
monolayer coverage assumed in the Langmuir adsorption model. For the study reported
here, for example, we may assume that the amount of surface area comprised of metal
oxides is limited, but that the total amount of silica surface is sufficiently large as to be
effectively modeled as infinite. This is reasonable given that the total estimated surface
area of deposited O-MWCNTs is less than 1% of the total surface area of the glass beads.
With this model, then, the combined first order deposition rate coefficient needs to be
separated into two terms as shown in Eq. 4.21,
),(),(),(),(),(
bbd2
2
txCktxCkx
txCv
x
txCD
t
txC
Eq. 4.21
where kb [T-1
] is the deposition rate coefficient due to the limited sites and ψb is the ratio
of available number of metal-oxide deposition sites on the collector surface relative to
the total number of metal-oxide deposition sites on the collector surface. ψb can be
quantitatively expressed as shown in Eq. 4.22,
max
bmax),
S
txSSb
(
Eq. 4.22
where Smax [M/M] is the maximum solid-associated concentration of O-MWCNTs on the
impurity sites of collectors, and Sb(x,t) [M/M] is the solid-associated concentration of O-
MWCNTs on such sites at time t and distance x from the column inlet.

137
c. CBF model with additional straining effects
Due to the large aspect ratio of O-MWCNTs and their unique shape as one-
dimensional nanomaterials, it is likely that straining may occur. Moreover, the effects of
such straining may perhaps represent an even more important fraction of total removal
for step feed conditions, owing to the longer period of feed and a perhaps greater initial
accumulation of materials at the column inlet. Bradford et al.52
have reported that
straining was likely to occur within the first 20% of a column’s length and to diminish
with distance. In their later research, these authors proposed a straining term in addition
to the CBF model as shown in Eq. 4.23 below, which includes a first-order straining rate
coefficient and a factor related to the distance from column inlet:23
),(),(
),(),(),(ssd2
2
txCktxCkx
txCv
x
txCD
t
txC
Eq. 4.23
where ks [T-1
] is the straining rate coefficient and ψs [-] is a dimensionless colloid
straining function:
-
c
c
s
a
da
Eq. 4.24
Here, d is the distance from the porous medium (column) inlet, and β is a fitting
parameter controlling the shape of the colloid spatial distribution.
d. CBF model with additional ripening effects
The large aspect ratio of O-MWCNTs not only increases the likelihood of
straining after long-time feeding of O-MWCNT dispersions, but also increases the
tendency of interactions between deposited and dispersed O-MWCNTs. In particular, the
deposited O-MWCNTs may be likely to have a portion of their length extending out into

138
the solution and could thus possibly retain dispersed O-MWCNTs as they pass by. This
interaction would be significant at high IS, when the electrostatic repulsion between O-
MWCNTs is screened and multiple layers of O-MWCNTs can deposit onto collector
surfaces. Under these circumstances, breakthrough curves and retention profiles would
exhibit decreasing plateaus and hypo-exponential decay, respectively. These phenomena
have been reported in prior literature,30, 31
where they have been modeled by the addition
of a “ripening” term to the convection-diffusion. In this study, a simplified deposition
coefficient kr [T-1
·M/M], is applied to characterize the ripening phenomenon:
),(),(),(),(),(),(
rd2
2
txStxCktxCkx
txCv
x
txCD
t
txC
Eq. 4.25
Note that the ripening effect is a function of both the aqueous concentration of O-
MWCNTs, C (x,t), and the concentration of deposited O-MWCNTs, S (x, t). Therefore,
the deposition rate coefficient for ripening effect (kr) has the units [T-1
·M/M] ([g/(mg·s]].
e. Combining CBF model with three additional models
An equation employing all three terms of the above has been used in this research
and is shown below as Eq. 4.26.
),(),(),(),(),(),(),(),(
rssbbd2
2
txStxCktxCktxCktxCkx
txCv
x
txCD
t
txC
Eq. 4.26
4.4 Results and Discussion
4.4.1 Estimation of Dispersion
a. Effect of flow-through cuvette on breakthrough curves
Because the inner volume of the flow-through cuvette is small (1.2 mL), the
mixture of solution in the cuvette should not have major impact on the shape of the BTC.
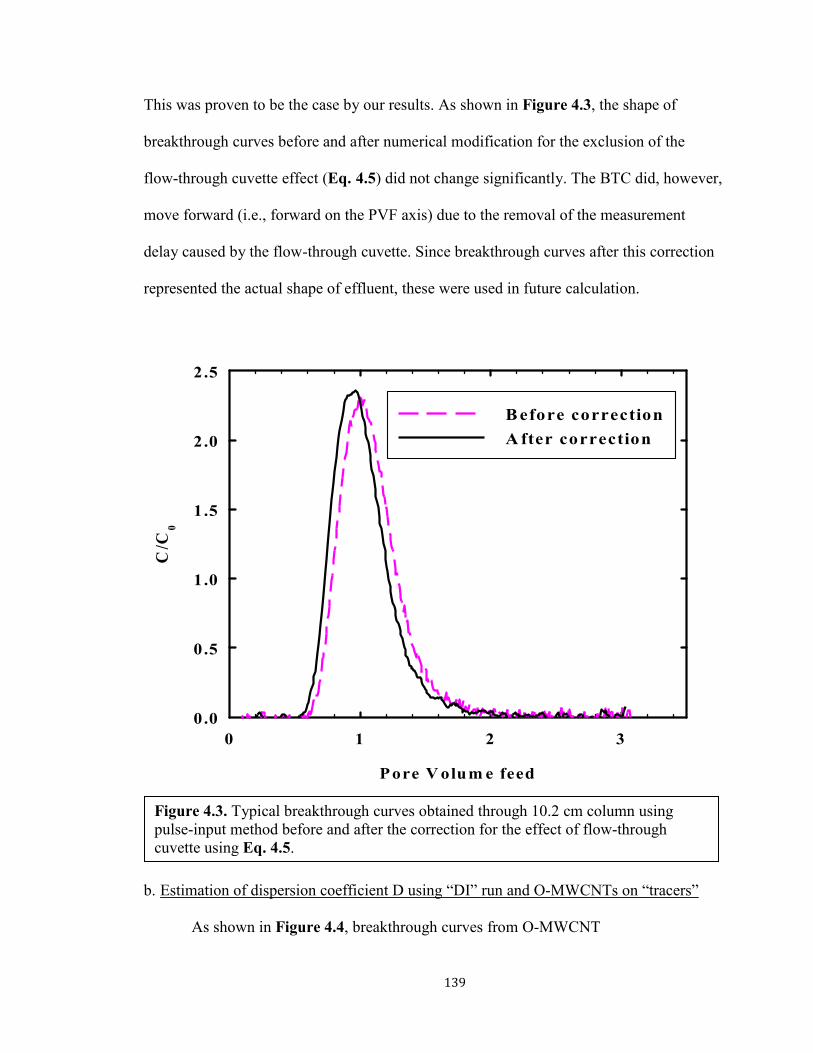
139
This was proven to be the case by our results. As shown in Figure 4.3, the shape of
breakthrough curves before and after numerical modification for the exclusion of the
flow-through cuvette effect (Eq. 4.5) did not change significantly. The BTC did, however,
move forward (i.e., forward on the PVF axis) due to the removal of the measurement
delay caused by the flow-through cuvette. Since breakthrough curves after this correction
represented the actual shape of effluent, these were used in future calculation.
b. Estimation of dispersion coefficient D using “DI” run and O-MWCNTs on “tracers”
As shown in Figure 4.4, breakthrough curves from O-MWCNT
Figure 4.3. Typical breakthrough curves obtained through 10.2 cm column using
pulse-input method before and after the correction for the effect of flow-through
cuvette using Eq. 4.5.
Pore V olum e feed
0 1 2 3
C/C
0
0.0
0.5
1.0
1.5
2.0
2.5
B efore correction
A fter correction
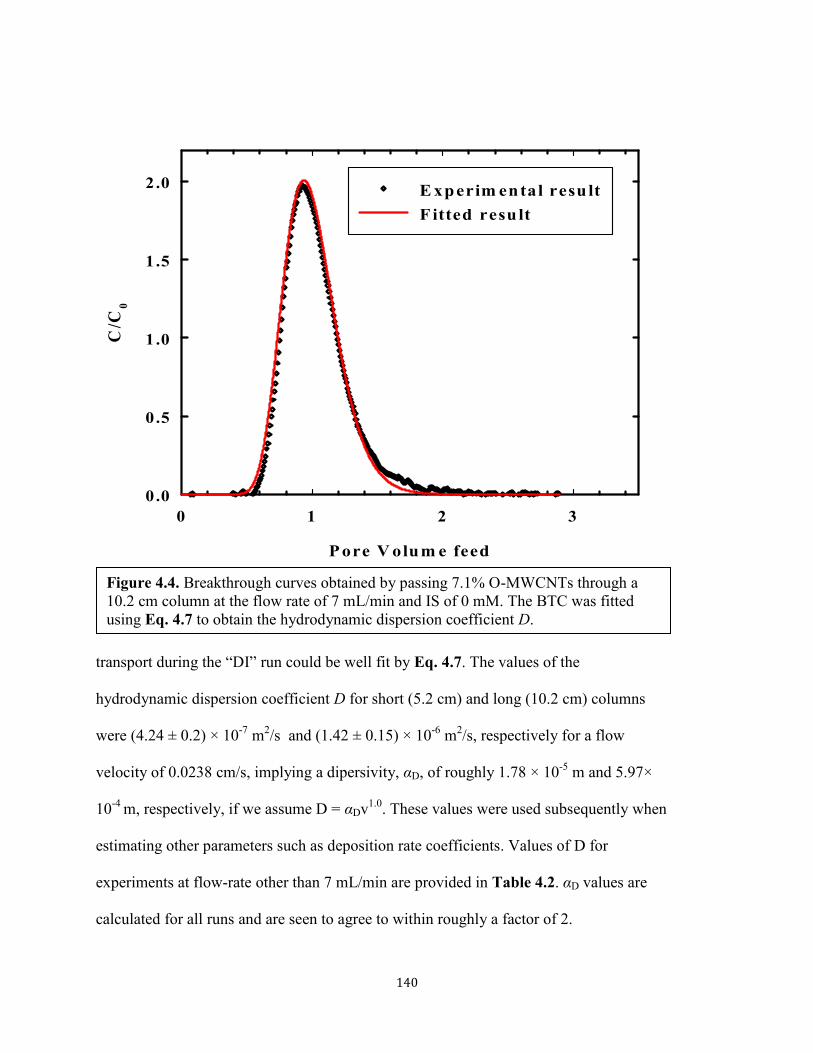
140
transport during the “DI” run could be well fit by Eq. 4.7. The values of the
hydrodynamic dispersion coefficient D for short (5.2 cm) and long (10.2 cm) columns
were (4.24 ± 0.2) × 10-7
m2/s and (1.42 ± 0.15) × 10
-6 m
2/s, respectively for a flow
velocity of 0.0238 cm/s, implying a dipersivity, αD, of roughly 1.78 × 10⁻⁵
m and 5.97×
10-4
m, respectively, if we assume D = αDv1.0
. These values were used subsequently when
estimating other parameters such as deposition rate coefficients. Values of D for
experiments at flow-rate other than 7 mL/min are provided in Table 4.2. αD values are
calculated for all runs and are seen to agree to within roughly a factor of 2.
Figure 4.4. Breakthrough curves obtained by passing 7.1% O-MWCNTs through a
10.2 cm column at the flow rate of 7 mL/min and IS of 0 mM. The BTC was fitted
using Eq. 4.7 to obtain the hydrodynamic dispersion coefficient D.
Pore V olum e feed
0 1 2 3
C/C
0
0.0
0.5
1.0
1.5
2.0E xperim ental result
F itted result

141
Table 4.2 Summary of dispersion coefficient D and deposition rate coefficient kd at
varied approach velocity v for transport experiments conducted using 5.2 cm columns at
pH 5.8 ± 0.2 and 30 mM NaCl as shown in Figure 4.5.
Approach velocity
v (m/s)
Dispersion
coefficient D (m2/s)
Dispersivity αD (m) Deposition rate
coefficient k (s-1
)
0.007 1.7E-07 2.5E-05 0.015
0.007 1.2E-07 1.8E-05 0.015
0.010 1.9E-07 2.0E-05 0.020
0.012 2.2E-07 1.8E-05 0.023
0.012 2.1E-07 1.7E-05 0.024
0.012 2.4E-07 1.9E-05 0.024
0.018 2.8E-07 1.6E-05 0.033
0.024 4.3E-07 1.8E-05 0.044
0.034 5.8E-07 1.7E-05 0.060
0.048 7.1E-07 1.5E-05 0.082
0.068 7.5E-07 1.1E-05 0.111
4.4.2 Effect of Approach Velocity on the Deposition Rate Coefficient
The change of deposition coefficients kd as a function of approach velocity is shown
in Figure 4.5. Experiments with altered flow-rate (and therefore changed velocity of
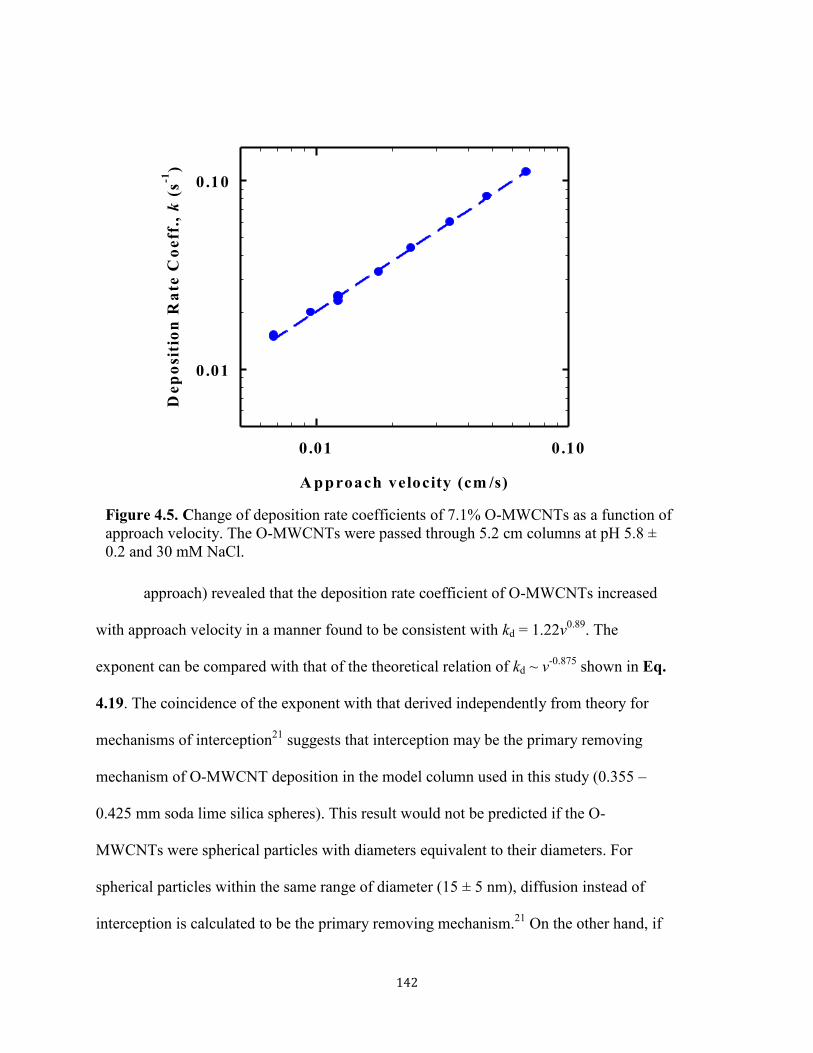
142
approach) revealed that the deposition rate coefficient of O-MWCNTs increased
with approach velocity in a manner found to be consistent with kd = 1.22v0.89
. The
exponent can be compared with that of the theoretical relation of kd ~ v-0.875
shown in Eq.
4.19. The coincidence of the exponent with that derived independently from theory for
mechanisms of interception21
suggests that interception may be the primary removing
mechanism of O-MWCNT deposition in the model column used in this study (0.355 –
0.425 mm soda lime silica spheres). This result would not be predicted if the O-
MWCNTs were spherical particles with diameters equivalent to their diameters. For
spherical particles within the same range of diameter (15 ± 5 nm), diffusion instead of
interception is calculated to be the primary removing mechanism.21
On the other hand, if
Figure 4.5. Change of deposition rate coefficients of 7.1% O-MWCNTs as a function of
approach velocity. The O-MWCNTs were passed through 5.2 cm columns at pH 5.8 ±
0.2 and 30 mM NaCl.
A pproach velocity (cm /s)
0.01 0.10
De
po
sit
ion
Ra
te C
oe
ff.,
k (
s-1
)
0 .01
0.10
143
O-MWCNTs are considered as spheres with diameters equivalent to their lengths, then
the interception mechanism would not be surprising. As shown in previous study, the
same type of O-MWCNTs after identical treatment (oxidation and 20 h sonication)
exhibited a length distribution ranging from 0.09 µm to 5.81 µm.44
The majority of O-
MWCNTs had diameters between 0.3 µm and 0.7 µm.44
Thus, interception is the
expected collision mechanism if O-MWCNTs rotate out of stream lines of flow and can
collide onto the collector by way of “end-on” contact, where the ends of O-MWCNTs
contact the collector during deposition. Alternatively, this is also conceivable if the
dispersed O-MWCNTs re-aggregated during transport to form small bundles prior to
contact and if the effective diameters of these bundles were equal or larger than the
length of individual O-MWCNTs such that interception could occur. The hydrodynamic
diameter Dh of dispersed O-MWCNT was tested to be ~120 nm and ~180 nm before and
after transport experiments, indicating slight aggregation of O-MWCNTs, which
suggested the possible formation of small bundles. Although it is possible that some O-
MWCNT aggregates with larger Dh might deposite onto the porous media, separately
conducted aggregation experiments showed (Chapter 3) that severe aggregation would
not occur during the time of transport experiments under the given conditions (IS = 30
mM, pH 5.8, O% = 7.1 for O-MWCNTs). Nevertheless, the formation of small bundles is
possible. It is noteworthy that Jaisi and Elimelech47
also conducted similar experiments to
investigate the relationship of approach velocity with the deposition rate coefficient of
SWCNTs onto columns packed with soil. The authors observed a relationship of kd ~ v-
0.65, closely consistent with the deposition of soil-mobilized colloids observed in prior
literature (kd ~ v-0.6
)36
, but substantially different from the diffusion dominated removal

144
(kd ~ v-0.33
) or the interception dominated removal (kd ~ v-0.875
).21, 36
Jaisi and Elimelech
attributed this discrepancy to a straining effect, which they assumed to be a dominant
effect in columns packed with soil.47
In the case of this study, however, we believe that
the straining effect is not the primary contributor to O-MWCNT removal due to the
application of spherical glass beads as collectors, A more detailed analysis of the
potential role of straining under different conditions is provided in section 4.4.4(c).
4.4.3 Analysis of Breakthrough Curves and Retention Profiles
Breakthrough curves and retention profiles of transport experiments conducted at
IS of 5, 10, 40, 60 and 357 mM are shown in Figure 4.6. As mentioned above and seen in
Figure 4.6, the total PVF were different for varied experiments. The discrepancy in PVF
as well as the varied IS in those experiments resulted in discrepancy in the total mass of
deposited O-MWCNTs. Larger amount of O-MWCNTs were deposited for experiments
Figure 4.6. (a) Breakthrough curves and (b) retention profiles obtained by passing 7.1%
O-MWCNTs through 10.2 cm columns at varied NaCl concentrations (pH = 5.8± 0.2).
Pore V olum e fed
0 5 10 15 20 25
C/C
0
0.0
0.2
0.4
0.6
0.8
1.0
D istance from colum n in let (cm )
0 2 4 6 8 10
No
rm
ali
ze
d O
-MW
CN
T m
ass
pe
r u
nit
of
co
lle
cto
r (
g-1
)
0 .00
0.01
0.02
0.03
0.04
0.05(a) (b)
N aC l concentration (m M )
5 10 40 60 357

145
that were conducted at higher IS or that ran for a longer period of time. In order to
compare the pattern of retention profiles obtained under different experimental conditions,
the solid concentrations of O-MWCNTs (mass of O-MWCNTs per unit mass of glass
beads) were normalized by dividing absolute solid concentrations by the total injected
mass of O-MWCNTs. Results shown in Figure 4.6 provide evidence that the assumption
of CBFT, which was previously found to be valid for the pulse-input method, was
partially violated for results using step-input method. As previously discussed, this is
presumed to be the result of the long pore volume applied in these experiments. Both
blocking (for IS of 5, 10 and 40 mM) and ripening (for IS of 60, 357 mM) phenomena
were observed in breakthrough curves. At the same time, hypo-exponential decay
phenomenon was observed in the retention profiles, especially for those at high IS (for IS
of 60, 357 mM).
4.4.4 Numerical Simulation Using Traditional CBF Model and Additional Models
As mentioned above, site-blocking, straining and ripening terms in addition to
simple means of CBF have been reported in previous research.4, 5, 8, 23, 27, 29, 31
Such terms
were employed in this study to interpret observations of increasing or decreasing plateau
and hypo-exponential decay in retention profiles. Simulations conducted using CBF
model alone, CBF and each of three additional models (site-blocking model, straining
model and ripening model), as well as CBF and all three additional models are
summarized in Table 4.3 and shown in Figure 4.7. The advantages and disadvantages of
each model are discussed as below.

146
Table 4.3. Simulated results using traditional CBFT, CBFT and site-blocking model,
CBFT and straining model, CBFT and ripening model and all four models.
Simulation using CBFT
IS (mM) 5 10 40 60 357
kd (s-1
) 0.032 0.040 0.076 0.092 0.12
kd,ex (s-1
) 0.032 0.040 0..075 0.095 0.12
Simulation using CBFT and site-blocking model
kd (s-1
) 0.029 0.031 0.072 0.095 0.12
kb (s-1
) 0.041 0.070 0.054 0.065 0
Smax (mgCNT/kg glassbeads) 0.26 0.71 1.00 0.057 N/A
Simulation using CBFT and straining model
kd (s-1
) 0.032 0.040 0.075 0.095 0.12
ks (s-1
) 0.58 0.41 11.6 11.1 0
Β 1.61 1.61 2.12 2.1 N/A
Simulation using CBFT and ripening model
kd (s-1
) 0.032 0.040 0.076 0.092 0.115
kr (s-1
) 0 0 0 0.015 0.015
Simulation using all four models
kd (s-1
) 0.019 0 0.043 0.082 0.11
kb (s-1
) 0.042 0.072 0.056 0.064 0.096
Smax (mgCNT/kg glassbeads) 0.23 0.69 0.85 0.12 0.046
ks (s-1
) 0.11 0.25 0.17 0.41 0
β 0.64 1.2 0.48 1.25 N/A
kr (s-1
) 0 0.011 0 0.019 0.016
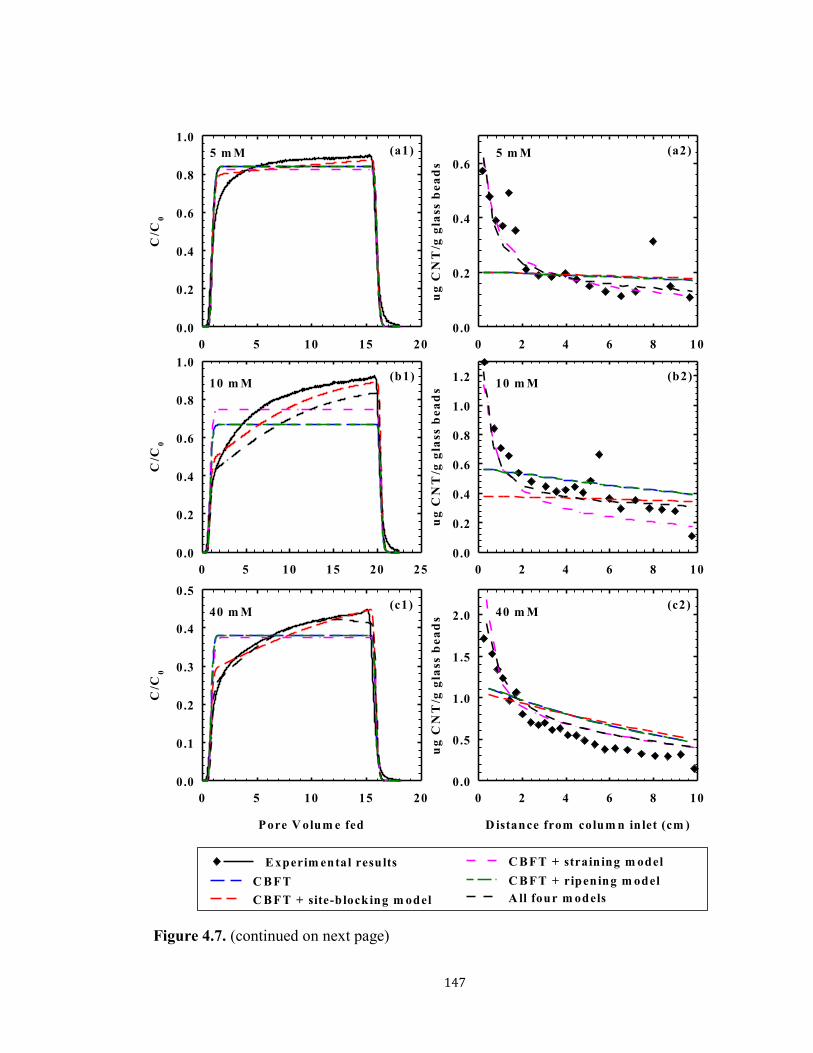
147
Figure 4.7. (continued on next page)
E xperim ental results
0 5 10 15 20
C/C
0
0.0
0.2
0.4
0.6
0.8
1.0
0 2 4 6 8 10
ug
CN
T/g
gla
ss b
ea
ds
0 .0
0.2
0.4
0.6(a1) (a2)
0 5 10 15 20 25
C/C
0
0.0
0.2
0.4
0.6
0.8
1.0
0 2 4 6 8 10
ug
CN
T/g
gla
ss b
ea
ds
0 .0
0.2
0.4
0.6
0.8
1.0
1.2(b1) (b2)
Pore V olum e fed
0 5 10 15 20
C/C
0
0.0
0.1
0.2
0.3
0.4
0.5
D istance from colum n in let (cm )
0 2 4 6 8 10
ug
CN
T/g
gla
ss b
ea
ds
0 .0
0.5
1.0
1.5
2.0(c1) (c2)
C B FT
C B FT + site-blocking m odel
C B FT + straining m odel
A ll four m odels
C B FT + ripening m odel
5 m M 5 m M
10 m M 10 m M
40 m M 40 m M
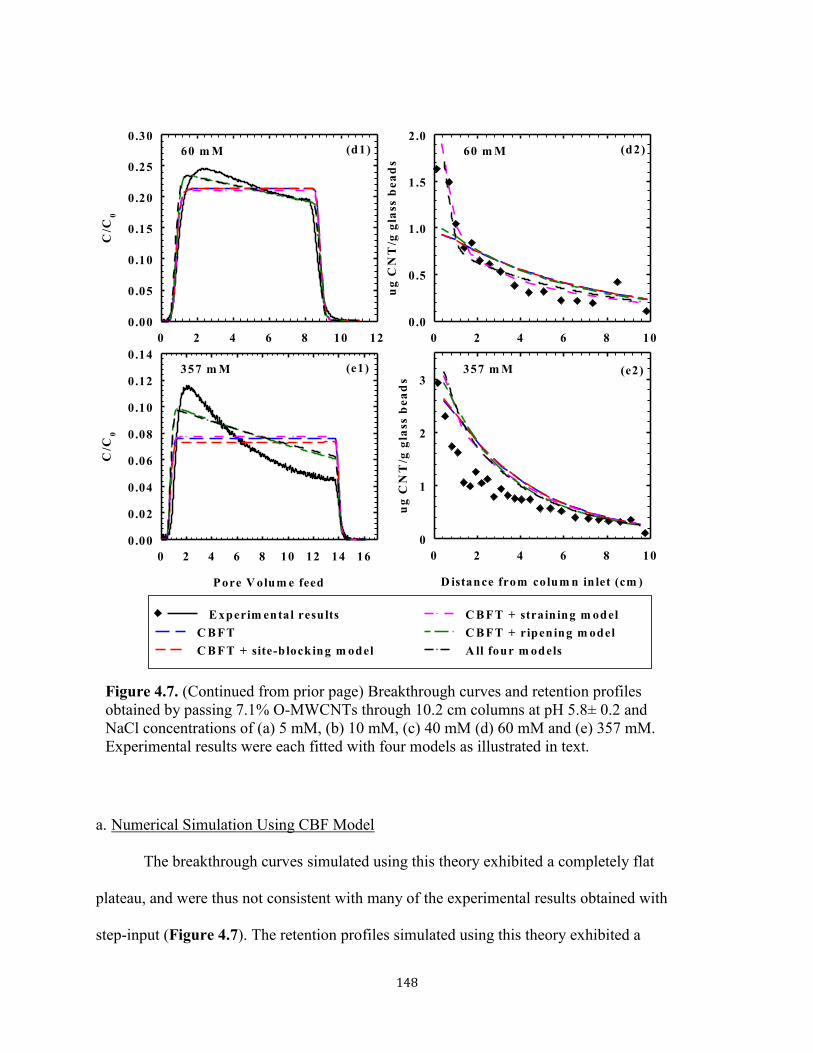
148
a. Numerical Simulation Using CBF Model
The breakthrough curves simulated using this theory exhibited a completely flat
plateau, and were thus not consistent with many of the experimental results obtained with
step-input (Figure 4.7). The retention profiles simulated using this theory exhibited a
0 2 4 6 8 10 12
C/C
0
0.00
0.05
0.10
0.15
0.20
0.25
0.30(d1)
P ore V olum e feed
0 2 4 6 8 10 12 14 16
C/C
0
0.00
0.02
0.04
0.06
0.08
0.10
0.12
0.14
0 2 4 6 8 10
ug
CN
T/g
gla
ss b
ea
ds
0 .0
0.5
1.0
1.5
2.0
(e1)
(d2)
D istance from colum n in let (cm )
0 2 4 6 8 10
ug
CN
T/g
gla
ss b
ea
ds
0
1
2
3(e2)
E xperim ental results
C B F T
C B F T + site-b lock ing m odel
C B F T + strain ing m odel
C B F T + ripening m odel
A ll four m odels
60 m M 60 m M
357 m M 357 m M
Figure 4.7. (Continued from prior page) Breakthrough curves and retention profiles
obtained by passing 7.1% O-MWCNTs through 10.2 cm columns at pH 5.8± 0.2 and
NaCl concentrations of (a) 5 mM, (b) 10 mM, (c) 40 mM (d) 60 mM and (e) 357 mM.
Experimental results were each fitted with four models as illustrated in text.

149
trend of exponential decay with increasing distance from column inlet. The decay rates
observed in the retention profiles were found to be higher than theoretical. Although the
simulation was not accurate, the fitted deposition rate coefficient kd still exhibited a clear
increasing trend with increasing IS as shown in Table 4.3, indicating that the DLVO
theory still played a significant role in deposition of O-MWNTs onto glass beads.
However, additional model components are needed to fully explain the observed results.
b. Numerical simulation using CBF and an additional site-blocking term
As shown in Figure 2.2, the breakthrough curves obtained at low IS (≤ 40 mM)
all exhibited obvious blocking phenomena. The site-blocking model (Eq. 4.21) was
therefore applied. For results obtained from each transport experiment, kd, kb, and Smax
were all obtained by fitting experimental data with Eq. 4.21. Since the amount of
impurity on collector surfaces should be effectively identical for all of the columns, and
given that the parameter Smax represents the total concentration of sites from the
impurities (known to be mostly metal oxides or metal silicates), Smax should be identical
regardless of the background ionic strength. Therefore, the simulation was conducted
using a fixed amount of the impurity sites, Smax,f. Since, there was no available
experimental approach to independently quantify Smax,f, the maximum Smax obtained by
fitting the model to 5 batches of experimental was adopted to be the fixed parameter
Smax,f . Results obtained with Smax,f are plotted in Figure 4.7. The simulation results of the
BTC at IS of 40 mM are also re-plotted in Figure 4.8 to more clearly show the effects of
each model.

150
The site-blocking model was able to catch the phenomena of increasing plateau of
the breakthrough curves successfully. However, due to the existence of the maximum
capacity of collectors, the simulated retention profile (Figure 4.7(c2)) has a curve that is
less steep than the typical exponential decay curve, thus showing that the model still fails
to agree with all experimental observations. The results suggest that although blocking is
one of the important mechanisms at play, there are other considerations as well. Li et al.11
successfully used a similar model for the quantitative explanation of the transport of C60
through quartz sand. In their study, the breakthrough curves of C60 showed significantly
Figure 4.8. Simulation results of BTC obtained at IS = 40 mM. (Same as Figure
4.7(c1)).
P ore V olum e fed
0 5 10 15 20
C/C
0
0.0
0.1
0.2
0.3
0.4
0.5
40 m M (c1)
E xperim ental results
C B F T
C B F T + site-b lock ing m odel
C B F T +strain ing m odel
A ll four m odels
C B F T +ripening m odel

151
increasing plateaus and the retention profiles were flat for observation points at the first
several centimeters from the column inlet. Both of these phenomena were consistent with
the blocking mechanism. Since C60 particles used in their experiments were spherical
particles with diameters of 92 ± 0.3 nm, and the IS applied was low enough to prevent
multilayer deposition, the site-blocking model in conjunction with CBFT was sufficient
to simulate the transport behavior of C60. In the case of O-MWCNTs, however, blocking
is apparently not the only mechanism other than CBFT that contributes to the removal of
O-MWCNTs.
c. Numerical simulation using CBFT plus straining
Straining has been reported by numerous prior investigators to be a potentially
important factor in O-MWCNT transport.1, 8, 26-28
Although straining effects were not
found to be especially significant in the prior pulse-based transport experiments, they
appear to have played a relatively more important role in transport experiments of O-
MWCNTs under the conditions of step-input, i.e., using a long feeding time and a large
total amount of O-MWCNTs. As shown in Figure 4.7 and re-plotted in Figure 4.9 (pink
dash-dot line), the straining model (Eq. 4.23) could explain the high solid concentration
of deposited O-MWCNTs at the beginning of columns, especially for results obtained at
low IS. It has been reported by Bradford et al.27, 53
that straining effects are only
significant at the beginning of the column and should quickly decay with distance from
the column inlet since after a certain distance an exclusion effect would force water and
remaining particles through larger pores and therefore reduce the straining effect.23, 52
The
decay parameter, β, was used to simulate the diminishing effect of the straining effect
with distance. For this study, evidence suggests that the diminishment of straining effects

152
with distance was particularly pronounced. The values of β obtained by fitting Eq. 4.23
to experimental results were all significantly larger than those reported by Bradford et
al.23
or Wang et al.8, indicating a faster diminishment of the straining effect which
effectively limits the role of straining to the first several centimeters of columns. This
may relate to our use of spherical collectors -- compared to quartz sands, spherical
collectors have more evenly distributed pores that may provide fewer regions conductive
to straining. It is conceivable that most straining in our system is due to the fact that water
distribution is initially imperfect.
Figure 4.9. Simulation results of retention profiles obtained at IS = 10 mM. (Same as
Figure 4.7(b2)).
D istance from colum n in let (cm )
0 2 4 6 8 10
ug
CN
T/g
gla
ss b
ea
ds
0 .0
0.2
0.4
0.6
0.8
1.0
1.2 E xperim ental results
C B FT
C B FT +site-b lock ing m odel
C B FT +strain ing m odel
A ll four m odels
C B FT +ripening m odel
(b2)10 m M
153
For experiments conducted at high IS, because straining and multilayer deposition could
both potentially cause the hypo-exponential decay of the retention profile, the
contribution of straining cannot be accurately isolated without also understanding the
possible influence of ripening. However, at low IS (< 40 mM) where multilayer effects
can be presumed as negligible, it is reasonable to fully attribute the higher O-MWCNT
deposition at the beginning of the retention profile to straining.
d. Simulation using CBFT plus ripening
The ripening model used in this research is based on the concept of multi-layer
deposition. Since such multi-layer deposition would involve an interaction between the
dispersed O-MWCNTs and the deposited O-MWCNTs, the deposition rate coefficient
due to ripening (kr) is considered as a second-order rate coefficient for a rate equation
based on the product of both aqueous- and solid-phase concentrations of O-MWCNTs
(Eq. 4.25). As shown in Table 4.3, the fitted values of kr were large enough to be
important only in experiments conducted at high IS (60 mM and 357 mM). This finding
is consistent with prior results obtained by other researchers.29, 31
With the addition of this
term, the transport model was able to explain the decreasing plateau of the BTC obtained
at high IS as well as the hypo-exponential decay trend exhibited in some retention
profiles -- see Figure 4.7.Thus, the results suggest that multi-layer deposition becomes
the most dominant effect at high IS, where it can be used to explain most of the BTC and
retention profile data. As with other models, however, the ripening model alone cannot
completely account for all phenomena observed in all transport experiments or even for
all aspects of high IS results.

154
e. Simulation of experimental results using all four models
All three process mechanisms (site-blocking, straining, and ripening) have been
proved to be necessary additions to CBFT in interpreting the various experimental results
observed in this study. Therefore, Eq. 4.25 was used to simulate all results as shown in
Figure 4.7. During the simulation, kd, kb, ks, β, and kr from Eq. 4.25 were all fitting
parameters but Smax,f was fixed at a value of 0.9929 μg/g with method illustrated above.
As shown in Figure 4.7, experimental results were all reasonably well fit by this
combined model.
4.5 Conclusions
Overall, four models, describing including CBF effect, straining effect, site-
blocking effect and ripening effect, are all needed to fit the experimental results. The
requirement of all four models indicates that transport of O-MWCNTs through soda-lime
glass beads is a complex process which can be affected by numerous factors, including
the heterogeneous surface of the collectors, the morphology of the dispersed O-
MWCNTs, and the interactions among O-MWCNTs and between O-MWCNTs and
collectors.
4.6 Cited References
1. Jaisi, D. P.; Saleh, N. B.; Blake, R. E.; Elimelech, M., Transport of Single-
Walled Carbon Nanotubes in Porous Media: Filtration Mechanisms and Reversibility.
Environ Sci Technol 2008, 42, (22), 8317-8323.
2. Lecoanet, H. F.; Bottero, J. Y.; Wiesner, M. R., Laboratory Assessment of the
Mobility of Nanomaterials in Porous Media. Environ Sci Technol 2004, 38, (19), 5164-
5169.
3. Lecoanet, H. F.; Wiesner, M. R., Velocity Effects on Fullerene and Oxide
Nanoparticle Deposition in Porous Media. Environ Sci Technol 2004, 38, (16), 4377-
4382.

155
4. Wang, Y.; Li, Y.; Fortner, J. D.; Hughes, J. B.; Abriola, L. M.; Pennell, K. D.,
Transport and Retention of Nanoscale C60 Aggregates in Water-Saturated Porous Media.
Environ Sci Technol 2008, 42, (10), 3588-3594.
5. Liu, X. Y.; O'carroll, D. M.; Petersen, E. J.; Huang, Q. G.; Anderson, C. L.,
Mobility of Multiwalled Carbon Nanotubes in Porous Media. Environ Sci Technol 2009,
43, (21), 8153-8158.
6. Rajagopalan, R.; Chu, R. Q., Dynamics of Adsorption of Colloidal Particles in
Packed-Beds. J Colloid Interf Sci 1982, 86, (2), 299-317.
7. Song, L.; Elimelech, M., Dynamics of Colloid Deposition in Porous-Media -
Modeling the Role of Retained Particles. Colloid Surface A 1993, 73, 49-63.
8. Wang, Y. G.; Kim, J. H.; Baek, J. B.; Miller, G. W.; Pennell, K. D., Transport
Behavior of Functionalized Multi-Wall Carbon Nanotubes in Water-Saturated Quartz
Sand as a Function of Tube Length. Water Res 2012, 46, (14), 4521-4531.
9. Liu, Y. Y.; Zhang, C. Y.; Hilpert, M.; Kuhlenschmidt, M. S.; Kuhlenschmidt, T.
B.; Nguyen, T. H., Transport of Cryptosporidium Parvum Oocysts in a Silicon
Micromodel. Environ Sci Technol 2012, 46, (3), 1471-1479.
10. Baumann, T.; Werth, C. J., Visualization and Modeling of Polystyrol Colloid
Transport in a Silicon Micromodel. Vadose Zone J 2004, 3, (2), 434-443.
11. Li, Y. S.; Wang, Y. G.; Pennell, K. D.; Abriola, L. M., Investigation of the
Transport and Deposition of Fullerene (C60) Nanoparticles in Quartz Sands under
Varying Flow Conditions. Environ Sci Technol 2008, 42, (19), 7174-7180.
12. Tufenkji, N.; Elimelech, M., Spatial Distributions of Cryptosporidium
Oocysts in Porous Media: Evidence for Dual Mode Deposition. Environ Sci Technol
2005, 39, (10), 3620-3629.
13. Lanphere, J. D.; Luth, C. J.; Walker, S. L., Effects of Solution Chemistry on
the Transport of Graphene Oxide in Saturated Porous Media. Environ Sci Technol 2013,
47, (9), 4255-4261.
14. Tufenkji, N.; Elimelech, M., Deviation from the Classical Colloid Filtration
Theory in the Presence of Repulsive Dlvo Interactions. Langmuir 2004, 20, (25), 10818-
10828.
15. Chowdhury, I.; Hong, Y.; Honda, R. J.; Walker, S. L., Mechanisms of Tio2
Nanoparticle Transport in Porous Media: Role of Solution Chemistry, Nanoparticle
Concentration, and Flowrate. J Colloid Interf Sci 2011, 360, (2), 548-555.
16. Yao, K. M.; Habibian, M. M.; Omelia, C. R., Water and Waste Water
Filtration - Concepts and Applications. Environ Sci Technol 1971, 5, (11), 1105-1112.
17. Derjaguin, B., On the Repulsive Forces between Charged Colloid Particles
and on the Theory of Slow Coagulation and Stability of Lyophobe Sols. Transactions of
the Faraday Society 1940, 35, (0), 203-215.
18. Derjaguin, B.; Landau, L., Theory of the Stability of Strongly Charged
Lyophobic Sols and of the Adhesion of Strongly Charged-Particles in Solutions of
Electrolytes. Prog Surf Sci 1941, 14, 633.
19. Verwey, E. J. W.; Overbeek, J. T., Theory of the Stability of Lyophobic
Colloids. Elsevier: Amsterdam, 1948.
20. Rajagopalan, R.; Tien, C., Trajectory Analysis of Deep-Bed Filtration with
Sphere-in-Cell Porous-Media Model. Aiche J 1976, 22, (3), 523-533.
156
21. Tufenkji, N.; Elimelech, M., Correlation Equation for Predicting Single-
Collector Efficiency in Physicochemical Filtration in Saturated Porous Media. Environ
Sci Technol 2004, 38, (2), 529-536.
22. Johnson, P. R.; Elimelech, M., Dynamics of Colloid Deposition in Porous-
Media - Blocking Based on Random Sequential Adsorption. Langmuir 1995, 11, (3),
801-812.
23. Bradford, S. A.; Simunek, J.; Bettahar, M.; Van Genuchten, M. T.; Yates, S.
R., Modeling Colloid Attachment, Straining, and Exclusion in Saturated Porous Media.
Environ Sci Technol 2003, 37, (10), 2242-2250.
24. Tufenkji, N.; Redman, J. A.; Elimelech, M., Interpreting Deposition Patterns
of Microbial Particles in Laboratory-Scale Column Experiments. Environ Sci Technol
2003, 37, (3), 616-623.
25. Li, X. Q.; Lin, C. L.; Miller, J. D.; Johnson, W. P., Role of Grain-to-Grain
Contacts on Profiles of Retained Colloids in Porous Media in the Presence of an Energy
Barrier to Deposition. Environ Sci Technol 2006, 40, (12), 3769-3774.
26. Xu, S. P.; Liao, Q.; Saiers, J. E., Straining of Nonspherical Colloids in
Saturated Porous Media. Environ Sci Technol 2008, 42, (3), 771-778.
27. Bradford, S. A.; Simunek, J.; Walker, S. L., Transport and Straining of E-Coli
O157 : H7 in Saturated Porous Media. Water Resour Res 2006, 42, (12).
28. Cushing, R. S.; Lawler, D. F., Depth Filtration: Fundamental Investigation
through Three Dimensional Trajectory Analysis. Environ Sci Technol 1998, 32, (23),
3793-3801.
29. Ryde, N.; Kallay, N.; Matijevic, E., Particle Adhesion in Model Systems .14.
Experimental Evaluation of Multilayer Deposition. J Chem Soc Faraday T 1991, 87, (9),
1377-1381.
30. Privman, V.; Frisch, H. L.; Ryde, N.; Matijevic, E., Particle Adhesion in
Model Systems .13. Theory of Multilayer Deposition. J Chem Soc Faraday T 1991, 87,
(9), 1371-1375.
31. Ryde, N.; Kihira, H.; Matijevic, E., Particle Adhesion in Model Systems .15.
Effect of Colloid Stability in Multilayer Deposition. J Colloid Interf Sci 1992, 151, (2),
421-432.
32. Adamczyk, Z.; Siwek, B.; Zembala, M.; Weronski, P., Kinetics of Localized
Adsorption of Colloid Particles. Langmuir 1992, 8, (11), 2605-2610.
33. Davis, C. J.; Eschenazi, E.; Papadopoulos, K. D., Combined Effects of Ca2+
and Humic Acid on Colloid Transport through Porous Media. Colloid Polym Sci 2002,
280, (1), 52-58.
34. Elimelech, M., Indirect Evidence for Hydration Forces in the Deposition of
Polystyrene Latex Colloids on Glass Surfaces. J Chem Soc Faraday T 1990, 86, (9),
1623-1624.
35. Elimelech, M.; Omelia, C. R., Effect of Electrolyte Type on the
Electrophoretic Mobility of Polystyrene Latex Colloids. Colloid Surface 1990, 44, 165-
178.
36. Grolimund, D.; Elimelech, M.; Borkovec, M.; Barmettler, K.; Kretzschmar, R.;
Sticher, H., Transport of in Situ Mobilized Colloidal Particles in Packed Soil Columns.
Environ Sci Technol 1998, 32, (22), 3562-3569.
157
37. Smith, B.; Wepasnick, K.; Schrote, K. E.; Cho, H. H.; Ball, W. P.; Fairbrother,
D. H., Influence of Surface Oxides on the Colloidal Stability of Multi-Walled Carbon
Nanotubes: A Structure-Property Relationship. Langmuir 2009, 25, (17), 9767-9776.
38. Fogden, S.; Verdejo, R.; Cottam, B.; Shaffer, M., Purification of Single
Walled Carbon Nanotubes: The Problem with Oxidation Debris. Chemical Physics
Letters 2008, 460, (1-3), 162-167.
39. Price, B. K.; Lomeda, J. R.; Tour, J. M., Aggressively Oxidized Ultra-Short
Single-Walled Carbon Nanotubes Having Oxidized Sidewalls. Chem Mater 2009, 21,
(17), 3917-3923.
40. Salzmann, C. G.; Llewellyn, S. A.; Tobias, G.; Ward, M. a. H.; Huh, Y.;
Green, M. L. H., The Role of Carboxylated Carbonaceous Fragments in the
Functionalization and Spectroscopy of a Single-Walled Carbon-Nanotube Material.
Advanced Materials 2007, 19, (6), 883-887.
41. Wang, Z. W.; Shirley, M. D.; Meikle, S. T.; Whitby, R. L. D.; Mikhalovsky, S.
V., The Surface Acidity of Acid Oxidised Multi-Walled Carbon Nanotubes and the
Influence of in-Situ Generated Fulvic Acids on Their Stability in Aqueous Dispersions.
Carbon 2009, 47, (1), 73-79.
42. Worsley, K. A.; Kalinina, I.; Bekyarova, E.; Haddon, R. C., Functionalization
and Dissolution of Nitric Acid Treated Single-Walled Carbon Nanotubes. J Am Chem
Soc 2009, 131, (50), 18153-18158.
43. Chen, K. L.; Smith, B. A.; Ball, W. P.; Fairbrother, D. H., Assessing the
Colloidal Properties of Engineered Nanoparticles in Water: Case Studies from Fullerene
C-60 Nanoparticles and Carbon Nanotubes. Environ Chem 2010, 7, (1), 10-27.
44. Smith, B.; Wepasnick, K.; Schrote, K. E.; Bertele, A. H.; Ball, W. P.; O'melia,
C.; Fairbrother, D. H., Colloidal Properties of Aqueous Suspensions of Acid-Treated,
Multi-Walled Carbon Nanotubes. Environ Sci Technol 2009, 43, (3), 819-825.
45. Langley, L. A.; Villanueva, D. E.; Fairbrother, D. H., Quantification of
Surface Oxides on Carbonaceous Materials. Chem Mater 2006, 18, (1), 169-178.
46. Wepasnick, K. A.; Smith, B. A.; Schrote, K. E.; Wilson, H. K.; Diegelmann, S.
R.; Fairbrother, D. H., Surface and Structural Characterization of Multi-Walled Carbon
Nanotubes Following Different Oxidative Treatments. Carbon 2011, 49, (1), 24-36.
47. Jaisi, D. P.; Elimelech, M., Single-Walled Carbon Nanotubes Exhibit Limited
Transport in Soil Columns. Environ Sci Technol 2009, 43, (24), 9161-9166.
48. Elimelech, M.; Gregory, J.; Jia, X.; Williams, R. A., Particle Deposition and
Aggregation : Measurement, Modelling, and Simulation. Butterworth-Heinemann:
Oxford ; Boston, 1995; p xv, 441 p.
49. Kretzschmar, R.; Barmettler, K.; Grolimund, D.; Yan, Y. D.; Borkovec, M.;
Sticher, H., Experimental Determination of Colloid Deposition Rates and Collision
Efficiencies in Natural Porous Media. Water Resour Res 1997, 33, (5), 1129-1137.
50. Tufenkji, N.; Elimelech, M., Correlation Equation for Predicting Single-
Collector Efficiency in Physicochemical Filtration in Saturated Porous Media.
Environmental Science and Technology 2004, 38, (2), 529-536.
51. Forsythe, G. E.; Malcolm, M. A.; Moler, C. B., Computer Methods for
Mathematical Computations. Prentice-Hall: 1976.

158
52. Bradford, S. A.; Yates, S. R.; Bettahar, M.; Simunek, J., Physical Factors
Affecting the Transport and Fate of Colloids in Saturated Porous Media. Water Resour
Res 2002, 38, (12).
53. Bradford, S. A.; Bettahar, M., Straining, Attachment, and Detachment of
Cryptosporidium Oocysts in Saturated Porous Media. J Environ Qual 2005, 34, (2), 469-
478.

159
Chapter 5. Sensitivity Analysis of Simulations Conducted for
Experimental Results Obtained Using Step-Input Method
under Varied Ionic Strengths.
ABSTRACT
Sensitivity analyses were conducted on the modeling approaches presented in Chapter 4
to investigate the contribution and physical meaning of each term in the models and thus
to better understand the relative importance of each process under different conditions of
aquatic chemistry. Results showed that at ionic strength (IS) < 40 mM, model
modifications for site-blocking and straining effects were more important than other
effects for simulating observed data. At higher IS (≥ 60 mM), the ripening modification
was the only important component needed beyond clean-bed filtration theory (CBFT).
Site-blocking, straining and ripening models were all found to be important for accurately
simulating O-MWCNT removal at IS = 40 mM. Thus, the sensitivity results suggest that
ionic strength is a key variable in determining which mechanistic processes are most
important to consider when quantitatively simulating O-MWCNT interactions with silica-
based porous media.
5.1 Introduction
As illustrated in Chapter 4, good simulation of the transport and retention of
oxidized multi-walled carbon nanotubes (O-MWCNTs) under step input conditions
required that numerical models based on clean bed filtration theory (CBFT) be amended
with terms to account for the additional processes of site-blocking, straining and ripening.

160
Although each of these three processes was relevant to at least one of our experimental
runs, there were many circumstances under which adequate simulation could be achieved
with inclusion of only one or two of the additional processes in the model. Therefore,
sensitivity analyses were conducted in order to better understand the relative importance
of each process under different conditions of aquatic and surface chemistry and to gain
more understanding about model sensitivity to parameter values. The results of these
sensitivity analyses are presented in this chapter.
5.2 Methodological Approach to Sensitivity Analysis
The analyses presented in this chapter are based on systematic study of the
generalized form of the O-MWCNT transport equation that was developed and discussed
in Chapter 4. The generalized equation is the convection-dispersion equation of
transport with three additional terms to account for a second set of site types with site-
blocking (term including “kb” and “ψ”), a new term to account for a possible straining
mechanism of removal (“ks” term), and a new term to account for the removal by
deposition onto already deposited O-MWCNTs and often referred to as “ripening” (“kr”
term). The overall equation was previously presented as Eq. 4.26 and is reproduced
below as Eq. 5.1:
),(),(),(),(),(),(),(),(
rssbbd2
2
txStxCktxCktxCktxCkx
txCv
x
txCD
t
txC
Eq. 5.1
The contributions of all four processes, first-order “normal” clean-bed deposition
(kd), blocking-affected deposition on a sub-set of sites (kb), straining (ks) and ripening (kr)
were analyzed by separately lowering each of the identified rate constants to 10% and

161
50% of its initially fit value. Simulation curves based on those revised values were then
plotted together with the best fit of the experimental results as a means of observing the
relative influence of the varied term. The effect of the maximum available deposition
sites of impurities (Smax) used in the term accounting for site-blocking mechanism was
also analyzed by increasing its value to infinity, thus fixing the parameter ψb at 1.0 as per
its definition given below in Eq. 5.2. (This was previously provided as Eq. 4.22)
max
bmax),
S
txSSb
(
Eq. 5.2
Thus, setting Smax to infinity effectively eliminates site-blocking as a mechanism but still
includes deposition onto high energy sites as a component of “clean-bed” deposition – in
other words, the total deposition rate constant under this condition is effectively kd + kb.
5.3 Results and Discussions
5.3.1 Contribution of “Clean-Bed” Deposition
Figure 5.1 shows a sensitivity analysis in which the contribution of the “clean-
bed” deposition term (“kd” term) is reduced to 10% and 50% of its initial value. This term
is referred to as “clean-bed filtration” or CBF hereafter. A clear trend of increasing
contribution of CBF with increasing IS was observed. At relatively lower IS (Figure 5.1
(a) through (c)), the contribution of CBF was negligible, as reflected in no apparent
change in model simulated results with major changes in kd. For IS values of 60 mM and
357 mM, on the other hand, the C/C0 values associated with the plateaus of the
breakthrough curves (BTCs) were found to increase dramatically with decreasing kd.
(from ~0.1 and ~0.2 up to ~0.8 respectively). These results imply that CBF accounts for

162
0 5 10 15 20
C/C
0
0.0
0.2
0.4
0.6
0.8
1.0
0 2 4 6 8 10
ug
CN
T/g
gla
ss b
ea
ds
0.0
0.2
0.4
0.6(a1) (a2)
0 5 10 15 20 25
C/C
0
0.0
0.2
0.4
0.6
0.8
1.0
0 2 4 6 8 10
ug
CN
T/g
gla
ss b
ea
ds
0.0
0.2
0.4
0.6
0.8
1.0
1.2
1.4(b1) (b2)
Pore V olum e feed
0 5 10 15 20
C/C
0
0.0
0.1
0.2
0.3
0.4
0.5
D istance from colum n in let (cm )
0 2 4 6 8 10
ug
CN
T/g
gla
ss b
ea
ds
0.0
0.5
1.0
1.5
2.0
(c1) (c2)
E xperim ental results
B est fit
10% kd
50% kd
5 m M 5 m M
10 m M 10 m M
40 m M 40 m M
Figure 5.1 (This figure is continued on the next page, where its caption is provided.)

163
the majority of the O-MWCNT removal under these high IS conditions and the direction
of change is consistent with expectations based on DLVO theory. In particular, increased
rates of CBF are expected at higher IS where surface charges on the collectors (glass
beads) and particles (O-MWCNTs) are more effectively screened by cations (Na+) at
0 2 4 6 8 10 12
C/C
0
0.0
0.2
0.4
0.6
0.8
1.0
0 2 4 6 8 10
ug
CN
T/g
gla
ss b
ea
ds
0.0
0.5
1.0
1.5
2.0
(d1) (d2)
Pore V olum e feed
0 2 4 6 8 10 12 14 16
C/C
0
0.0
0.2
0.4
0.6
0.8
1.0
D istance from colum n in let (cm )
0 2 4 6 8 10
ug
CN
T/g
gla
ss b
ea
ds
0
1
2
3(e1) (e2)
60 m M 60 m M
357 m M 357 m M
E xperim ental results
B est fit
10% kd
50% kd
Figure 5.1. (continued from prior page) Analysis of the contributions of CBF for
experimental results obtained at pH 5.8± 0.2 and NaCl concentrations of (a) 5 mM,
(b) 10 mM, (c) 40 mM, (d) 60 mM and (e) 357 mM. The CBF term kd under each
condition was reduced to 10% and 50% of its original value to analyze its
importance and contribution.

164
relatively higher IS. Therefore, the results support a conclusion that CBF was the primary
removal mechanism for the observed O-MWCNT retention in our study at IS > 60 mM.
This further corroborates the assumptions and interpretations presented in Chapter 3 for
pulse input conditions, where CBF is even more likely to hold. On the other hand, the
results presented in Figures 5.1(a) through (c) reveal that our simulations of transport
experiments conducted at lower IS were dominated by mechanisms other than CBF.
5.3.2 Contribution of Site-Blocking Removal Mechanism
The results of our analysis of contributions from site-blocking component of the
model are shown in Figure 5.2. Unlike CBF, which has a clear trend of IS dependency,
the relationship between IS and the site- blocking removal mechanism is more
complicated.
As evident from Figure 5.2(a), the value of kb did not affect the simulations for IS
= 5 mM (where very low alpha is manifest) but variation of kb does affect the simulation
substantially for the “best fit” simulations of experiments conducted at IS of 10 mM and
40 mM, especially at 40 mM.
Particularly important to note is Figure 5.2(c). These results clearly show that the
model’s ability to simulate rising plateau over time was strongly dependent on the value
of kb. Only at the initially fitted kb (and not at the 10% or 50% kb values used in
sensitivity test) did the effects of blocking cause accurate simulation of this rising plateau
phenomenon.
On the other hand, model results were once again fairly insensitive to kb for the
simulation of results obtained at IS above 60 mM. At IS < 60 mM, the effect of IS on
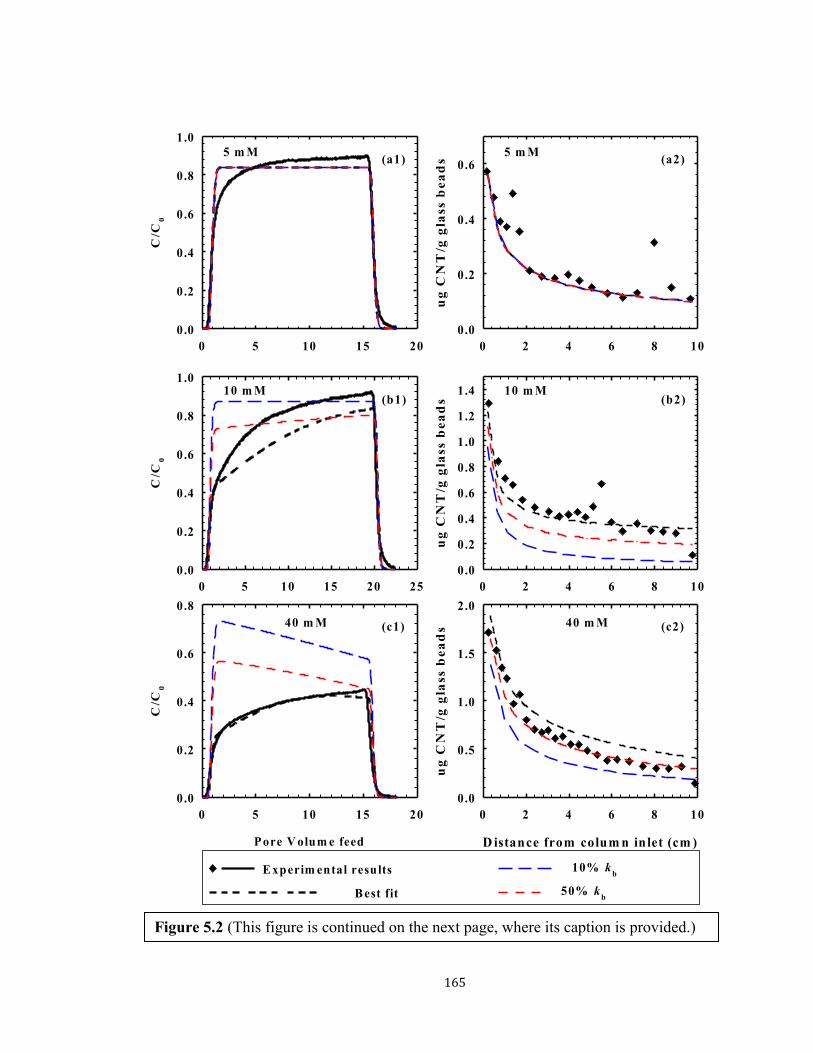
165
0 5 10 15 20
C/C
0
0.0
0.2
0.4
0.6
0.8
1.0
0 2 4 6 8 10
ug
CN
T/g
gla
ss b
ea
ds
0.0
0.2
0.4
0.6(a1) (a2)
0 5 10 15 20 25
C/C
0
0.0
0.2
0.4
0.6
0.8
1.0
0 2 4 6 8 10
ug
CN
T/g
gla
ss b
ea
ds
0.0
0.2
0.4
0.6
0.8
1.0
1.2
1.4(b1) (b2)
Pore V olum e feed
0 5 10 15 20
C/C
0
0.0
0.2
0.4
0.6
0.8
D istance from colum n in let (cm )
0 2 4 6 8 10
ug
CN
T/g
gla
ss b
ea
ds
0.0
0.5
1.0
1.5
2.0
(c1) (c2)
E xperim ental results
B est fit
10% kb
50% kb
5 m M 5 m M
10 m M 10 m M
40 m M 40 m M
Figure 5.2 (This figure is continued on the next page, where its caption is provided.)

166
modeling sensitivity to kb (deposition rate on the “blockable” high affinity sites)
increased with increasing IS, similar to (but not quite as strong as) the effect on
sensitivity to kd,
Figure 5.2. (continued from prior page) Analysis of the contributions of site-blocking
removal mechanism for experimental results obtained at pH 5.8± 0.2 and NaCl
concentrations of (a) 5 mM, (b) 10 mM, (c) 40 mM, (d) 60 mM and (e) 357 mM. The
blocking term kb under each condition was reduced to 10% and 50% of its original
value to analyze its importance and contribution.
Pore V olum e feed
0 2 4 6 8 10 12
C/C
0
0.00
0.05
0.10
0.15
0.20
0.25
0.30
D istance from colum n in let (cm )
0 2 4 6 8 10
ug
CN
T/g
gla
ss b
ea
ds
0.0
0.5
1.0
1.5
2.0
(d1) (d2)
Pore V olum e feed
0 2 4 6 8 10 12 14 16
C/C
0
0.00
0.02
0.04
0.06
0.08
0.10
0.12
D istance from colum n in let (cm )
0 2 4 6 8 10
ug
CN
T/g
gla
ss b
ea
ds
0
1
2
3(e1) (e2)
E xperim ental results
B est fit
10% kb
50% kb
60 m M 60 m M
357 m M 357 m M

167
As discussed in Chapter 4, the “blockable” high-affinity sites are most likely
associated with impurities on the glass. Such impurities are reported in the compositional
data provided by the manufacturer and have been further characterized through TEM
imaging by Dr. Ken Livi in the Electron Microscope Laboratory located within the
Department of Earth and Planetary Sciences at JHU (Figure 3.1). The surfaces of
impurities, mostly metal oxide or silicate, may be less likely to have negative charge at
the given pH (5.8 ± 0.2). Based on the amounts observed, it is reasonable to assume that
these sites were relatively sparse and surrounded by the more dominant silica sites.
Given the large size of O-MWCNTs, it is therefore likely that their deposition is affected
by their interaction with silica sites as well as the alternative site types, and that screening
of charge repulsion is still relevant to the overall forces of interaction. I speculate that this
is the cause of the IS effects at 10 mM and 40 mM. At > 60 mM, on the other hand, the
repulsive interaction between O-MWCNT particles and collector surface is effectively
diminished for all sites, making the deposition rate coefficient influenced by site-blocking
effect (kb), identical to that due to CBFT (kd). The sites with or without impurities were
equally preferred by O-MWCNTs. Under these conditions, the inclusion of kb (as a
separate component from kd) is no longer important to the modeling and its value has
little impact on the simulation. It is noteworthy that at the beginning of each experiment,
where Smax ≫ S, no site-blocking is occurring and the full impact of kb is at play. Under
these conditions, which are likely to apply for the pulse input case, the overall deposition
rate coefficient measured using CBF alone will represent the added sum of deposition to
both site types – that is, kd,CBF-pulse = kd, + kb). Moreover, because these two mechanisms
were the dominant mechanisms responsible for O-MWCNT removal at most depths and
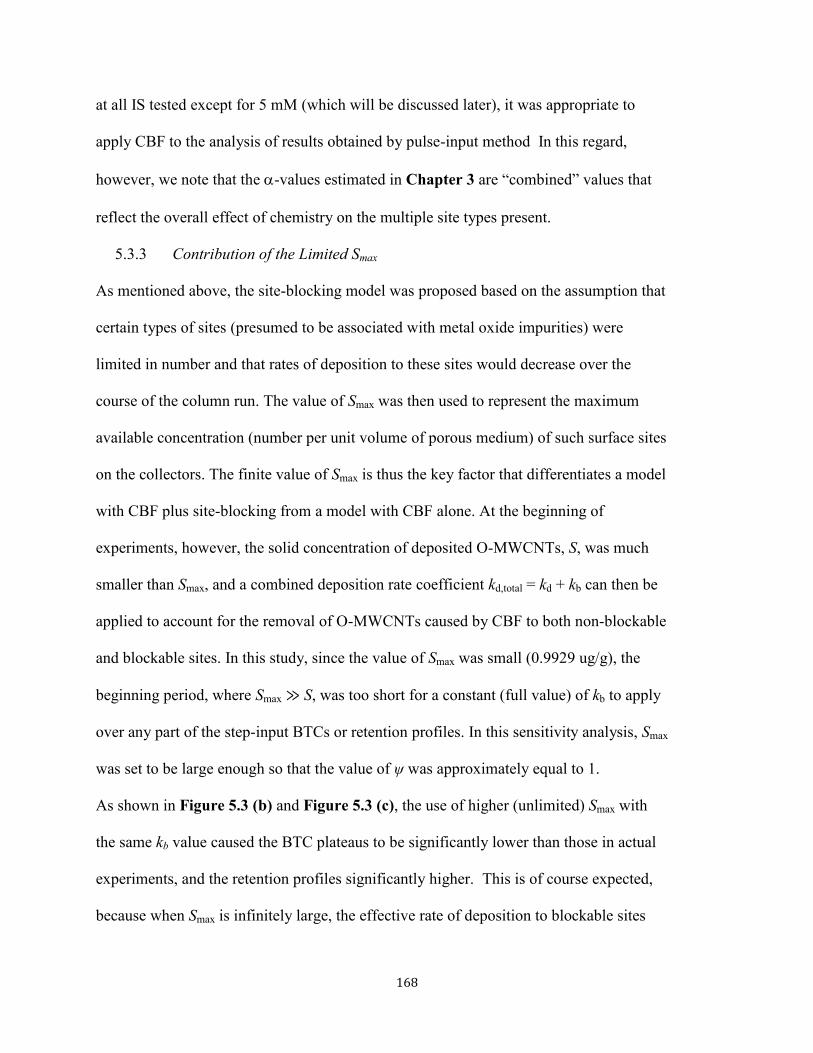
168
at all IS tested except for 5 mM (which will be discussed later), it was appropriate to
apply CBF to the analysis of results obtained by pulse-input method In this regard,
however, we note that the -values estimated in Chapter 3 are “combined” values that
reflect the overall effect of chemistry on the multiple site types present.
5.3.3 Contribution of the Limited Smax
As mentioned above, the site-blocking model was proposed based on the assumption that
certain types of sites (presumed to be associated with metal oxide impurities) were
limited in number and that rates of deposition to these sites would decrease over the
course of the column run. The value of Smax was then used to represent the maximum
available concentration (number per unit volume of porous medium) of such surface sites
on the collectors. The finite value of Smax is thus the key factor that differentiates a model
with CBF plus site-blocking from a model with CBF alone. At the beginning of
experiments, however, the solid concentration of deposited O-MWCNTs, S, was much
smaller than Smax, and a combined deposition rate coefficient kd,total = kd + kb can then be
applied to account for the removal of O-MWCNTs caused by CBF to both non-blockable
and blockable sites. In this study, since the value of Smax was small (0.9929 ug/g), the
beginning period, where Smax ≫ S, was too short for a constant (full value) of kb to apply
over any part of the step-input BTCs or retention profiles. In this sensitivity analysis, Smax
was set to be large enough so that the value of ψ was approximately equal to 1.
As shown in Figure 5.3 (b) and Figure 5.3 (c), the use of higher (unlimited) Smax with
the same kb value caused the BTC plateaus to be significantly lower than those in actual
experiments, and the retention profiles significantly higher. This is of course expected,
because when Smax is infinitely large, the effective rate of deposition to blockable sites
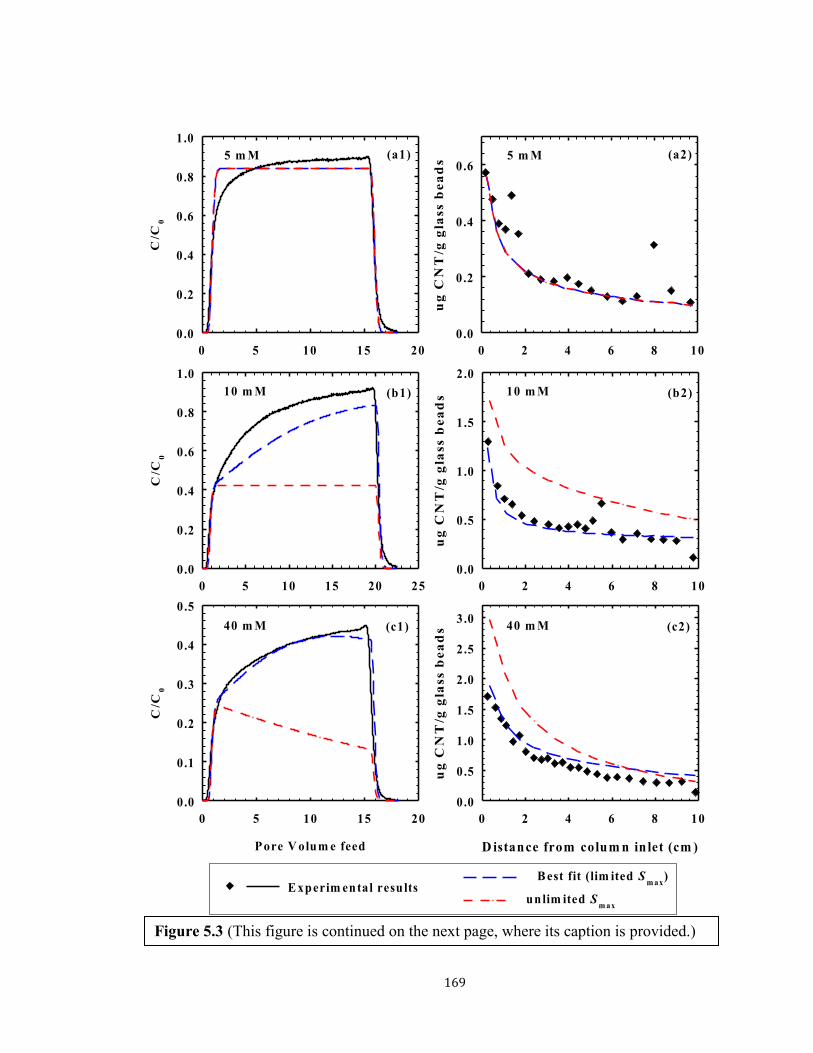
169
Pore V olum e feed
0 5 10 15 20
C/C
0
0.0
0.1
0.2
0.3
0.4
0.5
D istance from colum n in let (cm )
0 2 4 6 8 10
ug
CN
T/g
gla
ss b
ea
ds
0.0
0.5
1.0
1.5
2.0
2.5
3.0
0 5 10 15 20 25
C/C
0
0.0
0.2
0.4
0.6
0.8
1.0
0 2 4 6 8 10
ug
CN
T/g
gla
ss b
ea
ds
0.0
0.5
1.0
1.5
2.0
0 5 10 15 20
C/C
0
0.0
0.2
0.4
0.6
0.8
1.0
0 2 4 6 8 10
ug
CN
T/g
gla
ss b
ea
ds
0.0
0.2
0.4
0.6(a1) (a2)
(b1) (b2)
(c1) (c2)
5 m M 5 m M
10 m M 10 m M
40 m M 40 m M
E xperim ental resultsB est fit (lim ited S
m ax)
unlim ited Sm ax
Figure 5.3 (This figure is continued on the next page, where its caption is provided.)

170
will be fully equal to kb at all times and locations and thus greater than assumed in the
prior simulations for any site where blocking was high enough to be relevant. Under this
circumstance, C/C0 ~ 0.42 for IS = 10 mM and C/C0 ~ 0.25 for IS = 40 mM. These values
were important to simulate results obtained with pulse-input method. The simulation of
0 2 4 6 8 10 12
C/C
0
0.00
0.05
0.10
0.15
0.20
0.25
0.30
0 2 4 6 8 10
ug
CN
T/g
gla
ss b
ea
ds
0.0
0.5
1.0
1.5
2.0
Pore V olum e feed
0 2 4 6 8 10 12 14 16
C/C
0
0.00
0.02
0.04
0.06
0.08
0.10
0.12
D istance from colum n in let (cm )
0 2 4 6 8 10
ug
CN
T/g
gla
ss b
ea
ds
0
1
2
3
(d1) (d2)
(e1) (e2)
60 m M 60 m M
357 m M 357 m M
E xperim ental resultsB est fit
unlim ited sm ax
Figure 5.3. (continued from prior page) Analysis of the Smax effect on experimental
results obtained at pH 5.8± 0.2 and NaCl concentrations of (a) 5 mM, (b) 10 mM, (c)
40 mM, (d) 60 mM and (e) 357 mM. The Smax under each condition was increased to
infinitely large to analyze its importance and contribution.

171
unlimited Smax further revealed the function of CBF and blocking removal mechanisms
and could also help to explain the observation with pulse-input method. In experiments
where site-blocking mechanism was not important, the change of Smax didn’t alter the
simulation results as shown in Figure 5.3 (a), (d), (e).
5.3.4 Contribution of Straining Removal Mechanism
Unlike deposition under conditions of CBF and deposition to blockable sites, the
contribution of straining was unaffected by IS, with almost identical experimental results
obtained at IS of 5 mM, 10 mM, and 40 mM as shown in Figure 5.4. For results at IS =
40 mM, the plateau increased from ~ 0.1 at the beginning to ~ 0.3 in the end with the
diminishing removal rates over time presumable due to the existence of substantial site-
blocking effects. Although the contribution of kb and site-blocking was a strong function
of IS in this low IS range as discussed above, the total contribution of straining (as
evident from the changes observed with changing ks) was similar at 5, 10, and 40 mM .
For results obtained at 60 mM and 357 mM, however, the contribution of straining was
very limited. This is presumably because the effects of straining are overwhelmed by the
depositional removal mechanisms of CBF and multilayer deposition, both of which are
quite rapid at higher IS.
As shown in Table 4.3, the value of β -- a parameter obtained by fitting and used
to describe the distance-dependent decay of the straining effect -- was always below 1 at
IS ≤ 40 mM, but was as high as 4 at IS ≥ 60 mM,. These higher values indicate a much
faster decay of straining with distance for the high IS simulations. This is consistent with
the idea that other mechanisms are relatively more important at high IS and that straining
is only a major contributor early in the column.
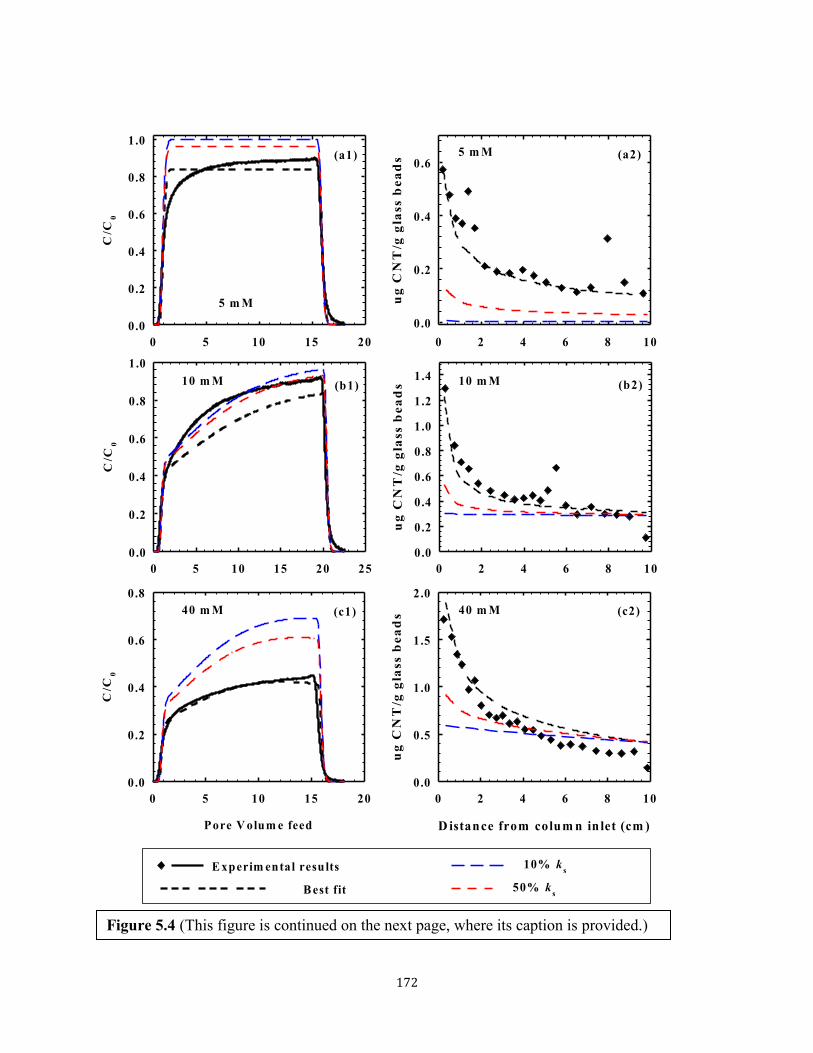
172
0 5 10 15 20
C/C
0
0.0
0.2
0.4
0.6
0.8
1.0
0 2 4 6 8 10
ug
CN
T/g
gla
ss b
ea
ds
0.0
0.2
0.4
0.6(a1) (a2)
0 5 10 15 20 25
C/C
0
0.0
0.2
0.4
0.6
0.8
1.0
0 2 4 6 8 10
ug
CN
T/g
gla
ss b
ea
ds
0.0
0.2
0.4
0.6
0.8
1.0
1.2
1.4(b1) (b2)
Pore V olum e feed
0 5 10 15 20
C/C
0
0.0
0.2
0.4
0.6
0.8
D istance from colum n in let (cm )
0 2 4 6 8 10
ug
CN
T/g
gla
ss b
ea
ds
0.0
0.5
1.0
1.5
2.0
(c1) (c2)
5 m M
5 m M
10 m M 10 m M
40 m M 40 m M
E xperim ental results
B est fit
10% ks
50% ks
Figure 5.4 (This figure is continued on the next page, where its caption is provided.)

173
5.3.5 Contribution of Ripening Removal Mechanism
The results of our sensitivity analyses with regard to the relative magnitude of the
ripening term are shown in Figure 5.5. The inclusion of a ripening term in the modeling
was found to manifest itself through the appearance of decreasing plateaus in the BTCs
0 2 4 6 8 10 12
C/C
0
0.00
0.05
0.10
0.15
0.20
0.25
0.30
0 2 4 6 8 10
ug
CN
T/g
gla
ss b
ea
ds
0.0
0.5
1.0
1.5
2.0
(d1) (d2)
Pore V olum e feed
0 2 4 6 8 10 12 14 16
C/C
0
0.00
0.02
0.04
0.06
0.08
0.10
0.12
D istance from colum n in let (cm )
0 2 4 6 8 10
ug
CN
T/g
gla
ss b
ea
ds
0
1
2
3(e1) (e2)
E xperim ental results
B est fit
10% ks
50% ks
60 m M 60 m M
357 m M 357 m M
Figure 5.4. (continued from prior page) Analysis of the contributions of straining
removal mechanism for experimental results obtained at pH 5.8± 0.2 and NaCl
concentrations of (a) 5 mM, (b) 10 mM, (c) 40 mM, (d) 60 mM and (e) 357 mM. The
straining term ks under each condition was reduced to 10% and 50% of its original
value to analyze its importance and contribution.
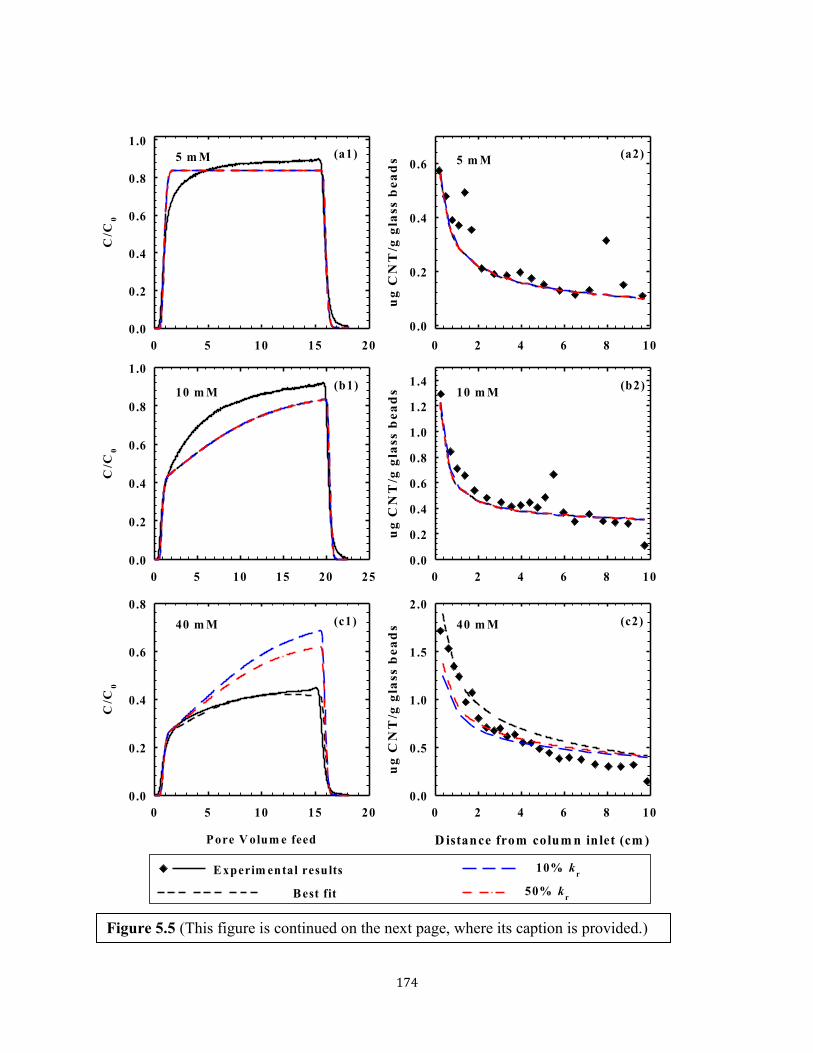
174
0 2 4 6 8 10
ug
CN
T/g
gla
ss b
ea
ds
0.0
0.2
0.4
0.6
0 5 10 15 20
C/C
0
0.0
0.2
0.4
0.6
0.8
1.0(a1) (a2)
0 2 4 6 8 10
ug
CN
T/g
gla
ss b
ea
ds
0.0
0.2
0.4
0.6
0.8
1.0
1.2
1.4
0 5 10 15 20 25
C/C
0
0.0
0.2
0.4
0.6
0.8
1.0
(b1) (b2)
Pore V olum e feed
0 5 10 15 20
C/C
0
0.0
0.2
0.4
0.6
0.8
D istance from colum n in let (cm )
0 2 4 6 8 10
ug
CN
T/g
gla
ss b
ea
ds
0.0
0.5
1.0
1.5
2.0
(c1) (c2)
5 m M 5 m M
10 m M 10 m M
40 m M 40 m M
E xperim ental results
B est fit
10% kr
50% kr
Figure 5.5 (This figure is continued on the next page, where its caption is provided.)
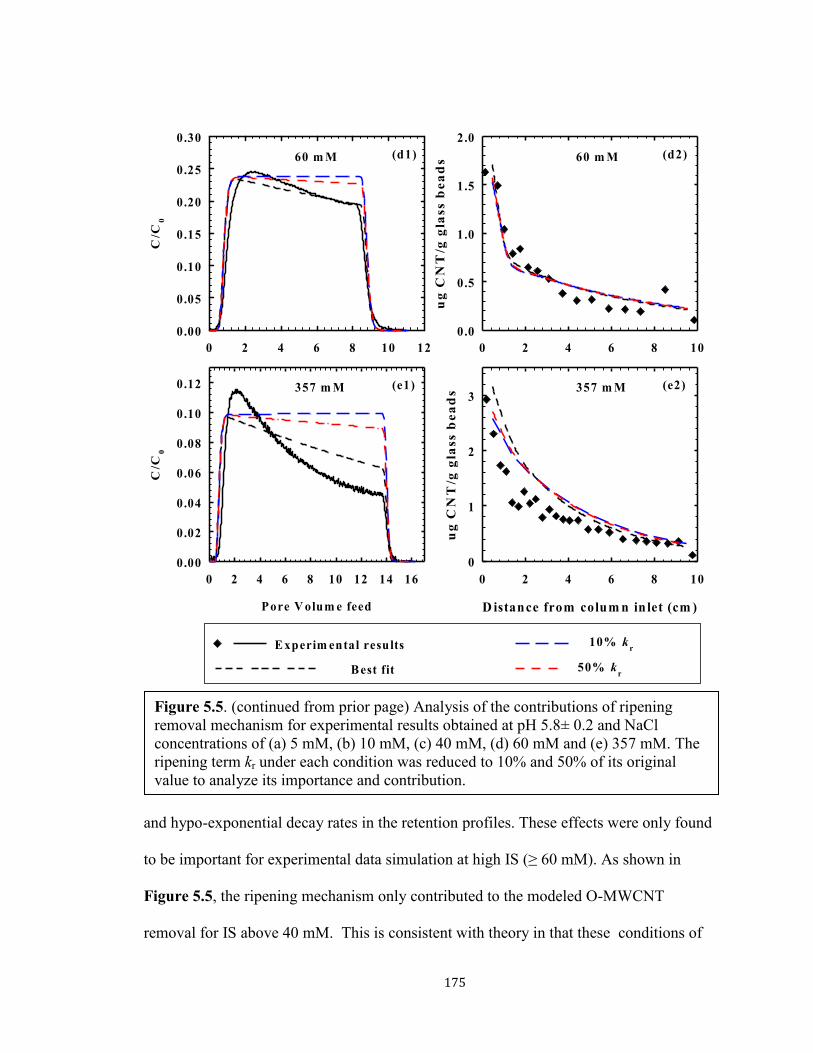
175
and hypo-exponential decay rates in the retention profiles. These effects were only found
to be important for experimental data simulation at high IS (≥ 60 mM). As shown in
Figure 5.5, the ripening mechanism only contributed to the modeled O-MWCNT
removal for IS above 40 mM. This is consistent with theory in that these conditions of
Figure 5.5. (continued from prior page) Analysis of the contributions of ripening
removal mechanism for experimental results obtained at pH 5.8± 0.2 and NaCl
concentrations of (a) 5 mM, (b) 10 mM, (c) 40 mM, (d) 60 mM and (e) 357 mM. The
ripening term kr under each condition was reduced to 10% and 50% of its original
value to analyze its importance and contribution.
0 2 4 6 8 10 12
C/C
0
0.00
0.05
0.10
0.15
0.20
0.25
0.30
0 2 4 6 8 10
ug
CN
T/g
gla
ss b
ea
ds
0.0
0.5
1.0
1.5
2.0
(d1) (d2)
D istance from colum n in let (cm )
0 2 4 6 8 10
ug
CN
T/g
gla
ss b
ea
ds
0
1
2
3
Pore V olum e feed
0 2 4 6 8 10 12 14 16
C/C
0
0.00
0.02
0.04
0.06
0.08
0.10
0.12 (e2)(e1)
E xperim ental results
B est fit
10% kr
50% kr
60 m M 60 m M
357 m M 357 m M

176
high IS are those where repulsive interaction between O-MWCNT particles would be
screened, allowing strong attractive interactions between dispersed O-MWCNTs and
those on collector surfaces. Also under the circumstance of high IS, the collector surfaces
would be more quickly occupied by O-MWCNTs such that more pre-existing O-
MWCNTs would be present. Figure 5.5 (c) shows that the ripening removal mechanism
accounted for only a small part of the simulated O-MWCNT removal at 40 mM NaCl. As
previously discussed in the context of Figure 5.2 and Figure 5.4 , mechanisms of site-
blocking and straining were found to play important roles in the simulation of
O-MWCNT removal at IS = 40 mM. Note that, although the concurrent application of all
three mechanisms can complicate the modeling exercise, each mechanism has a vastly
different type of effect on results, and each is relevant under its own specific set of
conditions. We postulate that 40 mM was not high enough to completely screen the
surface charges on o-MWCNTs and glass beads, and therefore O-MWCNTs still
preferred sites containing impurities of metal oxides, the gradual blocking of which
causes the plateau of the BTC to increase (as previously discussed). On the other hand, it
can be clearly observed that at 40 mM, much more O-MWCNTs were retained within the
column compared to experiments conducted at lower IS (see Figure 5.5 (a), (b) and (c)).
The large amount of deposited O-MWCNTs occupied most available glass bead surfaces
after a period of time and caused multi-layer deposition. The presence of the ripening
effect decreased the BTC plateau significantly relative to what would have occurred with
blocking alone (Figure 5.5 (c)), but still not profoundly enough to cause a decreasing
plateau over time, as in the higher IS cases (Figure 5.5(d) and 5.5.(e). Since the straining
effect existed under all conditions, and the amount of deposited O-MWCNTs at 40 mM
177
was not large enough to negate the losses caused by straining, the contribution of
straining could be easily observed. For BTCs and retention profiles obtained at higher IS
(60 mM, 357 mM), normal CBF and deposition and ripening were the two removal
mechanisms that dominated the simulations, with other mechanisms being relatively
unimportant.
5.3.6 Contributions of all effects at varied background IS
During the simulation, the specific contribution of CBF, straining, blocking, and
ripening effect can be calculated using Eq. 5.1. The summaries of the relative and
absolute contributions of each effect on the overall rate of O-MWCNT removal are
shown in Figure 5.6 and Figure 5.7, respectively.
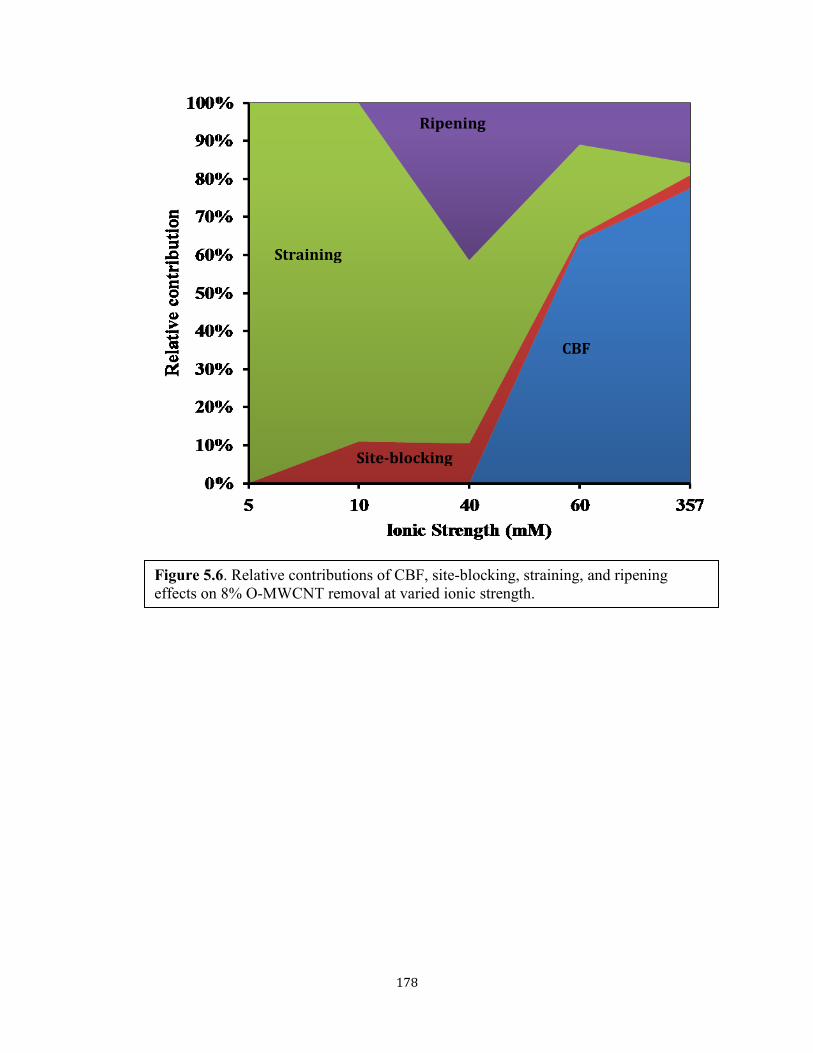
178
Figure 5.6. Relative contributions of CBF, site-blocking, straining, and ripening
effects on 8% O-MWCNT removal at varied ionic strength.
Site-blocking
Straining
CBF
Ripening

179
As shown in those figures, deposition (both kd and kb) played an important role in
O-MWCNT removal at IS ≥ 60 mM, but the separation kd and kb (i.e., of specific separate
consideration of a site-blocking model) was found to be most important at IS of 10 mM
and 40 mM. Although its effect was still noticeable above 60 mM, its importance was
much less profound. Overall, the combination of CBF and deposition to “blockable” sites
was found to account for the majority of O-MWCNT removal at IS ≥ 60 mM and the
combined first-order deposition rate was the one detected in pulse-input method. The
straining effect was less IS sensitive and was responsible for an almost consistent amount
of the modeled O-MWCNT removal except at 357 mM, where the effect of straining
Figure 5.7. Amount of 8% O-MWCNT removed by CBF, site-blocking, straining, and
ripening effects at varied ionic strength.
Site-blocking
Straining
CBF
Ripening
180
could not be clearly separated from the ripening effect. This effect was responsible for all
of the simulated removal at IS of 5 mM, which is consistent with the idea that all other
mechanisms will be effectively absent at such low IS. Ripening removal mechanisms
were found relevant to modeling only at high IS and provided reasonable explanation of
the decreasing plateaus at high IS. This mechanism also had a noticeable impact on
simulated O-MWCNT removal at IS ≥ 40 mM.
5.4 Conclusion
In general, the sensitivity analyses were very effective at revealing the relative
contributions of each removal mechanism on O-MWCNT removal at varied experimental
conditions. Overall, each of the four removal mechanisms had conditions where it was
relevant, such that consideration of all four was important in order to accurately simulate
the transport of O-MWCNTs through porous media under all of the conditions studied.

181
Chapter 6. Summary, Application, and Future Work
6.1 Summary
In this work, I established quantitative relationships between the surface
composition of oxidized multi-walled carbon nanotubes (O-MWCNTs) and their sorption
and transport properties under varying aquatic chemical conditions. Mathematical models
and computations were applied to test whether the hypothesized conceptual
understanding was useful for interpreting and predicting experimental observations.
6.1.1 Sorption Properties of O-MWCNTs
In work reported in this dissertation, the adsorption of divalent zinc and nickel
ions (Zn2+
and Ni2+
) onto O-MWCNTs under varied conditions was investigated
(Chapter 2). Effects of “aquatic chemistry”, surface chemistry, O-MWCNT aggregation
state and concentration, as well as competitive effects of naphthalene on the adsorption of
Zn2+
onto O-MWCNTs were studied.
The chemistry of the experimental aquatic environment, including pH, and ionic
strength (IS), affected the adsorption capacity of O-MWCNTs for Zn2+
and Ni2+
in ways
consistent with those previously reported in our research group.1 The adsorption of both
Zn2+
and Ni2+
increased with increasing pH and decreasing IS. The observed effects of O-
MWCNT surface chemistry on the adsorption of Zn2+
was also similar to those observed
in a prior study.1 O-MWCNTs with higher total oxygen concentrations and higher
concentrations of carboxylic groups exhibited higher adsorption capacity on Zn2+
. All
isotherms conducted using O-MWCNTs at 4 different surface oxygen concentrations
could be well fit by the traditional Langmuir isotherm model. The two-site Langmuir

182
model developed by Cho et al.1 and as described in Chapter 2 was applied to
mathematically analyze the role of carboxyl functional groups. This model fit the
experimental results reasonably well, indicating that the adsorption capacity of O-
MWCNTs comprised contributions primarily from graphene and carboxylic groups on
the surface. The presence of 5 mg/L naphthalene did not have any effect on the
adsorption of Zn2+
onto 8% O-MWCNTs, in contrast to the obvious suppressing effect of
other competing metallic ions on the adsorption of metallic ions onto O-MWCNTs.2
These results indicated that the primary adsorption mechanism for Zn2+
and similar
divalent cations is different from that for naphthalene, and therefore the competing
naphthalene did not effectively suppress the adsorption of cations.
Studies of aggregation state and solid-to-liquid ratio on adsorption were also
conducted. Ranges of S/L were studied for both the “original-powder-state” (aggregated)
and fully dispersed O-MWCNTs, as discussed in the paragraph below. Unfortunately,
however, there was only a single S/L value (0.061 g/L) at which the both aggregation
states could be studied, because of limits on both (1) the minimum amount of O-
MWCNT that could be accurately weighed in “powder-addition” systems (and therefore
minimum S/L values with experimentally practical volumes of liquid); and (2) maximum
S/L values that could be used for dispersed phase systems without reducing final aqueous
concentrations below detection limits.
Results obtained in the studies at the common identical solid-to-liquid ratio (S/L)
(0.061 g/L) revealed that there was no statistical difference in the adsorption isotherms
between aggregated and dispersed forms at the studied S/L. These results indicate that, at
the S/L value studied (0.061 g/L) no significant difference in adsorption extent exists
183
between O-MWCNTs that are still in their initial aggregated state, relative to when they
are sonicated and well dispersed. I interpret these results to mean that mechanism of
sorption is not dependent on aggregation state.
Although the aggregation state of the O-MWCNTs did not have any major effect
on the adsorption capacity of O-MWCNTs at S/L of 0.061 g/L, the solid-to-liquid ratio
showed significant effect on adsorption characteristics for both types of O-MWCNTs
studied, whose surface oxygen concentrations were 5.1% and 8.0%. For both types of O-
MWCNTs, isotherms obtained at lower solid-to-liquid ratios were significantly higher
than those obtained at relatively higher solid-to-liquid ratios, and this phenomenon was
observed with both the orginial-state-powders and the fuly dispersed tubes, albeit over
different S/L ranges, as previously discussed. We also observed that the effects of S/L
were primarily on sorption affinity at low Ce (i.e., the product of KLqmax) rather than on
adsorption capacity (qmax). Although there are numerous prior reports of similar findings
by other researchers on adsorption reactions of trace metals with soils and clays3-6
, the
source for the S/L effect remains unclear. Much prior work has focused on alternative
“artifactual” explanations for these findings, but there remain many cases where all
imagined explanations have been disproven3-5, 7
and I am also unable to posit a good
mechanistic explanation for results in the current case.
6.1.2 Transport Properties of O-MWCNTs
I also investigated numerous transport properties of O-MWCNTs of varying
surface oxygen concentrations through columns of uniform silica glass beads under a
wide range of aquatic conditions. Both pulse-input and step-input methods were
employed in these studies and analyses were conducted of both the aqueous
184
(breakthrough curves, BTCs) and adsorbed phases (retention profiles). A pulse-input
method was employed to investigate effects of aquatic and surface chemistry on O-
MWCNT transport, using temporal histories of O-MWCNT effluent concentrations, i.e.,
breakthrough curves (BTCs), under conditions where the overall removal of O-MWCNTs
was dominated by clean-bed filtration. Comparisons of results under these conditions
with those obtained under conditions of perfectly unfavorable attachment (distilled water)
allowed me to determine the effects of system chemistry on attachment efficiency, .
(Chapter 3). In other experiments described in Chapter 4, a step-input method was
employed to investigate effects of site blocking, straining, and ripening, which come to
have major effects with prolonged loading, and especially at the frontal ends of columns.
For these studies, data were obtained in the forms of both temporal histories of O-
MWCNT concentration in column effluent water (BTCs) as well as in-situ spatial
distributions of retained O-MWCNTs (retention profiles), as obtained through column
dissection at each experiment’s end. More complex mathematical models were developed
for the simulation and interpretation of experimental results (Chapter 4), and these
models were further tested to better understand their sensitivity to the various mechanistic
sub-models (Chapter 5).”
In regard to the effects of aquatic and surface chemistry on the transport of O-
MWCNTs (Chapter 3), our results provided important new data about O-MWCNT
attachment efficiencies as a function of aquatic and surface chemistry In the presence of
Na+, the required ionic strength (IS) for maximum particle attachment efficiency (i.e., the
critical deposition concentration, or CDC) increased as the O-MWCNT’s surface oxygen
concentration or pH increased, following qualitative tenets of theories based on

185
electrostatic interaction. In the presence of Ca2+
, CDC values were lower than those with
Na+ present, but were no longer sensitive to surface oxygen content. Because surface
oxygen groups are known to affect electrostatic interactions, these suggest that Ca2+
influences the interactions between O-MWCNTs and glass beads by mechanisms other
than electrostatics alone. The presence of Suwannee River natural organic matter
(SRNOM) decreased the attachment efficiency of O-MWCNTs in the presence of either
Na+ or Ca
2+, but with more pronounced effects when Na
+ was present. Nevertheless, low
concentrations of SRNOM (< 4 mg/L of dissolved organic carbon) were sufficient to
mobilize all O-MWCNTs studied at CaCl2 concentrations as high as10 mM. Overall,
results from these studies revealed that NOM content, pH and cation type have more
importance than the surface characteristics of O-MWCNTs in affecting O-MWCNTs
deposition during transport through silica-based porous media.
Chapter 4 contains findings in regard to the transport of O-MWCNTs through
columns packed with glass beads, including analysis of both breakthrough curves (BTCs)
and retention profiles at five different ionic strengths (IS). As previously noted, a step-
input method was employed, which allowed more O-MWCNTs to deposit onto glass
beads and both (a) ensured a sufficient quantity of deposited O-MWCNTs for the
creation of retention profiles and (b) caused a violation of the assumptions of clean-bed
filtration for some sets of conditions, and especially at the frontal end of the column.
Although the general trend of the experimental observation followed the expectation of
traditional theory based on clean-bed filtration and electrostatic interactions, the BTCs as
well as retention profiles exhibited features that could not be well explained by such
simple theory alone. Such features included BTC “plateaus” that either increased (low IS)

186
or decreased (high IS) over time as well as hypo-exponential decay in retention profiles.
Conventional CBFT models were first applied and shown not to simulate all of these
effects. Improved simulations were then obtained using modified models that incorporate
straining, site-blocking, and multilayer deposition (ripening). Simulation results indicated
that all four effects were necessary to explain the experimental observations. Sensitivity
analysis regarding simulation results (Chapter 5) revealed that at IS < 40 mM, site-
blocking and straining effects played relatively more significant roles than other effects.
For experiments conducted at higher IS (≥ 60 mM), CBF together with ripening effect
were the primary removal mechanisms. Site-blocking, straining and ripening effects all
made significant contributions in O-MWCNT removal at IS = 40 mM.
6.2 Application
The purpose of this study was to understand the behavior of O-MWCNTs and
their interactions with other contaminants, so as to help researchers better estimate risks
O-MWCNTs may pose on human and ecosystems. Findings from this study have
partially fulfilled this purpose and outputs from model development can also be used to
estimate the transport of colloidal particles other than O-MWCNTs.
Findings from the adsorption study (Chapter 2) have furthered the understanding
of the interactions of trace metals with O-MWCNTs. Effects of aquatic and surface
chemistry estimated in this study were consistent with prior findings obtained in our
laboratory and elsewhere1, 8-10
Importantly, however, this work also made new
discoveries about the effect of experimental conditions on measured sorption isotherms.
In particular, a significant effect of S/L was revealed, indicating that the adsorption
capacity of well-dispersed O-MWNCTS (for at least Zn2+
and possibly many other types
187
of low-molecular weight adsorbates) may be underestimated by studies conducted with
high O-MWCNT concentrations, as has been the case in much prior work. Adsorption
results developed in this study using O-MWCNTs at environmentally relevant
concentrations provide necessary information for the estimation of O-MWCNT
interactions with Zn2+
in natural environments and suggests a more appropriate method
for obtaining adsorption isotherms for dispersed O-MWCNTs with other adsorbates in
future research.
Transport properties of O-MWCNTs were investigated using columns packed
with spherical glass beads as porous media. The rigid methods of glass-bead preparation
and column packing developed in this study as described in Chapter 3 are necessary to
create stable and consistent experimental conditions and therefore to guarantee the output
of reliable results. These methods are useful for future researchers conducting similar
column experiments to investigate the transport properties of colloidal particles as well as
aqueous contaminants. Findings from the transport study not only provide a thorough
analysis of the effects of aquatic and surface chemistry, but also provide a valuable
source of new data for estimating O-MWCNT behavior in aquatic environments. Results
indicated that in natural environments where both Ca2+
and NOM are present, O-
MWCNT transport may be largely independent of O-MWCNT surface oxidation, with
attachment efficiencies of dispersed O-MWCNTs being instead controlled primarily by
the amount of adsorbed NOM and other aquatic conditions such as pH, ionic strength,
and ionic composition. The observed independence of the transport of O-MWCNTs on
their surface chemistry suggests that, for purposes of generalized risk estimation under
these common aquatic conditions (of NOM presence), it may be possible to treat O-

188
MWCNTs with varied surface characteristics as a single kind of model colloid. Moreover,
the reported values of attachment efficiency may be directly useful for making gross
estimates of environmental transport under some conditions, such as in subsurface sand
and gravel aquifers where grain size and uniformity are sufficient to exclude straining
mechanisms.
In this study, I also investigated a variety of filtration-related mechanisms of O-
MWCNTs using both experimental approaches and mathematical simulations (Chapter
4). Developments in both regards should be useful to future researchers. The method of
column dissection was found useful for developing retention profiles of colloidal
particles after transport experiments. This method has been used in similar studies such as
the studies of O-MWCNT11
, fullerene12
or graphene oxide13
transport through porous
media. The models used for the simulation of experimental results were developed from
basic concepts of traditional clean bed filtration theory,14-16
in combination with prior
approaches suggested by others for simulating the effects of site-blocking,17
straining,18,
19 and multilayer deposition.
20, 21 In scenarios where multiple removal mechanisms
control the movement of colloidal particles, the new combined model could be a useful
tool to others for estimating the contribution of each removal mechanism under varied
conditions.
6.3 Future Work
The environmental implication of O-MWCNTs has been intensively investigated
in study presented in this dissertation in terms of the effects of varied environmental
conditions on their transport properties and their adsorption properties for heavy metals
as typical aquatic contaminants. Experimental approaches and mathematical simulation
189
are also applied to study the mechanisms of O-MWCNT removal through porous media.
More studies, however, need to be conducted especially at several aspects as shown
below.
6.3.1 Investigation on Physical Meaning of Solid-to-Liquid Effect
Although the effect of solid-to-liquid ratio in adsorption studies has been reported
previously, the reason for such effect is still to be investigated. Several hypothesized
explanations were provided in prior literature. McKinley et al.6 have summarized them as
follows: (1) adsorption by “non-settling” colloids that remain suspended in the aqueous
phase after centrifugation or filtration;22-25
(2) competition for adsorbate by complexing
agents (particularly organic carbon) desorbed from the adsorbent;23-26
(3) implicit
adsorbate competition;26, 27
(4) increased solid aggregation (e.g., flocculation) to produce
a net decrease in readily available adsorption sites;22, 28-31
and (5) extraneous chemical
reactions.32
For example, Di Toro et al.4, 5
proposed particle interaction model to explain
the increasing adsorption of heavy metals onto montmorillonite and quartz with
decreasing adsorbent concentration. The model could fit experimental data well but the
proposed physical explanation for this model is questionable and solid mechanistic
underpinnings for the observations have yet to be well developed. Zhang et al.7 attributed
increasing amounts of adsorbed pyrene onto CNTs after sonication to the presence of
more exposed surface in dispersed CNTs that were broken down from aggregates during
sonication. In our current study, however, we observed little difference on adsorption
ability between dispersed and non-disaggregated O-MWCNTs when the experiments
were conducted at similar S:L. As with the prior observations summarized by Di Toro et
al., a mechanistically defensible theory is still needed to explain the solid-to-liquid effects
190
observed in our current study. This is a potentially intriguing area for further research but
we unfortunately do not have a strong hypothesis to test at this time.
6.3.2 Investigation of O-MWCNT Transport Properties under More
Environmentally Relevant Conditions
In this study, the transport of O-MWCNTs was investigated using spherical glass
beads as model porous media under simple aquatic environment (single cation, limited
impurities). In this simplified experimental environment, the behavior of O-MWCNTs
could be observed with limited interference and the removal mechanisms could be easily
separated. In order to better relate these results to O-MWCNT transport in the
environment, however, additional studies are needed under more complex circumstances.
In particular, it would be useful to systematically increase the complexity of the porous
medium, for example by introducing non-spherical grains and grain-size distributions.
More complex media that includes a wide range of mineral surfaces and particulate
organic matter would also add complications deserving of direct study. Such
complications will undoubtedly have major impact on transport and it is currently unclear
whether the trends and mechanisms identified in dissertation work will always apply.
6.3.3 Further Improvement and Testing of the Developed Model
The multi-process filtration models developed in this work could be used more
widely for simulating other types of colloidal transport. Although this model was able to
fit the experimental results well in this study, it should be further tested with other kinds
of colloidal particles for verification. A particular result that needs further testing is the
issue of deposition mechanism for rod-like colloid such as O-MWCNTs. In the work
presented here, the transport of initially dispersed O-MWCNTs showed velocity effects

191
consistent with deposition by interception, suggesting that the O-MWCNTs behaved as
spherical particles with effective diameters equal to their lengths. It is unclear, however,
as to whether this finding was the result of re-aggregation of the tubes during transport
(perhaps into bundles of roughly this size) or whether rotation of the tubes during
transport may have caused them to occupy effectively spherical volumes defined by their
length. Additional testing with other rod-like or thread-like particles would be useful in
testing this and other assumptions, and for investigating the role of aspect ratio and size
on the effect.
6.4 Cited References
1. Cho, H. H.; Wepasnick, K.; Smith, B. A.; Bangash, F. K.; Fairbrother, D. H.;
Ball, W. P., Sorption of Aqueous Zn[Ii] and Cd[Ii] by Multiwall Carbon Nanotubes: The
Relative Roles of Oxygen-Containing Functional Groups and Graphenic Carbon.
Langmuir 2010, 26, (2), 967-981.
2. Li, Y. H.; Ding, J.; Luan, Z. K.; Di, Z. C.; Zhu, Y. F.; Xu, C. L.; Wu, D. H.;
Wei, B. Q., Competitive Adsorption of Pb2+
, Cu2+
and Cd2+
Ions from Aqueous Solutions
by Multiwalled Carbon Nanotubes. Carbon 2003, 41, (14), 2787-2792.
3. Di Toro, D. M., A Particle Interaction Model of Reversible Organic Chemical
Sorption. Chemosphere 1985, 14, (10), 1503 - 1538.
4. Di Toro, D. M.; Horzempa, L. M., Reversible and Resistant Components of
Pcb Adsorption-Desorption. Environmental Science and Technology 1982, 16, (9), 594 -
602.
5. Di Toro, D. M.; Mahony, J. D.; Kirchgraber, P. R.; O'byrne, A. L.; Pasquale, L.
R.; Piccirilli, D. C., The Effects of Nonreversibiliy, Particle Concentration, and Ionic
Strength on Heavy Metal Sorption. Environmental Science and Technology 1986, 20, (1),
55 - 61.
6. Mckinley, J. P.; Jenne, E. A., Experimental Investigation and Review of the
"Solids Concentration" Effect in Adsorption Studies. Environmental Science and
Technology 1991, 25, (12), 2082 - 2087.
7. Zhang, X.; Kah, M.; Jonker, M. T. O.; Hofmann, T., Dispersion State and
Humic Acids Concentration-Dependent Sorption of Pyrene to Carbon Nanotubes.
Environ Sci Technol 2012, 46, (13), 7166-7173.

192
8. Chen, C. L.; Wang, X. K., Adsorption of Ni(Ii) from Aqueous Solution Using
Oxidized Multiwall Carbon Nanotubes. Ind Eng Chem Res 2006, 45, (26), 9144-9149.
9. Chen, G. C.; Shan, X. Q.; Wang, Y. S.; Pei, Z. G.; Shen, X. E.; Wen, B.;
Owens, G., Effects of Copper, Lead, and Cadmium on the Sorption and Desorption of
Atrazine onto and from Carbon Nanotubes. Environ Sci Technol 2008, 42, (22), 8297-
8302.
10. Velickovic, Z. S.; Bajic, Z. J.; Ristic, M. D.; Djokic, V. R.; Marinkovic, A. D.;
Uskokovic, P. S.; Vuruna, M. M., Modification of Multi-Wall Carbon Nanotubes for the
Removal of Cadmium, Lead and Arsenic from Wastewater. Dig J Nanomater Bios 2013,
8, (2), 501-511.
11. Wang, Y. G.; Kim, J. H.; Baek, J. B.; Miller, G. W.; Pennell, K. D., Transport
Behavior of Functionalized Multi-Wall Carbon Nanotubes in Water-Saturated Quartz
Sand as a Function of Tube Length. Water Res 2012, 46, (14), 4521-4531.
12. Wang, Y.; Li, Y.; Fortner, J. D.; Hughes, J. B.; Abriola, L. M.; Pennell, K. D.,
Transport and Retention of Nanoscale C60 Aggregates in Water-Saturated Porous Media.
Environ Sci Technol 2008, 42, (10), 3588-3594.
13. Lanphere, J. D.; Luth, C. J.; Walker, S. L., Effects of Solution Chemistry on
the Transport of Graphene Oxide in Saturated Porous Media. Environ Sci Technol 2013,
47, (9), 4255-4261.
14. Yao, K. M.; Habibian, M. T.; O'melia, C. R., Water and Waste Water
Filtration: Concepts and Applications. Environmental Science and Technology 1971, 5,
(11), 1105-1112.
15. Rajagopalan, R.; Tien, C., Trajectory Analysis of Deep-Bed Filtration with
Sphere-in-Cell Porous-Media Model. Aiche J 1976, 22, (3), 523-533.
16. Tufenkji, N.; Elimelech, M., Correlation Equation for Predicting Single-
Collector Efficiency in Physicochemical Filtration in Saturated Porous Media. Environ
Sci Technol 2004, 38, (2), 529-536.
17. Liu, X. Y.; O'carroll, D. M.; Petersen, E. J.; Huang, Q. G.; Anderson, C. L.,
Mobility of Multiwalled Carbon Nanotubes in Porous Media. Environ Sci Technol 2009,
43, (21), 8153-8158.
18. Bradford, S. A.; Bettahar, M., Straining, Attachment, and Detachment of
Cryptosporidium Oocysts in Saturated Porous Media. J Environ Qual 2005, 34, (2), 469-
478.
19. Bradford, S. A.; Simunek, J.; Bettahar, M.; Van Genuchten, M. T.; Yates, S.
R., Modeling Colloid Attachment, Straining, and Exclusion in Saturated Porous Media.
Environ Sci Technol 2003, 37, (10), 2242-2250.
20. Ryde, N.; Kallay, N.; Matijevic, E., Particle Adhesion in Model Systems .14.
Experimental Evaluation of Multilayer Deposition. J Chem Soc Faraday T 1991, 87, (9),
1377-1381.
21. Ryde, N.; Kihira, H.; Matijevic, E., Particle Adhesion in Model Systems .15.
Effect of Colloid Stability in Multilayer Deposition. J Colloid Interf Sci 1992, 151, (2),
421-432.
22. Li, Y. H.; Burkhardt, L.; Buchholtz, M.; Ohara, P.; Santschi, P. H., Partition
of Radiotracers between Suspended Particles and Seawater. Geochimica Et
Cosmochimica Acta 1984, 48, (10), 2011-2019.
193
23. Gschwend, P. M.; Wu, S. C., On the Constancy of Sediment Water Partition-
Coefficients of Hydrophobic Organic Pollutants. Environ Sci Technol 1985, 19, (1), 90-
96.
24. Voice, T. C.; Rice, C. P.; Weber, W. J., Effect of Solids Concentration on the
Sorptive Partitioning of Hydrophobic Pollutants in Aquatic Systems. Environ Sci Technol
1983, 17, (9), 513-518.
25. Voice, T. C.; Weber, W. J., Sorbent Concentration Effects in Liquid Solid
Partitioning. Environ Sci Technol 1985, 19, (9), 789-796.
26. Higgo, J. J. W.; Rees, L. V. C., Adsorption of Actinides by Marine-Sediments
- Effect of the Sediment Seawater Ratio on the Measured Distribution Ratio. Environ Sci
Technol 1986, 20, (5), 483-490.
27. Curl, R. L.; Keoleian, G. A., Implicit-Adsorbate Model for Apparent
Anomalies with Organic Adsorption on Natural Adsorbents. Environ Sci Technol 1984,
18, (12), 916-922.
28. Grover, R.; Hance, R. J., Effect of Ratio of Soil to Water on Adsorption of
Linuron and Atrazine. Soil Sci 1970, 109, (2), 136-&.
29. Chang, C. C. Y.; Davis, J. A.; Kuwabara, J. S., A Study of Metal-Ion
Adsorption at Low Suspended-Solid Concentrations. Estuar Coast Shelf S 1987, 24, (3),
419-424.
30. Santschi, P. H., Factors Controlling the Biogeochemical Cycles of Trace-
Elements in Fresh and Coastal Marine Waters as Revealed by Artificial Radioisotopes.
Limnol Oceanogr 1988, 33, (4), 848-866.
31. Nyffeler, U. P.; Li, Y. H.; Santschi, P. H., A Kinetic Approach to Describe
Trace-Element Distribution between Particles and Solution in Natural Aquatic Systems.
Geochimica Et Cosmochimica Acta 1984, 48, (7), 1513-1522.
32. Avotins, P.; Jenne, E. A., Time Stability of Dissolved Mercury in Water
Samples .2. Chemical Stabilization. J Environ Qual 1975, 4, (4), 515-519.

194
Curriculum Vitae
Jin Yang 2526 Rellim Rd, Apt B, Baltimore, MD 21209 [email protected] (410)350-5387
Education Ph.D., Environmental Engineering (3/2014) Johns Hopkins University, Baltimore, MD GPA 3.7/4.0 M.S., Environmental Engineering (5/2008) Johns Hopkins University, Baltimore, MD GPA 3.9/4.0 B.S., Environmental Science (7/2007) Peking University, Beijing, China GPA 3.3/4.0 B.S., Economics (7/2007) Peking University, Beijing, China GPA 3.0/4.0
Skills Computation and data analysis: MATLAB, Mathematica, Sigma-plot, SPSS, C
Sample Analysis: Chemical detection (GC/MS, ICP-MS, AAS, UV-Vis, TOC, LSC), material characterization (BET surface area analysis, DLS) Language: English (fluent), Mandarin Chinese (Native)
Research Projects Project I: Implication of oxidized multi-walled carbon nanotubes (O-MWCNTs) to aquatic environments: aggregation, adsorption and transport of MWCNTs and their interaction with pre-existing co-contaminants Advisor: Prof. William P. Ball Sep, 2008 – present Johns Hopkins University, Baltimore, MD Developed a reliable experimental set-up to analyze the transport of O-MWCNTs in simulated porous media; Summarized and improved currently available theoretical models for O-MWCNT removal and successfully conducted simulation using MATLAB; Discovered an important effect of the solid-to-liquid ratio on adsorption of Zn2+ and Ni2+ onto O-MWCNTs and proposed theoretical explanation; Collaborated with graduate students and a professor from Chemistry department and advised 7 undergraduate or graduate lab assistants on the investigation of O-MWCNT transport and adsorption properties. Project II: Analysis on the Interdependency of Infrastructure networks Advisor: Prof. Seth Guikema Sep, 2013 – present Applied graph theory, Monte Carlo method, and Dijkstra’s algorithm in the analysis of infrastructure networks; Learnt new knowledge regarding optimization and graph theory within one semester and successfully created simulated networks for infrastructure systems. Project III: Investigation of effect of UV light exposure on the stability of CNTs – redox reaction in the presence of radicals Advisor: Prof. Howard Fairbrother Aug. 2012 – Jan. 2013 Investigated the effect of UV light on the stability of dispersed O-MWCNTs and the possible mechanism for these effects; Collaborated with Graduate students and professors from Chemistry Department in JHU and Department of Environmental Engineering in Purdue Univesrity.
Publications and Presentations Yang, J.; Bitter, J. L.; Smith, B. A.; Fairbrother, D. H.; Ball, W. P., Transport of multi-walled carbon nanotubes through porous media: influences of aquatic chemistry, surface oxidation, and natural organic matter. Environ Sci Technol 2013, 47, (24), 14034-14043. Smith, B.; Yang, J.; Bitter, J. L.; Ball, W. P.; Fairbrother, D. H., Influence of Surface Oxygen on the Interactions of Carbon Nanotubes with Natural Organic Matter. Environ Sci Technol 2012, 46, (23), 12839-12847.
195
Yang, J.; Smith, B. A.; Bitter, J. L.; Fairbrother, D. H.; Ball, W. P., Transport mechanism of multi-walled carbon nanotubes through porous media, (manuscript in preparation)
Platform Presentations “Aggregation, Sorption and Transport Properties of Carbon Nanotubes as Influenced by Surface Oxides” SETAC North America 33rd Annual meeting (EPA grantee meeting), Long Beach, CA, Nov, 11 – 15, 2012 “Transport of Multi-Walled Carbon Nanotubes through Porous Media” The 86th ACS Colloid & Surface Symposium, Baltimore, MD, Jun, 10 – 13, 2012 “Transport properties of Multi-Walled Carbon Nanotubes: Influence of Surface Oxides and Aquatic Chemistry” The 2011 Association of Environmental Engineering and Science Professors (AEESP) Education & Research Conference, Tampa, FL, Jul, 10 – 12, 2011 “Transport of Oxidized Multi-Walled Carbon Nanotubes through Porous Media” The 240th ACS National Meeting (Hot Topic Talk), Boston, MA, Aug, 22 – 26, 2010
Poster Presentations “Transport of Oxidized Multi-Walled Carbon Nanotubes (O-MWCNTs) through porous media” The 2nd Gordon Research Conference on Environmental Nanotechnology, Stoweflake Resort and Conference Center, Stowe, VT, Jun, 2-7, 2013 “Transport of Oxidized Multi-Walled Carbon Nanotubes through Porous Media” The 1st Gordon Research Conference Environmental Nanotechnology, Waterville Valley Resort, NH, May, 29 – Jun, 3, 2011 “Challenges in Experimental Studies with Nanomaterials: Sorption and Transport Studies with Carbon Nanotubes” The 2010 Gordon Research Conference Environmental Sciences: Water, Jun, 20 – 25, 2010 “Adsorption of Divalent Aquatic Contaminants by Oxidized Multi-Walled Carbon Nanotubes: Modeling and Measurements” The 4th Annual Symposium of the Institute of NanoBioTechnology (INBT), Baltimore, MD, Apr, 29, 2010 “Influence of Surface Oxidation on Divalent Cations Sorption Properties of Multi-Walled Carbon Nanotubes in Single- and Binary-Solute System” The 2009 Association of Environmental Engineering and Science Professors (AEESP) Education & Research Conference, Iowa City, IA, Jul, 26 – 29, 2009
Honors and Awards The Lee Albert H. Halff Doctoral Student Award (Sep, 2012- Dec, 2012) Department of Geography and Environmental Engineering, Johns Hopkins University
Top Related