


Languages
Pages
Legal

88Active Physics
Safety
GOALSIn this activity you will:
• Define speed.
• Identify constant and changingspeeds.
• Interpret distance-time andspeed-time graphs.
• Contrast average andinstantaneous speeds.
• Calculate the distance traveledat constant speed.
Activity 2 Speed and Following Distance
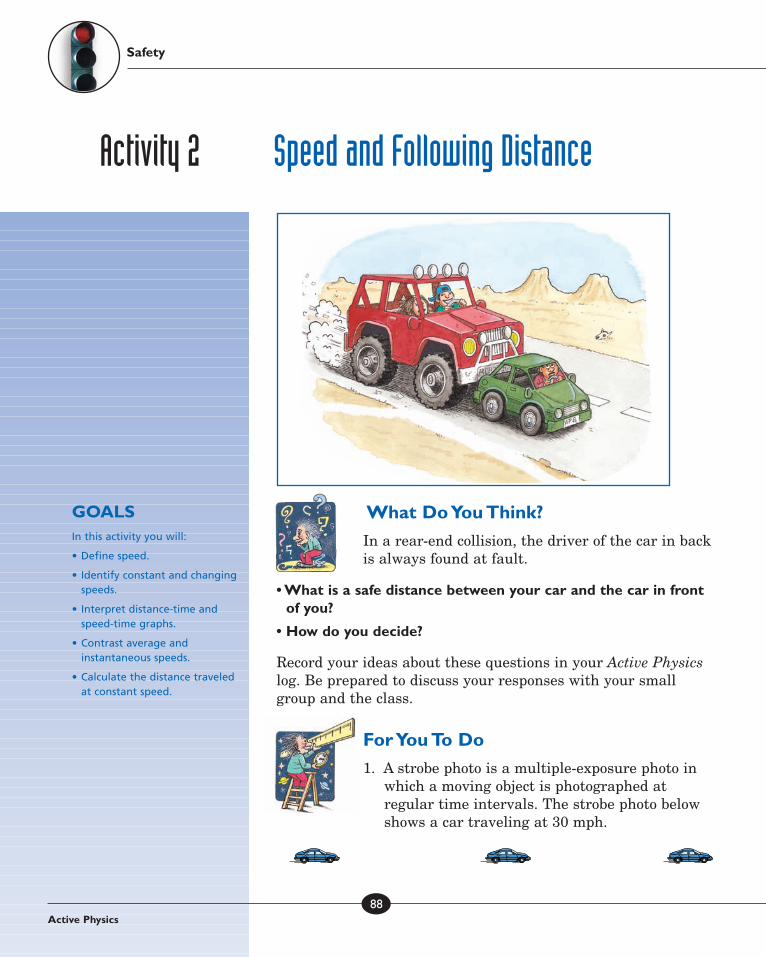
What Do You Think?In a rear-end collision, the driver of the car in backis always found at fault.
• What is a safe distance between your car and the car in frontof you?
• How do you decide?
Record your ideas about these questions in your Active Physicslog. Be prepared to discuss your responses with your smallgroup and the class.
For You To Do1. A strobe photo is a multiple-exposure photo in
which a moving object is photographed atregular time intervals. The strobe photo belowshows a car traveling at 30 mph.
CS_Ch2_Safety 2/24/05 12:04 AM Page 88

89Coordinated Science for the 21st Century
Activity 2 Speed and Following Distance
a) Copy the sketch in your log.2. Think about the difference between the motion of a car
traveling at 30 mph and one traveling at 45 mph.
a) Draw a sketch of a strobe photo, similar to the one above,of a car traveling at 45 mph.
b) Are the cars the same distance apart? Were they fartherapart or closer together than at 30 mph?
c) Draw a sketch for a car traveling at 60 mph. Describe howyou decided how far apart to place the cars.
3. The following sketch shows a car traveling at different speeds.
a) Copy the sketch in your log. Mark where the car istraveling fast, where it is traveling slowly, and where it istraveling at a constant speed. How did you know?
4. A sonic ranger connected to a computer will produce a graphthat shows an object’s motion. Use the sonic ranger setup toobtain the following graphs to print or sketch in your log.
a) Sketch a graph of a person walking toward the sonicranger at a normal speed.
b) Sketch a graph of a person walking away from the sonicranger at a normal speed.
c) Sketch a graph of a person walking both directions at a very slow speed.
d) Sketch a graph of a person walking both directions at a fast speed.
5. Predict what the graph will look like if youwalk toward the system at a slow speed andaway at a fast speed. Test your prediction.
a) Record your prediction in your log.b) Based on your measurements, how accurate
was your prediction?
Make sure the path of motion is clear of any hazards.
CS_Ch2_Safety 2/24/05 12:04 AM Page 89
90Active Physics
Safety
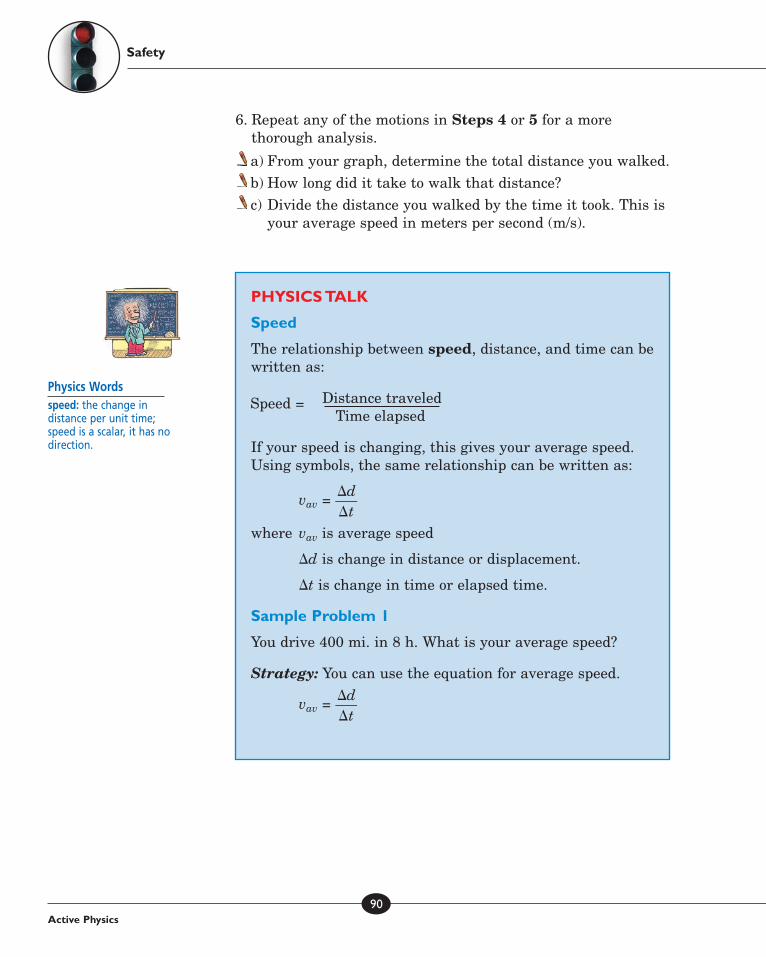
6. Repeat any of the motions in Steps 4 or 5 for a morethorough analysis.
a) From your graph, determine the total distance you walked.b) How long did it take to walk that distance?c) Divide the distance you walked by the time it took. This is
your average speed in meters per second (m/s).
PHYSICS TALK
Speed
The relationship between speed, distance, and time can bewritten as:
Distance traveledTime elapsed
If your speed is changing, this gives your average speed.Using symbols, the same relationship can be written as:
vav = ��
�
dt�
where vav is average speed
�d is change in distance or displacement.
�t is change in time or elapsed time.
Sample Problem 1
You drive 400 mi. in 8 h. What is your average speed?
Strategy: You can use the equation for average speed.
vav = ��
�
dt�
Speed =Physics Wordsspeed: the change indistance per unit time;speed is a scalar, it has nodirection.
CS_Ch2_Safety 2/24/05 12:04 AM Page 90

91Coordinated Science for the 21st Century
Activity 2 Speed and Following Distance
Givens:
�d = 400 mi.
vav = ��
�
dt�
= �40
80
hmi.�
= 50 mph (miles per hour)
Your average speed is 50 mph. This does not tell you thefastest or slowest speed that you traveled. This also doesnot tell you how fast you were going at any particularmoment.
Sample Problem 2
Elisha would like to ride her bike to the beach. From cartrips with her parents, she knows that the distance is 30 mi. She thinks she can keep up an average speed ofabout 15 mph. How long will it take her to ride to thebeach?
Strategy: You can use the equation for average speed.
vav = ��
�
dt�
However, you will first need to rearrange the terms tosolve for elapsed time.
�t = �v�
a
d
v�
Solution:
�t = �v�
a
d
v�
= �1350
mm
pih.
�
= 2 h
CS_Ch2_Safety 2/24/05 12:04 AM Page 91

92Active Physics
Safety
92
FOR YOU TO READ
Representing Motion
One way to show motion is with the use of strobe photos.A strobe photo is a multiple-exposure photo inwhich a moving object is photographed atregular time intervals.The sketches you used inSteps 1, 2, and 3 in For You To Do are similarto strobe photos. Here is a strobe photo of a cartraveling at the average speed of 50 mph.
Another way to represent motion is with graphs.The graph below shows a car traveling at theaverage speed of 50 mph.
Kilometers and Miles
Highway signs and speed limits in the USA aregiven in miles per hour, or mph.Almost every other country inthe world uses kilometers tomeasure distances. Akilometer is a little less thantwo-thirds of a mile. Kilometersper hour (km/h) is used tomeasure highway driving speed. Shorterdistances, such as for track events and
experiments in a science class,are measured in metersper second, m/s.
You will use mph whenworking with driving
speeds, but meters persecond for data you collect in
class.The good news is that youdo not need to change measuresbetween systems. It is important to
be able to understand and compare measures.
To help you relate the speeds with which you arecomfortable to the data you collect in class, thechart below gives approximate comparisons.
Time (hours)
200
150
100
50
1 2 3 4
Dis
tan
ce (
mil
es)
School zone
Residentialstreet
Suburbaninterstate
Ruralinterstate
25 mph
35 mph
55 mph
75 mph
40 km/h
55 km/h
90 km/h
120 km/h
11 m/s
16 m/s
25 m/s
34 m/s
CS_Ch2_Safety 2/24/05 12:05 AM Page 92

93Coordinated Science for the 21st Century
Activity 2 Speed and Following Distance
Reflecting on the Activity and the ChallengeYou now know how reaction time and speed affect the distancerequired to stop. You should be able to make a good argumentabout tailgating as part of the Chapter Challenge. If your carcan be designed to limit tailgating or to alert drivers to thedangers of tailgating, it will add to improved safety.
Physics To Go1. Describe the motion of each car moving to the right. The
strobe pictures were taken every 3 s (seconds).
a)
b)
2. Sketch strobe pictures of the following:
a) A car starting at rest and reaching a final constant speed.b) A car traveling at a constant speed then coming to a stop.
3. For each graph below, describe the motion of the car:
d
t
d
t
d
t
d
t
a) b)
c) d)
CS_Ch2_Safety 2/24/05 12:05 AM Page 93
94Active Physics
Safety
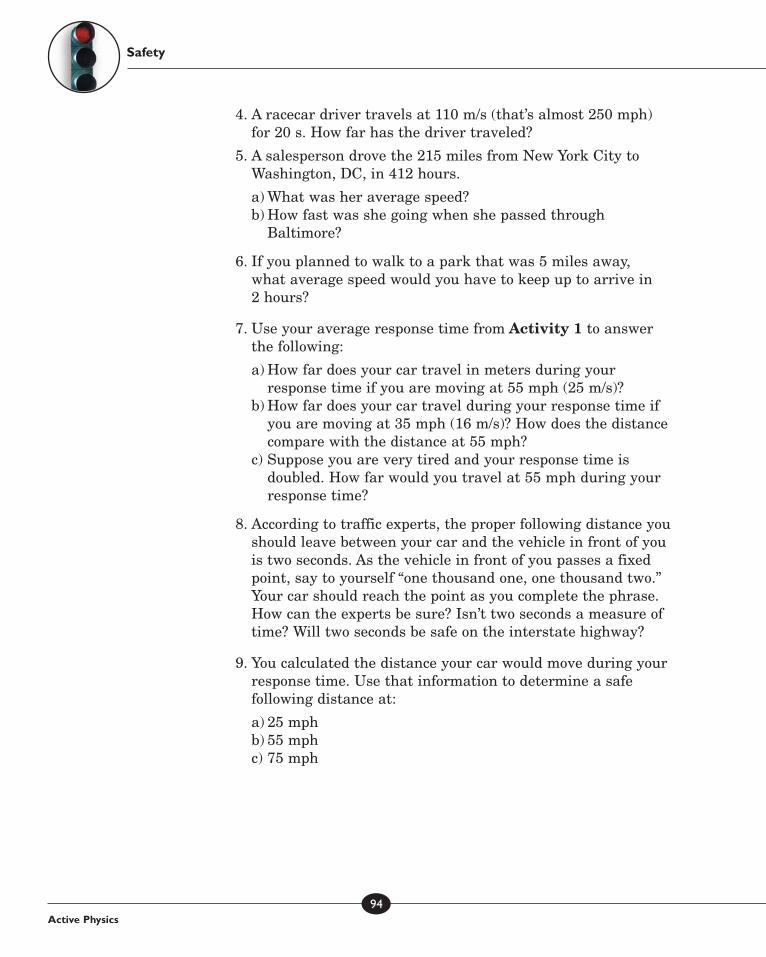
4. A racecar driver travels at 110 m/s (that’s almost 250 mph) for 20 s. How far has the driver traveled?
5. A salesperson drove the 215 miles from New York City toWashington, DC, in 412 hours.
a) What was her average speed? b) How fast was she going when she passed through
Baltimore?
6. If you planned to walk to a park that was 5 miles away, what average speed would you have to keep up to arrive in2 hours?
7. Use your average response time from Activity 1 to answer the following:
a) How far does your car travel in meters during your response time if you are moving at 55 mph (25 m/s)?
b) How far does your car travel during your response time ifyou are moving at 35 mph (16 m/s)? How does the distancecompare with the distance at 55 mph?
c) Suppose you are very tired and your response time isdoubled. How far would you travel at 55 mph during yourresponse time?
8. According to traffic experts, the proper following distance youshould leave between your car and the vehicle in front of you is two seconds. As the vehicle in front of you passes a fixedpoint, say to yourself “one thousand one, one thousand two.”Your car should reach the point as you complete the phrase.How can the experts be sure? Isn’t two seconds a measure oftime? Will two seconds be safe on the interstate highway?
9. You calculated the distance your car would move during yourresponse time. Use that information to determine a safefollowing distance at:
a) 25 mphb) 55 mphc) 75 mph
CS_Ch2_Safety 2/24/05 9:28 PM Page 94

95
Activity 2 Speed and Following Distance
10. Apply what you learned in this activity to write aconvincing argument that describes why following a car tooclosely (tailgating) is dangerous. Include the factors youwould use to decide how close counts as “tailgating.”
Stretching ExercisesMeasure a distance of about 100 m. You can use a football fieldor get a long tape or trundle wheel to measure a similardistance. You also need a watch capable of measuring seconds.Determine your average speed traveling that distance for eachof the following:
a) a slow walkb) a fast walkc) runningd) on a bicyclee) another method of your choice
CS_Ch2_Safety 3/22/05 12:35 AM Page 95
Top Related