


Languages
Pages
Legal


Active Galaxies & Emission Line Diagnostics
• Review of Properties Discussed:
• Things hinted at:
1) Powered by accretion unto a supermassive nuclearblack hole
2) They are the possible precursors to luminousmassive galaxies
1) AGN may be activated by a merger/interaction event.

AGN Nomenclature
• Seyfert Galaxies• Radio Galaxies• Quasi Stellar Radio Sources (Quasars or QSRs)• Quasi Stellar Objects (QSOs)• Low Ionization Nuclear Emission Regions (LINERs)
AGN come in several flavors. The classes we will discussare:

Seyfert Galaxies
• Bright, unresolved nuclei• Typically have blue continuum• Strong nuclear emission lines• Moderate radio emission (Lrad ~ 1040 erg s-1)• Strong X-ray emission (LX ~ 1042 erg s-1)

1) Type I – Permitted emission lines (I.e., recombination lines) are broader than Forbiddenemission lines (e.g. [O II] λ 3727, [O III] λλ 4959+5007)
2) Type II – Both Permitted & Forbidden emission lineshave the same line width. Type II Seyferts are alsoweaker X-ray sources
Seyfert Galaxy Classes

Radio Galaxies
• Luminous, nonthermal radio emission (Lrad > 1042 erg s-1)• Extended (100 kpc – 10 Mpc) radio jets• Starlight spectra in the case of weak radio emission, &
Seyfert-like spectra in the case of strong radio emission• Radio Galaxies come in two classes:
1) Broad Line Radio Galaxies (BLRG) ≈ to Seyfert 12) Narrow Line Radio Galaxies (NLRG) ≈ to Seyfert 2

Radio Galaxy Classification via Radio Jet Morphology
• Fanaroff-Riley I (FR I)
• Fanaroff-Riley II (FR II)
1) Edge-Darkended Lobes2) vjet ~ vsound3) P408MHz ≤ 1025.3 W Hz-1
(typically)
1) Edge-brightened lobes2) Vjet ~ 0.1c3) P408MHz ≤ 1025.3 W Hz-1
(typically)
3C31
Cygnus A = 3C 405

Quasi-Stellar Radio Sources
• Bright & unresolved nuclei. The underlying galaxy is difficult to see
• Lrad & radio morphologies are similar to luminous radio galaxies
• Seyfert 1 – like optical emission line spectra
Quasi-Objects
• Bright & unresolved nuclei. The underlying galaxy is very difficult to see
• Radio-Quiet • Seyfert 1 – like emission line spectra
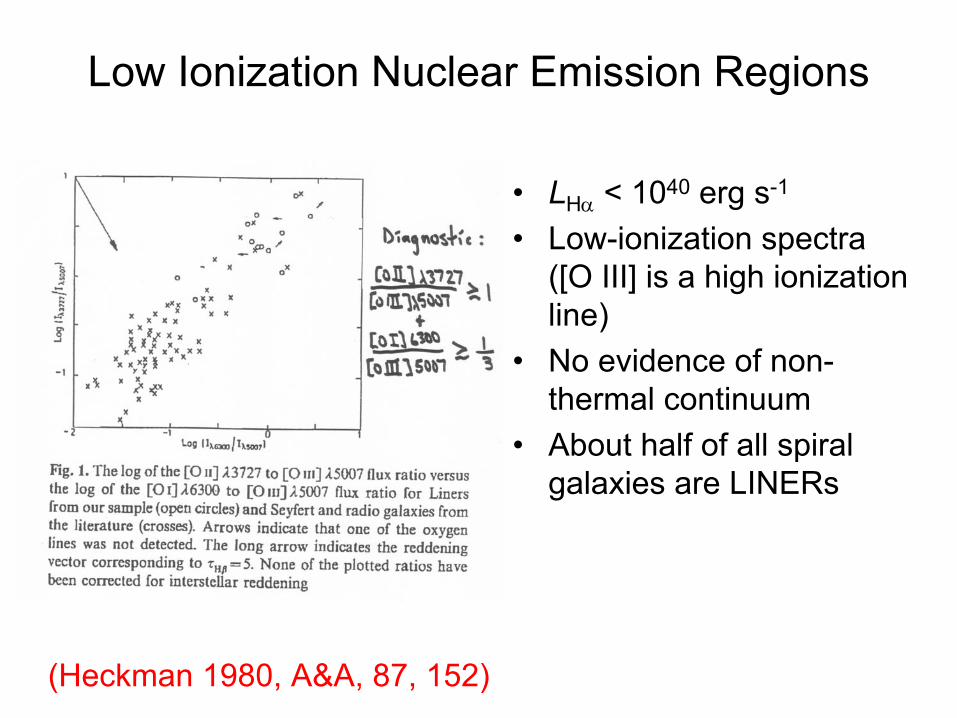
Low Ionization Nuclear Emission Regions
• LHα < 1040 erg s-1
• Low-ionization spectra ([O III] is a high ionization line)
• No evidence of non-thermal continuum
• About half of all spiral galaxies are LINERs
(Heckman 1980, A&A, 87, 152)

General AGN Model• General Model –
Accretion disk surrounding a supermassive black hole.
• ∆vBLR ~ 2000 km s-1
• ∆vNLR ~ 500-100 km s-1
• Orientation may be what separates one type of AGN from another

Size of the BLR
• Lbol ~ several x 1012 Lsun
• MBH ~ 108 Msun
• ∆vBLR ~ 2000 km s-1
BLR has a full extent of about 0.1 pc.

Evidence of Dust Torus
(Jaffe et al. 1996, ApJ, 460, 214)

Orientation Models• NLRG(FR-II) → BLRG(FR-II) → QSR• NLRG(FR-I) → BLRG(FR-I) → QSO
• The apparent length of QSR jets are smaller than those of radio galaxies, also supporting the orientation model (Barthel 1989, ApJ, 336, 606)

Narrow Lines Visible, Broad Lines Obscured
(Osterbrock 1989)

Broad Lines Visible, Narrow Lines Visible
(Osterbrock 1989)

Obscuration is also supported by observations of NIR BLR in Optical Seyfert 1
Flux
den
sity
λ (µm)(Veilleux, Sanders, & Kim1997, ApJ, 484, 92)
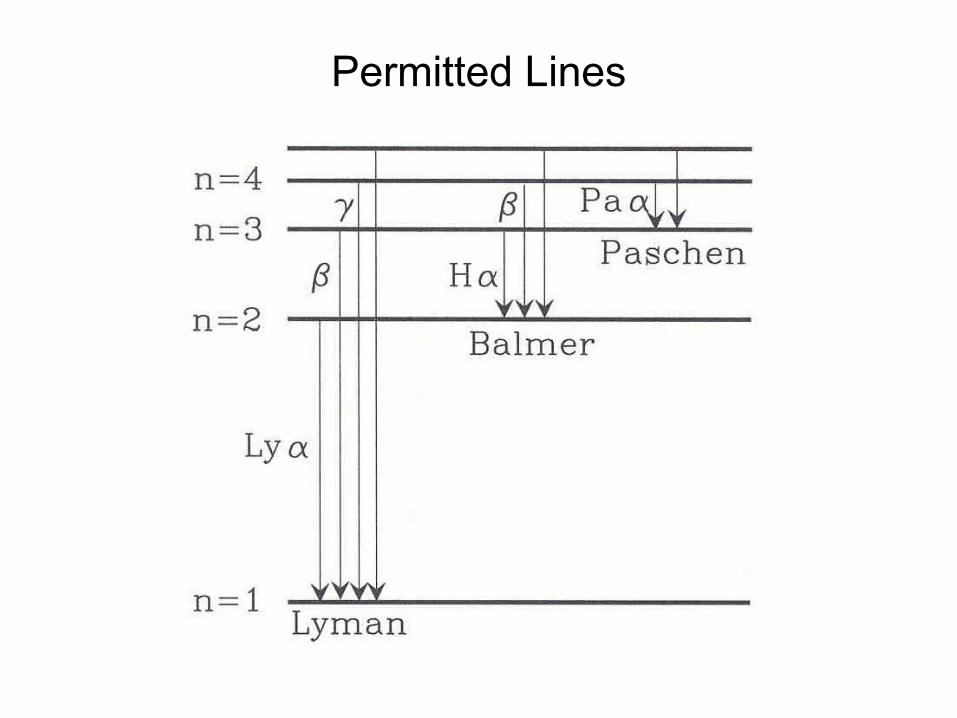
Permitted Lines

Permitted vs. Forbidden Lines
• The permitted recombination lines result from free electrons recombining with nuclei & cascading down to the ground state
• The forbidden lines have extremely low transition probabilities
• Thus, forbidden line emission is typically excited by collisions in the NLR
Permitted Line emission is seen from both the BLR & NLR,whereas forbidden line emission is seen only from theNLR.
1) Aij ≈ 10-2 s-1 for forbidden lines2) Aij ≈ 108 s-1 for permitted lines

Collision radiative collisionalexcitation de-excitation de-excitatoin= +
For an atom with two levels 1 & 2,
which can be written as,
where n1, n2, and ne are the level 1, 2, and free electronnumber densities, respectively, v is the velocity of the freeelectrons, & the σ’s are the collisional cross sections.
Thus, if ne < nc, collisions do not dominate the de-excitation& there is forbidden line emission.
The critical ne for collisional de-excitation is thus,
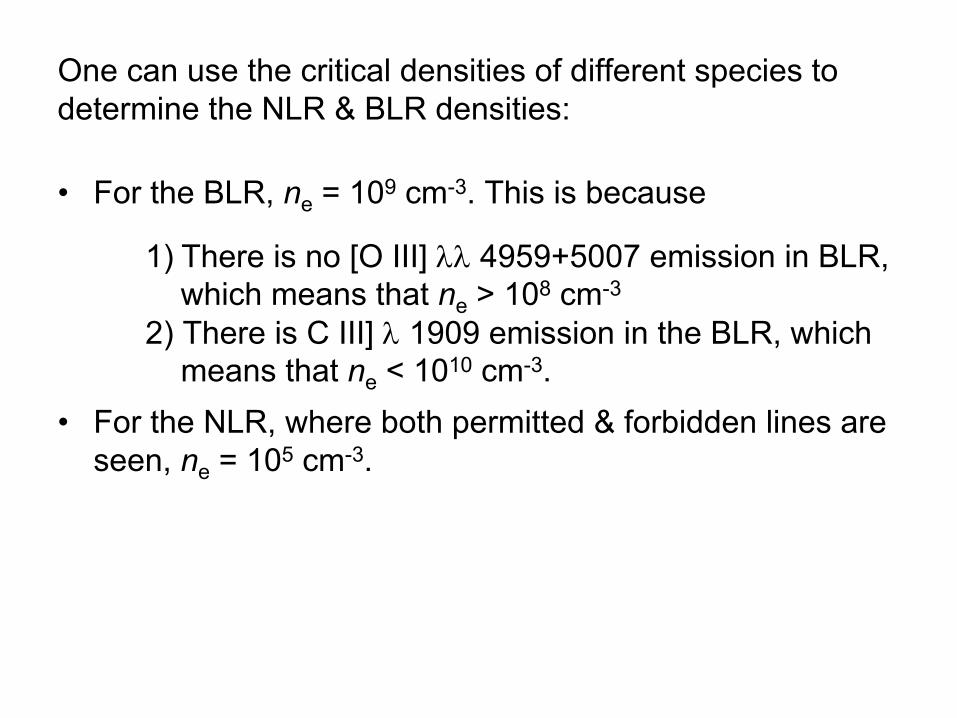
One can use the critical densities of different species to determine the NLR & BLR densities:
• For the BLR, ne = 109 cm-3. This is because
• For the NLR, where both permitted & forbidden lines are seen, ne = 105 cm-3.
1) There is no [O III] λλ 4959+5007 emission in BLR,which means that ne > 108 cm-3
2) There is C III] λ 1909 emission in the BLR, which means that ne < 1010 cm-3.

The Host Galaxies of AGN(i.e., QSOs and Radio Galaxies)
• SEDs• Host Galaxies• Black Hole Masses• Molecular Gas

SED of QSOs
• Radio – Non-Thermal• Infrared – Thermal Emissionfrom dust
• Tdust = 20 – 120 K
(Müller, Chini, Haas et al. 2001)

“Typical” QSO Spectrum
• νfν = total energyoutput at ν
• 20 – 40% of Lbol isthermal emission from dust.
(Sanders et al. 1989)

For Radio Galaxies…
• Radio – Non-Thermal• Infrared – Thermal Emissionfrom dust
• Tdust = 30 – 80 K
(Müller, Chini, Haas et al. 2001)

Note: optical tonear-infraredemission from radio galaxiesis primarily stellar in nature.Moreso for NLRGsthan BLRGs.
I.e., obscuration ofAGN is a majorfactor.
(Evans 1996)
Hosts: Galaxy TypeFocus: QSOs
• Main problem: The bright QSO nucleus makes it difficult to observed the underlying host galaxy.
• A note on nomenclature: QSO and QSR refer to the AGN itself, not to the whole galaxy. Also, people commonly use “QSO” or “Quasar” to refer to both radio-loud & radio-quiet objects.
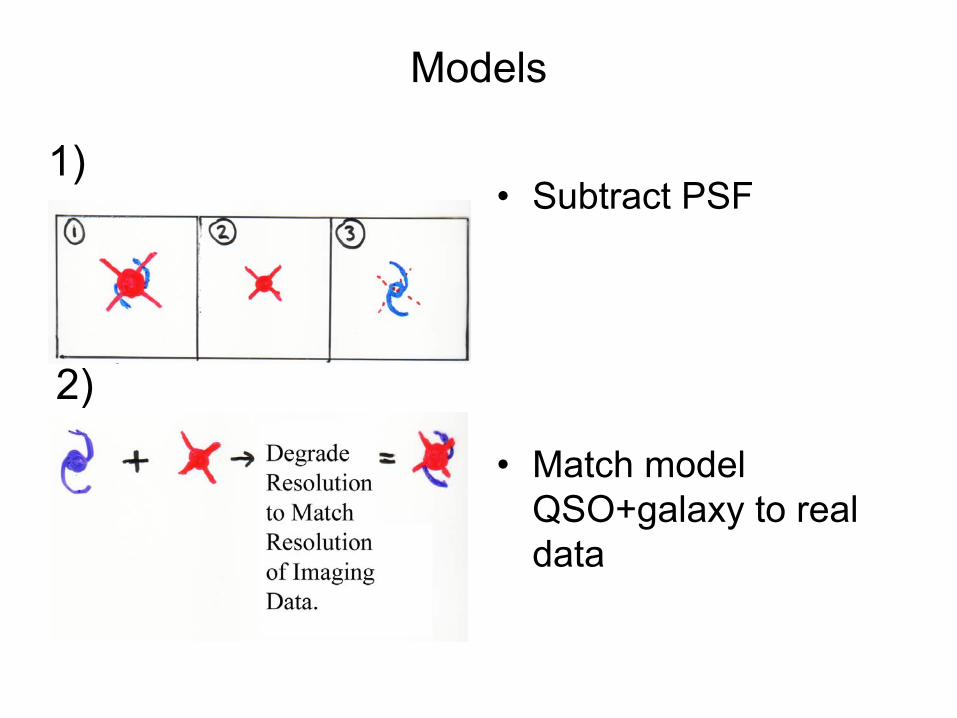
Models
• Subtract PSF
• Match model QSO+galaxy to real data
1)
2)

PSF Subtraction
Before… After. (Bahcall et al. 1997)

Results to Date
• Almost all of the Brightest Quasars are in Elliptical Galaxies
• The Fainter Quasars are in Spiral Galaxies, Elliptical Galaxies, & Galaxy Mergers
(Dunlop et al. 2001)

Radio Galaxies
Radio Loud Quasars
Radio-Quiet Quasars
µ ~ exp(-rβ)
β = 0.25 (de Vaucouleurs law)
Mv ~ -23.5
(Dunlop 2001)

Figure: Bahcall et al. 1997
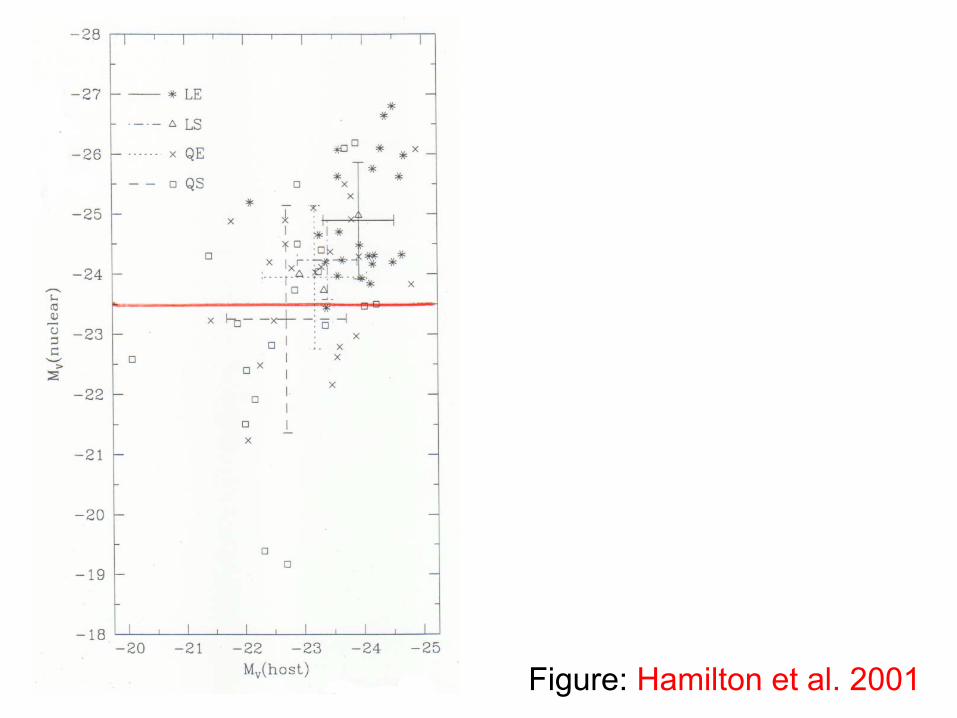
Figure: Hamilton et al. 2001

Lbulge / Lhost vs. Mv (nucleus)
• Disk-Dominated host galaxies become rarewith increasing nuclearpower.
(Dunlop 2001)
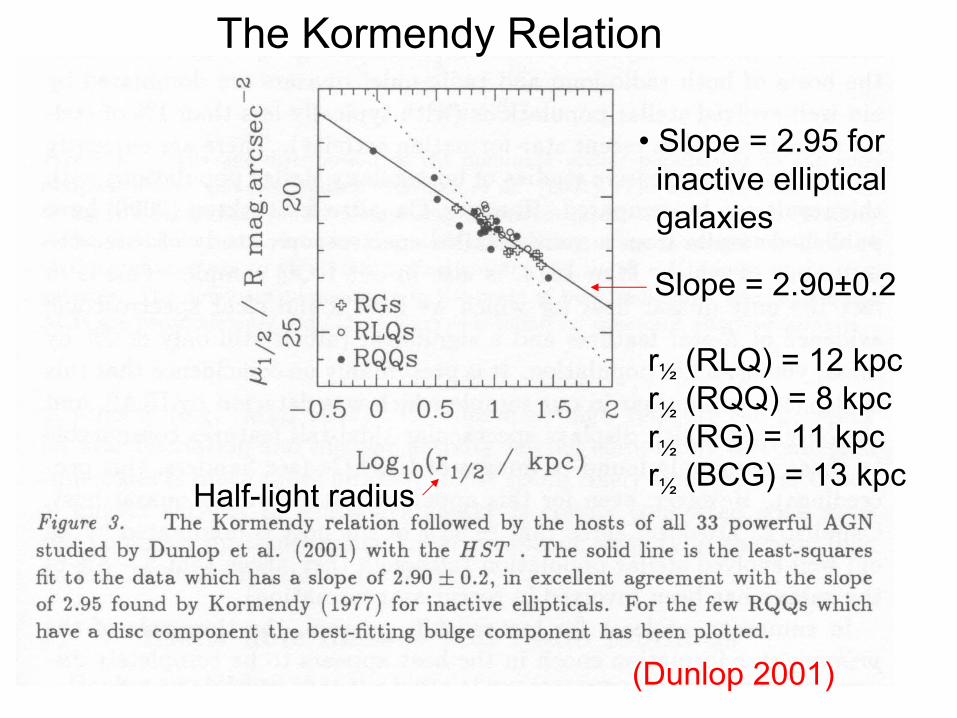
The Kormendy Relation
• Slope = 2.95 for inactive ellipticalgalaxies
Slope = 2.90±0.2
Half-light radius
r½ (RLQ) = 12 kpcr½ (RQQ) = 8 kpcr½ (RG) = 11 kpcr½ (BCG) = 13 kpc
(Dunlop 2001)

MBH Based on ∆vHβ + Reverberation Method
• The Hβ data…
(McClure & Dunlop 2001)

The Results…
‹MBH (RLQ)› = 1x10⁹ Msun‹MBH (RQQ)› = 5x10⁸ Msun
(Dunlop 2001)
An Infrared Excess Sample
• Palomar-Green Quasar Survey• LIR / Lbbb (0.1-1.0 µm) > 0.36• Redshift, z < 0.17• MB < -22.0
• 17 QSOs match this description
(Surace, Sanders & Evans 2001Evans et al. 2001)

Molecular Gas: The Fuel for AGN activity?
• …Detected in 8 of the 17 IR-excess QSOs to date• M(H2) ~ 109 – 1010 Msun of gas (α = L’CO / M(H2) = 4)
(Evans et al 2001)

Evidence of Molecular Gas
Associated with AGN
(Evans et al. 2000; 2002)
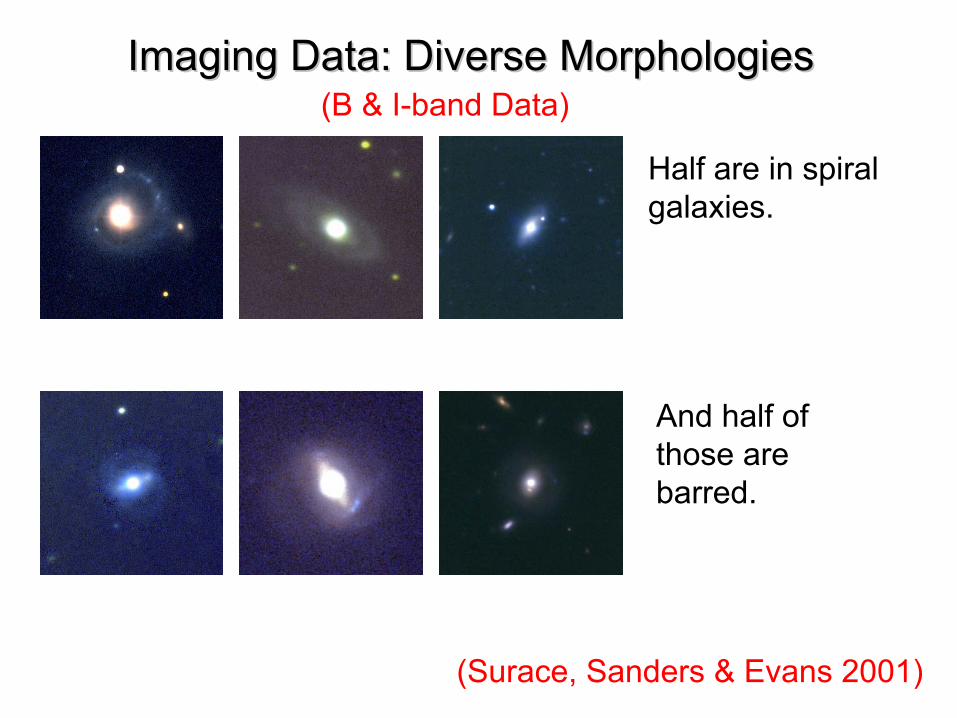
Imaging Data: Diverse MorphologiesImaging Data: Diverse Morphologies
Half are in spiral galaxies.
And half of those are barred.
(Surace, Sanders & Evans 2001)
(B & I-band Data)

Diverse MorphologiesDiverse Morphologies
A quarter are in major merger systems as evidenced by tidal tails 20-80 kpc in length.
A few are extended but don’t look like anything. They have no resolvable structure, and could be ellipticals or unresolved spirals. Radial profiles do not produce very meaningful results due to convolution effects with PSF.
(Surace et al. 2001)

SmallSmall--Scale StructureScale Structure
In some cases there is resolvable small scale structure similar to the star-forming knots found in ULIRG nuclear regions and tidal structure. In most cases the ages of these knots are probably under 100 Myrs based on 4-color analysis and spectral synthesis models.
(Surace et al. 2001)

Optical Imaging of IR-excess QSOs
• IR-Excess QSOs Have Spiral, Merger, and “Elliptical” Galaxy Hosts
• 25% - Ongoing Major Mergers
(Surace et al. 2001)
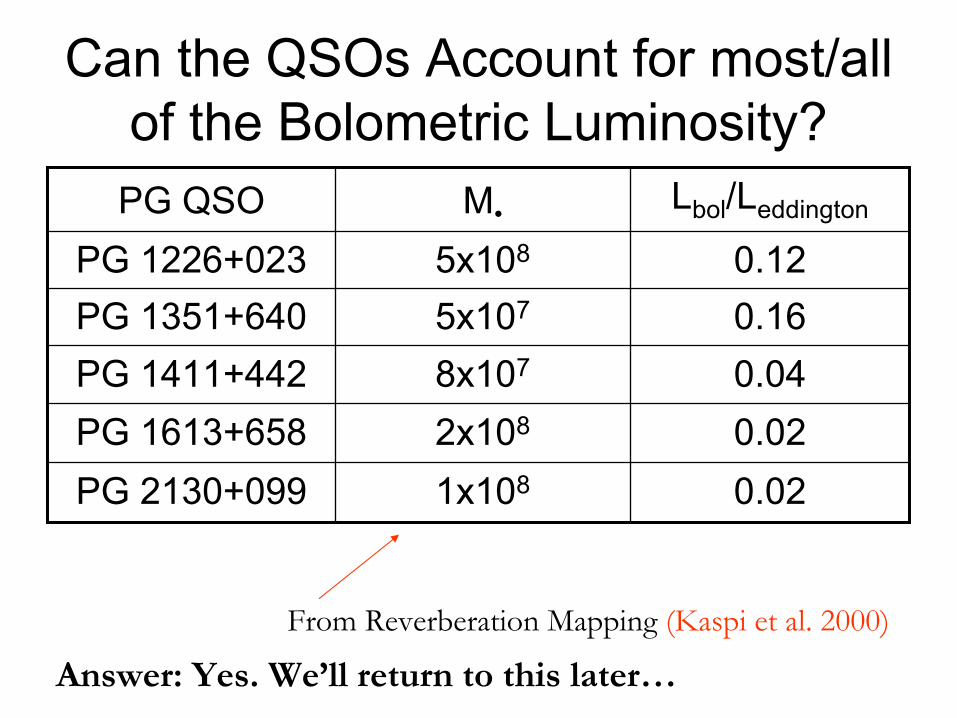
Can the QSOs Account for most/all of the Bolometric Luminosity?
0.021x10⁸PG 2130+0990.022x108PG 1613+6580.048x107PG 1411+4420.165x107PG 1351+6400.125x108PG 1226+023
Lbol/LeddingtonM•PG QSO
From Reverberation Mapping (Kaspi et al. 2000)
Answer: Yes. We’ll return to this later…
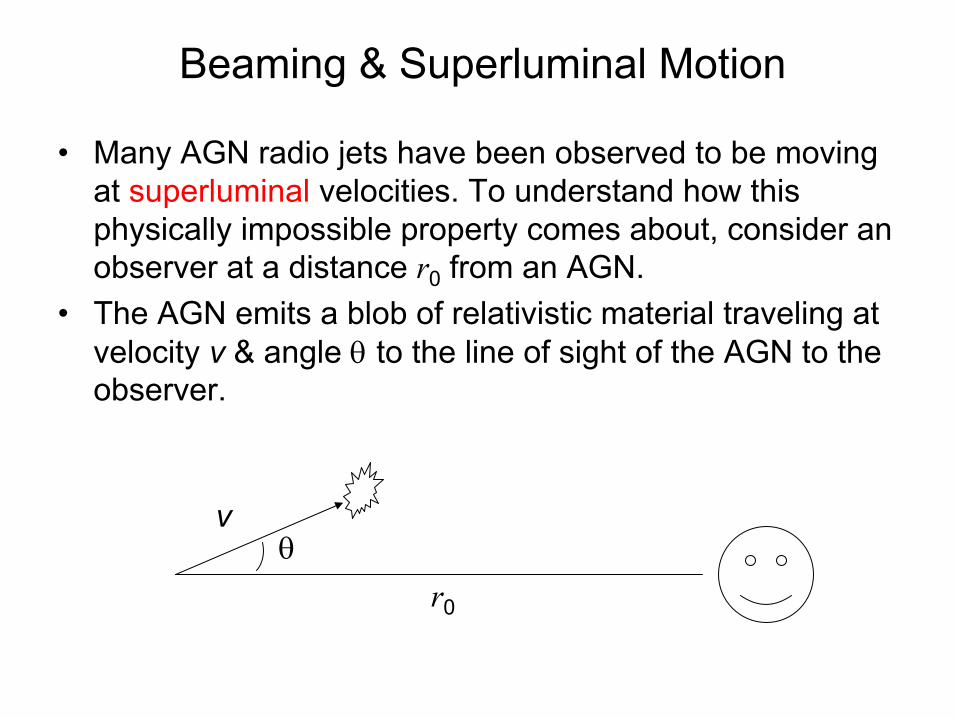
Beaming & Superluminal Motion
• Many AGN radio jets have been observed to be moving at superluminal velocities. To understand how this physically impossible property comes about, consider an observer at a distance r0 from an AGN.
• The AGN emits a blob of relativistic material traveling at velocity v & angle θ to the line of sight of the AGN to the observer.
vθ
r0
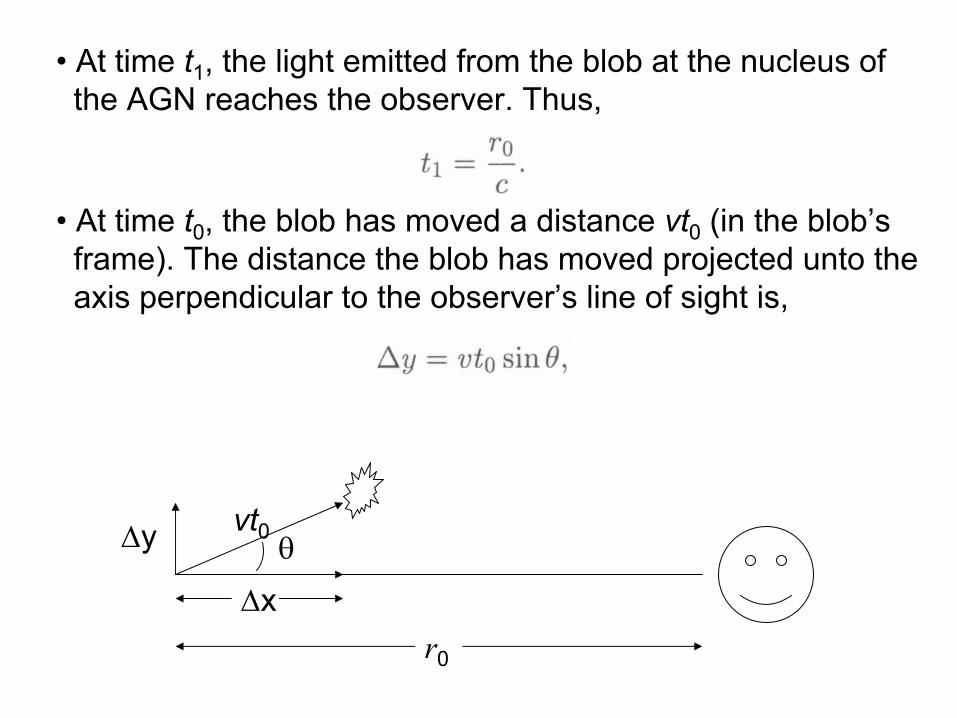
• At time t1, the light emitted from the blob at the nucleus ofthe AGN reaches the observer. Thus,
• At time t0, the blob has moved a distance vt0 (in the blob’sframe). The distance the blob has moved projected unto theaxis perpendicular to the observer’s line of sight is,
vt0θ
r0
∆y
∆x

• The distance the blob has traveled projected unto the observer line of sight axis is
• At t2, the observer see the blob at ∆y. However, the radiation that the observer sees was emitted from the blob at time t0. Thus,
• Thus, the elapse time for the observer is,
where β = v / c.

• The y-axis velocity will be defined as,
Thus,
If,
then,
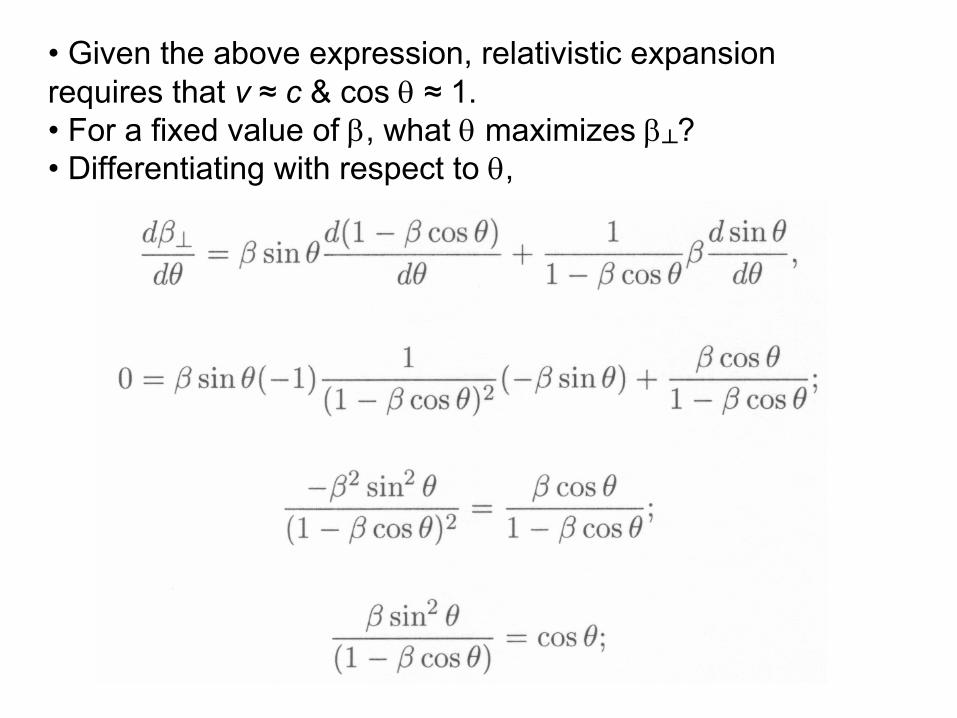
• Given the above expression, relativistic expansion requires that v ≈ c & cos θ ≈ 1.• For a fixed value of β, what θ maximizes β┴?• Differentiating with respect to θ,

• It follows that,
• Thus, if β = 0.99, then θ = 8o. If β = 0.999, then θ = 2.6o.I.e., the radiation becomes beamed – the faster the objectmoves, the narrower the doppler boosting cone.
• Note also that,
• And thus if β = 0.99, β┴ (max) = 7; the object will appearto the observer to be moving at 7c.

Emission Line Diagnostics
• Seyfert 2s, starburst galaxies, & LINER have narrow emission lines.
• How does one tell the difference between them?• Importance: Tells you what is ionizing the ISM, &
potentially tells you the dominant source of ionization in the galaxy
• This is a very active area of research, especially for galaxies at high redshift

Photoionization Cross Section• In order to understand the
differences, consider the photoionization cross section, aν
• The mean free path (mfp) is expressed as,
• Punch line: Low energy photons have have short mfp’s, & the mfpincreases with increasing photon energy
Neutral H number density

• Most low energy photons are absorbed very close to AGN. The region of ionized gas near the AGN is called the ionized region
• High energy photons, with their longer mfp’s, escape the ionized region & transfer ionization energy & momentum to the semi-ionized region. Forbidden lines are made here
• Because AGN make a higher fraction of high energy photons than stars, their semi-ionized region is more extended

A word of caution
• Shocks likely produce extended semi-ionized regions.• Shocks can be produced by either weak power-law AGN
or supernovae• Shocks likely create LINER-like spectra• Keep in mind than 30% of all emission line galaxies are
LINERs. We will return to this point later.

Emission Line Diagnostic Diagrams
• Low/high ionization to recombination line ratio
• Ratios are of lines with similar wavelengths, thus minimizing extinction effects
(Veilleux et al. 1995)
Stars LINERs
SeyfertsH
igh
Ioni
zatio
n →
Semi-ionized region extent →

Dividing Lines: Partly Empirical1981

Diagnostics at Optical Wavelengths can then be Related to Diagnostic Developed at Longer Wavelengths.
(Genzel et al. 1998)Destroyed by AGN radiation field
Hig
h io
niza
tion →

Electron Densities
• [O II] & [S II] Doublets• Levels Collisionally
Populated• De-excitation Forbidden
(comparable radiative & collisional de-excitation rates – i.e., Aul = Cul)
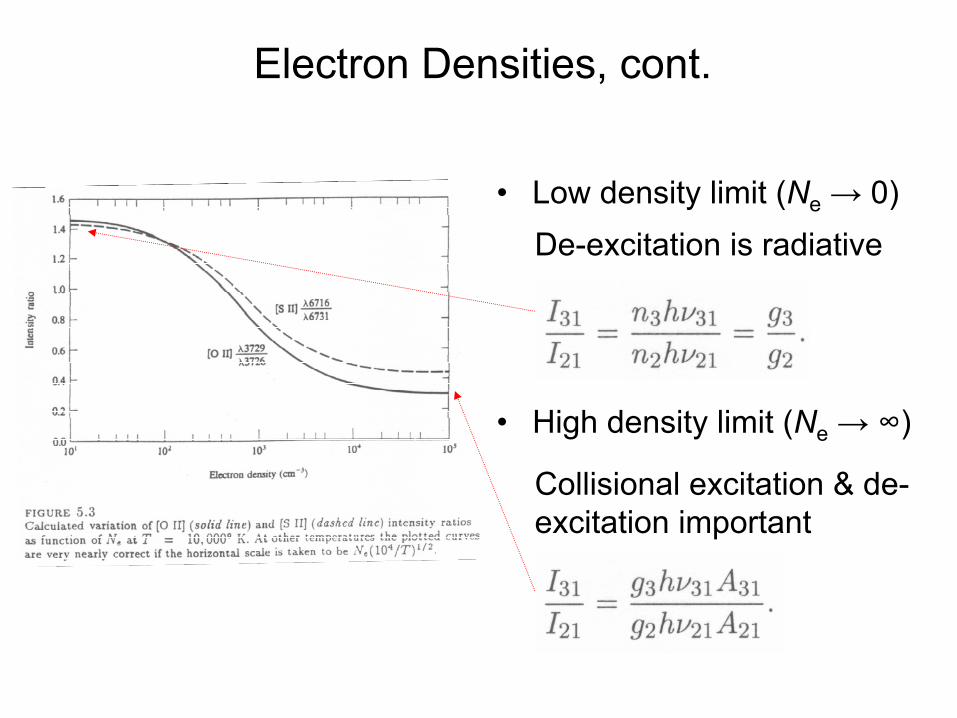
Electron Densities, cont.
• Low density limit (Ne → 0)
• High density limit (Ne → ∞)
De-excitation is radiative
Collisional excitation & de-excitation important

Temperatures
• Levels with different excitation energies required
• [O III] & [N II] Transitions thus useful
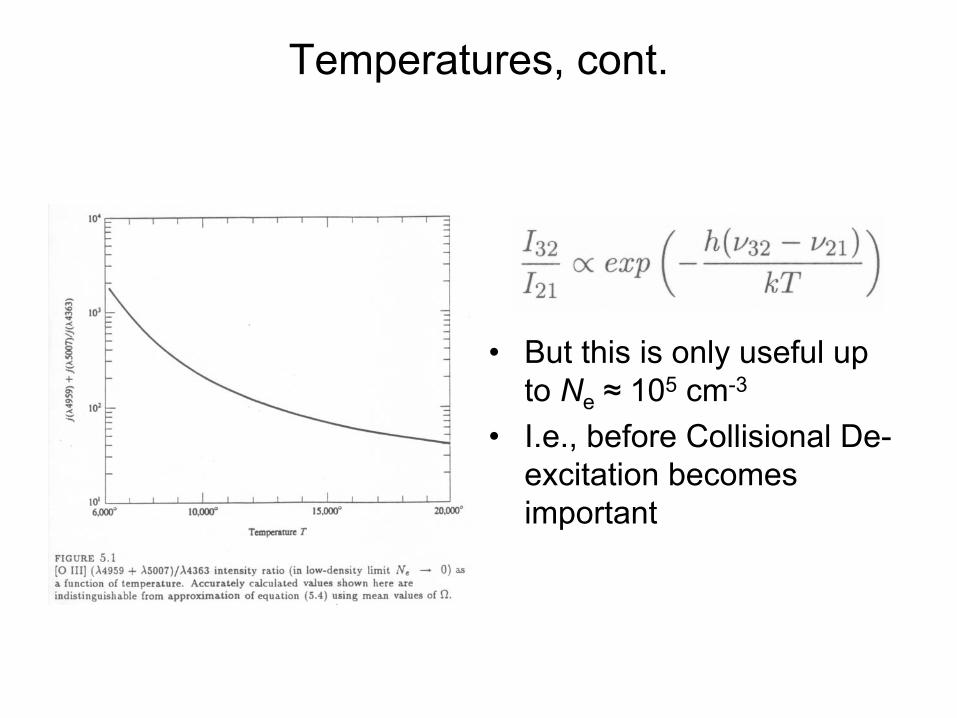
Temperatures, cont.
• But this is only useful up to Ne ≈ 105 cm-3
• I.e., before Collisional De-excitation becomes important
Top Related