


Languages
Pages
Legal

Abu Dhabi Commercial Bank PJSC
Q2/H1’16 Investor presentation
July 2016
THIS PRESENTATION IS NOT AN OFFER OR SOLICITATION OF AN OFFER TO BUY OR SELL SECURITIES. IT IS SOLELY FOR USE AS AN INVESTOR PRESENTATION AND IS PROVIDED ASINFORMATION ONLY. THIS PRESENTATION DOES NOT CONTAIN ALL OF THE INFORMATION THAT IS MATERIAL TO AN INVESTOR. BY READING THE PRESENTATION SLIDES YOU AGREETO BE BOUND AS FOLLOWS:
This presentation has been prepared by Abu Dhabi Commercial Bank PJSC (“ADCB”), is furnished on a confidential basis and only for discussion purposes, may be amended andsupplemented and may not be relied upon for the purposes of entering into any transaction. The information contained herein has been obtained from sources believed to bereliable but ADCB does not represent or warrant that it is accurate and complete. The views reflected herein are those of ADCB and are subject to change without notice. Allprojections, valuations and statistical analyses are provided to assist the recipient in the evaluation of the matters described herein. They may be based on subjective assessmentsand assumptions and may use one among alternative methodologies that produce different results and to the extent that they are based on historical information, they should notbe relied upon as an accurate prediction of future performance.
No action has been taken or will be taken that would permit a public offering of any securities in any jurisdiction in which action for that purpose is required. No offers, sales, resalesor delivery of any securities or distribution of any offering material relating to any such securities may be made in or from any jurisdiction except in circumstances which will result incompliance with any applicable laws and regulations.
This presentation does not constitute an offer or an agreement, or a solicitation of an offer or an agreement, to enter into any transaction (including for the provision of any services). Noassurance is given that any such transaction can or will be arranged or agreed. Before entering into any transaction, you should consider the suitability of the transaction to yourparticular circumstances and independently review (with your professional advisers as necessary) the specific financial risks as well as the legal, regulatory, credit, tax and accountingconsequences.
This presentation may include forward-looking statements that reflect ADCB's intentions, beliefs or current expectations. Forward-looking statements involve all matters that are nothistorical by using the words "may", "will", "would", "should", "expect", "intend", "estimate", "anticipate", "believe" and similar expressions or their negatives. Such statements aremade on the basis of assumptions and expectations that ADCB currently believes are reasonable, but could prove to be wrong.
This presentation is for the recipient’s use only. This presentation is not for distribution to retail clients. In particular, neither this presentation nor any copy hereof may be sent ortaken or distributed in the United States, Australia, Canada or Japan or to any U.S. person (as such term is defined in Regulation S under the U.S. Securities Act 1933, as amended (the“Securities Act”)), except pursuant to an exemption from the registration requirements of the Securities Act. If this presentation has been received in error it must be returnedimmediately to ADCB. Accordingly, this presentation is being provided only to persons that are (i) "qualified institutional buyers" within the meaning of Rule 144A under theSecurities Act or (ii) not "U.S. persons" within the meaning of Regulation S under the Securities Act. By accepting the delivery of this presentation, the recipient warrants andacknowledges that it falls within the category of persons under clause (i) or (ii). No representation can be made as to the availability of the exemption provided by Rule 144 for re-sales of any securities offered by or guaranteed by ADCB. No securities offered by or guaranteed by ADCB have been recommended by, or approved by, the United States Securitiesand Exchange Commission (the “SEC") or any other United States federal or state securities commission or regulatory authority, nor has any such commission or regulatory authoritypassed upon the accuracy or adequacy of this presentation.
This document does not disclose all the risks and other significant issues related to an investment in any securities/transaction. Prior to transacting, potential investors should ensurethat they fully understand the terms of any securities/transaction and any applicable risks. This document is not a prospectus for any securities. Investors should only subscribe forany securities on the basis of information in the relevant prospectus and term sheet, and not on the basis of any information provided herein.
This presentation is being communicated only to (i) persons who are outside the United Kingdom, (ii) persons who have professional experience in matters relating to investments fallingwithin Article 19(5) of The Financial Services and Markets Act 2000 (Financial Promotion) Order 2005, or (iii) those persons to whom it may otherwise lawfully be distributed (all suchpersons together being referred to as “relevant persons”). This presentation is communicated only to relevant persons and must not be acted on or relied on by persons who are notrelevant persons. Any investment or investment activity to which this presentation relates is available only to relevant persons and will be engaged in only with relevant persons.
By accepting this document you will be taken to have represented, warranted and undertaken that (i) you are a relevant person (as defined above); (ii) you have read and agree tocomply with the contents of this notice; and (iii) you will treat and safeguard as strictly private and confidential all such information and take all reasonable steps to preserve suchconfidentiality.
Disclaimer
2 | Q2/H1’16 Investor presentation
Financial highlights
Business overview
Appendix
Our journey
45
50
55
60
65
70
Jan-
14Fe
b-14
Mar
-14
Apr
-14
May
-14
Jun-
14Ju
l-14
Aug
-14
Sep
-14
Oct
-14
Nov
-14
Dec
-14
Jan-
15Fe
b-15
Mar
-15
Apr
-15
May
-15
Jun-
15Ju
l-15
Aug
-15
Sep
-15
Oct
-15
Nov
-15
Dec
-15
Jan-
16Fe
b-16
Mar
-16
Apr
-16
May
-16
Jun-
16
PMINew Export Orders IndexNew Orders/Incoming New Business IndexOutput/Business Activity Index
2,000
2,200
2,400
2,600
2,800
3,000
3,200
Sep
-09
Dec
-09
Mar
-10
Jun-
10Sep
-10
Dec
-10
Mar
-11
Jun-
11Sep
-11
Dec
-11
Mar
-12
Jun-
12Sep
-12
Dec
-12
Mar
-13
Jun-
13Sep
-13
Dec
-13
Mar
-14
Jun-
14Sep
-14
Dec
-14
Mar
-15
Jun-
15Sep
-15
Dec
-15
Mar
-16
Jun-
16
UAE Oil ProductionAnnual Average
-6
-4
-2
0
2
4
6
8
10
12
2006
2007
2008
2009
2010
2011
2012
2013
2014
2015
e
2016
f
Non-oil Sector Oil Sector Headline Growth
0
2
4
6
8
10
12
14
16
18
Q1'14 Q2'14 Q3'14 Q4'15 Q1'15 Q2'15 Q3'15 Q4'15 Q1'16
Chemical Construction GasIndustrial Oil PowerTransport Water
USD billion
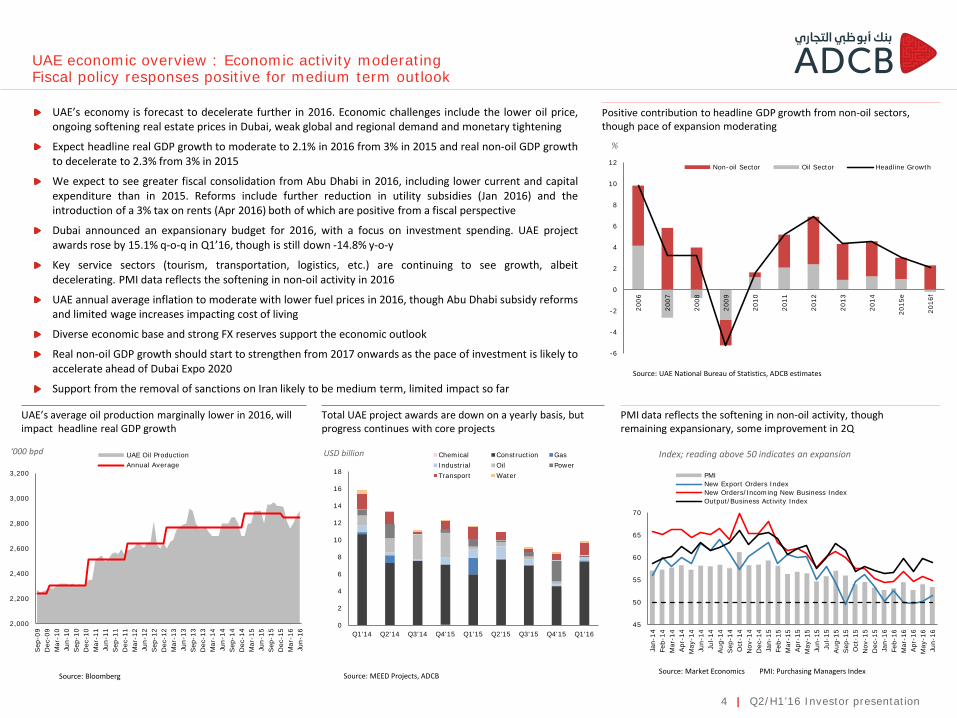
Positive contribution to headline GDP growth from non-oil sectors, though pace of expansion moderating
Total UAE project awards are down on a yearly basis, but progress continues with core projects
UAE’s average oil production marginally lower in 2016, will impact headline real GDP growth
Source: Market Economics PMI: Purchasing Managers IndexSource: MEED Projects, ADCB
UAE economic overview : Economic activity moderatingFiscal policy responses positive for medium term outlook
PMI data reflects the softening in non-oil activity, though remaining expansionary, some improvement in 2Q
Source: Bloomberg
%
Source: UAE National Bureau of Statistics, ADCB estimates
‘000 bpd Index; reading above 50 indicates an expansion
UAE’s economy is forecast to decelerate further in 2016. Economic challenges include the lower oil price,ongoing softening real estate prices in Dubai, weak global and regional demand and monetary tightening
Expect headline real GDP growth to moderate to 2.1% in 2016 from 3% in 2015 and real non-oil GDP growthto decelerate to 2.3% from 3% in 2015
We expect to see greater fiscal consolidation from Abu Dhabi in 2016, including lower current and capitalexpenditure than in 2015. Reforms include further reduction in utility subsidies (Jan 2016) and theintroduction of a 3% tax on rents (Apr 2016) both of which are positive from a fiscal perspective
Dubai announced an expansionary budget for 2016, with a focus on investment spending. UAE projectawards rose by 15.1% q-o-q in Q1’16, though is still down -14.8% y-o-y
Key service sectors (tourism, transportation, logistics, etc.) are continuing to see growth, albeitdecelerating. PMI data reflects the softening in non-oil activity in 2016
UAE annual average inflation to moderate with lower fuel prices in 2016, though Abu Dhabi subsidy reformsand limited wage increases impacting cost of living
Diverse economic base and strong FX reserves support the economic outlook
Real non-oil GDP growth should start to strengthen from 2017 onwards as the pace of investment is likely toaccelerate ahead of Dubai Expo 2020
Support from the removal of sanctions on Iran likely to be medium term, limited impact so far
4 | Q2/H1’16 Investor presentation
0
2
4
6
8
10
12
Dec
-15
Jan-
16
Feb-
16
Mar
-16
Apr
-16
May
-16
Total Private Sector
Business & Industrial Sector
Individuals
0.6
0.7
0.8
0.9
1.0
1.1
1.2
1.3
1.4
1.5
4-Ja
n-15
4-Fe
b-15
4-M
ar-1
5
4-Apr
-15
4-M
ay-1
5
4-Ju
n-15
4-Ju
l-15
4-Aug
-15
4-Sep
-15
4-O
ct-1
5
4-N
ov-1
5
4-D
ec-1
5
4-Ja
n-16
4-Fe
b-16
4-M
ar-1
6
4-Apr
-16
4-M
ay-1
6
4-Ju
n-16
4-Ju
l-16
EIBOR 3M EIBOR 6M
0
2
4
6
8
10
12
14
90
92
94
96
98
100
102
104
Mar
-14
Apr
-14
May
-14
Jun-
14
Jul-
14
Aug
-14
Sep
-14
Oct
-14
Nov
-14
Dec
-14
Jan-
15
Feb-
15
Mar
-15
Apr
-15
May
-15
Jun-
15
Jul-
15
Aug
-15
Sep
-15
Oct
-15
Nov
-15
Dec
-15
Jan-
16
Feb-
16
Mar
-16
Apr
-16
May
-16
Loan-to-Deposit Ratio (LHA) Credit Growth, y-o-y (RHA) Deposit Growth, y-o-y (RHA)
-40
-20
0
20
40
60
80
100
1Q20
14
2Q20
14
3Q20
14
4Q20
14
1Q20
15
2Q20
15
3Q20
15
4Q20
15
1Q20
16
May
-16
GRE Net DepositsGovernment Net DepositsTotal Net Deposits
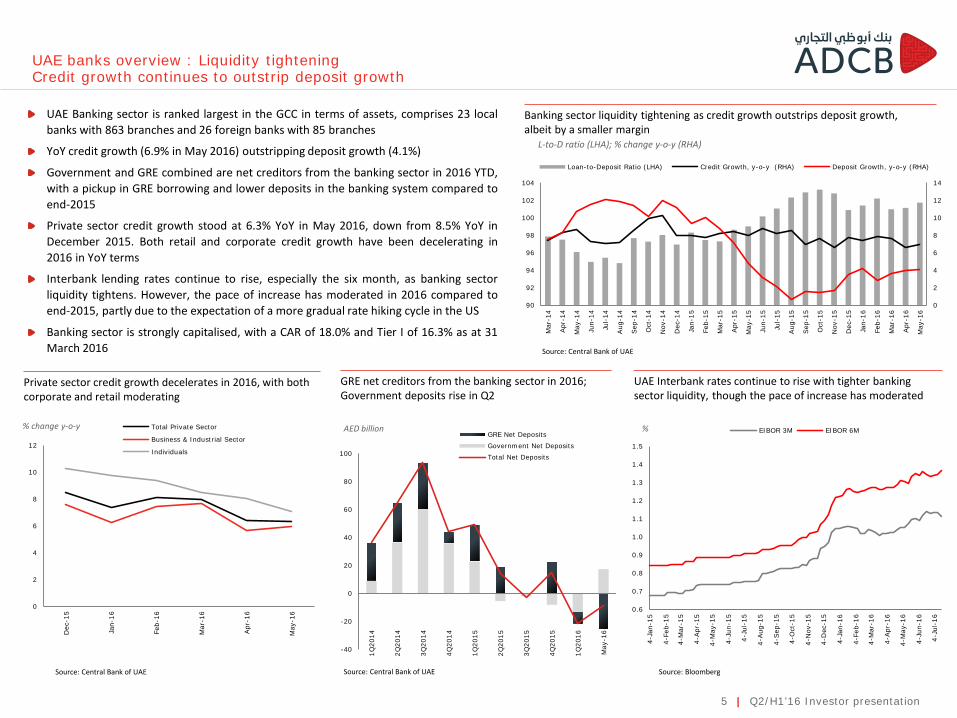
UAE Banking sector is ranked largest in the GCC in terms of assets, comprises 23 localbanks with 863 branches and 26 foreign banks with 85 branches
YoY credit growth (6.9% in May 2016) outstripping deposit growth (4.1%)
Government and GRE combined are net creditors from the banking sector in 2016 YTD,with a pickup in GRE borrowing and lower deposits in the banking system compared toend-2015
Private sector credit growth stood at 6.3% YoY in May 2016, down from 8.5% YoY inDecember 2015. Both retail and corporate credit growth have been decelerating in2016 in YoY terms
Interbank lending rates continue to rise, especially the six month, as banking sectorliquidity tightens. However, the pace of increase has moderated in 2016 compared toend-2015, partly due to the expectation of a more gradual rate hiking cycle in the US
Banking sector is strongly capitalised, with a CAR of 18.0% and Tier I of 16.3% as at 31March 2016
Private sector credit growth decelerates in 2016, with both corporate and retail moderating
GRE net creditors from the banking sector in 2016; Government deposits rise in Q2
UAE Interbank rates continue to rise with tighter banking sector liquidity, though the pace of increase has moderated
Banking sector liquidity tightening as credit growth outstrips deposit growth, albeit by a smaller margin
UAE banks overview : Liquidity tighteningCredit growth continues to outstrip deposit growth
Source: BloombergSource: Central Bank of UAESource: Central Bank of UAE
L-to-D ratio (LHA); % change y-o-y (RHA)
Source: Central Bank of UAE
AED billion% change y-o-y %
5 | Q2/H1’16 Investor presentation
Financial highlights
Appendix
Macro overview
Our journey
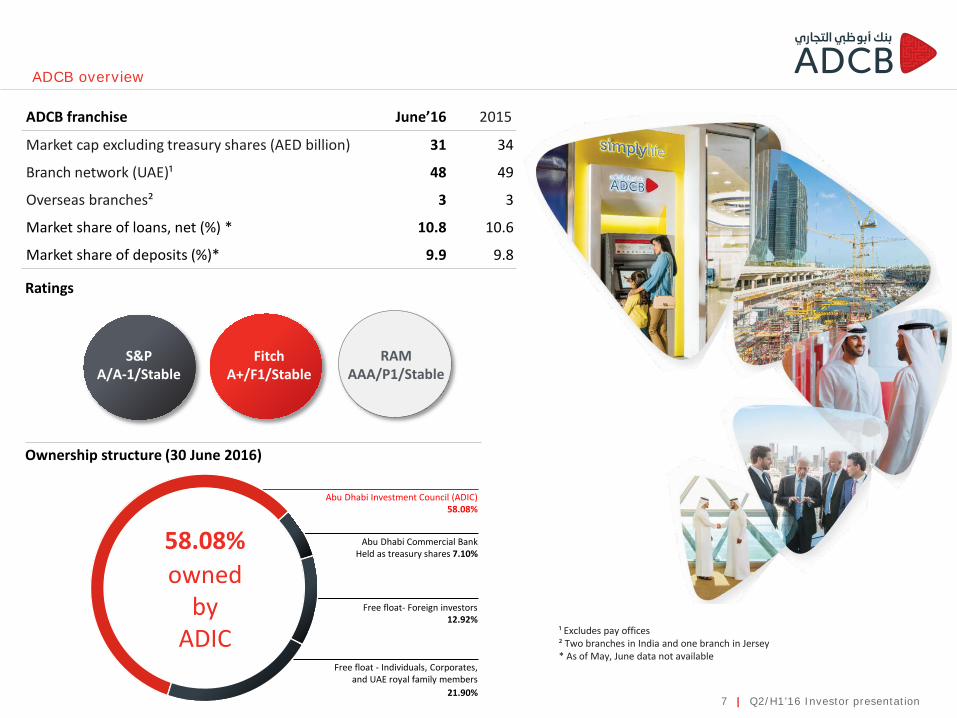
ADCB franchise June’16 2015
Market cap excluding treasury shares (AED billion) 31 34
Branch network (UAE)¹ 48 49
Overseas branches² 3 3
Market share of loans, net (%) * 10.8 10.6
Market share of deposits (%)* 9.9 9.8
58.08% owned
byADIC
Free float- Foreign investors 12.92%
Abu Dhabi Investment Council (ADIC) 58.08%
Abu Dhabi Commercial BankHeld as treasury shares 7.10%
Free float - Individuals, Corporates, and UAE royal family members
21.90%
ADCB overview
Ownership structure (30 June 2016)
¹ Excludes pay offices ² Two branches in India and one branch in Jersey* As of May, June data not available
Ratings
S&P A/A-1/Stable
FitchA+/F1/Stable
RAMAAA/P1/Stable
7 | Q2/H1’16 Investor presentation
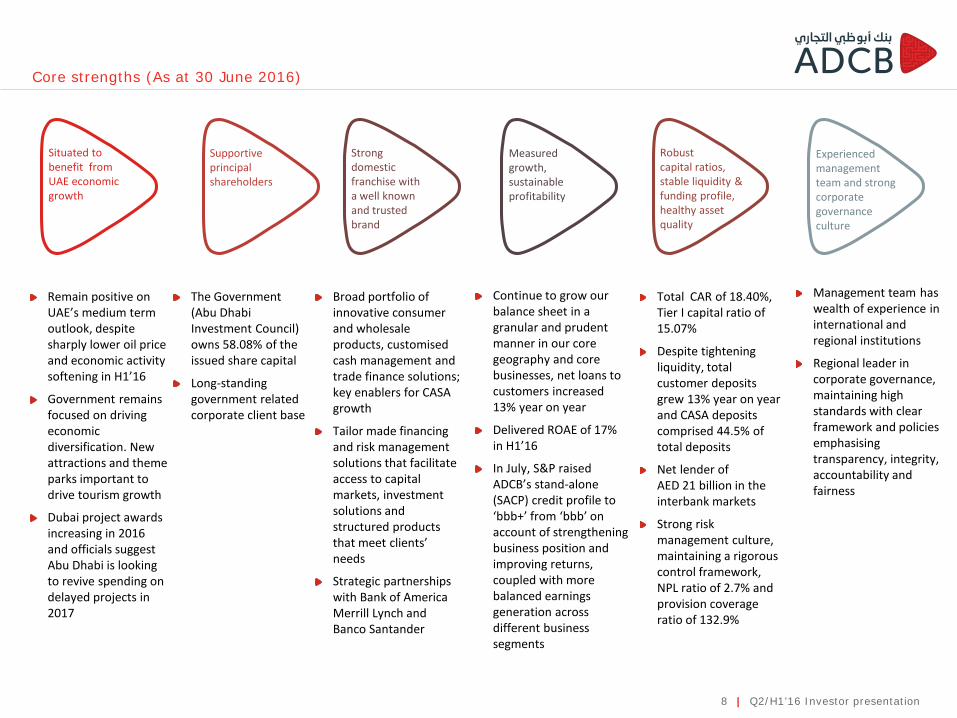
Situated to benefit from UAE economic growth
Remain positive on UAE’s medium term outlook, despite sharply lower oil price and economic activity softening in H1’16
Government remains focused on driving economic diversification. New attractions and theme parks important to drive tourism growth
Dubai project awards increasing in 2016 and officials suggest Abu Dhabi is looking to revive spending on delayed projects in 2017
Supportive principal shareholders
The Government (Abu Dhabi Investment Council) owns 58.08% of the issued share capital
Long-standing government related corporate client base
Robustcapital ratios, stable liquidity & funding profile,healthy asset quality
Total CAR of 18.40%, Tier I capital ratio of 15.07%
Despite tightening liquidity, total customer deposits grew 13% year on year and CASA deposits comprised 44.5% of total deposits
Net lender of AED 21 billion in the interbank markets
Strong risk management culture, maintaining a rigorous control framework, NPL ratio of 2.7% and provision coverage ratio of 132.9%
Strong domestic franchise with a well known and trusted brand
Broad portfolio of innovative consumer and wholesale products, customised cash management and trade finance solutions; key enablers for CASA growth
Tailor made financing and risk management solutions that facilitate access to capital markets, investment solutions and structured products that meet clients’ needs
Strategic partnerships with Bank of America Merrill Lynch and Banco Santander
Measured growth,sustainable profitability
Continue to grow our balance sheet in a granular and prudent manner in our core geography and core businesses, net loans to customers increased 13% year on year
Delivered ROAE of 17% in H1’16
In July, S&P raised ADCB’s stand-alone (SACP) credit profile to ‘bbb+’ from ‘bbb’ on account of strengthening business position and improving returns, coupled with more balanced earnings generation across different business segments
Core strengths (As at 30 June 2016)
Management team has wealth of experience in international and regional institutions
Regional leader in corporate governance, maintaining high standards with clear framework and policies emphasising transparency, integrity, accountability and fairness
Experienced management team and strong corporate governance culture
8 | Q2/H1’16 Investor presentation
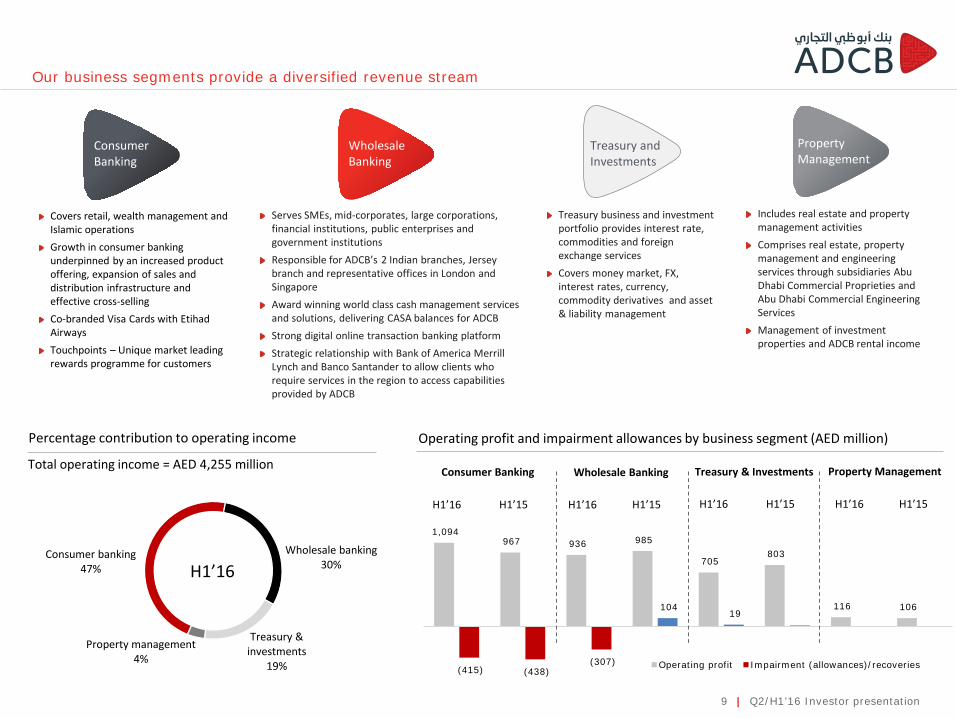
1,094 967 936 985
705 803
116 106
(415) (438)(307)
104 19
Operating profit Impairment (allowances)/recoveries
Consumer banking47%
Wholesale banking30%
Treasury & investments
19%
Property management4%
Total operating income = AED 4,255 million
Percentage contribution to operating income
Consumer Banking
Wholesale Banking
Treasury and Investments
Property Management
Covers retail, wealth management and Islamic operationsGrowth in consumer banking underpinned by an increased product offering, expansion of sales and distribution infrastructure and effective cross-sellingCo-branded Visa Cards with Etihad AirwaysTouchpoints – Unique market leading rewards programme for customers
Serves SMEs, mid-corporates, large corporations, financial institutions, public enterprises and government institutionsResponsible for ADCB’s 2 Indian branches, Jersey branch and representative offices in London and SingaporeAward winning world class cash management services and solutions, delivering CASA balances for ADCBStrong digital online transaction banking platformStrategic relationship with Bank of America Merrill Lynch and Banco Santander to allow clients who require services in the region to access capabilities provided by ADCB
Treasury business and investment portfolio provides interest rate, commodities and foreign exchange services Covers money market, FX, interest rates, currency, commodity derivatives and asset & liability management
Includes real estate and property management activitiesComprises real estate, property management and engineering services through subsidiaries Abu Dhabi Commercial Proprieties and Abu Dhabi Commercial Engineering ServicesManagement of investment properties and ADCB rental income
Our business segments provide a diversified revenue stream
Operating profit and impairment allowances by business segment (AED million)
Consumer Banking Wholesale Banking Treasury & Investments Property Management
H1’16 H1’15 H1’16 H1’15 H1’16 H1’15 H1’16 H1’15
9 | Q2/H1’16 Investor presentation
H1’16
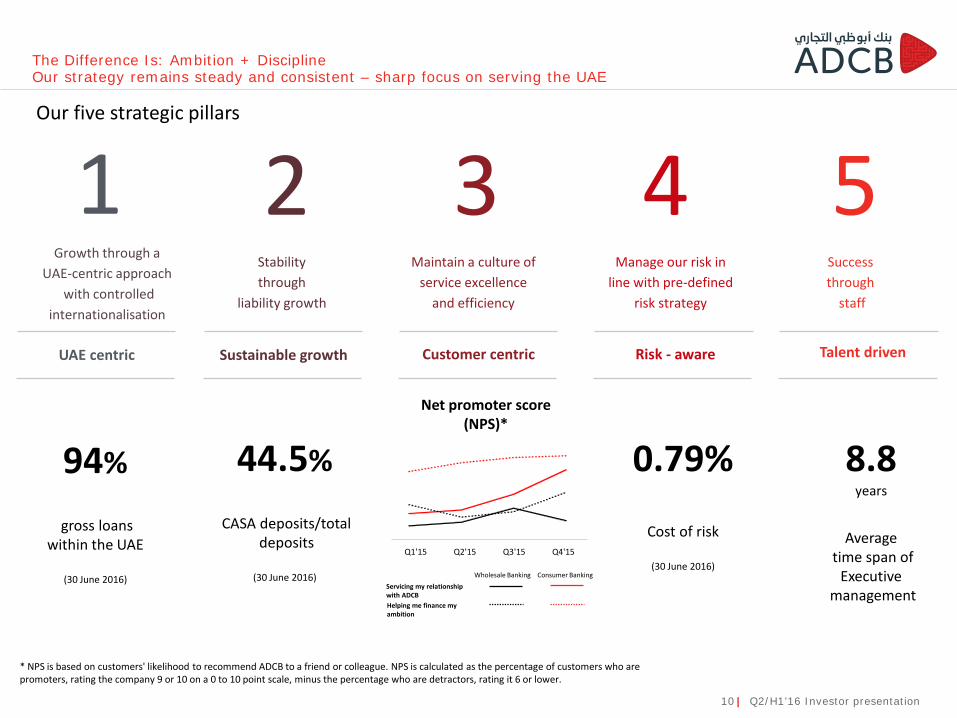
44.5%
CASA deposits/totaldeposits
(30 June 2016)
Q1'15 Q2'15 Q3'15 Q4'15
8.8years
Averagetime span of
Executivemanagement
Our five strategic pillars
Net promoter score (NPS)*
94%
gross loans within the UAE
(30 June 2016)
The Difference Is: Ambition + DisciplineOur strategy remains steady and consistent – sharp focus on serving the UAE
1Growth through a
UAE-centric approachwith controlled
internationalisation
2Stability through
liability growth
3Maintain a culture of
service excellence and efficiency
4Manage our risk in
line with pre-defined risk strategy
5Success through
staff
UAE centric Sustainable growth Customer centric Risk - aware Talent driven
* NPS is based on customers' likelihood to recommend ADCB to a friend or colleague. NPS is calculated as the percentage of customers who are promoters, rating the company 9 or 10 on a 0 to 10 point scale, minus the percentage who are detractors, rating it 6 or lower.
Wholesale Banking Consumer BankingServicing my relationship with ADCBHelping me finance my ambition
10 | Q2/H1’16 Investor presentation
0.79%
Cost of risk
(30 June 2016)

Recognised as a regional leader in corporate governance
11 | Q2/H1’16 Investor presentation
Corporate governance structure
Board committees
Audit & Compliance Committee
Corporate Governance Committee
Nomination, Compensation & HR Committee
Risk & Credit Committee
Management Committees
Management Executive Committee (MEC)
Management Human Resource Committee
(MHRC)
Liabilities and Initiatives Committee (LICO)
Senior Management Committee (SMC)
Assets & Liabilities Committee (ALCO)
Management Risk & Credit Committee
(MRCC)
Management Recoveries Committee (MRC)
Capital Expenditure Committee (CEC)
Financial Performance Management
Committee (FPMC)
International Operations & Alliances
Committee (IO&AC)
Board
Board of Directors
Government Relations
Group
Human Resources
Group
Wholesale Banking Group
Consumer Banking Group
Treasury & Investments
Group
Group Business Services
Group Finance
Risk Group
Structure and composition
Maintain high standards in Corporate Governance, winning “BestCorporate Governance in UAE” from World Finance Magazine in2015 and for the second time in three years, the Hawakamah BankCorporate Governance Award in 2014
The Bank’s governance structure is headed by the Board which hasoverall responsibility for guiding the Bank
The Bank has a number of Board committees and managementcommittees which oversee and monitor day to day activities of theBank
Our reporting lines are an important part of our governancestructure:
- Group Chief Risk Officer is independent and reports to the BoardRisk & Credit Committee (BRCC)
- Group Chief Internal Auditor is independent and reports to theBoard Audit & Compliance Committee
- Group General Counsel and Board Secretary is independent andhas a dual reporting line to the Board and the CEO
The Bank appointed Sir Gerry Grimstone as an independent Adviserto its Board of Directors – Chairman of Standard Life and DeputyChairman of Barclays PLC, to bring a third party perspective on theBank’s governance, and his deep experience, and to help the Bankwith a continual process of improvement
During 2013, Aysha Al Hallami was appointed as Director, firstwoman to be appointed to the Bank’s Board of Directors, In linewith international trends and the Bank's efforts to promote greaterdiversity at Board level, Aysha Al Hallami was appointed in 2013 asthe Bank's first female Director
Highlights
Group Chief Internal Auditor
Group Chief Executive Officer Group General
Counsel and Board Secretary
BACC BRCC
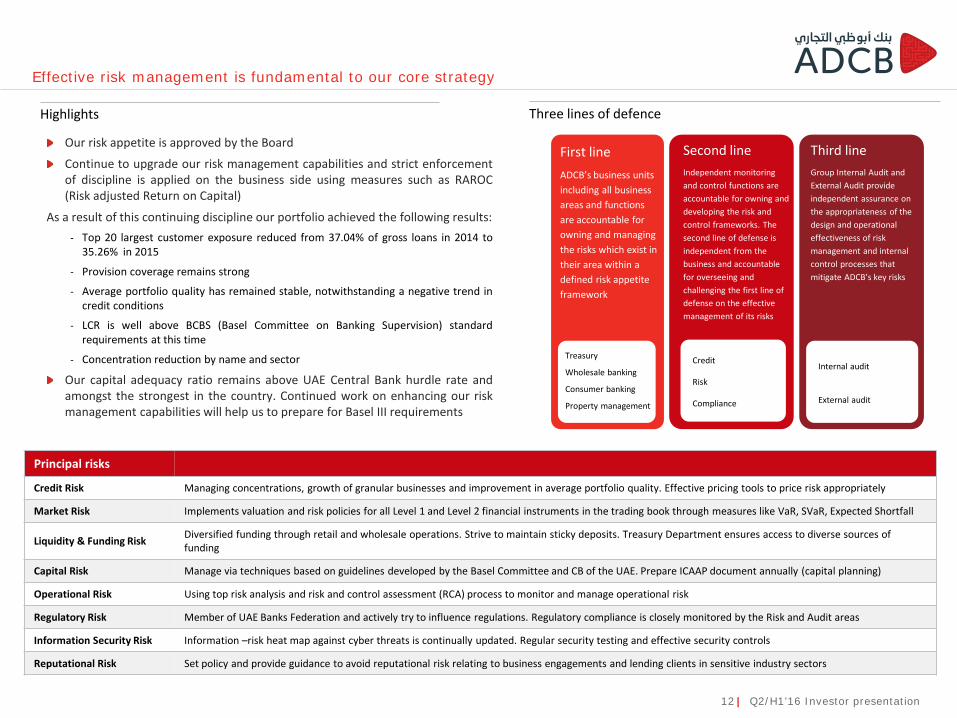
Effective risk management is fundamental to our core strategy
Business units Risk management Independent assurance
Three lines of defenceHighlights
Our risk appetite is approved by the Board
Continue to upgrade our risk management capabilities and strict enforcementof discipline is applied on the business side using measures such as RAROC(Risk adjusted Return on Capital)
As a result of this continuing discipline our portfolio achieved the following results:- Top 20 largest customer exposure reduced from 37.04% of gross loans in 2014 to
35.26% in 2015
- Provision coverage remains strong
- Average portfolio quality has remained stable, notwithstanding a negative trend incredit conditions
- LCR is well above BCBS (Basel Committee on Banking Supervision) standardrequirements at this time
- Concentration reduction by name and sector
Our capital adequacy ratio remains above UAE Central Bank hurdle rate andamongst the strongest in the country. Continued work on enhancing our riskmanagement capabilities will help us to prepare for Basel III requirements
First lineADCB’s business units including all business areas and functions are accountable for owning and managing the risks which exist in their area within a defined risk appetite framework
Second lineIndependent monitoring and control functions are accountable for owning and developing the risk and control frameworks. The second line of defense is independent from the business and accountable for overseeing and challenging the first line of defense on the effective management of its risks
Third lineGroup Internal Audit and External Audit provide independent assurance on the appropriateness of the design and operational effectiveness of risk management and internal control processes that mitigate ADCB’s key risks
Treasury
Wholesale banking
Consumer banking
Property management
Credit
Risk
Compliance
Internal audit
External audit
Principal risks
Credit Risk Managing concentrations, growth of granular businesses and improvement in average portfolio quality. Effective pricing tools to price risk appropriately
Market Risk Implements valuation and risk policies for all Level 1 and Level 2 financial instruments in the trading book through measures like VaR, SVaR, Expected Shortfall
Liquidity & Funding Risk Diversified funding through retail and wholesale operations. Strive to maintain sticky deposits. Treasury Department ensures access to diverse sources of funding
Capital Risk Manage via techniques based on guidelines developed by the Basel Committee and CB of the UAE. Prepare ICAAP document annually (capital planning)
Operational Risk Using top risk analysis and risk and control assessment (RCA) process to monitor and manage operational risk
Regulatory Risk Member of UAE Banks Federation and actively try to influence regulations. Regulatory compliance is closely monitored by the Risk and Audit areas
Information Security Risk Information –risk heat map against cyber threats is continually updated. Regular security testing and effective security controls
Reputational Risk Set policy and provide guidance to avoid reputational risk relating to business engagements and lending clients in sensitive industry sectors
12 | Q2/H1’16 Investor presentation
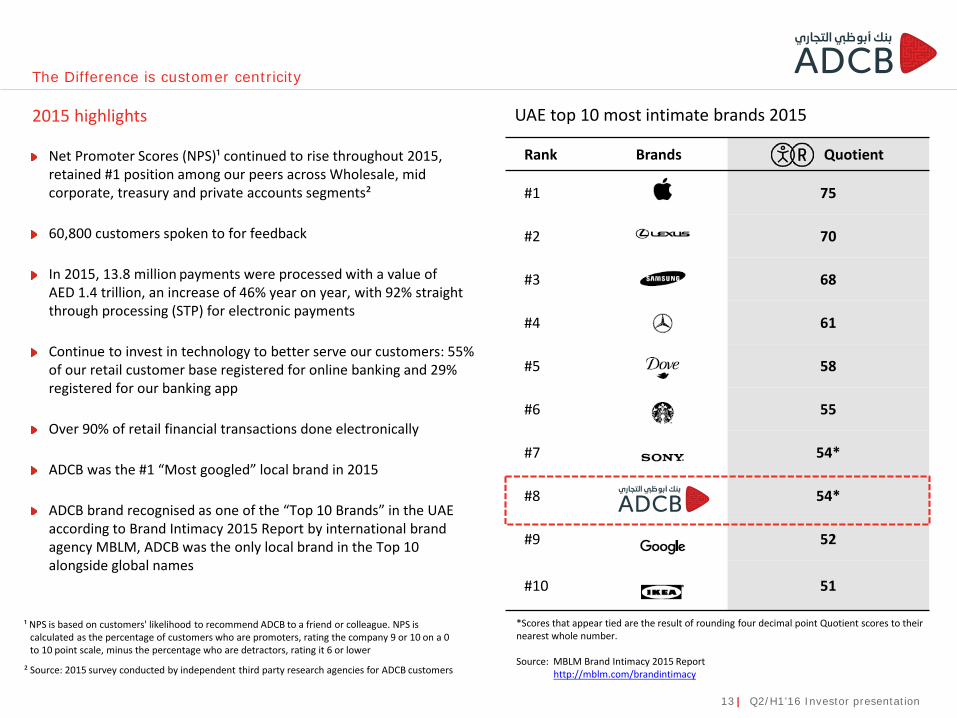
The Difference is customer centricity
Rank Brands Quotient
#1 75
#2 70
#3 68
#4 61
#5 58
#6 55
#7 54*
#8 54*
#9 52
#10 51
Net Promoter Scores (NPS)¹ continued to rise throughout 2015, retained #1 position among our peers across Wholesale, mid corporate, treasury and private accounts segments²
60,800 customers spoken to for feedback
In 2015, 13.8 million payments were processed with a value of AED 1.4 trillion, an increase of 46% year on year, with 92% straight through processing (STP) for electronic payments
Continue to invest in technology to better serve our customers: 55% of our retail customer base registered for online banking and 29% registered for our banking app
Over 90% of retail financial transactions done electronically
ADCB was the #1 “Most googled” local brand in 2015
ADCB brand recognised as one of the “Top 10 Brands” in the UAE according to Brand Intimacy 2015 Report by international brand agency MBLM, ADCB was the only local brand in the Top 10 alongside global names
UAE top 10 most intimate brands 20152015 highlights
*Scores that appear tied are the result of rounding four decimal point Quotient scores to their nearest whole number.
Source: MBLM Brand Intimacy 2015 Reporthttp://mblm.com/brandintimacy² Source: 2015 survey conducted by independent third party research agencies for ADCB customers
¹ NPS is based on customers' likelihood to recommend ADCB to a friend or colleague. NPS is calculated as the percentage of customers who are promoters, rating the company 9 or 10 on a 0 to 10 point scale, minus the percentage who are detractors, rating it 6 or lower
13 | Q2/H1’16 Investor presentation
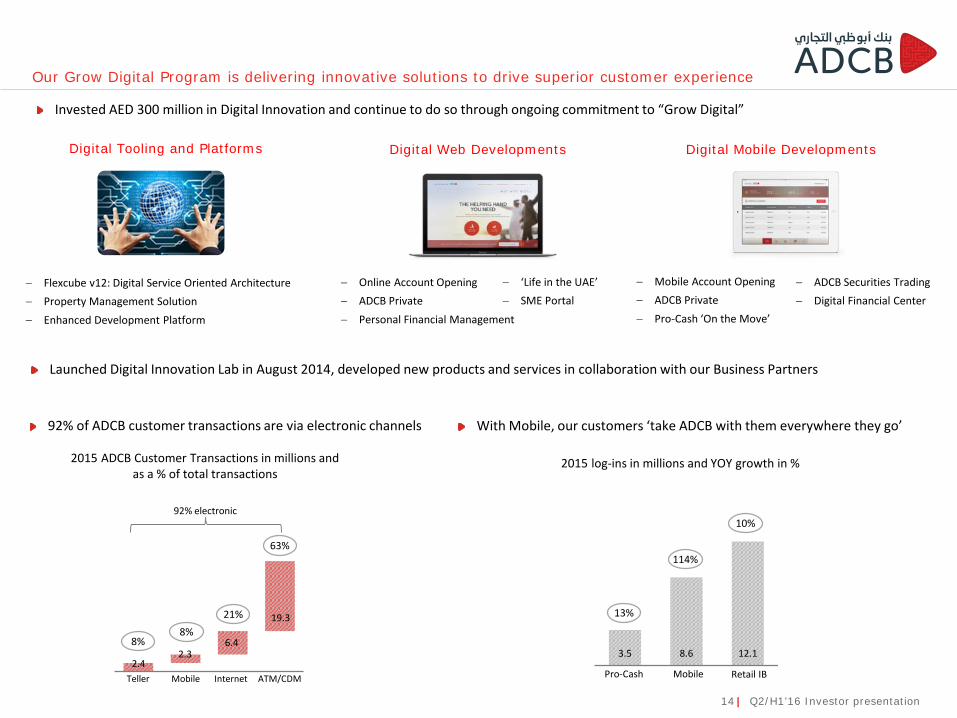
3.5 8.6 12.1
2015 ADCB Customer Transactions in millions and as a % of total transactions
Our Grow Digital Program is delivering innovative solutions to drive superior customer experience
92% electronic
2015 log-ins in millions and YOY growth in %
Teller InternetMobile ATM/CDM2.4
6.42.3
19.3
8%8%
21%
63%
MobilePro-Cash Retail IB
13%
114%
10%
− Flexcube v12: Digital Service Oriented Architecture − Property Management Solution− Enhanced Development Platform
Digital Tooling and Platforms Digital Web Developments Digital Mobile Developments
92% of ADCB customer transactions are via electronic channels With Mobile, our customers ‘take ADCB with them everywhere they go’
Launched Digital Innovation Lab in August 2014, developed new products and services in collaboration with our Business Partners
Invested AED 300 million in Digital Innovation and continue to do so through ongoing commitment to “Grow Digital”
− Mobile Account Opening− ADCB Private− Pro-Cash ‘On the Move’
− ADCB Securities Trading− Digital Financial Center
− Online Account Opening− ADCB Private− Personal Financial Management
− ‘Life in the UAE’− SME Portal
14 | Q2/H1’16 Investor presentation
Financial highlights
Business overview
Appendix
Macro overview
0.29%
0.48%
0.90%
1.20%
1.73%
2.61%
2015
2014
2013
2012
2011
2010
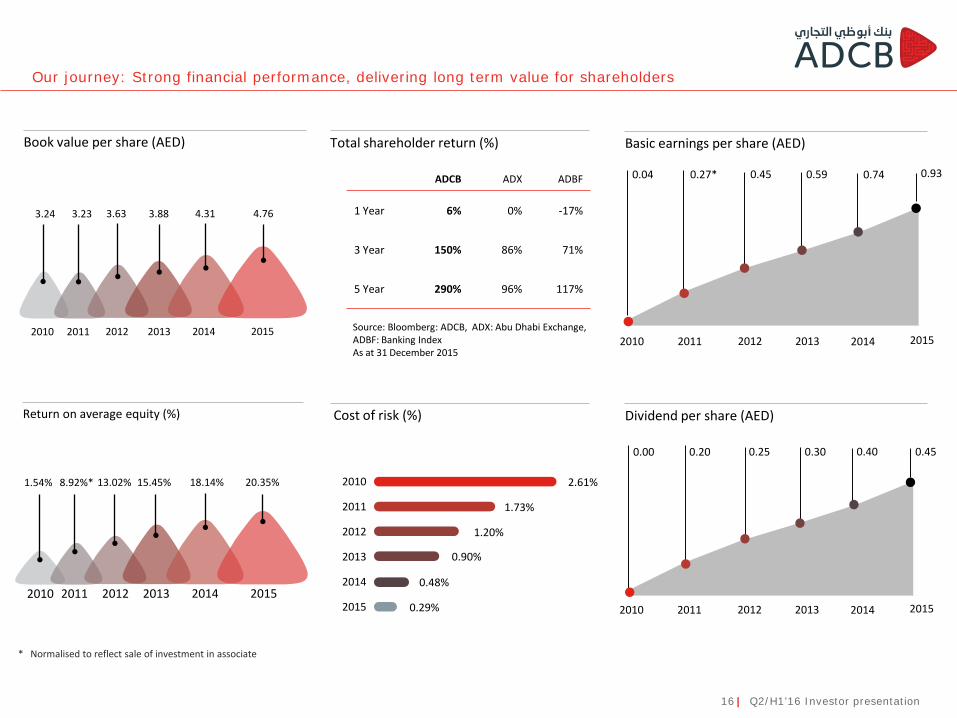
Our journey: Strong financial performance, delivering long term value for shareholders
Book value per share (AED) Total shareholder return (%) Basic earnings per share (AED)
0.27* 0.45 0.59 0.74 0.930.04
0.20 0.25 0.30 0.40 0.450.00
Cost of risk (%) Dividend per share (AED)
2011 2012 2013 2014 20152010
2011 2012 2013 2014 20152010
3.23 3.63 3.88 4.31 4.763.24
2011 2012 2013 2014 20152010
ADCB ADX ADBF
1 Year 6% 0% -17%
3 Year 150% 86% 71%
5 Year 290% 96% 117%
Source: Bloomberg: ADCB, ADX: Abu Dhabi Exchange, ADBF: Banking IndexAs at 31 December 2015
16 | Q2/H1’16 Investor presentation
2011 2012 2013 2014 20152010
Return on average equity (%)
8.92%* 13.02% 15.45% 18.14% 20.35%1.54%
* Normalised to reflect sale of investment in associate
2010 2011 2012 2013 2014 2015
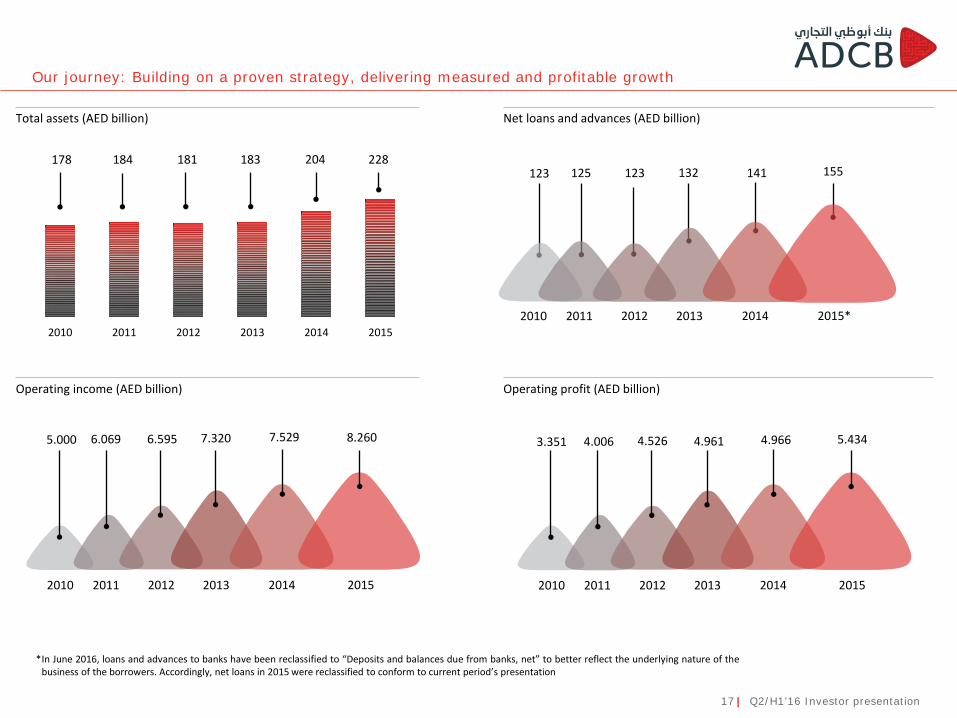
Total assets (AED billion)
Our journey: Building on a proven strategy, delivering measured and profitable growth
184 181 183 204 228178
17 | Q2/H1’16 Investor presentation
Net loans and advances (AED billion)
123 125 123 132 141 155
2011 2012 2013 2014 2015*2010
5.000 6.069 6.595 7.320 7.529 8.260
2011 2012 2013 2014 20152010
3.351 4.006 4.526 4.961 4.966 5.434
2011 2012 2013 2014 20152010
Operating income (AED billion) Operating profit (AED billion)
*In June 2016, loans and advances to banks have been reclassified to “Deposits and balances due from banks, net” to better reflect the underlying nature of thebusiness of the borrowers. Accordingly, net loans in 2015 were reclassified to conform to current period’s presentation
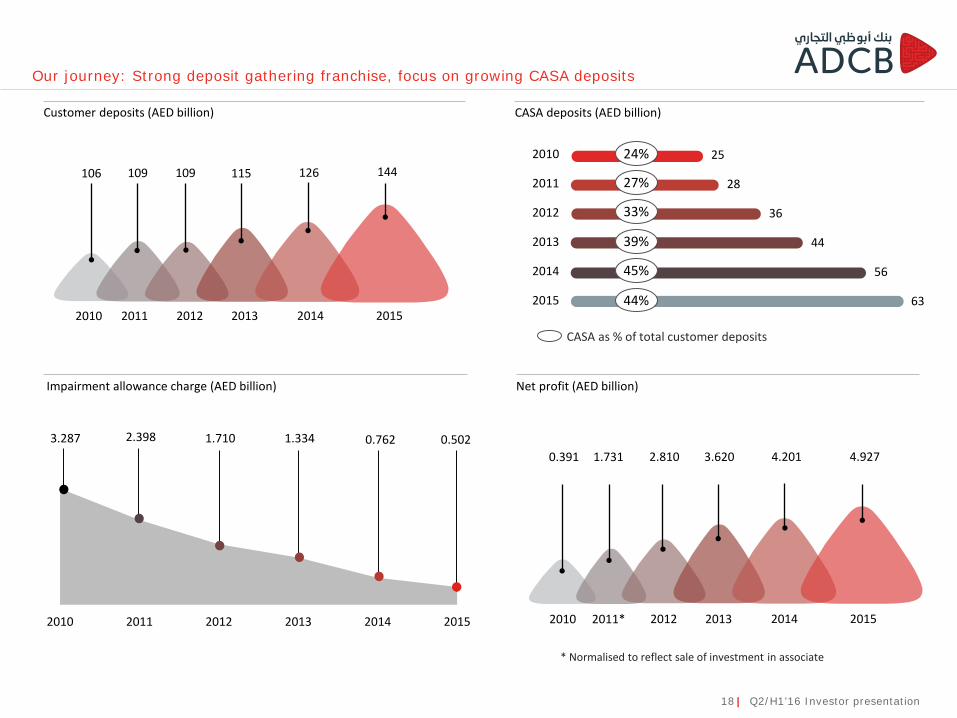
106 109 109 115 126 144
63
56
44
36
28
25
2015
2014
2013
2012
2011
2010
Our journey: Strong deposit gathering franchise, focus on growing CASA deposits
Customer deposits (AED billion) CASA deposits (AED billion)
2011 2012 2013 2014 20152010
18 | Q2/H1’16 Investor presentation
CASA as % of total customer deposits
24%
27%
33%
39%
45%
44%
2011* 2012 2013 2014 20152010
Net profit (AED billion)
1.731 2.810 3.620 4.201 4.9270.391
Impairment allowance charge (AED billion)
3.287 2.398 1.710 1.334 0.762 0.502
2010 2011 2012 2013 2014 2015
* Normalised to reflect sale of investment in associate
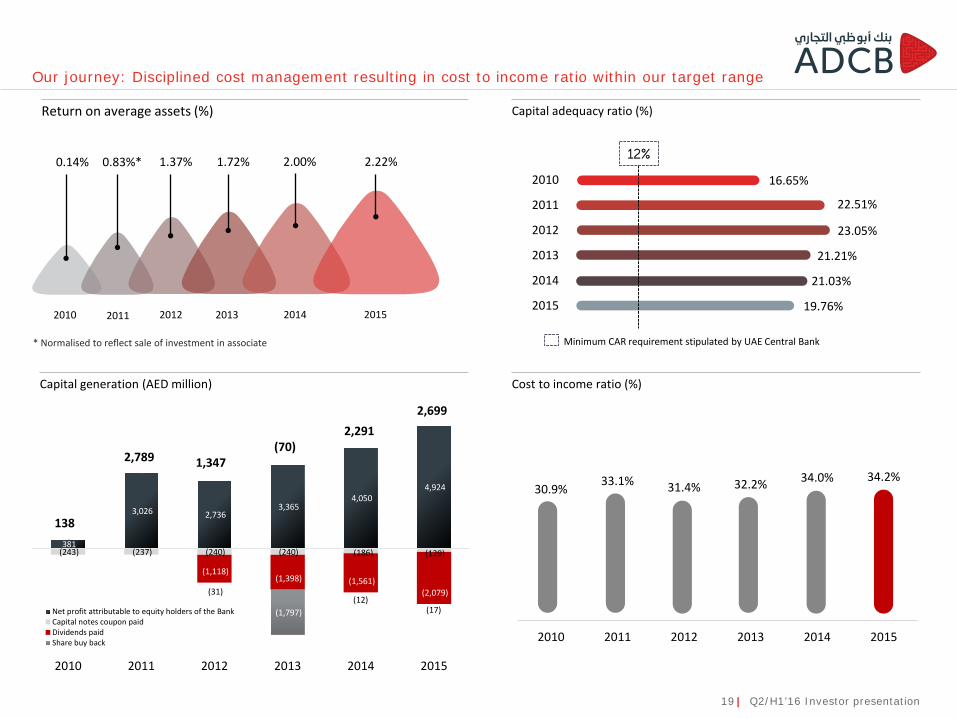
Our journey: Disciplined cost management resulting in cost to income ratio within our target range
Cost to income ratio (%)
30.9% 33.1% 31.4% 32.2% 34.0% 34.2%
2010 2011 2012 2013 2014 2015
19 | Q2/H1’16 Investor presentation
Capital generation (AED million)
381
3,026 2,736 3,365
4,050 4,924
(243) (237) (240) (240) (186) (129)
(1,118)(1,398) (1,561)
(2,079)
-
-
(31)
(1,797)(12)
(17)
2010 2011 2012 2013 2014 2015
Net profit attributable to equity holders of the BankCapital notes coupon paidDividends paidShare buy back
138
2,789 1,347(70)
2,2912,699
* Normalised to reflect sale of investment in associate
Capital adequacy ratio (%)
19.76%
21.03%
21.21%
23.05%
22.51%
16.65%
2015
2014
2013
2012
2011
2010
12%
Minimum CAR requirement stipulated by UAE Central Bank
Return on average assets (%)
0.83%* 1.37% 1.72% 2.00% 2.22%0.14%
2011 2012 2013 2014 20152010
Business overview
Appendix
Macro overview
Our journey
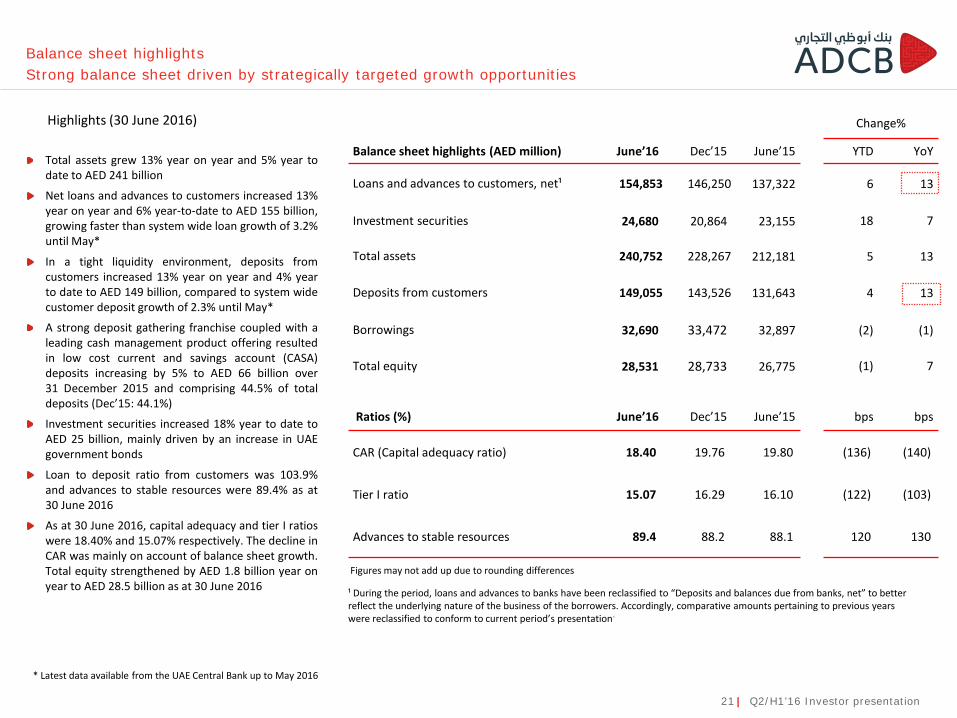
Total assets grew 13% year on year and 5% year todate to AED 241 billion
Net loans and advances to customers increased 13%year on year and 6% year-to-date to AED 155 billion,growing faster than system wide loan growth of 3.2%until May*
In a tight liquidity environment, deposits fromcustomers increased 13% year on year and 4% yearto date to AED 149 billion, compared to system widecustomer deposit growth of 2.3% until May*
A strong deposit gathering franchise coupled with aleading cash management product offering resultedin low cost current and savings account (CASA)deposits increasing by 5% to AED 66 billion over31 December 2015 and comprising 44.5% of totaldeposits (Dec’15: 44.1%)
Investment securities increased 18% year to date toAED 25 billion, mainly driven by an increase in UAEgovernment bonds
Loan to deposit ratio from customers was 103.9%and advances to stable resources were 89.4% as at30 June 2016
As at 30 June 2016, capital adequacy and tier I ratioswere 18.40% and 15.07% respectively. The decline inCAR was mainly on account of balance sheet growth.Total equity strengthened by AED 1.8 billion year onyear to AED 28.5 billion as at 30 June 2016
Highlights (30 June 2016)
Balance sheet highlightsStrong balance sheet driven by strategically targeted growth opportunities
* Latest data available from the UAE Central Bank up to May 2016
Figures may not add up due to rounding differences
Change%
Balance sheet highlights (AED million) June’16 Dec’15 June’15 YTD YoY
Loans and advances to customers, net¹ 154,853 146,250 137,322 6 13
Investment securities 24,680 20,864 23,155 18 7
Total assets 240,752 228,267 212,181 5 13
Deposits from customers 149,055 143,526 131,643 4 13
Borrowings 32,690 33,472 32,897 (2) (1)
Total equity 28,531 28,733 26,775 (1) 7
Ratios (%) June’16 Dec’15 June’15 bps bps
CAR (Capital adequacy ratio) 18.40 19.76 19.80 (136) (140)
Tier I ratio 15.07 16.29 16.10 (122) (103)
Advances to stable resources 89.4 88.2 88.1 120 130
21 | Q2/H1’16 Investor presentation
¹ During the period, loans and advances to banks have been reclassified to “Deposits and balances due from banks, net” to better reflect the underlying nature of the business of the borrowers. Accordingly, comparative amounts pertaining to previous yearswere reclassified to conform to current period’s presentation.
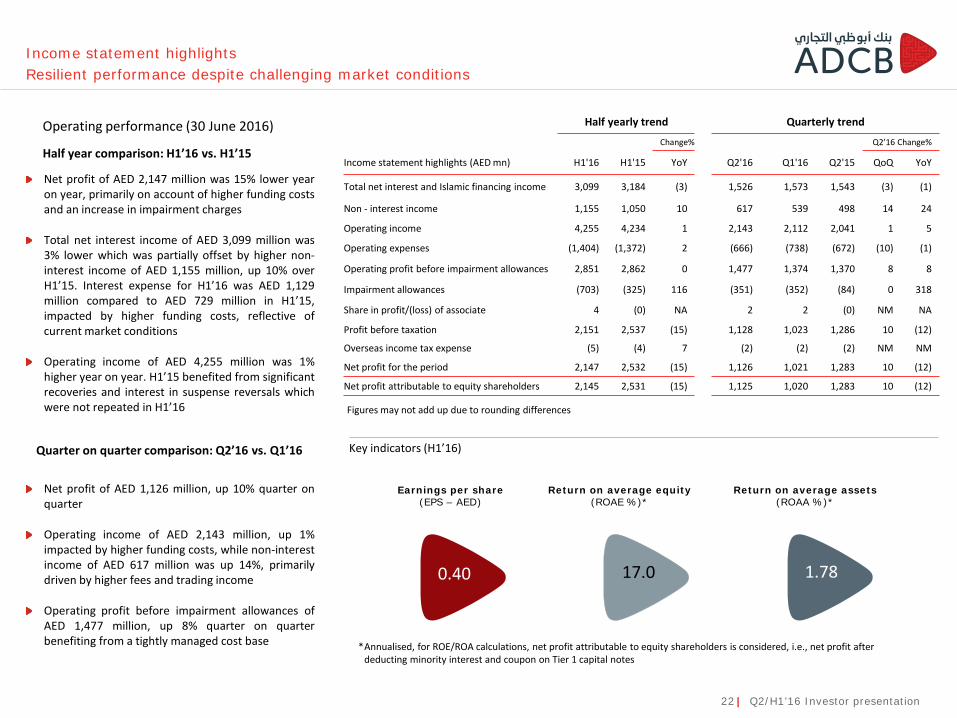
Income statement highlightsResilient performance despite challenging market conditions
Key indicators (H1’16)
Return on average equity(ROAE %)*
Return on average assets (ROAA %)*
Earnings per share(EPS – AED)
*Annualised, for ROE/ROA calculations, net profit attributable to equity shareholders is considered, i.e., net profit after deducting minority interest and coupon on Tier 1 capital notes
15.9
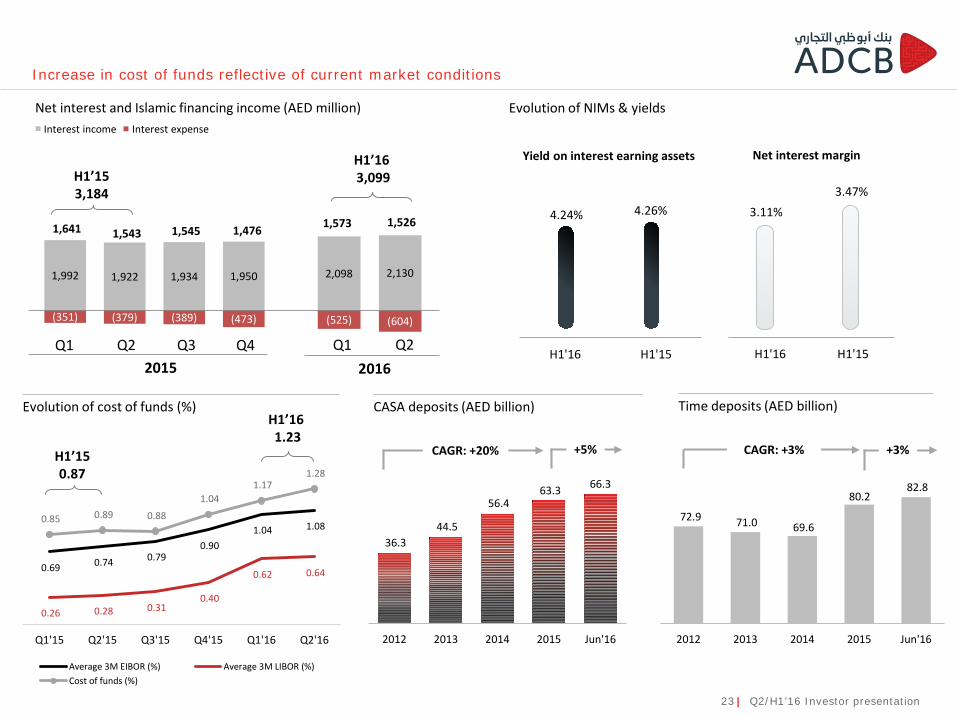
Net profit of AED 2,147 million was 15% lower yearon year, primarily on account of higher funding costsand an increase in impairment charges
Total net interest income of AED 3,099 million was3% lower which was partially offset by higher non-interest income of AED 1,155 million, up 10% overH1’15. Interest expense for H1’16 was AED 1,129million compared to AED 729 million in H1’15,impacted by higher funding costs, reflective ofcurrent market conditions
Operating income of AED 4,255 million was 1%higher year on year. H1’15 benefited from significantrecoveries and interest in suspense reversals whichwere not repeated in H1’16
Net profit of AED 1,126 million, up 10% quarter onquarter
Operating income of AED 2,143 million, up 1%impacted by higher funding costs, while non-interestincome of AED 617 million was up 14%, primarilydriven by higher fees and trading income
Operating profit before impairment allowances ofAED 1,477 million, up 8% quarter on quarterbenefiting from a tightly managed cost base
0.40 17.0 1.78
Figures may not add up due to rounding differences
Operating performance (30 June 2016)
Half year comparison: H1’16 vs. H1’15
22 | Q2/H1’16 Investor presentation
Quarter on quarter comparison: Q2’16 vs. Q1’16
Half yearly trend Quarterly trend
Change% Q2’16 Change%
Income statement highlights (AED mn) H1'16 H1'15 YoY Q2'16 Q1'16 Q2'15 QoQ YoY
Total net interest and Islamic financing income 3,099 3,184 (3) 1,526 1,573 1,543 (3) (1)
Non - interest income 1,155 1,050 10 617 539 498 14 24
Operating income 4,255 4,234 1 2,143 2,112 2,041 1 5
Operating expenses (1,404) (1,372) 2 (666) (738) (672) (10) (1)
Operating profit before impairment allowances 2,851 2,862 0 1,477 1,374 1,370 8 8
Impairment allowances (703) (325) 116 (351) (352) (84) 0 318
Share in profit/(loss) of associate 4 (0) NA 2 2 (0) NM NA
Profit before taxation 2,151 2,537 (15) 1,128 1,023 1,286 10 (12)
Overseas income tax expense (5) (4) 7 (2) (2) (2) NM NM
Net profit for the period 2,147 2,532 (15) 1,126 1,021 1,283 10 (12)
Net profit attributable to equity shareholders 2,145 2,531 (15) 1,125 1,020 1,283 10 (12)
0.69 0.74 0.79 0.90
1.04 1.08
0.26 0.28 0.31 0.40
0.62 0.64
0.85 0.89 0.88
1.04 1.17
1.28
Q1'15 Q2'15 Q3'15 Q4'15 Q1'16 Q2'16
Average 3M EIBOR (%) Average 3M LIBOR (%)Cost of funds (%)
2,098 2,130
(525) (604)
1,992 1,922 1,934 1,950
(351) (379) (389) (473)
1,573 1,526 4.24% 4.26%
H1'16 H1'15
3.11%3.47%
H1'16 H1'15
Increase in cost of funds reflective of current market conditions
Net interest and Islamic financing income (AED million) Evolution of NIMs & yieldsInterest income Interest expense
Evolution of cost of funds (%)
Yield on interest earning assets Net interest margin
23 | Q2/H1’16 Investor presentation
1,543 1,545 1,4761,641
H1’153,184
H1’163,099
2015 2016Q1 Q2 Q4Q3 Q1 Q2
72.9 71.0 69.6
80.2 82.8
2012 2013 2014 2015 Jun'16
CASA deposits (AED billion) Time deposits (AED billion)
+3%+5% CAGR: +3%CAGR: +20%
36.3 44.5
56.4 63.3 66.3
2012 2013 2014 2015 Jun'16
H1’150.87
H1’161.23
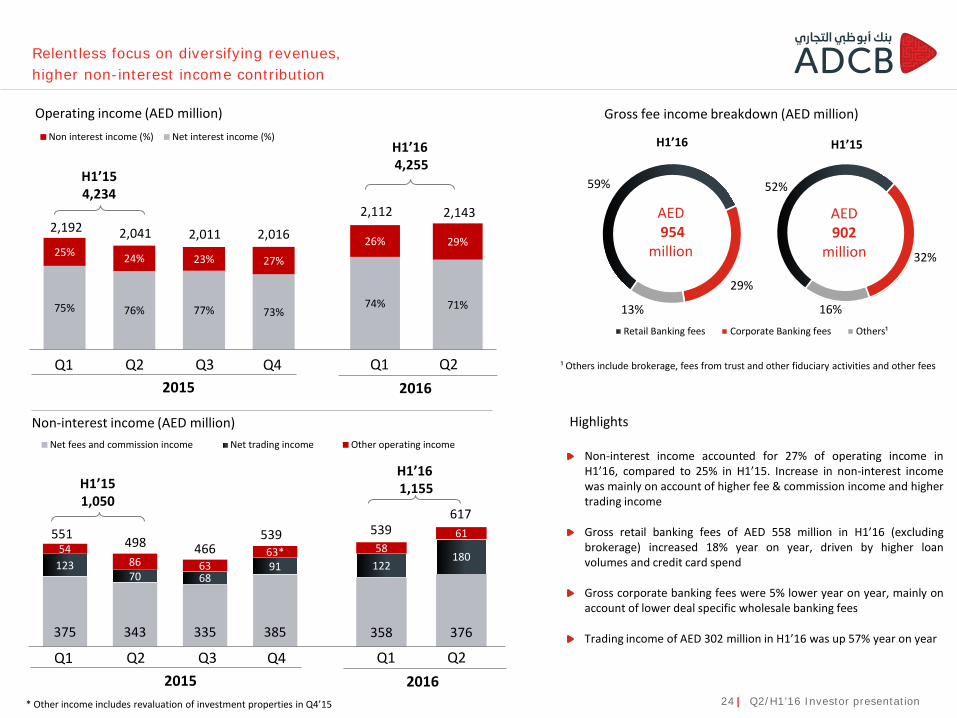
Non-interest income accounted for 27% of operating income inH1’16, compared to 25% in H1’15. Increase in non-interest incomewas mainly on account of higher fee & commission income and highertrading income
Gross retail banking fees of AED 558 million in H1’16 (excludingbrokerage) increased 18% year on year, driven by higher loanvolumes and credit card spend
Gross corporate banking fees were 5% lower year on year, mainly onaccount of lower deal specific wholesale banking fees
Trading income of AED 302 million in H1’16 was up 57% year on year
52%
32%
16%Retail Banking fees Corporate Banking fees Others¹
59%
29%
13%
Relentless focus on diversifying revenues, higher non-interest income contribution
Operating income (AED million)
Non-interest income (AED million) Highlights
24 | Q2/H1’16 Investor presentation
75% 76% 77% 73%
25% 24% 23% 27%
Non interest income (%) Net interest income (%)
74% 71%
26% 29%2,041 2,011 2,016
2,143 2,112
H1’154,234
H1’164,255
2015 2016Q1 Q2 Q4Q3 Q1 Q2
2,192
* Other income includes revaluation of investment properties in Q4’15
375 343 335 385
12370 68
9154
86 6363*
Net fees and commission income Net trading income Other operating income
358 376
122180
5861
2015 2016Q1 Q2 Q4Q3 Q1 Q2
617
498 466539 539
H1’151,050
H1’161,155
551
AED954
million
H1’15H1’16
¹ Others include brokerage, fees from trust and other fiduciary activities and other fees
AED902
million
Gross fee income breakdown (AED million)
443 371 451 424
219 261248 257
38 39 40 34
468 374
235255
34 36
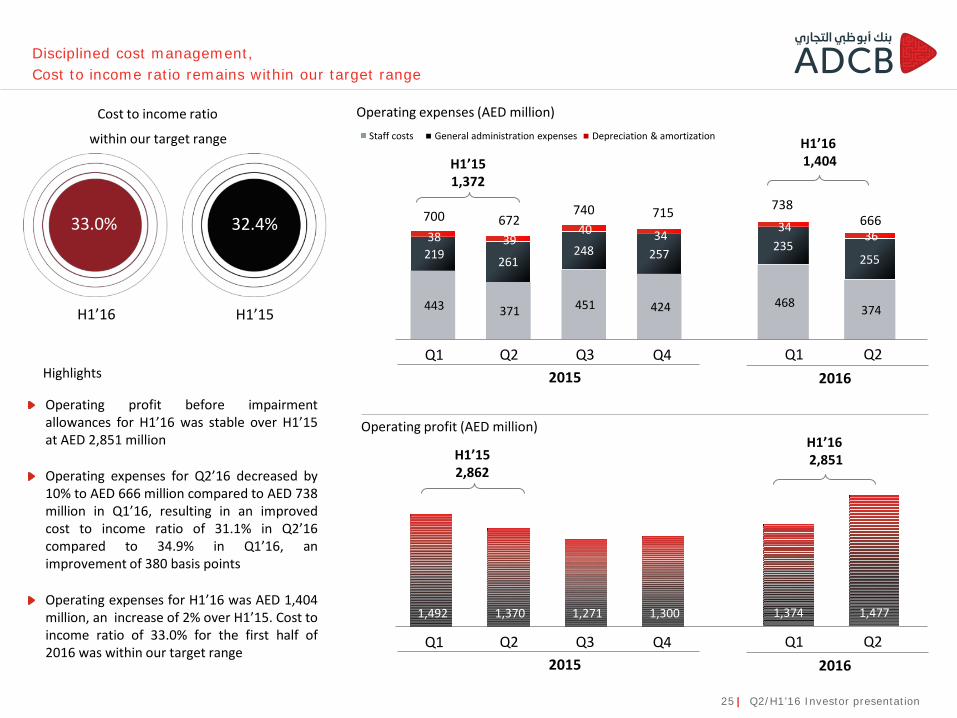
Disciplined cost management, Cost to income ratio remains within our target range
Cost to income ratio Operating expenses (AED million)
666672 740 738715
Highlights
within our target range
H1’15H1’16
32.4%33.0%
Operating profit before impairmentallowances for H1’16 was stable over H1’15at AED 2,851 million
Operating expenses for Q2’16 decreased by10% to AED 666 million compared to AED 738million in Q1’16, resulting in an improvedcost to income ratio of 31.1% in Q2’16compared to 34.9% in Q1’16, animprovement of 380 basis points
Operating expenses for H1’16 was AED 1,404million, an increase of 2% over H1’15. Cost toincome ratio of 33.0% for the first half of2016 was within our target range
Depreciation & amortization Staff costs General administration expenses
25 | Q2/H1’16 Investor presentation
2015 2016Q1 Q2 Q4Q3 Q1 Q2
H1’151,372
H1’161,404
700
Operating profit (AED million)
2015 2016Q1 Q2 Q4Q3 Q1 Q2
1,492 1,370 1,271 1,300 1,374 1,477
H1’152,862
H1’162,851
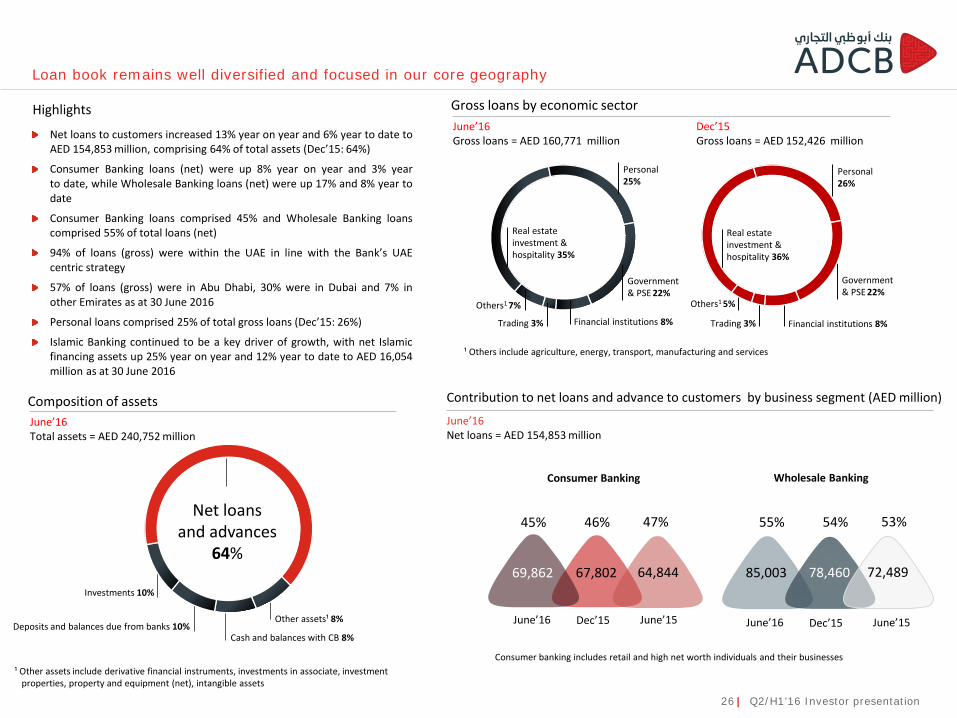
Loan book remains well diversified and focused in our core geography
Highlights
Net loans to customers increased 13% year on year and 6% year to date toAED 154,853 million, comprising 64% of total assets (Dec’15: 64%)
Consumer Banking loans (net) were up 8% year on year and 3% yearto date, while Wholesale Banking loans (net) were up 17% and 8% year todate
Consumer Banking loans comprised 45% and Wholesale Banking loanscomprised 55% of total loans (net)
94% of loans (gross) were within the UAE in line with the Bank’s UAEcentric strategy
57% of loans (gross) were in Abu Dhabi, 30% were in Dubai and 7% inother Emirates as at 30 June 2016
Personal loans comprised 25% of total gross loans (Dec’15: 26%)
Islamic Banking continued to be a key driver of growth, with net Islamicfinancing assets up 25% year on year and 12% year to date to AED 16,054million as at 30 June 2016
26 | Q2/H1’16 Investor presentation
June’16Gross loans = AED 160,771 million
¹ Others include agriculture, energy, transport, manufacturing and services
Contribution to net loans and advance to customers by business segment (AED million)
Gross loans by economic sector
Consumer banking includes retail and high net worth individuals and their businesses
Personal25%
Others1 7%
Real estate investment & hospitality 35%
Financial institutions 8%
Government & PSE 22%
Trading 3%
Personal26%
Others1 5%
Real estate investment & hospitality 36%
Financial institutions 8%
Government & PSE 22%
Trading 3%
Dec’15Gross loans = AED 152,426 million
June’16Net loans = AED 154,853 million
Wholesale Banking
Dec’15June’16 June’15
46%45% 47%
67,80269,862 64,844
Dec’15June’16 June’15
54%55% 53%
78,46085,003 72,489
Consumer Banking
June’16Total assets = AED 240,752 million
Composition of assets
¹ Other assets include derivative financial instruments, investments in associate, investment properties, property and equipment (net), intangible assets
Net loans and advances
64%
Deposits and balances due from banks 10%
Investments 10%
Other assets¹ 8%
Cash and balances with CB 8%
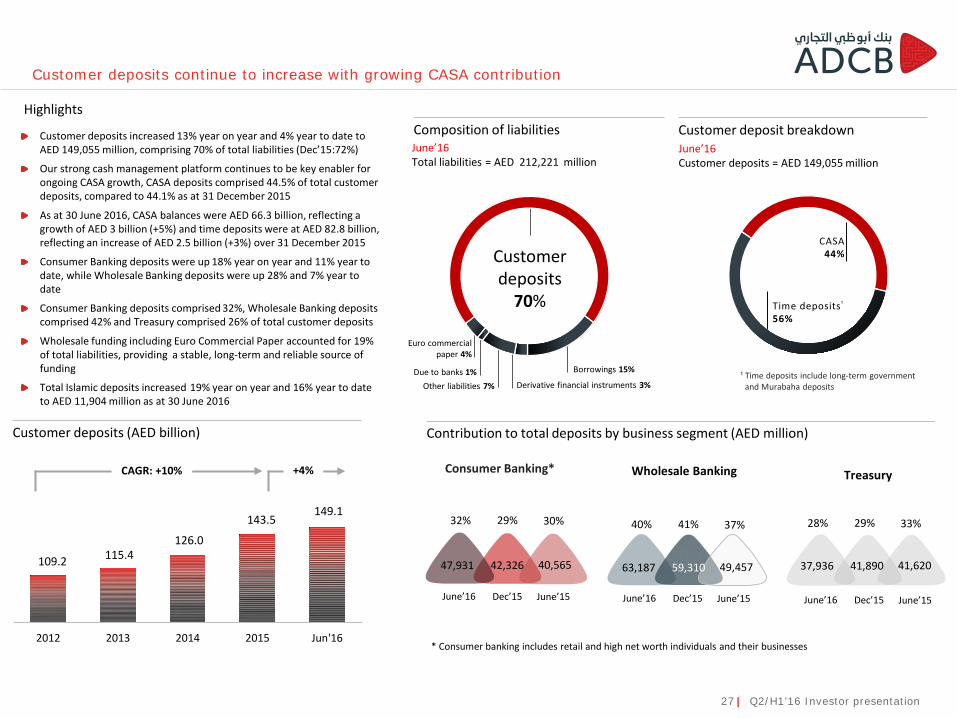
Contribution to total deposits by business segment (AED million)
Customer deposits
70%
Euro commercial paper 4%
Due to banks 1%Other liabilities 7% Derivative financial instruments 3%
Borrowings 15%
Customer deposits continue to increase with growing CASA contribution
¹ Time deposits include long-term government and Murabaha deposits
CASA44%
Time deposits¹
56%
* Consumer banking includes retail and high net worth individuals and their businesses
Consumer Banking*
Dec’15June’16 June’15
29%32% 30%
42,32647,931 40,565
Wholesale Banking
Dec’15June’16 June’15
41%40% 37%
59,31063,187 49,457
Highlights Composition of liabilities Customer deposit breakdownJune’16Total liabilities = AED 212,221 million
June’16Customer deposits = AED 149,055 million
Treasury
Dec’15June’16 June’15
29%28% 33%
41,89037,936 41,620
27 | Q2/H1’16 Investor presentation
109.2 115.4 126.0
143.5 149.1
2012 2013 2014 2015 Jun'16
+4%CAGR: +10%
Customer deposits (AED billion)
Customer deposits increased 13% year on year and 4% year to date to AED 149,055 million, comprising 70% of total liabilities (Dec’15:72%)
Our strong cash management platform continues to be key enabler for ongoing CASA growth, CASA deposits comprised 44.5% of total customer deposits, compared to 44.1% as at 31 December 2015
As at 30 June 2016, CASA balances were AED 66.3 billion, reflecting a growth of AED 3 billion (+5%) and time deposits were at AED 82.8 billion, reflecting an increase of AED 2.5 billion (+3%) over 31 December 2015
Consumer Banking deposits were up 18% year on year and 11% year to date, while Wholesale Banking deposits were up 28% and 7% year to date
Consumer Banking deposits comprised 32%, Wholesale Banking deposits comprised 42% and Treasury comprised 26% of total customer deposits
Wholesale funding including Euro Commercial Paper accounted for 19% of total liabilities, providing a stable, long-term and reliable source of funding
Total Islamic deposits increased 19% year on year and 16% year to date to AED 11,904 million as at 30 June 2016
30.7 29.7 36.7 39.2 40.4
2012 2013 2014 2015 June'16
5,057
2,616
551
2,018
735
735
731 4,201
89
4,954
2,739 5,764
6,170 1,844
792
990
278
100
2016 2017 2018 2019 2020 and beyond
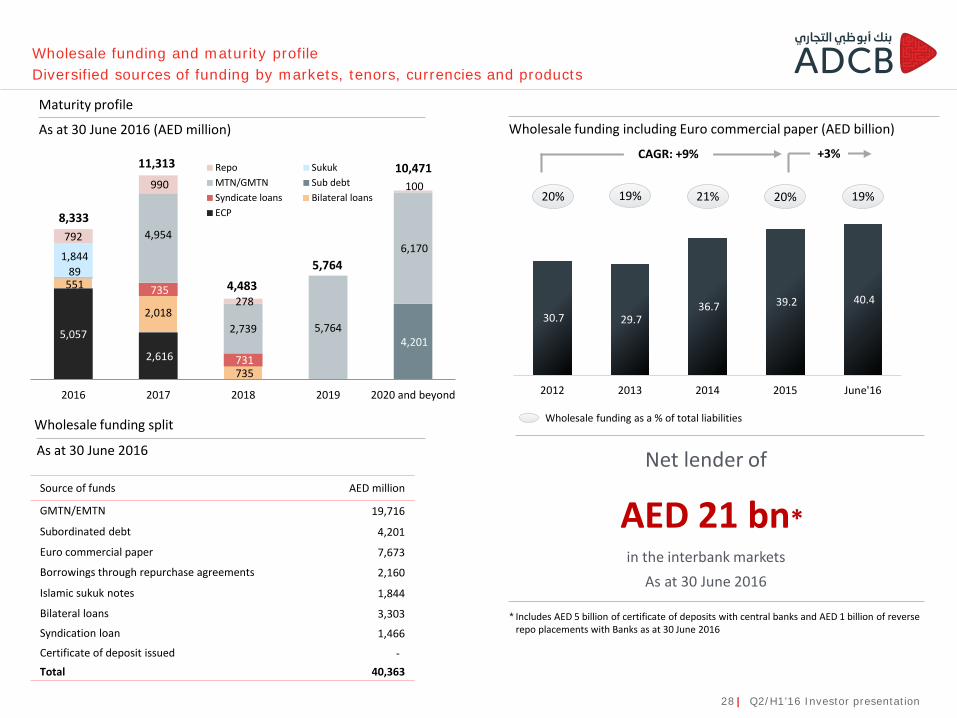
Repo SukukMTN/GMTN Sub debtSyndicate loans Bilateral loansECP
Maturity profile
As at 30 June 2016 (AED million)
Wholesale funding and maturity profileDiversified sources of funding by markets, tenors, currencies and products
4,4835,764
10,47111,313
8,333
Wholesale funding including Euro commercial paper (AED billion)
+3%
Net lender of
AED 21 bn*in the interbank markets
As at 30 June 2016
* Includes AED 5 billion of certificate of deposits with central banks and AED 1 billion of reverse repo placements with Banks as at 30 June 2016
As at 30 June 2016
Source of funds AED million
GMTN/EMTN 19,716
Subordinated debt 4,201
Euro commercial paper 7,673
Borrowings through repurchase agreements 2,160
Islamic sukuk notes 1,844
Bilateral loans 3,303
Syndication loan 1,466
Certificate of deposit issued -Total 40,363
Wholesale funding split Wholesale funding as a % of total liabilities
CAGR: +9%
28 | Q2/H1’16 Investor presentation
20% 19% 21% 20% 19%
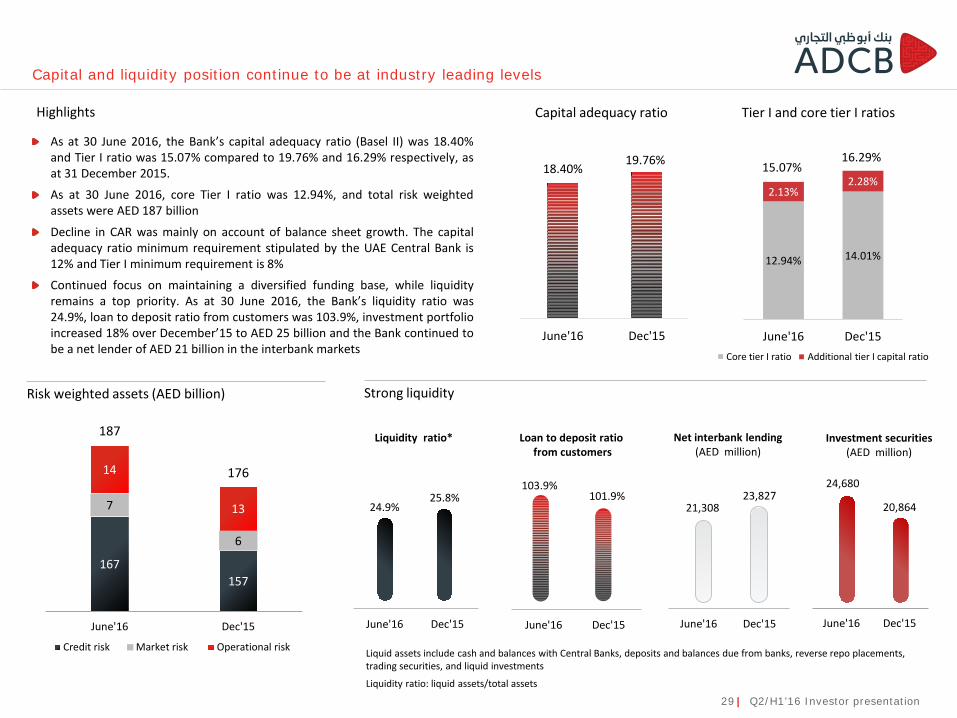
Liquid assets include cash and balances with Central Banks, deposits and balances due from banks, reverse repo placements, trading securities, and liquid investments
Liquidity ratio: liquid assets/total assets
Capital and liquidity position continue to be at industry leading levels
18.40%19.76%
June'16 Dec'15
12.94% 14.01%
2.13%2.28%
June'16 Dec'15
167157
7
6
14
13
June'16 Dec'15
Credit risk Market risk Operational risk
16.29%As at 30 June 2016, the Bank’s capital adequacy ratio (Basel II) was 18.40%and Tier I ratio was 15.07% compared to 19.76% and 16.29% respectively, asat 31 December 2015.
As at 30 June 2016, core Tier I ratio was 12.94%, and total risk weightedassets were AED 187 billion
Decline in CAR was mainly on account of balance sheet growth. The capitaladequacy ratio minimum requirement stipulated by the UAE Central Bank is12% and Tier I minimum requirement is 8%
Continued focus on maintaining a diversified funding base, while liquidityremains a top priority. As at 30 June 2016, the Bank’s liquidity ratio was24.9%, loan to deposit ratio from customers was 103.9%, investment portfolioincreased 18% over December’15 to AED 25 billion and the Bank continued tobe a net lender of AED 21 billion in the interbank markets
Highlights
187
176
Capital adequacy ratio Tier I and core tier I ratios
Risk weighted assets (AED billion)
15.07%
29 | Q2/H1’16 Investor presentation
21,308 23,827
June'16 Dec'15
24.9%25.8%
June'16 Dec'15
103.9%101.9%
June'16 Dec'15
Liquidity ratio* Loan to deposit ratiofrom customers
Net interbank lending (AED million)
Strong liquidity
24,680
20,864
June'16 Dec'15
Investment securities(AED million)
Core tier I ratio Additional tier I capital ratio
A+ to A-27%
AAA to AA-30% BBB+ to BBB-
25%
BB+ to B-11%
Unrated 7%
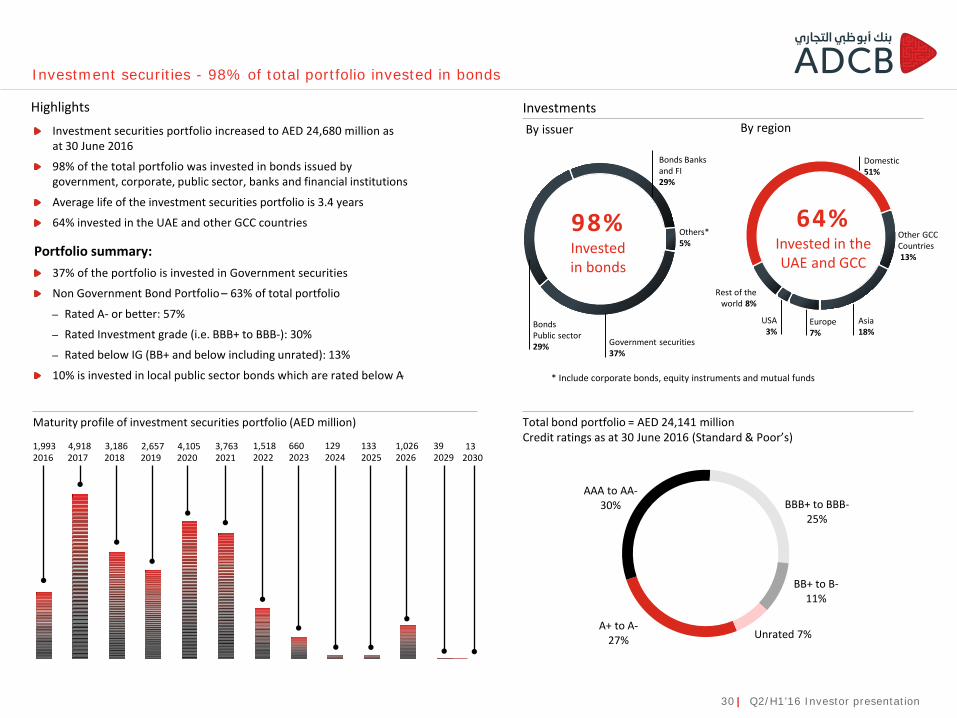
Investment securities - 98% of total portfolio invested in bonds
By issuer
98%Invested in bonds
Government securities37%
Others*5%
BondsPublic sector29%
Bonds Banks and FI29%
* Include corporate bonds, equity instruments and mutual funds
Highlights By region
64% Invested in the UAE and GCC
Other GCCCountries13%
Europe7%
Rest of theworld 8%
Asia18%
Domestic51%
USA3%
Investments
Total bond portfolio = AED 24,141 millionCredit ratings as at 30 June 2016 (Standard & Poor’s)
Maturity profile of investment securities portfolio (AED million)
Investment securities portfolio increased to AED 24,680 million as at 30 June 2016
98% of the total portfolio was invested in bonds issued by government, corporate, public sector, banks and financial institutions
Average life of the investment securities portfolio is 3.4 years
64% invested in the UAE and other GCC countries
Portfolio summary:37% of the portfolio is invested in Government securities
Non Government Bond Portfolio – 63% of total portfolio
– Rated A- or better: 57%
– Rated Investment grade (i.e. BBB+ to BBB-): 30%
– Rated below IG (BB+ and below including unrated): 13%
10% is invested in local public sector bonds which are rated below A-
30 | Q2/H1’16 Investor presentation
2017 20182016 2020 20212019 2023 20242022 2026 202920254,918 3,1861,993 4,105 3,7632,657 660 1291,518 1,026 39133
203013
2,761 *
3,376 *3,281 2,969
June'16 Dec'15
132.9%
128.5%
June'16 Dec'15
2012 2013 2014 2015 March'16 June'16
4,472 4,834
June'16 Dec'15
2.7%3.0%
June'16 Dec'15
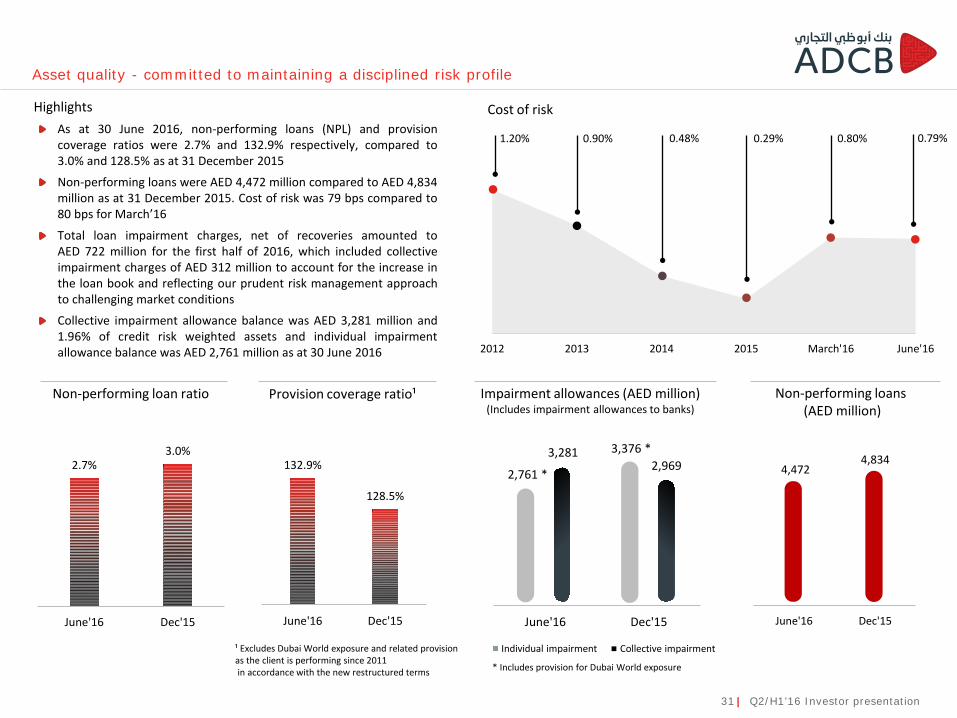
Asset quality - committed to maintaining a disciplined risk profile
Impairment allowances (AED million)(Includes impairment allowances to banks)
Cost of risk
Non-performing loan ratio
As at 30 June 2016, non-performing loans (NPL) and provisioncoverage ratios were 2.7% and 132.9% respectively, compared to3.0% and 128.5% as at 31 December 2015
Non-performing loans were AED 4,472 million compared to AED 4,834million as at 31 December 2015. Cost of risk was 79 bps compared to80 bps for March’16
Total loan impairment charges, net of recoveries amounted toAED 722 million for the first half of 2016, which included collectiveimpairment charges of AED 312 million to account for the increase inthe loan book and reflecting our prudent risk management approachto challenging market conditions
Collective impairment allowance balance was AED 3,281 million and1.96% of credit risk weighted assets and individual impairmentallowance balance was AED 2,761 million as at 30 June 2016
Individual impairment Collective impairment
Highlights
Provision coverage ratio¹
¹ Excludes Dubai World exposure and related provision as the client is performing since 2011in accordance with the new restructured terms
31 | Q2/H1’16 Investor presentation
1.20% 0.90% 0.48% 0.29% 0.80% 0.79%
Non-performing loans(AED million)
* Includes provision for Dubai World exposure
Summary
Our focus on the UAE market remains a key strategic pillar and a differentiator for ADCB
Net profit of AED 2.147 billion in H1’16 with ROAE of 17.0%, Q2’16 net profit of AED 1.126 billion, up 10%quarter on quarter
Diversified revenue stream, with increased non-interest income contribution
Cost to income ratio of 33% for the first half of 2016, within our target range
Net loans to customers increased 13%, while customer deposits increased 13% year on year, well above thesystem wide growth until May
CASA deposits increased 5% year to date and comprised 44.5% of total customer deposits as at 30 June 2016
NPL and provision coverage ratios improved to 2.7% and 132.9% respectively as at 30 June 2016, compared to3.0% and 128.5% as at 31 December 2015
Liquidity remains a top priority, while capital position remains robust with CAR and tier I ratios of 18.40% and15.07% respectively
32 | Q2/H1’16 Investor presentation
Financial highlights
Business overview
Macro overview
Our journey
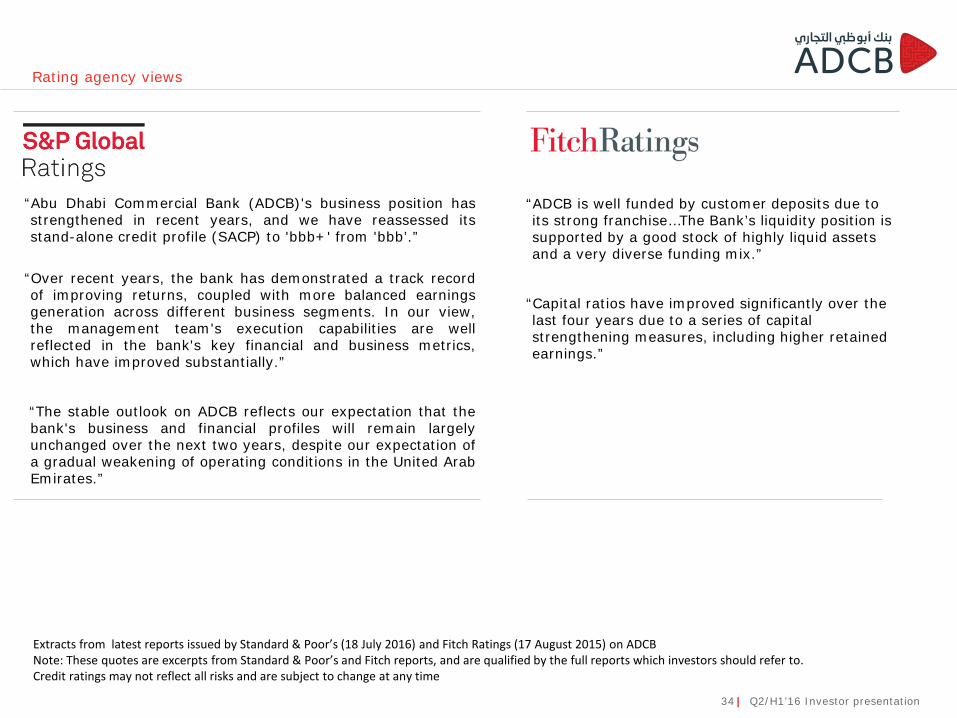
Extracts from latest reports issued by Standard & Poor’s (18 July 2016) and Fitch Ratings (17 August 2015) on ADCBNote: These quotes are excerpts from Standard & Poor’s and Fitch reports, and are qualified by the full reports which investors should refer to. Credit ratings may not reflect all risks and are subject to change at any time
Rating agency views
34 | Q2/H1’16 Investor presentation
“ADCB is well funded by customer deposits due to its strong franchise…The Bank’s liquidity position is supported by a good stock of highly liquid assets and a very diverse funding mix.”
“Capital ratios have improved significantly over the last four years due to a series of capital strengthening measures, including higher retained earnings.”
“Abu Dhabi Commercial Bank (ADCB)'s business position hasstrengthened in recent years, and we have reassessed itsstand-alone credit profile (SACP) to 'bbb+' from 'bbb’.”
“Over recent years, the bank has demonstrated a track recordof improving returns, coupled with more balanced earningsgeneration across different business segments. In our view,the management team's execution capabilities are wellreflected in the bank's key financial and business metrics,which have improved substantially.”
“The stable outlook on ADCB reflects our expectation that thebank's business and financial profiles will remain largelyunchanged over the next two years, despite our expectation ofa gradual weakening of operating conditions in the United ArabEmirates.”
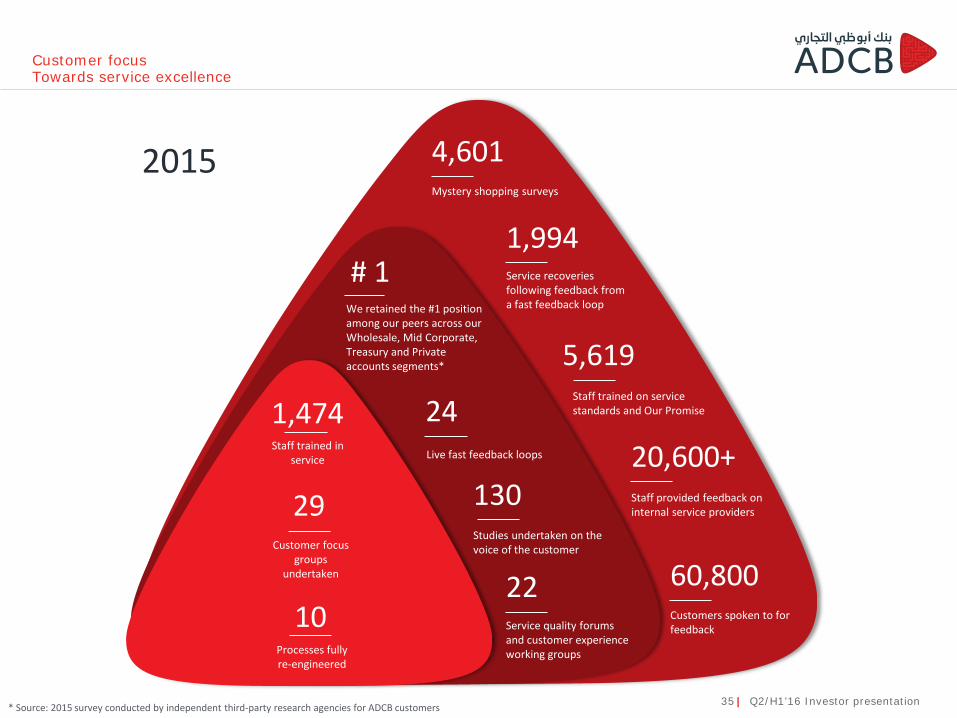
Customer focus Towards service excellence
* Source: 2015 survey conducted by independent third-party research agencies for ADCB customers
Staff trained in service
1,474
Customer focus groups
undertaken
29
We retained the #1 position among our peers across our Wholesale, Mid Corporate, Treasury and Private accounts segments*
# 1
Live fast feedback loops
24
Studies undertaken on the voice of the customer
130
Service quality forums and customer experience working groups
22
Mystery shopping surveys
4,601
Service recoveries following feedback from a fast feedback loop
1,994
Staff trained on service standards and Our Promise
5,619
Staff provided feedback on internal service providers
20,600+
Customers spoken to for feedback
60,800
2015
Processes fully re-engineered
10
35 | Q2/H1’16 Investor presentation
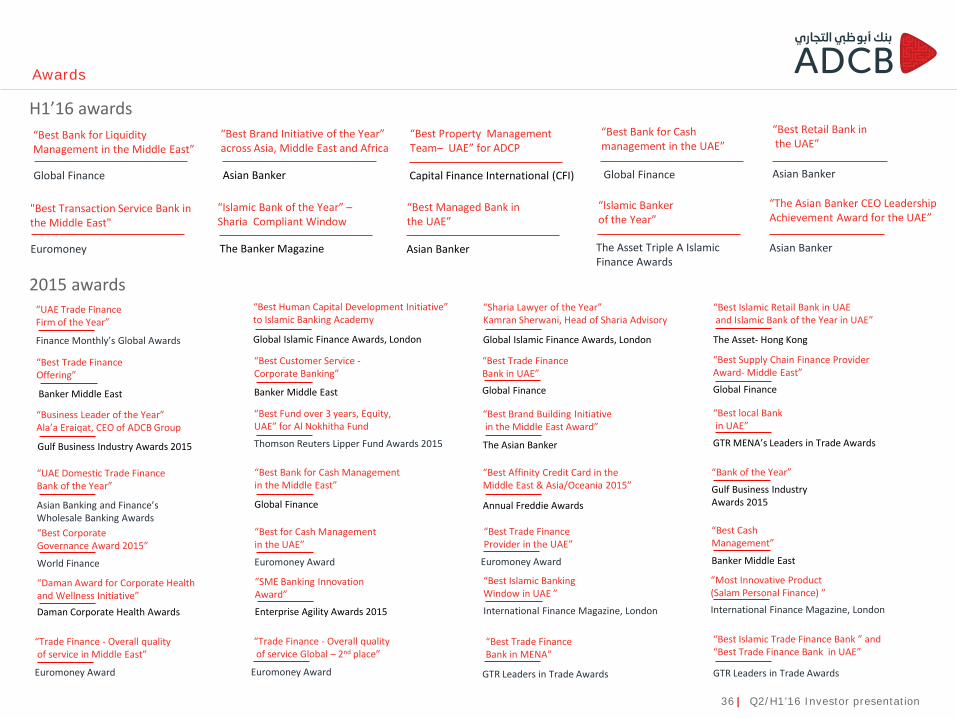
Awards
“Best Bank for Cash management in the UAE”
Global Finance
“Best Retail Bank inthe UAE”
Asian Banker
“Best Brand Initiative of the Year” across Asia, Middle East and Africa
Asian Banker
“Best Property Management Team– UAE” for ADCP
Capital Finance International (CFI)
“Best Bank for Liquidity Management in the Middle East”
Global Finance
“SME Banking Innovation Award”
Enterprise Agility Awards 2015
“Best Corporate Governance Award 2015”
World Finance
“Best Trade Finance Bank in UAE”Global Finance
“Best for Cash Management in the UAE”
Euromoney Award
“Best Trade Finance Provider in the UAE”
Euromoney Award
“Best Customer Service -Corporate Banking”
Banker Middle East
“Business Leader of the Year”Ala’a Eraiqat, CEO of ADCB Group
Gulf Business Industry Awards 2015
“Best Supply Chain Finance Provider Award- Middle East”Global Finance
“Best Fund over 3 years, Equity, UAE” for Al Nokhitha Fund
Thomson Reuters Lipper Fund Awards 2015
“UAE Domestic Trade Finance Bank of the Year”
Asian Banking and Finance’sWholesale Banking Awards
“Best Bank for Cash Management in the Middle East”
Global Finance
“Best Trade Finance Offering”
Banker Middle East
“Best local Bankin UAE”
GTR MENA’s Leaders in Trade Awards
“Best Cash Management”
Banker Middle East
“Best Affinity Credit Card in the Middle East & Asia/Oceania 2015”
Annual Freddie Awards
“Best Brand Building Initiativein the Middle East Award”
The Asian Banker
“Bank of the Year”
Gulf Business Industry Awards 2015
“UAE Trade Finance Firm of the Year”
Finance Monthly’s Global Awards
“Best Human Capital Development Initiative” to Islamic Banking Academy
Global Islamic Finance Awards, London
“Daman Award for Corporate Health and Wellness Initiative”Daman Corporate Health Awards
“Best Islamic Retail Bank in UAEand Islamic Bank of the Year in UAE”
The Asset- Hong Kong
“Most Innovative Product (Salam Personal Finance) ”International Finance Magazine, London
“Best Islamic Banking Window in UAE ”
International Finance Magazine, London
“Sharia Lawyer of the Year”Kamran Sherwani, Head of Sharia Advisory
Global Islamic Finance Awards, London
“Trade Finance - Overall qualityof service in Middle East”
Euromoney Award
“Trade Finance - Overall qualityof service Global – 2nd place”
Euromoney Award
“Best Trade Finance Bank in MENA”
GTR Leaders in Trade Awards
“Best Islamic Trade Finance Bank ” and“Best Trade Finance Bank in UAE”
GTR Leaders in Trade Awards
2015 awards
H1’16 awards
36 | Q2/H1’16 Investor presentation
“Islamic Banker of the Year”
The Asset Triple A Islamic Finance Awards
“The Asian Banker CEO Leadership Achievement Award for the UAE”
Asian Banker
“Islamic Bank of the Year” –Sharia Compliant Window
The Banker Magazine
“Best Managed Bank in the UAE”
Asian Banker
"Best Transaction Service Bank in the Middle East"
Euromoney
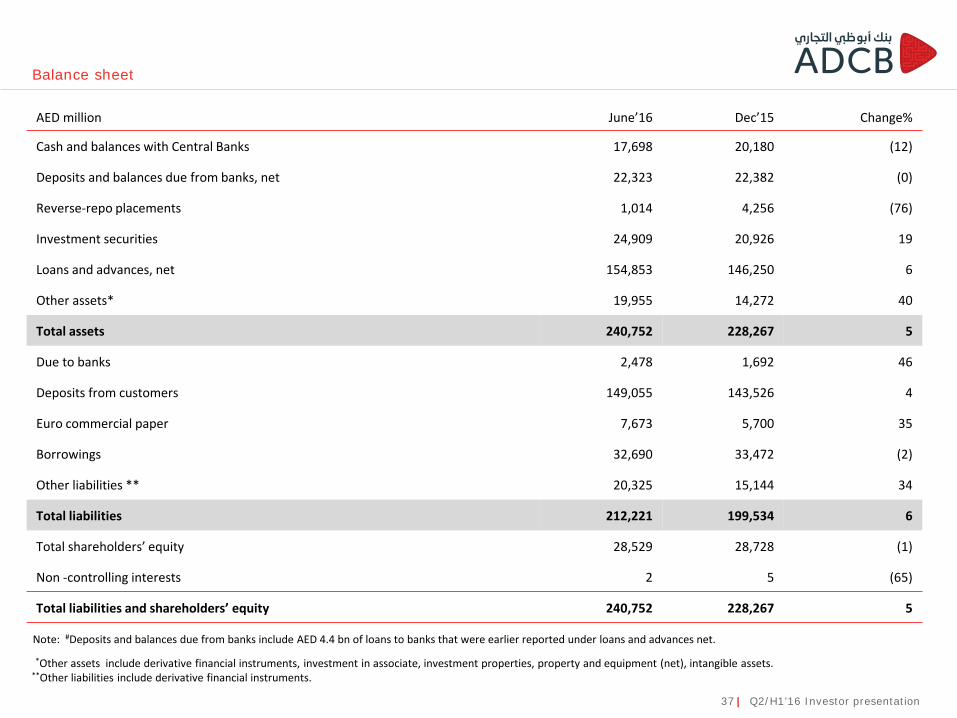
Balance sheet
37 | Q2/H1’16 Investor presentation
AED million June’16 Dec’15 Change%
Cash and balances with Central Banks 17,698 20,180 (12)
Deposits and balances due from banks, net 22,323 22,382 (0)
Reverse-repo placements 1,014 4,256 (76)
Investment securities 24,909 20,926 19
Loans and advances, net 154,853 146,250 6
Other assets* 19,955 14,272 40
Total assets 240,752 228,267 5
Due to banks 2,478 1,692 46
Deposits from customers 149,055 143,526 4
Euro commercial paper 7,673 5,700 35
Borrowings 32,690 33,472 (2)
Other liabilities ** 20,325 15,144 34
Total liabilities 212,221 199,534 6
Total shareholders’ equity 28,529 28,728 (1)
Non -controlling interests 2 5 (65)
Total liabilities and shareholders’ equity 240,752 228,267 5
Note: #Deposits and balances due from banks include AED 4.4 bn of loans to banks that were earlier reported under loans and advances net.
*Other assets include derivative financial instruments, investment in associate, investment properties, property and equipment (net), intangible assets.**Other liabilities include derivative financial instruments.
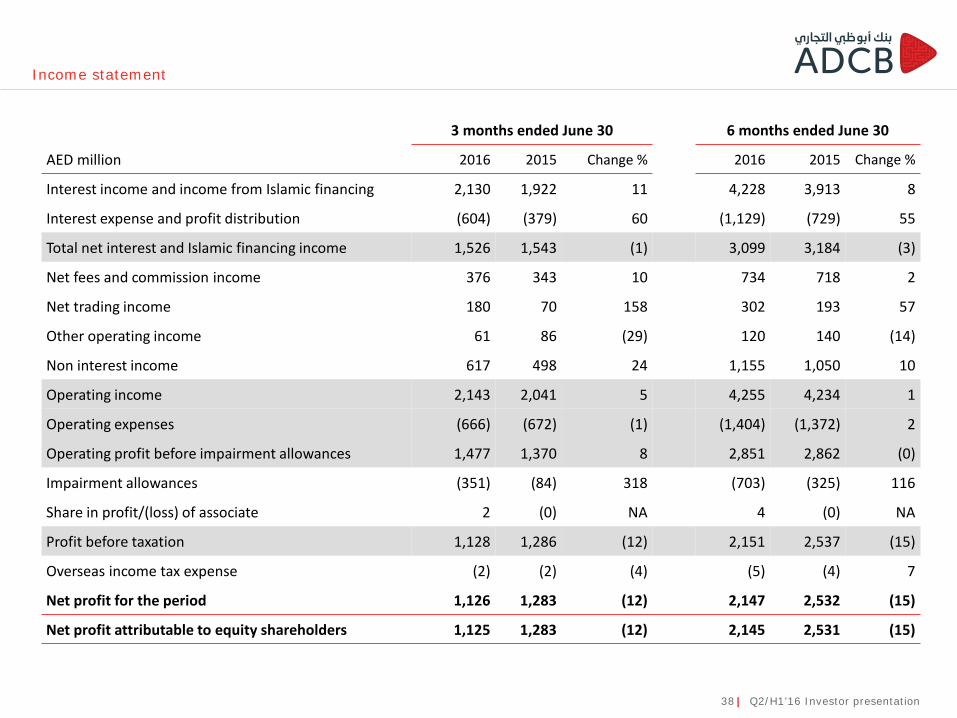
Income statement
38 | Q2/H1’16 Investor presentation
3 months ended June 30 6 months ended June 30
AED million 2016 2015 Change % 2016 2015 Change %
Interest income and income from Islamic financing 2,130 1,922 11 4,228 3,913 8
Interest expense and profit distribution (604) (379) 60 (1,129) (729) 55
Total net interest and Islamic financing income 1,526 1,543 (1) 3,099 3,184 (3)
Net fees and commission income 376 343 10 734 718 2
Net trading income 180 70 158 302 193 57
Other operating income 61 86 (29) 120 140 (14)
Non interest income 617 498 24 1,155 1,050 10
Operating income 2,143 2,041 5 4,255 4,234 1
Operating expenses (666) (672) (1) (1,404) (1,372) 2
Operating profit before impairment allowances 1,477 1,370 8 2,851 2,862 (0)
Impairment allowances (351) (84) 318 (703) (325) 116
Share in profit/(loss) of associate 2 (0) NA 4 (0) NA
Profit before taxation 1,128 1,286 (12) 2,151 2,537 (15)
Overseas income tax expense (2) (2) (4) (5) (4) 7
Net profit for the period 1,126 1,283 (12) 2,147 2,532 (15)
Net profit attributable to equity shareholders 1,125 1,283 (12) 2,145 2,531 (15)

ADCB Investor RelationsSheikh Zayed StreetP. O. Box: 939, Abu DhabiEmail: [email protected]: +971 2 696 2084Fax: +971 2 610 9845Internet: http://adcb.com/about/investorrelations/investor-relations.aspx
Top Related