


Languages
Pages
Legal


FINAL REPORT HR 142 ISU- ERi -AMES-71101
ABSORPTIVE AGGREG1ATES IN ASPHALT PAVING M[KTURES
Submitted to:
Iowa State Highway Commission
Project 780-S
D.V.LEE NOVEMBER
. ···;- . . ··-·

Tho opinions, finrlin11s. anrl conclu1ion1 uxpro!lliud in lhie puhlit:111ion 11rn 1ho1U ol lhe 11u1hor, and nol necessarily tho5ti of the Iowa State Highway Commission
Project 780-S ISU-ERl-AMES-71101
ENGINEERING RESEARCH ENGINEERING RESEARCH ENGINEERING RESEARCH ENGINEERING RESEARCH ENGINEERING RESEARCH
FINAL REPORT
HR142
ABSORPTIVE AGGREGATES IN ASPHALT PA YING MIXTURES
Dah-Yinn Lee
December. 1971
Submitted to the Iowa State Highway Commission
ENGINEERING RESEARCH INSTITUTE
IOWA STATE UNIVERSITY AMES

, 1!. Government Accession No. 1. Report No.
ISU-ERI-AMES-71101 4. Title and Subtitle
ABSORPTIVE AGGREGATES IN ASPHALT PAVING MIXTURES
7. Author(sl
D. Y. Lee 9. Performing Organization Name and Address
Iowa State University Engineering Research Institute Ames, Iowa 50010
3. Recipient's Catalog No.
5. Report Date
November 1971
6. Performing Organization Code
8. Performing Organization Report No.
ISU-ERI-AMES-71101 10. Work Unit No.
11. Contract or Grant No.
HR-142 13. Type of Report and Period Covered
~1-2-.-S-po_n_so---ring __ A_ge __ nc_y_N_a_m_e_a_n_d_A_dcl __ ress---------~·-------------------------------------1 Final Report
Iowa State Highway Commission Ames, Iowa 50010
15. Supplementary Notes
1969-1971
14. Spons0ring Agency Code
The opinions, findings, and conclusions expressed in this publication are those of the author and not necessarily those of the Iowa State Highway Commission.
16. Abstract
In this study, the asphalt absorption of six Iowa limestones were investigated. It was found that the most important factors that determined the nature, amount, and rate of asphalt absorption are porosity and pore-size distribution of the aggregate, viscosity of the asphalt, and time. Methods needed to determine the realistic maximum and minimum asphalt absorption by aggregates are recommended. Simple methods of asphalt absorption were developed. Since the most important factor that determines the accuracy of asphalt absorption is the bulk specific gravity of aggregates and since the current ASTM method is not adequate in this respect, several new methods were developed. Preliminary treatment studies for the purpose of upgrading absorptive aggregates were conducted using close to1 40 chemicals. The improvements of some of these treatments on the mixture properties were demonstrated.
17. Key. Words 18. Distribution Statement
absorption, asphalt, aggregate, porosity, chemical treatments, bulk specific gravity
This document approved for public sale and release; distribution unlimited.
19. Security Classif. (of this report) 20. Security Clasif. (of this page) 21. No. of Pages 22. Price
Unclassified Unclassified 177

EXECUTIVE SUMMARY
FIGURES
TABLES
INTRODUCTION
AGGREGATE STUDIES
Aggregates Studied
Porosity
CONTENTS
Evaluation of Bulk Specific Gravity
ABSORPTION STUDIES
Methods and Procedures
Water Absorption
Kerosene and Oil Absorption
Dye Absorption
Asphalt Absorption
Correlation
Field Study of Asphalt Absorption
TREATMENT STUDIES
Summary
Approach
Material and Procedure
Results
Asphalt Concrete Mixtures
Conclusions
SUMMARY AND CONCLUSIONS
RECOMMENDATIONS
iii
iv
ix
xii
1
1
8
36
41
41
45
57
b2
68
94
108
111
111
111
113
122
134
155
166
169

ACKNOWLEDGMENTS
REFERENCES 171
TECHNICAL APPENDIX
Appendix A. Theses and Publications Resulting from A-1 HR-127 and HR-142
Appendix B. Summary of Materials Studied as Possible B-1 Agents for Absorptive Aggregate Treatments
Appendix C. Determination of Bulk Specific Gravity of C-1 Aggregates
Mercury Pycnometer Method
Chemical Indicator Methods
Appendix D. Determination of Asphalt Absorption
Innnersion Method
Bulk Impregnat~~d Specific Gravity of Aggregates
Modified Rice Method 1
C-1 C-3
D-1
D-1
D-2
D-3

iii
EXECUTIVE SUMMARY
Recent studies have shown that aggregates are potentially in short
supply over about one-third of the US; south~rn Iowa is included in these
areas. Among the most effoctive approaches to the alleviation of the
aggregate shortage problem:s are: (a) better utilization of locally
available aggregates, (b) 1expanded use of marginal materials (including
better materials evaluation and specifications), and (c) the benefaction
of otherwise unsuitable materials. These have been the ultimate goals
of this project, with respect to absorptive aggregates.
In this study, the asphalt absorption of six Iowa limestones were
investigated. It was found that the most important factors that determined
the nature, amount, and rate of asphalt absorption are porosity and pore
size distribution of the aggregate, viscosity of the asphalt, and time.
Methods needed to determine the realistic maximum and minimum asphalt
absorption by aggregates are reconnnended. Simple methods of asphalt
absorption were developed. Since the most important factor that determines
the accuracy of asphalt absorption is the bulk specific gravity of
aggregates and since the current ASTM method is not adequate in this respect,
several new methods were developed. Preliminary treatment studies for the
purpose of upgrading absorptive aggregates were conducted using close
to 40 chemicals. The improvements of some of these treatments on the
mixture properties were de:monstrated.
In order for the infcirmation generated by this research to be used
by the highway engineer tci judge the suitability of aggregates and to
upgrade the unsuitable or marginal aggregates with respect to asphalt
absorption, further research areas have been recommended.

• iv
FIGURES
Page
Fig. 1. Project HR-142 aggregate quarry locations 2
Fig. 2. Diagram of rock pores 8
Fig. 3. Cumulative porosity distributfon, Menlo 16
Fig. 4. Cumulative porosity distribution, Pints 16
Fig. 5. Cumulative porosity distribution, Alden 17
Fig. 6. Cumulative porosity distribution, Linwood 17
Fig. 7. Cumulative porosity distribution, Cook 18
Fig .. 8. Cumulative porosity distribution, Keota 18
Fig. 9. Percent of pore volume distribution, Menlo 19
Fig. 10. Percent of pore volume distribution, Pints 19
Fig. 11. Percent of pore volume distribution, Alden 20
Fig. 12. Percent of pore volume distribution, Linwood 20
Fig. 13. Percent of pore volume distribution, Cook 21
Fig. 14. Percent of pore volume distribution, Keota 21
Fig. 15. Non-normalized pore size distribution, Menlo 22
Fig. 16. Non-normalized pore size distribution, Pints 22
Fig. 17. Non-normalized pore size distribution, Alden 23
Fig. 18. Non-normalized pore size distribution, Linwood 23
Fig. 19. Non-normalized pore size distribution, Cook 24
Fig. 20. Non-normalized pore size distribution, Keota 24
Fig. 21. Hysteresis in mercury porosity, Menlo 25
Fig. 22. Hysteresis in mercury porosity, Pints 25
Fig. 23. Hysteresis in mercury porosity, Alden 30
Fig. 24. Hysteresis in mercury porosity, Linwood 30

v
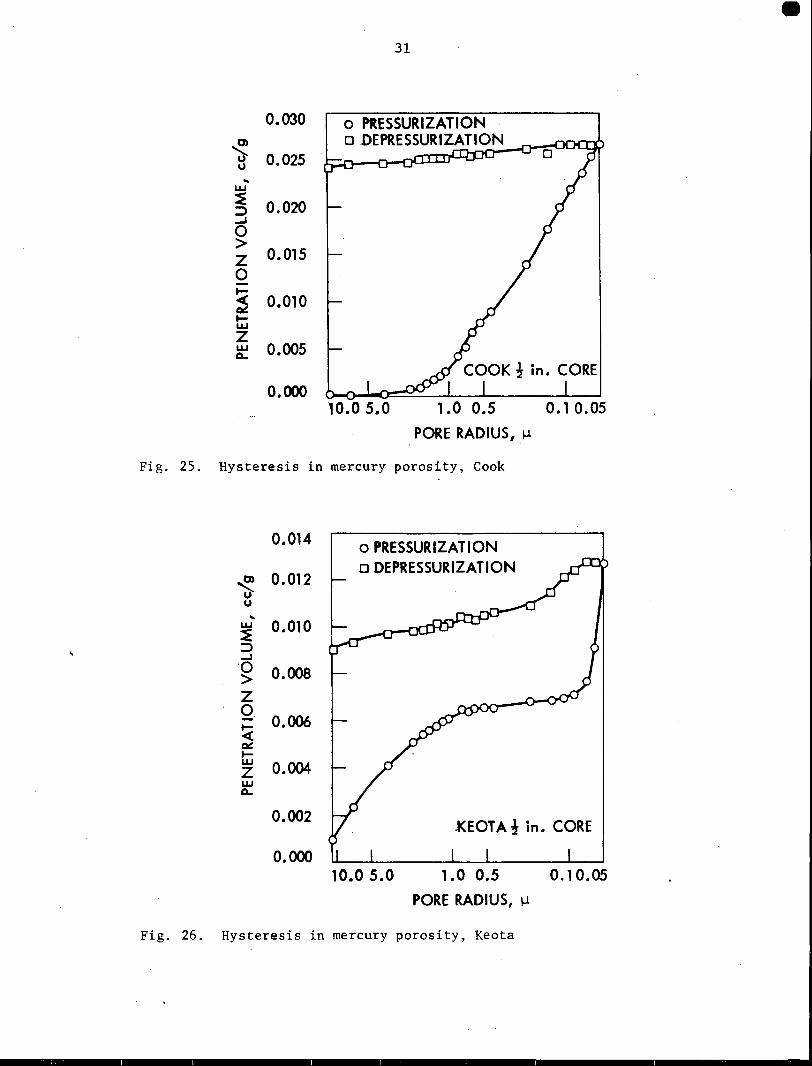
Fig. 25. Hysteresis in mercury porosity, Cook 31
Fig. 26. Hysteresis in mercury porosity, Keota 31
Fig. 27a. Time-water absorption curves of cores, Alden 47
Fig. 27b. Time-water absorption curve of cores, Cook 47
Fig. 27c. Time-water absorption curve of cores, Keota I 47
Fig. 27d. Time-water absorption curve of cores, Keota II 48
Fig. 27e. Time-water absc1rption curve of cores, Linwood 48
Fig. 27f. Time-water abse1rption curve of cores, Menlo 49
Fig. 27g. Time-water absorption curve of cores, Pints 49
Fig. 27h. Time-water abse>rption curve of cores, X (Alden II) 49
Fig. 28a. Time-weight in water curves of cores, A, C, and M 50 limestones
Fig. 28b. Time-weight in water curves of cores, Pints 50
Fig. 28c. Time-weight in water curves of cores, K 1, L and 51 X (A II)
Fig. 28d. Time-weight in water curves of cores, Keota II 51
Fig. 28e. Time-weight in water curves of+ 3/8 in fractions, 52 A, C, and P
Fig. 28f. Time-weight in water curves of + 3/8 in fractions, 52 K II and L
Fig. 28g. Time-weight fo water curves of+ 3/8 in fractions, 53 K I, M and X
Fig. 29. Relations between oil absorption and oil viscosity, 61 + No. 4 fractions
Fig. 30. Relations between oil absorption and soaking time, 62 + No. 4 fractions
Fig. 31. Asphalt absorption - BISG method vs immersion method 72
Fig. 32a. Asphalt absorption vs time of irmnersion and time of 76 absorption, cores, Alden
•

• vi
Fig. 32b. Asphalt absorption vs time of inrrnersion and time of 76 absorption, cores, Cook
Fig. 32c. Asphalt absorption vs time of inmlersion and time of 77 absorption, cores, Keota I
Fig. 32d. Asphalt absorption vs time of inrrnersion and time of 77 absorption, cores, Keota II
Fig. 32e. Asphalt absorption vs time of innnersion and time of 78 absorption, cores, Linwood
Fig. 32f. Asphalt absorption vs time of inrrnersion and time of 78 absorption, cores, Menlo
Fig. 32g. Asphalt absorption vs time of immersion and time of 79 absorption, cores, Pints
Fig. 32h. Asphalt absorption vs time of innnersion and time of 79 absorption, cores, X
Fig. 33. Asphalt absorption vs aggregate type 82
Fig. 34. Effects of innnersion temperature on absorption, Pints 82
Fig. 35. Effects of asphalt type on absorption, Pints 83
Fig. 36a. Effects of immersion time on absorption, Alden 83
Fig. 36b. Effects of iimnersion time on absorption, Cook 84
Fig. 36c. Effects of inrrnersion time on absorption, Keota I 84
Fig. 36d. Effects of innnersion time on absorption, Keota II 85
Fig. 36e. Effects of iimnersion time on absorption, Linwood 85
Fig. 36f. Effects of immersion time on absorption, Menlo 86
Fig. 36g. Effects of immersion time on absorption, Pints 86
Fig. 37. Alden, 60 min inunersion in A.C. 668 at 300 °F, 136X 87
Fig. 38. Cook, 5 min innnersion in A.C. 668 at 300 °F, 136X 87
Fig. 39. Keota II, 1 min inunersion in A.C. 668 at 300 op, 136X 88
Fig. 40. Menlo, 60 min immersion in A.C. 668 at 300 op, 136X 88
0 Fig. 41. Pints, 60 min immersion in A.C. 1425 at 300 F, 136X 89

vii
Fig. 42a. SEM, unimpregnated Keota II, lOOOX 89
Fig. 42b. SEM, unimpregnated Keota II, 3000X 90
Fig. 42c. SEM, asphalt impregnated Keota IIf lOOOX 90
Fig. 42d. SEM, asphalt impregnated Keota II, 3000X 91
Fig. 43a. Asphalt absorption VS time of absorption·and time of 92 immersion, + No. 4 fractions·
Fig. 43b. Asphalt ab sorp t:ion VS time of absorption and time of 92 immersion, + No. 4 fractions, Pints
Fig. 43c. Asphalt absorption vs time of absorption and time of 93 immersion, + No. 4 fraction, Keota II
Fig. 44. Cumulative porosity distribution (Menlo vs Pints cores)
Fig. 45. Hysteresis in mercury porosimetry (Menlo vs Pints cores)
Fig. 46. Asphalt absorption vs time
Fig. 47. Monomer loading VS time for Cook cylinders
Fig. 48. Monomer loading VS time for Menlo cylinders
Fig. 49. Curing curves for aniline fur fur al treatments
Fig. 50. Effects of curing temperature on water absorption
Fig. 51. Water absorptit:m of Cook aggregate vs percent aniline fur fur al treatment
104
104
110
119
119
123
123
124
Fig. 52. Water absorption of Menlo aggregate vs percent 124 aniline furfural treatment
Fig. 53. Absorption of 85-100 penetration asphalt by graded 128 crushed aggregates vs aniline furfural treatment
Fig. 54. Absorption of 120-150 penetration asphalt by graded 128 crushed aggregates vs aniline furfural treatment
Fig. 55. Water absorpti1on vs percent Armac T treatment 129
Fig. 56. Test property curves for mixes containing Cook ag- 135 gregate and agricultural lime by the Marshall method

viii
Fig. 57. Test property curves for mixes containing Menlo aggregate and agricultural lime by the Marshall method
Fig. 58. Test property curves for mixes containing aniline furfural treated Cook aggregate and agricultural lime by the Marshall method
Fig. 59. Test property curves for mixes containing aniline furfural treated Menlo aggregate and agricultural lime by the Marshall method
Fig. 60. Test property curve for mixes containing Armac T treated Cook aggregate and agricultural lime by the Marshall method
Fig. 61. Test property curves for mixes containing Armac T treated Menlo aggregate and agricultural lime by the Marshall method
Fig. 62. Water absorption of sulfur treated limestones
Fig. 63. Time-absorptive curves for treated and untreated Cook limestone
Fig. 64. Time-absorptive curves for treated and untreated Pints limestone
Fig. 65. Time-absorptive curves for treated and untreated Linwood limestone
Fig. 66. Time-absorptive curves for treated and untreated X (Alden II) limestone
Fig. 67. Time-absorptive curves for treated and untreated Menlo limestone
Fig. 68. Time-absorptive curves for treated and untreated Alden limestone
Fig. 69. Time-absorptive curves for treated and untreated Keota I limestone
Fig. 70. Time-absorptive curves for treated and untreated Keota II limestone
•
136
138
139
140
141
142
145
146
147
148
149
150
151
152

ix
TABLES
Table 1. Limestone aggregates studied
Table 2. Chemical composition of rocks
Table 3. Effective porosity of aggregates studied
Table 4. Properties of asphalt studied
Table 5. Bulk specific gravity, water absorption, and porosity of rock cores
Table 6. Porosity in different pore size .ranges
Table 7. Linear correlation coefficients between main pore properties
Table 8. Relation between mercury intrusion porosity and porosity in other size ranges
Table 9. Percent mercury retained on depressurization
Table 10. Bulk specific gravity and water absorption of quarry crushed aggregate and cores
Table 11. Bulk specific gravity and water absorption of laboratory crushed block samples
Table 12a. Water absorption of cores, ASTM vs graphical
Table 12b. Water absorption of laboratory crushed and #4, ASTM vs graphical
Table 13. Results of CKE, QC vs LC
Table 14. Results of oil absorption, QC vs LC
Table 15. Oil absorption vs time and temperature
Table 16. Asphalt absorption by photometer method
4
5
7
15
15
26
27
32
43
54
55
55
59
59
60
65
Table 17a. Dye absorption by photometer method, methylene blue 66
Table 17b. Dye absorption by photometer method, Safranine T 67
Table 18. Rankings of absorption by photometer method 68
Table 19. Asphalt absorption by rock cores 69

x
Table 20. Asphalt absorption by cores
Table 21. Asphalt absorption by #4 laboratory crushed aggregates
Table 22. Correlation Correlation between water absorption of 3/8 in to No. 4 sieve fraction (x) and other absorption properties (y)
Table 23. Correlation between water absorption of cores (x) and other absorption properties (y)
Table 24. Correlation coefficients for pore properties VS asphalt absorption
Table 25. Correlation coefficients for non-normalized pore sizes
Table 26.
Table 27.
Table 28.
Table 29.
Table 30.
Table 31.
Table 32.
Table 33.
Table 34.
Table 35.
Table 36.
Table 37.
Table 38.
Micron valuesof r10
radii
Relations between asphalt absorption and 0.7-0.05 µ porosity
Correlation between asphalt absorption by photocolorimeter method (x) and other absorption properties (y)
Linear correlation coefficients (r) between asphalt absorption by immersion
Gradation of 1968 surface
Potential materials for aggregate treatments
Chemical treatments, Grading A
Physical constants of aniline
Physical constants of furfural
Physical constants of methyl methacrylate
Chemical treatment, Grading B (sulfur series)
Series C aggregate treatment
Specific gravity, water absorption, water permeable pores of graded crushed aggregates treated with anili e furfural
•
95
97
98
99
100
101
102
103
. 106
107
llO
114
116
116
117
117
118
122
125

xi
Table 39. Heat stability of graded crushed aggregates treated with aniline furfural
Table 40. Asphalt absorption (percent by weight) of graded crushed aggregates treated with aniline furfural
Table 41. Specific gravity and water absorption of 1/2 in. cores treated with aniline furfural
Table 42. Specific gravity, water absorption and penneable pores of Armac T treated crushed aggregates
Table 43. Heat stability of graded crushed aggregates treated with Armac T
Table 44. Asphalt absorption (percent by weight) of graded crushed aggregates treated with Armac T
Table 45. Specific gravity and absorption of 1/2 in. cores treated with Armac T
125
126
127
127
130
130
132
Table 46. Specific gravity and absorption of cores impreg- 132 nated with monomer
Table 47. Specific gravity and absorption of graded crushed 133 aggregates treated with monomer
Table 48. Asphalt absorption of bituminous mixes by Rice 142 method
Table 49. Water absorption of sulfur treated limestones 143
Table 50. Asphalt absorption of sulfur treated limestones 153
Table 51. Asphalt absorption of sulfur treated limestone - 154 series C and D
Table 52. Absorption of chemically treated aggregate, Alden 158
Table 53. Absorption of chemically treated aggregates, Cook 159
Table 54. Absorption of chemically treated aggregates, Keota I 160
Table 55. Absorption of chemically treated aggregates, Keota II 161
Table 56. Absorption of chemically treated aggregates, Linwood 162
Table 57. Absorption of chemically treated aggregates, Menlo 163
Table 58. Absorption of chemically treated aggregates, Pints 164
Table 59. Absorption of chemically treated aggregates, X-QJarry 165

xii
INTRODUCTION
A long-range comprehensive research project entitled "Absorptive
Aggregates in Asphalt Paving Mixtures," was initiated in 1966 on
.evaluation and use of absorptive aggregates for asphalt paving mixtures.
The overall objectives of the study are:
• To evaluate existing methods. and develop new methods for determining
the absorption of asphalt by road aggregates by both quantitative
and qualitative methods.
• To correlate basic chemical and physical properties with the
absorption characteristics of aggregates with respect to asphalt,
and to identify parameters that are indicative of the absorptive
characteristics of aggregates.
• To evaluate the effects of asphalt absorption by aggregate
on asphalt, aggregate, and the asphalt mixtures.
• To establish criteria and tests for identifying, classifying,
and specifying aggregates used in asphalt mixtures with respect
to asphalt absorption.
• To develop methods and remedies for utilizing absorptive
aggregates in asphalt paving mixtures economically without
sacrificing durability and stability of the mixture.
Project HR-127 (1966-1967) was designed to study the first two
phases of the overall objectives and, to a limited extent, the third
objective. Project HR-142 (1968-1970) was initiated to study the third,
fourth, and fifth objectives. This report summarizes the work accomplished
in HR-142.
•

xiii
This report is intendE?d to be a detailed summary of the research
performed in HR-142. Whenever possible, the work accomplished will be
summarized and all pertinent data will be included, especially for the
part since HR-142 Progress Report No. 1, (Janaury 1970). For further
details, reference to the various theses ahd publications and previous
reports will be made (Appendix A). For clarity, some reference will be
made to work performed in HR-127.
The subject matter is organized and presented in the following areas:
• Aggregate studies
• Absorption studies
• Treatment studies
• Summary and conclusions
• Recommendations

AGGREGATE STUDIES
Aggregates Studied
Six limestone aggregates were studied from quarries selected by
Iowa State Highway Commission engineers. The sources and designations
of the aggregates are given in Table 1. The locations of the quarries
are shown in Fig. 1.
Four of the aggregates (Menlo quarry, Adair Co.; Linwood quarry,
Scott Co.; Cook quarry, Story Co.; and Keota quarry, Washington Co.) were
also studied in HR-127. Limestones from Alden quarry, Hardin County, and
Pints quarry, Black Hawk County, are included because of their known service
performance records as concrete aggregates. In addition to crushed aggregates
from 3/8 1 in. size, two "block stones" were obtained from all six
quarries for preparation of geometrically symmetrical rock cylinders.
Chemical compositions of rocks, both quarry-crushed fractions and
laboratory-cored block samples, were determined by the EDTA method. 1
Classification of aggregates was based on Pettijohn's system of classifying
carbonate rocks. 2
Aggregate from Alden is a white-to-cream limestone (97% calcite) with
dense, medium-to-coarse-grained texture of rounded white fragments cemented
with cream (possibly elastic origin). There are significant differences
among quarry-crushed Keota aggregates and two block samples. Quarry Keota
and block sample No. 2 (KII) were tan-to-buff, very porous, and fine-
grained with some vugs and fractures, and were classified as calciticdolemites
to dolomitic limestones. Keota block sample No. 1 (KI), on the other hand,
was a white-to-light grey, dense, medium-textured magnesium limestone(92%
calcite). The Cook quarry aggregate is a dolomitic limestone, tan-to-buff,
•

Table L
II
1-S 1-L
2
3-S 3-L
4
5-S 5-1
6
2
Limestone aggregates studied
County
Adair
Blackhawk
Hardin
Scott
Story
Washington
Size, Quarry in.
Menlo 3/8
Pints 3/4
Alden 3/8
Linwood 1/2
Cook 3/8
Keota 1
. ALDEN•
COOK•
MENILO•
Beds or
ledges
3-6-Argentine
Rapid
Davenport
Beds 14 - 22
KEOTA•
Fig. 1. Project HR-142 aggregate quarry locations
Geological formation
Missourian series Pennsylvania system
Cedar Valley formation, Devonian system
Gilmore City formation, Mississippian age
Devonian system
St. Louis formation, Mississippian series
Osage series, Mississippian age

3
dense, fine-grained, some fractures lined with secondary carbonate. Aggre
gates from Linwood quarry are magnesium limestone to limestone, mottled
grey-to-tan; dense, lithographic, small (~l mm) inclusions of coarse-grained
carbonate and some fractures filled with secondary carbonate, some vugs not
filled with secondary minerals. Menlo aggregates are magnesium limestones
and are tan to grey, dense, lithographic, but with inclusions (up to 1 cm
along longest axis) of coarse-grained calcite (may be fossil replacement).
Tiie Pints aggregate is an argillaceous calcitic dolomite (46 - 49% calcite)
with scattered chert nodules, grey color and dense, fine-grained, fairly
uniform texture. Tiie dolomite has a dirty appearance caused by numerous
tiny inclusions.
Chemical compositions of rocks studied are given in Table 2. Bulk
specific gravity and effective porosity of coarse fractions and core samples
are given in Table 3.
The crushed aggregates were separated by 3/8 in., #4, and #100 sieves,
washed and oven dried at 110°C for 24 hr before any tests were conducted.
Various fractions were designated as follows:
A - Retained on 3/8 in. sieve
B Passing 3/8 in. and retained on #4 sieve
c Passing #4 sieve and retained on #100 sieve
D Passing #100 sieve
Dl Passing #100 sieve and retained on #200 sieve
In certain phases of the present study, such as the pore characteristics
of the aggregate and time-absorption studies, it was decided to use rock
cores (1/2 and 1 in. diameters) drilled from stone blocks received from the
respective quarries. This was done to have consistent and comparable results
•

4
Table 2. Chemical Composition of Rocks
Size, % Caco3 % MgC03 Code guar!:Y in. % Insoluble Total
' Crushed Aggregate
ILA Menlo 3/8 94.64 1.18 3.16 98.98 lLB Menlo #4-3/8 92.12 1.50 3.95 97.57 lSB Menlo #4-3/8 90.43 1.18 4.83 96.44 2A Pints 3/8 + 47.55 31. 74 16.34 95.63 2B Pints 114-3/8 46.16 33.98 17.23 97.37 3LA Alden 3/8 + 98.05 0.46 0.41 98.92 3LB Alden 114-3/8 97.65 0.10 0.86 99.21 3SB Alden If 4-3/8 97.00 1.41 0.43 99.34 4A Linwood 3/8 + 97.16 o.oo 1.42 93.58 4B Linwood 114-3/8 95.13 1.00 2.58 98. 71 5LA Cook 3/8 + 58.66 32.22 6.39 97.27 5LB Cook 114-3/8 54.45 35.05 7.58 97.08 5SB Cook #4-3/8 54.58 35.63 6.54 96. 75 6A Keota 3/8 + 42.16 39.04 24.15 105.35 6B Keota 114-3/8 48.15 38.23 12.69 99.07
Block Sample
1 Menlo 94.45 .60 2.97 99.02 2 Pints 49.24 34.01 15.20 98.45 3 Alden 97.01 0.36 1.21 98.22 4· Linwood 95.41 1.13 2.19 98.73 5 Cook 56.57 33.87 8.08 98.52 6 Keota 96.62 0.19 2.15 98.98
KI 91.99 5.76 3.84 101.59 KII 52. 96 43.69 4.87 101.52 X(A2) 98.03 3.50 0.46 101.99

• 5
Table 3. Effective porosity of aggregates studied Bu
Specific Effective porosity, % gravity 24 hr Vacuum Mercury
Quarry Aggregate 1F (ATTM) soaked saturation penetration
Menlo 1-S-B 2.567 4.95 4.90 1. 94 1-L-A 2.613 3.08 3.84 1. 95 1-L-B 2.603 3.64 4.22 1.02 Core 2.637 2.37 0.98
Pints 2-A 2.348 15.40 16. 91 11.84 2-B 2.333 17.06 17.80 11.81 Core 2.271 16.40 16.88
Alden 3-S-B 2.475 7.35 8.44 8.24 3-L-A 2.517 4.88 7.10 6.46 3-L-B 2.508 5.80 7.55 6.33 Core 2.510 4.32 9.60
Linwood 4-A 2.613 3. 72 4.26 2.78 4-B 2.582 4.29 4.47 2.30 Core 2.636 2.37 0.90
Cook 5-S-B 2.397 14.33 17.74 10.66 5-L-A 2.426 10.33 13.73 11.54 5-L-B 2.408 13.00 14.04 11.42 Core 2.465 9.56 17.44
Keota 6-A 2.326 12.98 16.47 10.50 6-B 2.303 12.68 19.19 14. 77 Core 2.489 7. 77 4.66

6
in studying pore characteristics and asphalt absorption, and for the
following reasons:
• Aggregates obtained from stone crushers have variable characteristics
both in composition and texture and cannot be depended upon for
delicate treatment of analysis of pore characteristics. Rock
cores being from one stone block are more likely to be homogeneous
and uniform, and correlation between absorption and pore characteristics
can be more realistic.
• Rock cores or cylinders allow uniform drying of surface for
saturated surface dry condition in ASTM test (C-127-59) for
determination of bulk specific gravity and thus give reproducible
results to be used in immersion method and bulk-impregnated specific
gravity methods for calculating asphalt absorption.
• Due to the same surface texture of drilled cores, mercury porosimetry
and absorption results are comparable.
• Chances of inclusion of air bubbles in asphalt are considerably
reduced by adding cores one by one, which utilizes bulk-impregnated
specific gravity.
• In case of immersion tests, the draining of asphalt from rock cores
is more uniform than aggregates with varying surf ace texture and
shapes.
It may be mentioned that cores were drilled out so as to have their
longitudinal axis at right angles to the natural bedding planes to keep
uniformity.
Hereinafter, the cor1es shall be referred to in this study by the name
of the quarry from which the stone blocks were received.

7
Two asphalt cements have been included in major phases of this study.
The properties of the two asphalts studied are shown in Table 4. The
85-100 pen asphalt will be referred to as 142-1, 142-A or No. 668S
and the 120-150 pen asphalt will be referred to as either 142-2 or 142-B.
Both asphalt cements were obtained from American Oil Company, Sugar Creek,
Missouri.
Table 4. Properties of asphalt studied
1f Property
1 Penetration 77/100/5
2 Sp. Gr. 77/77
3 Flash point, °F
4 Fire point, °F
5 Softening point, R&B, °F
6 Viscosity at 140°F, poises
7 Viscosity at 77°F, poises
8 Thin film oven test
% loss
Penetration of residue
% retained penetration
9 Soluble in C Cl4
10 Ductility at 77°F, cm
11 Spot test
12 Percent asphaltenes
AsEhalt A(l42-l). B (142-2)
92 127
1.008 1.024
600 605
670 665
120 118
1144 727
3. 96 x 106 1.58 x 10⁶
0.10 0.08
54 72
57 53
99.84% 99.83%
130+ 130+
Negative Negative
17.94 16.93
•

8
Porosity
The importance of pore size and pore size distribution has been
realized and studied extensively in the case of concrete aggregates.
However, there has been no published data on the study of the pore-size
characteristics of asphalt aggregates and their relationship to the
3 absorption other than that by Lee.
The pores in a system may or may not be interconnected. Flow of
interstitial fluid is possible only if at least part of the pore space is
interconnected. The interconnected part of the pore system is called the
effective p0re space of the porous medium.
The diagram of two pores is shown in Fig. 2.
D
~ PORE 1
Fig • .2. Diagram of rock pores
INTERCONNECTING CAPILLARY
The pores in rock are pictured as irregularly-shaped cavities con
nected by capillaries that have varying shapes and diameters. 4 The
smallest entrance diameter to a pore is used as the measure of the size
of that pore.
According to Scheidegger, 5 the only unambiguous pore size should
be the largest sp~ere that can be put into the space containing the point
in question.

9
Generally detennined pore characteristics are:
• Porosity. A distinction is frequently made between total porosity
and the part that is interconnected, which is usually called the
effective porosity. In general, any part of the pore space of an
aggregate piece that is completely isolated from the exterior is
not of concern in the question of asphalt absorption, since other
conditions such as density and strength are obviously affected as
much by the isolated as by the effective porosity.
• Pore size and pore size distribution. The pore size in terms of
radius or diameter of pore (assumed cylindrical in shape, generally)
is measured. The frequency of each pore size is also meas~red to
ascertain pore size distribution.
• Specific surface. Another well-defined geometrical quantity of
a porous medium is its specific internal area, called specific
surface.
Probably the most connnon method used in casual investigation of
aggregate porosity is to measure the absorption and assume the volume of
water absorbed equals the pore volume, that is, to assume complete satura
tion. The ASTM test for specific gravity and absorption of coarse aggregate
(C 127) is the method for absorption of coarse aggregates and is straight-
forward except for the question of surface drying. The surface moisture
must be dried from the wet aggregate without removing any water from the
pores, either by evaporation or by capillary attraction into the cloth
used. The result may be termed water penneable or 24 hr soaked porosity.
Dinkle4 obtained vacuum saturated porosity and reported good correlation
between saturated porosity, 24 hr soaked porosity, and mercury intrusion
porosity. The main point with respect to the absorption method as a
•

10
measurement of porosity is that one hardly ever gets complete saturation. 6
W hb dB . 7 1 d h . hdb as urn an unting emp oye t e gas expansion met o ased on
Boyle's law to determine porosity. Isolated voids will be counted as solids
and thus the method measures effective porosity if the sample is not pow
dered. Beeson8 modified th1~ apparatus and most of the commercially avail-
able equipment is based on this principle.
Porosity can be determined visually on a polished or thin section of
aggregate by measuring void area (pore space) microscopically by various
camera-lucida or photomicrographic methods. . 9 Sweet has used such optical
methods on aggregates.
DolchlO determined the effective porosity of limestone aggregates
with the McLeqd gauge porosimeter developed by Washburn and Bunting.11
The method gives a value for the effective void volume by causing the head
to be lowered on a dry sample while it is immersed in mercury. The air
in voids expands and leavesthe sample and is then measured volumetrically
at atmospheric pressure. If the bulk volume of the sample is obtained by
the use of shaped pieces, porosity can be calculated.
Pore Size and Specific Surface of the Solids
Parameters of the porous aggregates can be determined by methods
described earlier for porosity determination, such as microscopic methods.
One of the most effective and frequently used methods of determining
the specific surface of a solid is the sorption method. Brunauer, Emmett
. 12 and Teller advanced the BET theory for obtaining specific surfaces from
sorption isotherms. Surfac:e adsorption has also been used indirectly to
obtain a curve for pore si:z:e distribution. Other methods for determining
pore size and specific surface are small angle x-ray scattering, heat of
immersion, rate of dissolution, ionic adsorption, and radioactive and

11
. 13 14 electrical methods, ' but these have been little used.
The method most frequently used is that of injection of mercury
15 into the pore system. This method has been.adopted in the present
study. 16 Washburn was the first to suggest the use of pressed mercury
in determining the pore-size distribution of porous solids assuming a
model based on a system of circular capillaries.
The relation developed by him may be stated in the following form
pr = - 2 a cos e
where p is the pressure applied, r is the pore radius, a is the surface
tension of mercury, and 9 is the contact angle of the mercury with respect
to the solids.
17 Ritter and Drake put Washburn's conception to practical use and
developed· the apparatus measuring the penetration of mercury into. pores
down to 200 A in diameter at 10,000 psi covering the so-called macropore
range. The apparatus generally referred to as mercury porosimeter has
18 been described by Purcell.
19 Subsequently, Drake utilized a high pressure mercury porosimeter
and made measurements up to 60,000 psi to measure pore radii down to 20 A. As a result, the mercury penetration method can, in principle, be used
for practically the whole range of pores of importance in research work.
The method was applied successfully to concrete aggregates by Hiltrop and
L . h 20 emis •
Testing Procedure
Water permeable or 24-hr soaked porosity. The water permeable porosity
was computed by nrultiplying the percent water absorption by the bulk specific
gravity where both were determined on 1/2 in.diameter rock cores from the
•

12
standard 24 hr soaked procedure as in the ASTM C-127-59 test.
Effective porosity or mercury intrusion porosity. Effective porosity
is a measure of the permeable or interconnected pores in a rock. It was
determined with mercury capillary apparatus or mercury porosimeter apparatus.
The effective pore volume was the volume of mercury injected into the rock
core at pressure 2000 psi. The bulk volume was that occupied by the rock
surrounded by mercury at a pressure of 5 psi. In other words, the effective
porosity as defined in this study is the ratio of the interconnected permeable
pores in the pore entry radius range, from 21.32 -0.05 µ, to the total bulk
volume of particle including pores, expressed as a percentage.
Pore size and pore siz:e distribution. The pore size and its distribution
was determined with mercury porosimeter apparatus manufactured and distributed
by-. the Ruska Instrument Corporation, Houston, Texas, under license of the
Shell Development Company. The apparatus and procedure have been described
in detail elsewhere. 3 ' 20
The data of the cumulative volume of pores or volume of mercury absorbed
at various applied pressurE~s or corresponding pore radii can be treated in
various ways; results of the study were:
Data obtained from non-normalized pore size distribution curve. This
curve represents the freqmmcy of occurrence of one particular pore size.
The curve indicates at what size (say r) the greatest number of pores occur.
Ritter and Drake17 derived the equation for a non-normalized distribution
curve
D(r)

where
13
D(r) = distribution function
p = applied pressure, psi
r = pore entry radius, microns
(Vo V) = volume of mercury injected from zero to pressure p, cc/g
d(Vo - V) ---''------~ =
dp slope of (Vo - V) vs pressure determined from pressurepore volume curve
All the terms on the right side of this equation are known or deter-
minable. Values of the derivation are readily obtained by graphical differ-
entiation. Plotting D(r) against r gives the distribution curve. Hiltrop
and Lemish20 also derived an equation for a normalized distribution curve
in which the area under the curve was equated to unity.
Porosity distribution curve. Curves of cumulative porosity vs pore
radius were plotted for all rock cores. The cumulative porosity is the
cumulative pore volume divided by total bulk volume of a particle.
Percent of pore volume distribution curve. Curves of pore volume
expressed as a percent of total pore volume for each aggregate were
plotted as a function of pore radius.
Percent porosity in various pore radius range. The porosity for pores
between certain radii is the ratio of the pore volume in these sizes to the
total bulk volume of an aggregate including pores, expressed as a percentage.
These porosities were determined for the following pore radius ranges (in
microns): 21-11, 21-5, 21-2, 21-1, 11-1, 5-1, 1-0.5, 1-0.1, 1-0.05, 0.1-0.05,
and 0.7-0.05.
Hysteresis in the mercury porosimetry. When the pressure is systematically
released in the mercury-porosimeter, the depressurization curve does not
•

•
•
14
follow the original pressurization curve and some of the mercury is
retained in the sample even on complete removal of pressure. The
phenomenon was also observed[ by Ritter and Drake,17
who attributed the
action to the so-called "ink bottle" shape of the pores. Curves illustrating
hysteresis have been obtaim~d for all rock cores •
Pore properties of rock cores
Water permeable or 2~ hr soaked porosity. Results of water permeable
or 24 hr soaked porosity, bulk specific gravity and water absorption as
determined from ASTM C-127-.59 test for 1/2 in. rock cores are given in
Table 5.
Effective porosity or :mercury-intrusion porosity. This covers the
pore entry radius from 21.32-0.,05 µ. The results are given in Table 6.
Pore size and pore size distribution. Plots were made from the data
of the cumulative volume of pores or volume of mercury absorbed at various
applied pressures or corresponding pore radii. From these the following
graphs were drawn after nec:essary computations:
Porosity distribution curves. Curves of cumulative porosity (%) vs pore
radius for rock cores are given in Figs. 3 - 8. The cumulative porosity
is the cumulative pore volume .divided by total bulk volume of a particle.
Percent of pore volume distribution curves. Curves of cumulative pore
volume expressed as a perc1~nt of total pore volume of core vs pore radius
are given in Figs. 9 - 14.
Non-normalized pore size distribution curves. These curves representing
the frequency of occurrence of one particular pore size, as mentioned
earlier, are given in Figs. 15 - 20.

15
Table S. Bulk specific gravity, water absorption, and
Bulk Cores specific gravity Water absorption, %
Menlo 2.637 o. 90
Pints 2.271 7.22
Alden 2.510 1. 72
Linwood 2.636 0.90
Cook 2.565 2.16
Keota 2.489 3.12
Table 6. Porosity in different pore size ranges
Pore size range, Quarry µ Menlo Pints Alden Linwood
21 - 11 0.17 0.12 0.10 0.13
21 - 5 0.26 0.18 0.28 0.24
21 - 2 0.36 0.32 a.so 0.32
21 - 1 0.43 2.30 1.12 0.36
11 - 1 0.26 2.18 1.02 0.23
5 - 1 0.17 2.12 0.84 0.12
1 - 6.5 0.08 6.20 5.28 0.08
1 - 0.1 0.45 12.90 8.29 0.51
1 - 0.05 0.55 14.65 8.48 0.54
0.1 -.0.05 0.10 1. 75 0.19 0.03
0.7 - 0.05 0.52 10.45 5.80 0.49
21 - o.o5a 0.98 16.88 9.60 0.90
aMercury intrusion porosity
porosity of rock cores
24 hr soaked porosity
2.37
16.40
4.32
2.37
5.54
7. 77
Cook Keota
0.17 o. 71
0.25 1.52
1.10 2.29
7 .oo 2.68
6.83 1. 97
6. 75 1.16
5.30 0.22
10.00 0.97
10.40 1. 98
0.40 1.01
7. 20 1.86
17.44 4.66
• •
•

'# ...
>-!:::: V)
0 ~ a.. w > .... < _, j ::::> u
--Fig. 3.
"#. ...
>-t-V)
0 ~
0 a.. w > ~ _, ::::> ~ ::::> u
16
1.0 0.9 MENLO~~ in. CORE (13.9704 g)
0.8 POROSITY 0.98%
0.7
0.6
0 .. 5
0.4
0.3
0.2
o. 1
0 30.0 10.0 5.0 1.0 0.5 o. 1 0.05
PORE RADIUS, µ
Cumulative porosity distribution, Menlo
20 PINTS! in. CORE (13.8620 g)
16 POROSITY 16.88%
12
8
4
OL.-..... ...cJ-10-.....,.:)mm~~-L~-L~~~~...l____J 30. 0 10.0 5.0 1.0 0.5
PORE RADIUS, µ
0.1 0.05
Fig. 4. Cumulative porosity distribution, Pints

17
10 ALDEN! in. CORE(12.1338 g)
'#. POROSITY 9. 600/b .. 8 >-I-V)
0 ar:: 6 0 a.. w > < 4 ......
~ :::> 2 u
OL_...-=<:k::Q:::±:~::.::=~_l_--1~~~-1~~ 30.0 10.0 5.0 1.0 0.5
PORE RADIUS, µ
Fig. 5. Cumulative porosity distribution, Alden
1.0
0.9
>-' o.a I-
0 0.7 ar:: 0 0.6 a..
> 0.5
< 0.4 ....J :::> ~ 0.3 :::> u 0.2
0.1
LINWOOD! in. CORE {12.5591 g)
POROSITY 0. 90%
0.1 0.05
01--.1--~--L-~-L-~~~~---'-~----L.~~~~---L~--.J 30. 0 1 0. 0 5. 0 1.0 0.5
PORE RADIUS, µ
Fig. 6. Cumulative porosity distribution, Linwood
0.1 0.05
•

1.0 0.5
PORE RADIUS, µ
Fig. 7. Cumulative porosi.ty distribution, Cook
5.0 KEOTA! in .. CORE (16.9743 g)
"i'R. POROSITY -4 .• 66% 0 .
-.. 4.0 ~ "' 0 0 3.0 Q.
w > ~ ..J ::::> ~ ::::> u
2.0
1.0
0.1 0.05
o.__-'-~-'-~~-'---~~~~_._~_._~~~~~-'-~~ 30.0 10.0 5.0 1.0 0.5
PORE RADIUS, µ
Fig. 8. Cumulative porosity distribution, Keota
o. 1 0.05

.. w
100
~ Q> 80 :::> E ...I ::> Oo > >
~ ~ 60 0 Q. Q.. -
0 w -> 0 - -........... 40 < 0 ...I -;R. :::> 0 ~.,, :::> 0
u 20
19
MENLO~ in. CORE ( 13. 9704 g)
o.__L-~~.__~__._~~~~~_._~~....._~~~~~-'--~--' 30.0 10.0 5.0 1.0 0.5
PORE RADIUS, µ
Fig. 9. Percent of pore volume distribution, Menlo
.. w
100
~ Q> 80 :::> E ...I ::> o> ~ w Q>
0 &. 60 Q.. -w 0 >o - -~ 'O S* ~.,, :::> 0 u
40
20
PINTS! in. CORE ( 13.8629)
0.1 0.05
0L--.----G=:::O::=i::~===~:::::_-1~~L-~~~~L---1 30.0 10 5 1.0 0.5
PORE RADIUS, µ
Fig. 10. Percent of pore volume distribution, Pints
o. 1 0.05
•

.. w
100
~ Q) 80 ::> e .... -= 0 0 > >
Q)
~ ~ 60 0 c.. ~-c w ... ~ .2 ~ 0 40 _, '#. :::> .,. ~ c :::> u 20
20
ALDEN! in. CORE ( 12.1338 g)
ol --of==D-~- 1 1 1 I 30 10 5 1.0
PORE RADIUS, µ
Fig. 11. Percent of pore volume distribution, Alden
.. w
100
~ Q> 80 ::> e .... ::> Oo > >
I) w ... 60 ex o 0 Cl. ~ -c w ... > 0 - -< 0 40 ...I ..._o ;:) O'
~"' ::::> c u
20
LINWOOI:>! in. CORE (12.55919)
OL....-L--~...L-.--...L-.~~~~L.----JL...-~~~-'-~~ 30.0 10.0 5.0 0.1 0.5 o. 1 0.05
PORE RADIUS, µ
Fig. 12. Percent of pore volume distribution, Linwood

.. w
100
~ ~ 80 ..J :::> Oo > > w Cl> ... 0 &. 60 Q.. -w.E > 0 - .... ~ -< 0 40 5~ ~"' ::::> 0 u
20
21
COOK! hi~ CORE ( 12.4953 g)
01 -o1=o I 0--- I I I I 30.0 10.0 5.0 1 .o 0.5 0. 1 0.05
PORE RADIUS, µ
Fig. 13. Percent of pore volume distribution, Cook
100 KEOTA! in. CORE (16.9743 g)
.. w 80 ~ Cl> ::::> E ..J :::> Oo > > w '1 60 et= ...
0 &. 0.. -w .f > 0 - .... 40 ~ -< 0
5~ ~Ill ::::> c u 20
O.__.~~"'--~.l..--~~~-L-~.......1-~~~--.L_--l 30.0 10.0 5.0 1.0 0.5 0. 1 0.05
PORE RADIUS, µ
Fig. 14. Percent of pore volume distribution, Keota
•

0.080 MENLO J in. CORE
0.070
0.020 0.100
0.010 0.050
0.00 0.000 0 0.5 1.0 1.5 2.0 2.5 0 0.5 1.0 1.5 2.0 2.5
PORE RADIUS, µ PORE RADIUS, µ
Fig. 15. Non-normalized pore size distribution, Menlo Fig. 16. Non-normalized pore size distribution, Pints

• 23
0.060 ALDEN ! in. CORE
0.050
0.040 ... .. a
0.030
0.020
0.010
0.000 0 0.5 1.0 1.5 2.0 2.5
PORE RADIUS, µ
Fig. 17. Non-normalized pore size distribution, Alden
0.010 LINWOOD! in. CORE
0.008
... 0 0.006
0.004
0.002
0.000 0 0.5 1.0 1.5 2.0 2.5
PORE RADIUS, µ
Fig. 18. Non-normalized pore size distribution, Linwood

0.080 COOK ! in. CORE
0.200 KEOTA! in. CORE
0.070 0.175
0.060 0.150
0.020 o.oso-
0.010 0.025
0.00 0.000 0 0.5 1.0 1.5 2.0 2.5 0 0.05 1.0 1.5 2.0 2.5
!>ORE RADIUS, µ PORE RADIUS, µ
Fig. 19. Non-normalized pore size distribution, Cook Fig. 20. Non-normalized pore size distribution, Keota

25
Percent porosity in various pore radius range. 1be porosity between
certain radii, the ratio of the pore volume in these sizes to the total
bulk volume of an aggregate including pores, expressed as a percentage,
was determined for the following pore radius ranges (in microns): 21-11,
21-5, 21-2, 21-1, 11-1, 5-1, 1-0.5, 1-0.1, 1-0.05, 0.1-0.05 and 0.7-0.05.
1be last range included in the study was based on six non-normalized
pore size distribution curves which had the range from 0.05 to 0.7 for the
most frequently occurring pore radius.
1be above-mentioned porosities are included in Table 6.
Statistical analysis results. Out of the various pore size ranges,
important ranges indicated later were selected. Linear correlation
coefficients between these main pore properties were determined in order
to study how they vary with each other. 1be computed correlation coefficients
have been recorded in Table 7.
Pore size ranges in Table 7 were selected on the basis of their
correlation with asphalt absorption. 1bose with poor or no correlation
were not included. However, an inverse correlation exists between intrusion
porosity and porosity in all pore size ranges (Table 8).
It appears mercury intrusion porosity is mainly dependent upon the
porosities in the following ranges, (in microns) 0.7-0.05, 1-0.05, 1-0.1 and
1-0.5; the porosity in 5-1, 11-1, 21-2, and 0.1-0.05 ranges have fair
correlations with mercury intrusion porosity and show a general trend.
Based on the determination of 24 hr soaked porosity and mercury intrusion
porosity, the following plots have been made which show good correlations:
24 hr soaked porosity vs mercury intrusion. Correlation coefficient is
0.7093. Menlo and Linwood cores behave almost alike. Cook and Alden cores
•

Table 7. Linear correlation coefficients between main pore properties
24 hr Mercury soaked intrusion 0.7-0.05 µ 0.1-0.05 µ 1-0.05 µ 1-0.1 µ 1-0.5 µ
Property porosity porosity porosity porosity porosity porosity porosity
24 hr soaked 1 porosity
Mercury intrusion 0.7093 porosity
0.7 - 0.05 µ porosity o. 7716 0.9553 1 N
°'
0.1 - 0.05µ porosity 0.9782 0.5510 0.6510 1
1 - 0.05 µ porosity 0.7405 0.9548 0.9987 0.6128 1
1 - 0.1 µ porosity 0.6733 0.7084 o. 9894 0.5341 0.9953 1
1 - 0.5 u porosity 0.5664 0.9275 0.9566 0.4188 0.9687 0.9854 1

27
Table 8. Relation between mercury intrusion porosity and porosity in other· size ranges ,
Correlation 4fa Pore size range, µ coefficient Equation for regression line
1 0.7 - o.05 0.9553b y = 0.0101 + 0.5204 x 2 1 - 0.05 0.9548b y 0.7580 x 0.2747
3 1 - 0.1 0.9547b y = 0.7084 x 0.4376
4 1 - 0.5 0.9275b y = 0.3732 x 0.2786
5 5 - 1 0.7823
6 11 - 1 0.7610
7 21 - 1 0.7315
8 0.1 - 0.05- 0.5510
9 21 - 5 -0.2717
10 21 11 -0.2534
11 21 2 -0.0145
8x = mercury intrusion porosity Y = porosity in respective pore size range
bs. ·f· 5"' 1 1 igni icant at ro eve
tend to absorb less water, while Keota and Pints cores absorb more water
as compared to mercury intrusion.
Mercury intrusion porosity vs 0.7-0.05 µrange porosity. Since values of
pore radius r corresponding to maximum value of D(r) in the non-normalized
pore size distribution curves (Figs. 15-20) range from 0.05-0.7 µ, this
range was correlated with mercury intrusion porosity. The correlation is
excellent, correlation coefficient being 0.9553. The equation for regression
line is y = 0.0101 + 0.5204 x
where
X = mercury intrusion porosity, %, and
Y = O. 7 - 0.05 µporosity
•
a

28
Table 7 also indicates that mercury intrusion porosity has the highest
correlation with porosity in this range. In other words, in the cores
studied, mercury intrusion porosity is mainly dependent on this range of
porosity. This is also confirmed by the excellent correlations between
porosity of 1-0.05 and 1-0.1; 1-0.05 and 1-0.5; and 1-0.1 and 1-0.5 pore
size ranges (in microns). It seems porosity in the 1-0.05 range is the
controlling factor for total mercury intrusion, while the 0.1-0.05 range
is for water absorption, as the correlation coefficient between 0.1-0.05
range porosity and water absorption is 0.9782.
Hysteresis in the mercury porosimetry. Curves illustrating the
phenomenon of hysteresis have been plotted in Figs. 21 - 26 with the log
pore radius (micron) as the abscissa and mercury penetration volume
(cc/g) as the ordinate, based on mercury intrusion experiments.
If the pores are cylindrical with uniform diameter or V-shaped, the
points of penetration and retraction of mercury in the pres&ure-penetration
curve will fall on the same! line, provided the advancing and receding con
tact angles are also equal,, If they do not, it is practically certain that
the pore system deviates from this simple picture. Pores with narrow throat,
the so-called ink-bottle pores, would not be expected to empty when the
pressure is released and thus shall be responsible for hysteresis. The
occurrence can be accounted for as follows: the start of the penetration is
determined by the radius o:E curvature of a mercury surface that can just
penetrate into a narrow passage to an interstice. The start of the retraction,
however, is determined by the radius of curvature of the mercury surface
formed by the interfering mercury surfaces inside the interstice; this surface
has a different radius of curvature than the one formed during penetration.

0.005 ~
CJ CJ
... 0.004 w ~ ::> ..J 0.003 0 > z 0 0.002 ~ Qi: I-w 0.001 z ~
0.000
Fig. 21. Hysteresis
0.070
~ 0.060
CJ ...
0.050 w ~ ::> ..J 0 0.040 > z 0
s 0.030
I-w z 0.020 ~
0.010
0.000
29
a PRESSURIZATION o DEPRESSURJZATION
MENLO! in. CORE
10.0 5.0 LO 0.5 0.1 0.05
PORE RADIUS, µ
in mercury porosity, Menlo
o PRESSURIZATION o DEPRESSURIZATION
0
PINTS! in. CORE
10.0 5.0 1.0 0.5
PORE RADIUS, µ
0. 1 0.05
Fig. 22. Hysteresis in mercury porosity, Pints
•
•

~ 8 ..
w ~ :::>
O.<l.50
0.040
C) 0.030 > z 0 ,0.020
s ~ 0.010 z w .a..
0.000
30
o PRESSURIZATION oDEPRESSURIZATION
10.0 5.0 1.0 0.5
PORE RADIUS, µ
Fig.· 23. Hysteresis in mercury porosity, Alden
~ 0.004 a PRESSURIZATION u u
oDEPRESSURIZATION .. w ~ 0.003 :::> ...J 0 > 0.002 z LllNWOOD ! in. CORE 0
!< o.oor ~ ~ w z 0.000 w a.. 10.0 5.0 1.0 0.5
PORE RADIUS; µ
0.1 0.05
o. 1 o_._05
Fig. 24. Hysteresis in mercury porosity, Linwood
31
0.030 o PRESSURIZATION
~ o DEPRESSURIZATION
0.025 u u ..
w ~ 0.020 :::> ...J 0 > 0.015 z 0
~ 0.010 °' .... w z w 0.005 a.
COOK ! in. CORE 0.000
10.0 5.0 1.0 0.5 0. 1 0.05 PORE RADIUS, µ
Fig. 25. Hysteresis in mercury porosity, Cook
~ u u ..
w ~ :::> ...J ·o > z 0
~ °' .... w z w a.
0.014
0.012
0.010
0.008
0.006
0.004
0.002
0.000
o PRESSURIZATION o DEPRESSURIZATION
.KEOTA! in. CORE
10.0 5.0 1.0 0.5
PORE RADIUS, µ
0. 10.05
Fig. 26. Hysteresis in mercury porosity, Keota
•

32
Examining Figs. 21 - 26, it is evident that all rock cores retain
a large percentage of mercu:ry when the pressure is released for 2000 psi
10 psi. Percentages of mericury retained on depressurizing to 10 psi are
shown in Table 9.
Table 9. Percent mercury r·etained on depressurization
Core Mercury retained,%
Menlo 63. 77
Pints 79.85
Alden 69.33
Linwood 80.56
Cook 90.54
Keota 68.18
Interpretation of Porosity Data
Menlo core. The porosity distribution curve indicates a unifonn upward
trend with more steepness in the latter part. Mercury intrusion porosity
above 1 µpore size is 0.43 while less than that size is 0.55. The pore
size most frequent and having maximum value is 0.'05 µ. Since 24 hr soaked
porosity (2.37) is more than mercury intrusion porosity (0.98), it seems
rock structure is made of c:apillaries finer than O. 05 µ which could absorb
more water whereas mercury could not penetrate at 2000 psi. Thus, this
core is expected to absorb less bitumen.
Hysteresis (Fig. 21) shows pore throats are predominantly between
O. 2 and O. 05 µ in radius since this is where the mercury entered.
The major dimensions of thE! interior cavities, on the other hand, are
between 0.15 and 0.8 µin :radius because these are the sizes indicated
by the receding mercury. Non-normalized pore size distribution curve

33
(Fig. 15) indicates 0.05 µas the most freq~ent pore size with 0.15 µ
following it as second peak for the range 0.1 µand above.
Pints core. The porosity distribution curve (Fig. 4) reveals that most
of the porosity is below 1 µpore size (14.65 out of total 16.88%) of
which 1-0.1 µ range has 12.9%. Since water absorption and mercury
intrusion are almost equal, the rock may not have many fine capillaries
less than 0.05 µradius. Non-normalized pore size distribution shows 0.05 µ
radius most frequent with 1.1 µfollowing it as second peak in the curve
(Fig. 16) for the range 0.5 µand above. Hysteresis (Fig. 22) shows pore
throats are predominantly between 1.1 - 0.05 µin radius while interior
cavities are of varying size more than 0.1 µin radius evenly dispersed
throughout. It has been observed in this study that rock cores having no
major defined dimensions for the interior cavities, as shown by the de-
pressurization curve, retain more mercury after releasing pressure from
2000 - 10 psi. A possible explanation could be that interconnected cavities
of uniformly decreasing dimensions opening successively into each other.
After the mercury porosimetry, the shining mercury could be observed visually
in the Pints core. It retained a substantial percentage of mercury (79.85%)
at the end of the test.
Higher mercury intrusion porosity indicates that the Pints core is
likely to absorb more bitumen also.
Alden core. The porosity distribution curve (Fig. 5) reveals Range
21 - 1 µ 1 - 0.05 µ
Porosity 1.12% 8.48%
Thus the core contains more pores having diameter less than 1 µ
(most of the pores are 1-0.1 µrange as in the case of Pints, comprising
8.29 out of 8.48%). Since water absorption is much less than mercury
•

34
intrusion, it seems there a1ce few fine capillaries and also the internal
structure might have been disrupted by mercury intrusion to some extent.
Such instances have been noted by Dinkle also. 4 As the mercury penetrates
the soft stone, it breaks through the pore walls of some pores that origi
nally had no entrance capillaries into them; these pores were completely
sealed off by their pore walls. As a result,the mercury intrusion method
measures the volume of thesie once-sealed. pores. Alden was observed to be
quite soft in drilling operations. The other reason could be chemisorption
of mercury, especially in fine pores. Non-normalized pore size distribution
curve (Fig. 17) indicates 0.71 µas peak pore radius (having maximum pore
volume) with 0.21 µas the next higher peak. Hysteresis (Fig. 23) shows
that. predominant pore throats range from 1-0.05 µ, while most internal
cavities have a radius of 1-3 µ.
Due to greater dimension of the internal cavities, it is expected Alden
may absorb much bitumen also.
Linwood core. Referring to the porosity distribution curves, the
porosities are:
Range Porosity
21 1 µ 0.36%
1 0.05 µ 0.54%
The porosity is uniformly distributed from 21-0.2 µ; it is maximum
in the range of 0.1-0.2 µ (Fig. 6). Since 24 hr soaked porosity is higher than
mercury intrusion porosity, it seems the rock core has more fine capillaries
having radius less than 0.05 µ. Non-normalized curve indicates O. 14 µ
as the most frequently occurring pore radius. Pore tl:troats range from
1.3-0. 7 µand 0.4-0.05 µ O'ig. 24), whereas internal cavities range in

35
dimensions (radius) from 1.5-2 µand 0.25-0.45, but their extent is not
so much as observed in the Alden core.
Though the pore radius having maximllm ~ore volume (0.14 µ) is greater
than four other cores, the total porosity (both water-soaked and mercury
intrusion) of Linwood core is the least among six cores. Thus it is
expected that the Linwood core will absorb less asphalt.
Cook core. The porosity distribution curve (Fig. 7) indicates porosity
in the 21-2 µrange as 1.10% while it goes up and is 16.34% in the
2.0-0.05 µ range. Water absorption is far less than the mercury intrusion.
It seems that mercury has very much disrupted the internal structure by
breaking through the pore walls into isolated interstices or cavities. The
striking constance of the volume of mercury retained (Fig. 25), despite the
fact that pore volumes, and hence surface areas, were of widely differing
extent, constitutes strong evidence thar chemisorption is insignificant and
the retention is a result of ink-bottle pore shapes. The constance of
retention, moreover, indicates that ink-bottling occurs primarily in the
coarse pores. Cook core retained 90.54% of mercury after depressurizing to
10 psi. The pore radius having maximum pore volume is 0.05 µas seen in
non-normalized pore size distribution curve (Fig. 19).
Keota core . The pore size distribution curve (Fig. 8) indicates:
21
1
0.1
Range
1 µ
0.1 µ
0.05 µ
Porosity
2.68%
0.97%
1.01%
Mercury intrusion porosity is 4.66% while 24 hr saturated porosity
is 7.77% which can imply that Keota core has more fine capillaries of
radius less than 0.05 µ, which can absorb water readily.
•

36
The non-normalized pore size distribution curve (Fig. 20) shows 0.05 µ
as the pore radius having maximum pore volwhe.
In the hysteresis (Fig. 36) the predominiint pore throat radii seem to
range from 10 - 0.7 µ.,and 0.1 - 0.05 ~ The internal cavities have 0.07 -
0. 2 µ radius in general.
Due to narrowness of the most frequently occurring cavities and moderate
mercury intrusion porosity, it is likely the Keota cores will absorb moderate
amountsof asphalt among the cores studied.
The relationship between absorptions determined by various methods
3 22 and between pore characteristics and absorption have been reported '
elsewhere and will be discussed under "Absorption Studies."
Evaluation of Bulk Specific-Gravity
Accurate determination of bulk specific gravity of the aggregate is
of paramount importance in a number of engineering design applications.
Percent voids is generally used as one of the criteria for the design
of bituminous paving mixtures. The exact determination of bulk specific
gravity of the various constituents of the paving mixture is a necessary
part of the design procedure for determination of void properties of
bituminous mixtures. It is also used to estimate percent of asphalt
absorption by aggregate, which is the major consideration of projects HR-127
and HR-142. In the design and control of portland cement concrete, bulk
specific gravity is used in design calculation of concrete mixtures by the
absolute volume concept.
Bulk specific gravity can be defined as the ratio of the weight in
air of a given volume of a permeable material (including both permeable and

• 37
impermeable voids normal to the material) at a stated temperature to
the weight in air of an equal volume of distilled water at a stated
temperature. The bulk specific gravity of an aggregate as defined by the
ASTM equals the oven-dry weight of the aggregate (A) divided by the sum
of the aggregate volume (Vs), the volume of the permeable voids (Vp) and
the impermeable voids (Vi), and the unit weight of water (yw)
bulk specific gravity A = (Vs + Vp + Vi)yw
or
A = B - c
where B is the saturated surface-dry weight of the material in air, and C
is the weight of saturated material in water. Those voids that cannot be
filled with water after a 24 hr soaking are referred to as impermeable
voids. Voids that can be filled with water after a 24 hr soaking are
referred to as permeable.
ASTM Standards C-127 and C-128 outline methods for determining absorption
and bulk specific gravity of aggregates. These standards call for inunersion
of material in water for 24 hr, followed by drying until the surface-dry
state is attained. Coarse aggregates are rolled in an absorbent cloth
until all visible water films are gone. Some operators judge this condition
by observing the shine contributed by water film while others'judge by
observing a slight color change in the aggregate.
Fine aggregates are spread on a pan and exposed to a gentle current of
warm air until a free flowing condition is· reached. The aggregate is then
lightly taxnped into a conical mold. If the cone stands when the mold is

38
removed, the fine aggregat~ is assumed to carry moisture on its surface
and it is dried further. When the cone just begins to slump upon removal
of the cone, it is assumed to be in a saturated surface-dry state.
For natural, well grad·ed fine aggregates, the saturated surface-dry
condition is usually reprodueible. However, the end point is more erratic
for crushed fine aggregates because the angularity of the particles does
not permit a definite slump condition as do the rounded surfaces of natural
sands. Besides this, the higher percentage of material passing the fflOO
sieve also poses a problem in achieving slump condition.
Various attempts have been made in the past to pinpoint the saturated
surface-dry condition of the aggregates to improve the reproducibility
of the bulk specific gravity test results. These include Howard's glass
. 23 24 25 3ar method ' Martin's wet and dry bulb temperature method, Saxer's
26 absorption time curve proce:dure and Hughes' and Bahramian' s saturated
air drying method. 27 However, the various modifications either offer little
improvement or are too elaborate to be practical in the field or average
laboratory.
During the first year of Project HR-142, a special study was conducted
to develop new, simple, and more reproducible methods to determine the bulk
specific gravity or the saturated surface-dry condition for granular materials.
As a result, a new chemical indicator method was developed to determine the
saturated surface-dry condition, and a glass mercury pycnometer was designed
to determine bulk specific gravity of aggregates larger than the#lOO sieve
size.· Preliminary work on the mercury pycnometer is described in Appendix c.
In the chemical indicator study, the bulk specific gravity of crushed
aggregates and cylindrical rock cores from the six HR-142 limestone quarries,

• 39
one crushed trap rock, and one synthetic aggregate (Synopal) from Denmark,
was determined by five methods. The methods are standard ASTM, geometrical
measurement, mercury displacement, and two chemical indicator methods (cobalt
chloride and fluorescein di-sodium salt) developed at the Iowa State University
Bituminous Research Laboratory. The chemical methods are described in
Appendix B. The detailed work on the chemical indicator method is reported
. 28 elsewhere. The general conclusions of the study were:
• The ASTM standard tests underestimate the bulk specific gravity
of aggregates, as these tests measure adsorption as well as
absorption of particles. Results obtained in determining bulk
specific gravity by other methods such as the mercury displacement
method, the geometrical mensuration method, and the chemical methods
appear to confirm this statement.
• Experiments on rock cores indicate that the mercury displacement
method gives realistic values between those obtained from the
ASTM standard method and the geometrical mensuration method.
Further investigations are needed in order to have a properly
specified pressure at which measurements of volume displaced by
mercury should be taken for consistent results with all aggregateso
• Chemical methods eliminate the human ~lement to a great extent
in observing the saturated surface-dry condition of the aggregates
since color change is quite apparent.
• Attainment of saturated surface-dry condition by the chemical method
is not affected by the surface character, particle shape, or
gradation of the particles.
• Results of chemical methods agree well with those obtained from
the mercury displacement method.

40
• On the basis of the data in this study and the relative cost
of each chemical method, the cobalt chloride method appears to
be the more preferable of the two chemical methods investigated.
However, fluorescein di-sodium salt is better suited when dealing
with dark-colored aggregates.
• Data in this limited study seem to indicate that most duplicate
determinations cl;leck within 0.01 reliability in the case of the
chemical method as compared to 0.02 reliability specified in the
ASTM standard test.
• Additional work is needed in order to establish the reproducibility
of the chemical ind.icator methods.
A third method for determination of bulk specific gravity and water
absorption was developed during absorption-time studies. The procedure and
results of this method will. be discussed in the next section.

41
ABSORPTION STUDIES
Methods and Procedures
Many investigators have attempted to evaluate aggregate absorption
with kerosene and have applied suitable corrections for the amount of
asphalt absorbed by aggregates in mixture design. Hveem29
devised the
Centrifuge Kerosene Equ.ivalent test (CKE) in 1942. The CKE measures the
quantity of kerosene absorbed by 100 g of aggregate under specified
conditions of soaking and centrifuging, shown to be a function of the
surface area and absorptive capacity of the aggregate, and has been used
21 as a part of the design of bituminous mixtures by Hveem's method. Lohn
adopted similar procedure with some modifications in soaking and centri-
fuging time and was able to correlate bitumen absorption of an aggregate
with kerosene absorption. 30
Donaldson et al. proposed modifying the Hveem
CKE method by increasing soaking time to 30 min and by testing a non-
absorptive aggregate of the same gradation as the aggregate in question
for purposes of comparison. Since kerosene has wetting properties similar
to asphalt, it has been believed to be a better representative absorption
31 agent than water. 0 ·1 h 1 b d b . . 29,32 1 s ave a so een use y some investigators
to evaluate the absorptive capacity of coarse aggregates.
In 1942, Goshorn and Williams33 developed an irmnersion method in which
0 the coarse aggregate is inunersed in a tarred wire basket in asphalt at 275 F
for 3 hr. The basket is removed from the asphalt and suspended in an oven for
10 min to drain off excess asphalt. The basket with coated aggregate is cooled
to room temperature and weighed in air and in water at 77°F. The percent
asphalt absorbed is calculated by the procedure described by Goshorn and
Williams, based on straightforward volume-weight relationships of aggregate,
•

42
asphalt and effective volum.4~ of coated aggregate.
Since the aggregate is in contact with an unlimited supply of asphalt
at relatively low viscosity for extended periods of time, the absorption
is nruch higher than would be expected in a bituminous mixture. However,
the values can definitely b1~ taken as the absorptive potentials of aggregates
d f b . . . 30 use or 1tum1nous mixtures. Accuracy of this test is limited by homo-
geneity of the aggregate and accuracy of the bulk specific gravity and
R. 34 d d d h ice propose a proce ure to etermine t e maximum specific
gravity of the mixture by using volumetric flasks. The absorption of
asphalt by aggregate in a mixture can be calculated if the maximum
specific gravity of the mixture (after Rice's method), the asphalt content,
and the bulk specific gravity of the aggregate used in the mixture are
known.
One serious limitation of this method is that aggregate particles
must be thoroughly coated; failure to do this may give erratic data
because of possible water absorption during saturation. However, in
this method, results can be obtained from actual mixtures.
The US Corps of Engine:ers 35 developed and used bulk-impregnated specific
gravity in the design and c.ontrol of bituminous paving mixtures. The bulk-
impregnated specific gravity (Gbi) can be defined as the ratio of the weight
in air of a given volume of a permeable aggregate (including solids, impermeable
pores, and pores normally permeable to water but which are variably permeable
to bitumen) at a stated temperature (77°F) to the weight of an equal volume
of water (Vt) minus the weight of the volume of bitumen (Vb) absorbed by
pores permeable to it. In the CGS system, the bulk-impregnated specific
gravity, Gbi, is the ratio of the weight of the aggregate to the volume
of the aggregate including solids, impermeable internal pores, and
bitumen impermeable pores.

43
Table 10. Bulk specific gravity and water absorption of quarry-crushed aggregate and cores
Quarry Aggregate II
Menlo 1-S-B
1-L-A
1-L-B
Core
Pints 2-A
2-B
Core
Alden 3-S-B
3-L-A
3-L-B
Core
Linwood 4-A
4-B·
Core
Cook 5-S-B
5-L-A
5-L-B
Core
Keota 6-A
6-B
Core
Bulk specific gravity
(ATTM) Water absorption, "/,,
2.567 1. 93
2.613 1.18
2.603 1.40
2.637 0.90
2.348 6.56
2.348 7.31
2.271 7.22
2.475 2.97
2.517 1. 94
2.508 2.31
2.510 1. 72
2.613 1.42
2.582 1.66
2.636 0.90
2.397 5.98
2.426 4.26
2.408 5.40
2.465 3.88
2.326 5.58
2.303 7.51
2.489 3.12
•

44
Thus, when an aggregatie absorbs no bitumen, its bulk-impregnated
specific gravity, Gbi, equals bulk specific gravity, Gb; on the other hand,
if absorbed bitumen is equal to water absorption, its Gbi is equal to the
apparent specific gravity, Ga. Therefore, Ga= Gbi - Gb. Thus, bulk-
impregnated specific gravity is a function of the ratio of bitumen to
water absorption, which varies widely but follows a definite pattern with
different types of aggregate. This is suitable for general use with all
aggregates used in bituminous mixtures and is particularly suited for use
with porous aggregates.
36 McLeod has recommended the use of this method to determine the
maximum, or upper limit, absorption for aggregate. 37 Lee compared the
data with those obtained by other methods and concluded that these absorption
values were by no means the: absolute maximum absorption values for a particular
aggregate, but can be looke!d upon as the "realistic" maximum absor.ption values
aggregates will have in bituminous mixtures.
Absorption capacity of aggregates can also be determined by colorimetric
analysis with photometer, using either asphalt solution or dye solution and
l .b . 37 ca i ration curves.
In this investigation:, aggregate absorption has been evaluated with
re~pect to water, CKE and oil, asphalt (Rice method, bulk-impregnated specific
gravity method, and immersion method), and dyes (photometer method). Factors
studied included asphalt type, aggregate type, temperature, and time.
In the following sections, the results of these studies will be
presented. The techniques and methods used will be briefly described.
Detailed procedures will be referred to specific references or given in
Appendix D.

45
Water Absorption
Several series of bulk specific gravity and water absorption tests
were conducted on fractioned quarry crushed, cores and laboratory crushed
block samples at various stages of this investigation. Because of the
inherent unhomogeneity of the material (even among cores from block samples)
and the weaknesses of the standard specific gravity and water absorption
tests, the results of different series of t7sts were not always comparable.
TablelO represents the results of specific g~avity and absorption of quarry
crushed, laboratory separated coarse fractions, and 1/2 in. rock cores from
one of the two block samples for each quarry during early stages of this
project. Table llgives the results of specific gravity and water absorption
of laboratory crushed and separated aggregates made during the latter part
of this investigation. Most calculations used in asphalt absorption reported
in this section and chemical treatment studies reported later were based on
values from this table (or weighed avera.ge for graded aggregates). Values
in TablelO were used for correlation studies.
In order to investigate the nature and rate of water absorption by
aggregates, two series of time-absorption stud.ies were made. One series
was made on 1 in. core samples and the other series was made on laboratory
crushed 3/8 in. to #4 sieve fractions. In these tests, oven-dried samples
(about 100-120 g) were weighed on a single-pan, direct reading analytical
balance with special attachment in air and water (at 25°C) after immersion
time of 1/2, 1,,3, 5, 10, 20, 30, 60 min and 2, 4, 8, 12, 24 hr (some to
96 hr). At the end of the last weighing in water, samples were surface
dried and weighed in air. Apparent and bulk specific gravities and water
absorption were calculated and tabulated in Table 12a for rock cores and·in
' I I : I ' I I
•

• 46
Table 12b for crushed 3/8 in. samples. Time-absorption curves of core
sample are shown in Figs. 27a to 27b. Weight in water vs time curves
of these core samples were plotted in Figs. 28a to 28d. Similar plots
for +#4 sieve fractions.

3.0
2.5
z 2.0 0 ~ 0.. ci:: 0 1.5 V') co <(
*-1.0
0.5
0.2
47
3.4 ALDEN COOK'S SERIES A
3.0 SERIES A
2.!? z 0 t: 2.0 ~ V')
*' <(
'#. 1.5
1.0
0 10 100 1000 10,000 100,000 10 100 1000 10,000 100,000
TIME, sec TIME, sec
Fig. 27a. Time-water absorption Fig. 27b. Time-water absorption
z 0 ~ 0.. ci::
0 V') cc <(
*-
0.5
0.4
0.3
0.2
curves of cores, Alden
KEOTA-I SER1ES A
curve of cores, Cook
0.1 '--~~~~---"-~~~~~~~~~~---'-~~~~~~ 10 1000
TIME, sec 10,000 100,000
~ig. 27c. Time-water absorption curve of cores, Keota I
•

48
4.0 l KEOTA-If SERIES A
3.5
3.0 z 0 2.S --IL ~
0 2.0 Cl) • ~ ~ 1.5
1.0 - '
o.s I 0 .4 L-L._._L____L___ -- J ~_LJ
' 110 100 1000 .10,000 500,000
TIME, sec
Fig. 27d. Time-loi•ater absorption curve of cores, Keota II
0.8 LINWOOD Sl:RtES A
0.7
z 0.6 0 i: 0.5 a=: 0 V> CQ 0.4 <
* 0.3
0.2
o. 1 10 100 1000 10,000 100,000 500,000
TIME, sec
Fig. 27e. Time-water absorption curve of cores, Linwood

4.5
4.0
3.5
z 3.0 0 -t: °'' 0 V> CIQ
< *
2.5
2.0
1.5
1.0
0.5
PINTS SERIES A
49
0.2 ....................... _ _._ _ _.__....._. ...... 10 100 1000 500,000
TIME, sec Fig. 27f. Time-water absorption curve
of cores, Menlo
2.0 X SERIES A
z 1.5 0 t:: °' 0 V> m
l.O <
* 0.5 J
0 10 100 1000
0.45
0.40
0.35
z 0.30 .Q t:: 0.25
0 V> 0.20 m < 'ffl. 0.15
0.10
0.05
MENLO SERIES A
0. 00 ~__.._ _ _..__..J.-...---11~
10 100 1000 500,000 TJME, sec
Fig. 27g. Time-water absorption curve of cores, Pints
10,000 100,000 TIME, sec
Fig. 27h. Time-water absorption curve of cores, X (Alden II)
•

50
107
~ 106 'f MENLO 0 ..
O> 105 ..
QI:: w
104 ~ ~ z 103 .... :I: 0 102 -w ~ T ALDEN
101 0
100 T COOK 0
0 1.0 10 100 1000 1440 10,000 TIME, q1in
Fig. 28a. Time-weight in water curves of cores, A, C, and M limestones
113
112
111 O> ..
Cl:: 110 w .... < ~ 109 z ....
108 :I: 0 w ~ 107
106
105 1.0 10 100 1000 10,000
TIME, min
Fig. 28b. Time-weight in water curves of cores, Pints

• 51
--------------------·------·--·---------.
119
C> 118 .. ~ w
< 117 ~ z
116 t-:c (!) - 115 w ~
114
113 1.0 10 100 1000 10,000
TIME, min
Fig. 28c. Time-weight in water curves of cores, K 1, L and X (A II)
88
C> 87 .. ~ w 86 < ~ z 85 t-:c 84 (!) w ~ 83
82
81 0
1.0 10 100 1000 10,000 TIME, min
Fig. 28d. Time-weight in water curves of cores, Keota II

121
119 O>
... ei:: w 117 ~ ~ z 115 .... :z:: C> - 113 w ~
111
52
I c . ('r
0COOK
/_ y ALDEN 0
-T 0
PINTS
1.0 10
TIME, min.
~
100 1000
• 0
0
Fig. 28e. Time-weight in wat,er curves of+ 3/8 in fractions, A, C, and P
.. ell: w
~ z
121 LINWOOD
120
119
118
117
LINWOOD
116
115
Lr K .. ·
101~1 1.0
KEOTA II
I 10
TIME, min
I 100
J 1000
• •
Fig. 28f. Time-weight in water curves of + 3/8 in fractions, K II and L
i

.. O! w
< ~ z 1-:::c (!) w ~
121
114
0. 1.0
53
10 TIME, min
100 1000
Fig. 28g. Time-weight in water curves of + 3/8 in fractions, K I, M and X
•
• ~

Table 11. Bulk specific gravity and absorption of crushed block
Size fraction Alden Cook Keota I Keota II Linwood Menlo Pints X-Quarry
Bulk specific gravity (ASTM)
1/2 2.439 2.457 2.305 1.984 2.6081 2.617 2.320 2.430
~In l"ti I. "'l '} .., /, "'t: ..., 1.ni:: 1 a~c:; 2.611 2.620 2.320 2.426 :>/ 0 Lo'"tJJ ~•'+.JV L.e"'"t'VJ ~. _, __
4 2.404 2.449 2.493 1. 990 2.599 2.618 2.297 2.415
8 2.383 2.368 2.479 1. 996 2.575 2.585 2.237 2.344 U1 ~
8 ..... 100 2.546 2.556 2.619 2.430 2.620 2.586 2.620 2.548
Water Absorption, %
1/2 2. 71 3.99 6.12 12.60 1.17 0.84 6.44 3-.10
3/8 2. 92 4.19 5.51 13.00 1.24 o. 94 6.80 3.28
4 3.64 4.83 3.52 13.80 1.49 1.35 7.57 3.70
8 4.58 6.86 3.56 14. 73 1. 98 1.87 9.39 5.55
8 ..... 100 1.69 3.49 1.36 4.33 1.47 1. 70 2.78 2.02

55
Table 12a. Water absorption of cores
SEecific . a gravl.t}'.
Ga Gb
Cook 2.708 2.450
Alden 2.576 2.447
KI 2.689 2.652
Pints 2. 713 2.398
Linwood 2.787 2.589
KII 2.704 1.973
Menlo 2.701 2.638
aGa = Apparent specific gravity
Gb = Bulk specific gravity
bCorrelation coefficient (r) = 0.6183
Absorption, 1o ASTM Graphicalc
3.88 3.38
2.78 2.90
0.51 0.50
4.83 4.07
0.81 0.78
11.85 2.92
0.46 0.39
Table 12b. a Water absorption of crushed block samples
· SEecific . b gravity Ga Gb
Cook 4. 72 2.19
Alden 2.91 1. 78
KI 1.64 1.57
x 3.26 2.17
Pints 6.89 4.67
Linwood 1.45 0.61
KII 13. 77 3.05
Menlo 1.05 0.55
a3/8" to #4 sieve
bGa = Apparent specific Gravity
Gb = Bulk specific Gravity
cCorrelation Coef. (r) = 0.6768
AbsorEtion, to ASTM Graphicalc
2. 7.69 2.449
,2.641 2.443
2.695 2.405
2.646 2.426
2.773 2.275
2.697 2.596
2.741 1.990
2.704 2.620
•

56
Some interesting and perhaps significant observations can be made from
these curves:
• Only one out of eight limestones (Keota 1) reached equilibrium
saturation at 24 hr (1440 min or 86,400 sec) which is the basis.
for ASTM specific gravity and absorpt:t.on determinations. Two
other core samples (Menlo and Linwood) can be considered having
reached saturation due to insignificant amount of change and
low total absorption. All the other cores (especially highly
absorptive Keota II and Pints) continued to increase absorption
beyond 24 hr.
• When plotted on a semi-logarithmic scale, the first part of the
time-absorption curves all take shapes of an "S". Depending on
pore-size distribution, the steep portion of the curve occurs
somewhere between 100-10,000 sec.
• For certain aggregates, there is a second rapid increase in
absorption with respect to time (Keota II and Pints) beyond
100,000 sec ir.mners:ion.
• From the weight-in-water vs time plot (Figs. 28), one can determine
specific gravity and absorption following ASTM definitions and
equations for coarse aggregates, if oven dry weight of the
sample (A) is known, and if the weight of the sample in water
at time zero (Co) can be accurately extrapolated. The equations
for specific gravity and absorption will be
Apparent specific gravity (Ga) A =---
A - C
A Bulk specific gravity (Gb) = -A-----Co-
Absorption, io = C - Co
A x 100

where
57
A = oven-dry weight of sample in air, g
C = water of sample in water after 24 hr immersion, g
Co = water of sample in water at zero time, gm
(from weight-in-water vs time plot)
Bulk specific gravity and absorption can be determined this way without
trying to achieve the saturated-surface dry condition of the aggregate, of
which, for certain material, the reproducibility can be very poor. The
difficulty of this method is, of course, the accurate determination of Co.
This difficulty can be overcome with more sophisticated electronic digit
print-out balances such as Mettler PE series balance, with a BE control
unit which can be hooked up to a printer, paper tape punch, a card punch
or a recorder, or an Ainsworth digimetric weighing system Model 30D or
30DT with Model DP-6 data printer.
Absorption of cores and 3/8 in. laboratory crushed samples were
determined by this method. The results, together with those of the ASTM
method, are given in Table 12. The results were reasonably close for core
samples, but very poor for crushed and highly absorptive samples (Keota II).
The discrepancies were mainly from Co extrapolation and entrapped air in
crushed aggregate samples; both sources of error can be reduced by further
refinement of instrument and procedure.
Kerosene and Oil Absorption
In this investigation,a modified CKE method3s, 39 ,4o was used to determine
both the specific surface and the kerosene absorption of aggregates. The
revised method provides a procedure for predetermining the asphalt content
•

• •
•
------------ -- -
58
of a bituminous mixture by obtaining independently the surface area and
absorption of a composite aggregate sample. This method involves first
determining the specific surface (sq ft/lb) of the aggregate by wetting
with kerosene (without soaking) and determining the absorption by soaking
in kerosene for ten minute:s. Centrifuge conditions for both determinations
are 2 min @ 400 g. The standard California method38 was followed for oil
absorption by aggregates.
Both CKE and oil abso1r:ption were determined for several times at various
stages of this investigation by different individuals on fractioned samples.
The repeatability of these tests (especially CKE) were very poor. Slight
variation in the interpretation of the procedure will result in large dis-
crepancies. In addition, t:here was some difficulty in getting even reasonably
close results on minus No. 100 sieve fractions. This could be the contributing
factor in the poor correlation between kerosen-asphalt and oil-asphalt
absorption reported by another investigation. 37 Results of one of such CKE
determinations are given in Tables 13 and 14.
Limited studies on time-absorption and viscosity-absorption relation-
ships were conducted. The results of these are given in Table 15 and
plotted in Figs. 29 and 30. The ratios of oil absorption between Pints
and Menlo aggregates at 5 cP (300°F) was 2.7,whereas at 82 cP (68°F),
it was 2.0; the absorption ratio at 5 min absorption was 2.0, and at 1440 min,
absorption was 2.7.

59
Table 13. Results of CKE (HR-142)
Quarri crushed (Qqb
a Surf ace area Quarry Sample (sq ft/lb)
Menlo 1-S-C 1-S-Dl
Pints 2-L-C 2-L-Dl
Alden 3-L-C 3-L-Dl
Linwood 4-L-C 4-L-Dl
Cook 5-S-C 5-S-Dl
Keota 6-L-C 6-L-Dl
aSize fraction designations: A: -3/4 in. - +3/8 in. B: -3/8 in. - +/f4 C: -4f4 - +/tlOO D: -{flOO
Dl: -#100 - +/f200
bDuplicate samples
40.3 292.3
98.2 192. 7
57.0 125.3
35.0 264.5
79.5 236.6
52.8 179.0
Absorption (g/ 100 g)
0.26 6.06
0.62 9.20
0.15 5.01
0.32 5.43
o. 72 7.19
0.19 2.40
Lab crushed (LC)c Surface area Absorption
(sq ft/lb) (g/100 g)
34. 9 0.16 233.5 5.39
87.6 o. 71 184.6 8.91
54.4 0.23 129.0 5.08
36.0 0.20 244.0 4.34
68.0 0.73 173.3 6.88
63.0 0.24 201.0 3.09
cCorrelation coefficient r between QC and LC = 0.8864, significant at 5% level
Table 14. Results of oil absorption (HR-142)
Quarry Sample a Quarry crushed (QC)b
g/100 g
c Lab crushed (LC) g/100 g
Menlo 1-L-B Pints 2-L-B Alden 3-L-B Linwood 4-L-B Cook 5-L-B Keota 6-L-B
aSize designations: A: -3/4 in. - +3/8 in.
2.68 4.97 3.07 3.21 5.90 5.96
Al: +1/2 in. (-3/4 in. - +1/2 in.) A2: +3/8 in. (-1/2 in. - +3/8 in.)
B: +/f4 (-3/8 in. - +/f4)
b
2.63 4. 71 4.02 3.24 5.65 6.07
Average of duplicate determinations
cCorrelation coefficient r between QC and LC = 0.9551, significant at 1% level
•
•
•

60
Table 15. Oil absorption vs time and temperature
a oFb Aggregate Oil temp., Soaking
time, min Oil absorption, %c
A 68 5 5.19
c 68 5 4.63
KI 68 5 3.30
KII 68 5 12.50
L. 68 5 2.96
M 68 5 2.81 p 68 5 5.63
x 68 5 4.65
A 300 5 4.63
c 300 5 4.55
KI 300 5 5.32
KII 300 5 17.52
L 300 5 2.93
M 300 5 2.55 p 300 5 6.90
x 300 5 4.66
M 68 10 3.02 60 3.58
240 3.03 1440 3.16
p 68 10 6.07 60 7.39
240 8.16 1440 8.67
a Laboratory crushed, passing 3/8 in., retained on /fr4
bSAE /HO
cDuplicate determinations
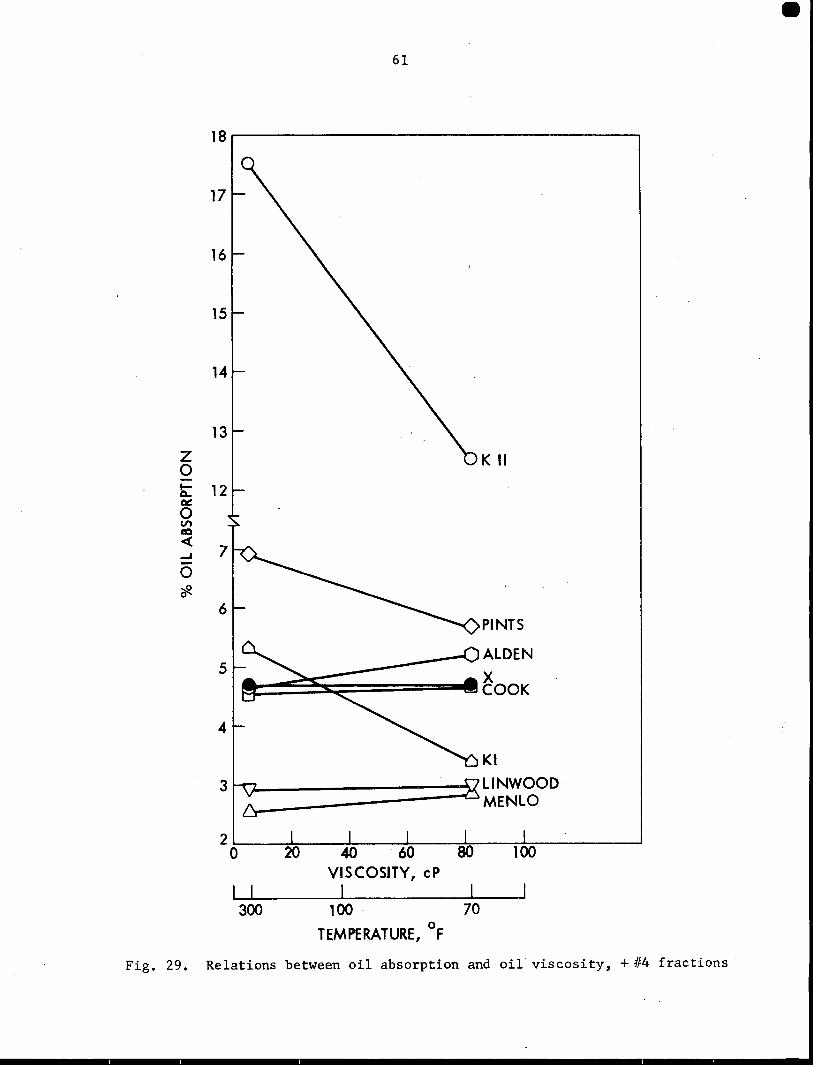
z 0 Ii: °' 0 V) m ~ ...... 0
*
17
16
15
14
13
12
6
5
61
K II
PINTS
ALDEN
x COOK
Kl
LINWOOD ~-------wMENLO
2~~~'=-~--'~~~~~......,,.i.,,...-~--L~~~~~--...1 0 20 40 60 80 100
VISCOSJTY, cP
300 100 . 70
TEMPERATURE, °F
Fig. 29. Relations between oil absorption and oil viscosity, +#4 fractions
•

z 0 8.0 -t: ~
06.0 V) GO < 54.0 '#.
62
0 MENLO 0 -0
2.o.__ __ ~1.----~~1.--~----J.___~----' 10 100
TIME, min
1000
Fig. 30. Relations betweep. oil absorption and soaking time, +if 4; fractions
Dye Absorption
The use of photo-colorimeter in measurement of aggregate absorption
37 capacity was first suggested by Lee.
The basic principle in colorimetry is that the amount of light
absorbed by a given species in solution is proportional to the intensity
of the incident light and to the concentration of the absorbing species
in the path of the light be.am.
For a specific substance, a given wavelength, and a constant length
of the light path through the sample (standard sample cell), the ratio
between the intensity, P, of a beam of monochromatic light transmitted
through a solution and the intensity of the beam, Po, transmitted through
the solvent is a function of the concentration of the solution, c. This
relationship, the Lambert-Beer law, can be expressed
Po Log = P =kc
or
1 Log = P/Po = kc

63
where log Po/P is defined as the absorbance of the sample and P/Po, the
transmittance of the sample. For substances that follow this law, it is
obvious that the absorbance or the logarithms of the reciprocals of the
transmittance is a linear function of concentration c. The Nefluoro-Photo-
meter used in this investigation was calibrated to read directly the
1 logarithmic value log P/Po X 100.
When a specific amount of aggregate is shaken and soaked in a specific
amount of asph~lt solution of known concentration, the reduction in asphalt
concentration due to absorption of the asphalt by the aggregate results in
a change in the light transmittance of the solution. The concentration
change, thus the asphalt absorbed or adsorbed, can be easily and quantitatively
determined by the colorimetric analysis with a concentration-log absorption
calibration curve.
Factors involved in this experiment include: (a) solvent, (b) optinrum
asphalt concentration, (c) filter combination, and (d) method of removing
aggregate from solution for colorimetric or light transmittance determination.
In this investigation the following procedure was used: A stock solution
of 1.000 g asphalt in 1 liter trichloroethylene was prepared and the light
transmittance concentration calibration curve was determined. Oven-dry
aggregates (100 g) were weighed into Erlenmeyer flasks. Two hundred
milliliters of 1 g/liter asphalt stock solution were added to the aggregates.
The flasks and contents were shaken for 3 min, allowed to set for 30 min
and shaken for another minute and set for 30 min. About 100 ml of the
solution was drawn from the flask and centrifuged, in a pear-shaped flask,
for 30 min at 400 g. About 20 ml of solution was carefully drawn from the
top of the settled aggregate with a syringe and transferred into a 1-in. cell.
•

64
Transmittance was determined using a 650 filter. (A cutoff filter was
also used to pass only thosE? wavelengths above 430 mµ. ) Concentration
was determined from the calibrated curves. Reduction in concentration
(or increase in light transtnission) was considered as loss of asphalt due
to absorption or adsorption by aggregate and was expressed in mg per 100 g
of aggregate. Alternative methods of filtering the solution through a
filter paper, asbestos filt1:!r or through a Buchner filter funnel were also
investigated. There was no difference in light transmission found for
asphalt solutions. However, there were difficulties in getting repeatable
results when dye solutions were used (see next section). Therefore, a
uniform centrifuge method was used for both methods.
Results of asphalt absorption by photo-colorimetric method are given
in Table 16.
Relative absorption capacity of aggregate by photometer method was
also determined using dye solutions. Two dyes were selected: methylene
blue and safranine T. Except for optimum concentrations and filter com-
binations, the procedures for dye absorption by photometer method was
essentially the same as that for asphalt absorption. In addition, time-
absorption relations were also studied. The results of these two series
of study are given in Table:s 17. Qualitative comparison of absorption
by the three photometer method in terms of absorptivity rankings are
given in Table 18. The results of the photometer method of dye solution,
especially methylene blue, are excellent. Correlation between absorption
by this method and other absorption methods will be discussed later. Certain
37 conclusions resulting from a previous study have been confirmed during
this investigation: (a) the photo-colorimeter definitely can be used to
evaluate the absorptive properties of aggregate, (b) the method is simple

· . ab photometer method ' Table 16. Asphalt absorption by
Wt. of d Date Source
c Log-abs. aggregate, g
3-4-71 Alden 100.04 102.5
3-4-71 Cook 100.01 63.0
3-5-71 Keota I 100.00 82.0
3-5-71 Keota II 100.00. 34.5
3-5-71 Linwood 100.04 1-00. 0
3-4-71 Menlo 100.02 lll.5
3-5-71 Pints 100.02 13.2
3-5-71 x(Alden II) 100.02 90.5
a A.C. 124-2; solvent = trichloroethylene
bFilters: Center 650 Right 430+ Left Diffuser
cLaboratory crushed, passing 3/8 in., retained on #4
d Average of three samples
Stock Abs. of Abs. of Asphalt
Cone. mg/l Asphalt mg/l (mg/100 g of aggr.)
ll53.4 288.4 57 .68
ll53. 4 638.4 127.68
1045.8 360.8 72.16
1045.8 785.8 157.16
1045.8 200.8 40.16
1053.4 106.4 21.28
1045.8 975.8 195.16
°' 1045.8 286.8 57.36 V1
•

Table 17a. Dye absorption by photometera(methylene blue)
Wt. of b Stock Source Aggr., g Cone. (g/l)
Alden 100.04 0.25043
Cook 100.03 0.25043
Keota I 100.02 0.25043
Keota II 100.02 0.25043
Linwood 100.04 0.25043
Menlo 100.02 0.25043
Pints 100.06 0.25043
x(Alden II) 100.04 0.25043
aFilters: Center 425 Right 430+ Left Diffuser
1 hr Abs of Dye
Log-abs. c (g/100 g aggr.)
113.0 0.0110
92.0 0.0182
122.0 0.0080
85.5 0.0204
129.0 0.0060
116.0 0.0100
43.0 0.0348
125.0 0.0.0.72
b Laboratory crushed, passing 3/8 in., retained on #4
c Average of three samples
Log-Abs. c
81.0
22.4
85.8
8.5
109.0
86.0
9.2
85.0
24 hrs Abs.of Dye
(g/100 g aggr.)
0.0220
0.0416
0.0204
0.0464
0.0126
0.0202
0.0460
0.0206
°' °'

Table 17b. Dye absorption by photometer (Safranine T)a
Source
Alden
Cook
Keota I
Keota II
Linwood
Men lob
Pints
Wt. of c
Aggr., g
100.01
100.03
100.03
100.02
100.01
100.00
100.01
Stock Cone. (g/l)
4.0002
4.0000
4.0019
4.0000
4.0014
4.0000
4.0019
x(Alden II) 100.02 4.0002
aFilters: Center 650 Right 430+ Left Diffuser
bPassing 4f4, retained on 4f8
cp . as sing 3/8 in., retained on #4
d Average of three samples
d Log-abs.
126.0
125.0
119.0
120.0
97.0
113.0
88.0
122.5
1 hr Abs. of Dye
(g/ 100 g aggr.)
0.0280
0.0360
0.0823
0.0740
0.2522
0.1300
0.3262
0.0560
d Log-Abs.
98.0
72.0
109.5
82.0
88.0
83.0
61.5
95.0
24 hr Abs. of Dye
(g/ 100 g aggr.)
0.2460
0.4440
0.1563
0.3720
0.3262
0.3640
0.5103
0.2700
°' .......i
•

68
Table 18. Rankings of absorption by photometer method
Safranine T Methylene Blue Asphalt a Rank 1 hr 24 hr 1 hr 24 hr 1 hr
1 A KI L L M
2 c A x M L
3 x x KI KI x 4 KII L M ·X A
5 Kl M A A KI
6 M KII c c c 7 L c KII p KII
8 p p p KII p
al . ncreasing absorptivity
and rapid; the instrument is standard, inexpensive and readily available;
and (c) the method can be applied to evaluate single-sized aggregates,
graded aggregates, as well as mineral fillers. No currently available
methods provide the means to evaluate the absorptive characteristics of
fillers.
~.sphal t Absorption
Several series of asphalt absorption tests were conducted during the
course of this investigation. Variables investigated included:
• Type and size of aggregate: Six major types, eight subtypes
(laboratory crushed), rock cores, fractioned as well as graded.
• Absorption methods:: Immersion method, bulk-impregnated specific
gravity and Rice specific gravity method.
• Asphalt type: from 91-127 pen.

69
• Temperature: 220-300°F.
• Time factor: Extensive time-absorption curves were established
for core samples, crushed 3/8 in. to #4 sieve fractions and
graded aggregates up to 100 days.
Four major series of asphalt absorption studies were carried out in
HR-142, each with different emphases:
Series A
The major purpose of this series of tests was to determine the
influence of asphalt type, aggregate type, method of measurement and pore
characteristics on asphalt absorption. 22 Rock cores from six major limestones
and two asphalt cements (91 and 127 pen) were studied by immersion and
bulk-impregnated specific gravity (Corps of Engineers) methods.
The immersion method used is essentially that developed by Goshorn
and Williams33 for coarse aggregates, with the exception that the rock
cores (about 250 g) were iIIDilersed in asphalt at 300°F (instead of 275°F)
for 1 hr only (instead of a total of 3 hr) and without cooling the
sample to room temperature and reheating it to 275°F before removing
the cores from the asphalt. It is felt that by this modification, the
time required to complete the test can be greatly reduced, the conditions
more nearly approach the field operation of hot mix,and the absorption should
be more indicative of the maximum or potential absorptive capacity of an
aggregate. A detailed procedure is described in Appendix D.
The procedure used in determining the bulk-impregnated specific
38 gravity (Gbi) is essentially that described by Ricketts et al. except
that 250 g of rock cores were used. For detailed procedure and calculation
of asphalt absorption, see Appendix D.
•

70
The results of absorption tests are summarized in Table 19. Each
value represents the average of two determinations.
Table 19. Asphalt absorbed by rock cores, wt %
BISG method Innnersion method Rock core Asphalt A Asphalt B Asphalt A Asphalt B
Menlo 0.30 0.30 0.59 0.59
Pints 2.01 2.27 2.11 2.47
Alden 0.91 1.08 1.20 1.31
Linwood 0.30 0.33 0.44 0.28
Cook 0.40 0.70 0.45 0.83
Keota 0.41 0.69 0.52 0.98
Absorption by bulk-impregnated specific gravity method. The percent
absorption varied from a low of 0.30 for Menlo cores to a high of 2.01
for Pints cores, using Asphalt A. Correlation of results of absorption
for asphaltsof different penetrations (A and B) were made. The correlation
coefficient is 0.9861, which is excellent. The equation of the regression
line is
y = 0.1111 + 1.07 x
where
Y =percent asphalt absorption (Asphalt B), and
X = percent asphalt absorption (Asphalt A).
The regression line suggests, as was found in HR-127, 37 the absorption
of higher penetration Asphalt B is somewhat higher than Asphalt A.

71
Asphalt absorption by immersion method. The percent absorption varied
from 0.44% for Linwood cores to 2.11% for Pints cores, using Asphalt A. The
correlation between absorption of two asphalts is very good, correlation
coefficient being 0.9504. The equation for regression line is
y = 0.0993 + 1.0912 x
where
Y = percent asphalt absorption using Asphalt B, and
X = percent asphalt absorption using Asphalt A.
Again, the regression line indicates a slightly higher absorption for
softer or lower viscosity asphalt.
Comparison of two methods. It shall be observed in Table 19 that the
absorption values from the immersion method are higher t·han those by BISG
method. Figure 31 shows the plot of percent absorption, by BISG
method vs same by the immersion method. The correlation is excellent
for both A and B asphalts used, correlation coefficients being 0.9883
and 0.9862, respectively. Equations for the regression line are:
Asphalt A, Y = 0.1788 + 0.9785 X and
Asphalt B, y 0.1523 + 1.0332 x
where
Y ~ percent asphalt absorption by innnersion method, and
X = percent asphalt absorption by BISG method.
37 In Fig. 31, regression lines resulted from HR-127 with quarry
crushed fractioned aggregates of considerably different nature were also
plotted. Despite the differences in two sets of materials, the regression
lines are surprisingly consistent.
•

.2.50 Asphalt 127-2 ,I Asphalt 127-1 . ~ O ASPHALT A
/ / ~ 6 ASPHALT B
/ ~
2.0 / ~o
// ~ (fl
/ ~ .. z
/ ~ 0 V> ~ IClll: y = o. 1523 + 1.0332 x w 1.5
/ ~ ~ r = 0.9862
~ ASPHALT B ~ / o~ z 0 '/r - 1.0 t: c¥ 0 V> co <( y :: 0.1788 + o. 9785 x
0.5 r =: 0.9883
ASPHALT A
0 0.5 1.0 1.5 2.0 2.50 3.0
ABSOR.PTION BY BULK IMPREG. SP. GR., %
Fig. 31. Asphalt absorption - BISG method vs innnersion method

73
McLeod36
considered the absorption values obtained by the BISG method
to represent the maximum or upper limit of bitumen absorption. But, from
this study, as well as results from HR-127, it is evident that the innnersion
method gives still.higher values which can be taken as the absorptive
potentials of aggregates in question. The values obtained from the BISG
method can be considered as "realistic" maximum value, which can occur
during mixing, hauling, spreading and cooling of the paving mixture, and
in service under traffic.
Accuracy of both the absorption tests is generally limited by
homogeneity of the aggregate and accuracy of the bulk specific gravity and
water absorption. But in this study, use of rock cores drilled out from a
single block sample has practically eliminated the first discrepancy. The
determin~tion of bulk specific gravity by the ASTM C-127 test gave excellent
reproducible results in case of rock cores, as the saturated surface dry
condition could be achieved uniformly by rolling the cores on cloth. The
results can be considered to be consistent as far as these limitations are
concernedo
It should be mentioned that the results of absorption tests performed
on uniform size rock cores (1/2 ino dia) with smooth round surfaces are
considerably lower than that from crushed aggregates obtained from the same
rocks since the surface capacity is comprised of the surface area, varying
with gradation and the roughness of the aggregates in addition to the
effective porosity.
Series B
This series of absorption tests were conducted in conjunction with
aggregate treatment tests (discussed later). The major purposes of this
•

74
:series of tests were to establish the absorption-time curves of eight
laboratory crushed and grade:d limestones and to evaluate the effectiveness
of sulfur treatments on these aggregates. The asphalt absorption was
determined by the modified Rice method (Appendix D) and absorption of
treated and untreated aggregates were determined from one day up to 135 days.
The results of these mixturE!S are given in Table 43 and plotte.d on a semi-log
,,,::d•'. hi Vlj!,:i. 63 - 70. The: following were observed:
• All absorption-time (A-t) curves approach an exponential relationship,
and can be represented by
bA t = ae
where
a and b are constants.
• Major absorption occ:urs during first 10-30 days and the
absorption levels off after about three months.
• The ratios between 100 day absorption and one day absorption
varied from 1.15-3.15, actual absorption increase varied from
O. 7-1. 2%. Regression analysis was made between absorption at
one d"ay and at 100 days. The equation for line of regression
is
where
y = 0.923 + 1.034 x
y = 100 day absorption, %
x = 1 day absorption, %
Correlation coefficient is O. 998 which is significant at the 17.
level.

75
• Asphalt absorption varied from a low of 0.5% for Linwood lime
stone to a high of 7.7% for Keota II. Absorption value is most
significantly affected by bulk specific gravity value of the
aggregate.
• Even though quantitative data are lacking, it is reasonable to
assume that many flexible pavements can fail (crack) through
delayed absorption by aggregate and loss of effective binder
in the paving mixture.
Series C
This series of asphalt absorption tests were conducted on rock cores
by innnersion method to evaluate absorption as affected by aggregate type,
asphalt viscosity (asphalt penetration and temperature), innnersion time,
and absorption time.
Fifty-six immersion tests were conducted with absorption determined at
the end of 2 hr, 24 hr, and 2 weeks. Bulk specific gravity of cores was
determined by the standard ASTM method. Asphalt cements of either 91 or
127 pen were heated in 1000 ml beakers to either 300°F or 220°F• Three
to five cores used for bulk specific gravity test were heated to asphalt
temperatures and suspended (in a wire basket) in asphalts for 1/2, 1, 2,
30, 60, and 120 min, respectively. Baskets with cores were removed from
asphalt at the end of the immersion or soaking period and suspended in an
oven at 275°F for 10-15 min or until the excess asphalt had drained off.
The cores were cooled to room temperature and weighed in air on an analytical
balance with a special attachment. Cores (with baskets) were weighed in
0 water at 77 F at the end of 2, 24, 48, 72 hrs and at the end of 1 and 2 weeks.
Asphalt absorption for each set of cores was calculated from the procedure
outlined in Appendix D. Results of the. 56 testsare presented in Table 20 and
are shown in Figs. 32.
•

t...1
1.9 ALDEN TYPE A .. C. 668
. TEMP. 300° F 1.7
~ 1.5 a. V)
< 1.3 -u.. 0 z 1.1 0 -t: 0.9 Ge: 0 V) 0.7 co < * 0.5
0.3
76
120 min
lmin
0.11--____ _._ ___ __. __ __.__...___._....._,_~ 1 10 100 200 300
TIME OF ABSORPTION, hr
Filg. 32a. Asphalt absorption vs time of innnersion and time of absorption, cores, Alden
2.8
t- 2.6 ...I
< :c 2.4 ~ < 0 2.2
z 2.0· 0 t: 1.8
°' 0 V) ca < '#-
1.6
1.4
1.2
COOIKS TYPE A.C. 668 TEMP 3<X/' F
120 min
60 min
5 min ---
l. 0 ....._ ____ _.__ ___ __.._ ____ ..__...._....____.. 1 10 100 200 300
TM Of> AISOIPrtON, hr Fig. 32b. Asphalt absorption vs time of inmersion and time of absorption,
cores, Cook

1--1
1.5
< J: 1 .4 c.. V)
< LL 1.3 0 z 0 1.2 I-c.. ~
0 1. 1 V) m < '?fl. 1.0
0.9
KEOTA I TYPE A.C. 668 TEMP. 300° F
'S K4
K6
K5
K2
1
77
10 TIME OF AISOIPTION, hr
20 min
60 min
30 min
5 min
1 min /2 min
JOO 200 300
Fig. 32c. Asphalt absorption vs time of immersion and time of absorption, cores, Keota I
10 KEOTA II 60 min
9. TYPE A.C. 668 I--I 0 < 8 - -TEMP 300 'F J: 0..
7 V)
< LL 6 0 z 5 0 I- 4 1 min 0.. ~
3 0 V)
cc 2 < 'Cf- 1
0 o. 1 . 1 10 100 200 300 TIME OF ABSORPTION, hr
Fig. 32d. Asphalt absorption vs time of immersion and time of absorption, cores, Keota II
•

78
LINWOOD
~.it. 668 'J.00°F ------ A.C. 1425 300°F -----·-·- A.C. 668 300°F
o.a .... 1 min -.J 0.7 -<( :J: 0.6 60 min 0.. VI L-2 -<( 0.5 z L-1 0 0.4 .... 0.. 0.3 a::: 0 VI 0.2 eD L-8 -<( L-3
*' 0. 1 L-s·
0 -9' 1 10 100 200300
TIME OF ABSORPTION, hr
Fig. 32e. Asphalt absorption vs time of immersion and time of absorption, cores, Linwood
....
....J
<
0.5
~ 0.4 VI -<( u.. 0 0.3 z 0
5 0.2 0 VI CIO -<( '?fl. o. 1
MENLO A.-<:. = 668
A.C. = · 668
T. = JOOOF A.C. = 1425-A T = JOOOF
· T :a:: 220°F' A.C. = 1425-A T = 2LJ0°F
M-2--------
10 TIME OF ABSORPTION, hr
100 200300
(M - 8) (M - 3) (M - 4)
Fig. 32f. Asphalt absorption vs time of itmnersion and time of absorption, cores, Menlo

~ .( 1.2
~ ~ 1.0 u.. 0 z .0.8 0 t: 0.6· 0:: 0 ~ 0.4 .(
~ 0.2
79
PINTS A.C. 668 T = ;300°F A.C. 1425 A T = 300 ------------. A.C. 668 T = 220 A.C. 1425 A T = 220 -----
P-7 ----------
0 '--~~~--1.~~~~_._~~~~_..___._.....L-~__, 1 10 100 200 300
TIME OF ABSORPTION, hr
Fig. 32g. Asphalt absorption vs time of iimllersion and time of absorption, cores, Pints
1.8
1.6 ..... _, < 1.4 ::c: 0. ..,, .( 1.2 u.. 0 z 1.0 0 - 0.8 ..... ~ 0 0.6 ..,, ~
< 'Cf. 0.4
0.2
TYPE A.C. 668 TEMP. 300°F
·x-4
X-3
120 min
60 min
X-5 1 min
X-6 ~~min X-1 :::;:::=--
' 10 100 200 300 TJME OF ABsov.r10N; hr
Fig. 32h. Asphalt absorption time of immersion and time of absorption, cores, X
•
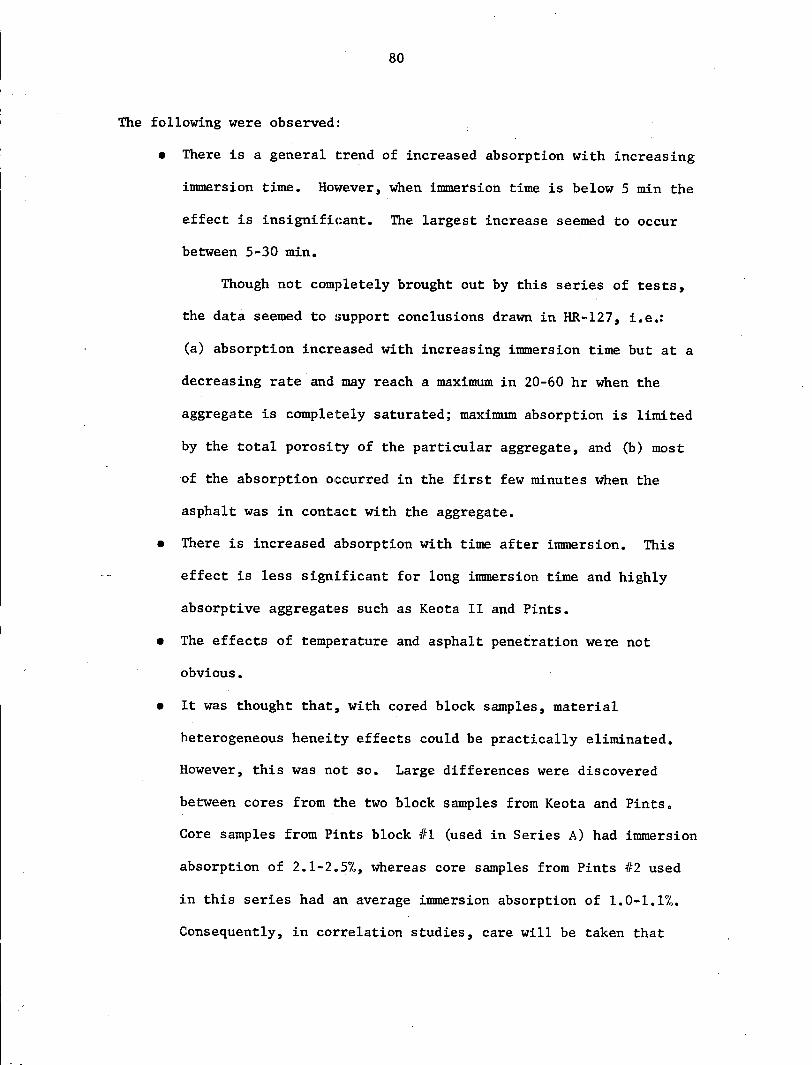
80
'I'he following were observed:
• There is a general trend of increased absorption with increasing
immersion time. However, when immersion time is below 5 min the
effect is insignificant. The largest increase seemed to occur
between 5-30 min.
Though not completely brought out by this series of tests,
the data seemed to support conclusions drawn in HR-127, i.e.:
(a) absorption incr1:lased with increasing immersion time but at a
decreasing rate and may reach a maximum in 20-60 hr when the
aggregate is completely saturated; maximum absorption is limited
by the total porosity of the particular aggregate, and (b) most
of the absorption occurred in the first few minutes when the
asphalt was in contact with the aggregate.
• There is increased absorption with time after immersion. This
effect is less significant for long immersion time and highly
absorptive aggregat·es such as Keota II and Pints.
• The effects of temperature and asphalt penetration were not
obvious.
• It was thought that, with cored block samples, material
heterogeneous heneity effects could be practically eliminated.
However, this was not so. Large differences were discovered
between cores from the two block samples from Keota and Pints.
Core samples from Pints block #1 (used in Series A) had immersion
absorption of 2.1-2.5%, whereas core samples from Pints #2 used
in this series had an average immersion absorption of 1.0-1.1%.
Consequently, in correlation studies, care will be taken that

81
only data from materials of same blocks or batches of aggregates
will be correlated.
In order to visually examine the effects of concern on asphalt
abHorption by immersion, photographs of sectioned and polished cores
tested in this series were taken. Figure 33 shows absorption differences
by aggregate type. Figure 34 shows effa'cts' of 'asphalt temperature.
Figure 35 shows effects of asphalt type •. Figtire: 36 shows effect of
immersion time on the seven major block samples. Figures 37-41 show
the photomicrographs of some of these cores, all magnified 136 times.
Scanning electron micrographs of asphalt impregnated and non-impregnated
Keota II core samples are shown in Figs. 42.
Series D
This series of absorption tests (22 samples) were similar to Series C,
except that only laboratory crushed limestones passing 3/8 in. and retained
on 414 sieve fractions were used. Immersion time was limited to 1 and 60
min. The results of these are presented in Table 21 and plotted in
Figs. 43. Observations made on cored samples in Series C are generally
true for crushed samples except that .absorption was much higher and effect
of immersion time, temperature, and asphalt type were more pronounced.
• •
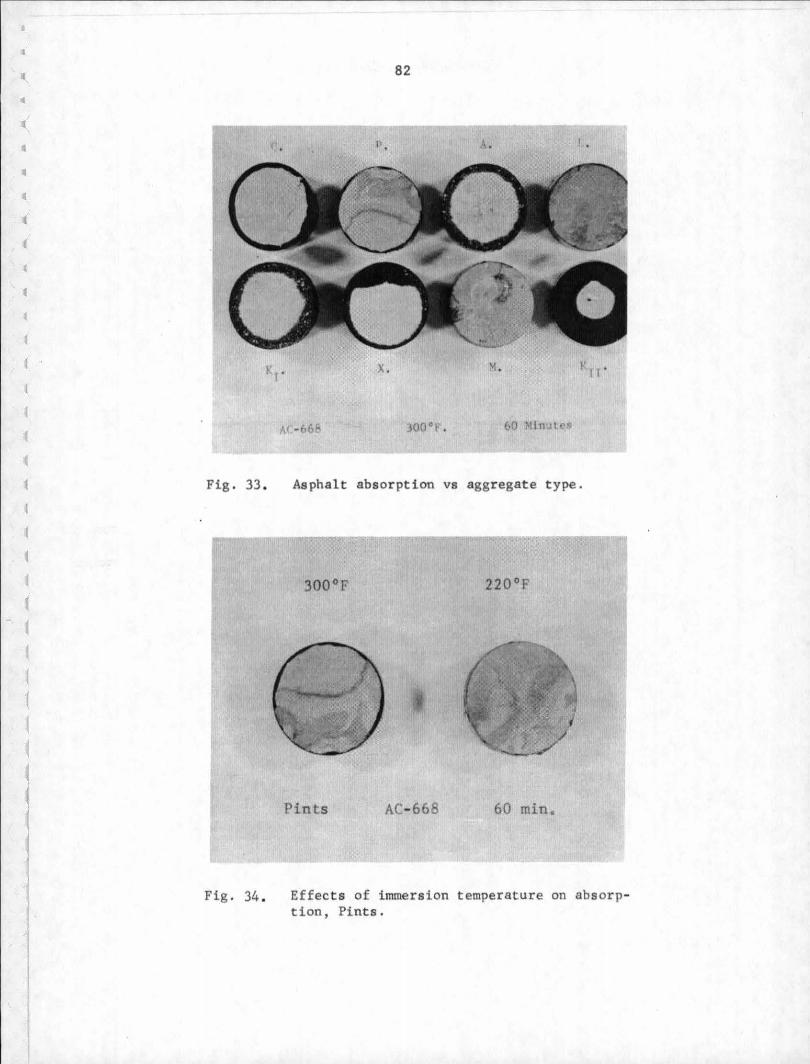
1l
II
(
• • " ' ' •
~ I .
Fig . 33 .
Fig. 34 .
82
"·
x.
300° .
\• ..
60 i 1l l~
Asphalt absorption vs aggregate type.
300°F 220°F
Pints AC- 668 60 min.
Effects of immersion temperature on absorption , Pints.

• I(
rfi
' • " • 4
(
'
' .
83
1425-A 668
Pints 300°F 60 min.
Fig. 35. Effects of asphalt type on absorption,
~ min .
30 min. Alden
min.
60 min .
300°P
5 min .
120 min .
AC- 663
Fig. 36a. Effects of immersion time on absorption, Alden .

• ii
II
I(
• • ' • • t
'\
84
\; min . min.
~ I f l
\J
30 min . 60 min . Cook AC- 668
5 min.
/ "" i (
~J
120 min.
300°F
Fig. 36b . Effects of immers ion time on absorpt ion, Cook.
1..z min .
30 min . Keota I
min .
60 min.
AC-668
5 min .
120 mi n .
300°1"
Fig . 36c . Effects of immersion time on absorption, Keota I.

c ,.
• c
If
If
(
.. •
(
)
Fig. 36d.
85
1 min. 60 min.
Keota II AC-668 300°F
Effects of immersion time on absorption, Keota II .
12 min . min. 5 min .
30 min. 60 min. 120 min.
Linwood AC-66~
Fig. 36e . Effects of immersion time on absorption, Linwood.

' .. -~ .. ~
~
' • • (
._
(
t (
• (
f
c
(
86
~ min. l min. 5 min.
30 min. 60 min.
Menlo AC-668 300°F.
Fig. 36£ . Effects of immersion time on absorption, Menlo.
1/2 1 5
40 60 120
Pints AC-668
Fig. 36g. Effects of immersion time on absorption, Pints.
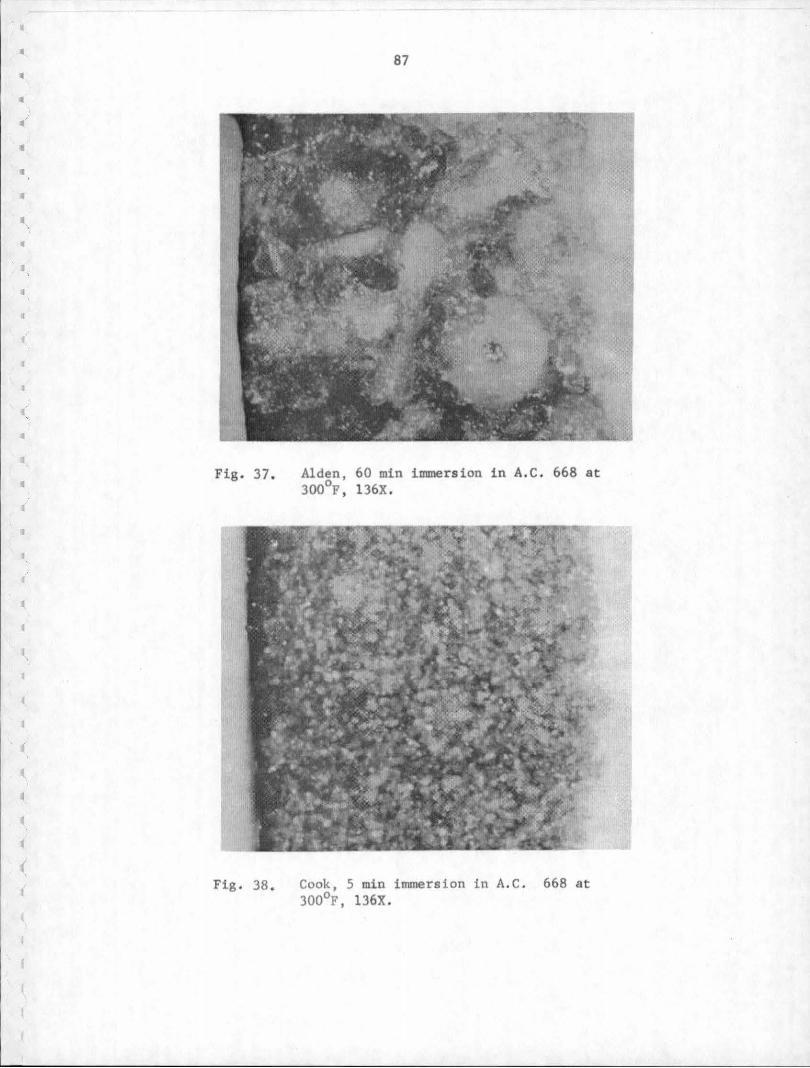
• • • • , • • • II
• • • •
•
•
• c
•
(
• ' (
(
'
Fig . 37 •
Fig. 38.
87
Alden, 60 min immers ion in A.C. 668 a t 300°F, 136X.
Cook, 5 min immersion in A. C. 668 at 300°F, 136X.

..
.. •
• ' (
' (
'
f
(
Fig. 39.
Fig. 40.
88
Keota II , 1 min immersion in A.C . 668 at 300°F, 136X.
Menlo, 60 min immersion in A.C. 668 at 300°F, 136X.

89
Fig . 41. Pints, 60 min immersion in A.C. 1425 at 300°F, 136X.
Fig. 42a. SEM, unimpregnated Keota II, lOOOX .
a .....
I
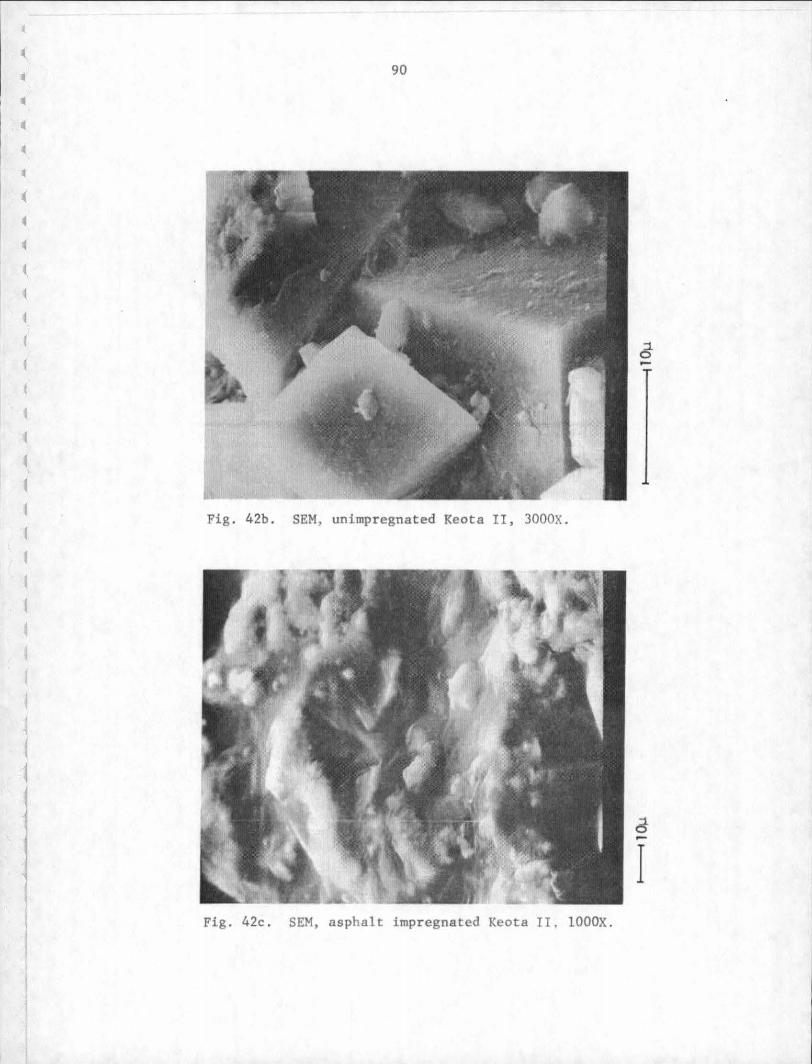
• (
• 90
• • • • (
c c 4
• 4
f ~ C>
Fig . 42b . SEM, unimpregnated Keota II, 3000X.
l a .....
I Fig. 42c . SEM, asphalt impregnated Keota II, lOOOX.
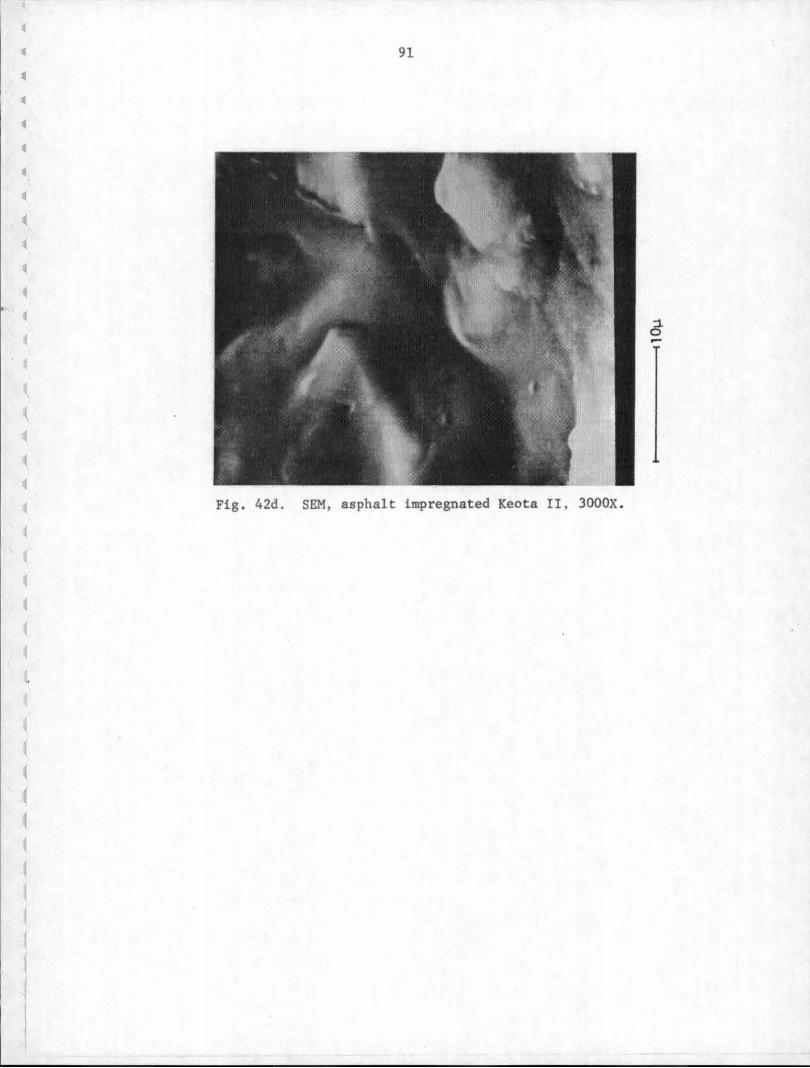
c 91
Fig. 42d. SEM, asphalt impregnated Keota II , 3000X .
:1 0 ....

....
7.0
6.0
5.5
~ 5.0 :::c: e; 4.5 < 0 4.0
~ 3.5
~ 3.0
~ 2.5 < '#. 2.0
1.5
1.0
0.5
A-2 C-2
A-1 ~
X-2~ C-1 "-----o--._.
X-1 n------0--.......
·o A.C. 688, 300 F 1 minD--<J
_60 mino--<>
A. C. 1425, 300°F 1 min----..
60 min---
L-2 ~ M-4_ . M-2
1 10 100 200 300 TIME OF ABSORPTION, hr
Fig. 43a. Asphalt absorption vs time of absorption and time of innnersion, + No. 4 fractions
A.C.668, 300 F, 1 mino--o 0 - 60min~
12. 22<>°F 60 min C>----(\
11.0 .... ~
~10.0 LI.. 0 z 0 9.0
ta: () ~ 8.0 -
'#.
7.01
.Co 1425, 3dd>F 1 m!n .__ -. 60 -min..__ 22<f'F, 60 min...-....
P-2 "'-----<r
P-3 6.0L..--___ _._ __ ~-'-----'--~-'----'
1 10 100 200 300
TIME OF ABSORPTION, hr
Fig. 43b. Asphalt absorption vs time of absorption and time of inunersion, + No. 4 fractions, Pints

26.5
t- 26.0 ....I <( :::c 0... V'l 25.5 <( LL.
0 z 25.0 0 t-0... ex 0 24.5 V'l co <(
cf. 24.0
23.5
93
SERIES D A.C. 668 TEMP 300°F
o-----l~m;,:.in:.:......--0
O 60 min ·O
K 11-1
10
TIME OF ABSORPTION, hr
100 200 300
Fig. 43c. Asphalt absorption vs time of absorption and time of ilIDllersion,
+ No. 4 fractions, Keota II
•

94
Correlations
Water absorption and asphalt absorption.
. 32 37 39 Efforts have been made in the past ' ' to correlate water
absorption of aggregates to asphalt absorption since the former is a
relatively very simple standard test. In this study, the linear correlation
coefficients for core samples (Series A) ranged from 0.8398 - 0.9341, as
compared to 0.874 - 0.956 found in HR-127. 37 Correlation coefficients
between water absorption (Table 12) and asphalt absorptions (Tables 20
and 21) are given in Tables 22 and 23.
Experience has shown that the water absorption is not a reliable
test for predicting asphalt: absorption due to noted exceptions. Bitumen-
water absorption ratios have been reported ranging from 1-100%. Aggregates
have been reported to show higher bitumen absorption than water absorption
in rare cases. 39 Differences in absorptions in case of different liquids
are expected since penetration of a liquid into aggregate pores (absorption)
is basically a capillary phenomenon influenced not only by pore size but
also the surface tension and contact angle of the liquid. However, water
absorption indicates the potential of asphalt absorption. Aggregates
having high water absorption are likely to absorb more asphalt than those
having low water absorption.
Porosity and asphalt absorption.
Extensive statistical analyses were undertaken to.find the pore size
range and other porosity characteristics whi.ch may have some correlation
with asphalt absorption. Absorption and porosity data for core samples
(Series A) were used to eliminate material error. Correlation coefficients
are given in Table 24.

• 95
Table 20. Asphalt absorption by cores
Time % Absorption a 0 Quarry A.C. Temp., F innnersed, min 2 hr 24 hr 2 wks
Pints 668 300 1/2 0.26 0.28 0.30 Pints 668 300 1 0.37 0.42 0.43 Pints 668 300 5 0.54 0.57 0.56 Pints 668 300 40 1.01 1.10 1.17 Pints 668 300 60 1.04 1.13 1.12 Pints 668 300 120 1.32 1.35 1.31 Pints 668 220 1 0.44 0.63 0.88 Pints 668 220 60 0.54 0.55 o. 72 Pints 1425 220 1 0.26 0.32 0.48 Pints 1425 220 60 0.88 0.93 1.02 Pints 1425 300 60 o. 94 0.94 .98
Alden 668 300 1/2 0.62 o. 72 .78 Alden 668 300 1 0.41 0.54 .42 Alden 668 300 5 o. 70 • 72 Alden 668 300 30 1.21 1.19 1.21 Alden 668 300 60 1.23 1.38 1.50 Alden 668 300 120 1. 71 1. 79 1. 90
Linwood 668 300 1/2 o.oo o.oo .07 Linwood 668 300 1 o.oo 0.09 .10 Linwood 668 300 5 o.oo 0.00 • 03 Linwood 668 300 30 0.12 0.07 .09 Linwood 668 300 60 o.oo 0.08 .10 Linwood 668 . 300 120 0.21 0.31 .26 Linwood 668 220 1 o.45 0.57 • 75 Linwood 668 220 60 o.54 0.46 .57 Linwood 1425 300 1 0.26 0.29 .36 Linwood 1425 300 60 0.23 0.18 .30
Keota I 668 300 1 1.04 1.03 • 94 Keota I 668 300 1/2 o. 92 0.92 .92 Keota I 668 300 . 30 1.21 1.25 1.20 Keota I 668 300 60 1.19 1. 25 1.23 Keota I 668 300 5 0.97 1.00 1.01 Keota I 668 300 120 1.44 1.58 1.57
X-Quarry 668 300 1/2 0.19 0.32 0.34 X-Quarry 668 300 1 0.47 0.60 0.61 X-Quarry 668 300 5 0. 26 0.25 0.38 X-Quarry 668 300 30 0.65 0. 71 0. 73 X-Quarry 668 300 60 0.97 1.09 1.15 X-Quarry 668 300 120 1.28 1.42 1.44
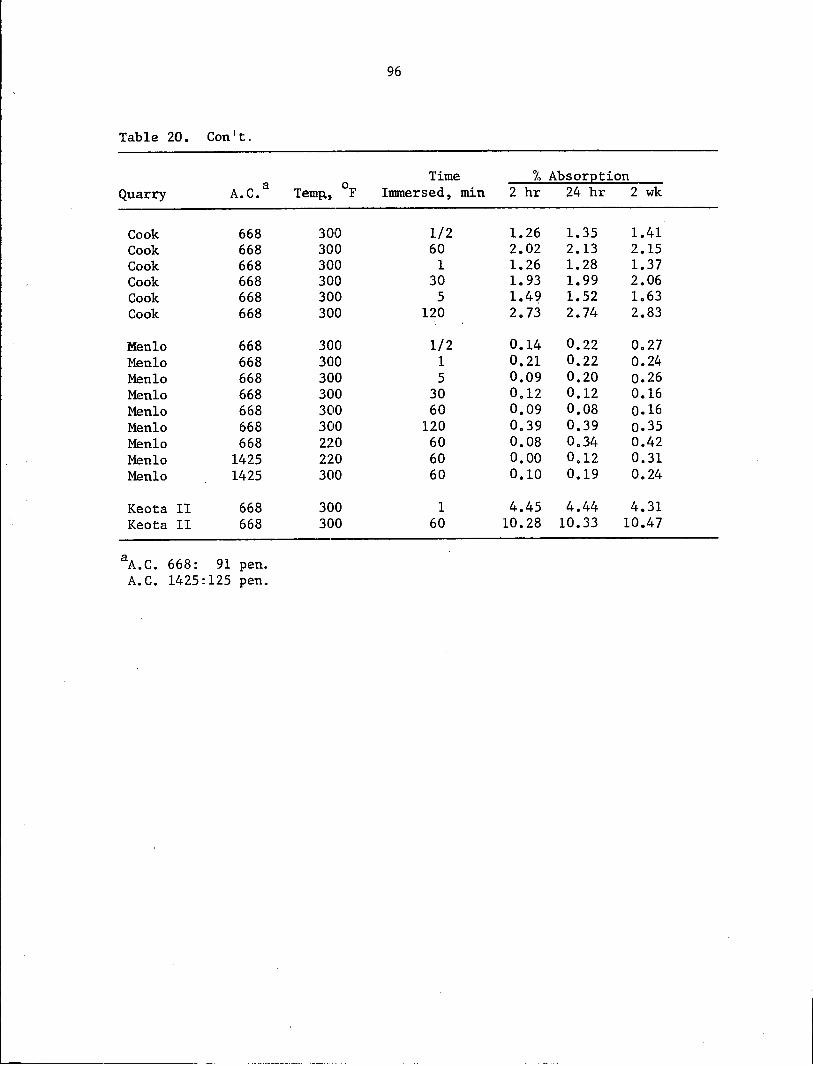
96
Table 20. Can't.
Time to Absorption a 0
Quarry A.C. Temp., F Immersed, min 2 hr 24 hr 2 wk
Cook 668 300 1/2 1.26 1.35 1.41 Cook 668 300 60 2.02 2.13 2.15 Cook 668 300 1 1.26 1.28 1.37 Cook 668 300 30 1. 93 1.99 2.06 Cook 668 300 5 1.49 1.52 1.63 Cook 668 300 120 2.73 2.74 2.83
Menlo 668 300 1/2 0.14 0.22 0.27 Menlo 668 300 1 0.21 0.22 0.24 Menlo 668 300 5 0.09 0.20 0.26 Menlo 668 300 30 0.12 0.12 0.16 Menlo 668 300 60 0.09 0.08 0.16 Menlo 668 300 120 0.39 0.39 o.35 Menlo 668 22:0 60 0.08 0.34 0.42 Menlo 1425 220 60 o.oo 0.12 0.31 Menlo 1425 300 60 0.10 0.19 0.24
Keota II 668 300 1 4.45 4.44 4.31 Keota II 668 300 60 10.28 10.33 10.47
a A.C. 668: 91 pen. A. C. 1425:125 pen.

• 97
Table 21. Asphalt absorption of +/f4 lab. crushed aggregate
Time Absorption,% 0 Quarry A.C. Temp., F immersed, min 2 hr 24 hr 2 wk
Cook 668 300 1 4.50 4.57 5.09 Cook 668 300 60 6.18 6.66 6.76
Alden 668 300 1 5. 71 5.89 5.95 Alden 668 300 60 6.47 6. 72 6.58
Keota I 668 300 60 0.16 0.31 0.52 Keota I 668 300 1 o.oo 0.02 0.17
X-Quarry 668 300 1 2.98 2.98 3.44 X-Quarry 668 300 60 5.06 5.07 5.55
Pints 668 300 1 7.54 7. 72 8.43 Pints 668 300 60 10.60 10.64 11.26
Linwood 668 300 1 0.12 0.04 0.16 Linwood 668 300 60 o. 92 1.00 1.21
Keota II 668 300 1 23.66 23.80 24.31 Keota II 668 300 60 25.98 25.80 26.26
Menlo 668 300 1 0.26 0.48 0.57 Menlo 668 300 60 0.48 0.53 0.67
Pints 668 220 60 6.36 6.16 7.23
Menlo 668 220 60 o.oo o.oo o.oo
Pints 1425 300 60 9.69 9.73 9.82
Menlo 1425 300 60 0.55 o. 77 0.90
Pints 1425 220 60 7.70 7.86 8.66
Menlo 1425 220 60 o.oo o.oo 0.04
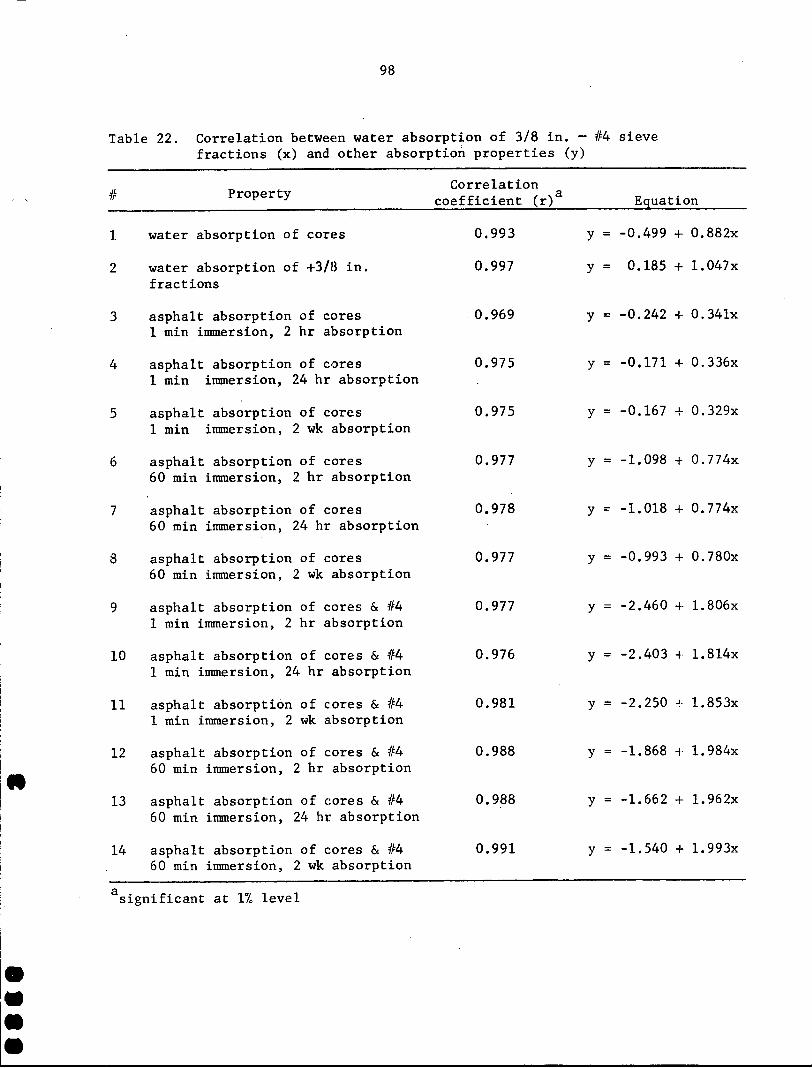
..
• • • •
98
Table 22. Correlation between water absorption of 3/8 in. -fractions (x) and other absorption properties (y)
# Property Correlation
coefficient (r)a
1 water absorption of cores 0.993
2 water absorption of +3/13 in. 0.997 fractions
3 asphalt absorption of cores 0.969 1 min immersion, 2 hr absorption
4 asphalt absorption of cores 0.975 1 min immersion, 24 hr absorption
5 asphalt absorption of cores 0.975 1 min immersion, 2 wk absorption
6 asphalt absorption of cores 0.977 60 min immersion, 2 hr absorption
7 asphalt absorption of cores 0.978 60 min immersion, 24 hr absorption
8 asphalt absorption of cores 0.977 60 min immersion, 2 wk absorption
9 asphalt absorption of cores & #4 0.977 1 min innnersion, 2 hr absorption
10 asphalt absorption of c.ores & 4fo4 0.976 1 min innnersion, 24 hr absorption
11 asphalt absorption of c:ores & #4 0.981 1 min immersion, 2 wk absorption
12 asphalt absorption of cores & #4 0.988 60 min immersion, 2 hr absorption
13 asphalt absorption of c:ores & 4fo4 0.988 60 min immersion, 24 hr absorption
14 asphalt absorption of c:ores & #4 0.991 60 min immersion, 2 wk absorption
a significant at 1% level
#4 sieve
Equation
y = -0.499 + 0.882x
y = 0.185 + 1.047x
y = -0.242 + 0.34lx
y -0.171 + 0.336x
y -0.167 + 0.329x
y = -1. 098 + 0. 774x
y = -1. 018 + O. 774x
y = -0.993 + 0.780x
y = -2.460 + 1.806x
y = -2. 403 + 1. 814x
y = -2.250 -! 1.853x
y -1. 868 + 1. 984x
y -1. 662 + 1. 962x
y -1. 540 + 1. 993x

99
Table 23. Correlation between water absorption of rock cores (x) and other absorption properties (y)
Property (y)
1 asphalt absorption, +#4 1 min immersion, 2 hr absorption
2 asphalt absorption, +114 1 min immersion, 24 hr absorption
3 asphalt absorption, +#4 1 min immersion, 2 wk absorption
4 asphalt absorption, + #4 60 min inunersion, 2 hr absorption
5 asphalt absorption, +#4, 60 min immersion, 24 hr absorption
6 asphalt absorption, + #4, 60 min immersion, 2 wk absorption
7 asphalt absorption of cores, 1 miri inunersion, 2 hr absorption
8 asphalt absorption of cores, 1 min immersion, 24 hr absorption
9 asphalt absorption of cores, 1 min immersion, 2 wk absorption
10 asphalt absorption of cores, 60 min immersion, 2 hr absorption
11 asphalt absorption of cores, 60 min immersion, 24 hr absorption
12 asphalt absorption of cores,
asignificant at 1% level
Correlation coefficient (r)a
0.990
0.989
0.992
0.995
0.996
0.996
0.946
0.950
0.950
0.977
0.979
0.979
Equation
y -1.401 + 2.054x
y -1.326 + 2.062x
y -1.169 + 2.104x
y -o. 833 + 2. 2s4x
y = -0.622 + 2.230x
y -0.511 + 2.262x
y 0.074 + 0.368x
y 0.125 + 0.364x
y = 0 .123 + 0. 356x
y -0.551 + 0.865x
y -0.480 + 0.866x
y = -0.460 + 0.874x
•
•
•

100
Table 24. Correlation coefficients for pore properties vs asphalt absorption
Properties
Value of correlation coefficients (r)
A:sphalt absorption (BISG), %
Asphalt absorption (Immersion),%
Asphalt A Asphalt B Asphalt A Asphalt B
Porosity range, µ
21-11
21-5
21-2
21-1
11-1
5-1
1-0.5
1-0.1
1-0.05
0.1-0.05
0.7-0.05
21-0.05a
Other Properties
·24-hr soaked porosity
Bulk sp. ·gr. of cores
Water absorption (%)
Percent mercury retained at 10 psi
aTotal effective porosity
bs · · f" 5"' 1 1 igni icant at m eve
-0.2902
-0.2738
-0.3233
-0.0294
-0.0020
0.0278
0.7063
0.7663
0.8063
0.7925
0.8208b
0.6248
0.8884b
-0.9358b
0.9014b
0.1400
-0.1970
-0.1831
-0.1903
0.1100
0.1296
0.1471
0.7563
0.8170b
0.8594b
0.8429b
0.8760b
o. 7136
0.9274b
o. 9341b
0.2055
-0.3361
-0.3099
-0.3903
-0.1380
-0.1056
-0.0722
0.6806
0.7247
0.7595
o. 7226
0.7708
0.5516
0.8238b
-0.8939b
0.8398b
0.0217
-0.1172
-0.1040
-0.1163
0.1038
0.1157
0.1246
0.7314
o. 7872
0.8331b
0.8566b
0.8518b
0.6907
0.9235b
-0.9750b
0.9280b
0.0852

101
It can be noted that the correlation is poor in 21-11, 21-5, 21-2, 21-1,
11-1 and 5-1 µpore size ranges. For the rest of the pore size ranges, the
correlation coefficients in decreasing order are given in Table 25.
Table 25. Correlation coefficients for non-normalized pore sizes
Porosity range, µ
0.7 - 0.05
1 0.05
0.1
1
1
21
0.05
0.1
0.5
0.05
(mercury intrusion porosity)
Range of correlation coefficients
0.8760 - 0.7708
0.8594 - 0.7595
0.8566 - 0.7226
0.8170 - 0.7247
0.756~ 0.6806
0.7136 0.5517
The range 0.7-0.05 µwas included in Table 25 since non-normalized
pore size distribution curves for all six rock cores indicated a range from
0.05-0.71 µfor the peak pore radius (most frequent pore radius). The
porosity in this range as determined by mercury porosimeter has excellent
correlations with asphalt absorption. This is closely followed by the
porosity in 1-0.05 µ range which is almost the same range for practical
purposes. Correlation coefficient between porosities in these two ranges
is 0.9987 (Table 7), which confirms this.
These ranges are then followed by the ranged 0.1-0.05 and 1-0.1 µ
which obviously add up to make 1-0.05 µ range. Since the porosity in
0.7-0.05 µrange has correlation coefficient of 0.9894 and 0.6510 with
porosities in ranges 1-0.1 and 0.1-0.05 µrespectively, it seems it is
mainly dependent upon the porosity of the former range.
•
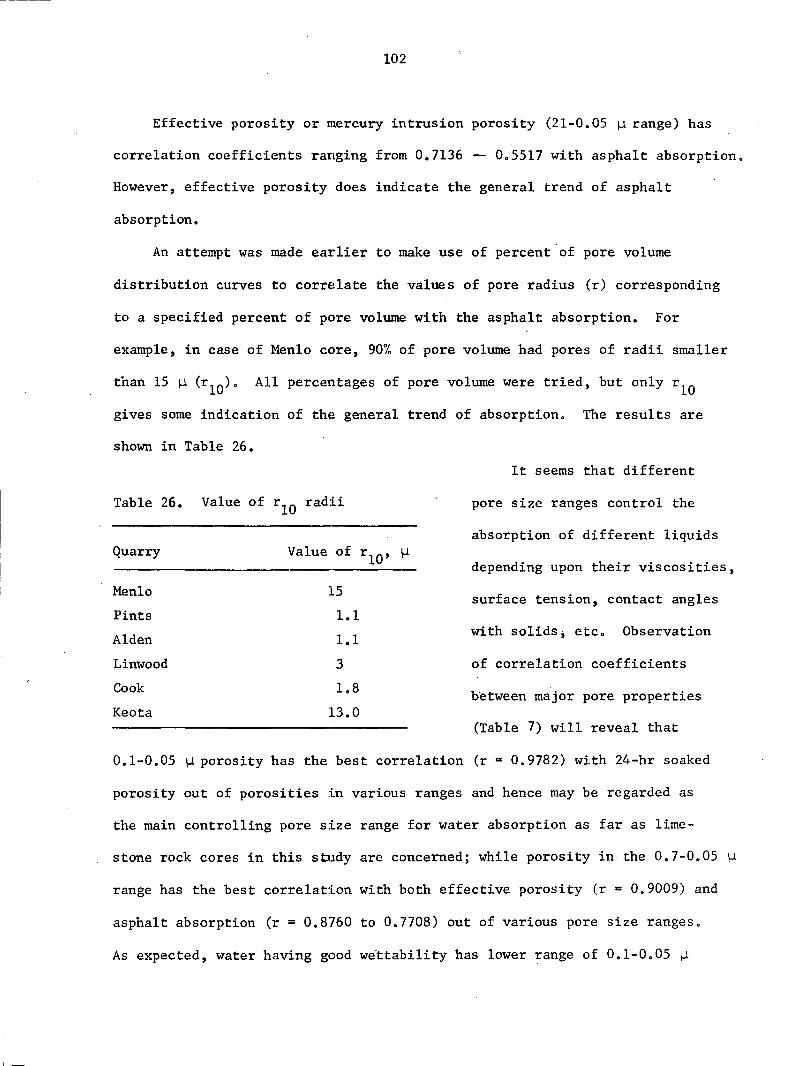
,_
102
Effective porosity or mercury intrusion porosity (21-0.05 µrange) has
correlation coefficients ranging from 0.7136 - 0.5517 with asphalt absorption.
However, effective porosity does indicate the general trend of asphalt
absorption.
An attempt was made earlier to make use of percent.of pore volume
distribution curves to correlate the values of pore radius (r) corresponding
to a specified percent of pore volume with the asphalt absorption. For
example, in case of Menlo core, 90% of pore volume had pores of radii smaller
than 15 µ (r10). All percentages of pore volume were tried, but only r10
gives some indication of thE~ general trend of absorption. The results are
shown in Table 26.
Table 26. Value of
Quarry
Menlo
Pints
Alden
Linwood
Cook
Keota
r 10 radii
Value of
15
1.1
1.1
3
1.8
13.0
rlO' µ
It seems that different
pore size ranges control the
absorption of different liquids
depending upon their viscosities,
surface tension, contact angles
with solids; etc. Observation
of correlation coefficients
between major pore properties
(Table 7) will reveal that
0.1-0.05 µporosity has the best correlation (r = 0.9782) with 24-hr soaked
porosity out of porosities :Ln various ranges and hence may be regarded as
the main controlling pore s:Lze range for water absorption as far as lime
stone rock cores in this sbidy are concerned; while porosity in the 0.7-0.05 µ
range has the best correlation with both effective porosity (r"" 0.9009) and
asphalt absorption (r = 0.8'760 to 0.7708) out of various pore size ranges.
As expected, water having good we.ttability has lower range of 0.1-0.05 µ

• 103
compared to asphalt having higher range of 0.7-0.05 µas the main controlling
range.
The equations for regression lines for the linear correlations with
0.7-0.05 µrange discussed above are presented in Table 27.
Table 27. Relations between asphalt absorption and 0.7-0.05 µporosity
Absorption Asphalt Equation for method type regression linea
BISG A y = 0.1294 + 0.135X
B y = 0.1977 + 0.1563X
Immersion A y = 0.3640 + 0.1255X
B y = 0.3362 + 0.1593X
~ = percent porosity in 0.7-0.05 µrange, and Y = percent asphalt absorption.
In all cases, correlations are better in case of Asphalt B having
higher penetration than Asphalt A. Also, absorption values obtained from
BISG method have better correlation with the porosity in the above pore
size ranges than those obtained from immersion test.
The following conclusions can be drawn from these pore size and
absorption correlations:
• Pore size distribution has direct effect on asphalt absorption.
To visualize this, Fig. 44 has been drawn to combine cumulative
pore size distribution of Menlo and Pints cores on same scale.
Considerable difference in asphalt absorption between these two
types of rock cores is reflected by the significant variation
between the two curves. This is also evident in Fig. 45, which
combines hysteresis in mercury porosimetry of Menlo and Pints cores.
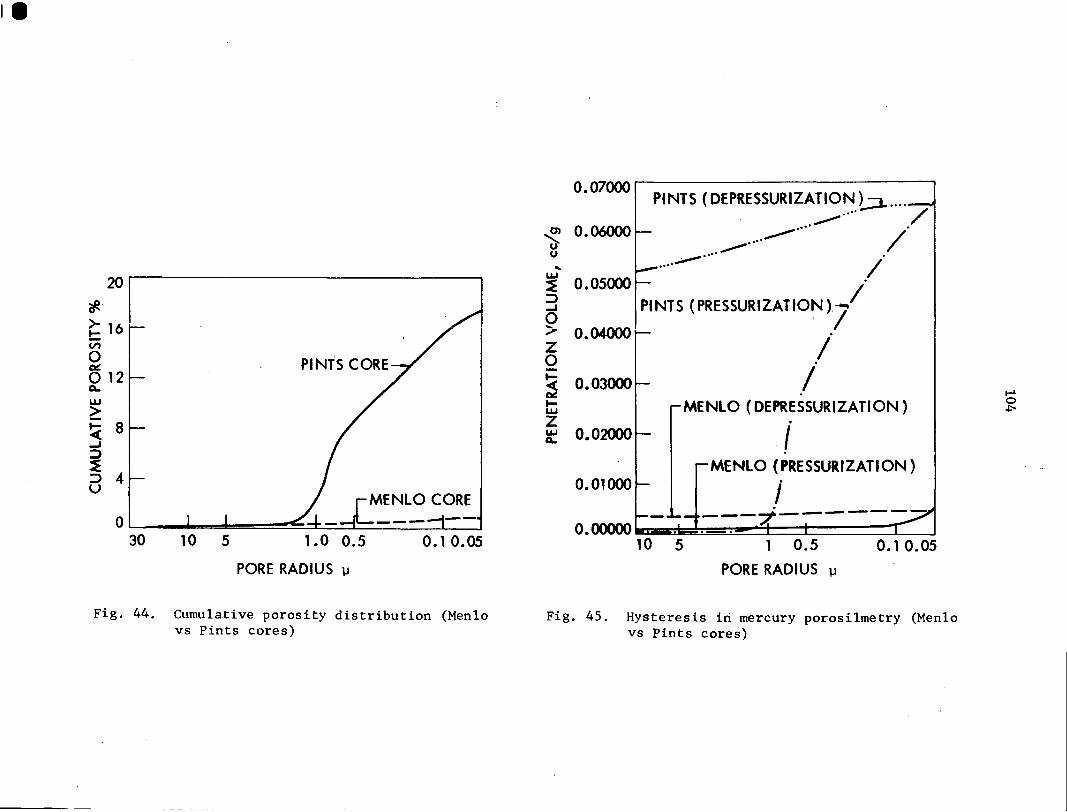
'if.· 20 I
>- 16 t:: V'I
0 ~
0 12 a.. w ~ ~ 8 ...J
~ ::> 4 u
PINTS CORE
OL------' ....... """""~~~=..::1=-=~=-===~__JL__J 30 10 5 1.0 0.5 0. 1 0.05
PORE RADIUS µ
Fig. 44. Cumulative porosity distribution (Menlo vs Pints cores)
0.07000 PINTS ( DEPRESSURIZATION b ....
_.-···· / ,m 0.06000 ---···· /. CJ- .--···· u ....
.. ····--- I ~ 0.05000 I ~ PINTS (PRESSURIZATION).7
~ o.04000 I 0 s 0.03000 I tu MENLO ( DEPRESSURIZATION) z ~ 0.02000 . /
MENLO (PRESSURIZATION) 0.01000 i ---'7.--------0. 00000 l.:m..S~e::!!~±:=:::±::====::::::ic___J
10 5 1 0.5 0.10.05
PORE RADIUS µ
Fig. 45. Hysteresis iri mercury porosilmetry (Menlo vs Pints cores)

105
• Porosity in 0.7-0.b5 µsize range has a direct effect on asphalt
absorption. The relation is linear. Difference between absorption
of Asphalt A and B gets larger as porosity in 0.7-0.05 µrange
increases.
• Pore size in the 0.1-0.05 µseems to determine the amount of water
absorption.
• Effective porosity indicates a general trend of absorption of
asphalt. Cores having more effective porosity (mercury intrusion)
are likely to absorb more asphalt and vice-versa, provided the
internal structure of the.rock is not altered during mercury
intrusion test.
• Percent mercury retained in the ro.ck cores after depressurizing
to 10 psi does not have any correlation with asphalt absorption
(Table 24).
Asphalt Absorption by Photometer
Correlations between asphalt absorption by photo-colorimeter method
and dye absorptions and asphalt absorption by innnersion (Series C and D)
are given in Table 28. Correlation coefficients between asphalt absorption
and methylene blue absorption at 1 and 24 hr are 0.924 and 0.941,
respectively, which are excellent (significant at 1% level), which also
confirm the ranking table (Table 18) presented earlier. Correlation
coefficients between asphalt absorption by the photometer method and the
immersion method are from 0.652 to 0.817 (d.f. = 6).
Correlation coefficients between methylene blue absorption and asphalt
absorption of corresponding laboratory crushed and fractioned aggregates
of one minute immersion, 24 hr absorption and 60 min immersion, 24 hr
•

Table 28. Correlation between asphalt absorption by photocolorimeter method (x) and other absorption properties (y)
Correlation No. Property (y) Coefficient (r) Equation
1 Dye absorption, MB, 1 hr O. 924a y = 0.0012 + O.OOOlx
2 Dye absorption, ST, 1 hr 0.295 y = 0.0775 + 0.0005x
3 Dye absorption, MB, 24 hr O. 941 a y = 0.0099 + 0.0002x
4 Dye absorption, ST, 24 hr n .,;. C::'> v = 0.2361 + 0. OOllx VeVJL. ,,
5 Asphalt absorption, cores, 0.817a y = -0.430 + 0.019x 1 min immersion, 24 hr absorption
6 Asphalt absorption, cores, 0.672 y = -0.882 + 0.036x 60 min immersion, 24 hr absorption
7_ Asphalt absorption, cores, + #4, 0.652 y = -1. 872 + 0.083x 1 min immersion, 24 hr absorption
8 Asphalt absorption, cores, + #4' 0.709a y = -1.689 + o.096x 60 min immersion, 24 hr absorption
aSignificant at 5% level
...... 0
°'

Table 29. Linear correlation coefficients (r) between asphalt absorption by immersion
Cores + #4 fractions
1 min immersion 60 min immersion 1 min immersion 60 min immersion Absorp- 2 hr 24 hr 2 wk 2 hr 24 hr 2 wk 2 hr 24 hr 2 wk 2 hr 24 hr 2 wk ti on (Xl5) (Xl6) (Xl 7) (Xl8) (Xl9) <x20) (X21) (X22) (X23) (X24) (X25) (X26)
Xl5 1.0000
xl6 0.9993 1.0000
xl7 0.9986 1.0000
x18 0.9875 1.0000 t-' 0 .....i
xl9 o. 9651 0.9998 1.0000
xzo 0.9618 0.9997 1.0000
x21 0.9273 0.9790 1.0000
x22 0.9271 0.9797 0.9999 1.0000
x23 0.9324 0.9800 0.9991 1.0000
x24 0.9340 0.9719 9.9949 1.0000
x25 0.9335 0.9709 0.9945 0.9997 1.0000
x26 0.9372 o. 9716 0.9926 0.9997 o. 9996 1.0000
•

108
absorption, are 0.730 and 0.773, respeatively, both are significant at
the 5% leve 1.
It appears that the simple and rapid dye absorption test using
methylene blue and photocolorimeter can definitely be used to evaluate
asphalt absorption.
Asphalt Absorption by Immersion Method
Correlation coefficients (r) between 2 hr asphalt absorption results
in Series C & D were calculated and given in Table 29. Even though r
values are much higher for correlations within same series, cross-series
correlations are also excellent (significant at 1% level). This means,
when adequate data are available, absorption at one condition and time can
be used to predict asphalt absorption at other conditions and time.
Field Study of Aggregate Absorption
As planned in the proposal, field study of absorption effects was to
be conducted in the second phase of HR-142. It was proposed that four
test sections of surface mixtures using absorptive aggregates of varied
absorptive capacities (but without compensation of absorbed asphalts) would
be laid as parts of regular construction projects during the 1968 construction
season and the following parameters would be studied:
• Nature, occurrence, and frequency of cracks that may be observed
at six-month intervals.
• The absorption history determined by the Rice method from point
to pavement and at six-month intervals.
• Hardening and chemical changes in the asphalt at six-month intervals~

109
On August 6, 1968, Mr. Stephen E. Roberts, Research Engineer of the Iowa
State Highway Commission, sent letters to nine county engineers (Butler,
Decatur, Dubuque, Floyd, Mahaska, Sac, Wapello, Webster and Hardin Counties)
asking for cooperation in the program. Subsequently, on September 11, 1968,
letters were sent to the same county engineers by the principal investigator
of Project HR-142, explaining the detailed field study program proposal.
While some of the counties responded, none could participate in the program
either because it was too late in the season or because no absorptive
aggregates would be used in their paving projects. It was hoped that field
study could be conducted during the 1970 construction season on either state
or county paving projects. However, this again was not possible.
Nevertheless, absorption history has been studied on one asphalt surface
project at Iowa State University laid on September 28, 1968. Aggregates used
for the project were blends of 70% Cook's quarry 3/8-in. limestone and 30%
concrete sand. Upon extraction, it was found that the asphalt content was
8.5% and the gradation of the aggregate was as shown in Table 30.
About 20 lb of the mixture was collected at the paver on September 28, 1968.
Rice specific gravity of the mixture has been determined at regular intervals.
Calculated asphalt absorption up to 1000 days is shown in Fig. 46, which
clearly shows the increased asphalt absorption at a decreasing rate up to
a year.
•

"#. z 0 ~ ~
0 VI CID -c: .... _, < :r. A. Vl.
<
110
Table 30. Gradation of 1968 surface
4.00
3.00
2~00
1.00
Sieve
3/8 in.
:/f4
:/f8
:/f30
:/f50
:/flOO
:/f200
Bulk Specific Gravity
2 10
TIME (days)
Fig. 46. Asphalt absorption vs time
% Passing
99.0
77. 9
61.5
29.9
13.0
6.9
6.3
2.374
100 144 204 368 1000

111
TREATMENT STUDIES
Summary
This chapter describes preliminary laboratory investigations under
taken to determine the most promising types of agents for absorptive
aggregate treatment. The major objective at this time was to find what
classes of chemicals will give·the desired results. It is hoped that
follow up work can be initiated to find agents most easily and economically
applied, making the absorptive aggregates suitable for highway work. In
this phase of work, practicability of application and economy were not
controlling factors, although in later phases these considerations shall
play a major role.
Five classes of agents were investigated in this project: (a) industrial
wastes, (b) polymers, (c) synthetic resins, (d) inorganic chemicals, and
(e) bituminous materials, each of which has advantages and disadvantages
shown later in terms of effectiveness in water absorption reduction, asphalt
absorption reduction, and relative costs.· None of these fields has yet
been exhausted. Efforts have been made, where possible, to suggest potential
agents and references to related studies, especially soil stabilization
studies, so further studies can be made.
Approach
One of the major objectives of this project was to investigate the
possibility of utilizing absorptive but otherwise available and suitable
aggregates. One approach in using absorptive aggregates in high-~ype
asphalt paving mixtures is to treat the aggregate (prior to or during
mixing with asphalt) with certain chemicals to reduce absorption, to
•
112
make binder content determination more reliable, and to avoid mixture
deterioration due to excessive and selective absorption (adsorption).
The materials used in these treatments will achieve absorption
reduction by: (a) changing the surface character~stics of the aggregate,
(11 J 1w11 If llK tl11· tll{Kr<~~11tn pores, (c) filling the aggregate pores, or
(c..I) comhlning any of the above.
In order to serve this purpose, the chemicals or resulted end
products of the treatments should be: (a) easily applied and no major health
or other hazards, (b) effective iri small quan.tities, (c) heat resistant
to at least 200°c, (d) waterproof and water resistant, (e) resistant to
freeze-thaw and volume change cycles, (f) resistant to chemical attack
(in~rt), (g) good cementing agents and able to establish a strong bond
with natural aggregates, and (h) readily coatable with bituminous materials.
Certainly, cost of the chemical should be a major factor in determining the
feasibility of using the chemical. However, it should be included in a
total economic consideration of certain projects comparing availability of
other quality aggregates, hauling costs of such aggregates, etc. Consequently,
the cost was not a majo_r consideration in selecting chemicals. Rather it was
concerned with available chemicals and aggregates and how best to treat them.
Table 31 suggests some 40 chemicals that may have the potential of
being used for aggregate treatment. About two-thirds of the listed chemicals
were obtained and/or investigated in the study.
Not included in the table, but certainly having potential because of
their uses in other film and coating applications, are polymers of all
kinds such as polyethylene (10¢/lb), polypropylene (20¢/lb), styrene-butadiene
rubber (SBR, 17¢/lb), various acrylic polymers, and PVC (polyvinyl chloride,
14¢/lb). Also deserving consideration are various thermosetting resins which

113
change irreversibly under the influence of heat from a fusible and
soluble material into one which is infusible and insoluble through
the formation of cross-linked, thermally stable network. These in
clude phenolic resins (22¢/lb), amino resins (32¢/lb), epoxy resins
(47¢/lb), and silicone resins, etc.
Materials and Procedures
Three major series of chemical treatment experiments, all in lab
oratory scales, were conducted during this project. Materials and proce
dures involved in each series are as follows:
Series A
Two aggregates were used (Cook and Menlo), both graded (Grading A,
Table 32).and core cylinders of 1 and 1/2 in., in conjunction with two
asphalt cements (142-1 and 142-2) and four chemicals (aniline, furfural,
Armac T, and methyl methacrylate). The properties of these chemicals are
given in Tables 33 - 35. Not including screening and preliminary tests
for mixing and curing conditions, a total of 16 treatments (2000 g mixtures)
and 8 sets of treatment on cores, and 25 batches of asphalt concrete mixes
made with treated aggregates, 20 lb each, were made. (See Ref. 94 for
detailed procedures.) Treatments included 2:1 aniline furfural from
0 - 9% on graded aggregates and cores, Armac T (0 - 8%) on graded aggregates
and cores, and impregnated methyl methacrylate treatment of cores by both
thermal catalytic and gannna irradiation polymerizations.
Before the treatment of cylindrical rock cores with methyl methacrylate,
preliminary investigations were made regarding impregnation and polymerization
techniques.
•

114
Table 31. Potential materi.als for aggregate treatments
Material
la Acrylic polymer Rhople1x HA8 lb Acrylic polymer Rhople1x HC-4530 le Acrylic Polymer Rhople1x E-330;
2 Ja Jb 4 s 6 7a 7b 7c Ba Bb Be 9
10 11 12 lJa 13b 14 15 16 17 lB 19 20a 20b 20c 21 22 23
24
26
26a
26b 27 2B 29 JO
31 32
33 34 35 36a 36b 36c 36d j7 38
39 40 41 42 43 44
Acrylonitrile Alnsco Res 3001 Alnsco Res 3004 Aniline
E-460
Armac T (Redicote E-~f) Arquad 2HT (Redicote ~:-45) Araplaz H- 95 Aroplaz 1254-H60 Aroplaz 1453 x SO Asphalts emulsion Asphalt cements Asphalt cutbacks Calcium acrylate Calcium chloride/sodium chlod~e Furfural Fly ash Gantrez resins HY-0,L,.H,R Gantrez resins AN-139,, 149 Lignins (Lignosulfonal:e) Lime Ca(OH) 2 cao Methyl Hethacrylate Methyl acrylate, ethyl acrylate NVX (Neutralized Vinsol rellin) Polyacrylic acids Polyvinyl alcohol (PVA) 52-22 Polyvinyl alcohol (PVA) 70-05 Polyvinyl alcohol (PVA) 71-30 Polyvinyl acetate Phosphoric acid Phenol - formaldehyde resins
(resionex) Resorcinol - formaldehyde resins
(amberite) Resin 321
(qum resin• sodium rosinate • 3:1) Rosins K-101
(a rosin modified phenolic) Rosin K-1010 (phenol11c) Rubber, latex (anmoni1sted) Super floe Styrene (polystyrene) Stabinol (portland ce1nent + complex .
· resins • 3: 1) Soilpak Silicone& and related material•
(e.g. silicone ru~ber) Sulfur Silicates (•odium or potaaaium) Stabilizer AH-955 (AH-9) Siroc Ill (base) Siroc 12 (reactor) Siroc 13 (accelerator) Siroc 14 (accelerator) riirs Urea - formaldehyde resins
(uformite) Vinyl acetate maleic acid (VAHA) Vinsol resin Sodium carbonate Shellac Epoxy resins Polyesters
Furfural
p20'i Aiiiml>nium perpulfate, sodium thiosulfate
Aniline Lime
Sodium or p9tassium dichromate
THPTHA, benzol peroxide Benzol peroxide
Sodium fluosilicate Catalysts
Catalysts
THPTHA + benzoyl perioxide
CaO, CaC12, Hg Cl2
Catalysts Reactor and accelerator

Table 31. Cont'd.
!!. la 15¢/lb lb 17¢/lb le 17¢/lb 2 $2.20/kg 3a 13¢/lb 3b .12.5¢/lh 4 $8.00/gal 5 31c;/lb 6 26¢ /lb 7a 18¢/lb 7b 21. 1¢ /lb 7c 14.5¢/lb
9 $19.50/kg
11 $4.00/kg
l3a $1. 72/lb l3b $1.01/lb 14 6¢/lb
16 45¢/lb 17 $2.20/lb 18 10¢ /lb 19 $3.00/kg 20a 55¢/lb 20b 51¢/lb 20c 45¢/lb
26a 25¢/lb 26b 38. 5¢ /lb 27 $3.50/gal
29 15¢/lb
32 $30/gal 33 2.6¢/lb
35 60¢ /lb 36a 33¢/gal 36b $1.60/gal 36c $6.50/cwt 36d $32/cwt
40 7 .5¢/lb
Rohm and Haas Co. Rohm and Haas Co. Rohm and Haas Co.
Union Oil Co. of Calif. Union Oil Co. of Calif. IL I. du Pont Armour Industrial Chemical Armour Industrial Chemical Ashland Chemical Co. Ashland Chemical Co. Ashland Chemical Co.
Borden Chemical
G.A.F. Corp. G.A.F. Corp. Scott Paper Co.
Borden Chemical Hercules Inc. Boi:den Chemical E. I. du Pont E.I. du Pont E. I. du Pont
Monsanto Rohm and Haas Co. Hercules Inc. Lawter Chemicals Inc. La~ter Chemicals Inc. Heveatex Co. Fisher Chemical
Dow Chemicals Stauffer Chemical Co. Philadelphia Quartz Am. Cyanamid Co. Raymond International Inc. Raymond International Inc. Raymond International Inc. Raymond International Inc.
Hercules Inc.
115
Reference
58 58 58 42,59,71 84,86
49,50,8la 79 42,43,67
86-92 86-88 86-88 53,54,63,70,73,82,84 73,78 49,50 73,74
52,65,66,81 51,73,92 48 84,87 56,73,75,81 41,42,43,67 41,42,44,72,81 41,42,44,72,81 41,42,44,72,81 41,42,80 68 • 7 7 • 84 -92 49,56,73 56,73 81,56,73,75,J.6
81 41,42 42,48,86 56,73,75,81 56 42,54,55,63,82 63,81 41,42,45,61,63,73,81,90,91 62,63,64 .
49,56,73,82 41,42,46,47,69,71 56,73,75,81 81 82 85,86,88 86,87
Remark
Resin emulsions Resin emulsions; cement modifiers Resin emulsions; cement modifiers
Polyvinyl acetate emulsion Polyvinyl acetate emulsion
Amine ~cetate Quaternary ananonium chloride Hammer resin Architectural resin Low cost enamels
Salt of abietic acid
Acrylamide Modified sid. silicate Amide Calcium chloride Sod. Alluminate
•
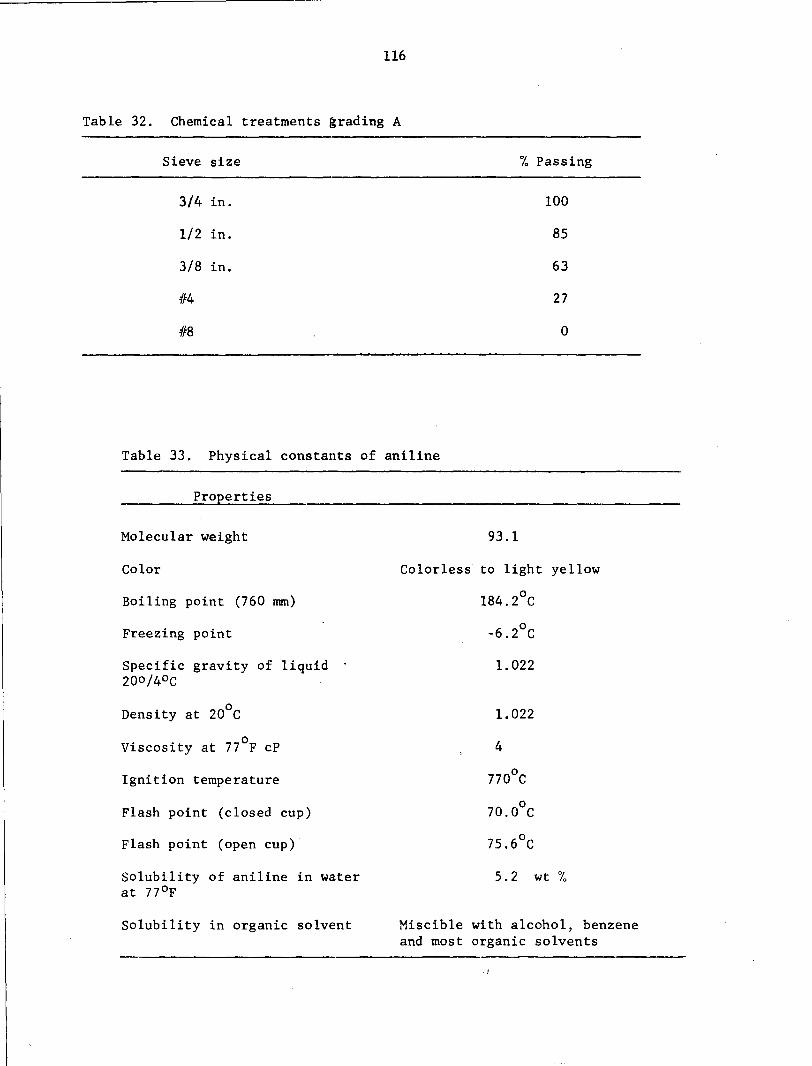
116
Table 32. Chemical treatments 1~rading A
Sieve size % Passing
3/4 in. 100
1/2 in. 85
3/8 in. 63
4fo4 27
0
Table 33. Physical constants of aniline
Properties
Molecular weight
Color
Boiling point (760 nnn)
Freezing point
Specific gravity of liquid · 200/4°c
Density at 20°c
Viscosity at 77°F cP
Ignition temperature
Flash point (closed cup)
Flash point (open cup)
Solubility of aniline in water at 77°F
Solubility in organic solvent
93.1
Colorless to light yellow
184.2°c
-6.2°C
1.022
1.022
4
770°C
70.0°c
75.6°C
5.2 wt '70
Miscible with alcohol, benzene and most organic solvents
'1

117
Table 34. Physical constants of furfural
Properties
Molecular weight
Melting point
Boiling point
Flash point (open cup)
Viscosity at 25°c
Heat of combustion
Specific gravity at 20°/4°c
Solubility in water (wt % at 20°c)
Solubility in al (wt % at 20°c)
Solubility in ether (wt % at 20°c)
Ignition temperature
96.08
-36.5°C
161. 7°C
56.8°C
1.49 cP
560.1 kg cal/mol
1.1598
8.3
infinite
infinite
393°C
Table 35. Physical constants of methyl methacrylate
Properties
Color
Boiling point
Density d 20 4
Index of refraction
Melting point
Specific heat
Solubility in water at 30°c
Viscosity at 25°c
colorless liquid
l00°c
0.936
1.413
48°C 0
0.49 cal g/ C
1. 5 wt '7.
0.569 centistokes
•

118
Table 36. Chemical treatment grading B (sulfur series)
Sieve size io Passing
3/4 in. 100
1/2 in. 90
3/8 in. 77
#4 59
#8 45
#30 24
#50 17
fflOO 11
#200 6

119
Impregnation treatment. To determine the condition required to obtain
any desired degree of monomer loading in the rock cores, it is necessary
to investigate the various parameters that alone or in combination give the
best preparatory results. Monomer loading is defined as the weight percent
increase of an untreated specimen.
Many factors influence monomer penetration. The main effort has been
to obtain a maximum monomer loading in the samples, principally through
removal of free water and air from the specimens by vacuum or thermal drying,
the latter of which was found to be the most practicable for water removal
because of its relative rapidity.
Another important parameter to be considered to obtain maximum monomer
loading or to improve the efficiency of impregnation is evacuation of the
specimens prior to soaking. Figures 47 and 48 show time-loading curves
for the two rocks.
1.0
0.5
1 2 3 TIME, hr
4
4
2
5
---OVEN DRIED ONLY -·-NO DRYING OR
EVACUATION -- OVEN DRIED AND
EVACUATED FOR 2 HR TO s; 3 in. HG, ABSOLUTE PRESSURE
2 3 TIME, hr
4
Fig. 47. Monomer loading vs time for Cook cylinders
Fig. 48. Monomer loading vs time for Menlo cylinders
•
5

120::
Polymerization techniques. After impregnation of rock cores with
liquid monomer consisting of 90wt % of methyl methacrylate plus 10 wt%
of trimethylolpropane trimethacrylate, it is polYm.erized by one of two
methods: cobalt gamma radiation or thermal catalytic technique.
Preliminary tests to estimate maximum radiation dose requirement
for complete polymerization of the monomer solution were conducted at
the Ames Laboratory Research Reactor (ALRR) of the US Atomic Energy
Commission. Dosages ranging from 0.2-4.5 megarads were used. Results
show that in the case of methyl methacrylate plus 10% trimethylolpropane
trimethacrylate, a radiation dosage of 1. 0 megarad is necessary.
Thermal catalytic method of initiating the polymerization of manomer
was also investigated. In this procedure, heat is used in conjunction
with a free radical initiator such as benzoyl peroxide. In the present
investigation, 1 wt % of be:nzoyl peroxide was added to the monomer solution
and polymerized at a temperature 6f 185°F. It was found that polymerization
was complete within 1 hr.
Treated aggregates were tested for water absorption, asphalt absorption
by bulk-impregnated specific gravity method and Rice specific gravity method,
and heat stability at 500°F. Asphalt concrete mixes of treated and untreated
aggregates were compared on Marshall properties (stability, flow, voids
and VMA), 24 hr Marshall immersion tests, and optimum asphalt contents.
Series B
In this series, sulfur (tire sulfur) was used to treat all six types
of laboratory crushed and graded (both grades A and B, Tables 32 and 36)
aggregates. Twenty-six mixes (2000 g each) were made with sulfur content
varying from 0 - 9 wt % of aggregate. Seventeen of these sulfur treated

121
aggregates were also mixed asphalt, and asphalt absorption by the Rice
method was determined at various time inter\ralS up to 135 days.
Series C
This was by far the most extensive, though not exhaustive, of the
three series of treatment studies. A total of 148 batches of 1000 g
mixtures were made with 30 chemicals. All. ag~regates were laboratory
crushed (from block rock samples) and graded to meet either Grading A
or Grading B. In several cases, due to limited quantities of laboratory
crushed materials, single sized aggregates were used. They were either
between 1/2 in. and 3/8 in. (+3/8 in.), between 3/8 in. and #4 (+#4) or
passing #4 and retained on #8 (+#8). Aggregates were first batched and
oven-dried before chemicals were added. In most cases, chemicals were
maintained between 0.25 - 2.00 wt % of the aggregate. Chemicals were
first diluted or dissolved in water or suitable solvent to a volume
enough to cover all aggregate particles (calculated from water absorption
data) and then added to the aggregates and hand mixed in a Hobart Kitchard
mixer. Depending on type of chemical and solvent used, they were either
air-cured or oven-cured (either 140 or 220°F) to constant weight before
absorption tests were run. Absorption of treated and control samples
were evaluated by the following manner: If the chemical is water soluble
(such as PVA), the treated mix was mixed with asphalt cement (just enough
to cover all particles) and asphalt absorption was determined at the end
of one and two weeks. If the chemical involved is water insoluble, water
absorption of the treated aggregate was first determined before mixing
with asphalt for asphalt absorption determinations. Asphalt absorption
in either case was determined by the Rice specific gravity method. For
a summary of results of treatment in Series C, see Table 37.
•

122
Table 37. Series C aggregate treatment
Quarry # treatment ffo chemical Gradings
Alden 12 10 A, B
Cook 11 11 A, +3/8 in.
Keota 1 11 8 A, B, +ffo4
Keota 2 14 11 A, B, +3/8 in.
Linwood 26 20 A, +ffo8
Menlo 21 18 A, +3/8 in.
Pints 39 23 A, B, +#4
x 14 10 A, +#8
Total 148 30
Results
Series A
Aniline Furfural Treatment:
Treatment on graded crushed aggregate. The results of the tests
conducted on the aggregates studied were encouraging. In Tables 38 - 40
water absorption and asphalt absorption for both untreated and treated
aggregates are summarized.
0 While standard curing was done at 220-230 F for 5 days, curing curves
for coarse-graded Cook and Menlo aggregates at 6% aniline-furfural were
0 established for two other temperatures, 140 and 325 F. (Fig. 49). It can
0 be seen that curing at 225 and 325 F can be considered complete after
10 24 hr, while curing at 140 F takes about 100-120 hr. The effectiveness
of aniline furfural treatmient was also dependent upon curing temperature,
curing at lower temperatur1e being more effective than these cured at
higher temperatures (Fig. 50).

123
24 3250F ;><:>-- -o.- J:J--~- --o- - -0- - ~ -~---o------0
22 I
I 0> 20 I ..
t-" 18 t-"
0 _, 16 ..... :::c <.!> 14 w 3: 12 w
> 10 .....
~ 8 ~ ::::> 6 u
2
?--
3250f
2250f
l 4QOF " " " .Q •• .i:) •• '""'"'-•-----0------0 ,.....,___ .,,,.._,,,__................ -,,..,,,,--
.t:>-- ---- -
_...__COOK, 6% A~F
------MENLO, 6% A-F
o.__._~_.____.._~~---,___,_~......____.._~_._~,___,_~.....____.._~_._~.___.___,
0 20 40 60 80 l ()() 120 140 160 180. 200 220 240 260 280 300 320 340
CURING TIME, hr
Fig. 49. Curing curves for aniline furfural treatments
";fl 4
~ .. 3 jJ z 0
ARMACT%,// ..... COOK, 0..
2 / 0::: 0 / t-" / cc < CJ"' MENLO, °' 1 ...,.,,."" w o--- ARMAC T, 6% ..... OOK, A-F, 6% < 3: o---
0 100 350
Fig. 50. Effects of curing temperature on water absorption
•

124
Effects of percent aniline furfural on water absorption of treated
coarse graded aggregates are shown in Figs. 51 and 52. A sharp decrease
was found in water absorption with 3% aniline furfural treatment. It was
8 ~
i - WATER AISOltPTION '#. 6 ... 6 BY ASTM C-1.27 TEST i z WATER ABSORPTION
0 WATER ABSORPTION .. BY ASTM C-127 TEST - ---- AFTER HEATING ~ 4 ....
~ 4 ~ AGGREGATE FOR - ---WATER ABSORPTION 0 ~ 4 hr AT 400°F t: AFTER HEATING V't
~ Cl
~ AGGREGATE FOR < V't 2 GI: ~ 4 hr AT 400°F w 2 ~ <
~ ~- ..... -- iK w ....
00 < 00 ~ 3 6 9 12
3 6 9 12 ANILINE-FURFURAL ANILINE-FURFURAL TREA°tMENT, % TREATMENT, %
Fig. 52. Water absorption of Fig. 51. Water absorption of Cook aggregate vs percent aniline furfural treatmemt
Menlo aggregate vs percent aniline furfural treatment
also found that an increase in the percentage of aniline furfural beyond
6% resulted in very small decrease in water absorption.
In order to determinE! if heating at temperatures higher than the
curing temperature of 220··230°F had any effect on the aggregates, both
the untreated and treated aggregates were oven heated at a constant
temperature of 400°F for l~ hr. Specific gravity and absorption tests were
then conducted on these aggregates and their values are given in Table 39.
On heating the treated aggregates to 400°F for 4 hrs, a subsequent
increase in water absorption over the unheated but treated aggregates
was found. Treatments were still effective in reducing absorption. This
change may be attributed to the burning of aniline furfural resin from
the surface and pores of the aggregates.
j

• 125
Table 38. Specific gravity, water absorption, water permeable pores of graded crushed aggregates treated with aniline furfural
Apparent Bulk Water Water specific specific absorption, permeable
Aggregate Treatment gravity gravity wt % pores, %
Cook Untreated 2. 778 2.293 7.62 17.50
Cook 3% aniline furfural 2. 360. 2.314 0.86 2.00
Cook 6% aniline fur fur al 2.385 2~367 0.49 0.91
Cook 9% aniline fur fur al 2.400 2.380 0.44 0.90
Menlo Untreated 2.663 2.392 2.57 6.42
Menlo 3% aniline furfural 2.598 2.565 0.50 1. 27
Menlo 6% aniline furfural 2.537 2.521 o. 26 0.65
Menlo 9% aniline fur fur al 2.519 2.506 0.20 0.52
Table 39. Heat stability of graded crushed aggregates treated with aniline fur fur al
Apparent Bulk Water Water specific specific absorption, permeable
Aggregate Treatment gravity gravity wt % pores, %
Cook Untreated 2. 778 2.293 7.62 17.5
Cook 3% aniline furfural 2.391 2.321 1. 25 2.92
Cook 6% aniline fur fur al 2.425 2.375 0.85 2.03
Cook 9% aniline furfural 2.411 2.370 o. 72 1. 71
Menlo Untreated 2.663 2.492 2.57 .6.42
Menlo 3% aniline furfural 2.595 2.555 0.60 1. 54
Menlo 6'Yo aniline fur fur al 2.527 2.503 0.38 0.83
Menlo 9% aniline furfural 2.533 2.516 0.27 0.69
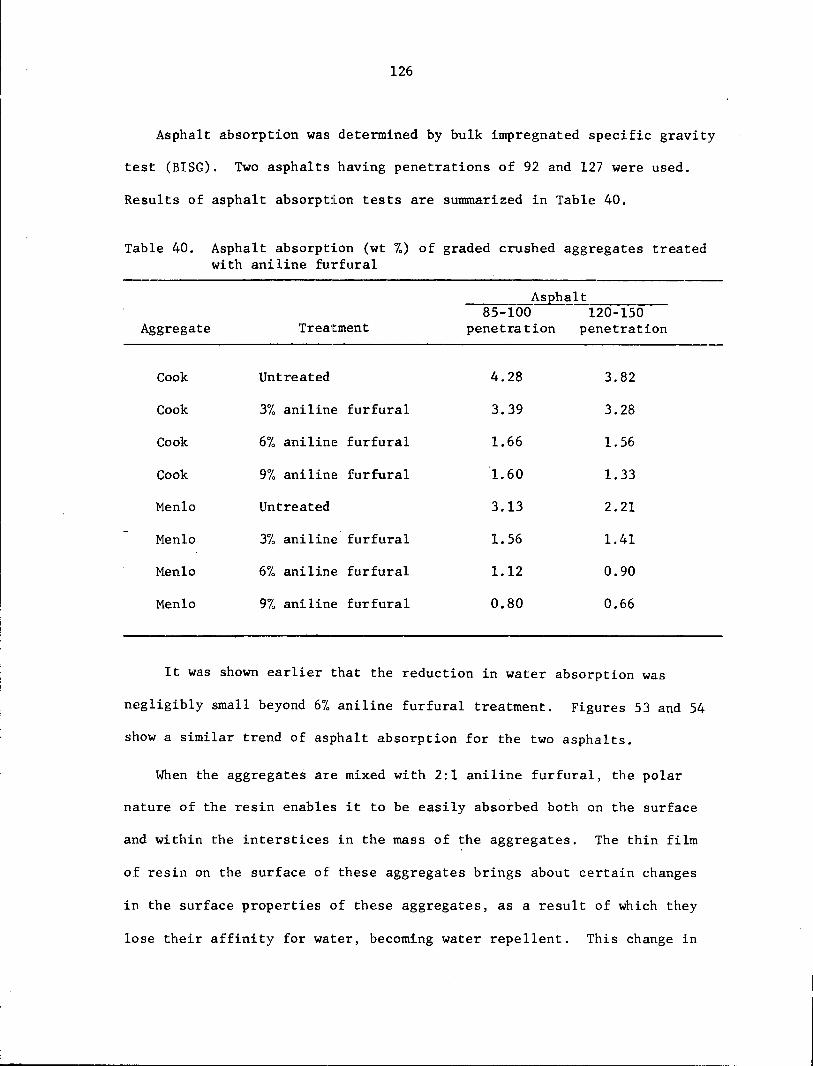
126
Asphalt absorption was determined by bulk impregnated specific gravity
test (BISG). Two asphalts having penetrations of 92 and 127 were used.
Results of asphalt absorption tests are summarized in Table 40.
Table 40. Asphalt absorption (wt %) of graded crushed aggregates treated with aniline fu:rfural
____ Asphalt 85-100 120-150
Aggregate Treatment penetration penetration
Cook Untreated 4.28 3.82
Cook 3% anilinie furfural 3.39 3.28
Cook 6% aniline furfural 1.66 1. 56
Cook 9io aniline furfural 1.60 1. 33
Menlo Untreated 3.13 2.21
Menlo 3io aniline furfural 1.56 1.41
Menlo 6% aniline furfural 1.12 0.90
Menlo 9% aniline furfural 0.80 0.66
It was shown earlier that the reduction in water absorption was
negligibly small beyond 6% aniline furfural treatment. Figures 53 and 54
show a similar trend of asphalt absorption for the two asphalts.
When the aggregates are mixed with 2:1 aniline furfural, the polar
nature of the resin enables it to be easily absorbed both on the surface
and within the interstices in the mass of the aggregates. The thin film
of resin on the surface of these aggregates brings about certain changes
in the surface properties of these aggregates, as a result of which they
lose their affinity for water, becoming water repellent. This change in

• 127
Table 41. Specific gravity and water absorption of 1/2 in. cores treated with aniline furfural
Apparent Bulk Water As2halt absor2tion 2 % specific specific absorption, 85-100 120-150
Core Treatment . gravity gravity % penetration penetration
Cook Untreated 2.72 2.48 3.61 0.68 0.65 Cook 2: 1 aniline 2.48 2.45 0.38 0.20 0.18
furfural Menlo Untreated 2. 71 2.66 0.69 0.30 0.28 Menlo 2: 1 aniline 2.64 2.63 0.16 0.15 0.13
furfural
Table 42. Specific gravity, water absorption and permeable pores of Armac T treated crushed aggregates
Apparent Bulk Water Aggregate Treatment specific si>ecific absorption, Permeable
gravity gravity wt % Eores,%
Cook Untreated 2.778 2.293 7.62 17.50 Cook 1/2% Armac T 3.46 Cook 1'7o Armac T 2.570 2.309 3.43 7.91 Cook 3% Armac T 2.442 2.324 2.08 4.83 Cook 6% Armac T 2.438 2.366 1. 27 3.00 Cook 8% Armac T 0.77 Menlo Untreated 2.663 2.492 2.57 6.42 Menlo 1/2% Armac T 1.16 Menlo 1% Armac T 2.608 2.528 1.21 3.7 Menlo 3% Armac T 2.574 2.519 0.85 2.13 Menlo 6% Armac T 2.505 2.481 0.39 o. 96 Menlo 8% Armac T 0.40

128
?fl. 6 ..
-GRADED CRUSHED z 0 COOK AGGREGAT ..... 4 0... --GRADED CRUSHED ~ MENLO AGGREGATE V') co ', <C(
2 ..... ............ ~
__. <C(
......... _ ::c: ...... .....;,_,_. 0... V') 0 <C(
0 3 6 9 ANILINE-FURFURAL TREATMENT,
Fig. 53. Absorption of 85-100 penetration asphalt by graded crushed aggregates vs aniline furfural treatment.
12 %
2
-GRADED CRUSHED COOK AGGREGATE
---GRADED CRUSHED MENLO AGGREGAT
o _______________ __._ ______ ...._ ____ ___. 0 3 6 9 12 ANILINE-FURFURAL TREATMENT, %
Fig. 54. Absorption of 120-150 penetration asphalt by graded crushed aggregates vs aniline furfural treatment
_surface property is primarily responsible for the sharp decrease in water
absorption characteristics of the aggregates. Decrease in asphalt absorption
·may be attributed to the plugging of the interstices as a result of resin
formation inside.
Treatment on 1/2 in. cores. Results of tests conducted· on 1/2 in. cores
treated with 2: 1 aniline forfural indicates that treatment on cylindrical
cores are much more effective than on graded crushed aggregates. Table 41
gives the water and asphalt absorption of both untreated and treated cores
from Cook and Menlo quarries.
On heating these treated cores to 400°F for 4 hrs, no change in specific
gravity and water absorption was found. This indicates that 1 hr of soaking
in the chemicals is a more effective method of treatment than the regular
mixing procedure adopted for graded crushed aggregates.
Asphalt absorption of the treated cores was reduced to negligible value.

• 129
Armac T Treatment
Treatment on graded crushed afliiregates. Similar tests were conducted on
the aggregates treated with different percentages of Armac T. Results of
specific gravity, water absorption and asphalt absorption are given in
Tables 42 - 44. Results obtained by this treatment were also favorable
but were not as effective as 2:1 aniline furfural treatment.
An appreciable reduction in water absorption was found (Fig. SS) with
an increasing amount of Armac T. For 6% Armac T treatment, reduction in
water absorption was of the order of 84% for Cook aggregate and 8S% for
Menlo aggregate.
0 On heating the treated aggregates to 400 F for 4 hr, it was found that
the water absorption was further decreased. One possible explanation could
0 be the presence of some unreacted Armac T which reacts at 400 F, thereby
forming more resin both on the surface and within the porous medium of
the aggregates.
8 0 ____ HEATING FOR 4 hr AT 400 F
6
O.__~~__.~~~_..~~~~~~~~~~~
0 2 4 6 8 10 ARMAC TI %
Fig. SS. Water absorption vs percent Armac T treatment

130
Table 43. Heat stability of graded crushed aggregates treated with Armac T
Apparent Bulk Water specific specific absorption, Permeable
Aggregate Treatment gravity gravity wt % pores, %
Cook Untreated 2. 778 2.293 7.62 17. so Cook 1% Armac T 2.450 2.314 2.40 5~56 Cook 3% Armac T 2.417 2.324 1.63 3.78 Cook 6% Armac T 2.386 2.336 0.89 2.06 Menlo Untreated 2.663 2.492 2.57 6.42 Menlo 1% Armac T 2.636 2.558 1.14 2.92 Menlo 3% Armac T 2.579 2.541 o. 72 1. 96 Menlo 6% Armac T 2.544 2.513 0.35 0.83
Asphalt absorption tests were carried out in both untreated and
treated aggregates and fairly good results were obtained. Results of
asphalt absorption by bullk impregnated specific gravity tests are given
in Table 44.
Table 44. Asphalt absorption (wt %) 6f graded crushed aggregates treated with Armac T
Ase halt 85-100 120-150
Aggregate Treatment penetration penetration
Cook Untreated 4.28 3.82 Cook 1/2% Armac T 3.32 Cook 1% Armac T 3.25 3.36 Cook 3% Armac T 2.37 2. 77 Cook 6% Armac T 1. 78 1.89 Cook 8% Armac T 1.62 Menlo Untreated 3.13 2.21 Menlo 1/2% Armac T 2.01 Menlo 1% Armac T 1.56 1. 28 Menlo 3% Armac T 1.18 0.80 Menlo 6% Armac T 0.69 0.54 Menlo 8% Armac T 0.47

• 131
Like aniline furfural resins, Armac T has the ability to cause similar
changes in the surface properties of the aggregates. With Armac T Treatment,
reduction in asphalt absorption is not much compared to that for water
absorption. Decrease in asphalt absorption could be due to the sealing
of the pores of the aggregates by Armac T resins.
Curing curves for Armac T treated graded aggregates were determined
0 0 0 for 6% Armac T at 140 F, 225 F and 325 F, and for 1/2% and 8% treatments
0 at 225 F. The required curing time was dependent upon curing temperature,
percent chemical and type of aggregate, and that, except for 140°F curing
which required 100-120 hr, curing can be considered complete within 24 hr.
The effects of curing temperature on the effectiveness of absorption
reduction was the same as for aniline furfural treatment: higher curing
temperature decreases the effectiveness (Fig. SO).
Graded aggregates were also treated by soaking in 1/2 and 3% Armac T
water solution. The results indicated that it was not as e~fective as the
mixing method.
Treatment of. 1/2 in. cores. Half-inch cylindrical cores from Cook and
Menlo quarries were also treated with Armac T solution. After proper
curing, ASTM C-127 tests and asphalt absorption were conducted on these
cores. Results of these tests are summarized in Table 45. Considerable
reduction in water and asphalt absorption was observed.
Monomer Treatment
Treatment of 1 in. cores. The results of the tests conducted on Cook and
.Menlo cores indicate that monomer impregnation of the cylindrical rock
cores to be the best method of reducing the absorptive capabilities of rock
cores. The results of specific gravity, water absorption and asphalt

132
absorption for both the untreated and treated cylindrical cores have
been sunnnarized in Tables 1+6 and 47. Both thermal and radiation
polymerization of the impr1egnated cores brought about the same degree of
reduction in water and asphalt absorption.
Table 45. Specific gravity and absorption of 1/2 in. cores treated with Armac T
Apparent Bulk Water Asehalt absoretion 2 % specific specific absorption 85-100 120-150
Cook Treatment gravity gravity % penetration penetration
Cook Untreated 2. 723 2.479 3.61 0.68 0.65
Cook Armac T 2.487 2.460 0.47 0.26 0.25
Menlo Untreated 2.712 2.662 0.69 0.30 0.28
Menlo Armac T 2.685 2.620 0.19 0.18 0.18
Table 46. Specific gravity and absorption of cores impregnated with monomer
Apparent Bulk Water Asphalt specific specific absorption, Permeable absorption,
Core Treatment gravity gravity wt % pores, % %
Cook Untreated 2.7:23 2.479 3.61 8.97 0.68
Cook Thermal polymerization 2. 51+2 2. 536 0.21 0.24 0.04
Cook Radiation polymerization 2.551 2.534 0.57 0.67 0.07
Menlo Untreated 2. 712 2.662 0.69 1. 85 0.30
Menlo Thermal polymerization 2.673 2.673 0.00 0.00 0.00
Menlo Radiation polymerization 2.671 2.668 0.00 0.11 0.05

133
Table 47. Specific gravity and absorptidn of graded crushed aggregates treated with monomer
Apparent Bulk Water Asphalt specific specif i~ absorption absorption
Aggregate Treatment gravity gravity wt % %
Cook Untreated 2. 778 2.293 7.62 4.28 Cook Thermal 2.375 2.348 0.96 0.89
polarization Menlo Untreated 2.663 2.492 2.57 3.13 Menlo Thermal 2.590 2.564 0.85 0.78
polarization
On heating both thermal and radiation polymerized cylindrical cores
to 400°F for 4 hr to determine their heat stability, values identical to
the ones cited in Table 41 were obtained. This is a good indication of
the heat stability of the impregnated polymer at temperatures as high as
400°F. This is mainly due to the cross-linking of the monomer with
trimethylolpropane trimethacrylate, one of the functions of which is to
increase the softening point of the monomer solution.
Treatment on graded crushed aggregates. Graded crushed aggregates from
Cook and Menlo quarries were impregnated with the monomer solution,
consisting of methyl methacrylate plus 10% trimethylolpropane-trimethacrylate
plus 1% benzoyl peroxide, and then thermally polymerized at 185°F to compare
the results of water and asphalt absorption of these aggregates with those
of 1 in. cylindrical cores impregnated with the same monomer solution and
thermally polymerized. Results of specific gravity, water and asphalt
absorption of these impregnated aggregates are given in Table 47.
Reduction in water and asphalt absorption of graded crushed aggregates
and cylindrical cores treated with the monomer solution was primarily due
to the sealing of the pores as a result of polymerization of impregnated
monomer solution. It was found that unlike aniline furfural and Armac T
treatments, asphalt absorption values were lower than water absorption.
This indicates that there was no change in the surface characteristics of
the monomer treated aggregates.
•

I '
134
Asphalt Concrete Mixtures
In order to determine the performance of the chemically treated
aggregates in asphalt paving mixtures, asphalt concrete mixtures using
treated and untreated aggn~gates were prepared.
Untreated aggregates. Marshall specimens were prepared with untreated
aggregates from Cook and M1~nlo quarries. In both cases, agricultural
lime passing #8 sieve were added to the coarse Cook and Menlo fractions
so that the combined gradation meet the Iowa.Type A mix gradation. Four
different percentages (6, 7, 8, and 9%) of 120~150 penetration asphalt
cement were used in these mixes. From the values of Marshall Stability,
flow, air void and voids i:n mineral aggregate (VMA), the optimum asphalt
content of the asphalt paving mixes was determined. On the basis of these
tests, it was found that 7.5 wt% asphalt mix was necessary for both
aggregates (Figs. 56 and 57). In these figures, stability and flow values
for Marshall Immersion Compression tests have also been plotted. It is
found that for an asphalt content of 7.5%, the resistance of bituminous
mixtures to the detrimental effect of water as expressed by percent retained
strength are of the order of 74 and 77% for mixtures containing Cook and
Menlo fraction, respectively. The US Army Corps of Engineers uses 75%
retained strength as one of the criteria in bituminous mixture design.
If this criterion is used in our mixture design, it is found that bituminous
mixtures using Cook aggregate do not meet the requirement even at a high
asphalt content of 7.5%.
Treated aggregates
Aggregates from Cook and Menlo quarries and agricultural lime were
treated with 6 wt io of 2: 1 aniline furfural and Armac T. The selection of

4000 ---------
3500
::9
~ 3000 ..... :J CCI
~ 2500 V'I _. _. <( :c V'I
°' ~
~
V'I 0
0 > °' -<(
2000 IMMERSION COMPRESS ION TEST
1500 ...._ __ ...._ __ ....__ __
10-----------.
8
2
7 8 9
AC wt% OF MIX
135
30
• .5 8 20 ., .....
IMMERSION
o.__ __ ....._ __ .&-_ __.
13
"#. 12 .. • ~ ~
11 >
AC wt% Of MtX
Fig. 56. Test property curves for mixes containing Cook aggregate and agricultural lime by the Marshall ·method
•
f \

136
5000 .--------------. 50
4000 :e .. ~ t-::::i 3000 • 30 al .E <(
8' IMMERSION t-U')
COMPRESSION TEST ...J -...J 2000 ~ 20 <( .. ::i: ~ U')
"" 0 ~ IMMERSION ...J
1000 IL. 10 OMPRESSION TEST·
8 14 "#. #-.. U')
a • 13 0 6 <(
> •
"" ~ •
<( > 4 12
AC wt % OF Mt><: AC wt% OF MIX
Fig. 57. Test property curves for mixe~ containing Menlo ~ggregate and agricultural lime by the Marshall method

137
6 wt % of these chemicals was based upon the 'results of tests on graded
crushed aggregates treated with these chemicals.
Bituminous mixtures were made with aggregate treated with 2:1 aniline
furfural using 120-150 penetration asphalt cement and Marshall specimens
prepared. Figures 58 and 59 give the test property curves for mix design
data by the Marshall method.
It was found that for aniline furfural treated aggregates, asphalt
content for mixtures containing Cook aggregate was reduced to 5.5% and for
those containing Menlo aggregate, 4.8%. The percent retained strength of
the mixtures at optimum asphalt contents were 83 and 82%, respectively.
Bituminous mixtures were also prepared with Arrnac T treated aggregates.
Results of the tests on these mixtures are summarized in Figs. 60 and 61.
Optimum asphalt content for mixtures containing Cook aggregate was 5.6%;
for those containing Menlo aggregate, 5%. The percent retained strength
of the mixtures at optimum asphalt content were 81 and 84% respectively.
The lowering of the optimum asphalt content and considerable increase in
the percent retained strength of the chemically treated aggregate bituminous
mixtures can be attributed to the effective chemical treatment of these
aggregates.
Rice specific gravity tests were conducted on asphalt paving mixtures
to determine the amount of asphalt absorbed by the treated aggregates in
the mixtures. Results of these tests are given in Table 48. The absorption
values are high even fot' these aggregates, due probably to incomplete
coating of the particles. Thus the absorption indicated could be the
combined absorption of both asphalt and some water. Nevertheless, con
siderable reduction in asphalt absorption of paving mixture was observed
due to the treatments.
•

138
5000-----------.
.a 4000 40 ...
>-~
::J 3000 • 30 CCII c MERSION < COMPRESS ION TEST ~ IMMERSION 8 "' ·--' COMPRESS ION TEST
520 --' 2000 < :c ...
"' ~
~ 0 --'
1000 u.. 10
17.....-------------,
8 16
'#. ~ ...
"' .. e 6 0 15 0 < . > ~ cc:: 0
< > 14
2 13
6 7 8 6 7 8 AC wt % OF MIX AC wt% OF MIX
Fig. 58. Test property curves for mixes containing aniline furfural treated Cook aggregate and agricultural lime by the Marshall method

.. >-1-
6000
5000
::! 4000 iCIO
·< IV)
.....
..... 3000 ~ ~
~ 2000
'*- 8 .. V)
Q
0 > 6 ~
<
2
IMMERSION COMPRESS ION TEST
139
50
.30 c
8 520 .. ~ 9 u.. 10
18
17
'*-.. • 16
< • ~ . >
15
14
IMMERSION COMPRESS ION TEST
Q"-~~_._~~-'-~~-'-~~--J ·13~-~~_._~~-'-~~-'-~~-I
4 5 6 8 4 5 6 7 8
AC wt% OF MIX AC wt% OF MIX
Fig. 59. Test property curves for mixes containing aniline furfural treated Menlo aggregate and agricultural lime by the Marshall method
•

5000 50 IMMERSION
COMPRESSION TEST
:B 4000 4()
.. >-..... ~ 3000 • 30 co
.~ < ..... 8 VI ...J 520 ...J 2000 < J: .. VI ~ ~ 0 ~ IMMERSION ...J
1000 COMPRESS ION TESl" u.. 10
8 15
*' .. * VI 0 .. - 6 . • 14 0 ~ >
~ ~ • < >
4 13
AC wt% OF MIX AC wt% OF MIX
Fig. 60. Test property curve for mixes containing Armac T treated Cook aggregate and agricultural lime by the Marshall method

141
.s 3000 . 40 ...
>-I-:::; al <( I-I.I')
...J -' <( :I: I.I')
°' ~
IMMERSION COMPRESSION TEST
c3o
8
2000 ' -20 IMMERSION .. COMPRESS ION TEST ~
0 -'
1000 u.. 10
8 18
* ... I.I')
0 * .. 17 0 6 > <(
°' ~ <( ">
4 16
2 15
o.__~~.._~~ ......... ~~--~~- 14'--~~.._~~--~~---~~-
4 5 6 7 8 4 5 6 7
AC wt% OF MIX AC wt% OF MIX
Fig. 61. Test property curves for mixes containing Armac T treated Menlo aggregate and agricultural lime by the Marshall method
8
•

142
Table 48. Asphalt absorption of bituminous mixes by Rice method
A.C. wt % Asphalt absorption, Aggregate Treatment of mix wt %
Cook Untreated 6 4.04
Untreated 7 4.12
Untreated 8 4.63
Untreated 9 4.85
Menlo Untreated 6 2.74
Untreated 7 2.98
Untreated 8 3.08
Untreated 9 3.25
Cook 6% Aniline 5 2.04 Furfural
6% Aniline 6 2.19 Furfural
6% Aniline 7 2.45 Furfural
6% Aniline 8 2.56 Furfural
Menlo 6% Aniline 4 1. 72 Furfural
6% Aniline· 5 2.12 Furfural
6% Aniline 6 2.46 Furfural
6% Aniline 8 2.56 Furfural
Cook 6% Armac T 5 1.04
6% Armac T 6 1.28
6% Armac T 7 2.29
6% Armac T 8 2.39
Menlo 6% Armac T 4 0.44
Menlo 6% Armac T 5 0.91
6% Armac T 6 1.15
6% Armac T 7 1.23
6'/'o Armac T 8 1.42

143
Series B. Treatment of Absorptive Aggregates by Sulfur
Three sub-series of treatments by sulfur were made:
Sub-series A. In this series, one highly absorptive (Cook) and
one moderately absorptive (Menlo) coarse-graded crushed limestone was
treated with tire sulfur ranging from 1 - 9 wt % of aggregate. Water
absorptions were determined and are given in Table 49 and plotted in
Fig. 62. At 6% sulfur, absorption was reduced by 80% for Menlo and by
57% for Cook limestone.
Tabie 49. Water absorption of sulfur treated lime-stonesa
Water Sulfur, c absorption,
Limestone b % % .. 6 z
Menlo 0 2.57 0 II 1 0.97 II 3 0.64 II 6 0.53
t-a.. 4 a.: 0 "' Cook 0 7.62
II 1 6.35 II 3· 5.08 II 6 3.29
lllQ ~ el: w t-~
MENLO II 9 1.94 ~
2 4 6 8 10 a o Aggregate·temperature: 325 F; TIRE SULFUR, %
sulfur temperature: 75-77°F Fig. 62. Water absorption of b
Coarse graded: 100% passing 3/4 in., sulfur treated limestones. 63% passing 3/8 in., 27% passing #4; 0% passing #8 sieve
cTire sulfur 21-4; wt % of aggregate
•

144
Sub-Series B Eight laboratory crushed and blended limestones were
treated with 3 - 6% tire sulfur by weight of aggregate (2.71 and 5.07 wt%
of total mixture) before b·eing mixed with asphalt. Asphalt absorptions
of these sulfur asphalt mixtures were determined at various time intervals
up to 135 days. Results were compared with asphalt mixtures containing
crushed limestones of identical gradation but without sulfur. The·
gradation of these mixtures are given in Table 33. The asphalt content,
sulfur c-ontent and asphalt absorption after 1 day and after 100 days of the
seventeen mixes are given in Table 50. The time-absorption curves of treated
and untreated aggregates, are shown in Figs. 63.,... 70. It can be noted
that: (a) there are definite improvements in sulfur treated aggregate in
reducing asphalt absorption, (b) the percent reduction varies with
aggregates, (c) the differences in asphalt absorption between treated
and untreated aggregates are greater at 100 days than at 1 day, i.e.,
there is a possible and significant advantage of reducing delayed absorption,
and (d) the addition of sulfur beyond 6% resulted in little further
improvement.
Sub-Series C. Asphalt absorption of sulfur treated and untreated
Cook and Ferguson limestones were also determined during an investigation
of effects of sulfur on mechanical properties of asphalt paving mixtures.
The results are given in Table-51. It can be seen that sulfurized asphalt
concrete reduced asphalt lost by absorption by 36% for Cook aggregate and
by 56% for Ferguson aggregate, at optinrum sulfur content of 5%.
Series C ----A total of 148 batches (not including preliminary trial mixes) involving
laboratory crushed and graded limestones from eight block sample (six quarries)

4.4
4.3
4.2
4. l
4.0
3.9 '#.
.. 3.8 z 0 3.7 ..... A.
0 3.6 ..,, c
3.5 <(
!:i 3. <(
:c Q.,
~ 3.3
3.1
LL-C Gb = 2 .427 AC wt % of mix 7 .47
SR wt % of mix 0
145
TIME, days
LL-CS Gb = 2 .427
AC wt % of mix 6. 90
SR wt 0k of mix 2.71
Fig. 63. Time-absorptive curves for treated and untreated Cook limestone
•

146
3.o..-~~~~~~~·~~~~~~~~~~~~~--+~~-+---
*
2.9
2.8
2.7
2.6
2.5
2 ...
2.3
... 2.2 z Q 2.1 .... 12 0 2 .• 0 VI 0 <I( 1. 9
!:J <I( 1.8 J: Q.. < 1.7
1.6
1.S
1.6'
1 .3
LL-P
AC wt % of mix 7 .49
SR wt % of mix 0
2 3 .. ;5678910
LL-PS
AC wt % of mix 6.86
SR wt % of mix 2.71
f 20 30 40 5060 80 l 00
TIME, days
200
Fig. 64. Time-absorptive curves for treated and untreated Pints limestone

l .7.
l ;6
1.5
1.4
1.3
~ 1.2
£ 1.1 0 t: l .o a=: 0 V') o. 9 clCI
< ~0.8 < ~0.7 V')
< 0.6
0.4
0.3
0.1
LL·L R
S Wt o/o of mix 5.61
AC wt o/o of mix
147
LL-LS
SR wt o/o of mix 4,62
AC wt o/o of mix 2.78
o.o..__~~-L-~-L...----'----'----'--'-...L...1.....1-~~----'-~----'-~.L-...L..-..L...J_,_.L.....L..~~___. 0 2 3 4 5 6 7 8 10 20 30 40 50 70 100 .
TIME, days
Fig. 65. Time-absorptive curves for treated and untreated Linwood limestone
•

148
3.1..--~~~~~~~--~~~~~~~~~~~~~~~~~---.
3.0
2.9
2.8 LL-X
2.7
2.6
2.5
2.4
'#. 2 3 ... . z Q 2.2 t: 0 2.1 V)
0 ~
~ ~ 1.9 :::c L < 1.8
1.7
1.6
1 .5
1.4
AC wt % of mix 6.06 SR wt % of mix 10
LL-XS
% AC by wt of mix 4.74 % SR by wt of mix 2.n
1.3
1 • 2 1~~~2..__~3~4~~'~5~6-7~8~1~0~~~2~0~~30~40"='-=50~f:J.)=-""'=8~0~l00~~~200
TIME, dclys
Fig. 66. Time absorptive curves for treated and untreated X (Alden II) limestone
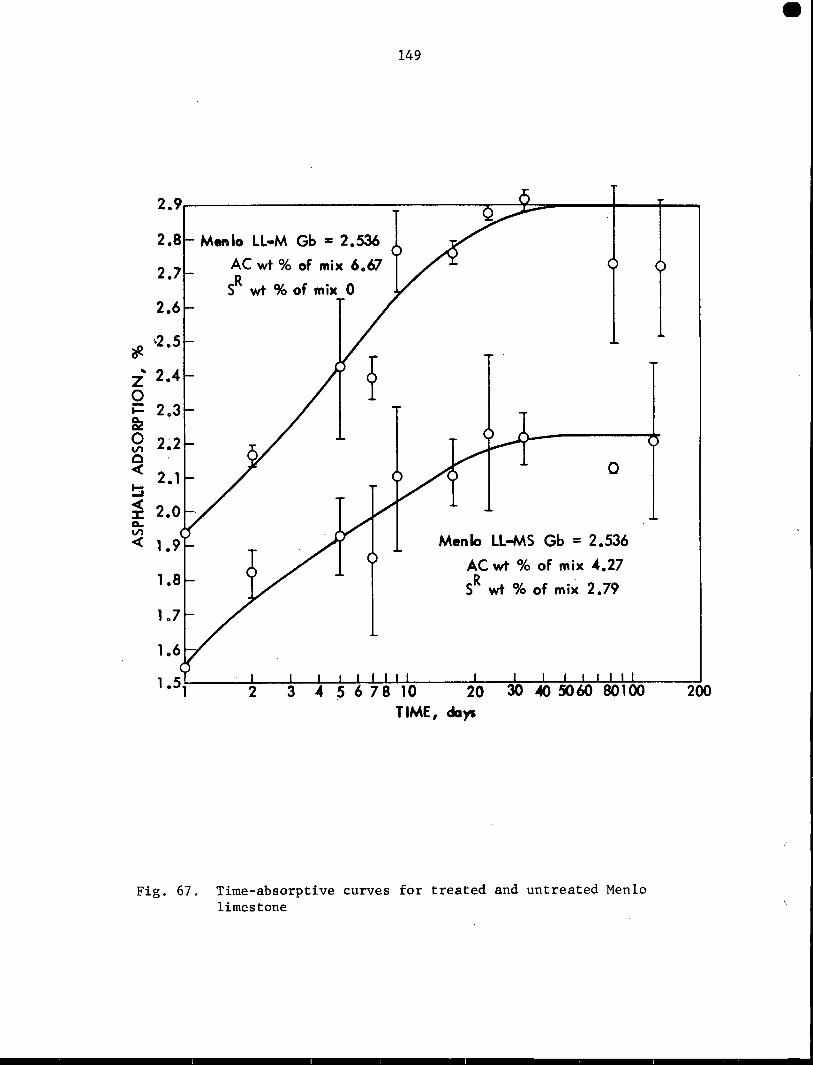
149
2.9r--~~~~~~~~~~~~~r:----¥-=-----..... --~~--
2.8
2.7
2.6
"#. •2 .5
z' 2.4 0 .... 8z 0 V> 0 ~
2~2
2.0
1.9
1.8
L7
Men lo LL·M Gb :r: 2. 536
AC wt% of mix 6.67
SR wt % of mix 0
2 3 4 ~ 6 7 8 10
0
Menlo LL-MS Gb = 2.536
AC wt % of mix 4.27 SR wt o/o of mix 2.79
20 30 «> 5060 801 ()() TIME, days
Fig. 67. Time-absorptive curves for treated and untreated Menlo limestone
200
•

150
3.0,..-----------------------------------------------~ LL-A 2.9
2.8
2.7
2.6
2.5
2.-4
cf. 2.3 ...
5 2.2
... ~ 2.1
~ 2.0 <II(
1 •
1.-'
~C wt% of mix 6.-49 SR wt % of mix O.O
LL-AS AC wt % of mix ... 67 R
S wt% of mix. 2.78
1.3L.-____,.____,......_____,......_____,._,.,____,,_,__.,...._____,.____,._._____,._._____,.L-____,.____,.......i.,...~____,.____,.__,
1 2 3 s 7 910 20 30 40 80 100 200 TtME, dC115
Fig. 68. Time-absorptive curves for treated and untreated Alden limestone

151
2.2.-~~~~~~~~~~~~~~~~~~~~~~~~~
2. 1
2.0
1.9
1 .8
1.7
1.6
1.5
£ 1.4 0 .,_ 1 .3 0.. Cl:
0·1 2 V'I •
0 < 1 .1 !:i < :::c 0.. V'I
< 0.9
0.8
0.7
0.6
0.4
of •ix 6.88
SR wt % of 111ix 0
f
LL-K 1 S
2 6 8
of mix 4.41
of mix 2.78
10 13 20 30 40 5060 80100 TIME, da)'S
Fig. 69. Time-absorptive curves for treated and untreated Keota I limestone
200
•

:R 0 .. z 0 ..... Cl..
"' 0 V') CIO -<(
!:i -<( ::c Cl.. V')
-<(
9.2
9 .1
9.0
8.9
8.8
8.7
8.6
8.5
8.4
8.3
8.2
8.1
8.0
7.9
7.5
7.4
7.3
7.2
7. 1
7.0
152
LL-K 11 . AC wt% of "'ix 11.~ R
S wt % of mix 0
2 3 4 5 6 :7810 20
LL-K11
S
AC % of mix 10.75 SR %of mix 2.60
LL-K11
S
AC wt% of mix 10 • .u> SR wt % of mix 5 .07
100
TIME, days
Fig. 70. Time-absorptive curves for treated and untreated Keota II limestone

• 153
Table 50. Asphalt absorption of sulfur treated limestones
A.C.a,% a Asehalt absori;~tion z % Mix # Sulfur , % 1 day 100 days
c 7.48 0 3.15 4.30
cs 6.91 2.71 2.94 4.14
p 7.49 0 1. 73 2.85
PS 6.86 2.60 1.16 1. 57
L 5.61 0 0.54 1. 70
LS 4.62 2. 71 0.19 0.88
x 6. 06 0 1.94 2.75
XS 4. 74 2.78 1.42 2.04
M 6.67 0 1.93 2.90
MS 4.28 2. 77 1.54 2.23
A 6.49 0 1.86 2.65
AS 4.67 2.79 1.48 1.83
KI 6.88 0 0.98 1.80
KIS 4.41 2.78 0.49 1.13
KII 11.43 0 7.69 8.89
KIISl 10.75 2.78 6.83 8.28
KIIS 2 10.49 5. 07 6.73 7.87
aBy weight of mix

154
Table 51. Asphalt absorptiona of sulfur treated limestone-series C & D
b c Asphalt Limestone Code A.C. Sulfur absorptionb
Cook C-1 7 0 4.4
II C-2 7 3 3.6
" C-3 7 6 2.8
II c-4 7 9 2.4
Ferguson D-1 ·s 0 1.6
II D-2 5 1 1. 6
II D-3 5 3 1.1
II D-4 5 6 0.7
~etermined by Rice method
bwt % of aggregate
cTire sulfur; wt % of aggr1egate
and 30 chemicals were made in this series of treatment study. Asphalt
and/or water absorption were determined on treated and central mixes.
Results of water absorption by ASTM method and asphalt absorption by Rice
method (after 1 week and 2 weeks), together with chemical type and con-
centration, are sunnnarized in Tables 52 - 59. Nature of the chemicals,
detailed treatment procedures, level of treatments, and qualitative observations
of these chemical treatments are sunnnarized in Appendix B. Because of the
large number of chemicals, aggregate types and percent chemical involved,
and limited observations per treatment conditions, quantitative evaluation
on relativeeffectiveness of these chemicals is rather difficult and may
be misleading. It seems, however, sufficient to state that: (a) Certain

155
agents, such as aniline-furfural, rapid curing cutbacks, crude tar,
methyl methacrylate, PVA, resins K-101 and K-1010, could be used to
reduce absorption effectively. Such treatments could thus make unsuitable
or marginal aggregates useful in asphalt concrete mixtures; (b) Certain
agents, such as rubber latex, lignin, acrylic polymers, while results
were inconclusive, deserve further study for optimum conditions of treat-
ments; and (c) Exploratory investigations should be expanded to other
potential chemicals, especially polymers and industrial wastes.
Conclusions
Aggregates of suitable quality for pavements of all types are in
short supply in numerous areas of this country, including the southern
96-99 part of Iowa. According to a study by Witczak et al.98
over one-third
of the states in the US have "poor" to "very restricted" potential aggregate
supply problems. The "realistic" (in contrast to "potential") appraisal of
aggregate sources may show an even more unfavorable situation. The
realistic appraisal of aggregate supply problems would include the problems
of population distribution, area accessibility, urban development or changes
in land uses, pollution control, increases in aggregate production costs
and demands for better quality aggregates.
Several measures have been suggested and/or are being taken to cope
with or compensate for the shortage of suitable aggregates for highway
. 97 98 35 construction. ' ' Among these are: (a) improved techniques for
locating and identifying new aggregate sources; (b) use of natural materials
such as shells and coral as substitutes of aggregates; (c) use of manufactured
or synthetic aggregates; (d) improved handling and transportation of those
•
156
aggregates that are remote~ to the construction sites; and (e) development
of novel materials and com1truction methods. However, by far the most
promising and effective approach to alleviate the problem of aggregate
shortage is better utilization of locally available aggregates, especially
the "marginal" materials.
There is little question as to the impact that can be made on the aggre-
gate supply problem by expanding the use of locally available materials of
. 1 l" 99 margina qua ity. Among the approaches that have proven merit (i.e., meet
objectives of project HR-ll~2) and/or justify research and evaluation are:
(a) better materials characterization; (b) revision of material specifications;
(c) benefaction, modification or upgrading otherwise unsuitable aggregates.
The work performed in this project on aggregate treatments is far
from exhaustive. However, it is sufficient to show that there is a wide
variety of additives and methods that may be used singly or in combination
to improve the quality of selected aggregates.
One question of importance is cost. Justification of the costs of
such improvements requires serious study and will be difficult especially
while no other aggregate source alternatives are available. From the
experiences of huge quantities of treated marginal mater.ials used, very
often successfully, in other construction areas (such as soil stabilization
and anti-stripping additives for aggregates), there is little doubt as to
the practicality and tensibility of upgrading absorptive aggregates for
paving mixtures, especially when sufficient data and information regarding
the selection and use of the additives for a given aggregate are available
and the use of such treatments is dictated by necessity rather than by
choice.

157
A case at hand similar to the treatment of absorptive aggregates
is the use of precoated aggregates for surface treatments: Precoating
of cold aggregates for surface treatment (dressing) has been widely
practiced in Australia and New Zealand to improve adhesion between
aggregate and binder and improve bonding and resistance to stripping,
reduce moisture absorption by the aggreg~te, and eliminate the dusty
aggregate problems during construction. Coating materials used for this
purpose included low viscosity tars, diesel fuel oils, low viscosity
cracked bitumens and asphalt emulsions. Of these, tar is the preferred
coating material because of its lower costs and better wetting character-
istics. Precoating machines were also designed.
As far as economic justification of precoating aggregate is concerned,
it was estimated that "even if a surface dressing last only one year
longer by using an improved aggregate it is justifiable to pay up to four
100 times the cost for such an aggregate."
As a matter of fac.t, it is considered a good practice in South Africa
to precoat aggregate for use in all surface dressing construction.
The inevitable conclusion based on this aggregate treatment study
and other evidences is that there is need for further research and
evaluation on:
• More agents and detailed laboratory studies for the information
on selection of additives.
• Effects of treatments other than absorption improvement.
• Field technical feasibility experiments.
•

158
Table 52. Absorption of chemically treated aggregate, Alden
Asphalt Chemical wt % of Water absoq~tion, %
Sample 41 Chemical aggri~gate Grading absorption, % 1 week 2 week
8 Control A 3.19 1.55 1.86
1 PVA o.:2s A 1. 29 1. 57 52-22
2 PVA 0 . .30 A 1.14 1. 02 70-05
3 Styrene 0.75 A 2.70 1.10 1.67
4 Calcium o.,45 A 1. 84 1.60 acrylate
5 NVX 0.75 A 1. 70 0.83 1.13
6 SS-lh 0.95 A 1.43 o. 70 o. 7 3
7 RC-70 1.25 A 1. 34 0.00 0.81
9 Crude tar 2.30 A 1.04 0.00 0.39
10 RT-6 1.95 A 1. 52 1.04 1.07
11 MC-30 1.50 A 1. so 0.89 0.86 ------

• 159
Table 53. Absorption of chemically treated aggregates, Cook
Asphalt Chemical wt % of Water absoq~tion, %
Sample 4F Chemical aggregate Grading absorption, 'fo 1 week 2 week
9 Control A 4.14 1.64 1. 98
1 PVA 0.30 A 0.97 1.42 52-22
2 Styrene 0.95 A 3.24 1.38 1.68
3 Calcium 0.55 A 1.03 1.02 acrylate
4 NVX 0.95 A 3.44 1.57 1.84
5 SS-lh 0.95 A 2.09 1.05 1.23
6 RC-70 1.30 A 2.21 1.21 1.18
7 Crude tar 1.95 A 2.42 1.05 1.11
8 MC-30 1. 95 A 2.68 1.32 1.27
10 ~alcium ydroxide
1.23 +3/8" 1.43 1. 91
11 RT-6 2.15 .+3/8" 1. 94 0.96 1.04
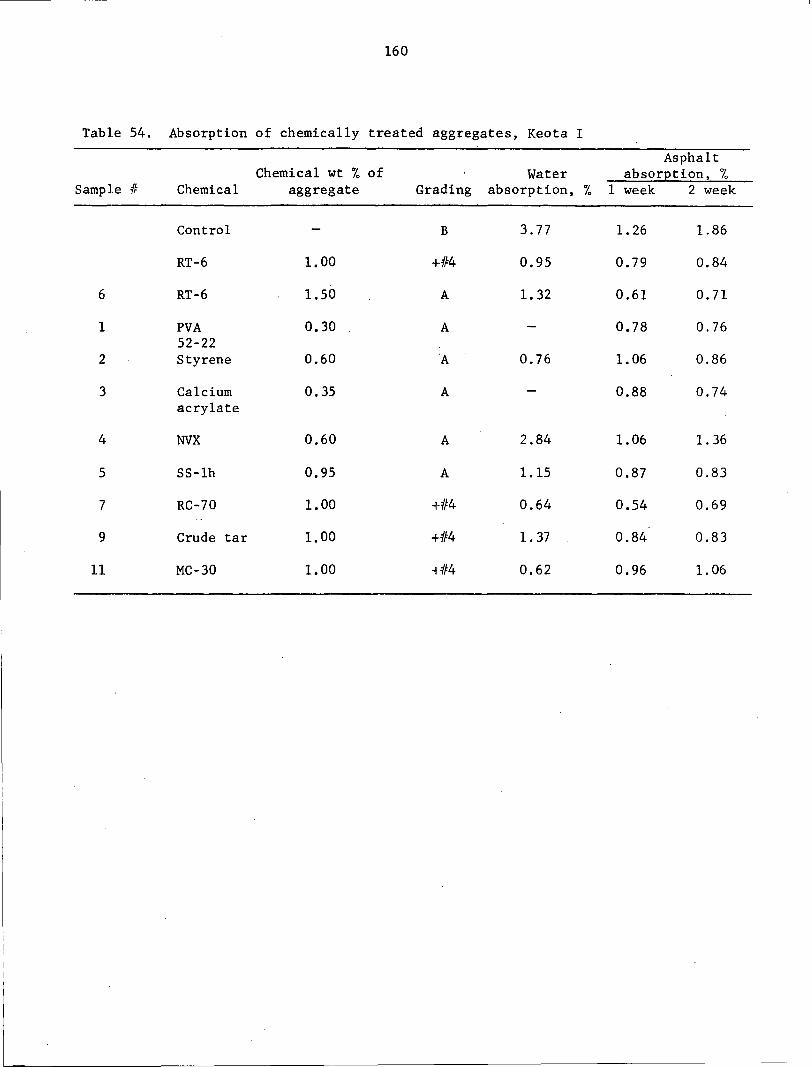
160
Table 54. Absorption of chemically treated aggregates, Keota I
Asphalt Chemical wt % of Water absorption, %
Sample :/fo Chemical aggregate Grading absorption, % 1 week 2 week
Control B 3. 77 1. 26 1.86
RT-6 1.00 +ffo4 0.95 0.79 0.84
6 RT-6 1.50 A 1. 32 0.61 0.71
1 PVA 0.30 A 0.78 0. 76 52-22
2 Styrene 0.60 A 0.76 1.06 0.86
3 Calcium 0. 3~) A 0.88 o. 74 acrylate
4 NVX 0.60 A 2.84 1.06 1. 36
5 SS-lh 0.95 A 1.15 0.87 0.83
7 RC-70 1.00 +ffo4 0.64 0.54 0.69
9 Crude tar 1.00 +ffo4 1. 37 0.84 0.83
11 MC-30 1.00 +ffo4 0.62 0.96 1.06

• 161
Table 55. Absorption of chemically treated aggregates, Keota II
Asphalt Chemical wt % of Water absoq~tion, %
Sample II Chemical aggregate Grading absorption, io 1 week 2 week
11 Control A 13. 70 8.33 8.62
5 SS-lh 0.90 A 9.55 5.65 5.60
101 SS-lh 0.90 B ' 6.50 3.83 4.28
10 Crude tar 5.65 +3/8" 4.09 2.06 2.42
7 Crude tar 7.45 A 3.89 2.21 2.54
1 PVA 52-22 0.85 A 7.42 7.59
2 Styrene 2.10 A 8.41 4.96 5.42
3 Calcium 1.25 A 5.75 5.88 acrylate
4 NVX 2.10 A 3. 76 2. 71 3.02
6 RC-70 3.85 A 8.07 3.98 4.08
8 MC-30 4.85 A 5.13 3.98 4.13
9 PVA 70-05 0.85 +3/8" 6~24 5.15
102 MC-4530 2.00 B 6.04 6.90
103 HA-8 2.00 B 5.97 6.33

162
Table 56. Absorption of chemically treated aggregates, Linwood
Asphalt Chemical wt % of Water absori;~tion, %
Sample 4F Chemical aggregate Grading absorption, fa 1 week 2 weeks
10 Control A 1.28 0.43 0.55
Control B 1.52 1.48 1. 57
24 RC.:.70 1.00 +118 0.43 0.17 0.14
9 RC-70 1.10 A 0.85 0.37 0.30
19 Crude far 1.00 A 0.66 0.19 0.28
25 Crude tar 1.00 +118 0.76 0.20 0.30
21 MC-30 1.00 A 1. 04 0.53 0.35
26 MC-30 1. 00 +118 0.92 0.34 0.15
1 PVA 0.15 A 0.50 0.54 52-22
22 PVA 0.20 +118 0.65 0.90 52-22
2 PVA 0.20 A 0.04 o.oo 70-05
3 Styrene 0.45 A 1.09 0.48 0.65
4 Calcium 0.30 A 0.52 0.96 acrylate
5 NVX 0.50 A 1.09 0.37 0.37
6 Polrainyl 0.40 A 1.65 0.44 0.62 ace ate
7 Rubber 0.60 A 0.41 0.51 latex
8 SS-lh. 0.95 A o. 70 0.04 0.40
11 K-101 0.62 A 1.11 0.42 0.37
12 AMS CO 0.62 A 1.07 0.50 0.56 3001
13 AN-139 0.25 A 0.52 0.40
14 CaC1 2 0.65 A 0.47 0.43
15 Acrylonitrile 0.55 A 1.17 0.41 0.49
16 Ca(OH) 2 1.00 A 0.52 0.50
17 HA-8 2.00 A 0.27 0.32
18 Methyl 1 .. 00 A 1. 25 0.64 0.54 acrylate
20 RT-6 1 .. 00 A 0.63 0.30 0.42

• 163
Table 57. Absorption of chemically treated aggregates, Menlo
Asphalt Chemical wt % of Water absoq~tion, %
Sample ff Chemical aggregate Grading absorption, fo 1 week 2 weeks
9 Control A 3.40 2.47 2.51
1 PVA 0.15 A 0.45 0.65 52-22
20 PVA 0.15 +3/8" 0.75 0.62 52-22
2 PVA 0.15 A 0.71 o. 77 70-05
3 Styrene 0.45 A 1. 39 1.00 1. 09
4 Calcium 0.25 A 0.48 0.90 acrylate
5 NVX 0.45 A 0.97 1.11 1.16
6 Rubber 0.55 A 0.68 0.80 latex
7 SS-lh 0.95 A 0.69 0.49 0.58
8 RC-70 1.00 A 1. 29 0.40 0.39
10 K-101 0.57 A 1.06 0.09 0.14
11 K-1010 0.40 A 1. 36 0.69 0.77
12 AMS CO 0.57 A 1. 70 0.13 0.18 3001
13 CaC12 0.55 A o. 78 o. 78
14 Acrylonitrile 0.45 A 1.40 0.80 0.87
15 Ca(OH) 2 0.55 A 0.31 0.52
16 Crude tar 1. 30 A 0.56 0.33 0.27
17 RT-6 1.00 A 0.80 0.47 0.51
18 MC-30 1.00 A 0.67 0.56 0.64
19 200-300 1.00 A 0.40 0.39 0.55 pen

164
Table 58. Absorption of ch1emically treated. aggregates, Pints
Asphalt Chemiclll wt t of Water abso!l!tion 1 1.
Sample # · Chemical a1~gregate Grading absorption, 1. 1 week 2 week
Control B 7.72 2.98 3.67 1 PVA 0.35 A 2.01 3.01
52-22 2 PVA 0.35 A 2.37 2.06
52-22 3 PVA 0,35 A 2.43 2.00
52-22 s Styrene 1.25 A 7.18 2.88 3.88
33 Styrene 1.25 +Ii+ 3.95. 1.91 2.25 34 Calcium 0.30 +#4 2. 77 3.10
acrylate 6 Calcium 0.55 A 4.33 4. 73
acrylate 8 Calcium 0.60 A 3.85 3.78
acrylate 7 Calcium 0.75 A 3.17 3.48
acrylate 35 SS-lh 0.50 +#4 5.25 2.46 2.85 12 SS-lh 0,95 A 6.46 1.91 2.09 14 SS-lb 1.10 A 6.30 2.20 2.19 13 SS-lh 1.90 A 6.02 1.84 .;..
36 Crude tar 1.00 +#4 3.09 0.74 0.78 25 Crude tar 1.95 A 4.66 1. 75 1. 72 26 Crude tar 2.95 A 4.04 1. 52 1.64 28 HC-30 1.00 A 6.48 2.12 2.31 37 HC-30 1.45 +#4 6.59 2.02 2.03 29 HC-30 2.00 A 5. 77 2.53 2.25 30 HC-30 2.!>; A 5.30 2.51 2.54 38 200-300 1.00 +#4 1. 24 0.89 1.11
Pen 31 200-300 2.00 A 4.52 0.96 1.18
Pen 4 PVA 0.35 A 3.63 3.65
70-05 9 NVX 1. 30 A 5.08 2.08 2.66
10 Polyvinyl 1.15 A 7.42 3.18 3.29 acetate
11 Rubber 1. 70 A 2.62 3.93 latex
15 RC-70 1.50 A 4.48 1.84 1.94 Cut-back
16 Methyl 1.00 A 7.15 2.90 2.91 acrylate
17 K-101 1. 70 A 4.50 1.64 1.88 18 K-1010 1.20 A 3.42 1.27 1.23 19 AHSCO 1. 70 A 7.29 2.68 2.21
3001 20 AN-139 0,60 A 2.94 3.10 21 Acrylonitrile 1.55 A 6.43 2.24 3.03 22 CaCl2 1. 70 A 3.64 3.67 23 Ca(OH) 2 1.00 A 2.97 2. 75 24 f:-330 1.90 A 1. 52 0.72
27 RT-6 2.95 A 4. 71 2.27 2. 72 32 PVA o. 70 +#4 2.61. 2.99
71-30

• 165
Table 59. Absorption of chemically treated aggregates, X-Quarry
Asphalt Chemical wt % of Water absoq~tion~
Sample 41 Chemical aggregate Grading absorption, % 1 week 2 week
Control B 4.02 2.39 2.48
Control +418 5.55 3.68 4.02
8 Crude tar 2.00 A 0.77 0.03 0.01
13 Crude tar 2.45 +418 0.65 0.82 0.95
9 MC-30 1.95 A 0.82 0.26 1. 54
14 MC-30 1.95 +118 1. 76 0.85 1.18
1 PVA, 0.25 A 0.55 0.51 52-22
2 PVA 0.55 A 1.06 1.13 71-30
3 Styrene 0.75 A 2.16 1.23 1.61
4 Calcium 0.50 A 0.89 1.00 acrylate
5 NVX 0.80 A 0.75 0.41 0.67
6 SS-lh 0.95 A 0.94 0.69 0.64
7 RC-70 1.25 A 1.67 0.00 0.11
10 PVA 0.30 +118 1.11 1. 28 70-05

166
SUMMARY AND CONCLUSIONS
• Most aggregates absorb asphalt to some degree. The absorption of
asphalt by aggregates may affect proper mixture design and pavement
failure due to delayed absorption.
• No standard method is available to evaluate, describe and specify
the absorptive characteristics of an aggregate with respect to asphalt.
There is a need to establish such a test.
• Indirect prediction of asphalt absorption by water absorption, CKE
or oil absorption is not always reliable.
• The bulk-impregnated sp1:!cific gravity (Corps of Engineers)method can
be used to determine th1:! practical or realistic maximum asphalt
absorption of an aggreg•:tte and is recommended for evaluating and
comparing potential aggregate sources; the Rice specific gravity
method can be used to d·etermine the practical or realistic minimum
asphalt absorption of an aggregate and is recommended for mixture
design.
• The accurate determination of asphalt absorption in both methods depends
upon the realistic and accurate determination of bulk specific gravity.
• Current ASTM methods for determination of bulk specific gravity of
aggregate are inadequate and non-reproducible for use in the asphalt
absorption tests recommended.
• Three methods for determination of bulk-specific gravity of aggregates
(chemical indicator method, mercury pycnometer or penetration method
and time-weight in water curve method) have been developed during this
investigation. However, all three need more work and further refinement
before formal adoption.

167
• Asphalt absorption is time dependent. Percent absorption increases
with time at decreasing rate.
• Asphalt absorption is directly related to the porosity of an
aggregate. The total porosity is a good indicator for absorption.
• Pore-size distribution of an aggregate has a direct effect on the
nature and degree of asphalt absorption. Good correlation was found
between percent porosity larger than 1 µ and asphalt absorption
for crushed aggregates and between percent porosity larger than 0.1 w
and asphalt absorption for rock cores. In general, asphalt absorption
increases as these coarse-pore porosities increase.
• Presence of ink-bottle pores of varying extent is indicated in all
cores. The probable dimensions of the pore throats and internal
cavities vary from one core to another and seem to affect the asphalt
absorption.
• The photo-colorimetric technique can be used to evaluate the asphalt
absorption of aggregates of all sizes and gradings~
• Chemical treatments of absorptive yet locally available aggregates
is the most promising and effective approach to alleviate the problem
of quality aggregate shortage which one-third of the US are facing.
Such treatments not only make unsuitable or "marginal" aggregates
useful but also reduces required optimum asphalt content, increase
water resistance and decrease the possibility of pavement failure
through reduction of effective binder content by delayed absorption.
• Among approximately 30 chemicals investigated, aniline-furfural, rapid
curing cutbacks, crude tar, methyl methacrylate, PVA, synthetic resins
K-101 and K-1010 were found to be effective in reducing asphalt
absorption. Others such as rubber latex, lignin, acrylic polymers,
•

168
while results were inconclusive, deserve further study for optimum
conditions of treatments.

169
RECOMMENDATIONS
Since the start of this project in 1968, no less than three important
studies concerning highway aggregates have been reported, all of which
have reinforced the importance and urgency of this research and correctness
of the approach and direction taken in this project.
The study by Witczak et a1. 97 has shown that aggregates are potentially
in short supply over about one-third of the ~nited States, i.e., these
areas have "limited to severe problem" ratings. Southern Iowa is included
in these areas. Gallaway98 reviewed the critical aggregate problems for
the 1970s and suggested better utilization of locally available aggregates,
expanded use of marginal materials (including better material evaluation
and specifications), selective use of solid wastes and benefaction of
otherwise unsuitable materials. 101 A study by Walker et al. has recommended
in high priority a research entitled "The Influence of Asphalt Absorption
Rate, Nature, and Amoun.t by Aggregate Particles on Bituminous Mix Design
and Performance."
In essence, these have been the philisophy, approach, and ultimate
goals of HR-142. In this project, the nature and extent of asphalt
absorption of limestone, of various chemical compositions have been studied;
the factors affecting asphalt absorption have been identified; the
characterization methods for asphalt absorption have been established and
the possibility and potentials of upgrading highly absorptive or marginal
aggregate have been explored. Bowever, in order to establish tolerance
levels of asphalt absorption rate and amount for specification and material
evaluation purposes, and to treat absorptive and marginal aggregates
economically and intelligently for use in asphalt paving mixtures, further
research is needed. The following programs are recommended:
•

170
• Field study of effects of asphalt absorption by aggregate,
especially in the areas of absorption history, influences on
physical properties of the mixture, such as voids and stability,
asphalt hardening a.nd low temperature cracking of asphalt films
due to absorption.
• Continued laboratory investigation of the feasibility (remedies
and methods) of uti.lizing absorptive aggregates for asphalt paving
mixtures.
• Field verification of laboratory developed concepts of mix design
using absorptive aggregates, modification of plant mixing operations,
construction standards, and specifications on aggregates and
asphalts.
• Identification and establishment of data file, on a regional
basis, on aggregatE~ types and sources that have high or detri
mental asphalt absorption characteristics.
• Expand the treatment or upgrading poor aggregate phase of research,
with experiences gained in HR-142, for the purposes of improving
other marginal aggregates in terms of soundness, stripping, and
hardness of the aggregates.

171
ACKNOWLEDGMENTS
This report is the result of a study undet Project HR-142, sponsored
by the Iowa Highway Research Board and the Iowa State Highway Commission.
The author is indebted to the Board for its support of this study and to
the engineers of the Iowa Highway Commission, Mr. Steve E. Roberts in
particular, for their interest and co-operation.
The author wishes to thank Dr. John Lemish, Professor of Geology
Department, for making available the mercury porosimeter used in this
study; to Dr. Adolf Voight, Ames Laboratory, for his permission to use
the Gamma Irradiation Facility; and to Mr. Joseph Crudele, Ames Laboratory,
for helping with radiation dosimetry wo.rk.
Acknowledgment is made to the Armour Industrial Chemical Company,
Box 1805, Chicago, Illinois 60650; E. I. du Pont Nenours and Company,
Wilmington, Delaware 19898; the Quaker Oats Company, Chemical Division,
Merchandise Mart Plaza, Chicago, Illinois 60654; Hercules Incorporated,
Wilmington, Delaware 19899; Heveatex Corporation, Melrose, Massachusetts
02176; Rohm and Haas Company, Philadelphia, Pennsylvania 19105; GAF
Corporation, Chemical Company, Minneapolis, Minnesota 55420; Diamond
Shamrock Corporation, Cleveland, Ohio 44115; Scott Paper Company,
Oconto Falls, Wisconsin 54154; Philadelphia Quartz Company, Primos,
Pennsylvania 19018; Union Oil Company of California, Palatine, Illinois
60067; Lawter Chemicals Company, Chicago, Illinois 60645; and Stauffer
Chemical Company, New York, New York 10017 for their generous donation
of chemicals used in this investigation.
The following individuals contributed, in various capacities at
various times, to this investigation: Prithvi S. Kandhal, Rathindra N. Dutt,
•
(

172
Laticia A. Davis, William B. Cook, Gary Zimmerman, Karen S. Ogbourne,
Denny V. Caslavka, Dale K. Vander Schaaf, and iarry W. Volkening.
This work was supported, in part, by fu~ds of the Engineering Research
Institute, Iowa State University. The scanning electron microscope used
in this work was purchased through National Science Foundation Grant GK26423.

113
REFERENCES
1. Bisque, R. E., J. Sed. Petro. 31, 113 (1961).
2. Pettijohn, F. J., Sedimentary Rocks, 2nd Ed., Harper and Row: N.Y. (1957).
3. Lee, Dah-yinn, Assoc. Asphalt Paving Tech. Proc. 38, 242 (1969).
4. Dinkle, R. E., MS thesis, University of Maryland (1966).
5. Scheidegger, A. E., The Physics of Flow through Porous Media, Macmillan: N.Y. (1957).
6. Dolch, W. L., ASTM, STP 169-A, 443 (1966).
7. Washburn, E.W., and Bunting, E. N., Am. Cer. Soc. J. 2. 112 (1922).
8. Beeson, C. M., Am. Inst. Mining Met. Petro. Eng. 189, 313 (1950).
9. Sweet, H. S., ASTM Proc. 48, 988 (1948).
10; Dolch, W. L., ASTM Proc. 59, 1204 (1959).
11. Washburn, E. W., and Bunting, E. N., Am. Cer. Soc. J. 2, 527 (1922).
12. Brunauer, S., Erranett, P.H., and Teller, E., Am. Chem. Soc. J. 60, 309 (1938).
13. Carman, P. C., Flow of Gases through Porous Media, Academic Press: N.Y. (1956).
· 14. Dallman, R. S., MS thesis, Iowa State University (1966).
15. Ritter, H. L., and Erich, L. C., Anal. Chem. 20, 7, 665 (July 1948).
16. Washburn, E.W., Nat. Acad. Sci. Proc. z, 115 (1921).
17. Ritter, H. L., and Drake, L. C., Ind. Eng. Chem. Anal. Ed . .!.Z,, 782 (1945).
18. Purcell, W. R., AIME Trans. 186, 39 (1949).
19. Drake, L. C., Ind. Eng. Chem. 41: 780 (April 1949).
20. Hiltrop, C. L., and Lemish, J., HRB Bull. 239, 1 (1960).
21. Lohn, R. N., Assoc. Asphalt Paving Tech. Proc. _!2, 188 (1943).
22. Kandhal, P. S., MS thesis, Iowa State University (1969).
•

23. Howard, E. L., Proc. Arn. Concrete Inst. 54, 1215 (1958).
24. Pearson, J. C., ~Prod. 32, 64 (1929).
25. Martin, J. Rogers, Assoc. Asphalt Paving Tech. Proc. 19, 41 (1950).
26. Saxer, E. L., Rock Prod. 87, 77 (1956).
27. Hughes, B. P., and B. Bahrarnian, Mat. Res. Standards, 18-23 (1967).
28. Kandhal, P. S., and D.Y. Lee, HRR,307, 44 (1970).
29. Hveern, F. N., Assoc, Asphalt Paving Tech. Proc. 13, 9 (1942).
30. Donaldson, J. A., Loomis, R. J., and Krchma, L. C., Assoc. Asphalt Paving Tech. Proc. lf~, 353 (1947).
31. Nevitt, H. G., and Krchrna, L. C., Assot. Asphalt Paving Tech. Proc. 13, 52068 (1942).
32. Lettier, J. A., Fink, D. F., Wilson, N. B., and Fraley, F. F., Assoc. Asphalt Paving Tech. Proc. 18, 278 (1949).
33. Goshorn, J. H., and Williams, F. M., Assoc. Asphalt Paving Tech. Proc. 13, 41 (1942).
34. Rice, J. M., ASTM STP 191, 43 (1956).
35. U.S. Corps of Engineers Waterways Experiment Station, Misc. Paper 4-88 (1954).
36. McLeod, N. W., Proc. HRB 36, 282 (1957). -----37. Lee, Dah-yinn, "Study of absorptive aggregates in asphalt paving
mixtures," Engineering Research Institute, Iowa State University Research Report HR-127 (1968).
38. Materials Manual, California Division of Highways (1966).
39. Ricketts, W. C., Sprague, J. C., Tabb, D. D., and McRae, J. L., ASTM Proc. 54, 1246 (1954).
40. Zube, E., and Cechetini, J., HRR, 104, 141 (1965).
41. Blavia, Moldenhauer & Law, Soil Science Soc. Am. Proc. 35, 119 (1971) .
42. Blavia, F. J., MS thesis, Iowa State University (1970).
43. Davidson, D. T., ~al., Iowa Eng. Exp. Sta. Bull. 193 (1960).
44. Williams, B. G., ~al., Australian J. Soil Res. ~. 85 (1967).

45. Dutt, A. K., Soil Sci. Soc. Am. Proc. 12, 497 (1948).
46. Emerson, W.W., J. Soil Sci. 47, 117 (1956).
47. Martin, W. P., Soil Sci. Soc. Am. Proc. 17, 1 (1953).
48. Dikeou, J. K., et al., ACI J. 829 (Oct. 1969).
49. Winterkorn, H. F., CAA Tech. Note No. 43 (1947).
50. Sheeler, J.B., Proc. HRB 36, 755 (1957).
51. Andrews, A. C., and Noble, G. G., Proc. HRB 29, 496 (1949).
52. Smith, J. C., Proc. Conf. Soil Stab. MIT,81 (1952).
53. Lambe, W. T., J. Boston Soc. Civil Engr. 38, 127 (1951).
54. Hauser, E. A., HRB Bull. 108, 58 (1955).
55. , Proc. HRB.l.?., 431 (1947).
56. Mainfort, R. C., CAA Tech. Development Rep. 136 (1951).
57. Clare, K. E., J. Soc. Chem. Ind. 68, 69 (1949).
58. Fungaroli, A. A., and Prager, S. R., Indr. Ind. Chem. Res. Dev.~. 4, 450 (1969).
59. Manowitz, B., et al., Paper presented at the IAEA Symposium on Utilization of Large Radiation Sources and Accelerators in Industrial Processing, Munich, Germany (1969).
60. Weldes, H. H., and Lange, K. R., Properties of Soluble Silicates, Ind. Engr. Chem. 61, 31 (1969).
61. Ellis, H. B., PhD thesis, Iowa State University (1956).
62. Afflack, J. G., Ind. Eng. Chem. 47, 2232 (1955).
63. Lambe, T. W., Ind. Eng. Chem. 47, 2234 (1955).
64. Lauritzen, C. W., Ind. Eng. Chem. 47, 2245 (1955).
65. Demirel, T., and Davidson, D. T., Iowa Acad. Sci. Proc. 2.2, 290 (1960).
66. Sinha, S. P., Davidson, D. T., and Hoover, J.M., Iowa Acad. Sci. Proc. 64, 314 (1957).
67. Nicholls, R. L., and Davidson, D. T., Iowa Acad. Sci. Proc. 64, 349 (1957).
•

174>
68. Demirel, T., Roegiers, J. V., and Davidson, D. T., Iowa Acad. Sci. Proc. 65, 311 (1958) ..
69. Grossi, F. X., and W1:>olsay, J. L., Ind. Eng. Chem. 47, 2253 (1955).
70. Hopkins, R. P., Ind. Eng. Chem. 47, 2258 (1955).
71. Laws, W. D., Soil Sci. Soc. Am. Proc. 18, 378 (1954).
72. Theng, B. K. G., Australian J. Soil Res. 1• 69 (1967).
73. Mainfort, R. C., HRB Bull. 108, 112 (1955).
74. Chu, T. Y. et al., HRB Bull. 108, 122 (1955).
75. U.S. Waterways Exp. Station Tech. Memo.217-1 (1946).
76. McAlpin, G. W. et al .. , CAA Tech. Dept. Development Report No. 35 (1944).
77. HRB Bull. 318 (1962).
78. Wang, J. W. H., and Krermnydas, A.H., HRB Record 315, 8 (1970).
79. Davidson, D. T., Iowa Engr. Expt. Station Report No. 4 (1951).
80. Dobbs, J. B. ' and Hitchcock, M., Waterway Experiment Station, Contract Report 3-174 (1967).
81. MIT, Waterway Experiment Station, Contract Report 3-2, Phase 1 (1948).
82. Ibid. Phase 2 (1950).
83. Ibid. Phase 3 (1951).
84. Ibid. Phase 4 (1952).
85. Ibid. Phase 5 (1953).
86. Ibid. Phase 6 (1954).
87. Ibid. Phase 7 (1955).
88. Ibid. Phase 8 (1956).
89. Ibid. Phase 9 (1957).
90. Ibid. Phase 10 (1958).
91. Ibid. Phase 11 (1959).
92. ~· Phase 12 (1960).

177
93. Ibid. Phase 13 (1961).
94. Dutt, R. N., MS thesis, Iowa State University (1970).
95. Lee, D. Y., ''Modification of Asphalt and Asphalt Paving Mixtures by Sulfur Additives," Engineering Research Institute Interim Report, Iowa State University, Ames (1971).
96. American Road Builders' Association, Research Report M-17 (1969).
97. Fondriest, F. F., and Snyder, M. J., NCHRP Report No. 8 (1964).
98. Witczak, M. W., Lovell, C. W., and Yoder, E. J., Paper presented at the SOth Annual Meeting of the Highway Research Board (1971).
99. Gallaway, B. M., Paper presented at the Annual Meeting of the Association of Asphalt Paving Technologists (1971).
100. Marais, C. P., National Institute for Road Research, South African Internal Report RB/A0/68 (1968).
101. Walker, R. D., Larson, T. D. and Cady, P. D., National Cooperative Highway Research Program Report 100 (1970).
•

TECHNlt~AL APPENDIX

A-1
APPENDIX A
Theses and Publications Resulting from HR-127 and HR-142
Lee, Dah-yinn, "Study of Absorptive Aggregates in Asphalt Mixtures," Iowa State Highway Commission Research Report, HR-127 (1968).
Lee, Dah-yinn, "The Relationship between Physical and Chemical Properties of Aggregates and their Asphalt Absorption". Proc. AAPT, 38, 242-275 (1969).
Kandhal, Prithri S., "Asphalt Absorption as R~lated to Pore Characteristics of Aggregates", M.S. Thesis, Iowa State University (1969).
Lee, Dah-yinn, "Absorption of Asphalt by Aggregate", Iowa State Highway Commission Progress Report No. 1 (1970).
Kandhal, P. S. and Lee, D. Y., "An Evaluation of the Bulk Specific Gravity for Granular Materials", Highway Research Records, 307, 44-55 (1970).
Dutt, R. N., "Upgrading Absorptive Aggregates by Chemical Treatments", M.S. Thesis, Iowa State University (1970).
Dutt, R. N. and Lee, D. Y .. , "Upgrading Absorptive Aggregates by Chemical Treatments",, Highway Research Records 353: 43 (1971).
Kandhal, P. S. and Lee, D. Y., "Asphalt Absorption as Related to Pore Characteristics of Aggregates". Paper to be presented at the 1972 Annual Meeting of the Highway Research Board.

B-1
APPENDIX B
Summary of Materials Studied as Possible Agents for
Absorptive Aggregate Treatments
Aniline-Furfural
Description
Aniline-furfural was the cheapest synthetic bonding agent considered for soil stabilization. Aniline is a colorless to light yellow liquid, soluble in water (5.2 dry wt%), alcohol, benzene and most organic solvents, and is a primary aromatic amine to which all other compounds in this organic family are related. Furfural is a colorless to red-brown liquid manufactured from agricultural residues such as oat hulls, corncobs, cottonseed hulls, etc. and is soluble in water (8.3 dry wt%), alcohol and ether. Furfural polymerizes with aniline to a water-insoluble hard, dark red resin. Aniline is toxic but toxicity ceases after polymerizes with furfural. The polymerization mechanism is not known; however, it has been found that a mole ratio of 2 parts aniline and 1 part furfural is most effective. In this experiment, 0-9 wt % of aniline-furfural with 2:1 molar ratio were used in crushed and cored aggregates, oven cured at 140 OF for 3 days.
Aggregates Treated
Cook and Menlo, both crushed-graded ~nd 1/2 in. cylindrical cores.
Tests
Water absorption (W)
Asphalt absorption by innnersion method (AI)
Asphalt absorption by Rice method (AR)
Marshall stability (M)
Heat stability at 400 OF
•

B-2
Remarks
• Aniline and furfural are both liquids and do not need water dilution.
• Aniline is toxic before polymerization.
• Treatment by these chemical combinations is promising
Acrylic Polymers
Description
In addition to Methyl methacrylate and calcium acrylate, five more acrylic polymers were studied: acrylonitrile, methyl acrylate and three acrylic polymers from Rohm and Haas Co. (Rhoplex HA-8, E-330, and MC-4530). The former two polymers WE~re tried at MIT for soil stabilization (Ref. 84, 87 ), HA-8 is a milky-white nonionic self-crosslinking acrylic polymer emulsion used in textile :industry for fabric finishing and adhesives; E-330 and MC-4530, also milky-white emulsions, are portland cement mortar modifiers. Acylon:itrile was added as 2% acetone solution to aggregate in percentages from 0.5-1.5. Methyl acrylate was dissolved in methanol and added to aggregate at 1% level. Rhoplex HA-8, E-330 and M-4530 were diluted with water and added to aggregates at 2% level. Acylonitrile-treated aggr•egates were air-cured and the other mixed were oven-cured at 140 °F until constant weight.
Aggregates Tested
Laboratory crushed and graded Linwood, Menlo, and Pints.
Tests
W and AR
Remarks
• Acrylonitrile was effective only on Menlo aggregate, possibly due to incomplete polymerization. Polymerization may improve by use of a redox system such as ammonium persulfate plus sodium sulfite or sodium metabisulfi te.

B-3
• Methyl acrylate was ineffective, possibly due to failure of removing of inhibitor before polymerization and use or catalyst in the treatments.
• Rhoplex polymers, especially E-330, were effective and easy to apply. They should be further investigated.
Armac T
Description
Armac T is a water soluble amine acetate made from long-chained amines obtained from fatty acids. A characteristic of Armac T which has been used industrially is its ability to cause certain hydrophilic surfaces to become water repellent. In this investigation, Armac Twas first diluted with water and then added to aggregates at percentages between 1/2-8 wt % of aggregate. Treated aggregates were cured at 230°F for five days .
Aggregates Treated
Cook and Menlo, both crushed, graded, and cores.
Tests -· W, AI, AR, M, and H.
Remarks
Effective at 6% by "pore-plugging" mechanism. Lower (e.g. 1/2%) dosage should be possible if "surface changing" mechanism is utilized.
•

B-4
Bituminous Materials
Description
Six bituminous materials were tested as aggregate treatment agents. They included one asphalt cement (200-300 pen.), a rapid-curing cutback (RC-70) a medium-curing cutback (MC-30), a slow-setting asphalt emulsion (SS-lh), a road tar (RT-6), and a crude tar. Asphalt cement was added at 1 and 2 wt% of aggregate (Menlo and Pints). Both asphalt and aggregate were heated to 300 °F prior to mixing. The MC-30 was used to pretreat all aggregates studied at varying cutback content of 1. 00-4.85% (asphalt residue content of 0.55 to 2.66%). Mixing was done at room temperature. Treated aggregates were air-cured for four days and oven-cured at 140 OF for two days. The RC-70 was also added and mixed at room temperature. Range of percent cutback was from 1.00-3.85% (asphalt residue content of 0.62-2.39%). The SS-lh was added to all aggregates at a concentration of 1% emulsion or 0.65% asphalt residue. Emulsion was first diluted with distilled water to volume sufficient to cover all aggregate particles and then mix:ed at room temperature and cured at 140 OF to constant weight. The crude tar and road tar RT-6 were obtained from U.S. Steel. The crude tar was tested on all aggregates at percentages between 1.0-7.5 wt% of aggregate. Aggregates were treated.at room temperature and cured at 220 °F until constant Meights were attained. The RT-6 was also tested on all aggregates at concentrations between 1-3 wt % of aggregate. Both· mixing and curing were carried out at 220·oF.
Aggregates Treated
All laboratory crushed and graded including both gradings A and B. Total number of treated samples: 57.
Tests
W, AR.
Remarks
• With 1% agent, absorption can be reduced by 50-80%.
• Most effective: RC·· 70 and crude tar.
• Pretreatment with bituminous materials at 1% level seemed to retard delayed asphalt absorption.
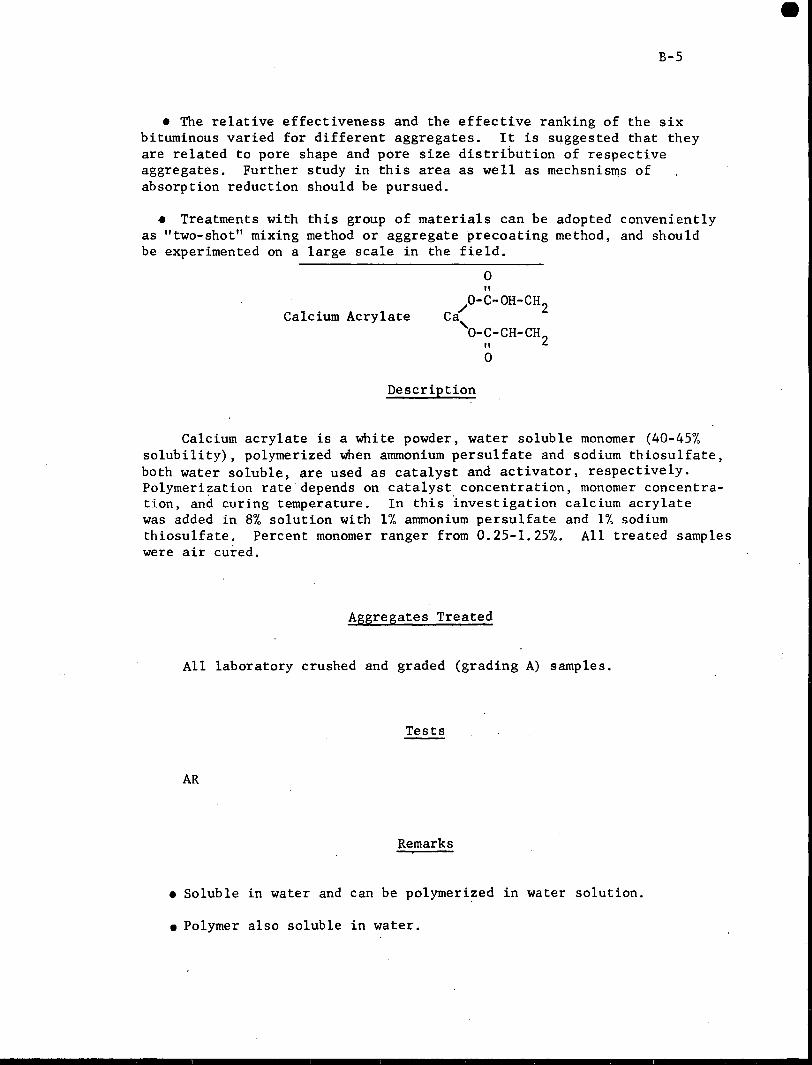
B-5
• The relative effectiveness and the effective ranking of the six bituminous varied for different aggregates. It is suggested that they are related to pore shape and pore size distribution of respective aggregates. Further study in this area as well as mechsnisms of absorption reduction should be pursued.
• Treatments with this group of materials can be adopted conveniently as "two-shot" mixing method or aggregate precoating method, and should be experimented on a large scale in the field.
0 II
Calcium Acrylate 0-C-OH-CH
c / 2 a, 0-C-CH-CH
II 2 0
Description
Calcium acrylate is a white powder, water soluble monomer (40-45% solubility), polymerized when ammonium persulfate and sodium thiosulfate, both water soluble, are used as catalyst and activator, respectively. Polymerization rate depends on catalyst concentration, monomer concentration, and curing temperature. In this ·investigation calcium acrylate was added in 8% solution with 1% ammonium persulfate and 1% sodium thiosulfate. Percent monomer ranger from 0.25-1.25%. All treated samples were air cured.
Aggregates Treated
All laboratory crushed and graded (grading A) samples.
Tests
AR
Remarks
• Soluble in water and can be polymerized in water solution.
•Polymer also soluble in water.
•

B-6
• Moderately effective at the range of percent chemical experimented.
• Expensive.
Inorganic Materials (Sodium silicate, hydrated lime,
calcium chloride and Siroc 132 system)
Description
Four chemicals in th:is category were tested, all of them were used at some time as cementing and/or grouting agents for soil stabilization. Sodium silicate alone or with inorganic salt such as calcium chloride has been used successfully for soil stabilization and chemical grouts. Various types of sodium silicates (different Na20/Si02 ratios) were tried with and without calcium chloride to treat aggregates oy ei~ner vacuum soaking or mixing. However, limited results failed to show improvements. Siroc grout system 132 (Siroc No. 1 is a modified sodium silicate, Siroc No. 2 is a formamide reactant, and Siroc No. 3 is a dry crystalline accelerator) was also tested on several aggregate samples and was unsuccessful. Calcium chlciride and hydrated lime were added to aggregate in water solution at average concentration of 1 wt %. Treated aggregates were oven cured at 220 °F to constant weights and then mixed with asphalt for absorption by the Rice method.
Aggregates Treated
Laboratory crushed and graded Menlo, Linwood, Pints, and Cook.
Tests
AR
Remarks
• Silicate treatments were not effective. However, in view of the proven success of sodium silicate in soil_ stabilization it is possible that the negative results in these series' of trials may be due to lack of proper conditions of treatment (concentration of sodium silicate,

B-7
soda-silicate ratio, concentration of calcium ions, method of m1x1ng or penetration, temperature of mixing and curing, etc.) rather than chemical itself. Further studies should be made.
• Calcium chloride and calcium hydroxide were effective in reducing asphalt absorption only on Menlo aggregate.
Li_gnin
Description
Waste sulfite liquor (lignosulfonate) from the paper industry has been used on roads as cementing agent, but being water-soluble it must be periodically replenished. An alternative is to chemically polymerize the calcium lignosulfonate to produce a water-insoluble resin. Chromium ions introduced as sodium or potassium dichromate react with the lignosulfonate to form a dark, water-insoluble gel-like mass.
Aggregates Treated
Crushed and graded Menlo and Cook.
Tests
W and AR
Remarks
•Ineffective without chromium ions (water soluble).
• Water absorption reduced by 50% when 3% lignin and 1% potassium dichromate was used in solution and cured at 220 op for 24 hours.
• Promising,due to lignin's low cost.
•

B-8
Methyl Methacrylate
Description
Methyl Methacrylate polymers have been used in industry for airplane windows, light fixtures, dental fillings, reflectors, and automobile tail lights. The methyl ester of methacrylic acid is a clear, colorless liquid that reacts with numerous reagents and polymerizes into a clear, colorless, transparent, water-insoluble plastic (Polymethyl methacrylate) with softening point, impact strength and weatherability better than most thermoplastics. Rock cores were first vacuum impregnated with a liquid monomer consisting of 90 wt % of methyl methacrylate plus 10 wt % of trimethylolpropane trimethacrylate; they were then polymerized by one of two methods: cobalt gaunna radiation or thermal catalytic technique. Both of these methods have been tried. As far as reduction in water and asphalt absorption properties of the rock cores are concerned, same degree of improvement was obtained in both cases. One percent .benzciyl peroxide was used as a free radical initiator in thermal polymerization (at 185 °F for 1 hour). Total dosage of 1 megarads was used in radiation treatment.
Aggregates Treated
Cook and Menlo rock cores and crushed-graded.
Tests
W, AI, and AR
Remarks
• Expensive ($0.45/lb.), but very effective.
• Techniques should be developed for radiation polymerization in field plant operation.
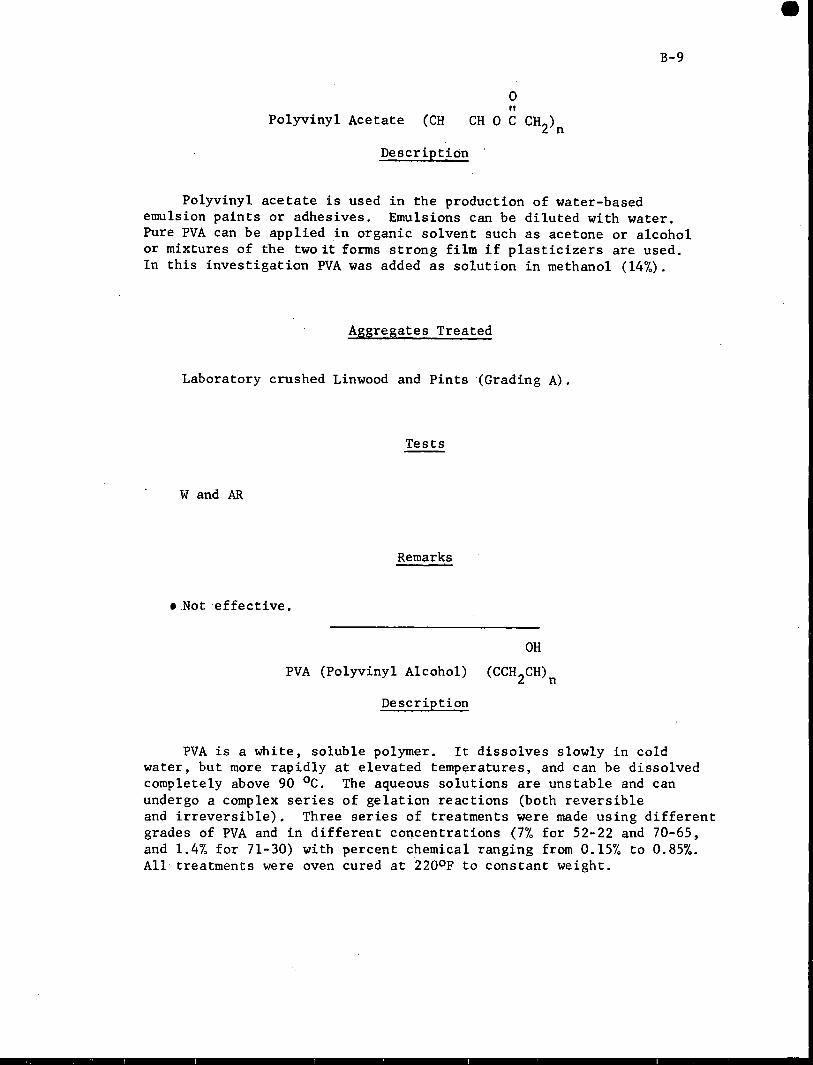
B-9
Polyvinyl Acetate (CH
Description
Polyvinyl acetate is used in the production of water-based emulsion paints or adhesives. Emulsions can be diluted with water. Pure PVA can be applied in organic solvent such as acetone or alcohol or mixtures of the two it forms strong film if plasticizers are used. In this investigation PVA was added as solution in methanol (14%).
Aggregates Treated
Laboratory crushed Linwood and Pints ·(Grading A).
Tests
W and AR
Remarks
• Not effective.
OH
PVA (Polyvinyl Alcohol) (CCH2CH)n
Description
PVA is a white, soluble polymer. It dissolves slowly in cold water, but more rapidly at elevated temperatures, and can be dissolved completely above 90 °c. The aqueous solutions are unstable and can undergo a complex series of gelation reactions (both reversible and irreversible). Three series of treatments were made using different grades of PVA and in different concentrations (7% for 52-22 and 70-65, and 1.4% for 71-30) with percent chemical ranging from 0.15% to 0.85%. All treatments were oven cured at 22QOF to constant weight.
•

B-10
Aggregates Treated
All laboratory crushed and graded aggregates.
Tests
AR
Remarks
• Dry polymer film is water soluble.
• Effective for most aggregates.
• Unstable at temperatures above 200 °c.
• Requires no organic solvent.
Rubber Latex
Description
An ammoniated natural latex from Heveatex Co. was used in the study. This latex, known also as S-4 latex, contains 61% dry rubber. Rubber was added to aggre!gates as mixtures of 1 part latex to 6 parts water. Latex content of treated aggregates ranged from 0.6-1.7%.
Aggregates Treated
Laboratory crushed Linwood, Menlo, and Pints meeting gradation A.
Tests
Asphalt absorption by Rice method.

B-11
Remarks
• Results of three aggregates inconsistent.
• Could have duel functions of modifying both aggregate and asphalt.
• Deserves further study.
Natural and Synthetic Resins
Description
Five resinous materials were investigated for the purpose of reducing aggregate absorption. They were: (a) Vinsol NVX, a neutralized Vinsol resin that was used to impart water-repellent characteristics in soil stabilization; (b) Synthetic resins Krumbhaar K-101 (a resin modified phenolic), and K-1010 (a pure phonolic resin), both from Lawter Chemical Co.; (c) Armsco Resin 3001 from American Mineral Spirits Co.; and (d) Gantrez Resin AN-139, a medium molecular weight grade poly (methyl vinyl ether/maleic anhydride) from GAF Corp., used, among other things, as film former (adhesives and coatings), soil conditioner, emulsifier, flocculant, binder, air-entraining agent and stabilizer. The powdered NVX was added to aggregates in 13% acetone solution ranging from 0.45-2.10 wt% of aggregate. The treated aggregates were air cured for 3 days followed by oven curing at 220 OF for two days before water absorption and asphalt absorption determinations were made. Resin K-101 was added at concentration between 0.57-1.70 wt% of aggregate in 18% acetone solution. Resin K-1010 was added at concentrations of 0.49%-1.46% in 17% methanol solution. Both mixing and curing were done at room temperature. Armsco Resin 3001 (emulsion) was mixed with aggregate in 18% ethanol solution. Percent resin ranged from 0.57-1.70%. Both mixing and curing were done at room temperature. Grantrez Resin AN-139 was added to aggregate in 7% water solution at percentage from 0.2-0.6 wt% of aggregate. Mixtures were air cured for 3 days and oven cured to constant weight before absorption tests were run.
Aggregates Treated
All aggregates.
•

Tests
Water absorption and asphalt absorption by Rice method.
Remarks
• Resins K-101 and K-1010 were very effective in reducing both water and asphalt absorption.
• Vinsol NVX was reasonably effective.
• Resins Amsco 3001 and AN-139 were not effective.
Styrene or Polystyrene
Description
9 -(CH CH) -
2 n
B-12
Styrene is a colorle~ss liquid monomer soluble in aromatic hydrocarbons and acetone. It can be polymerized (usually with a peroxide initiator) in solution, suspension or in bulk. Polystyrene is a thermoplastic, with reasonably good mechanical and thermal properties. In this investigation styrene was added to aggregates as 14% solution in acetone. Percent chemical in treated aggregates were between 0.45-2.10%. All treated aggregates WE~re cured at 140 °F until constant weight.
Aggregate Treated
All laboratory crushed and graded (A) samples.
Tests
W and AR
Remarks
• Water insoluble; acetone as solvent is expensive and toxic.

B-13
• Moderately effective. Effectiveness may improve if initiator (benzol peroxide) were used.
• Softens at 100 oc.
•

APPENDIX C
Determination of Bulk Specific Gravity of Aggregates
Mercury Pycrometer Method
Description
A sketch of the apparatus is shown in the figure below.
3/4 in. WOODEN ROTATIVE MOUNTING FOR APPARATUS.
TAPERED STOPPER.
GROUND SURFACE ..
250 ml CONSTANT VOL. SAMPLE CHAMBER .. 'TOP SCREEN I 10
BOTTOM SCREEN 1100
250 ml BURETTE GRADUATED TO 1 ml . . OUTER GLASS TUBE ,
3/4 in THICK 16 in DIAM WOODEN BLOCK FIXED ON WALL
CLAMP.
3-WAY TEFLON . STOP CLOCK
500 ml MERCURY RESERVOIR GRAIL>UATE TO 10 ml
2-WAY TEFLON STOP CLOCK
C-1
42 in.

C-2
The apparatus consists of: (a) 250 ml constant volume sample chamber,
(b) 250 ml burette, (c) 500 ml mercury reservoir. The apparatus is
mounted on wood which rotates on a pivot.
Procedure
Mercury is poured into the reservoir with the apparatus in an
inverted position· (with 3-way stop-cock closed). The apparatus is
then set in the normal position. The following steps comprise a
normal determination:
1. Apply vacuum grease and insert and secure the stopper by clamps (or springs).
2. Apply the 27 in. vacuum and evacuate the apparatus for 10 min.
3. Invert the apparatus and record the Hg level in the burette (A, cc) at 1 atm.
4. Close the stop-cock and again evacuate the apparatus. Return the apparatus to its normal position.
5. Open the 3-way stop-cock to atmosphere. Open the stopper and put the previously weighed (W, gms) aggregate in the sample chamber. Replace the stopper and secure it to the apparatus.
6. Evacuate the apparatus for 10 min.
7. Rotate and invert the apparatus; record the displaced Hg level in the burette (B, cc) at atmospheric pressure.
8. Close the two-way stop-cock, evacuate the apparatus for 10 min., then bring it to its normal position.
w Bulk specific gravity = -8~_~A
9. The mercury should be cleaned occasionally. This can be done by putting mercury in a container, covering it with a layer of 10% nitric acid, then blowing air through it by applying a vacuum for 3-4 hr, and then washing it with water and drying with blotting paper.
•

C-3
Data
A preliminary test was conducted on 1/2-in. rock cores, and the
following results were obtained:
Bulk sEecific gravit~ Rock core By pyconometer By ASTM
Menlo 2. 710 2.637 Pints 2.312 2. 271 Linwood 2.694 2.636 Cook 2.622 2.565 Keota 2.549 2.489
Samples were weighed to 0 .. 0001 gm and volume observed to 1/4 cc.
ImErovements of Procedure
.1. Have the burette read to the nearest 1/10 ml instead of. 1/4 ml as on th1~ present apparatus.
2. The orifice at the bottom of the sample chamber (below the screens) could ;be widened to have a bore equal to that of the burette. This is necessary since the present apparatus has to be rotated back and forth to eliminate residual air bubbles trapped between the orifice and fine screen.
3. Good stop-cocks to withstand the vacuum; the present ones, though teflon coated, have to be coated with vacuum grease.
4. Contamination of the mercury by grease in the stopper of the sample chamber and stop-cocks should be avoided.
5. Use a more effective clamp to insure no movement of the stopper.
Chemical Indicator Methods
Cobalt Chloride (C0Cl2) Method
The procedure is the same as for ASTM C-127 and C-128 test except
for the following points:

C-4
1. Inunerse the sample in a 5% solution of cobalt chloride instead of plain water for 24 hr.
2. Remove the sample from the solution and put on a white · surface such as a table or enameled tray. The aggregate may not seem colored, but the visible water films on the aggregate will be pinkish in color.
3. Spread the sample in such a fashion that a layer of individual particles are exposed to a gently moving current of warm air. Stir frequently to secure uniform drying. Some of the solution sticking to the porcelain will appear to be pink.
4. As drying proceeds, the aggregate attains bluish color which helps in adjusting the warm air. Frequently turn aggregate over by gentle hand action. If there is still some moisture left on the surface of the aggregate, the bluish color on the porcelain will change back to pink. Keep turning the sample, while exposing it to warm air, until all the aggregate is bluish in color and the bluish spots on the white porcelain no longer turn pink. This is assumed to be saturated surfacedry condition.
5. The saturated surface-dry coarse aggregate is innnediately weighed in air and water as outlined in the ASTM·C-127 test, while the fine aggregate is introduced into the Chapman's flask, filled with water to the 200 ml mark.
Fluorescein Di-Sodium Salt (FSS) Method
The procedure is essentially the same as the Cocl 2 method. In this
case a 0.5% solution of fluorescein di-sodium salt is used.
The sample is dried in the same manner as in the previous test.
The sample acquires a yellowish color when taken from the solution
after 24 hr immersion. On drying, an orange color appears on the
aggregate, the porcelain also changes to a distinct orange. This is
assumed to be the saturated surface-dry condition and the sample is
further treated as per ASTM C-127 and C-128 tests' procedure.
•

c-s
The Cocl2
method is suitable for whitish to light grey colored
aggregate. For dark aggn~gate, a 10% solution of Cocl 2 can be employed
or FSS can be used.
Before removing the :samples from the solution, the latter should
be agitated by turning ovier the aggregate.
Because a bluish color acquired by the saturated surface-dry
aggregate fades with time, indicating possible adsorption of moisture
from air or drawing moisture from within through capillaries, the
sample should be weighed irmnediately.

D-1
APPENDIX D
Determination of Asphalt Absorption
Immersion Method
Procedure:
The following procedure was adopted: the bulk specific gravity
and water absorption of the aggregates were determined in accordance
with ASTM C-127. Weighing was done to th~ nearest 0.1 gram.
The aggregates were heated to 3000-325 OF and suspended, by
means of a tared wire basket, in asphalt at 300 °F for one hour.
The basket was thert removed from the asphalt and suspended in the oven
at 300 OF for 10 minutes to drain off the excess asphalt. The basket
with coated aggregate was cooled to room temperature and weighed in
air and in water at 77 OF,
Calculation:
From the above procedure, the following data were derived:
1. Weight of basket in air, gm.
2. Oven dry weight of cores+ basket in air, gm.
3. Weight of coated aggregate + basket in air, gm.
4. Weight of coated aggregate + basket in water, gm.
5. Weight of basket in water, gm.
6. Weight of coated aggregate in water = 4-5
7. Weight of oven-dried aggregated in air= 2-1
8. 7 Bulk volume of aggregate = ~------------~ Bulk sp. gr.
9. Weight of asphalt = 3-2
10. Weight of coated aggregate in air = 3-1
•
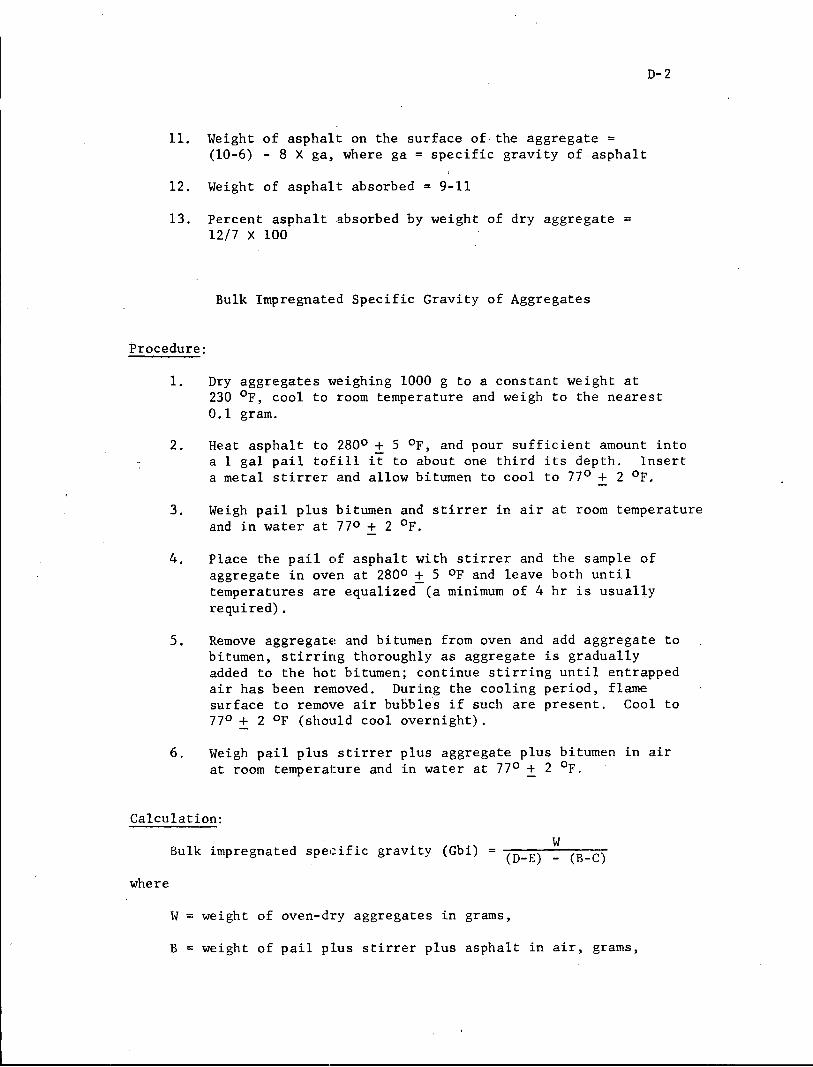
11. Weight of asphalt on the surface of the aggregate = (10-6) - 8 X ga, where ga = specific gravity of asphalt
12. Weight of asphalt absorbed "" 9-11
13. Percent asphalt absorbed by weight of dry aggregate = 12/7 x 100
Bulk Impregnated Specific Gravity of Aggregates
D-2
Procedure:
1. Dry aggregates weighing 1000 g to a constant weight at 230 °F, cool to room temperature and weigh to the nearest 0.1 gram.
2. Heat asphalt to 2800 ± 5 °F, and pour sufficient amount into a 1 gal pail tofill it to about one third its depth. Insert a metal stirrer and allow bitumen to cool to 77° + 2 °F.
3. Weigh pail plus bitumen and stirrer in air at room temperature and in water at 770 + 2 °F.
4. Place the pail of asphalt with stirrer and the sample of aggregate in ove:n at 2800 + 5 OF and leave both until temperatures are: equalized (a minimum of 4 hr is usually required).
5. Remove aggregate! and bitumen from oven and add aggregate to bitumen, stirring thoroughly as aggregate is gradually added to the hot: bitumen; continue stirring until entrapped air has been removed. During the cooling period, flame surface to remove air bubbles if such are present. Cool to 770 + 2 oF (should cool overnight).
6. Weigh pail plus stirrer plus aggregate plus bitumen in air at room temperature and in water at 77° + 2 °F.
Calculation:
Bulk impregnated specific gravity (Gbi) w
(D-E) - (B-C)
where
W = weight of oven-dry aggregates in grams,
B = weight of pail plus stirrer plus asphalt in air, grams,

where
D-3
= c weight of pail plus stirrer plus asphalt in water, grams,
D = weight of pail plus stirrer plus asphalt plus aggregates in air, grams,
E = weight of pail plus stirrer plus asphalt plus aggregates in water.
Asphalt absorption is calculated:
1 1 A + (Gb - Gbi) X ga X 100
A = asphalt absorption by weight of aggregates, percent,
Gb = bulk specific gravity of aggregates (as per ASTM C-127),
Gbi = bulk impregnated specific gravity of aggregate, and
ga = specific gravity of asphalt.
Modified Rice Method
1. About 500 g of the bituminous mixture is weighed to the nearest 0.1 g (A) and introduced into the pycnometer.
2. The pycnometer is filled with 0.01% aerosol solution to cover the sample. ·
3. The entrapped air in the sample is removed by agitation and applying vacuum (25 in. Hg) to the pycnometer with an aspirator for 15 min.
4. The pycnometer is completely filled with aerosol solution and brought to a temperature of 77 Of in a water bath and weighed to the nearest 0.1 g (B).
5. The pycnometer is. completely fi'iled with aerosol solution above and brought to 77 °F and weighed to the nearest 0.1 g (C).
6. The maximum specific gravity of the mixture
A Dm=A+C-B
7. The effective specific gravity of the aggregate
100 - Wa Ge = 100/Dm - Wa/ga
•

D-4
where
Wa =percentage asphalt (by weight of mixture), and
ga specific gravity of asphalt.
8. Asphalt absorption
(Ge - Gb) lOO Aac = X ga X Ge X Gb
where
Gb bulk specific gravity of aggregates.
Top Related