


Languages
Pages
Legal

DP2015-12
A Reexamination of Changes in Accounting Policy: Evidence from Japan
Masahiro ENOMOTO
March 19, 2015

A Reexamination of Changes in Accounting Policy: Evidence from Japan
Masahiro Enomoto
Research Institute for Economics & Business Administration Kobe University
2-1 Rokkodaicho, Nada-ku, Kobe 657-8501, JAPAN. E-mail: [email protected]
Tel: +81-78-803-7031; fax: +81-78-803-7031.
March 2015
A Reexamination of Changes in Accounting Policy: Evidence from Japan
Abstract
This paper reconsiders various hypotheses tested in the literature concerning income
smoothing, the big bath, financial distress, debt covenants, management turnover,
ownership structure, and auditors. The results show that changes in accounting policy
have been carried out for income smoothing. The analysis also indicates a big bath
accounting. A higher debt ratio produces more changes in accounting policy, resulting in
both income decreases and increases. A higher bank ownership ratio leads to more
changes in accounting policy, which decreases income. Banks serve as both shareholders
and creditors. Banks’ influence as creditors increases when the debt ratio increases. This
paper finds that banks influence both income increases and decreases through changes in
accounting policy. The evidence also shows that management turnover promotes income
increases through changes in accounting policy, while an audit by a Big N firm effectively
restrains accounting policy changes that increase income. I find that management changed
its accounting policy depending on circumstances, even when the changes were clear
from the disclosures and could be seen as earnings management.
JEL Classification: M41
Key Words: Change in Accounting Policy, Earnings Management
1

1. Introduction
This paper reconsiders changes in accounting policy, which researchers have often used
to proxy for earnings management, focusing on its relation to performance and other
factors. Prior literature shows evidence that managers use accounting discretion and/or
real discretion to manage earnings. From the 1960s to the 1990s, there have been many
studies on accounting discretion—a concept that includes changes in accounting policy—
as a means of earnings management.1 However, after Healy (1985), there has been an
increase in papers that use accounting accrual as a way to measure the degree of earnings
management rather than changes in accounting policy.
There have been numerous studies on real discretion that focus on individual items, but
now, like Roychowdhury (2006), mainstream researchers are turning to studies that
comprehensively estimate real discretion. This means that most earnings management
studies focus on methods that estimate accounting accrual and real discretion using
models. Actually, in the 2000s, the number of studies on changes in accounting policy
seems to have been much lower than before, in Japan and elsewhere. However, data on
changes in accounting policy in Japanese firms has been published every year since the
fiscal year ending March of 1999, enabling easier acquisition of data in larger volumes
than before.
This study collects data on changes in accounting policy and reexamines hypotheses on
income smoothing, the big bath, financial distress, debt covenants, management turnover,
ownership structure, and auditors that have been tested in the prior literature. Virtually no
recent research has investigated the relationship between these factors and changes in
accounting policy.
Management can handle accounting numbers by changing only accounting policies,
and not any real activities. However, accounting changes must be checked by auditors;
1 Instead of changes in accounting policy, Zimijewski and Hagerman (1981) employ the portfolio of accounting procedure, which is combination of various accounting methods.
2

income increasing changes in particular will easily gain the attention of stakeholders in
addition to auditors, because management must disclose in a footnote any changes that
have a material effect. It is easy for researchers to know precisely what effect a change in
accounting policy will have on earnings management, though it must be noted that not all
changes can be used as proxy variables for earnings management.
One feature of changes in accounting policy is that they have effects on future earnings.
For example, if a company changes the depreciation method it uses from the declining-
balance method to the straight-line method, it will increase current earnings and decrease
future earnings. This means that a change may have an adverse effect on future periods.
On the other hand, if the change-in-completion method a company applies changes, it
will not be clear whether or not this is a reversal. When carrying out a change in
accounting policy, management should take into consideration the effects on current and
future periods.
Real discretion as a means of earnings management has been widely examined.
Individual items employed are SG&A, R&D expenses, advertising expenses, gain and
loss of sale of securities and fixed assets, and so on. Studies have also appeared that
comprehensively estimate real discretion, such as sales management. This direction of
research resembles the study of accounting discretion.
One problem of this method is that it is difficult for researchers to distinguish between
the opportunistic management of earnings and daily operating activities. Therefore, real
discretion will not be more noticeable to auditors than accounting discretion. When the
results of real discretion, such as gains and losses on sales of fixed assets and securities,
are disclosed as separate items, they may be discovered out by stakeholders. In contrast,
if the results of real discretion are included in regularly appearing accounting items, such
as sales, COGS, and SG&A, it is necessary to estimate the amount of real discretion, since
it is difficult to identify. In addition, real discretion is likely to have the effect of
3

decreasing future income.2 As is the case with real discretion, one of the purposes of
using accounting accrual is to comprehensively grasp the degree of earnings management
being used—including accounting discretion and real discretion, which are difficult to
judge from superficial accounting figures.
Accounting accrual is the difference between earnings and cash flow, reflecting all
adjustments to the accrual accounting. In contrast with changes in accounting policy, with
accounting accrual it is necessary to estimate the discretionary portion that has accrued
due to earnings management. If the estimation model has not been established, it always
provokes debate about the model.3 In contrast, when there are changes in accounting
policy, the effect of which becomes clear by disclosure, there are no problems in
estimation.
This paper focuses on changes in accounting policy that are costly as a method of
earnings management in the sense that a change that has materiality shall be disclosed in
a footnote. In which situations does management select such a change in policy? This
study considers income smoothing, the big bath, financial distress, debt covenants,
management turnover, ownership structure, and auditors as factors influencing changes
in accounting policy. This paper uses annual income as a benchmark and also studies first-
quarter income (i.e., interim income for fiscal years ending before March 2008) to test
hypotheses concerning income smoothing and the big bath.4 Accounting policies follow
a principle of consistency between the year-end and the quarter financial statements, and
initial changes in accounting policy are always implemented in the first-quarter
statements.
2 Yamaguchi (2009) presents the results for real discretion carried out to decrease future earnings in Japan. In contrast, Gunny (2010) provides evidence that real discretion also has the effect of increasing future earnings 3 McNichols (2000) recommends methods for estimating individual accounting accrual items. 4 As quarterly financial statements are effective from the fiscal year beginning in April 2008, managements decide their accounting policies by the end of the first quarter. Before this change, Japanese firms reported their performance twice a year—at the end of the interim period and of the fiscal year. In this paper, “interim” means the first half of the year.
4

Our analysis also reveals the big bath phenomenon. Similar results are produced when
the first-quarter (interim) income is used as a benchmark. Moreover, a higher debt ratio
leads to more changes in accounting policy, resulting in both income decreases and
increases. A higher bank ownership ratio leads to more changes in accounting policy that
decrease income. The evidence also shows that management turnover promotes income
increases through changes in accounting policy, while audits by Big N audit firms
effectively restrain accounting policy changes that result in income increases.
The primary contribution of this paper is its evidence that managements change
accounting policy depending on circumstances, even when the changes are revealed in
disclosures and can be seen as earnings management.
Furthermore, as shareholders, banks influence accounting policy changes that decrease
income. This influence appears to increase as the debt ratio increases. Hence, higher debt
ratios lead to changes in accounting policy that decrease income; even so, however, the
results show that some managements choose accounting policies that result in income
increases. This paper also contributes by showing that banks influence both income
increases and decreases through accounting policy changes.
Another important contribution is that, unlike previous research based on annual
income, this study obtains consistent results by considering the income in the first-quarter
(interim), when accounting policy changes are initiated.
This paper also contributes by providing new evidence using a single dataset in a study
of the factors in accounting policy changes, which has not occurred in the twenty years
since Pincus and Wasley (1995).
Section 2 discusses previous literature and rules regarding changes in accounting policy
in Japan. Section 3 describes the hypotheses, research design, sample selection and data.
Section 4 contains the results of the analysis. Section 5 is a conclusion.
5
2. Prior literature and rules regarding changes in accounting policy
2.1. Prior literature
There are many papers dealing with the relationship between income smoothing behavior
and changes in accounting policy—Cushing (1969), Ronen and Sadan (1981), and Moses
(1987), for example. In Japan, Komura (1987), a study of the relationship between
changes in accounting policy and performance, examines the income smoothing
hypothesis. Using a sample of 100 companies between 1960 and 1984, it investigates
firms that change depreciation methods or inventory valuation methods and obtains
evidence that supports the income smoothing hypothesis. Other studies in Japan also
obtain evidence that supports this hypothesis.
Much research has been conducted on the violation of debt covenants. Many studies
use debt ratios (or leverage) as a proxy to measure proximity to covenant violation. Hunt
(1985) notes, for example, that the higher the leverage, the more likely firms are to make
changes in accounting policy that increase their income. Sweeney (1994) examines cases
of covenant violation and shows that firms close to covenant violation tend to change
their accounting policy to increase their income.
Beatty and Weber (2003) examine the relationship between changes in accounting
policy and debt covenants. The study focuses on 125 firm-years between 1995 and 2000.
The results show that the firms that employ income increasing changes in their accounting
policies rather than income decreasing changes are more likely to participate in contracts
that have performance pricing, dividend constraints, and incur high costs for violation of
covenants. They also find that firms that recorded small losses made income increasing
changes, and firms that reported large losses made income decreasing changes after
changes in management. Suda (2000) also analyzes the relationships between debt
covenants and accounting policy, focusing on Japanese firms.
Schwarts (1982) and Lilien et al. (1988) study firms facing financial distress, showing
that such firms change their accounting policies in order to increase earnings. Suda et al.
6

(2007) also show that firms in distress change accounting policies to increase earnings
just before going bankrupt in Japan.
Okabe (1994) focuses on the relationships between changes in accounting policy and
shareholding structures of Japanese firms, showing that firms are more likely to change
their accounting policy to decrease earnings if they have high management ownership or
bank ownership ratios.
Pincus and Wasley (1994) analyze a large volume of data on changes in accounting
policy, which is closely related to this study. They investigate 2,978 cases of voluntary
accounting changes and 3,689 cases of mandatory accounting changes between 1969 and
1988. The most frequent change in voluntary accounting changes is a change in inventory
(38.1%). Others reported as proportionately high are changes in reporting entities,
revenue recognition, and depreciation method. In addition, their study examines the
relationship between changes in accounting policy and producer price index, GNP, tax
system, and earnings response coefficient (ERC).
Enomoto (2014a) analyzes over 400 changes in accrued retirement benefits (i.e.,
accounting policy changes) for the fiscal year end of March 2000, showing that
accounting policy changes that decreased income occurred in big bath contexts, in which
debt ratios were low and bank ownership ratios high. This analysis is limited, however,
to accounting policy changes concerning retirement benefits. Enomoto (2014b)
demonstrates a relationship between recent changes in accounting policy and income
smoothing and/or the big bath. He finds that the higher the bank ownership ratios (the
lower the management ownership ratios), the more accounting policy changes are made
to increase income (decrease income), although the correlation may have depended on
the size of the firm. Management turnover is also shown to be related to changes that
produce both income increases and decreases. Enomoto (2014b) does not employ
regression analysis and therefore does not consider the relationship among the factors
involved in accounting policy changes.
7

The prevailing method uses accounting accrual as a proxy for earnings management
(after Healy, 1985); as a result, the amount of research on changes in accounting policy
has decreased. Very few attempts have been made to examine the relationship between
changes in accounting policy and managerial incentives to manage earnings. Therefore,
this paper arranges data from recent years and reexamines this relationship.
2.2. Rules on changes in accounting policy in Japan
Changes in accounting policy are generally disclosed in financial statements and audit
reports. Only audit reports noting material changes in accounting policy have been
examined in this study.
The Accounting Standards Board of Japan (ASBJ) issued Accounting Standard for
Accounting Changes and Error Corrections (ASBJ Statement No.24) and Guidance on
Accounting Standard for Accounting Changes and Error Corrections (ASBJ Guidance
No.24) in December, 2009.
These standards changed how entries concerning accounting policy changes are
recorded in financial statements. Prior to their implementation, accounting policy changes
were not applied retroactively. Therefore, Cabinet Office Regulations required the
description of the summary, the reason for the change in accounting policy, and the effect
of the change on the financial statement. Further, the Guideline of Cabinet Office
Regulations also required giving the effect of the change on operating income, ordinary
income, net income before taxes, net income, or other important items.5 In practice, there
were few cases that disclose all income given in the Guidelines, so disclosure can be
omitted for items that have no effect or are self-evident.
5 Operating income in Japanese income statement is different from that in International Financial Reporting Standards (IFRS) or the U.S. GAAP. Operating income is calculated as sales minus cost of goods sold minus selling, general, and administrative expenses. Nonrecurring items are included in “special items,” the Japanese definition of which is broader than that in the IFRS and the U.S. GAAP. Japanese operating income responds more to firms’ operating activities. Ordinary income is calculated as operating income plus profits and losses on financial activities such as interest income and expenses.
8

An entity shall apply the Accounting Standard and the Guidance to accounting change
which are made after the beginning of the fiscal year beginning on or after April 1, 2011.
Now, accounting policy changes are applied retroactively. The effect on the current period
is disclosed in a note when the retroactive application of changes to a previous period is
difficult and when the standards do not require disclosure of the effect on the previous
period.
A change in an accounting estimate is accounted for in the period of the change if the
change affects that period. Methods of depreciation for tangible fixed assets and of
amortization for intangible fixed assets are included in accounting policies, but those
changes are treated as a case when it is difficult to distinguish between a change in an
accounting policy and a change in an accounting estimate. In other words, those changes
is not accounted for retrospectively. A disclosure on the effect on current-period earnings
is made when a change in the depreciation method occurs, when retroactive application
is difficult, and/or accounting standards do not require it.
In the audit report, a change in accounting policy is disclosed if the auditors judge it
likely to have a materiality bearing on the decision making of the users of the financial
statements. While the audit report’s format changed significantly at the fiscal year end of
March 2003 and again in March 2012, the auditors’ judgment criteria have remained
largely the same.
For changes in accounting policies, two parties—management and auditor—judge the
materiality. Changes that affect performance to similar degrees will be disclosed, or not,
based on the judgment made by the management or the auditor. Actually, although
changes in accounting policies are disclosed in the footnotes of a financial statement,
some auditors did not treat it as explanatory paragraph on audit reports.
9

3. Hypothesis Development, research design, sample selection, and data
This research posits the hypotheses below based on previous research.6
3.1. Hypothesis Development and research design
Income Smoothing and Big-bath
Graham et al. (2005) perform a questionnaire to management in the United States, asking
questions about management and accounting. The results show that management
considered income smoothing desirable in order to suggest the market participants,
analysts, clients, suppliers and other stakeholders that business is stable. Hanaeda and
Suda (2008) conducted a similar questionnaire survey on management in Japan and
obtained similar results.7
For this paper, I consider an income smoothing hypothesis similar to those posited in
previous studies. This study’s hypothesis is that when earnings before a change in
accounting policy substantially exceed target earnings, they will be decreased by the
change in the accounting policy, and that when the earnings are substantially lower than
the target, they will be increased by the change in policy.
Management might avoid changing accounting policies when earnings before a
potential change are near their target, for fear of causing auditors and stakeholders to take
notice. There is also a possibility of the so-called big-bath—that is, when income is
substantially lower than expected, a change in accounting policy is made to decrease
income even further. I will also investigate the big-bath hypothesis.
The following hypotheses are proposed in consideration of the foregoing. Hypotheses
1-1 and 1-2 relate to income smoothing behavior, while Hypothesis 1-3 relates to the big
6 The hypotheses in this section were created with reference to Enomoto (2014a). 7 According to the evidence from Graham et al. (2005), however, U.S. managers are passive about making changes in accounting estimates in order to achieve target earnings. In research on Japanese managers, Hanaeda and Suda (2008) report similar results. It is presumed from these findings that managers do not make changes in accounting policies towards achieving target earnings. Nakamura (2006) do not find evidence of changes in accounting policy used as an earnings management tool by firms that reported small earnings. This suggests that these firms do not use changes in accounting policy to meet or beat target earnings. It is difficult for management to use changes in accounting policy to achieve earnings benchmarks, because it would be clear to stakeholders if they did so.
10

bath:
Hypothesis 1-1: Firms make income-decreasing accounting policy changes when
earnings are very high.
Hypothesis 1-2: Firms make income-increasing accounting policy changes when
earnings are very low.
Hypothesis 1-3: Firms make income-decreasing accounting policy changes when
earnings are very low.
Financial Distress
According to Schwarts (1982) and Lilien et al. (1988), the greater the financial distress
a firm faces, the more likely it is to changes its accounting policy to increase earnings.
Suda et al. (2007) show that, in Japan also, the closer a firm is to bankruptcy and the
greater its level of financial distress, the more likely it is to change its accounting policy
in an attempt to improve its financial situation. We thus propose the following hypotheses:
Hypothesis 2-1: The greater a firm’s financial distress, the more likely it is to make
income-increasing changes to its accounting policy.
Hypothesis 2-2: The greater a firm’s financial distress, the less likely it is to make
income-decreasing changes to its accounting policy.
Debt Covenants
Most of the research on debt covenant violation employs debt ratios (or leverage) as
proxies to measure proximity to covenant violation. Many studies have highlighted that
firms close to their debt covenants (i.e., with a high debt ratio) implemented changes in
accounting policy to increase their income and thus avoid a violation (Hunt 1985;
Sweeney 1994).
11

The research suggests that the higher a firm’s debt ratio, the more likely it is to choose
an accounting policy that increases income. It can thus be assumed that such a firm is less
likely to choose an accounting policy that decreases income, which would worsen the
debt ratio. We thus propose the following:
Hypothesis 3-1: The higher a firm’s debt ratio, the more likely it is to make income-
increasing changes to its accounting policy.
Hypothesis 3-2: The higher a firm’s debt ratio, the less likely it is to make income-
decreasing changes to its accounting policy.
Management Turnover
Research has highlighted the relationship between management turnover and changes
in accounting policy. Beatty and Weber (2003) reveal, for example, that newly appointed
management tends to change accounting policy to decrease earnings if a huge loss has
occurred (i.e., a big bath) before the change.
Strong and Meyer (1987) and Elliot and Shaw (1988) also report that newly appointed
management in their first fiscal year used big-bath strategies based on impairment
accounting. They found that management reported an impairment loss to decrease
earnings with the aim of lowering expectations concerning future earnings.
Using Japanese data, Yamaguchi (2013) also reports that newly appointed management
performed earnings management to decrease income. Shuto (2010) also reveals cases of
income-increasing earnings management. Together, these studies show that management
turnover provides an opportunity to change accounting policies. Using Japanese evidence,
then, the following hypotheses are proposed:
Hypothesis 4-1: Newly-appointed management makes income-increasing changes to
the accounting policies.
12
Hypothesis 4-2: Newly-appointed management makes income-decreasing changes to
the accounting policies.
Bank Ownership Ratio
Hypothesis 3 uses debt ratio as a proxy to measure debt covenant constraints. Japanese
banks often hold shares in the firms they finance in order to foster a long-term
relationship. As a stable stockholder, the bank plays an important role in the firm’s
governance. Sometimes, a number of banks hold shares in the financed firm; even then,
however, a main bank plays a monitoring role, observing and controlling the firm and
thereby disciplining management (Aoki and Patrick 1994). The higher the bank
ownership ratio, therefore, the greater the monitoring effect. With management under
watch, accounting policy changes as a proxy of discretionary behavior can be assumed to
be under control.
Hamamoto (2001) asserts, however, that an accounting system to decrease earnings is
effective within the main bank system. Banks have positions as both shareholders and
creditors; given their need to reclaim their loans, an accounting policy change made to
improve earnings would be unwelcome, as it could lead to more cash flowing out of the
firm and into management compensation and dividends.
Furthermore, Okabe (1994) argues, from the viewpoint of ownership, that increased
earnings would lead to negotiating disadvantages (such as salary and pay negotiations
with labor unions or price negotiations with suppliers and clients), causing the banks,
acting as owners, to seek to prevent management from adopting an accounting policy that
would increase income. It can thus be assumed that, given the opportunity, they would
choose accounting policy changes designed to decrease income. As a case in point, Okabe
(1994) found that firms with a high bank ownership ratio chose accounting policies that
decreased income. It can therefore be assumed that the higher a firm’s bank ownership
ratio, the less likely it is to change its accounting policy to increase income. We thus
13

propose the following:
Hypothesis 5-1: The higher the bank ownership ratio, the less likely the firm is to
make income-increasing changes to its accounting policy.
Hypothesis 5-2: The higher the bank ownership ratio, the more likely the firm is to
make income-decreasing changes to its accounting policy.
Management Ownership Ratio
Traditional agency theory holds that, as management ownership of shares grows, it
becomes increasingly possible to align the interests of management with those of
shareholders (Jensen and Meckling 1976). The theory posits that the owners and
managers of firms with a high management ownership ratio can enter into accord, thereby
preventing the moral hazard of management and enabling the efficient use of resources.
The theory argues that the actions of management become directly intertwined with their
own wealth as shareholders and that this naturally prevents them from taking actions that
fail to maximize corporate value. In light of this view, and supposing that earnings
management does not maximize corporate value, an increase in the management
ownership ratio would naturally decrease earnings management (e.g., Warfield et al.
1995).
As mentioned, Okabe (1994) notes that a higher management ownership ratio causes
firms to avoid accounting policies that increase income in order to avoid disadvantageous
negotiating positions caused by increased earnings. The argument here is that the
managements of firms with a high management ownership ratio are more incentivized to
maximize corporate value and thus refrain from choosing accounting policies that
increase income. In either case, accounting policy changes that increase income are under
control. We thus propose the following:
14
Hypothesis 6-1: The higher the management ownership ratio, the less likely the firm
is to make income-increasing changes to its accounting policy.
Hypothesis 6-2: The higher the management ownership ratio, the more likely the
firm is to make income-decreasing changes to its accounting policy.
Auditors
Auditors pay close attention to changes in accounting policy and thus exert a significant
influence on them. Even when accounting policy changes are legitimate, they can still be
employed to manage earnings. The higher the quality of the audit, the less likely the
auditors are to permit accounting policy changes intended to manage earnings. DeAngelo
(1981) notes that the larger the audit firm, the higher the quality of their audit. It can thus
be assumed that companies audited by Big N firms are less likely to change their
accounting policies than are those audited by non-Big N audit firms, regardless of whether
the changes are to increase or decrease income.
In this study, accounting policy changes are understood as acts of accounting discretion.
Research on auditors and accounting discretion has been conducted by Becker et al.
(1998) and Francis et al. (1999). Both show that firms audited by Big N audit firms have
lower discretionary accruals than do those audited by non-Big N audit firms. This result
is consistent with the prediction that these firms will choose not to make accounting
policy changes that increase income. The research also shows that the absolute values of
the discretionary accruals for firms audited by Big N audit firms are relatively low, a
result consistent with the prediction that these firms will choose not to change accounting
policies. Concerning Japanese firms, Yazawa (2010) and Takada and Muramiya (2013)
offer conflicting results depending on whether the firms have income-decreasing
discretionary accruals. As income-decreasing accounting policy changes can improve a
firm’s fiscal health, auditors may focus less on those and more on changes that increase
income. Indeed, Nelson et al. (2002) demonstrate that auditors pay less attention to clients
15

seeking to decrease earnings than to those seeking to increase them.
Given the above, the following hypothesis is proposed:
Hypothesis 7: Firms that are clients of a Big N audit firm are less likely to make
income-increasing accounting policies changes than are firms audited by a non-
Big N audit firm.
3.2. Regression Model
We examine the above hypotheses by estimating the coefficients in Equations (1) to (4)
below:
NIBTDit = β0 + β1UPP1it + β2LOW1it-1 + β3ALTMANit-1 + β4DEBTit-1 + β5MGTit-1 +
β6FINit-1 + β7OWNit-1 + β8BIGNit-1 + β9SIZEit-1 + β10NOAit-1 + β11MTBit-1 + βYEAR
+ βINDUSTRY + εit (1)
NIBTDit =β0 + β1UPP2it + β2LOW2it-1 + β3ALTMANit-1 + β4DEBTit-1 + β5MGTit-1 +
β6FINit-1 + β7OWNit-1 + β8BIGNit-1 + β9SIZEit-1 + β10NOAit-1 + β11MTBit-1 + βYEAR
+ βINDUSTRY + εit (2)
NIBTDit =β0 + β1UPP3it + β2LOW3it-1 + β3ALTMANit-1 + β4DEBTit-1 + β5MGTit-1 +
β6FINit-1 + β7OWNit-1 + β8BIGNit-1 + β9SIZEit-1 + β10NOAit-1 + β11MTBit-1 + βYEAR
+ βINDUSTRY + εit (3)
NIBTDit = β0 + β1UPP4it + β2LOW4it-1 + β3ALTMANit-1 + β4DEBTit-1 + β5MGTit-1 +
β6FINit-1 + β7OWNit-1 + β8BIGNit-1 + β9SIZEit-1 + β10NOAit-1 + β11MTBit-1 + βYEAR
+ βINDUSTRY + εit (4)
16

The dependent variables, NIBTD, indicate whether a change in accounting policy
increases or decreases net income before taxes. NIBTD is 1 if the change in accounting
policy increases net income before taxes, -1 if the change decreases it, and 0 otherwise.8
The number of disclosures regarding the effect on operating income, ordinary income
and/or net income is less than those for the effect on net income before tax.9 I employ
generalized ordered logit models for ordinal dependent variables to estimate the
parameters.10 The definitions of each independent variable are as follows:
UPP1 = 1 if the difference between net income before tax (hereafter NIBT)
before the accounting policy change and NIBT of the previous period
is above the median of nonzero positive values of this variable, and 0
otherwise.
LOW1 = 1 if the difference between NIBT before the accounting policy change
and NIBT of the previous period is below the median of nonzero
negative values of this variable, and 0 otherwise.
UPP2 = 1 if NIBT before the accounting policy change is above the median of
nonzero positive values of this variable, and 0 otherwise.
LOW2 = 1 if NIBT before the accounting policy change is below the median of
nonzero negative values of this variable, and 0 otherwise.
UPP3 = 1 if the difference between first quarter (interim) NIBT before the
accounting policy change and NIBT of the same period of the previous
8 For the dependent variables and the independent variables (UPP, LOW), dummy variables are used that do not reflect the extent of total change. For income before the change, it is based on the difference between the total change and actual income, but when the dependent variables are also included in the total change, the correlation from this process brings about a bias. Thus, dummy variables are used for analysis in this paper. 9 The effect on ordinary income is disclosed next to NIBT. Japanese stakeholders attach importance to ordinary income as a measure of recurring activities. 10 Proportionality of coefficients is not assumed between changing an accounting policy to increase income (NIBTD = 1) and choosing not to change a policy (NIBTD = 0), and between choosing not to change a policy (NIBTD = 0) and changing a policy to decrease income (NIBTD = -1). Generalized ordered legit models are therefore used.
17

fiscal year is above the median of nonzero positive values of this
variable, and 0 otherwise.
LOW3 = 1 if the difference between first quarter (interim) NIBT before the
accounting policy change and NIBT of the same period of the previous
fiscal year is below the median of nonzero negative values of this
variable, and 0 otherwise.
UPP4 = 1 if first quarter (interim) NIBT before the accounting policy change
is above the median of nonzero positive values of this variable, and 0
otherwise.
LOW4 = 1 if first quarter (interim) NIBT before the accounting policy change
is below the median of nonzero negative values of this variable, and 0
otherwise.
ALTMAN = The index in the bankruptcy prediction model developed at Altman
(1968), which is used as the variable indicating the extent of financial
distress (the formula is: ALTMAN = 0.12* X1 + 0.14*X2 + 0.33*X3 +
0.006 X4 + 0.999X5, X1 = working capital / total assets, X2 = retained
earnings / total assets, X3 = Eearnings before interest and taxes /
Total assets, X4 = Market value equity / Book value of total debt, X5
= Sales / Total assets.
DEBT = Total amount of debt, total debt/total assets at the beginning of the
period.
MGT = 1 if there is a change of management in the period, 0 if not.
FIN = The ratio of the shares owned by banks at the beginning of the period.
OWN = The ratio of the shares owned by all directors at the beginning of the
period.
BIGN = 1 if auditors are in a brand-name auditors, 0 if not (brand-name
auditors are Asahi Audit Corporation, Century Ota Showa & Co.,
18

Chuo Aoyama audit corporation, Deloitte Touche Tohmatsu LLC,
Ernst & Young Shin Nihon LLC, KMPG Azsa & Co., Misuzu Audit
Corporation, and Price Waterhouse Coopers Arata).11
SIZE = Natural logarithm of total assets at the beginning of the period,
NOA = Net operating assets relative to sales (the formula is: (shareholders'
equity - cash - marketable securities + total debt) / sales).
MTB = Market to book.
YEAR = Year dummy.
INDUSTRY = Industry dummy.
i = Firm i.
t = Time t.
To test the income smoothing and big bath hypotheses, the two variables UPP1 and
LOW1 are calculated in a way similar to Riedl (2004).12 The variables highlight whether
earnings are high or low.
The current NIBT level is also tested, as well as the change in NIBT. This results in
UPP2 and LOW2. Following these are UPP3 and LOW3.
In evaluating performance of firms and management, naturally annual income weighs
more heavily than quarter or interim results. 13 However, in principle, changes in
accounting policy are applied at the beginning of an accounting period, which means that
11 Century Ota Showa & Co. is now Ernst & Young Shin Nihon LLC. Asahi Audit Corporation is now KMPG Azsa & Co. Chuo Aoyama Audit Corporation is the predecessor of Misuzu Audit Corporation and Price Waterhouse Coopers Arata. 12 Riedl (2004) tests income smoothing and big bath using variables similar to UPP1 and LOW1. 13 According to Auditing and Assurance Practice Report No. 36 (JICPA), the accounting method for the preparation of quarterly (or interim) financial statement and annual financial statements must adhere to the principle of consistency. When quarterly (or interim) and annual financial statements do not maintain consistency, there are strong concerns that financial statements will lose their usefulness. Therefore, when consistency has not been maintained, appropriate disclosures must be made in the footnotes of the reports. Of particular relevance to this paper, when a quarterly (or interim) financial statement follows the accounting methods of the previous period and a change in accounting policies is made at the end of the year, Report No. 36 requires that the reason for change be reported in a footnote in the year-end report, not the quarterly (or interim) report.
19

management should decide on it by the end of the first quarter (interim) period. A change
at year’s end is also allowable, but supplemental disclosure is required. Therefore, if a
firm makes a discretionary change in accounting policy, it must make that change based
on the prospective annual income at the end of the first quarter (interim) period. With this
as a premise, detailed adjustments cannot be made to achieve earnings benchmarks for
the annual base income. Thus, this paper also analyzes performance for the first quarter
(interim) period in relation to changes in accounting policy, excluding firms that changed
accounting policies at year’s end. Actually, some firms disclose the changes at the end of
year, not at the end of the interim period.
As noted, the time at which an accounting policy is decided differs depending on the
fiscal year. Thus, there are also differences in the timing for calculating UPP3 and LOW3.
The impact of an accounting policy change is calculated as being a quarter of the annual
change for first-quarter earnings or half of the annual change for interim earnings.14
UPP4 and LOW4 are calculated in the same manner as UPP2 and LOW2.
Firms that changed their accounting policy after the second quarter (i.e., before the
fiscal year end of March 2009, when firms first changed their accounting policies in their
yearly financial statements) are not included in the estimation of the coefficients for
Equations (3) and (4).
Altman’s Z-Score (Altman 1968) is used as a proxy to measure financial distress. When
testing Hypothesis 3, debt ratio, DEBT, is used in line with previous research on the debt
ratio.
A variable for management turnover, MGT, is created in order to analyze the
relationship between management turnover and changes in accounting policy. For fiscal
years ending before March 2008, management turnover is deemed as having occurred
when a new president or CEO is appointed before September of that fiscal year.15
14 A database was used to obtain data on first quarter and interim income. 15 For fiscal years ending after March 2009 (when quarterly reporting was made mandatory), management turnover is deemed to have occurred when a new president or CEO has been appointed before June of that
20

FIN and OWN serve to calculate the bank ownership and management ownership ratios
respectively. For BIGN, auditors are grouped as Big N audit firms and non-Big N audit
firms.
Other control variables include SIZE, measuring scale, NOA, used by Barton and Simko
(2002) to represent accounting flexibility, and MTB to show growth.
I include industry and year dummies in Equations (1) to (4). The expected signs of the
coefficients are given in Table 4.
3.3. Sample selection and data
The base sample uses in this study is selected as follows:
(1) Firms whose fiscal year end is March 31 between 2000 and 2013
(2) Firms listed on any of the markets in Japan as of each balance sheet date (any of
the stock exchanges: Tokyo, Osaka, Nagoya, Sapporo, Kyoto, Fukuoka,
JASDAQ)16
(3) Firms that disclose consolidated financial statements based on Japanese standards
(4) Firms not belonging to banks, insurance companies, securities traders, or other
financial institutions
In addition to meeting these four requirements, firms must have the data I need available.
Data regarding changes in accounting policy is collected from data book of change in
accounting policy from 2000 to 2013. This data book, titled “Kaikeishori no Henkou
Jitsureishu” (An Actual Case of Change in Accounting Policy, in Japanese), is edited by
the Weekly Report on Financial Accounting (Zeimu Kenkyukai). 17 Changes in
fiscal year. 16 The Kyoto stock exchange was merged with Osaka Stock Exchange in February, 2001. JASDAQ moved to the stock exchange after December, 2004. Until then, it was an over the counter securities trading market. 17 It includes all changes in accounting policy for each year. The collection source of these materials is the firms listed on the stock exchange from 2000 to 2002, and after 2003, included JASDAQ (over-the-counter Japan Securities Dealers Association). For over-the-counter companies from 2000 to 2002, data was added by obtaining audit reports and the footnotes to financial statements from annual reports. The book did not appear in 2011 or 2013, however. For 2011, the Weekly Report on Financial Accounting is used (the September 26 and October 10 issues), and 2013 data were obtained from their website (http://www.zeiken.co.jp/mgzn/index_zaimu.html).
21

accounting policies reported in audit reports are recorded there. The collected data include
voluntary but not mandatory accounting changes made to comply with accounting
standards and legally enforced changes in accounting policies reported in audit reports.
The collected data present 2,547 cases of accounting policy changes across 2,207 firm-
years. The data comprise 26,966 firm-years, including firm-years without changes in
accounting policy.
Firms whose total effect is zero or cannot be calculated are excluded—when they do
not disclose the effect against net income before taxes. These changes are hand-collected
by the author.18 The numbers used in each analysis vary depending on the analysis, as
reported in each table.
In addition, financial data is extracted from Nikkei NEEDS-CD ROM Financial Data
(Nikkei Media Marketing). Auditor data is hand-collected from eol DB Service (eol),
annual reports for each firm, Who Audit Japan (Zeimu Kenkyukai), and KigyoKihon Data
(Nikkei Media Marketing) ; data on changes in management comes from Executives
Quarterly Journal (Toyo Keizai Shinposha) and The Japan Company Handbook (Toyo
Keizai Shinposha).
4. Results
4.1. Descriptive statistics
Table 1 shows descriptive statistics on the effect of changes in accounting policy on
NIBT from 2000 to 2013. NIBT is divided by total assets at the beginning of the period.
As Table 1 shows, all accounting policy changes have the overall effect of lowering NIBT,
although they have recently been increasing it. Moreover, the number of changes is
decreasing year by year because of a series of new accounting standards and revisions
18 In keeping with data collection, items not disclosed in footnotes or the audit report is treated as missing values. Also, when there is “No effect on gain or loss,” “no effect on financial statement,” or “immaterial effect” the effect on all income is made zero. Further, in making a disclosure, it is rare for firms to disclose every effect in operating income, ordinary income, net income before taxes and net income for the period. Among these types of income, the effect of net income before taxes is the most frequently reported.
22
made since 2000 to bring Japanese accounting standards closer to the IFRS and/or U.S.
GAAP. 19 New accounting standards and revisions usually increase the number of
accounting policy changes before the effective year and then decrease them thereafter.
Many firms change their accounting policy to bring themselves closer to the new
standards before their adoption in order to decrease their financial impact when they come
into effect. 20 As the early adoption of new accounting standards is included as an
accounting policy change, changes increase before mandatory adoption. At the same time,
adopting new accounting standards tends to lessen management’s accounting policy
options, which leads to fewer accounting policy changes following adoption. 21 The
overall decreases in the number of accounting policy changes can be assumed to be due
to the adoption of the new accounting standards, showing a fading of the initial increase
and the concurrent post-adoption drop in changes.
[Insert Table 1 here]
Table 2 summarizes the frequency and the effect on net income before taxes by the type
of change. A change in provision is the most frequent type of change. There are more than
200 cases under retirement benefit, depreciation methods for fixed assets, recognition of
revenue and expenses, change in classification of income statements, effect of early
adoption of new accounting standards. The mean and median effect on net income before
taxes is mostly negative. The greatest impact on earnings comes from changes in
accounting policy regarding accounting accrued retirement benefits. The impact on
19 Changes in accounting policy might have decreased due to the Enron scandal and the stricter audits that followed. 20 In 2000, the period just before the application of Accounting Standard for Retirement Benefit, a lot of firms changed the calculation method for retirement benefits. Most of them were changed to increase the provision of the retirement benefits. Certainly, these changes were for the purpose of reducing the difference arising from the initial application of the standard. 21 The prohibition of LIFO in inventory accounting standards has the effect of changing LIFO into some other evaluation method. For example, no changes in accounting policy pertaining to LIFO will be made post-adoption.
23

earnings from the early adoption of new accounting standards is also substantial. The
impact of changes in depreciation methods is also large, but the mean and median values,
as shown in Table 2, offset the positive and negative effects. The only positive mean value
is 0.0064 while the only negative mean value is -0.0064.
[Insert Table 2 here]
Table 3 presents descriptive statistics for the variables used in the regression. Firm years
with changes in accounting policies are grouped into firm years that increased NIBT and
those that decreased NIBT by the change.
There are more income decreasing changes in accounting policies than income
increasing changes. This result is the reason why income decreasing changes might be
recommended from the perspective of conservative accounting. Even the words
“financial soundness” are seen occasionally for the reasons for change.
[Insert Table 3 here]
Table 3 compares the variables of firm years that increased their NIBT through a change
in accounting policy (NIBTD = 1; hereafter the “income-increasing changes group”) with
those of firm years that did not disclose voluntary changes in accounting policy, drawn
from the samples selected in section 3.3 in the audit reports (NIBTD = 0; hereafter “other
firm-years group”) and also compares the variables of firm years that decreased their
NIBT through accounting policy changes (NIBTD = 1; hereafter, “income-decreasing
changes group”) with those of the “other firm-years group.”22
First, we focus on the variables UPP1 to UPP4 and LOW1 to LOW4. The mean and
22 When a firm makes an income-increasing change one year, an income-decreasing change in another year, and no change in the others, the firm’s firm years are classified into three groups according to the change.
24

median of UPP1 to UPP4 for the income-increasing changes group are lower than those
of the other firm-years group. LOW1 to LOW4 show the opposite tendency. These results
suggest that the income-increasing changes group has lower earnings than the other firm-
years group.
On the other hand, the income-decreasing changes group tends to have higher levels of
earnings than the other firm-years group. These results are consistent with income
smoothing.
ALTMAN, showing the levels of financial distress, revealed that firm-years that
increased or decreased their NIBT are smaller than other firms and have higher levels of
financial distress. This result is consistent with Hypothesis 2-1 but not Hypothesis 2-2.
DEBT is higher for the income-increasing and income-decreasing changes groups than
for the other firm-years group. This result is in line with Hypothesis 3-1 but not
Hypothesis 3-2.
MGT shows that management turnover is more likely to have occurred in the income-
increasing and income-decreasing changes groups than in the other firm-years group. This
result supports both Hypothesis 4-1 and Hypothesis 4-2.
FIN is higher for the income-increasing and income-decreasing changes groups than
for the other firm-years group, supporting Hypothesis 5-1. OWN is smaller for the
income-increasing and income-decreasing changes groups than for the other firm-years
group. This result supports Hypothesis 6-2. BIGN shows no meaningful differences.23
4.2. Regression Results
Table 4 is a correlation matrix. Table 5 shows the estimated coefficients from regression
equations (1) through (4).24 The upper half of Table 5 shows the estimated coefficients
regarding whether an accounting policy change is employed for the income-decreasing
23 The analysis in Table 3 is, strictly speaking, the reverse in cause and effect from hypothesis testing and is thus not used as hypothesis testing. 24 I winsorize independent variables at the one percent and 99 percent levels except dummy variables.
25

changed group and the other firm-years group (NIBTD = -1 and NIBTD = 0). The lower
half shows the estimated coefficients regarding whether a change in accounting policy is
employed for the income-increasing changes group and the other firm-years group
(NIBTD = -1 and NIBTD = 0). The second column from the left shows the predicted signs.
The third column from the left shows the estimated coefficient from Equation 1, and the
fourth column shows the z-value.
[Insert Table 4 and Table 5 here]
The upper half shows that the coefficient for UPP1 is negative and significant,
indicating that firms with higher earnings change their accounting policies more
frequently (i.e., for income smoothing).
The coefficient for LOW1 is also significantly negative. This is consistent with the big
bath hypothesis, showing that changes in accounting policy are made to increase future
income after a large drop in earnings. Hypothesis 1-1 and Hypothesis 1-3 are thus both
supported.
The coefficient for FIN is significantly negative, showing that a higher bank ownership
ratio leads to more conservative (i.e., income-decreasing) changes in accounting policy.
This supports Hypothesis 5-2.
The coefficient for BIGN is significant and positive, indicating that firms audited by
Big N firms are more likely to make accounting policy changes that do not decrease
income.
None of the coefficients for ALTMAN, DEBT, MGT, or OWN gives significant results.
Concerning the coefficients in the lower half, LOW1 is significantly positive, showing
that income-increasing accounting policy changes are more likely to occur in firms with
lower earnings levels. This result supports the income-smoothing Hypothesis 1-2.
The coefficient for DEBT is positive and significant, suggesting that a higher debt ratio
26
is more likely to lead to income-increasing accounting policy changes, supporting
Hypothesis 3-1.
The MGT coefficient is positive and significant, suggesting that management turnover
increases the chances of income-increasing accounting policy changes, supporting
Hypothesis 4-1.
The coefficient for BIGN is negative and significant, indicating that firms audited by
Big N firms are unlikely to make income-increasing accounting policy changes,
supporting Hypothesis 7. Hypotheses 2 and 6 are not supported.
The results of Equation (2), which based its analysis on levels of earnings, are similar,
apart from those for DEBT in the upper half and UPP2 in the lower half. The coefficient
of DEBT conflicts with Hypothesis 3-2.
The results of columns 7 and 8 from the left focus on earnings in the first-quarter
(interim), when new accounting policies come into effect. The results of Equation (3) are
similar to those for Equation (1), apart from LOW3 (which is not significant) and DEBT
(which is significant) in the upper half. Regarding the results of Equation (4), the
coefficient for LOW4 in the upper half produces a result opposite to that of LOW1. Thus,
the result of LOW1 in Equation (1) cannot be regarded as robust. The results are otherwise
mostly unchanged from Equation (1). There are a few divergences from Equation (1) in
the lower half, apart from the variable for UPP4, which is negative and significant and
therefore supports the hypothesis on income smoothing.
Thus, the evidence concerning accounting policy changes supports the income-
smoothing hypothesis. The big bath hypothesis is partially supported but is not robust.
Contrary to previous findings, management turnover is shown to promote income-
increasing accounting policy changes.
While a higher bank ownership ratio is found to lead to income-decreasing accounting
policy changes, a higher debt ratio leads to both income-decreasing and income-
increasing changes. This result indicates that banks tend to produce income-decreasing
27

accounting policy changes in their role as shareholders and creditors. However, some
managements prefer to make income-increasing changes to accounting policies in order
to improve financial indicators when their debt ratio is high. The influence of banks as
creditors increases as the debt ratio increases. The results show that banks influence both
income-increasing and income-decreasing changes in accounting policies.
We also see that Big N audit firms were not influential regarding income-increasing
changes.
Finally, we see that the control variable SIZE is significant in all regression analyses,
indicating that larger firms are more likely to make both income-increasing and income-
decreasing changes to their accounting policies.
The coefficient for NOA is not significant, while that for MTB is significant only in
some cases.
4.3. Additional Test
Consolidated interim income became available for use after the fiscal year end of
September 2001. Therefore, the sample periods available for Equations (3) and (4) differ
from those available for Equation (1) and (2) by one or two years. To address this fact,
data that would be used in Equations (1) and (2) are decreased to the portions that would
also be used in Equations (3) and (4). The results of the analysis are qualitatively the same
as those obtained in Section 4.2 (not tabulated).
Regarding the effect an accounting policy change has on earnings, the influence on
ordinary income (following NBIT) is disclosed in many cases.25 For further analysis,
variables are set and an analysis performed for ordinary income as for NBIT. We similarly
calculate UPP5 to UPP8 and LOW5 to LOW8. The definitions are presented in the
footnotes to Table 6. The results are fundamentally unchanged from those for NBIT.
25 Ordinary income is explained in footnote 5.
28

[Insert Table 6 here]
To analyze the managerial decision to change accounting policies more precisely, it is
ideal to focus on forecasts of annual earnings at the time they disclose the first quarter
earnings. They should decide on changes with reference to the forecasted annual earnings,
following the principle of accounting consistency, if management is to opportunistically
decide on a change. However, it is impossible to determine the extent to which forecasts
of annual income include such a change. I use the forecast of annual sales instead of the
forecast of annual income. While, of course, sales increases and decreases do not link
directly with increases and decreases in income, it is sufficient as information about
management’s performance prospects for the fiscal year. This sales analysis excluded
changes that disclose influence on sales. I computed UPP_sales and LOW_sales based
on the difference between annual forecasted sales and the actual sales of the previous
period.26 The results are similar to those discussed above (non-tabulated).
5. Conclusion
This paper reexamines several hypotheses tested in previous studies. The analysis has
shown that, depending on the situation, managements change accounting policies even
when earnings management would be made apparent in disclosures.
The results of our analysis mostly support the income smoothing hypothesis. In
particular, income decreasing changes are made especially at high levels of performance.
In contrast, there is inconsistent evidence for the big-bath hypothesis. Changes in
accounting policies are described in footnotes to financial statements and audit reports so
that they are revealed to the stakeholders. This is the important point that differs from
research on real discretion and accounting accruals. The cost is very high when achieving
26 Earnings forecast data by management comes from Nikkei NEEDS Kaisha Yosou (Earnings Forcast by Management) by Nikkei Media Marketing.
29

target earnings via a change in accounting policy. However, if earnings before the change
are far from the target, the cost is relatively low. Because the examinations of this study
focus on performance which is relatively far from the target, its results might support the
income smoothing hypothesis.
The debt ratio is also seen to influence both income-increasing and income-decreasing
changes, while the ratio of shareholding is seen to influence income-decreasing changes.
Both of these could be interpreted as proxies for pressure from banks. This paper finds
that banks influence both income-increasing and income-decreasing changes to
accounting policies. Management turnover is also seen to promote income-increasing
changes, while Big N audit firms are seen to control income-increasing changes.
In the future, another possible expansion is the linkage with mandatory change. For
example, the mandatory application of accounting standards for retirement benefits
triggered voluntary changes in accounting policy due to additions to the provisioning of
retirement benefits in anticipation of the effect of new standards. Even after the
accounting standards for retirement benefits were effective, accounting standards that
substantially affect earnings, such as accounting standards for impairment of fixed assets,
were newly applied. The relationship with these mandatory changes is also important
when considering the economic impact related to the adoption of accounting standards.
Furthermore, managers have access to a variety of methods of earnings management,
including not just changes in accounting policy (accounting discretion) but also real
discretion. When based on annual income, if accounting policy is changed in the first
quarter (interim) period, the change in accounting policy comes first, and then real
discretion is affected. Since the characteristics of a change in accounting policy for which
discretion is revealed by disclosure is different from that of real discretion, incorporation
of both is an interesting challenge.
30
References Altman,E. 1968. Financial Ratios, Discriminant. Analysis and the Prediction of Corporate
Bankruptcy. The Journal of Finance. Volume 23, Issue 4, pages 589–609.
Aoki, M. and Patrick, H. (Eds.) 1994. The Japanese Main Bank System: Its Relevance for
Developing and Transforming Economies. Oxford University Press.
Barton, J. and P. J. Simko. 2002. The Balance Sheet as an Earnings Management
Constraint. The Accounting Review 77 (Supplement): 1-27.
Beatty, A. and J. Weber, 2003. The Effects of Debt Contracting on Voluntary Accounting
Method Changes. The Accounting Review 78 (1): 119-142.
Becker, C. L., M. L. DeFond, J. Jiambalvo and K. R. Subramanyam, 1998. The Effect of
Audit Quality on Earnings Management. Contemporary Accounting Research 15
(1) :1-24.
Cushing, B. E. 1969. An Empirical Study of Changes in Accounting Policy. Journal of
Accounting Research 7 (2): 196-203.
DeAngelo, L. E. 1981. Auditor Size and Audit Quality. Journal of Accounting and
Economics 3 (3):183-199.
Elliott, J. and W. Shaw. 1988. Write-Offs as Accounting Procedures to Manage
Perceptions. Journal of Accounting Research 26 (Supplement): 91-119.
Enomoto,. M. 2014a. Shin-kaikeikijyun no Dounyu to Houkokurieki Kanri. (Tsuji, M. ed.
Tokubetu Iinkai Saishu Houkokusyo, Japane Accounting Associasion) (in Japanese)
Enomoto,. M. 2014b. A Basic Analysis of Accounting Change. Journal of Ecnomics and
Business Administration 210 (5): 29-65. (in Japanese)
Francis, J. R., E. L. Maydew., H. C. Sparks, and M. C. Building. 1999. The Role of Big
6 Auditors in the Credible Reporting of Accruals. Auditing: A Journal of Practice
and Theory 18 (2): 17-34.
Graham, J. R., C. R. Harvey, and S. Rajgopal. 2005. The Economic Implications of
Corporate Financial Reporting. Journal of Accounting and Economics 40 (1-3): 3-
31

73.
Gunny, K. 2009. The Relation between Earnings Management Using Real Activities
Manipulation and Future Performance: Evidence from Meeting Earnings
Benchmarks. Working Paper.
Hamamoto, M. 2001. The Effects of Control Structure upon Accounting Behavior of
Japanese Firms. Yokohama Business Review 13 (4): 329-336. (in Japanese)
Hanaeda, K. and K., Suda. 2008. Corporate Financial Reporting Strategy: Survey
Evidence from Japanese Firms. Securities Analysts Journal 46 (5): 51-69. (in
Japanese)
Healy, P. M. 1985. The Effect of Bonus Schemes on Accounting Decisions. Journal of
Accounting and Economics 7 (1-3): 85-107.
Hunt, H. 1985. Potential Determinants of Corporate Inventory Accounting Decisions.
Journal of Accounting Research 23 (2): 448-467.
Jensen, M. C. and W. H. Meckling. 1976. Theory of the Firm: Managerial Behavior,
Agency Costs and Ownership Structure. Journal of Financial Economics 3 (4):
305-360.
Koumura, M. 1987. Gendai Kigyou Kaikei to Syouken Shijyou. Doubunkan-Shuppan.
(in Japanese)
Lilien, S. B., Mellman, M. and Pastena, V. 1988. Accounting Changes: Successful versus
Unsuccessful Firms. The Accounting Review 63 (4):642-656.
McNichols, M. 2000. Research Design Issues in Earnings Management Studies. Journal
of Accounting and Public Policy 19 (4-5) 313-345.
Moses, O.D. 1987. Income Smoothing and Incentives: Empirical Tests Using Accounting
Changes. The Accounting Review 62 (2): 358-377.
Nakamura, D. 2006. Earnings Management to Kaikei-Hasseidaka: Kaikei Houshin
Henkou no Modai wo Hukumete. Nenpo Keiei Bunseki Kenkyu 22: 76-84. (in
Japanese)
32

Nelson, M., J. Elliott, and R. Tarpley. 2002. Evidence from Auditors about Managers’ and
Auditors’ Earnings Management Decisions. The Accounting Review 77 (4): 175–
202.
Okabe, T. 1994. Kaikei Houkoku no Riron. Moriyama Shoten. (in Japanese)
Pincus M. and C. Wasley. 1994. The Incidence of Accounting Changes and
Characteristics of Firms Making Accounting Changes. Accounting Horizons 8
(2):1-24.
Riedl, E. J. 2004. An Examination of Long-lived Asset Impairments. The Accounting
Review 79 (3): 823-852.
Ronen, J. and S. Sadan. 1981. Smoothing Income Numbers, Objectives, Means, and
Implications. Addison Wesley.
Roychowdhury, S. 2006. Earnings Management through Real Activities Manipulation.
Journal of Accounting and Economics 42 (3): 335-370.
Schwartz, K. B. 1982. Accounting Changes by Corporations Facing Possible Insolvency.
Journal of Accounting, Auditing & Finance 6 (1):32-43.
Shuto, A. 2010. Earnings Management: Theory and Empirical Evidence from Japan.
Chuokeizai-Sha (in Japanese)
Strong, J. S., and J. R. Meyer. 1987. Asset Writedowns: Managerial Incentives and
Security Returns. Journal of Finance 42 (3): 643-661.
Suda, K. 2000. Positive Theory of Financial Accouting. Hakuto-shobo. (in Japanese)
Suda, K., S. Otomasa, and T. Yamamoto. 2007. Accounting Manipulation. Daimond-Sha
Sweeney, A. 1994. Debt-Covenant Violations and Managers’ Accounting Responses.
Journal of Accounting and Economics 17 (3),:281-308.
Takada, T, and K. Muramiya 2013. The Analysis on Big 4 Auditor Conservatism. Journal
of Ecnomics and Business Administration 208 (5): 53-68. (in Japanese)
Warfield, T. D., J. J. Wild, and K. L. Wild. Managerial Ownership, Accounting Choices,
and Informativeness of Earnings. Journal of Accounting and Economics 20 (1): 61-
33
91.
Yamaguchi, T. 2009. Opportunistic Real Discretion and Future Operating Performance.
Accounting Progress 10: 117-137. (in Japanese)
Yamaguchi, T. 2013. Management Turnover and Earnings Management: Empirical
Analysis of Big Bath by Incoming Managers. Securities Analysts Journal 51 (5):
20-23. (in Japanese)
Yazawa, K. 2010. Big4 and Audit Quality: Audit Cost Hypothesis and Conservative
Accounting Hypothesis Aoyama Journal of Business 44 (4): 165-181. (in Japanese)
Weekly Report on Financial Accounting. 2000 – 2010. Kaikeishori no Henkou Jitsureishu.
Zeimu Kenkyukai. (in Japanese)
Weekly Report on Financial Accounting. 2012. Kaijijitsurei to Keikou. Zeimu Kenkyukai.
(in Japanese)
Zmijewski, M. and R. Hagerman. 1981. An Income Strategy Approach to the Positive
Theory of Accounting Standard Setting/Choice. Journal of Accounting and
Economics 3 (2): 129-149.
34

Table 1
The Effect of Changes in Accounting Policy on Net Income Before Taxes from 2000 to 2013
Year mean median N 2000 -0.0189 -0.0084 644 2001 -0.0032 -0.0016 187 2002 -0.0041 -0.0008 178 2003 -0.0045 -0.0009 143 2004 -0.0110 -0.0048 253 2005 -0.0150 -0.0047 406 2006 -0.0026 -0.0006 160 2007 -0.0072 -0.0039 159 2008 -0.0048 -0.0023 161 2009 0.0001 0.0000 105 2010 0.0027 0.0000 46 2011 -0.0005 -0.0001 30 2012 0.0049 0.0050 29 2013 0.0081 0.0066 45 Total -0.0097 -0.0030 2,546
Net income before tax is divided by total assets at the beginning of the period.
35
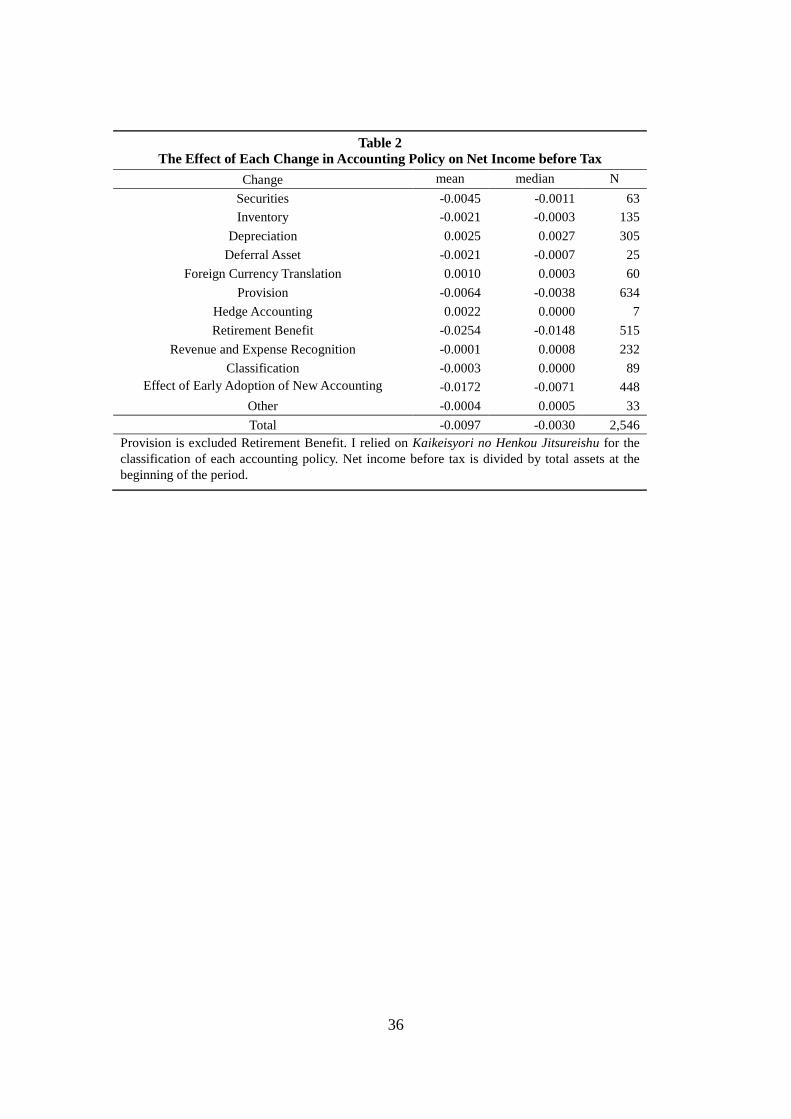
Table 2 The Effect of Each Change in Accounting Policy on Net Income before Tax
Change mean median N Securities -0.0045 -0.0011 63 Inventory -0.0021 -0.0003 135
Depreciation 0.0025 0.0027 305 Deferral Asset -0.0021 -0.0007 25
Foreign Currency Translation 0.0010 0.0003 60 Provision -0.0064 -0.0038 634
Hedge Accounting 0.0022 0.0000 7 Retirement Benefit -0.0254 -0.0148 515
Revenue and Expense Recognition -0.0001 0.0008 232 Classification -0.0003 0.0000 89
Effect of Early Adoption of New Accounting
-0.0172 -0.0071 448 Other -0.0004 0.0005 33 Total -0.0097 -0.0030 2,546
Provision is excluded Retirement Benefit. I relied on Kaikeisyori no Henkou Jitsureishu for the classification of each accounting policy. Net income before tax is divided by total assets at the beginning of the period.
36

Table 3
Comparison of Income-increasing Change Group, Income-decreasing Change Group, and Other Firm-years group Income-Increasing Change Group (NIBTD = 1) Income-Decreasing Change Group (NIBTD = -1) Other Firm-years Group (NIBTD = 0)
Variables mean median s.d. N mean median s.d. N mean median s.d. N UPP1 0.2698 0.0000 0.4443 530 0.3733 *** 0.0000 *** 0.4838 1,677 0.2767 0.0000 0.447
24,759
LOW1 0.2547 ** 0.0000 ** 0.4361 530 0.1825 *** 0.0000 *** 0.3863 1,677 0.2191 0.0000 0.413
24,759 UPP2 0.2472 *** 0.0000 *** 0.4318 530 0.4812 *** 0.0000 *** 0.4998 1,677 0.4085 0.0000 0.491
24,759
LOW2 0.1226 *** 0.0000 *** 0.3283 530 0.0900 0.0000 0.2863 1,677 0.0899 0.0000 0.286
24,759 UPP3 0.2112 ** 0.0000 ** 0.4086 412 0.4964 *** 0.0000 *** 0.5003 838 0.2564 0.0000 0.436
21,819
LOW3 0.3058 *** 0.0000 *** 0.4613 412 0.1229 *** 0.0000 *** 0.3285 838 0.2386 0.0000 0.426
21,819 UPP4 0.2461 *** 0.0000 *** 0.4312 451 0.5241 *** 1.0000 *** 0.4997 935 0.4096 0.0000 0.491
23,562
LOW4 0.1752 *** 0.0000 *** 0.3805 451 0.0481 *** 0.0000 *** 0.2142 935 0.0895 0.0000 0.285
23,562 ALTMAN 0.9938 *** 0.8985 *** 0.5208 530 1.0557 *** 0.9344 *** 0.6121 1,677 1.1094 0.9725 0.638
24,759
DEBT 0.6281 *** 0.6499 *** 0.2001 530 0.5997 *** 0.6170 *** 0.1965 1,677 0.5480 0.5573 0.210
24,759 MGT 0.1925 *** 0.0000 *** 0.3946 530 0.1610 * 0.0000 * 0.3676 1,677 0.1449 0.0000 0.352
24,759
FIN 0.2543 *** 0.2363 *** 0.1483 530 0.2691 *** 0.2500 *** 0.1491 1,677 0.2165 0.1931 0.138
24,759 OWN 0.0392 0.0039 *** 0.0881 530 0.0506 0.0067 *** 0.0927 1,677 0.0772 0.0107 0.821
24,759
BIGN 0.7547 1.0000 0.4307 530 0.7823 1.0000 0.4128 1,677 0.7819 1.0000 0.413
24,759 SIZE 11.531
*** 11.3589 *** 1.5723 530 11.2536 *** 11.0743 *** 1.5413 1,677 10.827
10.6483 1.489
24,759
NOA 1.2378 0.9250 *** 1.8654 530 1.1670 0.8837 *** 2.8985 1,677 1.0819 0.8150 3.976
24,759 MTB 1.2600 0.8718 1.4741 530 2.3676 1.0167 *** 40.842
1,677 1.3775 0.8771 14.90
24,759
***, **, * denote significance at the 0.01, 0.05, and 0.1 levels, respectively, for two-tailed t-tests (two-tailed Wilcoxson tests) of differences in means (medians). The differences between the income-increasing change group (firm-years that increased their NIBT by a change in accounting policy, NIBTD = 1) and other firm-years group (firm-years that did not disclose voluntary changes in accounting policy in the audit reports, NIBTD = 0), and those between income-increasing change group (firm-years that decreased their NIBT by change in accounting policy, NIBTD = -1 ) and other firm-years group (NIBTD = 0) are tested, respectively.
37

Table 4
Correlation Matrix
UPP1 LOW1
UPP2 LOW2 UPP3 LOW3 UPP4 LOW4 ALTMAN DEBT MGT FIN OWN BIGN SIZE NOA MTB
UPP 1 1 LOW1 -0.3293 1 UPP2 0.2276 -0.2200 1 LOW2 -0.0898 0.3879 -0.2572 1 UPP3 0.2187 -0.0123 0.1929 0.1300 1 LOW3 0.0310 0.1825 -0.0749 0.0199 -0.3328 1 UPP4 0.1684 -0.1581 0.6376 -0.2571 0.3086 -0.1475 1 LOW4 -0.0946 0.2769 -0.2585 0.2886 -0.1213 0.0927 -0.2584 1 ALTMAN -0.0140 -0.0060 0.0668 -0.0507 0.0088 0.0049 0.0400 -0.0401 1 DEBT -0.0023 -0.0610 -0.3099 0.0415 -0.0471 -0.0535 -0.2565 0.0851 0.1211 1 MGT 0.0101 0.0092 -0.0339 0.0486 -0.0028 0.0166 -0.0265 0.0182 -0.0036 0.0358 1 FIN -0.0474 -0.0556 0.0354 -0.1162 -0.0321 -0.0694 0.0439 -0.0279 -0.1536 0.0634 -0.0064 1 OWN 0.0141 0.0040 0.0324 -0.0045 0.0092 0.0094 0.0216 -0.0087 0.0154 -0.0233 -0.0106 -0.0567 1 BIGN -0.0183 -0.0169 0.0741 -0.0640 0.0057 -0.0140 0.0744 -0.0319 0.0008 -0.0052 -0.0014 0.0988 -0.0061 1 SIZE -0.0842 -0.0671 -0.0203 -0.1201 -0.0650 -0.0960 -0.0013 -0.0180 -0.1766 0.2006 0.0227 0.6151 -0.0613 0.1730 1 NOA -0.0243 -0.0184 -0.0627 0.0135 -0.0292 -0.0229 -0.0554 0.0191 -0.1621 0.0889 0.0093 0.0373 -0.0068 -0.0358 0.1328 1 MTB 0.0200 -0.0025 0.0059 0.0008 0.0022 0.0130 0.0052 -0.0040 0.0058 0.0313 0.0181 -0.0058 0.0022 0.0035 0.0065 -0.0029 1 N=23,069. The correlation matrix is computed by using the firm years with no missing variables. The definition of the variables are provided in section 3.3.
38

Table 5 Regression Results
Sgn Eqn. (1) Eqn. (2) Eqn. (3) Eqn. (4) NIBT = -1, 0 Coe
z-stat Coef z-stat Coef z-stat Coef
z-stat
Constant ? 3.2177 9.7742*** 4.9026 14.4737*** 5.3823 11.7968*** 5.2097 11.9295*** UPP1 - -
-7.6378*** LOW1 ±
-
-1.7428* UPP2 - -0.5915 -8.9249*** LOW2 ±
-0.3329 -3.2203*** UPP3 - -1.0289 -
LOW3 ±
0.1110 0.9414 UPP4 - -0.5875 -7.1665*** LOW4 ±
0.3862 2.3318** ALTMAN - -
-1.2984 -0.0161 -0.1938 -0.0650 -0.6026 -0.0609 -0.5951 DEBT + -
-1.3316 -0.7360 -4.3752*** -0.4451 -2.1690** -0.6879 -3.2966*** MGT - -
-0.5951 -0.0555 -0.7431 0.0386 0.3597 -0.0111 -0.1126 FIN - -
-4.1653*** -0.8836 -3.7279*** -0.7516 -2.2559** -0.6520 -2.0956** OWN - 0.2876 0.8502 0.5687 1.6512* 0.4727 0.9242 0.8433 1.7306* BIGN ? 0.1451 2.1220** 0.1555 2.2408** 0.0805 0.8105 0.0590 0.6223 SIZE ? -
-4.8119*** -0.1131 -4.3120*** -0.1746 -4.8977*** -0.1407 -4.2496*** NOA - -
-0.3370 -0.0366 -0.5750 -0.1131 -1.4093 -0.0902 -1.2112 MTB ? 0.0423 1.7228* 0.0725 2.6650*** 0.0313 0.7908 0.0291 0.8783 NIBT=0, 1
Constant ?
-
-11.8537*** -7.7160 -
-7.5507 -
-7.2574 -12.2263*** UPP1 - 0.0733 0.6673 LOW1 + 0.2561 2.2656** UPP2 - -0.5248 -4.4690*** LOW2 + 0.1086 0.7564 UPP3 - -0.0886 -0.6670 LOW3 + 0.4175 3.4061*** UPP4 - -0.5120 -4.1378*** LOW4 + 0.4517 3.4137*** ALTMAN - -
-1.3905 -0.1593 -0.9523 -0.2172 -1.1711 -0.1581 -0.8744 DEBT + 1.2225 4.7634*** 0.7513 2.7874*** 1.1377 3.9916*** 0.6625 2.2477** MGT + 0.2420 2.1786** 0.2320 2.0898** 0.3004 2.3743** 0.2856 2.3566** FIN - -
-0.6190 -0.1642 -0.3779 -0.5967 -1.2102 -0.4229 -0.8922 OWN - -
-0.8859 -0.2817 -0.4421 -0.2521 -0.3543 -0.0377 -0.0554 BIGN - -
-2.7318*** -0.2882 -2.6078*** -0.3319 -2.7062*** -0.3212 -2.7201*** SIZE ? 0.2354 5.5996*** 0.2392 5.7264*** 0.2481 5.3727*** 0.2587 5.8532*** NOA - -
-0.5262 -0.0827 -0.6330 -0.0588 -0.3838 -0.1004 -0.7152 MTB ? -
-1.3599 -0.0160 -0.3922 -0.0770 -1.2678 -0.0169 -0.3392 obs 26,966 26,966 23,069 24,948 Pseudo R2 0.145 0.147
0.139 0.120 ***, **, and * indicate significance at the 1%, 5%, and 10% levels (two-tailed). The definitions of variables are provided in section 3.2. The z-statistics are based on robust standard errors clustered by firm. NIBTDit = β0 + β1UPP1it + β2LOW1it-1 + β3ALTMANit-1 + β4DEBTit-1 + β5MGTit-1 + β6FINit-1 + β7OWNit-1 + β8BIGNit-1 + β9SIZEit-1 + β10NOAit-1 + β11MTBit-1 + βYEAR
+ βINDUSTRY + εit (1) NIBTDit =β0 + β1UPP2it + β2LOW2it-1 + β3ALTMANit-1 + β4DEBTit-1 + β5MGTit-1 + β6FINit-1 + β7OWNit-1 + β8BIGNit-1 + β9SIZEit-1 + β10NOAit-1 + β11MTBit-1 + βYEAR
+ βINDUSTRY + εit (2) NIBTDit =β0 + β1UPP3it + β2LOW3it-1 + β3ALTMANit-1 + β4DEBTit-1 + β5MGTit-1 + β6FINit-1 + β7OWNit-1 + β8BIGNit-1 + β9SIZEit-1 + β10NOAit-1 + β11MTBit-1 + βYEAR
+ βINDUSTRY + εit (3) NIBTDit =β0 + β1UPP4it + β2LOW4it-1 + β3ALTMANit-1 + β4DEBTit-1 + β5MGTit-1 + β6FINit-1 + β7OWNit-1 + β8BIGNit-1 + β9SIZEit-1 + β10NOAit-1 + β11MTBit-1 + βYEAR
+ βINDUSTRY + εit (4)
39
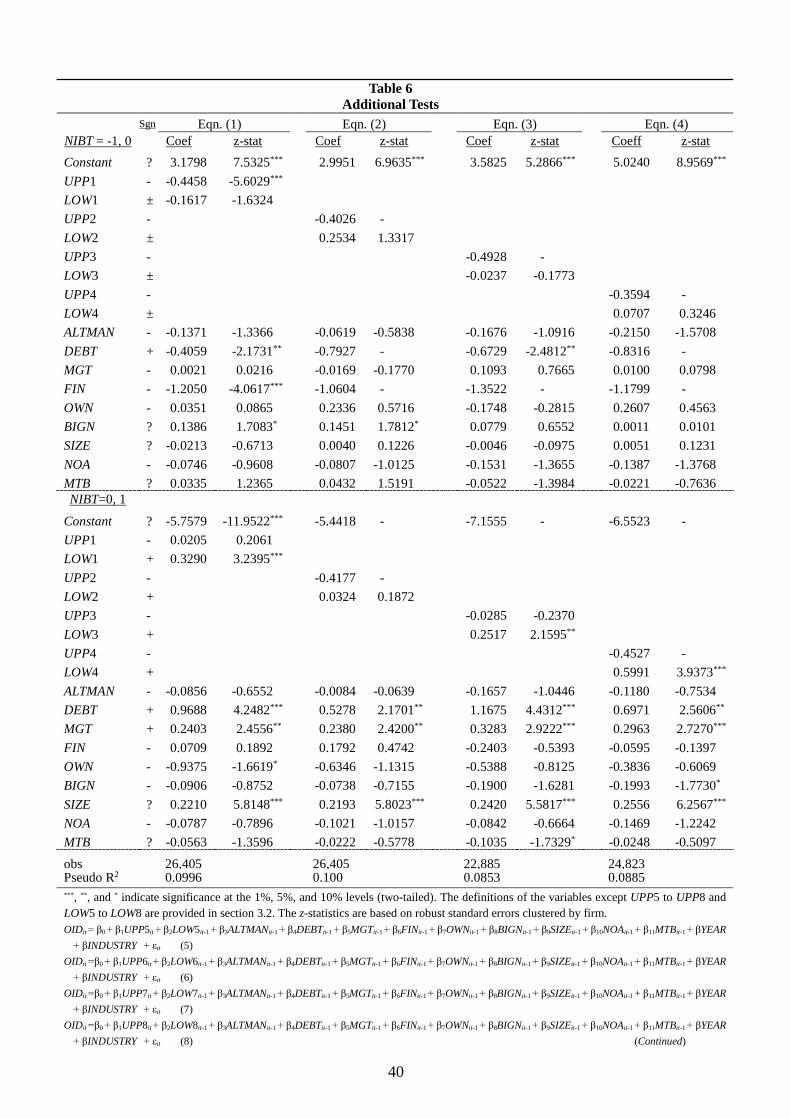
Table 6
Additional Tests Sgn Eqn. (1) Eqn. (2) Eqn. (3) Eqn. (4) NIBT = -1, 0 Coef
z-stat Coef z-stat Coef z-stat Coeff z-stat
Constant ? 3.1798 7.5325*** 2.9951 6.9635*** 3.5825 5.2866*** 5.0240 8.9569*** UPP1 - -0.4458 -5.6029*** LOW1 ±
-0.1617 -1.6324 UPP2 - -0.4026 -
LOW2 ±
0.2534 1.3317 UPP3 - -0.4928 -
LOW3 ±
-0.0237 -0.1773 UPP4 - -0.3594 -
LOW4 ±
0.0707 0.3246 ALTMAN - -0.1371 -1.3366 -0.0619 -0.5838 -0.1676 -1.0916 -0.2150 -1.5708 DEBT + -0.4059 -2.1731** -0.7927 -
-0.6729 -2.4812** -0.8316 -
MGT - 0.0021 0.0216 -0.0169 -0.1770 0.1093 0.7665 0.0100 0.0798 FIN - -1.2050 -4.0617*** -1.0604 -
-1.3522 -
-1.1799 -
OWN - 0.0351 0.0865 0.2336 0.5716 -0.1748 -0.2815 0.2607 0.4563 BIGN ? 0.1386 1.7083* 0.1451 1.7812* 0.0779 0.6552 0.0011 0.0101 SIZE ? -0.0213 -0.6713 0.0040 0.1226 -0.0046 -0.0975 0.0051 0.1231 NOA - -0.0746 -0.9608 -0.0807 -1.0125 -0.1531 -1.3655 -0.1387 -1.3768 MTB ? 0.0335 1.2365 0.0432 1.5191 -0.0522 -1.3984 -0.0221 -0.7636 NIBT=0, 1
Constant ?
-5.7579 -11.9522*** -5.4418 -
-7.1555 -
-6.5523 -
UPP1 - 0.0205 0.2061 LOW1 + 0.3290 3.2395*** UPP2 - -0.4177 -
LOW2 + 0.0324 0.1872 UPP3 - -0.0285 -0.2370 LOW3 + 0.2517 2.1595** UPP4 - -0.4527 -
LOW4 + 0.5991 3.9373*** ALTMAN - -0.0856 -0.6552 -0.0084 -0.0639 -0.1657 -1.0446 -0.1180 -0.7534 DEBT + 0.9688 4.2482*** 0.5278 2.1701** 1.1675 4.4312*** 0.6971 2.5606** MGT + 0.2403 2.4556** 0.2380 2.4200** 0.3283 2.9222*** 0.2963 2.7270*** FIN - 0.0709 0.1892 0.1792 0.4742 -0.2403 -0.5393 -0.0595 -0.1397 OWN - -0.9375 -1.6619* -0.6346 -1.1315 -0.5388 -0.8125 -0.3836 -0.6069 BIGN - -0.0906 -0.8752 -0.0738 -0.7155 -0.1900 -1.6281 -0.1993 -1.7730* SIZE ? 0.2210 5.8148*** 0.2193 5.8023*** 0.2420 5.5817*** 0.2556 6.2567*** NOA - -0.0787 -0.7896 -0.1021 -1.0157 -0.0842 -0.6664 -0.1469 -1.2242 MTB ? -0.0563 -1.3596 -0.0222 -0.5778 -0.1035 -1.7329* -0.0248 -0.5097 obs 26,405 26,405 22,885 24,823 Pseudo R2 0.0996 0.100 0.0853 0.0885 ***, **, and * indicate significance at the 1%, 5%, and 10% levels (two-tailed). The definitions of the variables except UPP5 to UPP8 and LOW5 to LOW8 are provided in section 3.2. The z-statistics are based on robust standard errors clustered by firm. OIDit = β0 + β1UPP5it + β2LOW5it-1 + β3ALTMANit-1 + β4DEBTit-1 + β5MGTit-1 + β6FINit-1 + β7OWNit-1 + β8BIGNit-1 + β9SIZEit-1 + β10NOAit-1 + β11MTBit-1 + βYEAR
+ βINDUSTRY + εit (5) OIDit =β0 + β1UPP6it + β2LOW6it-1 + β3ALTMANit-1 + β4DEBTit-1 + β5MGTit-1 + β6FINit-1 + β7OWNit-1 + β8BIGNit-1 + β9SIZEit-1 + β10NOAit-1 + β11MTBit-1 + βYEAR
+ βINDUSTRY + εit (6) OIDit =β0 + β1UPP7it + β2LOW7it-1 + β3ALTMANit-1 + β4DEBTit-1 + β5MGTit-1 + β6FINit-1 + β7OWNit-1 + β8BIGNit-1 + β9SIZEit-1 + β10NOAit-1 + β11MTBit-1 + βYEAR
+ βINDUSTRY + εit (7) OIDit =β0 + β1UPP8it + β2LOW8it-1 + β3ALTMANit-1 + β4DEBTit-1 + β5MGTit-1 + β6FINit-1 + β7OWNit-1 + β8BIGNit-1 + β9SIZEit-1 + β10NOAit-1 + β11MTBit-1 + βYEAR
+ βINDUSTRY + εit (8) (Continued) 40

(Continued) UPP5 = 1 if the difference between ordinary income before the accounting policy change and ordinary income of the previous period is above the median of nonzero positive values of this variable, and 0 otherwise.. LOW5 = 1 if the difference between ordinary income before the accounting policy change and ordinary income of the previous period is below the median of nonzero negative values of this variable, and 0 otherwise. UPP6 = 1 if ordinary income before the accounting policy change is above the median of nonzero positive values of this variable, and 0 otherwise. LOW6 = 1 if ordinary income before the accounting policy change is below the median of nonzero negative values of this variable, and 0 otherwise. UPP7 = 1 if the difference between first quarter (interim) ordinary income before the accounting policy change and ordinary income of the same period of the previous fiscal year is above the median of nonzero positive values of this variable, and 0 otherwise. LOW7 = 1 if the difference between first quarter (interim) ordinary income before the accounting policy change and ordinary income of the same period of the previous fiscal year is below the median of nonzero negative values of this variable, and 0 otherwise. UPP8 = 1 if first quarter (interim) ordinary income before the accounting policy change is above the median of nonzero positive values of this variable, and 0 otherwise. LOW8 = 1 if first quarter (interim) ordinary income before the accounting policy change is below the median of nonzero negative values of this variable, and 0 otherwise.
41
Top Related