


Languages
Pages
Legal

Ryerson UniversityDigital Commons @ Ryerson
Theses and dissertations
1-1-2012
A Novel Hybrid Active Anti-Islanding Method ForMulti-Converter Fed Distributed GenerationSystemsSasan MostafaeiRyerson University
Follow this and additional works at: http://digitalcommons.ryerson.ca/dissertationsPart of the Electrical and Computer Engineering Commons
This Thesis is brought to you for free and open access by Digital Commons @ Ryerson. It has been accepted for inclusion in Theses and dissertations byan authorized administrator of Digital Commons @ Ryerson. For more information, please contact [email protected].
Recommended CitationMostafaei, Sasan, "A Novel Hybrid Active Anti-Islanding Method For Multi-Converter Fed Distributed Generation Systems" (2012).Theses and dissertations. Paper 1422.
A NOVEL HYBRID ACTIVE ANTI-ISLANDING METHOD FOR
MULTI-CONVERTER FED DISTRIBUTED GENERATION SYSTEMS
by
SASAN MOSTAFAEI
Bachelor of Science, Electrical Engineering, Isfahan University of Technology, IRAN, 1995
A thesis
presented to Ryerson University
in partial fulfillment of the requirements for the degree of
Master of Applied Science
in the Program of
Electrical and Computer Engineering
Toronto, Ontario, Canada, 2012
© Sasan Mostafaei, 2012

ii
AUTHOR’S DECLARATION
I hereby declare that I am the sole author of this thesis. This is a true copy of the thesis, including
any required final revisions, as accepted by my examiners.
I authorize Ryerson University to lend this thesis to other institutions or individuals for the
purpose of scholarly research.
I further authorize Ryerson University to reproduce this thesis by photocopying or by other
means, in total or in part, at the request of other institutions or individuals for the purpose of
scholarly research.
I understand that my thesis may be made electronically available to the public.

iii
BORROWER’S PAGE
Ryerson University requires the signatures of all persons using or photocopying this thesis.
Please sign below, and give address and date.
Name Address Date Signature
iv
ABSTRACT
A Novel Hybrid Active Anti-Islanding Method For Multi-Converter Fed Distributed Generation Systems
© Sasan Mostafaei, 2012
Master of Applied Science
in the program of
Electrical and Computer Engineering
Ryerson University
This thesis presents a novel active anti-islanding detection scheme for the three phase grid-
connected converters. The proposed hybrid method works based on the combination of Positive
Feedback Frequency Shift (PFFS) and Reactive Power Variation (RPV) methods, and therefore
it combines the features of both methods. Unlike the RPV scheme, this method is capable of
synchronizing all power converters with each other in a distributed generation (DG) system.
Therefore, it can effectively detect islanding when the DG system has multiple renewable energy
sources interfaced to the system by multiple converters.
The proposed method can also be combined with other active methods, such as the active
frequency drift method. This minimizes the power quality degradation since the scheme is called
upon only when 0.1Hz deviation in the grid frequency is detected. Moreover, unlike other
positive feedback methods, this scheme has little impact on the stability of the DG system, since
the positive feedback reference is only limited to 0.5% of the converter generated power. The
performance of the proposed method is verified by simulation and experiments.

v
ACKNOWLEDGMENTS
First and foremost, I offer my sincerest gratitude to my supervisor, Dr. Bin Wu, who has
supported me throughout my thesis with his patience and knowledge. His personality will be a
source of inspiration to me for the rest of my life. I would also like to express my deepest
gratitude to my co-supervisor, Dr. Soosan Beheshti, for her valuable suggestions and help during
the last two years.
I am grateful to Dr. Amir Nasr Yazdani for his guidance and support. I am also indebted to
Mr. Venkata Yaramasu for sharing his knowledge in the experimental procedures of my thesis.
Finally, this thesis is dedicated to my family members, especially my wife, Parastoo, for
supporting and encouraging me to pursue this degree.

vi
TABLE OF CONTENTS
ABSTRARCT……..……………………………………….…………...……………………….. iv
ACKNOWLEDGMENTS………………………………...…………..…………………………..v
TABLE OF CONTENTS……………………………………………………...…………..……..vi
LIST OF FIGURES…………………………………………………….………………….….......x
LIST OF TABLES………………………………………………………..………………….....xiii
NOMENCLATURE………………………………………………………..…………………...xiv
CHAPTER 1 Introduction…………………………………………………...…………………….1
1.1 Power quality ……………………….………………………………………………….....1
1.2 Islanding …………….………………………………………………………………….....2
1.3 Islanding detection methods………….……………………………………………...,,…..4
1.4 Motivation ...…………………………….…………….………………………………...5
1.5 Organization of thesis ………..……………………………………………………...…...6
CHAPTER 2 Control and Design of the Grid-connected Converters ..…………………..……8
2.1 Grid-connected Converters……………………………………………………………8
2.2 Grid requirements……………………………………………….……………………..9
2.2.1 Grid frequency …………….………………………….…………………………..9
2.2.2 Grid voltage …….………………………….…………………………………....10
2.2.3 DC current injection …….………………………….…………………………...10
2.2.4 Current harmonic …….………………………….……………………………...11
2.2.5 Islanding …….………………………….……………………………………….11
2.3 Voltage source inverter …….………………………….………………………………....12
2.4 PWM modulator …….………………………….………………………………………..13
2.4.1 Harmonic spectrum of SPWM…….………………………….…………………14
2.4.2 Selection of switching frequency …….……………………….………………...15
2.5 Grid filter………………………………………………………………………………..16
2.5.1 L-Filters ………………………………………………………………………….16
2.5.2 LCL-Filters ……………………………………………………………………...16
2.5.3 Sizing of LCL filters …………………………………………………………….16
2.6 Current controller ……………………………………………………………………...…21

vii
2.6.1 Tuning of PI controllers …………………………………………………………26
2.6.2 Phased locked loop (PLL) ……………………………………………………….28
2.7 Case study ………………………………………………………………………………..30
2.7.1 Sizing of LCL filter ………………………………………………………….…30
2.7.2 PI tuning of the voltage-oriented controller (VOC) ………………………….32
2.7.3 PI tuning of the phase locked Loop (PLL) ………………………………………32
2.7.4 Simulation ………………………………………………………………………33
2.8 Summary …………………………………………………………………………………34
CHAPTER 3 Islanding Detection Methods for the Grid-connected Converters ………..…38
3.1 Islanding………………………………………………………………………………….38
3.2 Anti-islanding requirements in IEEE Std. 1547…………………………………………39
3.3 Non-detection zone (NDZ)………………………………………………………………41
3.4 Anti-islanding (AI) detection methods…………………………………………………..42
3.5 Passive anti-islanding detection methods ……………………………………………….44
3.5.1 Over/under voltage/frequency Detection (OUF-OUV) …………………………44
3.5.2 Phase jump detection (PJD) ……………………………………………………..46
3.5.3 Harmonic detection method (HD) ……………………………………………....46
3.5.4 Summary of the passive methods ……………………………………………….47
3.6 Active anti-islanding detection methods …………………………………………….…..47
3.6.1 Frequency drift methods ………………………………………………….…..…48
3.6.2 Voltage drift methods ………………………………………………………..….57
3.6.3 Impedance estimation (IE) ………………………………………………….…...59
3.6.4 Negative sequence detection ………………………………………………..…...62
3.6.5 PLL based methods ……………………………………………………………...63
3.7 External impedance insertion (EII) ……………………………………………………...63
3.8 Grid-resident anti-islanding detection methods……………………………………….....64
3.8.1 Power line carrier communication (PLCC) ……………………………………..64
3.8.2 Supervisory control and data acquisition (SCADA)………………………..……65
3.9 Comparison of anti-islanding detection methods ………………..…………..…….……65
3.10 Summary ……………………………………………………………………………..…65
CHAPTER 4 Novel Anti-Islanding Method for Multiple-Converters Applications……...……..68

viii
4.1 Problem statement………………………………………………….……………………68
4.2 Novel anti-islanding method ………………….……………………………………..….72
4.2.1 Positive feedback frequency shift scheme (PFFS) …….…….………………...73
4.2.2 Positive feedback gain .…….………………………..…………………………..74
4.2.3 Low pass filter …….…………………………..………………………………....76
4.2.4 Finite impulse filter (FIR) …………………………………………………….....76
4.2.5 Pre-detection time ( 0T )…………………………………………………………..77
4.2.6 RPV method ……………………………………………………………………..79
4.3 Computer simulation ………………….………………………………………………...80
4.3.1 Simulation model …….………………………………………………………….82
4.4 Simulation result ………………….……………………………………………………..83
4.4.1 Islanding with zero mismatch in active and reactive power …………………….83
4.4.2 Positive feedback frequency shift (PFFS) scheme……………………………….86
4.4.3 Performance of anti-islanding scheme when 1fQ …...…………..……….…….89
4.4.4 Performance of anti-islanding scheme when 5.2fQ ……………..………….….90
4.4.5 Performance of anti-islanding scheme when %50GCCP …...…………………….91
4.4.6 Performance of anti-islanding scheme with three converters paralleled ………..91
4.5 Anti-islanding scheme performance comparison ………………….…………………….92
4.5.1 Reliability ………………………………………………………………………..93
4.5.2 Maintaining power quality………………………………………………….…...93
4.5.3 Multiple-converters application …………………………………………..…….93
4.6 Summary ………………….………………………………………………………….....94
CHAPTER 5 Experimental Verification ……………...…………………………………..……95
5.1 Hardware implementation……………………………………………………………….95
5.2 Software implementation………………………………………………………………...96
5.3 Experimental results ………………………………….……………………………….....97
5.3.1 Converter connected to the grid …….……………………………………..…..99
5.3.2 Islanding with zero mismatch in active and reactive power …………………100
5.3.3 Positive feedback frequency shift (PFFS) scheme……………………………102
5.3.4 Performance of anti-islanding scheme when 1fQ ……………….……………103

ix
5.4 Summary………………………………………………………………………………105
CHAPTER 6 Conclusion….…………………………..….…………..……………...…………107
REFERENCES……………………………………………………………………………….110
x
LIST OF FIGURES
Fig. 1.1 Grid-connected converter for photovoltaic system ……………………………………2
Fig. 1.2 Islanding formation in the DG system ………………………………….…………….3
Fig. 1.3 Islanding detection methods .…………………………………………………………..4
Fig. 2.1 Structure of the grid-connected converter ……………………………………………10
Fig. 2.2 Simplified two-level voltage source inverter VSI)…………………………………...12
Fig. 2.3 Sinusoidal pulse width modulation (SPWM) ………………….……………………..14
Fig. 2.4 Harmonic content of abv ……………………………………………………………15
Fig. 2.5 Grid filters …………………………………………………………………………....17
Fig. 2.6 Transfer functions of L and LCL filters.………………………………....…..……….18
Fig. 2.7 Block diagram of voltage oriented control (VOC) ……………………………….......23
Fig. 2.8 Grid angle in VOC scheme ……………………………….………………………….25
Fig. 2.9 The Current loop of PI ……………………………………………………………....26
Fig. 2.10 PLL based on synchronous reference frame (SRF) …………………………………29
Fig. 2.11 Block diagram of the grid-connected converter discussed in the case study ………...32
Fig. 2.12 The grid-connected converter operating at nominal power ………………………….35
Fig. 2.13 Harmonic spectrum of the converter’s current ……………………………………….36
Fig. 2.14 VOC response to the step change of the converter’s active power reference ……….36
Fig. 2.15 PLL response to the step change of the grid frequency ……………………………..37
Fig. 3.1 Unintentional islanding test configuration, source IEEE Std. 1547…………………..40
Fig. 3.2 Interconnection of grid-connected converter …………………..……………….……43
Fig. 3.3 Non-Detection zone (NDZ).…………………..…………………………………..…..43
Fig. 3.4 Anti-islanding methods ……………………………………………………………....45
Fig. 3.5 GEFS method …………..…………………………………………………………….49
Fig. 3.6 AFD method ………………………………………………………………………….51
Fig. 3.7 Modifying grid angles in PLL for AFD method ……………………………………..51
Fig. 3.8 AFD implementation…………………………………………………………….……51
Fig. 3.9 THD versus chopping factor.………………..………………………………………..54
Fig. 3.10 Chopping factor in AFDPCF …………………..…………………………………….54
Fig. 3.11 Phase versus frequency in SMS ……………………………………………………...56
xi
Fig. 3.12 RPV method ………………………………………………………………………….57
Fig. 3.13 GEVS method ……………………………………………………………………..…59
Fig. 3.14 Changing active and reactive power for measuring grid impedance ……………..….62
Fig. 3.15 Measuring of grid impedance with two working points …………………………......62
Fig. 3.16 External impedance insertions ………………………………………………………..63
Fig. 3.17 Power line carrier communications to detect islanding ….…………………………...63
Fig. 4.1 PLL based on synchronous reference frame (SRF) …………………………………..69
Fig. 4.2 Variation of frequency after islanding …………………..……………………………72
Fig. 4.3 The proposed active AI scheme …………………..………………………………….75
Fig. 4.4 Variation of frequency with positive feedback ……………………………………....78
Fig. 4.5 Analytical approach to estimate the pre-detection time …………………..….….....79
Fig. 4.6 The proposed active scheme combined with RPV …………………………………..80
Fig. 4.7 One cycle reactive power injection pattern ……………………………………….….81
Fig. 4.8 Detection time in the proposed AI scheme ……………………………………..……81
Fig. 4.9 Circuit diagram of AI test-setup …………………..………………………………….84
Fig. 4.10 Circuit diagram of AI test-setup for three converters …………………..…………….85
Fig. 4.11 The islanding with zero mismatches in active and reactive power …………………..87
Fig. 4.12 Converter output voltage dq components …………………………………………....88
Fig. 4.13 Positive feedback frequency shift (PFFS) scheme to pre-detect islanding …………88
Fig. 4.14 Reactive power references when PFFS scheme is enabled ………………….….…....89
Fig. 4.15 Detection of islanding when 1fQ ……………………………………..…….……...89
Fig. 4.16 Detection of islanding when 5.2fQ .……………………..……………….……..…..90
Fig. 4.17 Detection of islanding when %50GCCP ………………………………………….…...91
Fig. 4.18 Positive feedback frequency shift (PFFS) scheme for three converters paralleled. .....92
Fig. 5.1 Prototype of AI test-setup based on dSPACE ……………………………………….96
Fig. 5.2 the grid-connected converter operating at nominal power………………………..…..99
Fig. 5.3 VOC response to the step change of active power reference …………….......….….100
Fig. 5.4 Converter output set at 100% of its nominal value………………………..……....100
Fig. 5.5 Converter output set at 50% of its nominal value ………………………….…..….101
Fig. 5.6 PLL response during start-up …………………………………………….….…….101
Fig. 5.7 The islanding with zero mismatches in active and reactive power …………………102

xii
Fig. 5.8 PFFS scheme to pre-detect islanding ……………………………………………....103
Fig. 5.9 Reactive power supplied by converter.………...………………………………..…..103
Fig. 5.10 Detection of islanding when 1fQ (over frequency) ………………………….…...104
Fig. 5.11 Detection of islanding when 1fQ (under frequency) ………………………….….104

xiii
LIST OF TABLES
Table 2.1 Interconnection system response to abnormal voltages ……………………………..11
Table 2.2 Maximum current harmonics specified by IEEE Std. 1547 ………...……………….12
Table 2.3 System specification of the grid-connected converter Estimated ……………….......30
Table 2.4 Simulation system specification of the grid-connected converter …………………..34
Table 3.1 Performance comparison for AI methods…………………........................................67
Table 4.1 Simulation system specification of the grid, transformer and the load ……..………85
Table 4.2 Simulation system specification of the grid-connected converter ………………......86
Table 5.1 Experimental system specification of the grid, transformer and the load …………..97
Table 5.2 Experimental system specification of the grid-connected converter ……………..…98

xiv
NOMENCLATURE
i Current
v Voltage
f Frequency
Angular frequency
R Load resistance of load
L Load inductance
C Load capacitance
h Harmonic order
THD Total harmonic distortion
dcC DC-link capacitor
dcI DC-link current
dcV DC-link current
swf Switching frequency
crf Carrier frequency
mf Modulation frequency
fm Frequency modulation index
am Amplitude modulation index
crV Peak of carrier wave
mV Peak of modulation wave
gv Converter output voltage
gi Converter output current
refP Converter active power reference
refQ Converter reactive power reference
GCCP Active power supplied by grid-connected converter
GCCQ Reactive power supplied by grid-connected converter

xv
s Laplace operator
gL Grid-side inductor
iL Inverter-side inductor
fC Filter Capacitor
dR Damping resistor
resf Resonance frequency
gridL Imaginary part of grid impedance
gridR Real part of grid impedance
bZ Base impedance of converter
nV Nominal voltage of converter
nI Nominal current of converter
nf Nominal frequency of converter
nP Nominal power of converter
ii Inverter current
*gP Active power reference set by operator
*gQ Reactive power reference set by operator
dgv d component of converter output voltage
qgv q component of converter output voltage
qgi q component of converter output current
dgi d component of converter output current
*qgi Set-point of qgi
*dgi Set-point of dgi
qiv q component of inverter output voltage
div d component of inverter output voltage

xvi
iVOCk Integral gain of PI controllers utilized in VOC
pVOCk Proportional gain of PI controllers utilized in VOC
g Grid angular frequency
)(sGd Transfer function delay caused by digital signal processor
)(sG f Transfer function of the LCL-filter
)(sGPI Transfer function of the PI controller
iT Time constant of integrator
sT Sampling time of digital signal processor
fiT Delay caused by utilizing low pass digital filters
gR Resistance of the grid filter
pT Time constant of grid filter
pPLLk Proportional gain of PI controllers utilized in PLL
iPLLT Integral gain of PI controllers utilized in PLL
st Settling time of PLL
fQ Quality factor
loadP Active power consumed by load
P Active power mismatch
loadQ Reactive power consumed by load
Q Reactive power mismatch
gV Converter output voltage after islanding
f Converter frequency after islanding
maxf Maximum allowable operating frequency for converter
minf Minimum allowable operating frequency for converter
maxV Maximum allowable operating voltage for converter
minV Minimum allowable operating voltage for converter
xvii
thershold Threshold phase angle
fc Chopping factor
I Peak of current
kf Measured frequency at thk sample
)(kfc Calculated chopping factor at thk sample
load Phase angle of load
n Measured angular frequency at thn sample
1fi Injected current at frequency of f1
1fZ Impedance measured at frequency of f1
Converter angular frequency after islanding
pfK Positive feedback gain
0T Islanding pre-detection time
3T Islanding detection time
ff Feed-forward

1
Chapter One
Introduction
In the last few years, Distributed Generation (DG) based on Renewable Energy Sources
(RES) has experienced over 30% growth per year [1]. The large centralized power plants have
excellent economies of scale. However the size of investment, environmental impacts and long
distance transmission lines are problematic, whereas in the Distributed Generation (DG), the
total investment can be spread over many owners. The security of the supply may be improved
and the environmental impacts are reduced. Obviously the shift from large centralized
production units connected at high voltage levels at network to small decentralized units
connected at lower voltage levels will have some barriers to overcome. These barriers include
economic, technical, and regulatory issues [2]. Among them, power quality and islanding are the
two most important technical issues in the DG systems.
1.1 Power quality
Power quality issues are becoming more pronounced as the renewable distributed generation
systems utilize power electronic converters [3]. Grid-connected converters are utilized as the
main interface between energy sources (such as photovoltaic or wind generation units) and the
grid. These converters should be able to control active and reactive power, to operate within a
wide range of voltage and frequency, to support voltage ride-through capability, to inject reactive
current during faults, and to support the grid code requirements [1]. A typical grid-connected
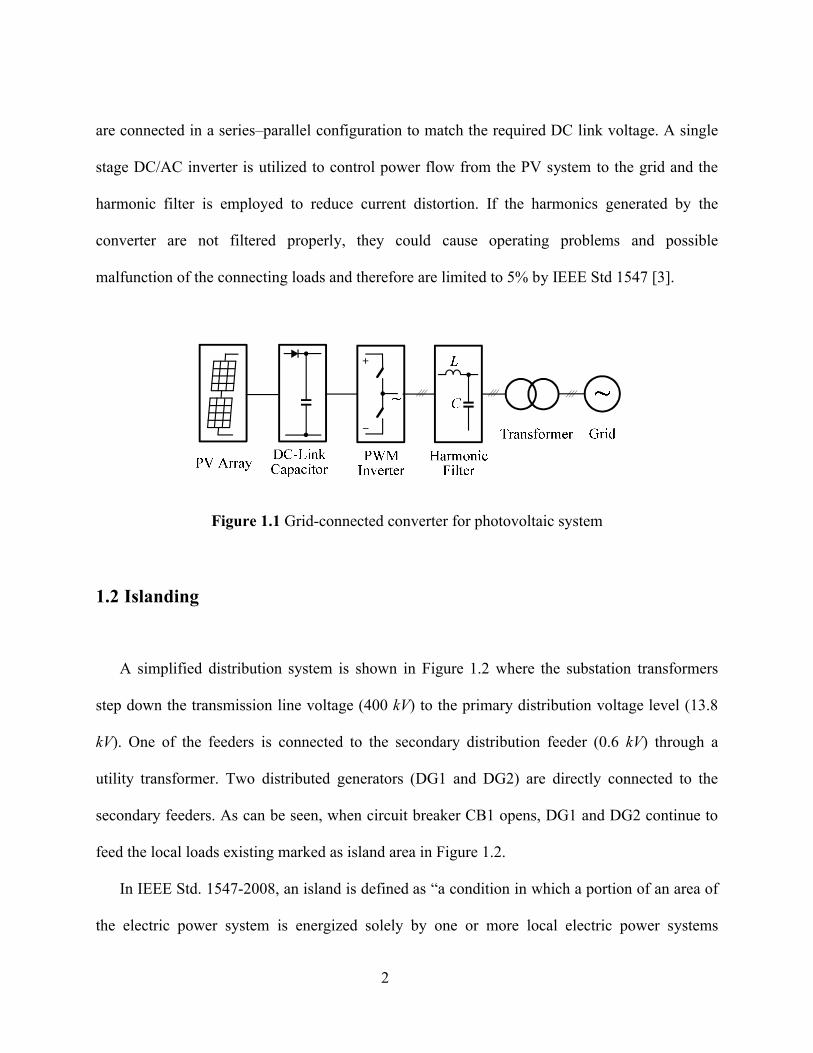
converter for the photovoltaic (PV) system is illustrated in Figure 1.1, where solar PV modules
2
are connected in a series–parallel configuration to match the required DC link voltage. A single
stage DC/AC inverter is utilized to control power flow from the PV system to the grid and the
harmonic filter is employed to reduce current distortion. If the harmonics generated by the
converter are not filtered properly, they could cause operating problems and possible
malfunction of the connecting loads and therefore are limited to 5% by IEEE Std 1547 [3].
Figure 1.1 Grid-connected converter for photovoltaic system
1.2 Islanding
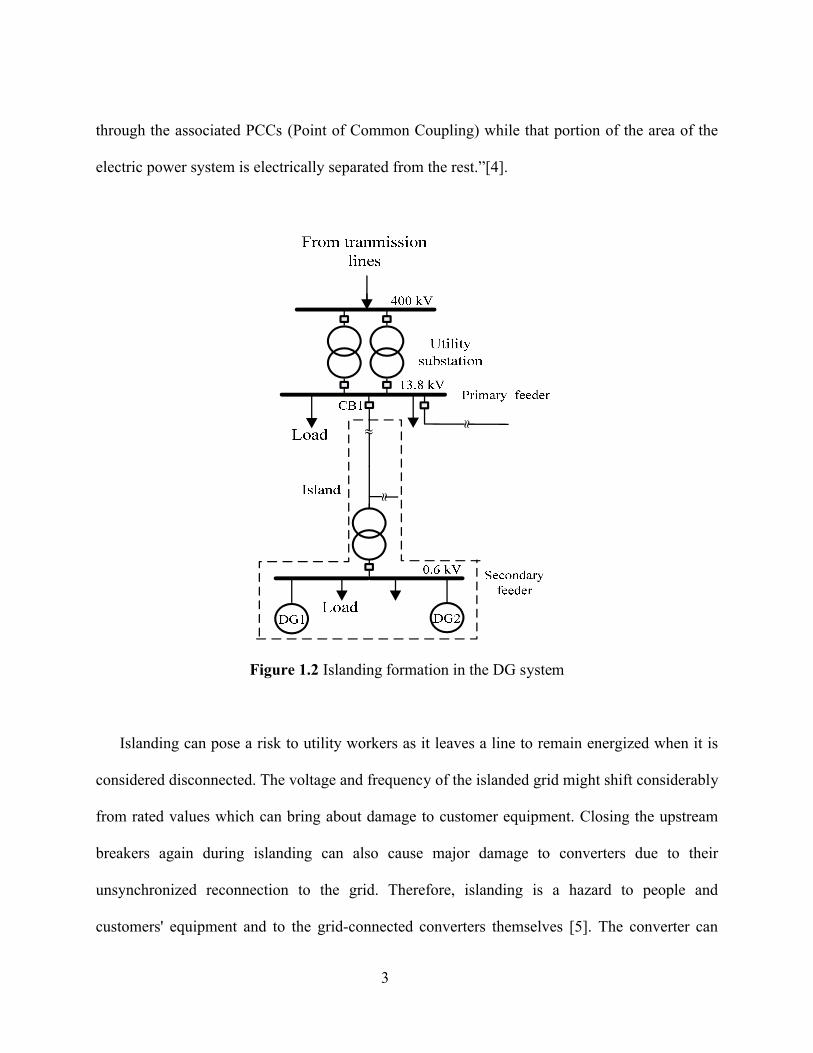
A simplified distribution system is shown in Figure 1.2 where the substation transformers
step down the transmission line voltage (400 kV) to the primary distribution voltage level (13.8
kV). One of the feeders is connected to the secondary distribution feeder (0.6 kV) through a
utility transformer. Two distributed generators (DG1 and DG2) are directly connected to the
secondary feeders. As can be seen, when circuit breaker CB1 opens, DG1 and DG2 continue to
feed the local loads existing marked as island area in Figure 1.2.
In IEEE Std. 1547-2008, an island is defined as “a condition in which a portion of an area of
the electric power system is energized solely by one or more local electric power systems
3
through the associated PCCs (Point of Common Coupling) while that portion of the area of the
electric power system is electrically separated from the rest.”[4].
Figure 1.2 Islanding formation in the DG system
Islanding can pose a risk to utility workers as it leaves a line to remain energized when it is
considered disconnected. The voltage and frequency of the islanded grid might shift considerably
from rated values which can bring about damage to customer equipment. Closing the upstream
breakers again during islanding can also cause major damage to converters due to their
unsynchronized reconnection to the grid. Therefore, islanding is a hazard to people and
customers' equipment and to the grid-connected converters themselves [5]. The converter can
4
detect islanding and cease to inject current within two seconds of formation of the island as
mandated by IEEE Std. 1547 [4].
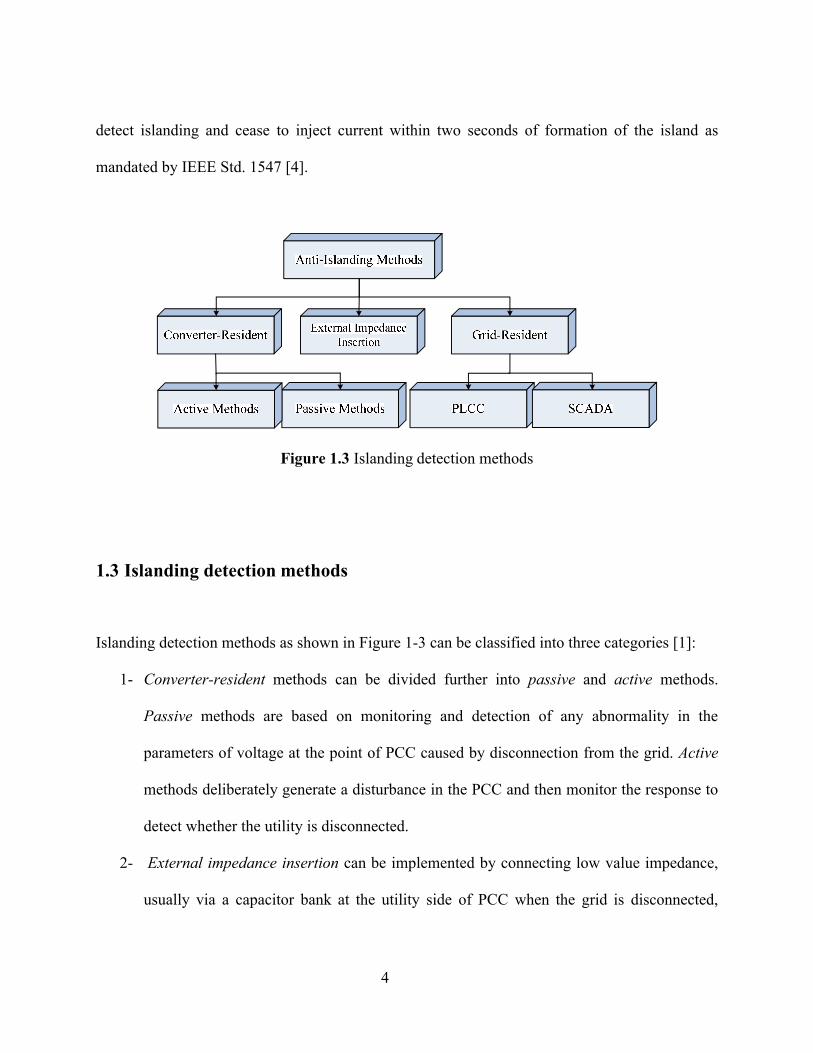
Figure 1.3 Islanding detection methods
1.3 Islanding detection methods
Islanding detection methods as shown in Figure 1-3 can be classified into three categories [1]:
1- Converter-resident methods can be divided further into passive and active methods.
Passive methods are based on monitoring and detection of any abnormality in the
parameters of voltage at the point of PCC caused by disconnection from the grid. Active
methods deliberately generate a disturbance in the PCC and then monitor the response to
detect whether the utility is disconnected.
2- External impedance insertion can be implemented by connecting low value impedance,
usually via a capacitor bank at the utility side of PCC when the grid is disconnected,
5
which creates a step change in the phase between current and the voltage of the converter
at PCC.
3- Grid-resident methods require means of communication between the grid and converter
such as the PLCC (power line carrier communication) or SCADA (supervisory control
and data acquisition).
1.4 Motivation
Motivation for this research is to propose a new active anti-islanding method with no impact
on power quality, and the stability of the network which can be utilized when multiple converters
are connected to the PCC.
The proposed method has the following features:
Many of the active AI methods degrade power quality, since they continuously inject
disturbance into the network. In the proposed method, the active process to detect
islanding is triggered only when it is called upon. Therefore this method will not
affect the power factor (PF), total harmonic distortion (THD) or the stability of the
network. As a result, this method exhibits superior performance in terms of
maintaining power quality when compared to other AI methods.
Many of the active AI methods could fail when multiple converters are connected to
the grid. This happens because the disturbance injected by one converter can cancel
the other one due to lack of synchronization between them. The proposed scheme

6
introduces a unique method to synchronize converters together. Therefore, it can be
combined with other active methods when multiple converters are paralleled to the
grid.
1.5 Organization of Thesis
The contents of this thesis are divided into six chapters. Chapter 1 is an introduction to the
research. Chapter 2 describes the structuring blocks of a grid-connected converter. The grid
requirements mandated by IEEE Std. 1547 are then introduced. A step-by-step design procedure
for sizing of harmonic filter, selection of switching frequency and tuning of PI controllers in the
Voltage Oriented Control (VOC) scheme and the phase locked loop (PLL) are presented. A Case
study with simulation is given to verify the design guidelines.
Chapter 3 details about islanding formation, and its potential hazards. Various proposed anti-
islanding detection methods and the criteria for their evaluation are then discussed.
Chapter 4 presents the main contribution of this thesis: a novel hybrid active anti-islanding
method based on combining the Positive Feedback Frequency Shift (PFFS) and Reactive Power
Variation (RPV). The intent of the research is to develop a robust active AI method with no
impact on power quality or stability of the network that can be utilized in multi-converter
applications. This unique method can also be combined with other active methods to reduce the
power quality degradation. The performance of the proposed method is then verified in single
and multiple-converter applications by simulation in Simulink/Matlab.

7
Chapter 5 presents the experimental verification of the proposed anti-islanding detection
method for the three-phase grid-connected converter. A prototype of the low-power grid-
connected converter is built based on the dSPACE prototyping system.
And finally, Chapter 6 draws conclusions based on the research for this thesis.

8
Chapter Two
Control and Design of Grid-connected Converters
Grid-connected converters are the key element in renewable energy integration. They can be
envisioned as electronic power interfaces between energy sources (such as fuel cell, photovoltaic
or wind generation units) and the grid. They should be able to control active and reactive power,
to operate within a wide range of voltage and frequencies, to support voltage ride-through
capability, to inject reactive current during faults, and to detect islanding and support the grid
code requirements [1].
In this chapter the block diagram of a grid-connected converter is presented. Based on the
grid requirements given by relevant standards, a step-by-step design procedure for a grid-
connected converter is discussed. The designed converter is later simulated in Chapter 5 and
implemented in Chapter 6.
2.1 Grid-connected converters
The block diagram for a grid-connected converter is illustrated in Figure 2.1, where the
photovoltaic or wind system is replaced by a DC power supply ( dcV ). The current controller is
based on the setting given for active power ( refP ) and reactive power ( refQ ). Measuring
voltages ( gv ) and currents ( gi ) at the output terminal determines control signals for the pulse
width modulator (PWM). Based on the switching pattern from the PWM modulator, the voltage
source inverter (VSI) controls the power flow from the DC side to the grid. A harmonic filter is

9
utilized to remove high switching frequency distortion which is usually required by grid code.
Phase locked loop (PLL) ensures that the frequency and phase of injected current is synchronized
with respect to the grid voltage. Finally, the maximum power point tracking block (MPPT)
continuously ensures that the maximum power is captured from the wind or PV system. Since
most of the design criteria for the converter systems are dictated by the grid requirements,
relevant international standards are introduced in the following section.
2.2 Grid requirements
The two main standards addressing the connection of converters to the grid are [1]:
IEEE Std. 1547-2008: Standard for Interconnecting Distributed Resources with Electric
Power Systems [1]; and
IEC 61727 2004: Photovoltaic (PV) Systems - Characteristics of the Utility Interface [6].
The IEEE Std. 1547 addresses all types of distributed resources (including grid-connected
converters) up to 10MW and establishes mandatory regulations. It covers technical specifications
islanding, design, commissioning, and testing of the interconnection. Requirements mandated by
IEEE Std. 1547 for designing a grid-connected converter are investigated in the following
sections.
2.2.1 Grid frequency
The frequency of the grid is measured at the interconnection point of converter and grid,

10
either by phase locked loop (PLL) or zero crossing detectors (ZCD). When the measured
frequency is out of the range (>60.5Hz or <59.3Hz), this will be considered an abnormal grid
connection, and the converter must stop injecting current to the grid within 0.16sec.
2.2.2 Grid voltage
As specified in Table 2.1, the converter must cease injecting current to the grid within a
given clearing time when the grid voltage measured at the interconnection point is detected as
being abnormal.
refPrefQswf
dcIdcV
dcVdcI
gv
gi
Figure 2.1 Structure of the grid-connected converter
2.2.3 DC current injection
DC current injected by the converter shall be limited to 0.5% of the rated RMS current under

11
any operating conditions.
Table 2.1 Interconnection system response to abnormal voltage, IEEE Std. 1547[4]
Voltage range
(% of base voltage)
Clearing time
(sec)
V < 50 0.16
50 < V < 88 2.00
110 < V < 120 1.00
V > 120 0.16
2.2.4 Current harmonics
Odd order harmonics in the injected current shall be limited, as specified in Table 2.2, to
reduce adverse effects to other equipment connected to the grid [1]. Even order harmonics are
limited to ¼ of the odd harmonic limits given in the table [4].
2.2.5 Islanding
In IEEE Std. 1547, an island is defined as “a condition in which a portion of an area of the
electric power system is energized solely by one or more local electric power systems while that
portion of the area of the electric power system is electrically separated from the rest” [4]. The
standard states that an island shall be detected, and the converter shall cease injecting current to
the grid within 2 seconds after the formation of an island.

12
Table 2.2 Maximum current harmonics specified by IEEE Std. 1547[4]
Odd
Harmonic
order
11h 1711 h 2317 h 3523 h 35h THD
% 4.0 2.0 1.5 0.6 0.3 5.0
2.3 Voltage source inverter
Central PV inverters are typically built in a three-phase two-level voltage source inverter
configuration, as shown in Figure 2-2 [7]. This consists of six IGBTs, 61 ~ SS , with an anti-
parallel free-wheeling diode with each switch. Typical power ratings for the small-central and
central inverters are 6 to 15kW and 100 to1000kW, respectively [1]. For the high power
converter, a utility transformer is usually connected between the converter and the grid, as shown
in Figure 2.1, to achieve galvanic isolation. Such isolation is often needed in order to ground the
PV system properly, but in commercial small-central inverters a transformer-less approach is
preferred.
Figure 2-2 Simplified two-level voltage source inverter (VSI)
13
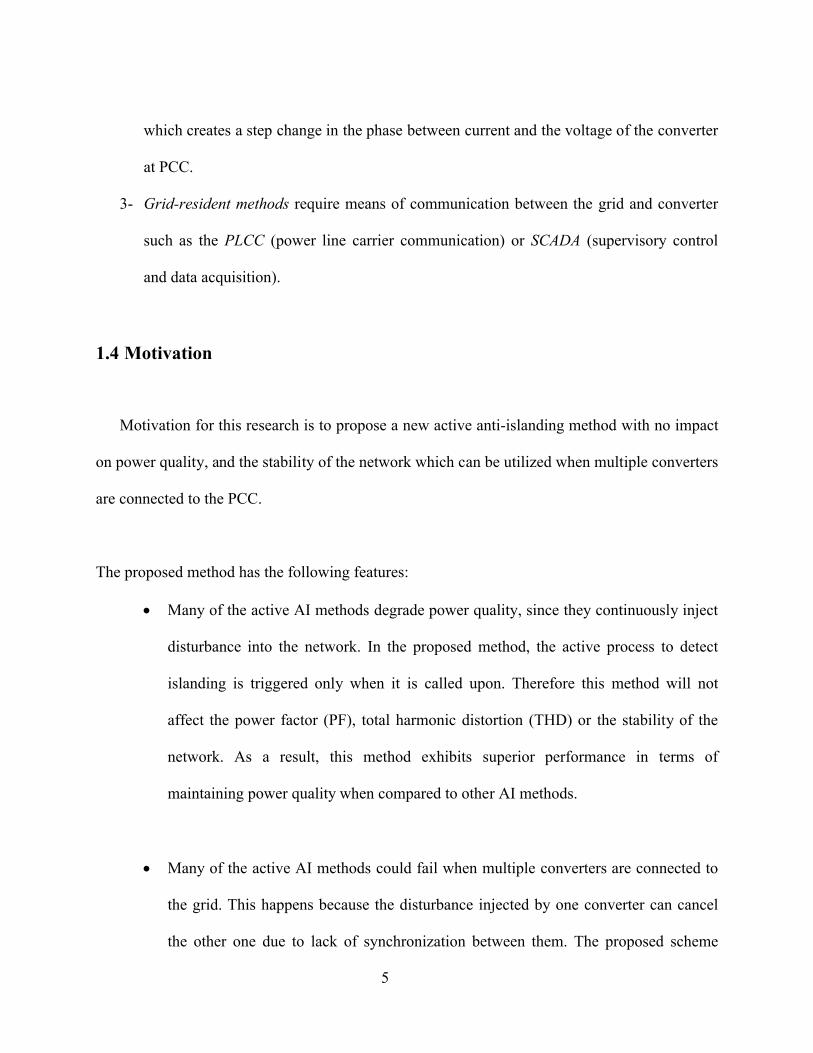
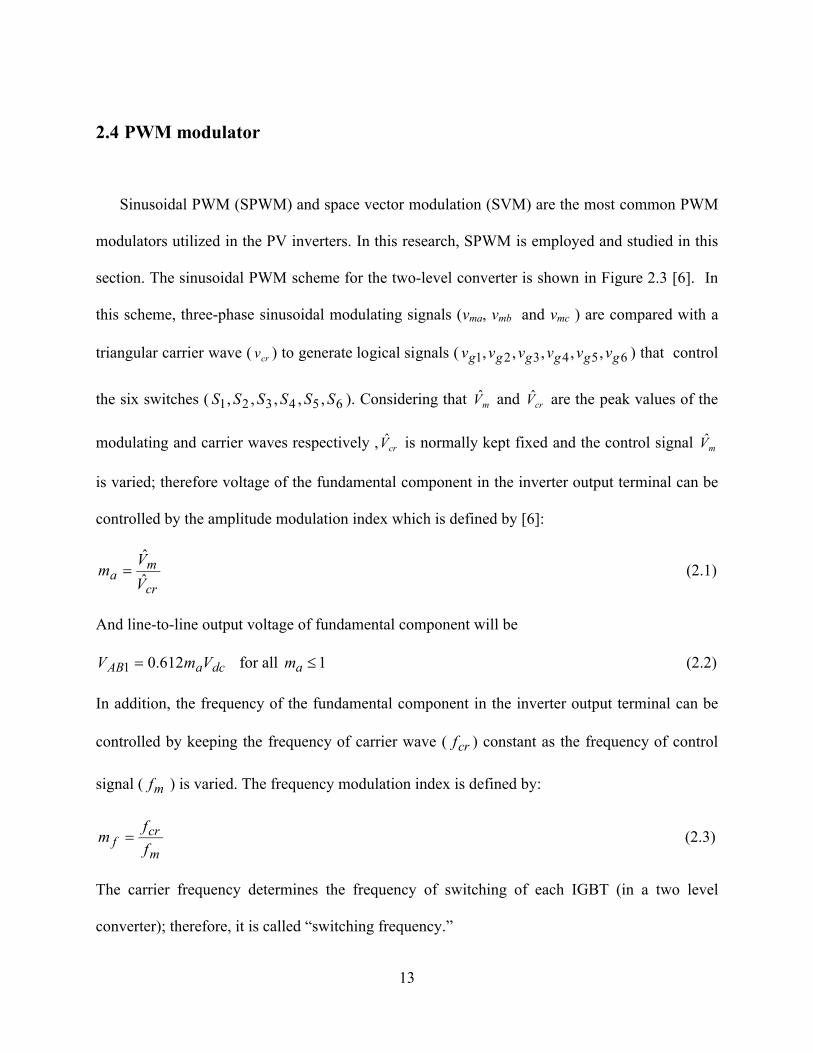
2.4 PWM modulator
Sinusoidal PWM (SPWM) and space vector modulation (SVM) are the most common PWM
modulators utilized in the PV inverters. In this research, SPWM is employed and studied in this
section. The sinusoidal PWM scheme for the two-level converter is shown in Figure 2.3 [6]. In
this scheme, three-phase sinusoidal modulating signals (vma, vmb and vmc ) are compared with a
triangular carrier wave ( crv ) to generate logical signals ( 654321 ,,,,, gggggg vvvvvv ) that control
the six switches ( 654321 ,,,,, SSSSSS ). Considering that mV and crV are the peak values of the
modulating and carrier waves respectively , crV is normally kept fixed and the control signal mV
is varied; therefore voltage of the fundamental component in the inverter output terminal can be
controlled by the amplitude modulation index which is defined by [6]:
cr
ma
V
Vm
ˆ
ˆ (2.1)
And line-to-line output voltage of fundamental component will be
dcaAB VmV 612.01 for all 1am (2.2)
In addition, the frequency of the fundamental component in the inverter output terminal can be
controlled by keeping the frequency of carrier wave ( crf ) constant as the frequency of control
signal ( mf ) is varied. The frequency modulation index is defined by:
m
crf f
fm (2.3)
The carrier frequency determines the frequency of switching of each IGBT (in a two level
converter); therefore, it is called “switching frequency.”
14
v crv
crV mV
2t
t
t
t
t
t
1gv
2gv
3gv
4gv
5gv
6gv
t
2
2
t
tt
Figure 2.3 Sinusoidal pulse width modulation (SPWM)
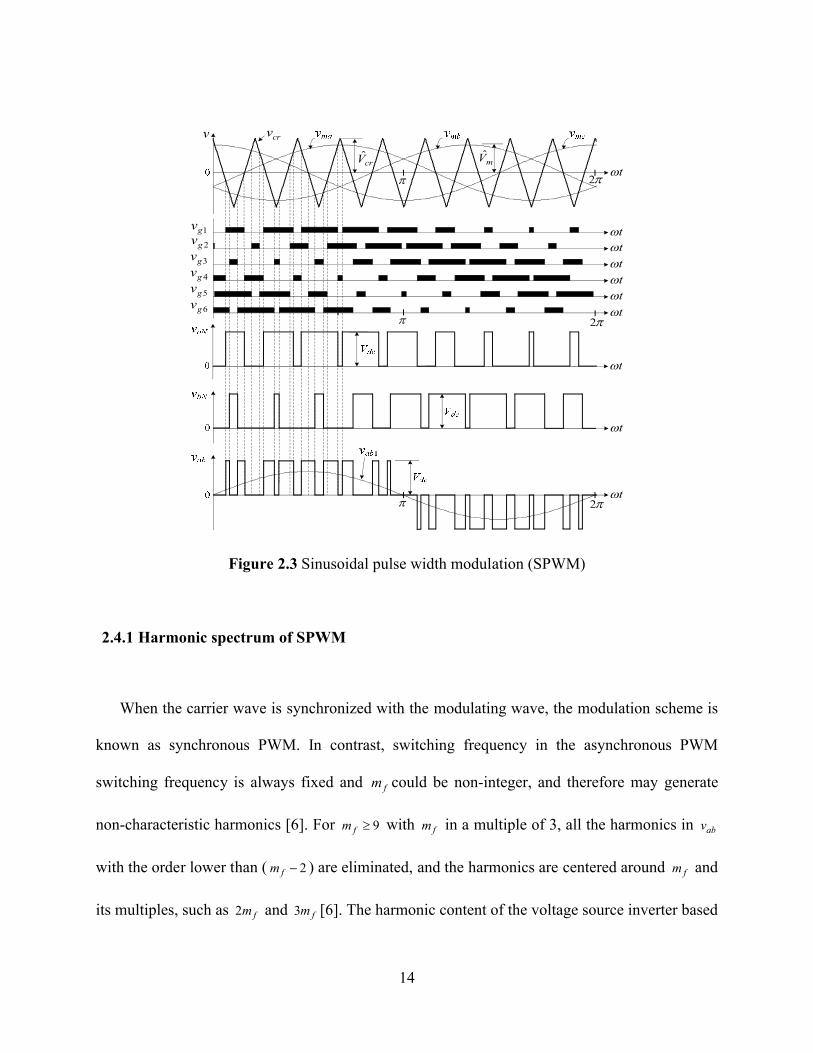
2.4.1 Harmonic spectrum of SPWM
When the carrier wave is synchronized with the modulating wave, the modulation scheme is
known as synchronous PWM. In contrast, switching frequency in the asynchronous PWM
switching frequency is always fixed and fm could be non-integer, and therefore may generate
non-characteristic harmonics [6]. For 9fm with fm in a multiple of 3, all the harmonics in abv
with the order lower than ( 2fm ) are eliminated, and the harmonics are centered around fm and
its multiples, such as fm2 and fm3 [6]. The harmonic content of the voltage source inverter based
15
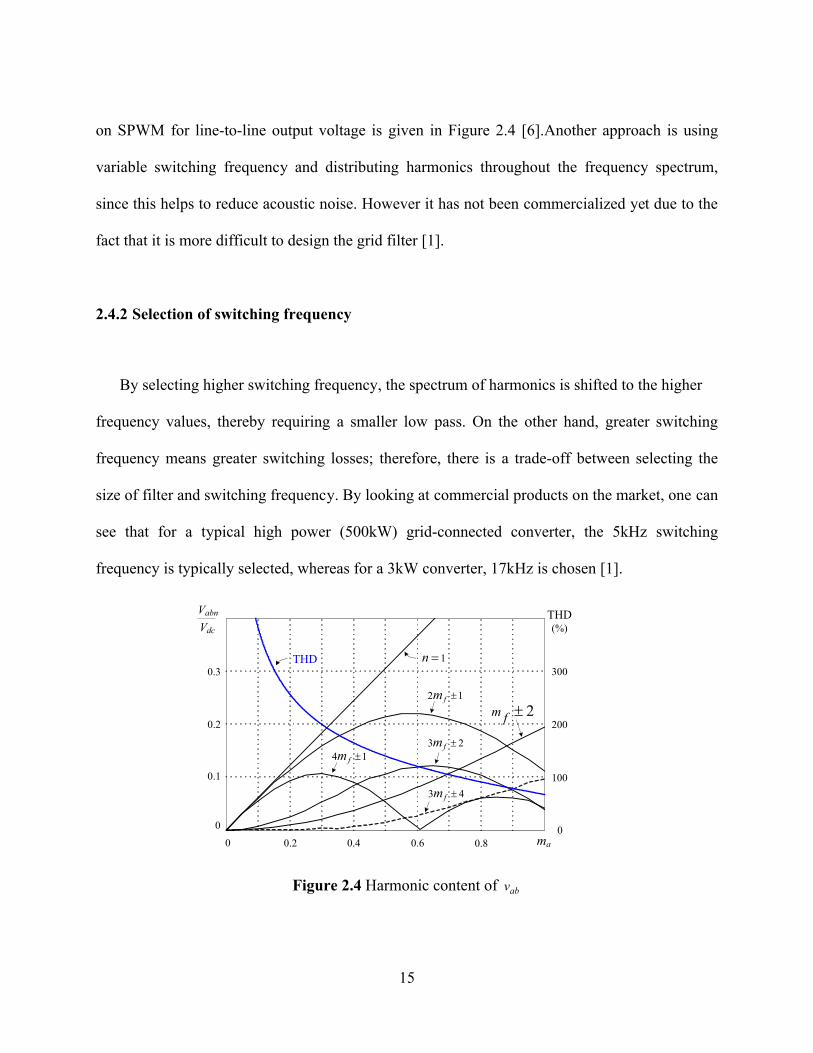
on SPWM for line-to-line output voltage is given in Figure 2.4 [6].Another approach is using
variable switching frequency and distributing harmonics throughout the frequency spectrum,
since this helps to reduce acoustic noise. However it has not been commercialized yet due to the
fact that it is more difficult to design the grid filter [1].
2.4.2 Selection of switching frequency
By selecting higher switching frequency, the spectrum of harmonics is shifted to the higher
frequency values, thereby requiring a smaller low pass. On the other hand, greater switching
frequency means greater switching losses; therefore, there is a trade-off between selecting the
size of filter and switching frequency. By looking at commercial products on the market, one can
see that for a typical high power (500kW) grid-connected converter, the 5kHz switching
frequency is typically selected, whereas for a 3kW converter, 17kHz is chosen [1].
Figure 2.4 Harmonic content of abv
12 fm2fm
14 fm23 fm
43 fm
1n
0.2 0.4 0.6 0.8
0.1
0.2
0.3
0
0
100
200
300
0
THD(%)
THD
Vabn
Vdc
ma

16
2.5 Grid filters
In order to filter out high frequency harmonics created by PWM and to meet the power
quality requirement given in Table 2.2, a grid filter is employed. L and LCL filters are
introduced in the following section.
2.5.1 L-filters
The L-filter as illustrated in Figure 2.5(a) is a first order filter with an attenuation of
20dB/decade for the entire range of frequencies. Assuming the grid voltage is considered an
ideal voltage source, the transfer function for L-filter can be derived by:
sLv
isH
g
1)( (2.5)
Therefore, to meet the requirement given in Table 2.2, either the switching frequency selected
should be very high; for example more than 50kHz, which is not possible with IGBT or the
inductor selected should be very large. Using a large inductor reduces the dynamics of the
converter, and in addition will be bulky and expensive; thus L-filters are seldom used in grid-
connected converters.
2.5.2 LCL-filters
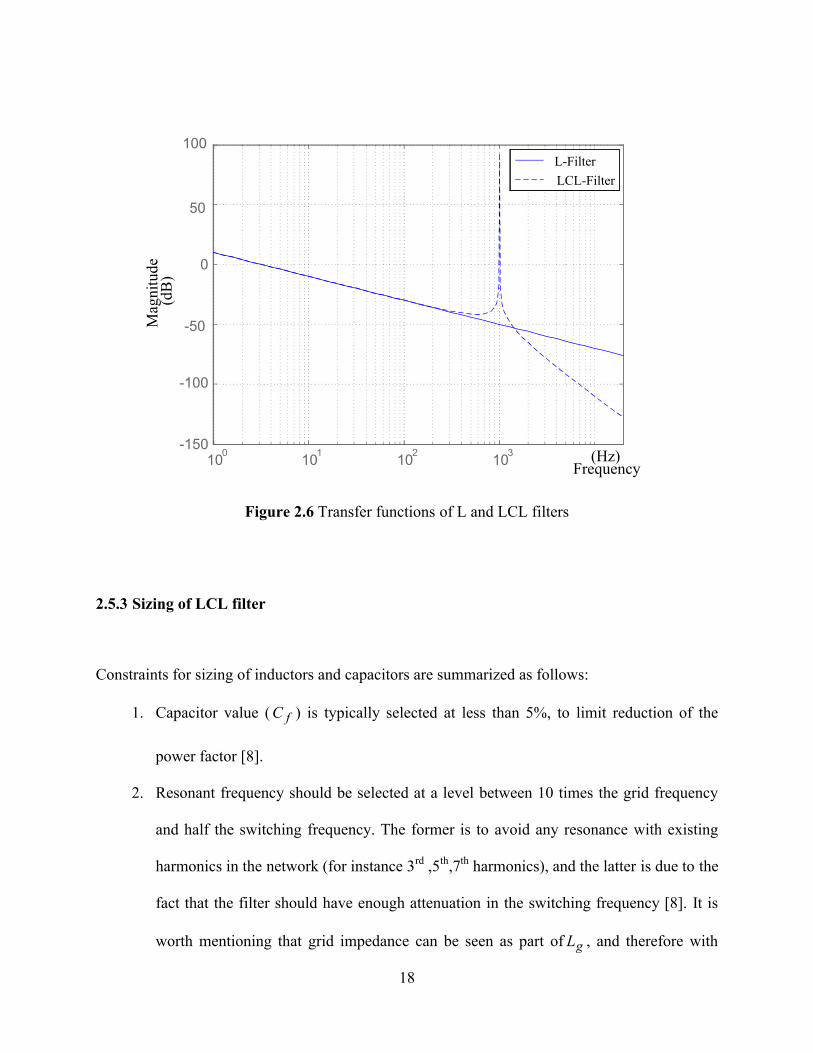
The LCL-filter, as shown in Figure 2.5(b), is a third order filter with an attenuation of
60dB/decade for any frequency above resonant frequency (Figure 2.6). Therefore a lower
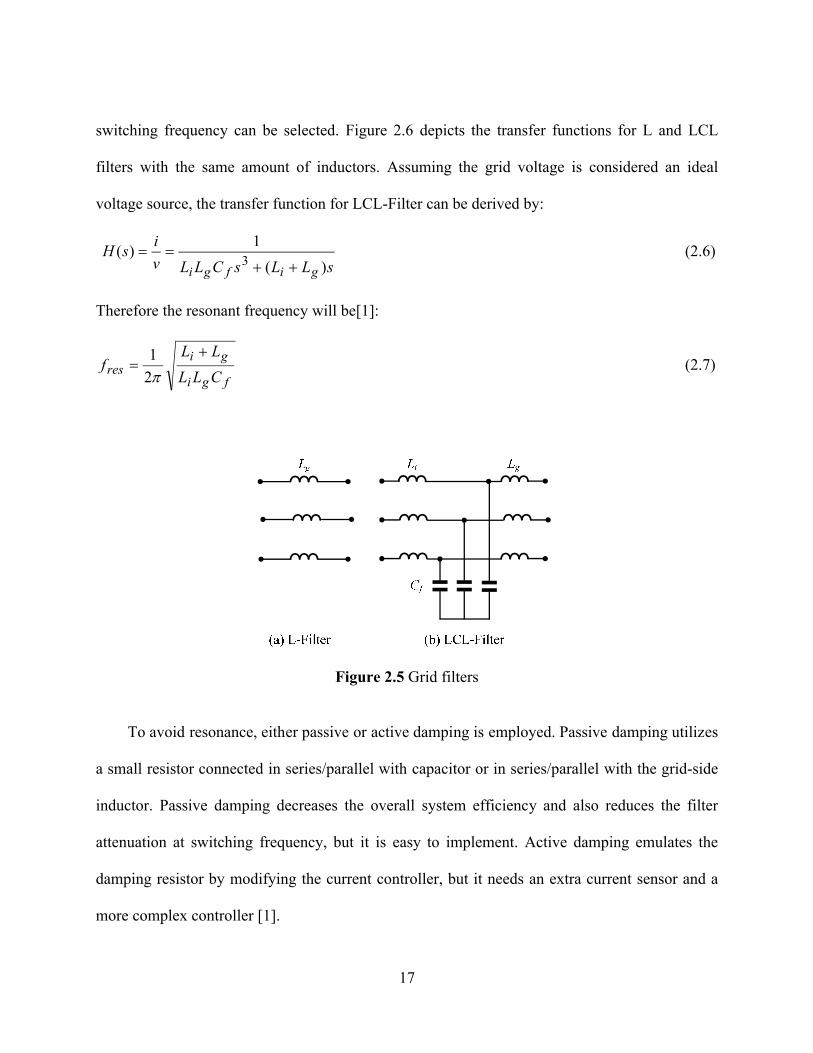
17
switching frequency can be selected. Figure 2.6 depicts the transfer functions for L and LCL
filters with the same amount of inductors. Assuming the grid voltage is considered an ideal
voltage source, the transfer function for LCL-Filter can be derived by:
sLLsCLLv
isH
gifgi )(
1)(
3 (2.6)
Therefore the resonant frequency will be[1]:
fgi
gires CLL
LLf
2
1 (2.7)
Figure 2.5 Grid filters
To avoid resonance, either passive or active damping is employed. Passive damping utilizes
a small resistor connected in series/parallel with capacitor or in series/parallel with the grid-side
inductor. Passive damping decreases the overall system efficiency and also reduces the filter
attenuation at switching frequency, but it is easy to implement. Active damping emulates the
damping resistor by modifying the current controller, but it needs an extra current sensor and a
more complex controller [1].
18
100
101
102
103
-150
-100
-50
0
50
100
(dB
)
(Hz)
L-Filter
LCL-Filter
Mag
nitu
de
Frequency
Figure 2.6 Transfer functions of L and LCL filters
2.5.3 Sizing of LCL filter
Constraints for sizing of inductors and capacitors are summarized as follows:
1. Capacitor value ( fC ) is typically selected at less than 5%, to limit reduction of the
power factor [8].
2. Resonant frequency should be selected at a level between 10 times the grid frequency
and half the switching frequency. The former is to avoid any resonance with existing
harmonics in the network (for instance 3rd ,5th,7th harmonics), and the latter is due to the
fact that the filter should have enough attenuation in the switching frequency [8]. It is
worth mentioning that grid impedance can be seen as part of gL , and therefore with

19
change of grid impedance, resonance frequency can vary up to 40% [1]. The variation
of resonance frequency when grid impedance varies can be derived as [1]:
(2.8)
From Equation 2.8, it can be seen that when a higher filter capacitor is chosen, less
variation in resonance frequency will occur [1]. Another important factor is that in the
LC-filter (without the grid-side inductor) variation of resonance frequency will be
considerable and, in fact, this is the main reason that LC-Filters are not employed in
practical situations.
3. The LCL filter is part of the packaging in low power inverters, so they must be as small
as possible. Therefore when employing high switching frequency, small inductors are
selected (less than 5%) [1]. In contrast, the main issue with sizing of LCL-filter in high
power inverter is the saturation of the inductor [1]. At the same time, switching
frequency should be lower (due to losses); therefore a higher value of inductor is
employed (typically around 20%, including leakage inductance of the utility
transformer).
4. The inverter-side inductor is sized to limit the ripple in the inverter currents, and the
core should also be designed to carefully avoid any saturation. The grid-side inductor is
sized based on harmonic requirements. Therefore, the design approach in the inverter-
side inductor is a time-domain analysis, while the grid-side inductor is designed with a
frequency-domain approach [1].
5. The damping resistor ( Rd ) is usually selected at one-third of the capacitor’s impedance
at the resonant frequency [8].
)11
(2
1
21 gridggridgfresres LLLLC

20
6. The position of current and voltage sensors can have an effect on the sizing of the
capacitor and inductors. If the voltage and current sensors are placed as shown in
Figure 2.1, then the optimum value for the capacitor to minimize absorbed reactive
power and therefore not to over-rate the inverter will be [8]:
2b
gif
Z
LLC
(2.9)
where bZ is the base impedance of the inverter.
Assuming that the desired harmonic attenuation factor in the inverter-side inductor for the first
harmonic, i.e., ( 2fm ), is named , and the desired harmonic attenuation factor in the grid-
side inductor for the first appeared harmonic is called :
003.0.. (2.10)
By looking into Figure 2.4:
195.0)2(
Vdc
V mfab (2.11)
Therefore with substituting of Equation 2.2:
nsw
n
nf
mfabi
If
V
Ifm
VL
23612.0
195.0
*)2)(2(3
)2( (2.12)
where nV and nI are nominal voltage and current of the converter respectively. Selection of
in Equation 2.12 depends on the saturation level of the inverter-side inductor and the effects on
the design of its core.
From [8]:

21
22
)
1)2(
1
)(
(
fgswswi
swg
CLffi
fi
(2.13)
where gi and ii are the inverter and the grid currents respectively.
Therefore,
fswg
CfL
2
2
)2(
11
(2.14)
Knowing iL , gL and fC , resonant frequency shall be calculated to verify whether the second
constraint is fulfilled. Otherwise the calculations should be repeated with the new values for
and .
2.6 Current controller
The grid-connected converter with PWM modulator can be controlled by various current
control schemes, such as resonant control, predicative control, and voltage oriented control [1].
In this research, voltage oriented control (VOC) is introduced, and design guidelines are
discussed. The objective of the controller is to adjust the injected current (phase and amplitude)
by adjusting the modulation index to achieve references given for active and reactive power;
moreover, the injected current should meet the harmonic requirements given in Table 2.2.
Before going into detail about VOC, it should be noted that, as already shown in Figure 2.6,
the frequency characteristic of the LCL-filter in the frequencies smaller than the resonant

22
frequency are similar to L-filter (considering the same amount of inductor is utilized in both
filters). Therefore the LCL-Filter can be replaced by the L-filter in the steady state condition.
The principal of the VOC scheme is illustrated in Figure 2.7. The first step in implementation
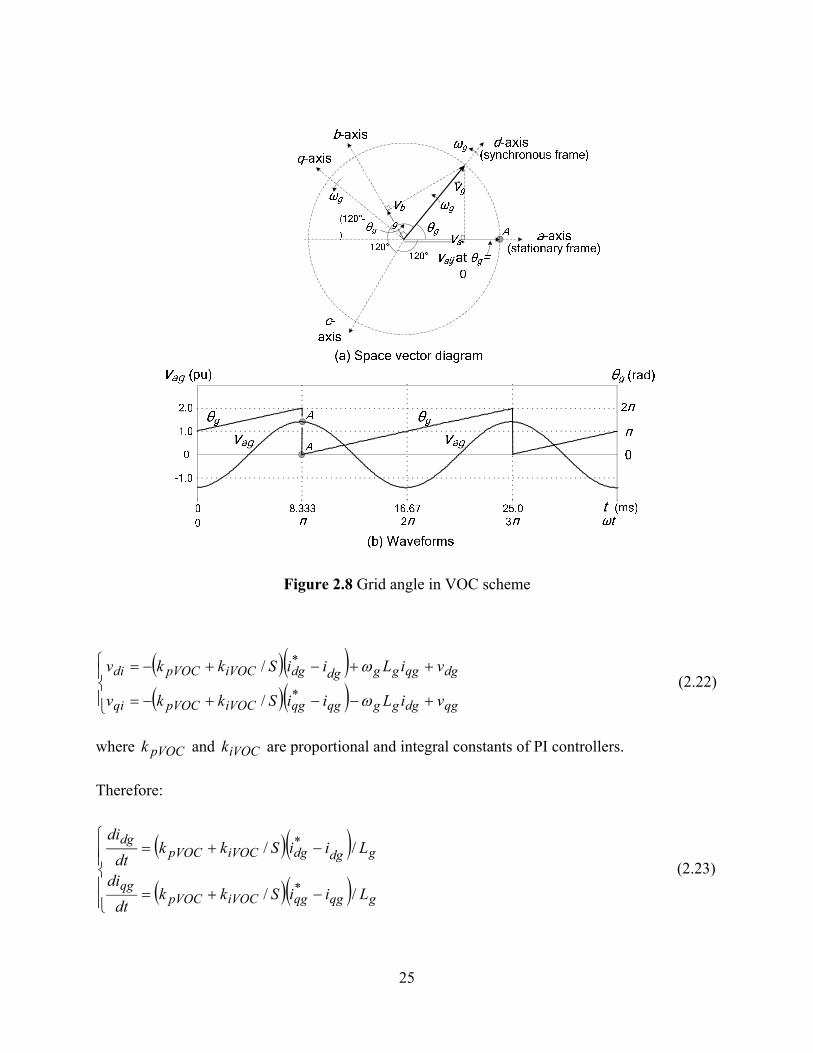
of VOC is detection of grid angle θg, as illustrated in Figure 2.8(b) [9]. The grid angle is required
to transform all three phase voltages and currents from abc stationary frame to dq synchronous
frame and also to transform voltages in dq synchronous frame back to the abc stationary frame.
This angle, in fact, is utilized for synchronizing the converter to the grid and is measured by the
PLL which will be covered in detail in the next section.
In the second step, as illustrated in Figure 2.8(a), the d-axis of the synchronous frame is
aligned with the grid voltage vector; therefore, the q-axis voltage will be equal to zero and the d-
axis voltage will be equal to the grid voltage magnitude. Three-phase currents set of converters
also can be transformed as:
cg
b
ag
ggg
ggg
qg
dg
i
gi
i
i
i.
3/4sin()3/2sin()sin(
)3/4cos()3/2cos()cos(
3
2
(2.15)
In the third step, reference for reactive ( *gQ ) and active power ( *
gP ) which are going to be
transferred is determined. In a low power converter, the reactive power’s reference is usually set
to zero, but in the wind converter and high power PV converter it might be set differently.
)(2
3*qgdgdgqgg ivivQ (2.16)
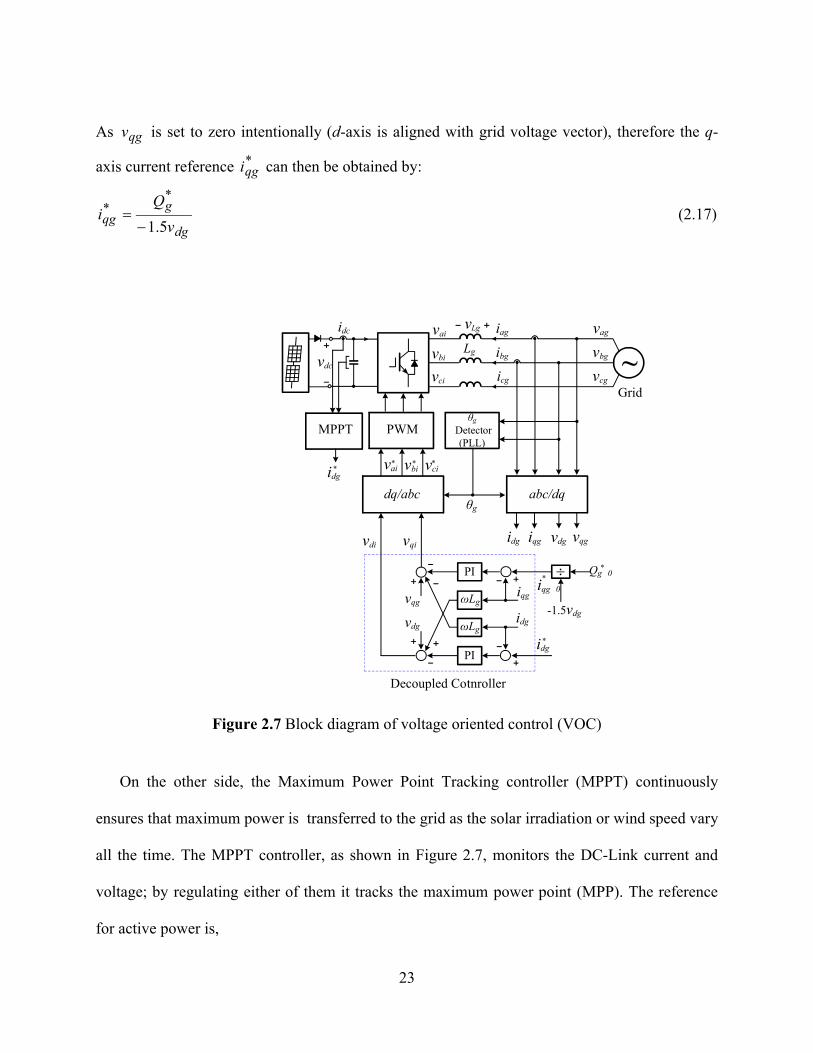
23
As qgv is set to zero intentionally (d-axis is aligned with grid voltage vector), therefore the q-
axis current reference *qgi can then be obtained by:
dg
gqg v
Qi
5.1
**
(2.17)
Lg
iagvLg
PWMθg
Detector(PLL)
vdc
vagvbgvcg
ibg
icg
idg iqg vqgvdg
θg
vdi vqi
vaivbivci
PI
vqg
vdg
iqg
idg-1.5vdg
Qg 0PI
Decoupled Cotnroller
idg*
iqg 0*
~Grid
vai vcivbi* * *
ωLg
abc/dq
*
dq/abc
ωLg
idc
MPPT
idg*
Figure 2.7 Block diagram of voltage oriented control (VOC)
On the other side, the Maximum Power Point Tracking controller (MPPT) continuously
ensures that maximum power is transferred to the grid as the solar irradiation or wind speed vary
all the time. The MPPT controller, as shown in Figure 2.7, monitors the DC-Link current and
voltage; by regulating either of them it tracks the maximum power point (MPP). The reference
for active power is,

24
dcdcdgdgqgqgdgdgg IVivivivP 2
3)(
2
3* (2.18)
Therefore the d-axis current reference *dgi can then be obtained by:
dg
dcdc
dg
gdg v
IV
v
Pi
5.15.1
** (2.19)
Therefore as already shown, “the three-phase line currents in the abc stationary frame iag, ibg
and icg are transformed to the two-phase currents idg and iqg in the dq synchronous frame, which
are the active and reactive components of the three-phase line currents, respectively.The
independent control of these two components provides an effective means for the independent
control of system active and reactive power” [9]. To build three phase modulating signals from
idg and iqg, KVL equations for the grid-side circuit of the inverter in the abc stationary reference
frame can be written as [9]:
gcicgcg
gbibgbg
gaiagag
Lvvdt
di
Lvvdt
di
Lvvdt
di
/
/
/
(2.20)
The above equations can then be transformed into the dq synchronous reference frame:
gdgggqiqgqg
gqgggdidgdg
LiLvvdt
di
LiLvvdt
di
/
/
(2.21)
where ωg is the speed of the synchronous reference frame, designed to achieve better dynamic
performance; the current in d-axis and the q-axis current shall be de-coupled.
25
Figure 2.8 Grid angle in VOC scheme
qgdgggqgqgiVOCpVOCqi
dgqgggdgdgiVOCpVOCdi
viLiiSkkv
viLiiSkkv
*
*
/
/ (2.22)
where pVOCk and iVOCk are proportional and integral constants of PI controllers.
Therefore:
gqgqgiVOCpVOCqg
gdgdgiVOCpVOCdg
LiiSkkdt
di
LiiSkkdt
di
//
//
*
*
(2.23)

26
The above equation indicates that the current in the d-axis current and q-axis become de-coupled,
and the current controller can be implemented as shown in Figure 2.7 [9].
2.6.1 Tuning of PI controllers
The current loop of the PI controller is shown in Figure 2.9, where )(sGPI is PI controller,
)(sGd is the delay due to elaboration of the computation device, and to the PWM, and )(sG f is
the transfer function of the LCL-filter [1].
)(sGPI )(sGd )(sG f*i i
Figure 2.9 The current loop of PI controller
)(sGPI = )1
1(/sT
kskki
VOCpiVOCpVOC (2.24)
iT is the time constant of integrator in the PI controller. The time delay associated with sampling
time of the digital signal processor DSP, filtering, and modulator are combined here in )(sGd .
Therefore,
sTsG
eqd
1
1)( (2.25)
where eqT is the summation of the following terms:

27
1. Sampling time of digital signal processor ( sT );
2. PWM modulator delay, when sampling time and switching frequency are adopted
equally, the delay associated with PWM modulator will be 2/sT [10]; and
3. Delay caused by utilizing digital filters ( fiT ), in the VOC scheme. It was assumed that
three-phase voltage and current are ideal, which is not the case in the real world;
therefore to avoid noise and harmonics, digital filters are utilized.
The plant transfer function, is defined as )(sG f :
s
R
L
R
sLRsv
sisG
g
g
g
ggf
1
/11
)(
)()(
sT
R
p
g
1
/1 (2.26)
where
g
gp R
LT (2.27)
where pT is time constant of the grid filter.
Delays in the current loop should be compensated in the PI controller to avoid overshoot and
also to increase the stability margin. It can be seen that the time delay consists of one large
delay ( pT , caused by the LCL filter,) and several small delays ( eqT ). Therefore, modulus
optimum can be applied [11], which means a large constant time can be compensated by the
PI controller’s phase advance (pole-zero cancellation). Hence:
piVOC TT (2.28)
It should be taken into account that to reject any disturbance existing in the grid, iVOCT might
be selected up to 10 times larger than pT [12].
28
Writing a closed-loop transfer function of the current loop[1]:
eqig
pVOC
eq
eqig
pVOC
TLL
k
T
ss
TLL
k
sH
)(
)()(
2
(2.29)
which means the process will have an optimal damped system with 707.0 [1]:
eq
igpVOC T
LLk
2
(2.30)
2.6.2 Phase locked loop (PLL)
The principle of three-phase synchronous reference frame PLL (SRF-PLL) is illustrated in
Figure 2.10. Grid voltage is transformed to dq rotating reference frame by Park transformation.
cg
b
ag
ggg
ggg
qg
dg
v
gv
v
v
v.
3/4sin()3/2sin()sin(
)3/4cos()3/2cos()cos(
3
2
(2.31)
The fundamental voltage vector will be translated to DC variables. Since the d-axis of the
synchronous frame is aligned with the grid voltage vector, the q-axis voltage will be equal to
zero and the d-axis voltage will be equal to grid voltage magnitude. n order positive-sequence
harmonic manifests itself as n-1 order harmonic in dq rotating reference frame, and n order
negative-sequence harmonic exhibit n+1 order harmonic in dq rotating reference. Therefore ,
unbalanced voltage in the grid is transformed to second order harmonics in the dq rotating
reference frame. High order harmonics can be filtered out easily by low pass filter from qgV , but

29
for the filtering of the second order harmonic, a notch filter is usually employed for achieving
fast dynamic performance and not compromising the PLL closed-loop bandwidth [13].
Then a PI controller is utilized to reduce the error between reference value (zero) and
measured value for qgV , and a feed-forward frequency Hzff 60*2 is added to the output to
improve initial dynamic performance. Finally an integrator will be employed for converting g
to g .
As demonstrated [1], having an optimal damped system with 707.0 , and settling time of
st , the proportional and integral constants for PLL shall be selected :
spPLL t
k2.9
(2.32)
6.4s
iPLLt
T (2.33)
iPLLpPLL KK
ff
qgV
0* qgV
gg
g dgV
Figure 2.10 PLL based on synchronous reference frame (SRF)

30
2.7 Case study
The goal of this section is to design a grid-connected converter based on the design guidance
and procedures provided in the previous sections in this chapter. The system specifications are
given in Table 2.3 and a block diagram of the converter is illustrated in Figure 2.11.
2.7.1 Sizing of LCL filter
As given in Section 2.5.3, the filter capacitor shall be sized :
FCC bf 75.1505.0 (2.34)
where bC is the base capacitance of the system.
Therefore,
FC f 10 (2.35)
Table 2.3 System specification of the grid-connected converter
From Equation 2.12, the inverter-side inductor shall be selected:
7500028.63
102318.0
23612.0
195.0
nsw
n
iIf
VL (2.36)
Converter rated Power nP 1.2 kW Converter rated voltage nV 102 V
Converter rated frequency nf 60 Hz Converter rated current nI 7 A
Switching frequency swf 5 kHz Sampling time sT 0.1 ms

31
Considering 04.0 :
1.2iL mH (2.37)
Therefore,
5.2iL mH (2.38)
To meet the inequality of 2.10, is selected 0.05.Therefore from Equation 2.14 the grid-side
inductor can be calculated as:
1.210)50002(
21
)2(
11
22
2
FCf
Lfsw
g
mH (2.39)
Thus,
5.2gL mH (2.40)
To calculate the resonant frequency (Equation 2.7):
15542
1
fgi
gires CLL
LLf
Hz (2.41)
It can also be seen that resonant frequency meets inequality 2.42:
210 sw
resnf
ff (2.42)
From section 2.5.3, damping resistor can be sized as,
41.323
1
fresd Cf
R
(2.43)
Power dissipation in the damping resistor is,
2)23
(3 fnn
dd CfV
RP 0.5 W

32
iag
PWM
VOC Controller + PLL
vag
vbg
vcg
ibg
icg~
Grid
vai vcivbi* * *
vdc
vaivbivci
Lg
CfdR
iL
LCL-filter
Inverter
swf
Figure 2.11 Block diagram of the grid-connected converter discussed in the case study
2.7.2 PI tuning of the Voltage-Oriented Controller (VOC)
By adopting a digital filter with the cut-off frequency of 1 kHz in the VOC, equivalent delay
caused by the current controller (introduced in Section 2.6.1) is,
4s
sfieqT
TTT =1.125 ms (2.44)
And delay caused by the grid filter (see Equation 2.27) is,
8.0
0042.0
g
gp R
LT =5.25 ms (2.45)
Therefore the integral time constant of the VOC controller is,
0525.000525.0 iVOCT ms (2.46)
From equation 2.30, proportional gain of the VOC controller can be calculated,
33
25.2
2.4
2 eq
igpVOC T
LLk 1.86 (2.47)
Hence integral gain of the VOC controller can be selected,
35435 iVOCk 1s (2.48)
2.7.3 PI tuning of the Phase Locked Loop (PLL)
To achieve 50 ms settling time in PLL, proportional gain of the PLL can be selected,
spPLL t
k2.9
=184 (2.49)
The integral time constant of the PLL is chosen by:
9.106.4 s
iPLLt
T ms (2.50)
Therefore, the integral time constant of the PLL,
iPLLK =16928 1s (2.51)
2.7.4 Simulation
To summarize, the complete specification of the designed grid-connected converter is
given in Table 2.4; moreover, to verify the design guidelines, the grid-connected converter is
simulated in the Simulink/Matlab environment.
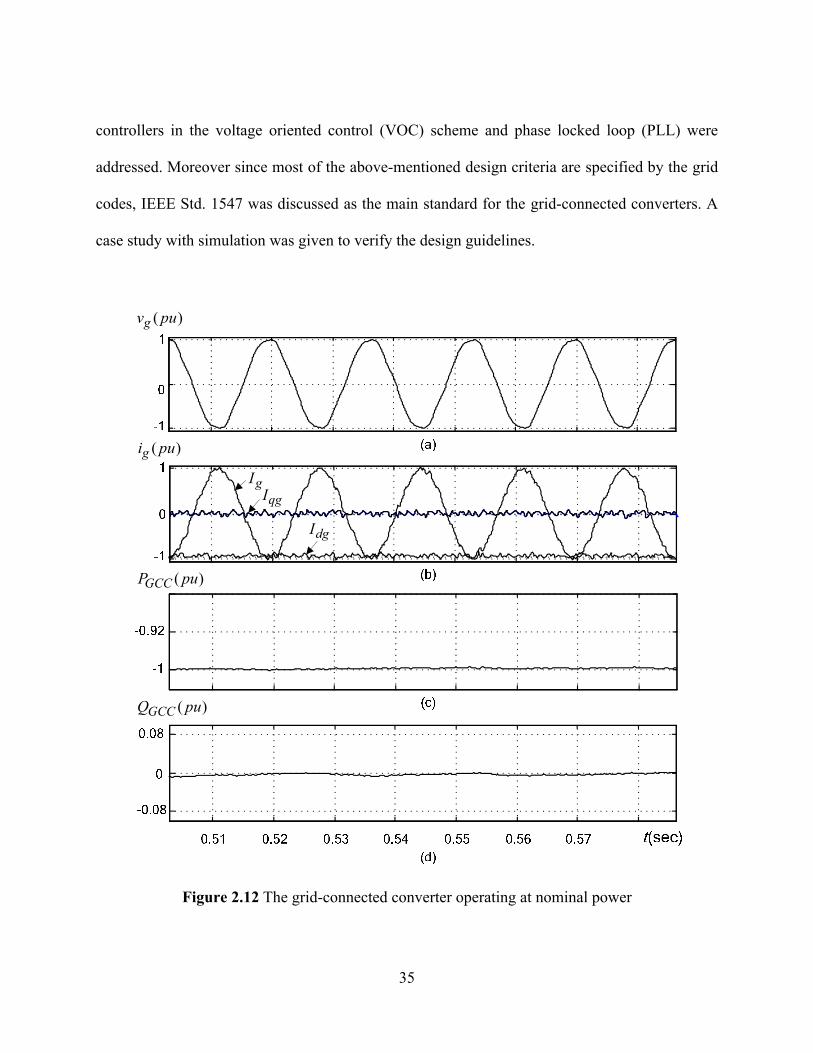
The result obtained for the voltage, current, active and reactive power, when the converter
operating at nominal power, is given in Figure 2.12. Reactive power reference is intentionally set
34
at zero. In Figure 2.13, the harmonic spectrum of the converter’s current is shown, where gnI
the RMS value of nth-order harmonic is current and 1gI is the RMS value of the fundamental
frequency current. This verifies that the harmonic required level given in Table 2.1 is satisfied. In
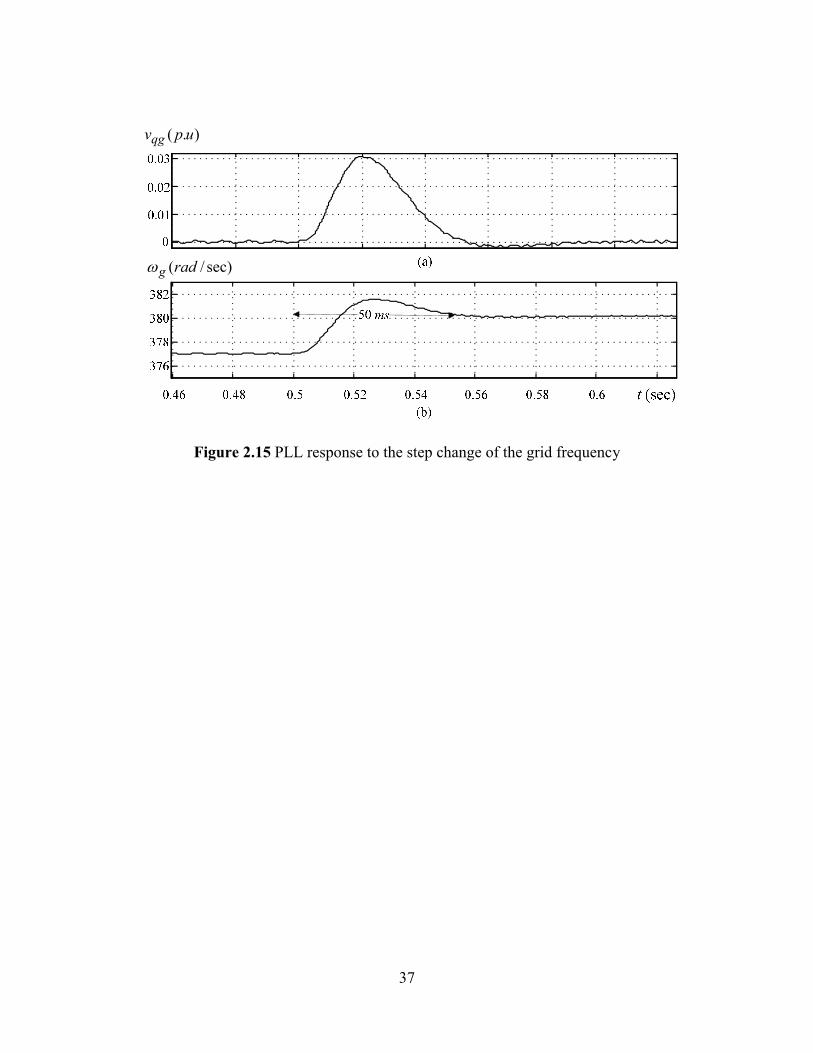
Figure 2.14, VOC response to the step change of the converter’s active power reference is
illustrated. As shown in Figure 2.15, PLL response to the step change of the grid frequency is
depicted. It is verified that settling time of the PLL is 50 milliseconds.
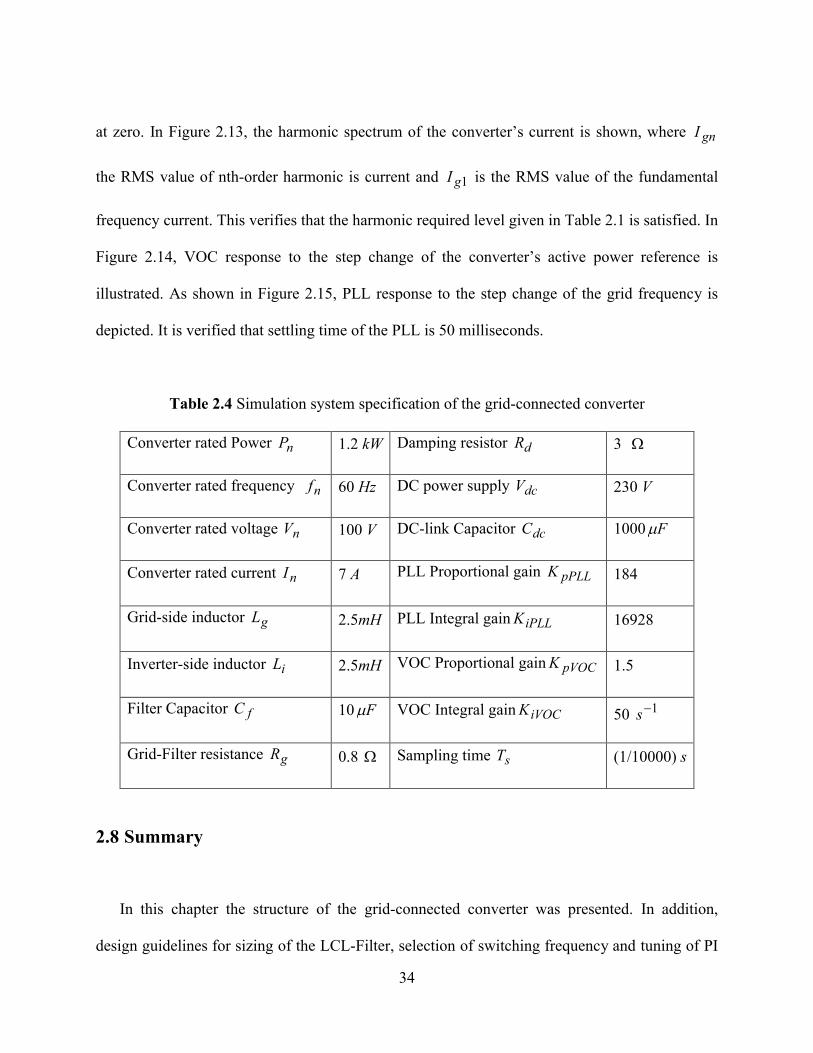
Table 2.4 Simulation system specification of the grid-connected converter
2.8 Summary
In this chapter the structure of the grid-connected converter was presented. In addition,
design guidelines for sizing of the LCL-Filter, selection of switching frequency and tuning of PI
Converter rated Power nP 1.2 kW Damping resistor dR 3
Converter rated frequency nf 60 Hz DC power supply dcV 230 V
Converter rated voltage nV 100 V DC-link Capacitor dcC 1000 F
Converter rated current nI 7 A PLL Proportional gain pPLLK 184
Grid-side inductor gL 2.5mH PLL Integral gain iPLLK 16928
Inverter-side inductor iL 2.5mH VOC Proportional gain pVOCK 1.5
Filter Capacitor fC 10 F VOC Integral gain iVOCK 50 1s
Grid-Filter resistance gR 0.8 Sampling time sT (1/10000) s
35
controllers in the voltage oriented control (VOC) scheme and phase locked loop (PLL) were
addressed. Moreover since most of the above-mentioned design criteria are specified by the grid
codes, IEEE Std. 1547 was discussed as the main standard for the grid-connected converters. A
case study with simulation was given to verify the design guidelines.
)( puvg
)( puig
)( puPGCC
)( puQGCC
gIqgI
dgI
Figure 2.12 The grid-connected converter operating at nominal power

36
1/ ggn II
Figure 2.13 Harmonic spectrum of the converter’s current
-1
0
1
-1
-0.8
-0.6
-0.4
-1
-0.83
-0.66
-0.49
(a)
(b)
(c)
)( upig
)( upPGCC
)( upidg
0.46 0.47 0.48 0.49 0.5 0.51 0.52 0.53 (sec)t
Figure 2.14 VOC response to the step change of the converter’s active power reference
37
).( upvqg
sec)/(radg
Figure 2.15 PLL response to the step change of the grid frequency

38
Chapter Three
Islanding Detection Methods for the Grid-connected Converters
As discussed in Section 2.2.5, detection of islanding is one of the requirements mandated by
IEEE Std. 1547 for the grid-connected converters. Islanding detection methods have recently
received a great deal of attention in research where higher penetration of the Distributed Power
Generation Systems (DPGSs) is restructuring the face of the power system.
This chapter focuses on the anti-Islanding (AI) detection methods. First, islanding and its
consequences are discussed; then anti-islanding requirements and its detection methods are
investigated.
3.1 Islanding
In IEEE Std.1547-2008, an island is defined as “a condition in which a portion of an area of
the electric power system is energized solely by one or more local electric power systems
through the associated PCCs while that portion of the area of the electric power system is
electrically separated from the rest” [4].
For a grid-connected converter, islanding happens if, after tripping the grid, the converter
does not stop itself from injecting current within a short period of time and continues to feed
local loads. Islanding can pose a risk to utility workers as they assume that the line is de-
energized after disconnecting it for maintenance, and the converter location could be an
unknown for them. Moreover, re-closing of upstream breakers during islanding can cause major
damage to converters due to their unsynchronized reconnection to the grid. Another issue is that

39
due to a mismatch between active and reactive power delivered by converters and consumed by
loads, the voltage and frequency of the islanded grid might shift considerably from rated values.
Therefore islanding is a hazard to people, equipment and grid-connected converters, and should
be properly detected and avoided [5]. As a result of these risks, anti-islanding (AI) requirements
have been issued and embodied in the standards [1].
3.2 Anti-islanding requirements in IEEE Std. 1547
Based on IEEE Std. 1547, which is applicable for converters with rated power of less than
10MVA connected to primary or secondary distribution systems, the following AI requirement is
given: “For an unintentional island in which the converter energizes a portion of the electric
power system through the PCC, the converter interconnection system shall detect the island and
cease to energize the area within two seconds of formation of island.”[4]
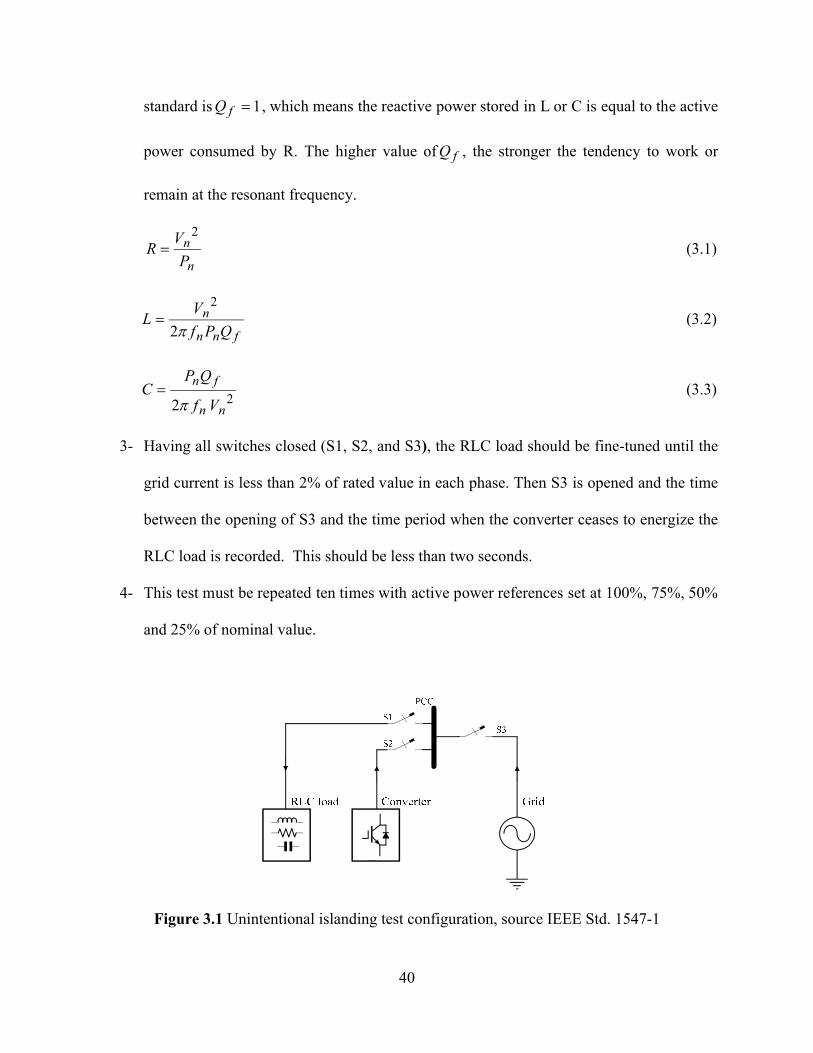
The test procedure for meeting the AI requirement described is shown in Figure 3.1 [4]:
1- Equipment under test (EUT) (here it applies to grid-connected converter) is set to deliver
100% rated output power ( nP ) and connected to the grid. Grid nominal voltage is set to
nominal voltage of converter ( nV ), with a maximum 2% deviation, and the grid nominal
frequency is set to the nominal frequency of converter ( nf ), with a maximum 0.1Hz
deviation.
2- The RLC load should be adjusted according to Equation 3.1, 3.2 and 3.3, which means R
is selected to dissipate all the power delivered by the converter at nominal voltage. LC
circuit will resonate at nominal frequency, which means reactive power generated by C
will be the same as reactive power absorbed by L. The required quality factor for this
40
standard is 1fQ , which means the reactive power stored in L or C is equal to the active
power consumed by R. The higher value of fQ , the stronger the tendency to work or
remain at the resonant frequency.
n
n
P
VR
2 (3.1)
fnn
n
QPf
VL
2
2 (3.2)
22 nn
fn
Vf
QPC
(3.3)
3- Having all switches closed (S1, S2, and S3), the RLC load should be fine-tuned until the
grid current is less than 2% of rated value in each phase. Then S3 is opened and the time
between the opening of S3 and the time period when the converter ceases to energize the
RLC load is recorded. This should be less than two seconds.
4- This test must be repeated ten times with active power references set at 100%, 75%, 50%
and 25% of nominal value.
Figure 3.1 Unintentional islanding test configuration, source IEEE Std. 1547-1
41
3.3 Non-detection zone (NDZ)
Anti-islanding (AI) is a protective scheme for the grid-connected converters; therefore its
performance can be measured in a manner similar to power system protective relays. It should be
robust enough to discriminate between islanding and disturbance in the network which can be
implied as selectivity. Dependability of protection is also tested with the test procedure described
previously in 3-2, which can be considered as the worst case scenario. Reliability is also defined
as the ability of the scheme to detect islanding under any given conditions within a given time
interval [1].
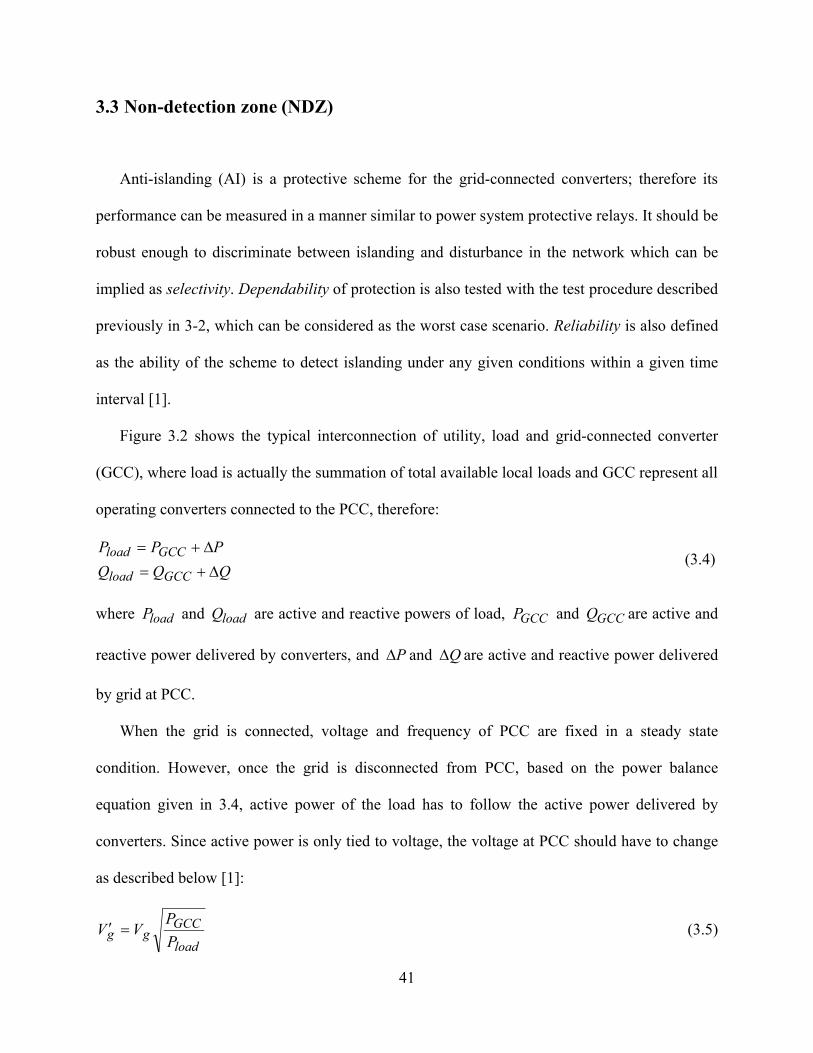
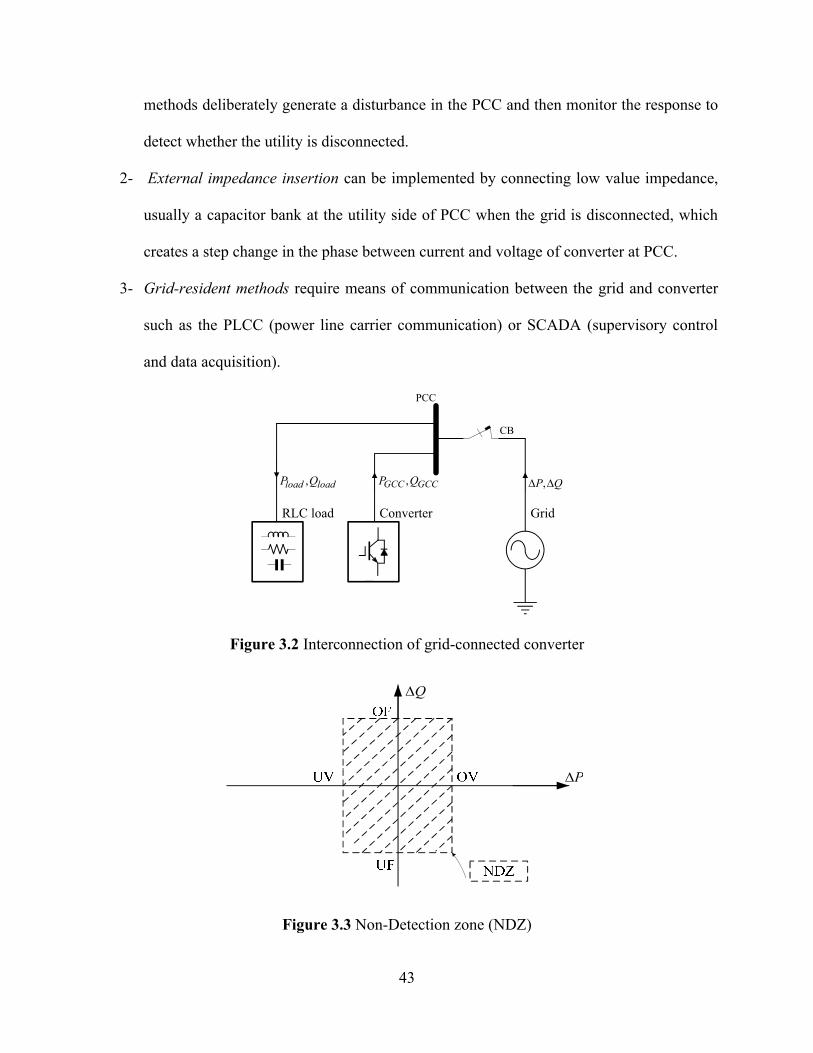
Figure 3.2 shows the typical interconnection of utility, load and grid-connected converter
(GCC), where load is actually the summation of total available local loads and GCC represent all
operating converters connected to the PCC, therefore:
QQQ
PPP
GCCload
GCCload
(3.4)
where loadP and loadQ are active and reactive powers of load, GCCP and GCCQ are active and
reactive power delivered by converters, and P and Q are active and reactive power delivered
by grid at PCC.
When the grid is connected, voltage and frequency of PCC are fixed in a steady state
condition. However, once the grid is disconnected from PCC, based on the power balance
equation given in 3.4, active power of the load has to follow the active power delivered by
converters. Since active power is only tied to voltage, the voltage at PCC should have to change
as described below [1]:
load
GCCgg P
PVV (3.5)

42
On the other hand, reactive power is a function of both frequency and voltage. Therefore based
on the power balance equation, islanding frequency can be calculated as [1]:
)22
1(2 Cf
LfVQ gGCC
(3.6)
Therefore,
4
42
22 LCVC
Q
VC
Q
fg
GCC
g
GCC
(3.7)
In the IEEE Std.1547, the acceptable operating range of distributed resources for voltage has
been defined as 88% to 110% of nominal voltage and an acceptable frequency is between 59.4 to
60.5 Hz. The worst case scenario in islanding happens when 0,0 QP . Hence no change in
frequency or voltage of PCC is detected. On the other hand, if active and reactive power required
by the load remains close enough to the active and reactive power delivered by the grid-
connected converters, voltage and frequency still cannot drift out of an acceptable window
during islanding. Thus, as shown in Figure 3.3, a non-detection zone (NDZ) appears. In other
words, the NDZ for each method of AI is a range of local loads connected to the PCC for which
the AI method under consideration can fail to detect islanding properly [1].
3.4 Anti-islanding (AI) detection methods
Islanding detection methods as shown in Figure 3-4 can be classified into three categories:
1- Converter-resident methods can be divided further into passive and active methods.
Passive methods are based on monitoring and detection of any abnormality in the
parameters of voltage at the point of PCC caused by disconnection of the grid. Active
43
methods deliberately generate a disturbance in the PCC and then monitor the response to
detect whether the utility is disconnected.
2- External impedance insertion can be implemented by connecting low value impedance,
usually a capacitor bank at the utility side of PCC when the grid is disconnected, which
creates a step change in the phase between current and voltage of converter at PCC.
3- Grid-resident methods require means of communication between the grid and converter
such as the PLCC (power line carrier communication) or SCADA (supervisory control
and data acquisition).
Grid
PCC
ConverterRLC load
CB
QP ,GCCGCC QP ,loadload QP ,
Figure 3.2 Interconnection of grid-connected converter
P
Q
Figure 3.3 Non-Detection zone (NDZ)

44
3.5 Passive anti-islanding detection methods
Passive methods rely on changes of voltage, frequency phases or THD of voltage at PCC when
the grid is disconnected to detect the islanding.
3.5.1 Over/under voltage/frequency Detection (OUF-OUV)
As discussed earlier, converters, to protect the equipment of consumers, are required to have
a OUF/OUV (over/under voltage, over/under frequency) protective scheme to stop the converter
from supplying power to the grid if the voltage or frequency at PCC are not in the permissible
range. Based on [21], NDZ for OUF:
2
max
2
min)(1)(1
f
fQ
P
Q
f
fQ f
GCCf (3.8)
And NDZ for OUV:
1)(1)( 2
min
2
max
V
V
P
P
V
V g
GCC
g (3.9)
According to IEEE Std. 1547, maxV =1.1 nomV , minV =0.88 nomV , and maxf =60.5 Hz and
minf =59.3 Hz, fQ =1. Therefore NDZ for OUF:
%64.1%37.2
GCCP
Q (3.10)
And NDZ for OUF:
%13.29%36.17
GCCP
P (3.11)
As can be seen, NDZ for reactive power mismatch is much smaller than that of the active power

45
mismatch (2.37% vs. 29.13%); also NDZ boundaries for the mismatch in reactive power become
larger when fQ is increased.
Over/Under Voltage/Frequency
Phase Jump detection
Anti-Islanding Methods
Grid-Resident
Passive Methods PLCC
Harmonic Detection
Active Methods
Converter-ResidentExternal Impedance
Insertion
Frequency Drift Voltage DriftImpedance
methods
GE Frequency shift
GE Voltage shiftImpedance
estimation at chosen frequency
Sandia Frequency shift
Sandia Voltage shift
Impedance estimation in time
domain
Slip mode frequency shift
Active Frequency drift with pulsating
chopping factor
Active frequency Drift
PLL based Estimation
Negative sequence Detection
Random Noise Injection
Reactive power variation
Frequency jump
SCADA
Figure 3.4 Anti-islanding methods

46
3.5.2 Phase jump detection (PJD)
This method monitors the phase difference between converter voltage terminals and current
for a sudden change. As long as the converter is connected to the grid, the set-point for reactive
power is given by the operator; therefore, the phase difference and power factor at the converter
terminal voltage is fixed. As soon as the islanding takes place, the power factor is dictated by
load; Moreover, the converter output current is fixed and the frequency has not changed yet. As a
result, voltage of the converter must jump to a new phase immediately. If the sudden jump in the
phase is greater than threshold value, a shutdown signal immediately stops the converter from
supplying power to the grid.
The NDZ of PJD is derived as [14]:
thershold
GCC
GCC
P
PP
Q
)1
arctan( (3.12)
As can be seen, NDZ in PDJ, similar to the OUV/OUF method, is very insensitive to an active
power mismatch. However it is independent from fQ .One drawback here is that a phase shift
can also happen due to other issues in the grid like the switching reactive load, and therefore
threshold in practice needs to be selected with the safety margin between 2 to 5 degrees [14].
As a result NDZ cannot be eliminated.
3.5.3 Harmonic detection method (HD)
This method monitors specific harmonics such as 3rd ,5th ,7th or THD level at PCC’s voltage.

47
As long as the grid is connected, since the equivalent impedance seen at PCC is low, the
harmonic created by converter’s current does not have a considerable effect on the harmonic
level in PCC. However once the grid is disconnected, the equivalent impedance seen at PCC is
replaced by the load impedance which is much higher. Therefore the harmonic spectrums that
exist in the converter’s current show themselves in the voltage at PCC.
In theory, this method can reduce NDZ to zero and does not depend on the power mismatch
However, the problem is that in the polluted grid, it is not easy to determine a threshold level; in
addition, the harmonic condition in the grid might change due to nonlinear load and no-load
transformers [1].
3.5.4 Summary of the passive methods
It is noted that passive methods have the same common problem for adjusting proper threshold,
since having too-sensitive settings may increase the chance of nuisance trip and otherwise NDZ
remains non-zero.
3.6 Active anti-islanding detection methods
Active methods deliberately inject a small disturbance into certain parameters at PCC and
then monitor the response to detect whether the utility is disconnected. Since the voltage source
converter behaves as a controlled current source, this disturbance can be implemented by
changing the amplitude, phase or frequency of the injected current [4]. While the grid power is
available, these small changes have little effect besides a small degradation of power quality.
Once the grid is lost, frequency and voltage of PCC are not stiff anymore, as equivalent
48
impedance seen by the converter terminals increase significantly. Thus any small disturbance
created by active methods can present itself at PCC. Active methods, usually in combination
with the passive method, can reduce NDZ to zero, but the challenge here is to minimize the
degradation of power quality and also to avoid instability in the network. The other issue is a
dilution of the active method when multiple converters are connected to the grid, as disturbances
created by converters might cancel each other out [15].
3.6.1 Frequency drift methods
In these methods, the frequency or phase of the current generated by the converter is
modified, usually with positive feedback. In the instance of islanding, the disturbance will push
the frequency out of the normal range and it detects by OUF. Frequency shift methods are not
sensitive to the grid impedance; however, they become less effective with loads that have a high
quality factor [1].
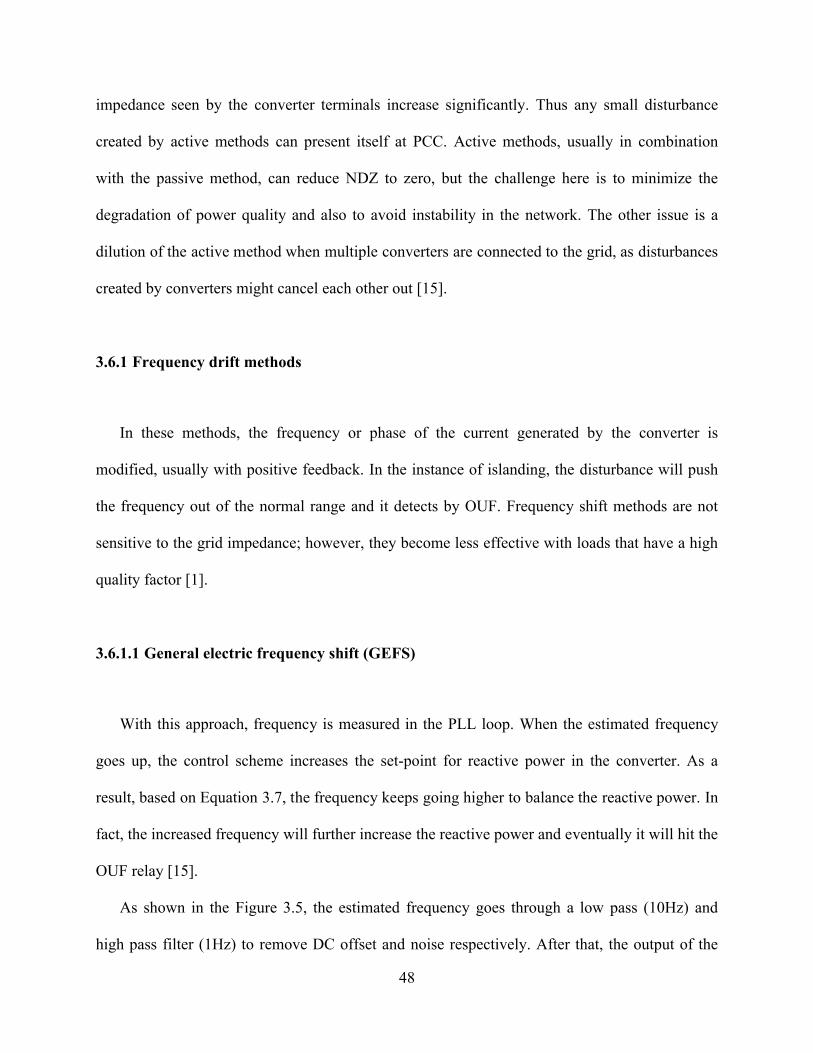
3.6.1.1 General electric frequency shift (GEFS)
With this approach, frequency is measured in the PLL loop. When the estimated frequency
goes up, the control scheme increases the set-point for reactive power in the converter. As a
result, based on Equation 3.7, the frequency keeps going higher to balance the reactive power. In
fact, the increased frequency will further increase the reactive power and eventually it will hit the
OUF relay [15].
As shown in the Figure 3.5, the estimated frequency goes through a low pass (10Hz) and
high pass filter (1Hz) to remove DC offset and noise respectively. After that, the output of the
49
filter is amplified by a gain and restricted by a limiter and then is added to the operator’s set-
point of reactive power in the converter. The gain selected should be small enough to minimize
instability when the grid is connected and large enough to detect islanding. According to [16],
)1
(.2 L
CPR
Q
GCC
GCC
(3.13)
where is the angular frequency; therefore, gain and limiter setting directly depend on the
quality factor of the load and the actual active power of converter. In this method, THD
degradation is very small and thus with increasing gain, NDZ can be reduced to zero. This
method has good potential when multiple converters are involved but according to GE this can
be problematic for the stability of the network [15].
Figure 3.5 GEFS method
50
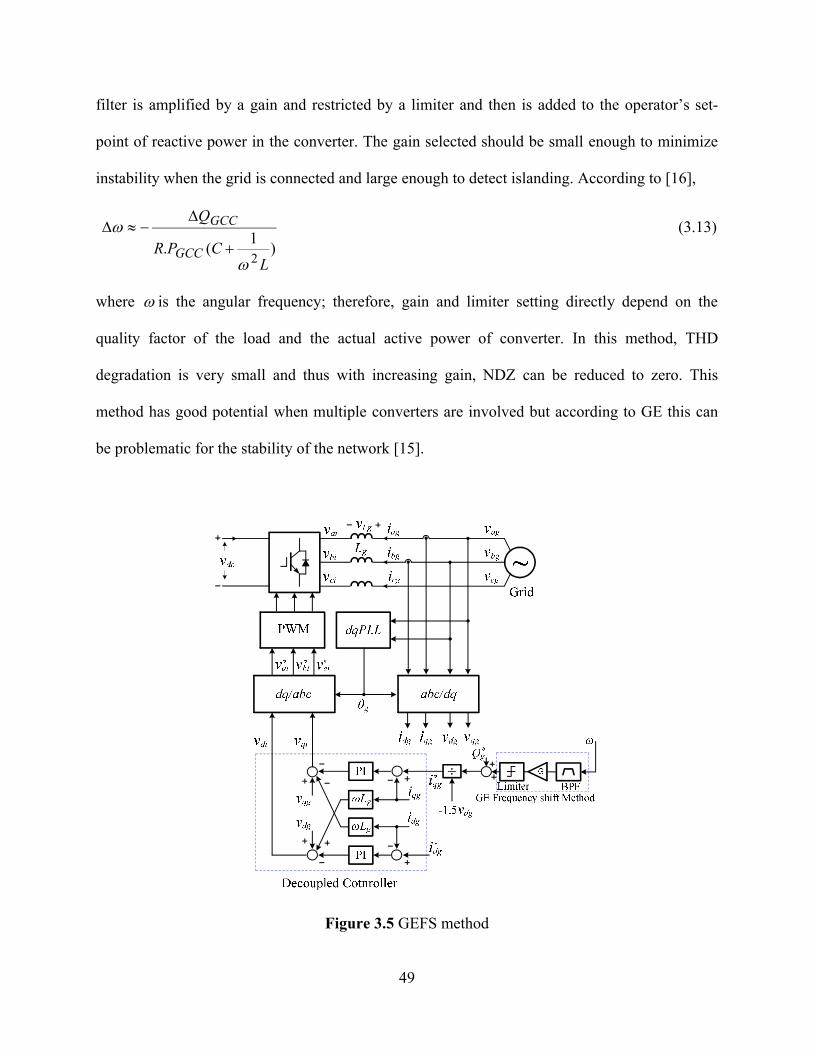
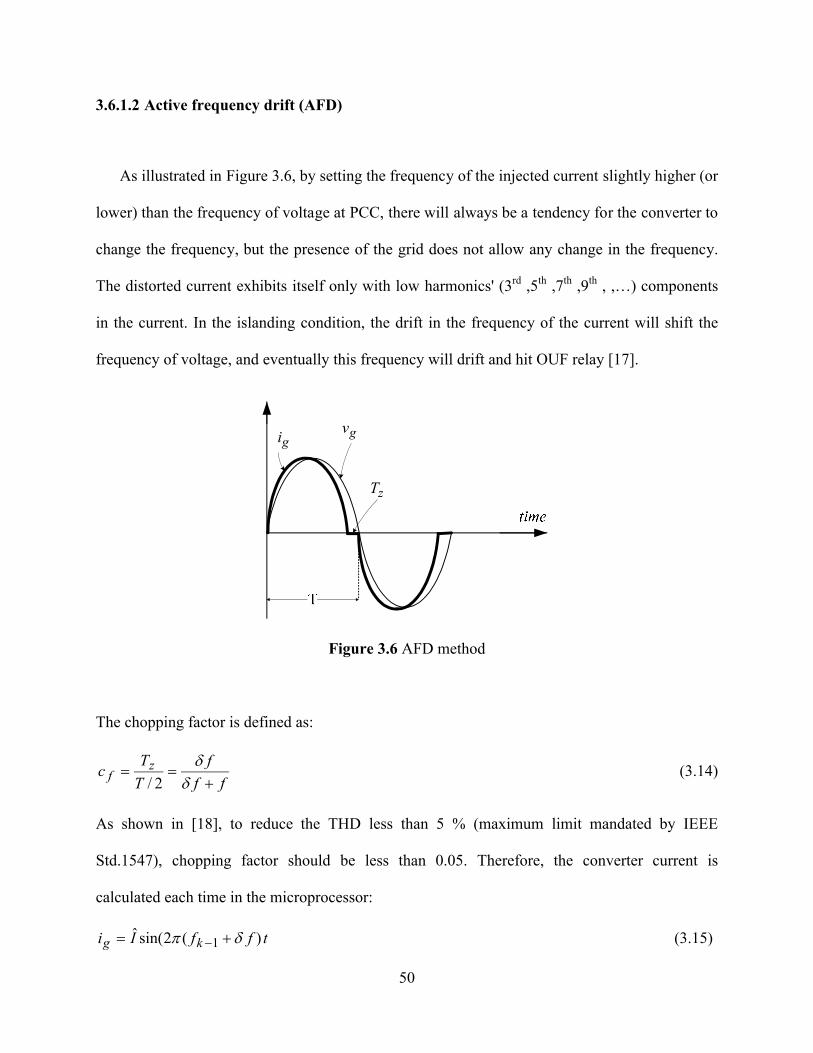
3.6.1.2 Active frequency drift (AFD)
As illustrated in Figure 3.6, by setting the frequency of the injected current slightly higher (or
lower) than the frequency of voltage at PCC, there will always be a tendency for the converter to
change the frequency, but the presence of the grid does not allow any change in the frequency.
The distorted current exhibits itself only with low harmonics' (3rd ,5th ,7th ,9th , ,…) components
in the current. In the islanding condition, the drift in the frequency of the current will shift the
frequency of voltage, and eventually this frequency will drift and hit OUF relay [17].
zT
gigv
Figure 3.6 AFD method
The chopping factor is defined as:
ff
f
T
Tc z
f
2/ (3.14)
As shown in [18], to reduce the THD less than 5 % (maximum limit mandated by IEEE
Std.1547), chopping factor should be less than 0.05. Therefore, the converter current is
calculated each time in the microprocessor:
tffIi kg )(2sin(ˆ1 (3.15)

51
time
time
g
i
2
.Tcf2
2
phase
phase
Figure 3.7 Modifying grid angles in PLL for AFD method
Lg
iagvLg
PWM dqPLL
vagvbgvcg
ibg
icg
idg iqg vqgvdg
θg
vdi vqi
vaivbivci
PI
vqg
vdg
iqg
idg-1.5vdg
QgPI
Decoupled Cotnroller
iqg*
~Grid
vai vcivbi* * *
ωLg
abc/dq
*
dq/abc
ωLg
idg*
vdc
θi
Figure 3.8 AFD implementation

52
In practise, this method can easily be implemented by building i from g (grid angle), as
depicted in Figure 3.7, and then utilizing i as a phase reference to make PWM outputs as shown
in Figure 3.8.
As can be seen, in the steady state phase the shift of current with respect to voltage will be:
fzi cfT2
(3.16)
AFD would fail to detect islanding, If for any frequency between 59.3 Hz to 60.5 Hz (normal
operating range), the load phase matches the current phase, i.e.:
(3.17)
In other word, the phase difference introduced by the current is compensated with load phase and
results in a steady state condition with no further drift in the frequency. In fact, with an analytical
approach it has been shown that this method is only effective with resistive and inductive loads
[19].Another problem with AFD is degradation of power quality, as shown in [18]: to reduce the
THD to less than 5 % (maximum limits given by IEEE Std.1547), chopping factor should be less
than 0.05 .
3.6.1.3 Sandia frequency shift (SFS)
This method employs AFD with a linear positive feedback from frequency deviation to increase
the chopping factor [20]:
)()1( kkff kcc (3.18)
The phase criterion here is:
fcL
CR2
)1
(arctan

53
(3.19)
And according to [15], by selecting an initial chopping factor of 0.05 and k equal to 0.1, NDZ
will be zero for all loads with 8.4fQ .
SFS employs a fast clock to measure the frequency in each half-cycle with zero crossing
detectors (ZCD). In theory, the chopping factor should be zero when the grid is available;
however, frequency in the grid changes all the time within +/- 0.01 Hz and most of the time
within +/- 0.03Hz. Furthermore, with noise and harmonics available in the network, the
measured frequency with ZCD is changing all the time. Thus, in practice the chopping factor will
not be zero, and SFS will degrade the power quality in the normal operating condition. Also,
when multiple converters are equipped with this scheme, the system behaviours caused by the
harmonics and their interactions will be unpredictable [15].
3.6.1.4 Active frequency drift with pulsating chopping factor (AFDPCF)
This method is an improved AFD scheme [18], based on the following criteria in design:
1- Maximum detection time should be less than 2 seconds, based on IEEE Std. 1547
standard.
2- Absolute value of chopping factor should be always less than 0.05% to meet the IEEE
Std. 1547 5% THD limit as illustrated in Figure 3.9.
The method as proposed in [10] is an AFD method with a variable chopping factor. As
illustrated in Figure 3.10, the chopping factor changes between 0.05, -0.05 and zero periodically
(20 cycles, 20cycles, 60cycles respectively), so when 0Q , but is not in the detectable range
)(2
)1
(arctan )1( kkf kcL
CR

54
by OUF protection, negative chopping factor in seven cycles can push the frequency out of the
range. In addition, if 0Q , but is not in the detectable range by OUF protection, a positive
chopping factor in seven cycles can force the frequency to drift up and hit the OUF relay.
When multiple converters are equipped with AFDPCF, one converter might work with a
positive chopping factor, while the other one works with a negative chopping factor. As a result
the scheme fails in detection of islanding.
(%)iTHD
5
046.0cf
0cf cf
046.0 cf
Figure 3.9 THD versus chopping factor
05.0
05.0
time
20 2030 15 cycles
2 Sec
cf
15
Figure 3.10 Chopping factor in AFDPCF

55
3.6.1.5 Slip mode frequency shift (SMS)
Normally the phase of the injected current of converter is kept at zero with respect to the
voltage at PCC. However, in the SMS scheme phase the current is controlled to be a function of
frequency, with a positive feedback. For example, if the frequency of the PCC voltage reduces
when islanding happens, the phase angle of the current goes down, this reduces the time to the
next zero crossing of the PCC voltage. This is interpreted by the controller as a frequency
decrease, so the phase angle of the current is decreased again, and so on, until the frequency hits
the OUF relay [21].
Considering that:
)2sin(ˆ1 SMSkg tfIi (3.20)
the phase of the current is calculated in each sampling time as the function of frequency :
)60
60
2sin( 1
m
kmSMS f
f (3.22)
where mf is maximum frequency at which maximum shift of m occurs [19]. As shown in
Figure 3.11, it is obvious that the frequency of the islanded system drifts from the nominal value
frequency only if:
Hz
SMS
Hz
load
ff 6060
(3.23)
Knowing that:
)
1(arctan
LCRload
(3.24)
and substituting Equation 3.22 and 3.24 into Equation 3.23:
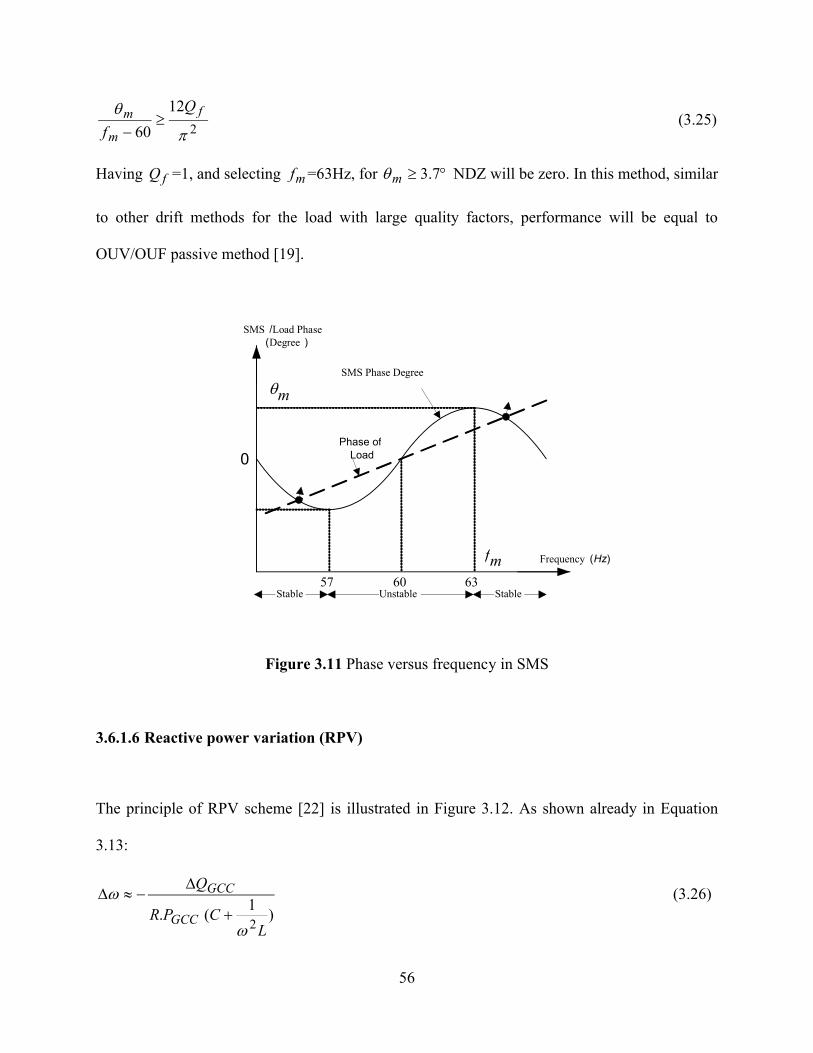
56
2
12
60
f
m
m Q
f
(3.25)
Having fQ =1, and selecting mf =63Hz, for 7.3m NDZ will be zero. In this method, similar
to other drift methods for the load with large quality factors, performance will be equal to
OUV/OUF passive method [19].
Figure 3.11 Phase versus frequency in SMS
3.6.1.6 Reactive power variation (RPV)
The principle of RPV scheme [22] is illustrated in Figure 3.12. As shown already in Equation
3.13:
)1
(.2L
CPR
Q
GCC
GCC
(3.26)
UnstableStable Stable
SMS /Load Phase(Degree )
Frequency (Hz)
57 60 63
SMS Phase Degree
Phase of Load0
mf
m
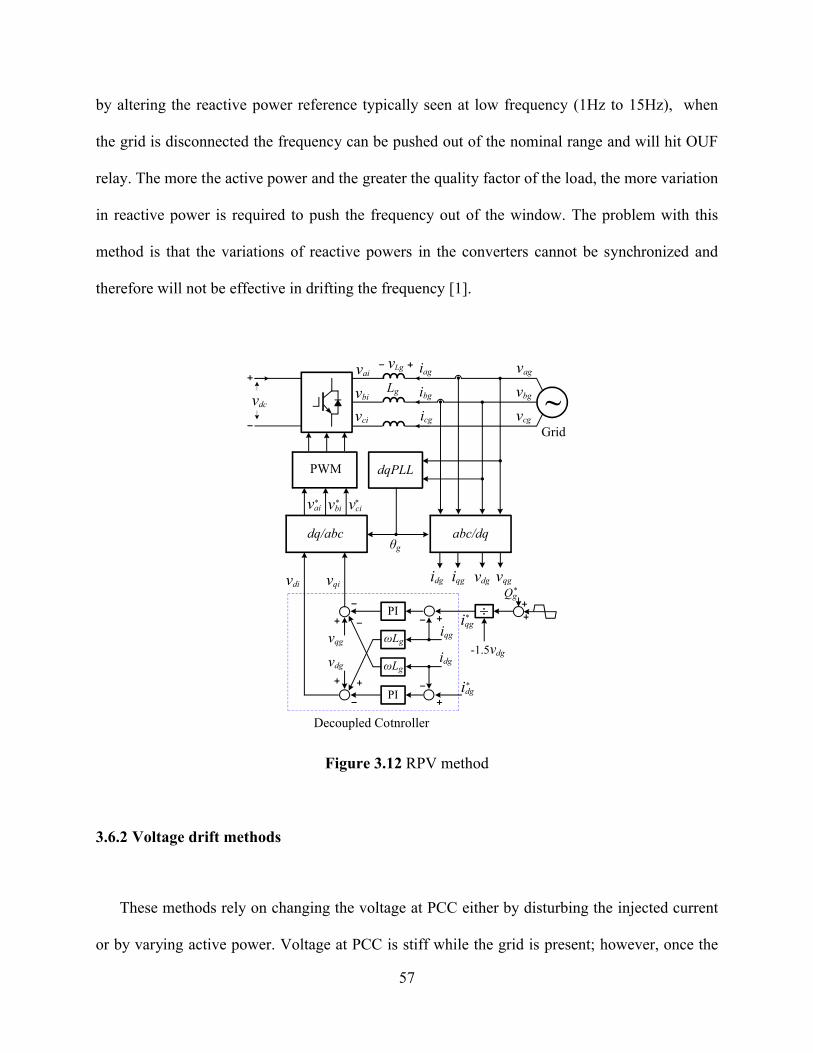
57
by altering the reactive power reference typically seen at low frequency (1Hz to 15Hz), when
the grid is disconnected the frequency can be pushed out of the nominal range and will hit OUF
relay. The more the active power and the greater the quality factor of the load, the more variation
in reactive power is required to push the frequency out of the window. The problem with this
method is that the variations of reactive powers in the converters cannot be synchronized and
therefore will not be effective in drifting the frequency [1].
Lg
iagvLg
PWM dqPLL
vagvbgvcg
ibg
icg
idg iqg vqgvdg
θg
vdi vqi
vaivbivci
PI
vqg
vdg
iqg
idg-1.5vdg
PI
Decoupled Cotnroller
iqg*
~Grid
vai vcivbi* * *
ωLg
abc/dqdq/abc
ωLg
idg*
vdc
Qg*
Figure 3.12 RPV method
3.6.2 Voltage drift methods
These methods rely on changing the voltage at PCC either by disturbing the injected current
or by varying active power. Voltage at PCC is stiff while the grid is present; however, once the

58
grid is disconnected, the disturbance can drift the voltage out of the normal range where it can be
detected by OUV. Voltage shift methods are sensitive to impedance grid. Two methods given in
the following figure are typically combined with their frequency shift counterparts to make the
schemes more robust [1].
3.6.2.1 General electric voltage shift (GEVS)
In this method, when the measured voltage at PCC goes down, the control scheme decreases
the set-point for active power in the converter. Based on equation 3.5, the voltage keeps going
lower to balance the active power, and the decreased voltage will further diminish the active
power and eventually will hit the OUV relay. As shown in Figure 3.13, the measured voltage
goes through a low pass (10Hz) and high pass filter (1Hz) to remove DC offset and noise
respectively; then the output of the filter is amplified by a gain and confined by a limiter. Finally,
the signal is added to the active power reference calculated in MPPT. In this approach THD
degradation is very small, and therefore by increasing gain, NDZ can be reduced to zero. This
also has good potential when multiple converters are involved, but according to GE it can be
problematic for network stability [15].
3.6.2.2 Sandia voltage shift (SVS)
Here, amplitude of the output current waveform is perturbed in response to utility voltage
fluctuations. When the voltage goes up, output current is increased. When voltage goes down,
output current is reduced; therefore, when the utility is connected, this method exhibits small
fluctuations in output power and output current. However when the grid is absent, voltage at

59
PCC eventually hits the OUV relay. The control signal is selected as the difference between
filtered average voltage and cycle-by-cycle measurements of RMS voltage [20].
Lg
iagvLg
PWM dqPLL
vagvbgvcg
ibg
icg
idg iqg vqgvdg
θg
vdi vqi
vaivbivci
PI
vqg
vdg
iqg
idg-1.5vdg
QgPI
Decoupled Cotnroller
iqg*
~Grid
vai vcivbi* * *
ωLg
abc/dq
*
dq/abc
ωLg idg*
G
vdg
BPFLimiterGE Voltage shift Method
vdc
Figure 3.13 GEVS method
3.6.3 Impedance estimation (IE)
By perturbing the injected current of the converter and measuring its response on the voltage
at PCC, and equivalent impedance seen from the converter terminal can be measured. As already
discussed in 3.6.3, during islanding the impedance of the grid is replaced by impedance of the
load at a higher rate. Thus, islanding can be detected when the measured impedance at
converter’s terminal increases significantly.
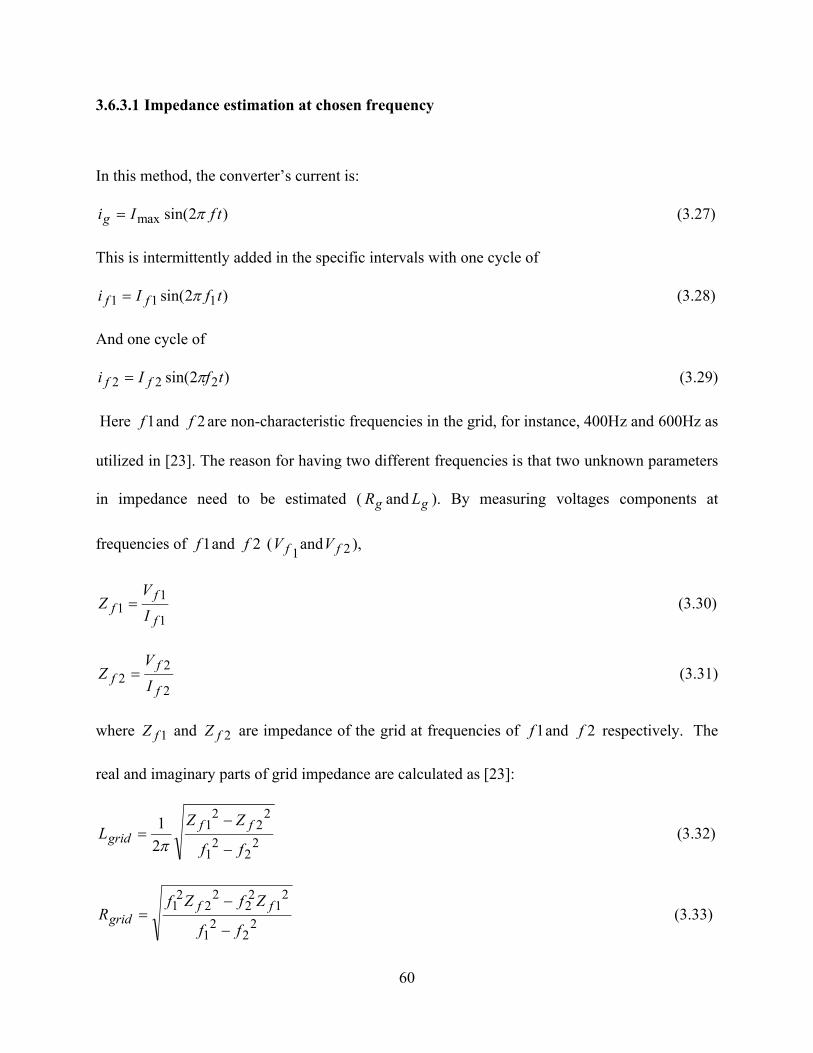
60
3.6.3.1 Impedance estimation at chosen frequency
In this method, the converter’s current is:
)2sin(max tfIig (3.27)
This is intermittently added in the specific intervals with one cycle of
)2sin( 111 tfIi ff (3.28)
And one cycle of
)2sin( 222 tfIi ff (3.29)
Here 1f and 2f are non-characteristic frequencies in the grid, for instance, 400Hz and 600Hz as
utilized in [23]. The reason for having two different frequencies is that two unknown parameters
in impedance need to be estimated ( gR and gL ). By measuring voltages components at
frequencies of 1f and 2f (1fV and 2fV ),
1
11
f
ff I
VZ (3.30)
2
22
f
ff I
VZ (3.31)
where 1fZ and 2fZ are impedance of the grid at frequencies of 1f and 2f respectively. The
real and imaginary parts of grid impedance are calculated as [23]:
22
21
22
21
2
1
ff
ZZL
ffgrid
(3.32)
22
21
21
22
22
21
ff
ZfZfR
ffgrid
(3.33)

61
If multiple converters are equipped with this scheme, this method will fail to measure the grid
impedance accurately, when two or more of them inject the harmonic current simultaneously.
3.6.3.2 Impedance estimation at time domain
In this approach [24], instead of injecting current at two different frequencies, two stationary
working points are created with the changing reference for active and reactive power at specific
intervals, as shown in Figure 3.14.
By having two sets of voltage and current at the converter’s terminal, impedance can be
estimated.
Looking at Figure 3.15, it can be seen that:
(3.34)
(3.35)
Assuming that Vg remains constant between two working points,
21
21
II
VVZ grid
(3.36)
22qd
qqddgrid
II
IVIVR
(3.37)
222 )( qd
qddqgrid
II
IVIVL
(3.38)
It is obvious that when two converters changed their working points simultaneously, this scheme
might still fail.
VgZIV grid 11
VgZIV grid 22
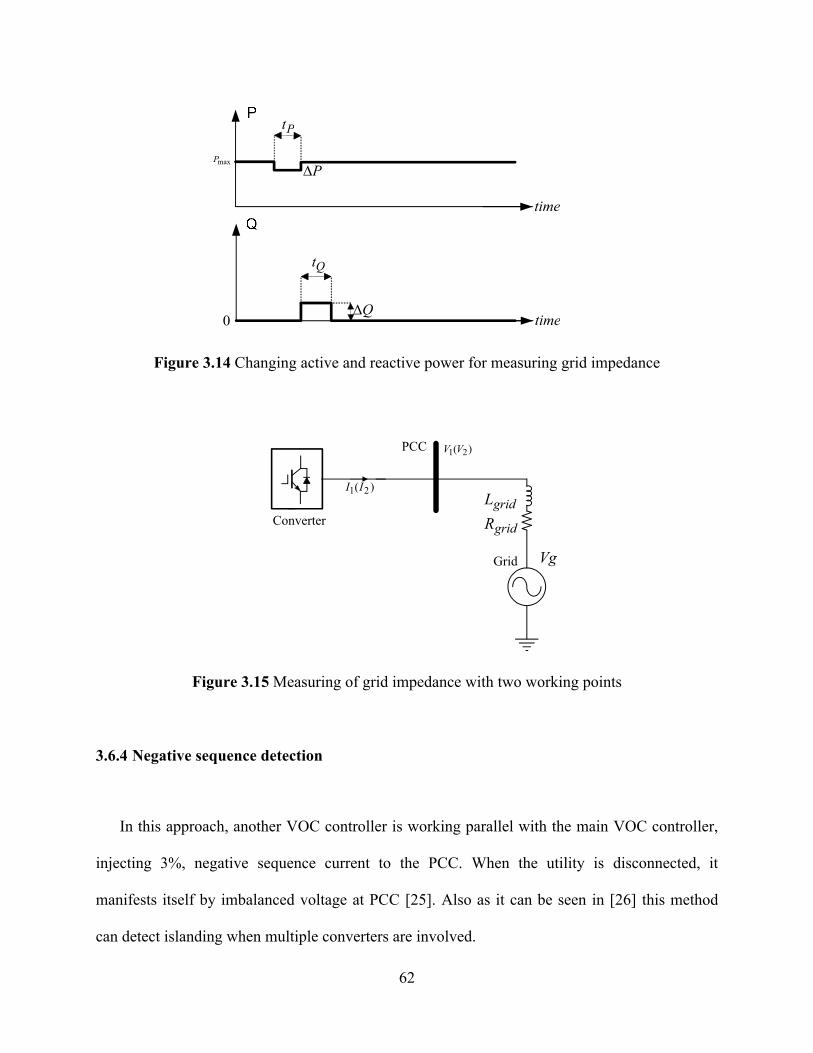
62
maxP
0 time
time
Pt
Qt
P
Q
Figure 3.14 Changing active and reactive power for measuring grid impedance
Grid
PCC
Converter
)( 21 II
)( 21 VV
gridL
gridR
Vg
Figure 3.15 Measuring of grid impedance with two working points
3.6.4 Negative sequence detection
In this approach, another VOC controller is working parallel with the main VOC controller,
injecting 3%, negative sequence current to the PCC. When the utility is disconnected, it
manifests itself by imbalanced voltage at PCC [25]. Also as it can be seen in [26] this method
can detect islanding when multiple converters are involved.

63
3.6.5 PLL based methods
These methods deliberately perturb the derived grid phase angle and then measure its
response in the voltage at PCC. For example as one specific example, the phase grid derived by
PLL will be augmented with a zebra signal, and the same pattern is expected to be observed
during the islanding by monitoring the voltage at PCC [1].
3.7 External impedance insertion (EII)
As illustrated in Figure 3.16, once the grid circuit breaker becomes disconnected, within a
small delay, another circuit breaker connects a capacitor bank to the PCC and creates a phase
jump, which can be detected with PJD. Implementation of this method is expensive and needs
additional equipment.
Therefore, it cannot be considered as a solution for small PV converters due to the high cost
of implementation [5].
Grid
PCC
ConverterRLC load
QP ,GCCGCC QP ,loadload QP ,
Figure 3.16 External impedance insertions
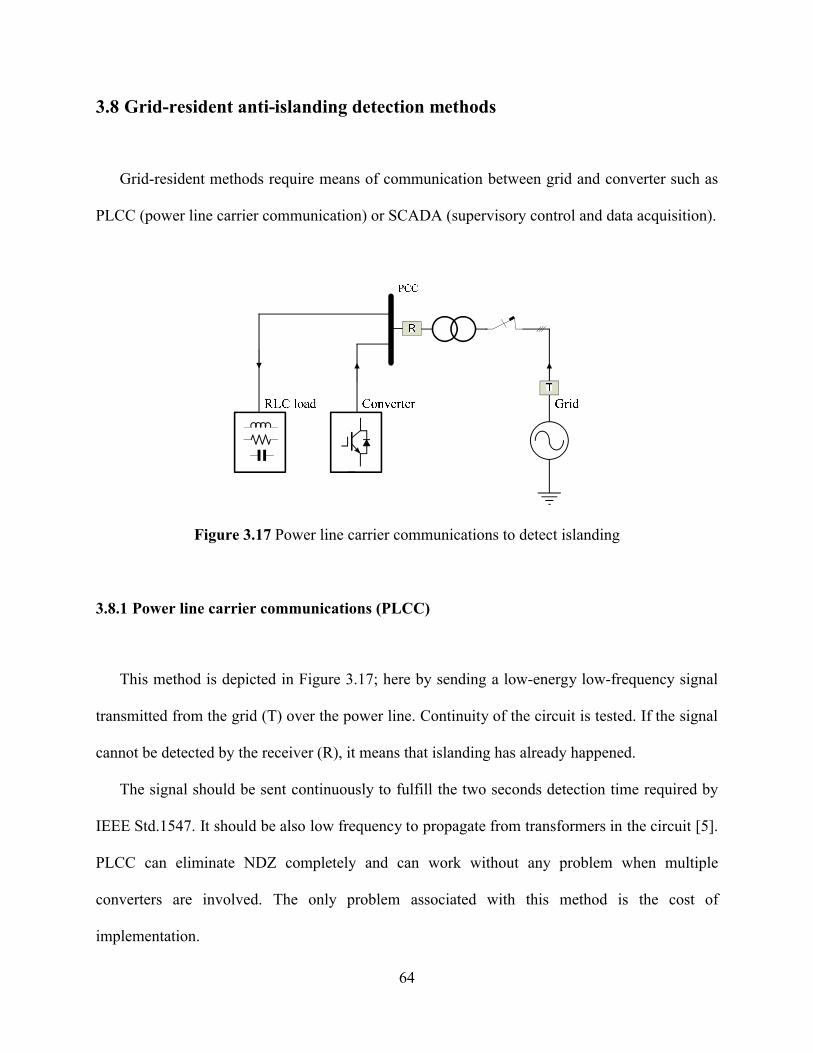
64
3.8 Grid-resident anti-islanding detection methods
Grid-resident methods require means of communication between grid and converter such as
PLCC (power line carrier communication) or SCADA (supervisory control and data acquisition).
Figure 3.17 Power line carrier communications to detect islanding
3.8.1 Power line carrier communications (PLCC)
This method is depicted in Figure 3.17; here by sending a low-energy low-frequency signal
transmitted from the grid (T) over the power line. Continuity of the circuit is tested. If the signal
cannot be detected by the receiver (R), it means that islanding has already happened.
The signal should be sent continuously to fulfill the two seconds detection time required by
IEEE Std.1547. It should be also low frequency to propagate from transformers in the circuit [5].
PLCC can eliminate NDZ completely and can work without any problem when multiple
converters are involved. The only problem associated with this method is the cost of
implementation.

65
3.8.2 Supervisory control and data acquisition (SCADA)
By installing a separate voltage sensor at PCC, voltage information is sent to the SCADA
system. Existing voltage in the disconnected area means islanding has already happened. This
method’s barriers include major utility involvement and the high cost of implementation [1].
3.9 Comparison of anti-islanding detection methods
Islanding detection methods can be benchmarked, as demonstrated in Table 3.1, based on the
three main criteria: 1) Reliability, 2) Maintaining power quality, and 3) Multiple–converters
application [1]. Reliability is the main concern for all passive methods, as having too sensitive
settings may increase the chance of a nuisance trip and otherwise NDZ remains non-zero.
Therefore the passive methods are only utilized in combination with the active methods. Among
the active methods, the positive feedback schemes exhibit better performance to fulfil the trade-
off between reliability and maintaining power quality. Frequency shift methods become less
reliable with the loads using high quality factors. Voltage shift methods become less effective
with the high impedance networks. However, the main challenge for all active methods is
multiple-converter application as there is not a consensus among the manufacturers for adopting
a common scheme.
3.10 Summary
In this chapter, islanding and the risks associated with it have been discussed. Anti-islanding

66
detection methods and the criteria for their evaluation were presented. Passive methods cannot
eliminate NDZ and must be combined with active methods.
Active methods work on drifting of frequency or voltage or grid impedance measurement.
Frequency drifting methods become ineffective when the load has a high quality factor. Voltage
drift methods cannot work properly with a high impedance grid. The impedance measurement
technique fails to detect islanding when multiple converters are involved.
Active methods are benchmarked based on reliability, degradation of power quality, and their
performance, when multiple converters are equipped with the same scheme. GE and Sandia
methods are more promising here, but there is still no consensus among the manufacturers to
adopt a common platform.
Grid-resident methods rely on communication between the grid and converters, and they
have a good potential for standardization in the long term.
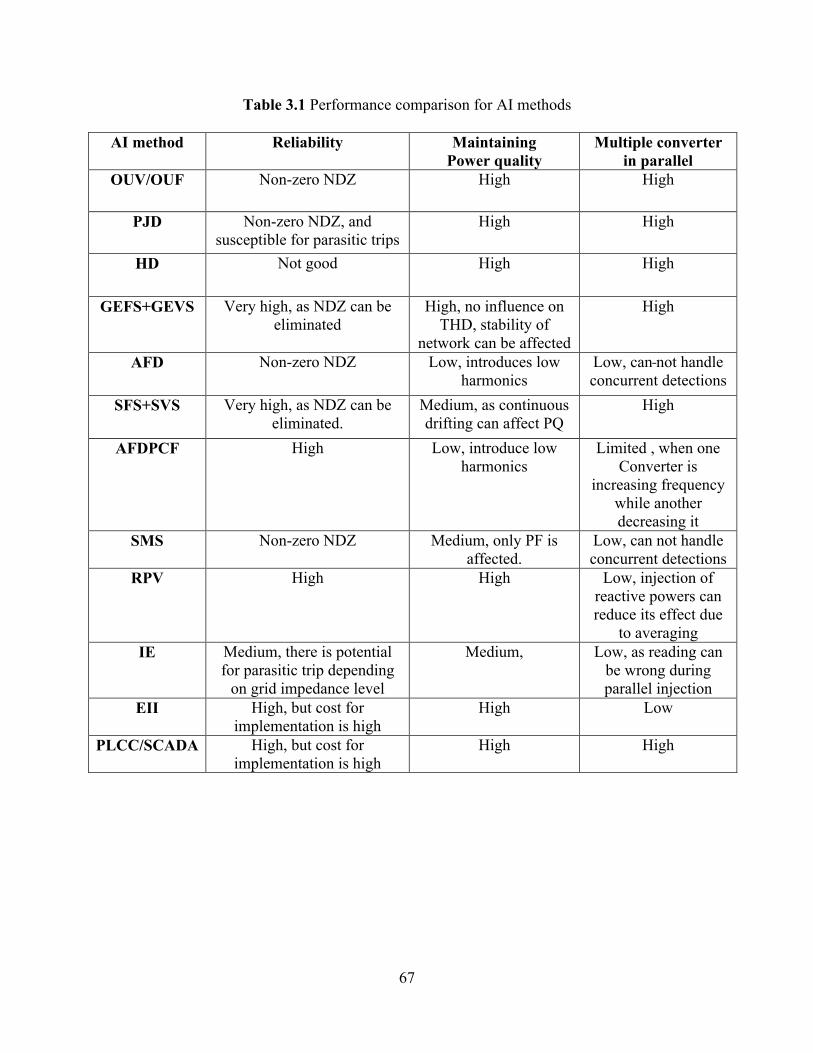
67
Table 3.1 Performance comparison for AI methods
AI method Reliability MaintainingPower quality
Multiple converterin parallel
OUV/OUF Non-zero NDZ High High
PJD Non-zero NDZ, and susceptible for parasitic trips
High High
HD Not good High High
GEFS+GEVS Very high, as NDZ can be eliminated
High, no influence on THD, stability of
network can be affected
High
AFD Non-zero NDZ Low, introduces low harmonics
Low, can not handle concurrent detections
SFS+SVS Very high, as NDZ can be eliminated.
Medium, as continuous drifting can affect PQ
High
AFDPCF High Low, introduce low harmonics
Limited , when one Converter is
increasing frequency while another decreasing it
SMS Non-zero NDZ Medium, only PF is affected.
Low, can not handle concurrent detections
RPV High High Low, injection of reactive powers can reduce its effect due
to averagingIE Medium, there is potential
for parasitic trip depending on grid impedance level
Medium, Low, as reading can be wrong during parallel injection
EII High, but cost for implementation is high
High Low
PLCC/SCADA High, but cost for implementation is high
High High

68
Chapter Four
Novel Anti-Islanding Method for Multiple-Converters Application
Anti-islanding is an important feature in the low-power grid-connected converters. The main
criteria are reliability, power quality degradation, and suitability for parallel operation. In the
passive methods, a zero non-detection zone cannot be achieved. Therefore the reliability of
passive methods is limited. In the active methods, a null NDZ can be met. However, the main
challenges are to reduce the power quality degradation and to make sure that the scheme works
in the multiple-converters application.
In this chapter a novel active anti-islanding method is proposed. The intent is to develop a
robust, active AI method with no impact on power quality and stability of the network that can
be utilized in multi-converter applications.
4.1 Problem statement
There are two major problems that occur with the existing AI methods. First, as illustrated in
Table 3.1, most of the active AI methods, such as Sandia Frequency Shift (SFS), Sandia Voltage
Shift (SVS), Active Frequency Drift with Pulse Chopping Factor (AFDPCF), and Active
Frequency Drift (AFD) degrade power quality, since they continuously inject disturbance into
the network. The second issue with some of the active AI methods is the dilution effect when
multiple converters are paralleled. For instance, both the RPV and AFDPCF scheme fail in
multi-converter applications because the disturbance injected by one converter can cancel the
other due to lack of synchronization between them.
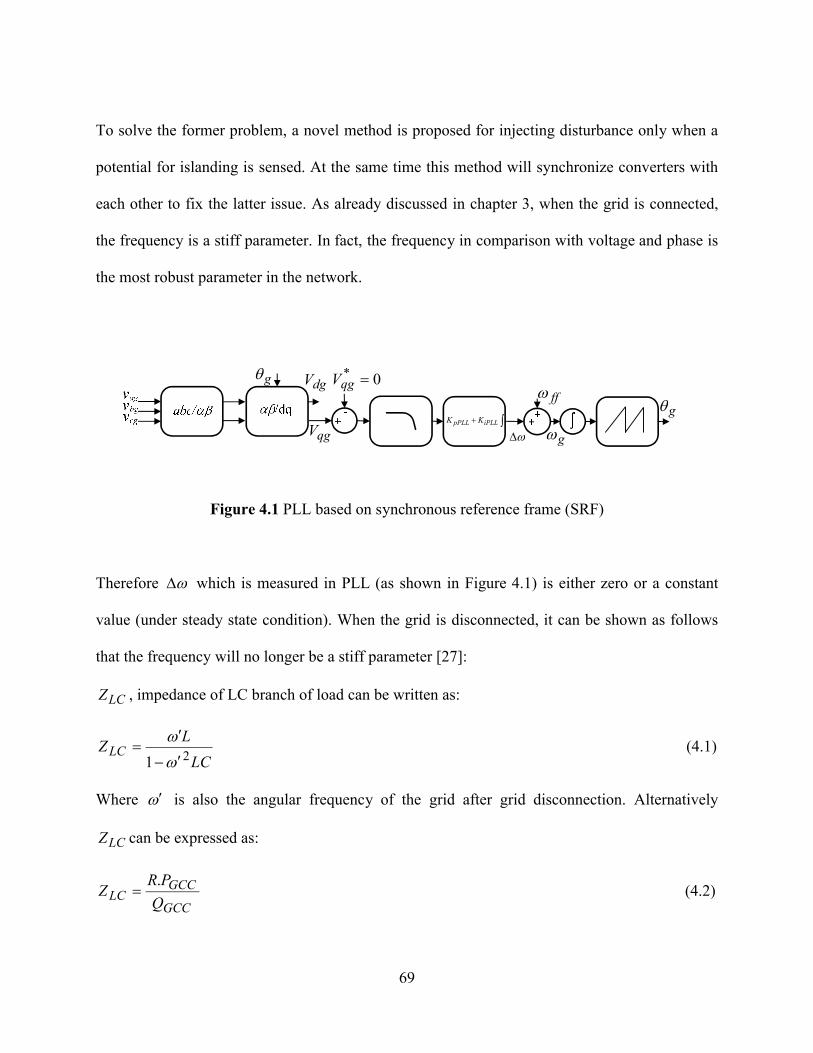
69
To solve the former problem, a novel method is proposed for injecting disturbance only when a
potential for islanding is sensed. At the same time this method will synchronize converters with
each other to fix the latter issue. As already discussed in chapter 3, when the grid is connected,
the frequency is a stiff parameter. In fact, the frequency in comparison with voltage and phase is
the most robust parameter in the network.
iPLLpPLL KK
ff
qgV
0* qgV
gg
g dgV
Figure 4.1 PLL based on synchronous reference frame (SRF)
Therefore which is measured in PLL (as shown in Figure 4.1) is either zero or a constant
value (under steady state condition). When the grid is disconnected, it can be shown as follows
that the frequency will no longer be a stiff parameter [27]:
LCZ , impedance of LC branch of load can be written as:
LC
LZ LC 21
(4.1)
Where is also the angular frequency of the grid after grid disconnection. Alternatively
LCZ can be expressed as:
GCC
GCCLC Q
PRZ
. (4.2)

70
where GCCP and GCCQ are the active and reactive power supplied by the grid-connected
converter, respectively. By equating (4.1) and (4.2) we arrive at:
012
LCRCP
Q
GCC
GCC (4.3)
Therefore:
2
4)( 2
LCRCP
Q
RCP
Q
GCC
GCC
GCC
GCC
(4.4)
The quality factor of the load is defined as:
L
CRQ f (4.5)
Also
LC
4>> 2)(
GCC
GCC
RCP
Q (4.6)
Therefore (4.4) can be rewritten as:
)2
11(
1
GCC
GCC
f P
Q
QLC (4.7)
In the worst case scenario in the islanding,
LC
1 (4.8)
Therefore:
GCC
GCC
f P
Q
Q2
(4.9)
GCCGCC
GCC
f PP
Q
Q
2
1
(4.10)

71
where is defined as
(4.11)
Also
GCCP << GCCP (4.12)
As a result, we find:
GCC
GCC
f P
Q
Q
2
1
(4.13)
Equation 4.13 states that when there is no mismatch in reactive power, still fluctuates
slightly all the time around the nominal frequency. In practice, due to the presence of harmonic
distortion and unbalanced supply voltages, a low pass filter and notch filter are employed in
PLL. Thus a very high bandwidth could not be achieved, and the response time of PLL usually
has to be set to 50 to 100 milliseconds [1], whereas the response time of the current loop is much
faster (less than 5 milliseconds). The discussed phenomenon is best shown in Figure 4.2 when
one converter is involved.
However, when multiple converters are paralleled, 4.13 can be rewritten as
GCC
GCC
f P
Q
Q2
1
(4.14)
Due to the averaging effect, GCCQ << GCCP ; therefore, changes in frequency will be
very small when a large number of the converters are paralleled. Even in the RPV method where
GCCQ is changed intentionally, the changes in each converter still cannot be synchronized with
the rest. Therefore the RPV method may fail in the multiple- converters application.
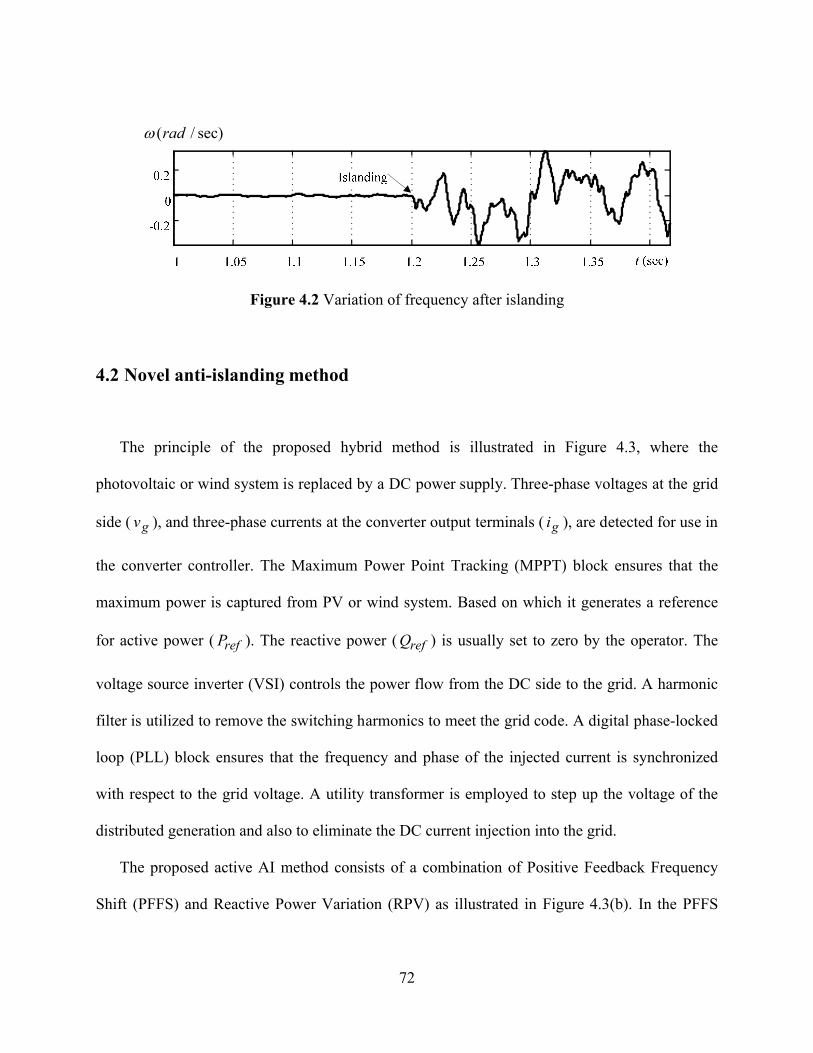
72
sec)/(rad
Figure 4.2 Variation of frequency after islanding
4.2 Novel anti-islanding method
The principle of the proposed hybrid method is illustrated in Figure 4.3, where the
photovoltaic or wind system is replaced by a DC power supply. Three-phase voltages at the grid
side ( gv ), and three-phase currents at the converter output terminals ( gi ), are detected for use in
the converter controller. The Maximum Power Point Tracking (MPPT) block ensures that the
maximum power is captured from PV or wind system. Based on which it generates a reference
for active power ( refP ). The reactive power ( refQ ) is usually set to zero by the operator. The
voltage source inverter (VSI) controls the power flow from the DC side to the grid. A harmonic
filter is utilized to remove the switching harmonics to meet the grid code. A digital phase-locked
loop (PLL) block ensures that the frequency and phase of the injected current is synchronized
with respect to the grid voltage. A utility transformer is employed to step up the voltage of the
distributed generation and also to eliminate the DC current injection into the grid.
The proposed active AI method consists of a combination of Positive Feedback Frequency
Shift (PFFS) and Reactive Power Variation (RPV) as illustrated in Figure 4.3(b). In the PFFS

73
method, the reactive power reference ( refQ ) is augmented by positive feedback derived from the
changes of grid frequency as measured by the PLL. When the measured frequency ω increases,
the anti-islanding scheme will proportionally increase the amount of reactive power supplied by
the converter ( GCCQ ). As a result, the frequency keeps increasing in order to balance the
reactive power. The increased frequency will further drive the converter’s reactive power up,
which is known as the positive feedback frequency shift method. To maintain the stability of the
DG system, the maximum positive feedback reference is only limited to 0.5% of the converter
supplied power.
The PFFS scheme in the proposed AI method is only employed to pre-detect potential
islanding in advance and to synchronize the converters for initiating the main active islanding
detection method. When 0.1Hz frequency shift is detected, as shown in Figure 4.3(b), the RPV
scheme or the other active islanding detection method is triggered by an RS flip-flop for a short
period of time to push the frequency or voltage out of the acceptable range. Therefore, as all
active methods embedded in the converters are triggered simultaneously, the proposed scheme
will not fail at the multiple-converter applications. The details of the proposed AI method and
selection of its parameters and boundaries are addressed in the following subsections.
4.2.1 Positive feedback frequency shift scheme (PFFS)
According to Equation (4.13), 0.5% variation of reactive power is adequate to change the
frequency by 0.1Hz when islanding takes place with the load quality factor of one (1.0) as
required by IEEE Std. 1547.

74
Considering and t are the phase shift and its associated time delay generated in each cycle
due to variation in reactive power [22],
s9.1460.2
)005.0(tan 1
t (4.15)
The required time to shift the frequency by 0.1Hz, QT , when the reactive power has already
changed by 0.5% can be calculated by
msTQ 3.339.14260
19.14
60
1
(4.16)
4.2.2 Positive feedback gain
The variation of the measured grid frequency ω related to the variation of the reactive power is
given by:
pfGCC KQ (4.17)
where pfK is the gain of the PFFS pre-islanding detection scheme shown in Figure 4.3(b).
According to [28], the lower limit of pfK can be derived as:
005.060.2
22(min)
n
GCCfpf
PQK (4.18)
A higher value of pfK means that a larger disturbance is added to the reactive power reference
when the same frequency variation occurs, which will positively contribute to the reliable
detection of islanding. However, selecting a gain that is too high has a negative impact on the
power quality of the grid [28]. In this research, the gain is selected equal to 0.08, which
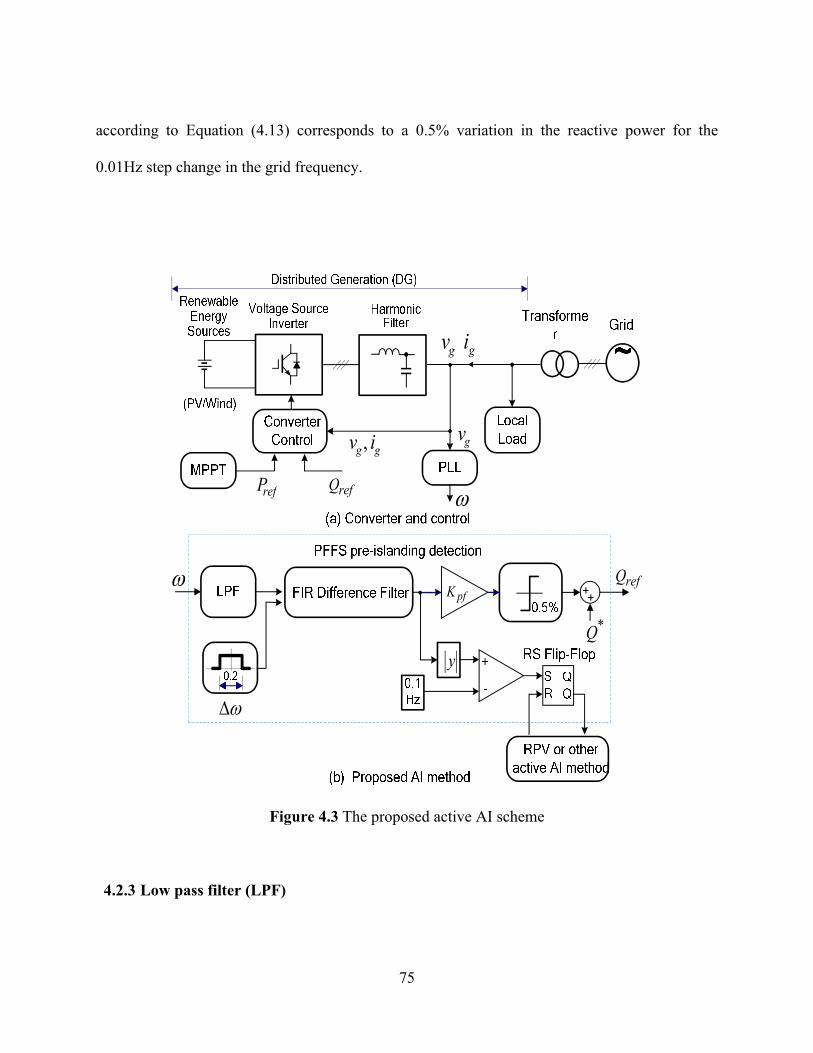
75
according to Equation (4.13) corresponds to a 0.5% variation in the reactive power for the
0.01Hz step change in the grid frequency.
*Q
refQ
y
pfK
gg iv ,
gigv
refQrefP
gv
Figure 4.3 The proposed active AI scheme
4.2.3 Low pass filter (LPF)

76
A low pass filter is employed to filter out the high frequency disturbance and noises that might
exist in the measured grid frequency. In this paper the LPF with a corner frequency of 25Hz is
utilized, which gives a response time of 0.04 seconds.
4.2.4 Finite impulse filter (FIR)
To remove any possible DC offset that might exist in the measured grid frequency and to
monitor any frequency changes in each of the 0.2 second intervals, a FIR difference filter is
proposed, as shown in Figure 4.3(b).The output of the FIR filter utilized in this study is at the
thn sample:
....321 nnnnnu (4.19)
mn .,,.........3,2,1
where n is the measured angular frequency at the thn sample. Considering the sampling time
of 1/5000 seconds for the system, m is chosen to be 999.
This implies that the FIR block integrates continuously from the measured frequency in a
definite time of 0.2 seconds. The output of the FIR difference filter is:
1 nununy (4.20)
Substituting nu and 1nu into (4.19) yields:
ny n - 1000n (4.21)
The PFFS pre-islanding detection method works based on the deviation between the measured
frequency of each sample and the sample acquired 0.2 seconds earlier. Moreover, the PFFS
filters out any DC offset in the measured frequency.

77
As shown in Figure 4.3(b), if the measured grid frequency ω changes more than 0.1Hz in
each 0.2 seconds interval, the RS flip-flop is set by the comparator, and the RPV or other active
islanding detection schemes are triggered to detect the islanding.
4.2.5 Pre-detection time ( 0T )
Pre-detection time ( 0T ), as shown in Figure 4.4, is defined as the time required by the PFFS
scheme to shift the frequency by 0.1Hz after islanding occurs. In Figure 4.5, an analytical
approach to estimate the maximum pre-detection time is presented. The frequency of the injected
current ( meaf ) is calculated by PLL from the frequency of the grid voltage ( actf ). The variation
in the measured frequency, with a delay caused by utilizing a low pass filter ( LPFT ) multiplied
by the gain ( pfK ), will be utilized as the reactive power reference. The converter reactive power
( GCCQ ), with a delay caused by current controller ( VOCT ), will be equal to the reactive power
reference ( refQ ). The converter reactive power with a delay given in Equation 4.16 ( QT ) drifts
the frequency. Therefore if the settling time of PLL selected is smaller than the pre-detection
time, the maximum value for 0T can be calculated by:
QVOCLPF TTTT 0 (4.22)
where LPFT is the time delay introduced by the low pass filter, and QT , is the time required for a
0.5 % shift in the reactive power with 0.1Hz shift in the frequency when the grid is disconnected.
VOCT is the current-control settling time, and as discussed in Section 2.6.1 can be approximated
by:
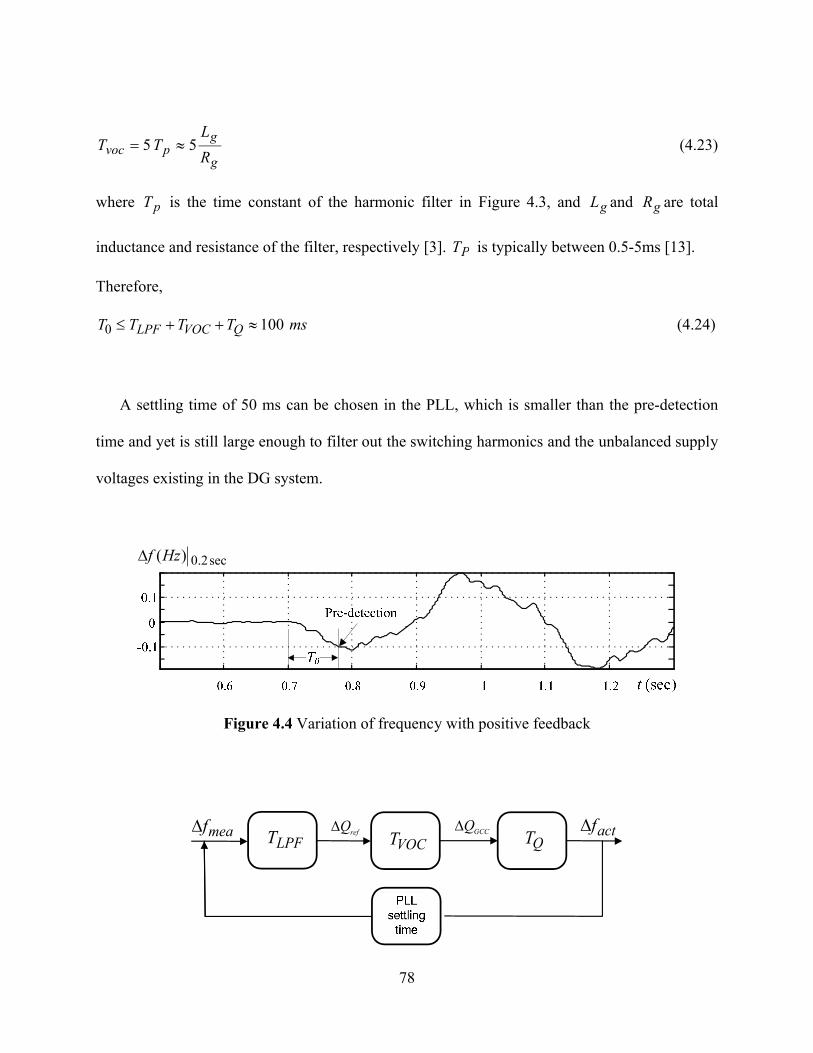
78
g
gpvoc R
LTT 55 (4.23)
where pT is the time constant of the harmonic filter in Figure 4.3, and gL and gR are total
inductance and resistance of the filter, respectively [3]. PT is typically between 0.5-5ms [13].
Therefore,
msTTTT QVOCLPF 1000 (4.24)
A settling time of 50 ms can be chosen in the PLL, which is smaller than the pre-detection
time and yet is still large enough to filter out the switching harmonics and the unbalanced supply
voltages existing in the DG system.
sec2.0)(Hzf
Figure 4.4 Variation of frequency with positive feedback
refQ qgiQTPTVOCT QT actfmeaf
LPFT GCCQ
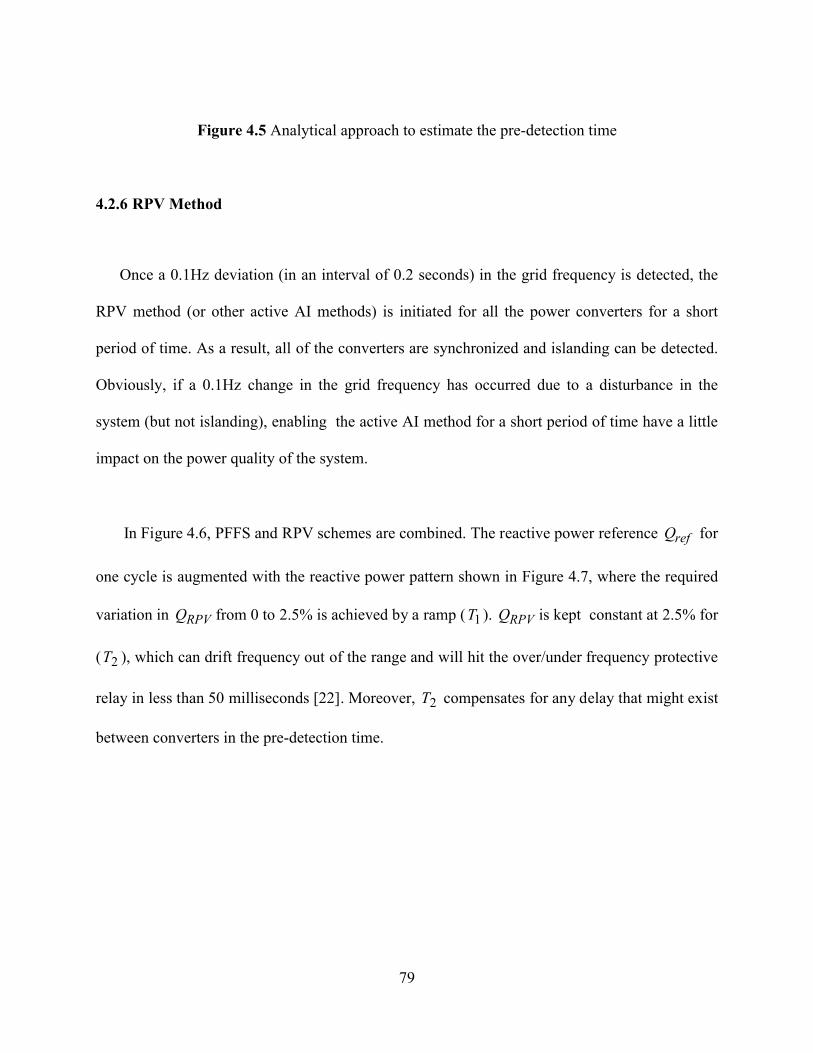
79
Figure 4.5 Analytical approach to estimate the pre-detection time
4.2.6 RPV Method
Once a 0.1Hz deviation (in an interval of 0.2 seconds) in the grid frequency is detected, the
RPV method (or other active AI methods) is initiated for all the power converters for a short
period of time. As a result, all of the converters are synchronized and islanding can be detected.
Obviously, if a 0.1Hz change in the grid frequency has occurred due to a disturbance in the
system (but not islanding), enabling the active AI method for a short period of time have a little
impact on the power quality of the system.
In Figure 4.6, PFFS and RPV schemes are combined. The reactive power reference refQ for
one cycle is augmented with the reactive power pattern shown in Figure 4.7, where the required
variation in RPVQ from 0 to 2.5% is achieved by a ramp ( 1T ). RPVQ is kept constant at 2.5% for
( 2T ), which can drift frequency out of the range and will hit the over/under frequency protective
relay in less than 50 milliseconds [22]. Moreover, 2T compensates for any delay that might exist
between converters in the pre-detection time.

80
fRPVQ
n
GCC
P
P
*Q
refQpfK
y
Figure 4.6 The proposed active scheme combined with RPV
As shown in Figure 7, the proposed method detects the islanding within 3T , where
3T 0T + msT 501 (4.25)
This method, similar to other frequency shift methods, is affected by quality factor of the load.
Therefore, as already shown in 4.13, the greater quality factor of load, the higher variation of
reactive power is required to push the frequency out of the window. For example, for a load with
a quality factor of 2.5, the maximum RPV reference shall be increased to +/-6.25% (of GCCP ).
4.3 Computer simulation
This section presents the computer simulation and verification of the proposed anti-islanding
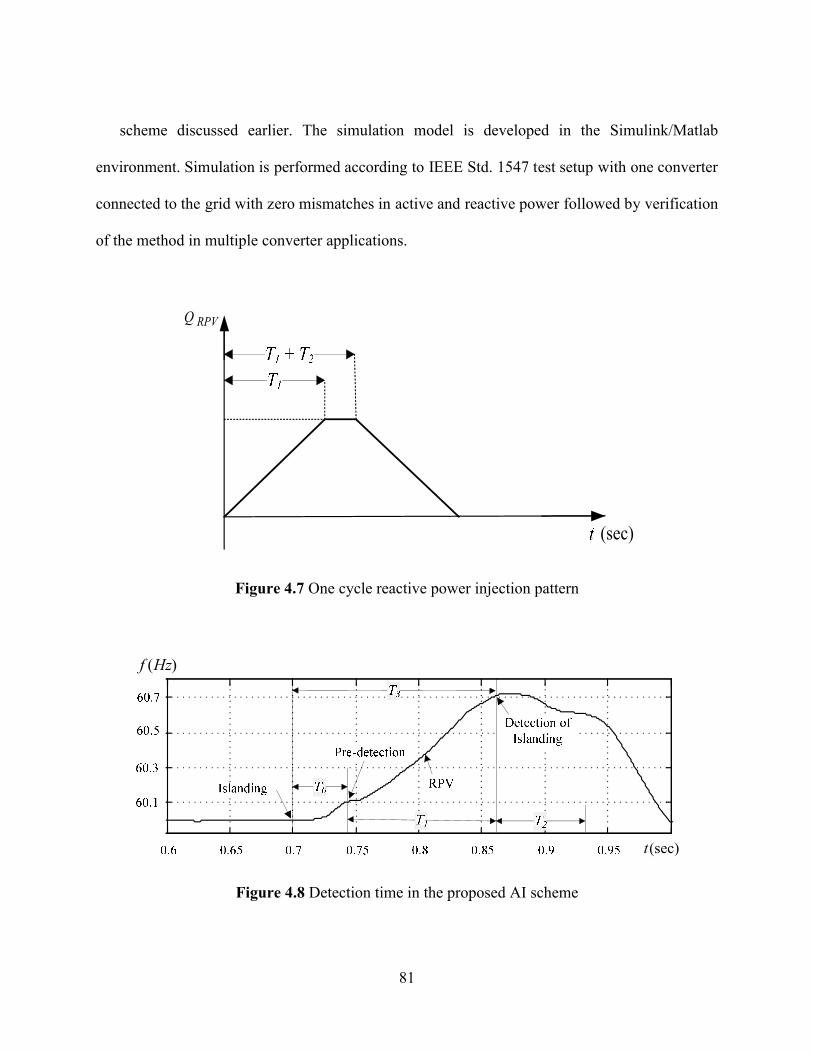
81
scheme discussed earlier. The simulation model is developed in the Simulink/Matlab
environment. Simulation is performed according to IEEE Std. 1547 test setup with one converter
connected to the grid with zero mismatches in active and reactive power followed by verification
of the method in multiple converter applications.
(sec)
RPVQ
Figure 4.7 One cycle reactive power injection pattern
(sec)t
)(Hzf
Figure 4.8 Detection time in the proposed AI scheme
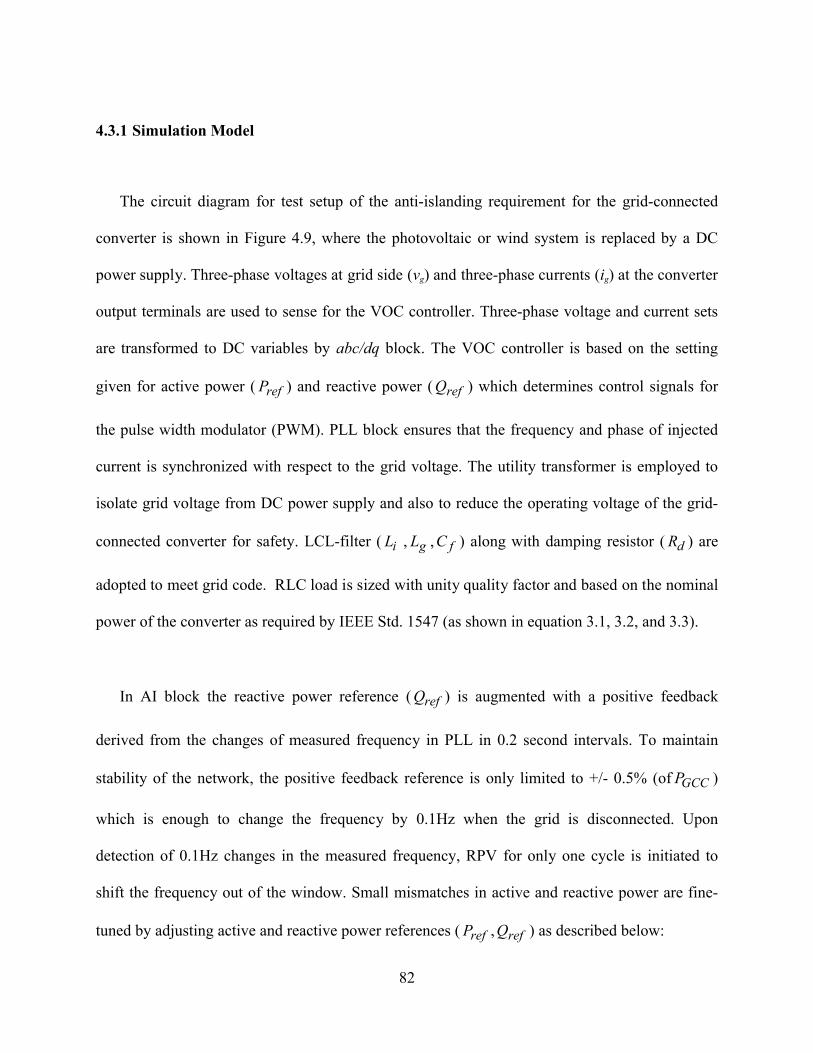
82
4.3.1 Simulation Model
The circuit diagram for test setup of the anti-islanding requirement for the grid-connected
converter is shown in Figure 4.9, where the photovoltaic or wind system is replaced by a DC
power supply. Three-phase voltages at grid side (vg) and three-phase currents (ig) at the converter
output terminals are used to sense for the VOC controller. Three-phase voltage and current sets
are transformed to DC variables by abc/dq block. The VOC controller is based on the setting
given for active power ( refP ) and reactive power ( refQ ) which determines control signals for
the pulse width modulator (PWM). PLL block ensures that the frequency and phase of injected
current is synchronized with respect to the grid voltage. The utility transformer is employed to
isolate grid voltage from DC power supply and also to reduce the operating voltage of the grid-
connected converter for safety. LCL-filter ( iL , gL , fC ) along with damping resistor ( dR ) are
adopted to meet grid code. RLC load is sized with unity quality factor and based on the nominal
power of the converter as required by IEEE Std. 1547 (as shown in equation 3.1, 3.2, and 3.3).
In AI block the reactive power reference ( refQ ) is augmented with a positive feedback
derived from the changes of measured frequency in PLL in 0.2 second intervals. To maintain
stability of the network, the positive feedback reference is only limited to +/- 0.5% (of GCCP )
which is enough to change the frequency by 0.1Hz when the grid is disconnected. Upon
detection of 0.1Hz changes in the measured frequency, RPV for only one cycle is initiated to
shift the frequency out of the window. Small mismatches in active and reactive power are fine-
tuned by adjusting active and reactive power references ( refP , refQ ) as described below:

83
While CB2 is closed, refP and refQ are set to 1 (pu) and 0 (pu) respectively, CB1 is used to
connect the converter to the grid. Then refP is fine-tuned based on trial and error so that vg does
not present any changes with the opening of CB2. And finally refQ is adjusted so that frequency
does not show any discrepancies with the opening of CB2. New values for refP and refQ are
considered as the new references for active and reactive power. To verify the proposed method
when multiple converters are connected to the grid, simulation is performed when three
converters are equipped with PFFS schemes as shown in Figure 4.10.
4.4 Simulation results
In this section, results obtained from the following simulations are provided: 1) Islanding
with zero mismatch in active and reactive powers, 2) PFFS scheme, 3) Anti-islanding scheme
when 1fQ , 4) Anti-islanding scheme when 5.2fQ , 5) Anti-islanding scheme when
%50GCCP and, 6) PFFS scheme with three converters paralleled. Simulation system
specifications of the grid, transformer, load and grid-connected converters are listed in Table 4.1
and 4.2 respectively.
4.4.1 Islanding with zero mismatch in active and reactive power
In this sub-section, the islanding with no mismatches between active and reactive power of
the grid-connected converter and the load is simulated. In Figure 4.11, the islanding happens at
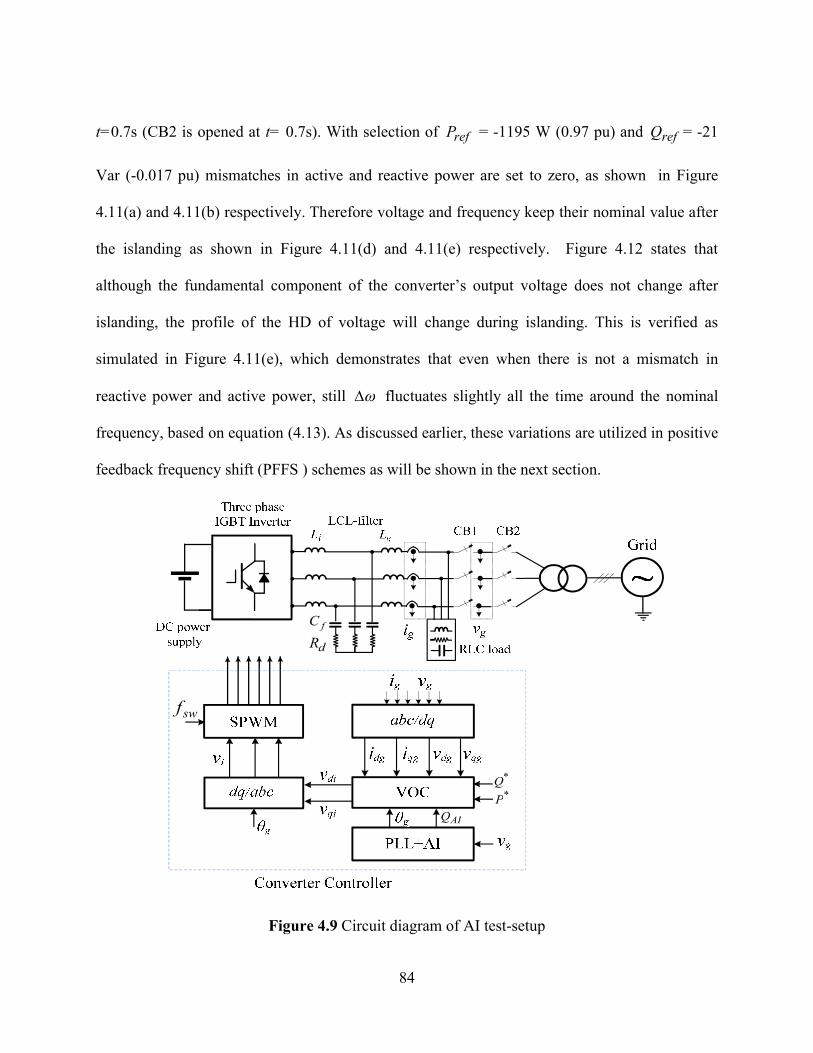
84
t=0.7s (CB2 is opened at t= 0.7s). With selection of refP = -1195 W (0.97 pu) and refQ = -21
Var (-0.017 pu) mismatches in active and reactive power are set to zero, as shown in Figure
4.11(a) and 4.11(b) respectively. Therefore voltage and frequency keep their nominal value after
the islanding as shown in Figure 4.11(d) and 4.11(e) respectively. Figure 4.12 states that
although the fundamental component of the converter’s output voltage does not change after
islanding, the profile of the HD of voltage will change during islanding. This is verified as
simulated in Figure 4.11(e), which demonstrates that even when there is not a mismatch in
reactive power and active power, still fluctuates slightly all the time around the nominal
frequency, based on equation (4.13). As discussed earlier, these variations are utilized in positive
feedback frequency shift (PFFS ) schemes as will be shown in the next section.
dRfC
*Q*P
AIQ
swf
Figure 4.9 Circuit diagram of AI test-setup
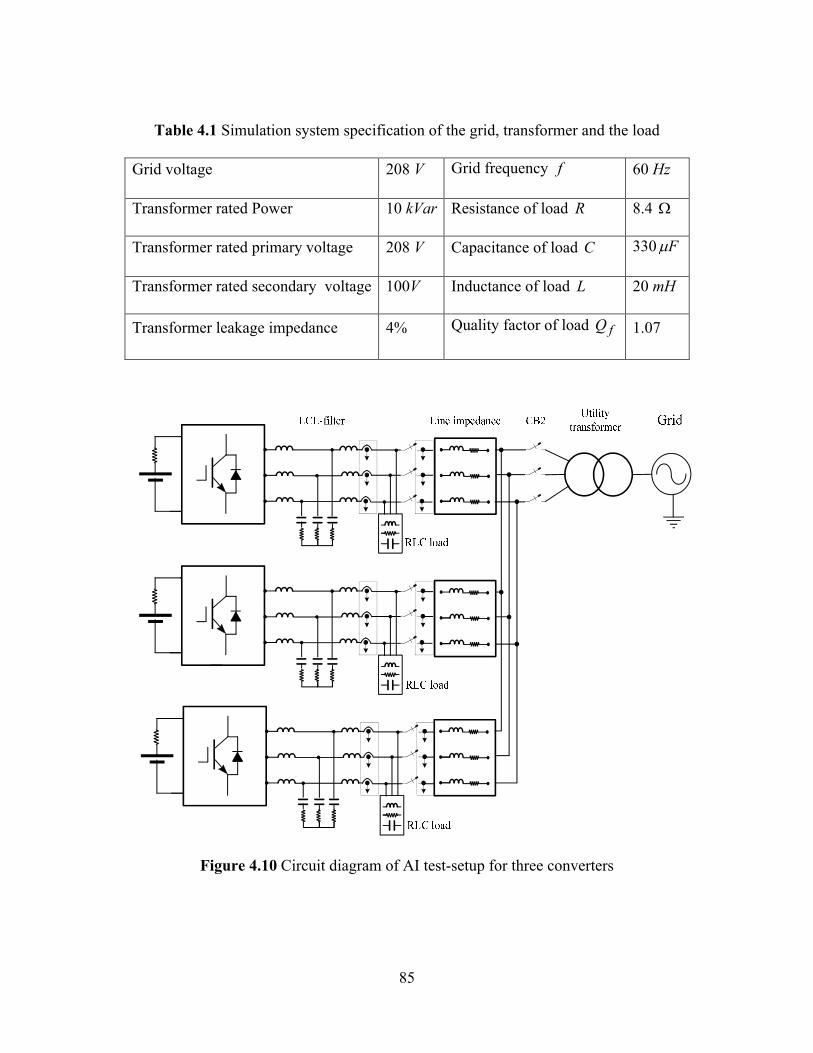
85
Table 4.1 Simulation system specification of the grid, transformer and the load
Figure 4.10 Circuit diagram of AI test-setup for three converters
Grid voltage 208 V Grid frequency f 60 Hz
Transformer rated Power 10 kVar Resistance of load R 8.4
Transformer rated primary voltage 208 V Capacitance of load C 330 F
Transformer rated secondary voltage 100V Inductance of load L 20 mH
Transformer leakage impedance 4% Quality factor of load fQ 1.07
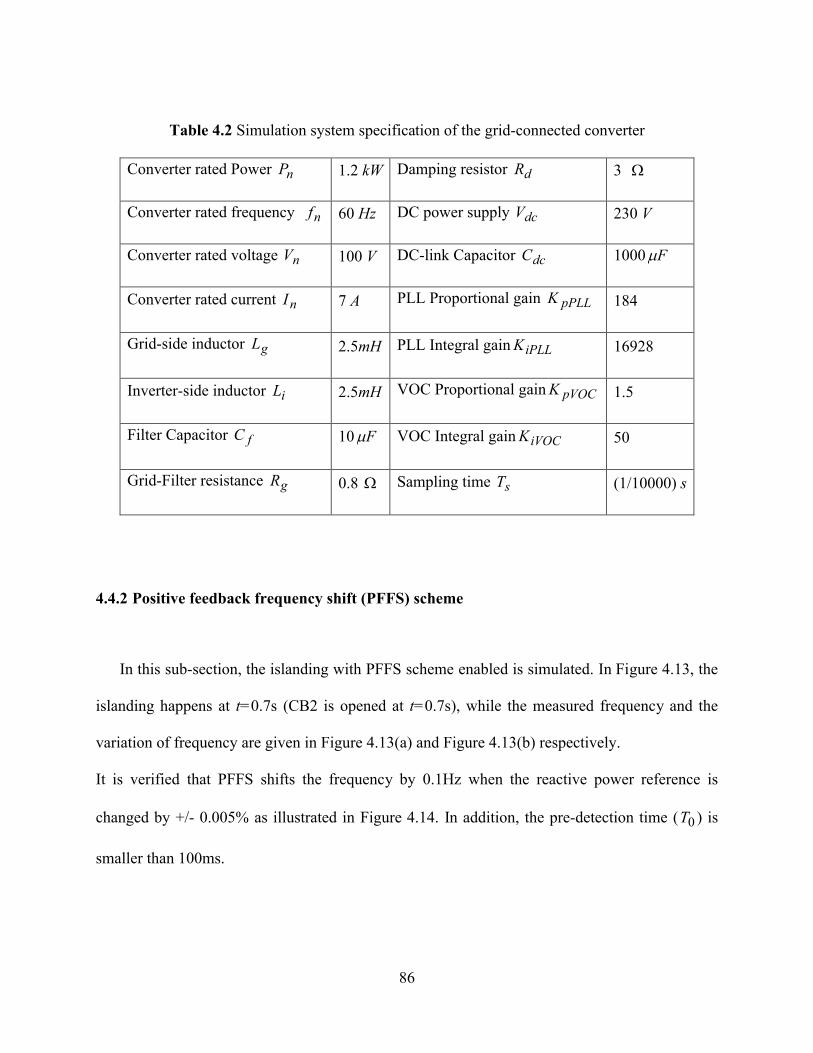
86
Table 4.2 Simulation system specification of the grid-connected converter
4.4.2 Positive feedback frequency shift (PFFS) scheme
In this sub-section, the islanding with PFFS scheme enabled is simulated. In Figure 4.13, the
islanding happens at t=0.7s (CB2 is opened at t=0.7s), while the measured frequency and the
variation of frequency are given in Figure 4.13(a) and Figure 4.13(b) respectively.
It is verified that PFFS shifts the frequency by 0.1Hz when the reactive power reference is
changed by +/- 0.005% as illustrated in Figure 4.14. In addition, the pre-detection time ( 0T ) is
smaller than 100ms.
Converter rated Power nP 1.2 kW Damping resistor dR 3
Converter rated frequency nf 60 Hz DC power supply dcV 230 V
Converter rated voltage nV 100 V DC-link Capacitor dcC 1000 F
Converter rated current nI 7 A PLL Proportional gain pPLLK 184
Grid-side inductor gL 2.5mH PLL Integral gain iPLLK 16928
Inverter-side inductor iL 2.5mH VOC Proportional gain pVOCK 1.5
Filter Capacitor fC 10 F VOC Integral gain iVOCK 50
Grid-Filter resistance gR 0.8 Sampling time sT (1/10000) s

87
-1250
-1200
-1150)(WPGCC
Islanding
-50
0
50)(VarQGCC
-1
0
1
)(
-1
0
1
)(
(a) Converter active power
(b) Converter reactive power
(c) Converter output current
(d) Converter output voltage
0.55 0.6 0.65 0.7 0.75 0.8375
376
377
378
379
sec)/(rad
(e) Measured frequency(sec)
Figure 4.11 The islanding with zero mismatches in active and reactive power

88
)( puvdg
)( puvqg
Figure 4.12 Converter output voltage dq components
)(Hzf
sec2.0)(Hzf
4.13 Positive feedback frequency shift (PFFS) scheme to pre-detect islanding
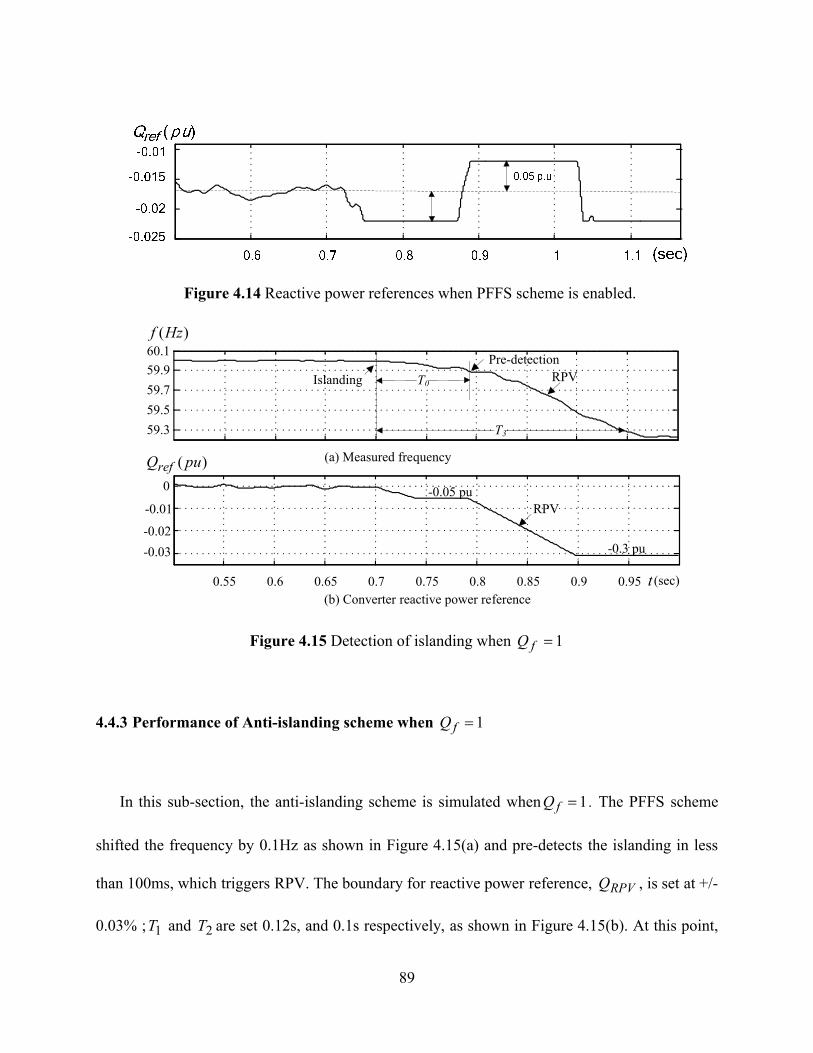
89
Figure 4.14 Reactive power references when PFFS scheme is enabled.
59.3
59.5
59.7
59.9
60.1
0.55 0.6 0.65 0.7 0.75 0.8 0.85 0.9 0.95
-0.03
-0.02
-0.01
0
(sec)t
Islanding T0
Pre-detection
RPV
RPV
T3
)(Hzf
)( puQref
-0.05 pu
-0.3 pu
(a) Measured frequency
(b) Converter reactive power reference
Figure 4.15 Detection of islanding when 1fQ
4.4.3 Performance of Anti-islanding scheme when 1fQ
In this sub-section, the anti-islanding scheme is simulated when 1fQ . The PFFS scheme
shifted the frequency by 0.1Hz as shown in Figure 4.15(a) and pre-detects the islanding in less
than 100ms, which triggers RPV. The boundary for reactive power reference, RPVQ , is set at +/-
0.03% ; 1T and 2T are set 0.12s, and 0.1s respectively, as shown in Figure 4.15(b). At this point,

90
the frequency is shifted out of the acceptable range (i.e. 60.5Hz). Moreover, it can be seen that
the detection time ( 3T ) is smaller than 2s .It is also verified that 3T 0T + msT 501 .
4.4.4 Performance of Anti-islanding scheme when 5.2fQ
In this sub-section, the anti-islanding scheme is simulated when 5.2fQ . The PFFS scheme
shifted the frequency by 0.1Hz as shown in Figure 4.16, and pre-detects the islanding in less than
100ms, which triggers RPV. The boundaries for PFFSQ and RPVQ are increased to +/- 1.25%,
and +/- 0.0625% respectively; 1T and 2T are set to 0.22s, and 0.1s respectively. Therefore, the
frequency is shifted out of the acceptable range (i.e. 60.5Hz). Moreover, it can be seen that the
detection time ( 3T ) is smaller than 2s. In addition, it is verified that 3T 0T + msT 501 . The
non-detection zone can be adjusted by changing the boundaries for PFFSQ and RPVQ .
)(Hzf
Figure 4.16 Detection of islanding when 5.2fQ

91
4.4.5 Performance of Anti-islanding scheme when %50GCCP
In this sub-section, the anti-islanding scheme is simulated when %50GCCP and 1fQ .
The PFFS scheme shifted the frequency by 0.1Hz, as shown in Figure 4.17, and pre-detects the
islanding in less than 100ms, which triggers RPV. The boundary for PFFSQ and RPVQ are
decreased to +/- 0.0025 %, and +/- 0.015 % respectively; 1T and 2T are set 0.12s, and 0.1s
respectively. It is verified that the frequency is shifted out of the acceptable range (i.e. 59.3Hz);
moreover, it can be seen that the detection time ( 3T ) is smaller than 2s. It is also verified that
3T 0T + msT 501 .
)(Hzf
Figure 4.16 Detection of islanding when %50GCCP
4.4.6 Performance of PFFS scheme with three converters paralleled
In this sub-section, the PFFS scheme when three converters are connected to the grid is
simulated (Figure 4.10). In Figure 4.13, the islanding happens at t=0.7s (CB2 is opened at
t=0.7s), while the measured frequencies are illustrated in Figure 4.17(a), (b) and (c).

92
It is verified that the PFFS shifts the frequency by 0.1Hz for every converter as illustrated in
Figure 4.17. It is also demonstrated that pre-detection time ( 0T ) is smaller than 100 ms for all
converters.
59.8
60
60.2
59.8
60
60.2
0.5 0.6 0.7 0.8 0.9 1 1.1
59.8
60
60.2
)(1 Hzf
)(2 Hzf
)(3 Hzf
(sec)t
(a) Measured frequency by converter #1
(b) Measured frequency by converter #2
(c) Measured frequency by converter #3
T0
T0
T0
Figure 4.17 Positive feedback frequency shift (PFFS) scheme for three converters paralleled.
4.5 Anti-islanding performance comparison
As shown earlier in Table 3.1 anti-islanding methods are benchmarked based on the three main
criteria 1) Reliability, 2) Maintaining power quality and 3) multiple-converters application [1].

93
4.5.1 Reliability
The PFFS pre-detection scheme, similar to other frequency shift methods like GEFS, RPV,
SFS, and SMS, is affected by the quality factor of the load. Therefore, as already shown in
Equation 4.13, the more quality factor of load, the higher the variation of reactive power is
required in order to change the frequency by 0.1Hz. As a result, this method exhibits similar
performance in terms of reliability compared to other frequency shift methods and the NDZ can
be eliminated in all practical situations.
4.5.2 Maintaining power quality
Many of the active AI methods, such as the Sandia Frequency Shift (SFS), Sandia Voltage
Shift (SVS), Active Frequency Drift with Pulse Chopping Factor (AFDPCF), and Active
Frequency Drift (AFD) degrade power quality, since they continuously inject disturbance into
the network. In the proposed method, the active method to detect islanding is triggered only
when is called upon by PFFS. Therefore this method will not have an effect on the power factor
(PF), total harmonic distortion (THD) and the stability of the network. As a result, this method
exhibits superior performance in terms of maintaining power quality compared to other AI
methods.
4.5.3 Multiple–converters application
Many of the active AI methods such as Active Frequency Drift with Pulse Chopping Factor
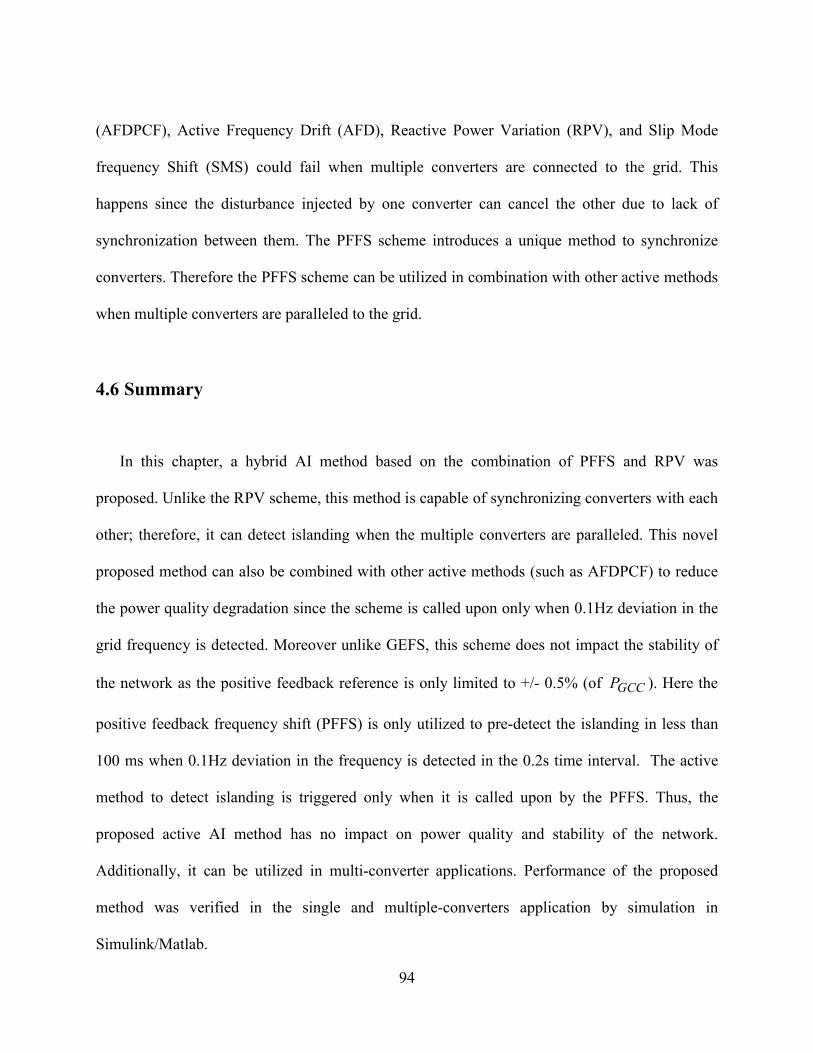
94
(AFDPCF), Active Frequency Drift (AFD), Reactive Power Variation (RPV), and Slip Mode
frequency Shift (SMS) could fail when multiple converters are connected to the grid. This
happens since the disturbance injected by one converter can cancel the other due to lack of
synchronization between them. The PFFS scheme introduces a unique method to synchronize
converters. Therefore the PFFS scheme can be utilized in combination with other active methods
when multiple converters are paralleled to the grid.
4.6 Summary
In this chapter, a hybrid AI method based on the combination of PFFS and RPV was
proposed. Unlike the RPV scheme, this method is capable of synchronizing converters with each
other; therefore, it can detect islanding when the multiple converters are paralleled. This novel
proposed method can also be combined with other active methods (such as AFDPCF) to reduce
the power quality degradation since the scheme is called upon only when 0.1Hz deviation in the
grid frequency is detected. Moreover unlike GEFS, this scheme does not impact the stability of
the network as the positive feedback reference is only limited to +/- 0.5% (of GCCP ). Here the
positive feedback frequency shift (PFFS) is only utilized to pre-detect the islanding in less than
100 ms when 0.1Hz deviation in the frequency is detected in the 0.2s time interval. The active
method to detect islanding is triggered only when it is called upon by the PFFS. Thus, the
proposed active AI method has no impact on power quality and stability of the network.
Additionally, it can be utilized in multi-converter applications. Performance of the proposed
method was verified in the single and multiple-converters application by simulation in
Simulink/Matlab.
95
Chapter Five Experimental Verification
This chapter presents the experimental verification of the proposed anti-islanding
detection method for the three-phase grid-connected converter. A prototype of the low-
power grid-connected converter is built based on the dSPACE prototyping system.
Details of hardware and software for the system are presented. Experimental results are
provided to verify the performance of the proposed active anti-islanding scheme.
5.1 Hardware implementation
Hardware configuration for the three-phase, grid-connected converter based on the
dSPACE prototyping system is given in Figure 5.1, where the photovoltaic or wind
system is replaced by a DC power supply. A small resistor ( iR ) in the series with DC
power supply limits the charging current of the DC-link capacitor and also decouples
voltage between the DC power supply and PWM rectifier. Three-phase voltages at grid
side ( gv ) and three-phase currents ( gi ) at the converter output terminals are sensed,
which are used for VOC controller. The Utility transformer is employed to isolate grid
voltage from the DC power supply and also to reduce the operating voltage of the grid-
connected converter for safety. An LCL-filter ( iL , gL , fC ) along with a damping
resistor ( dR ) are adopted to meet the grid code. An RLC load is sized with unity quality
factor and based on nominal power of a converter as required by IEEE Std. 1547.

96
dRfC
Figure 5.1 Prototype of AI test-setup based on dSPACE
The interface between the controller and the converter is achieved through a dSPACE
CP1103 I/O board and TTL/CMOS voltage level conversion board. The TTL/CMOS
board converts dSPACE CP1103 I/O PWM signals of 0/+10 V to 0/+15 V as required by
Semiteach Three-phase IGBT inverter. Voltage and current samples are also acquired by
CP1103 I/O board and fed as digital signals into the dSPACE DS1103 PPC controller
board. The dSPACE DS1103 functions as the real time controller for the grid-connected
converter. The microprocessor of the DS1103 board is a PowerPC 604e/333MHz. The
controller communicates with the PC through a DS814 board installed in the ISA slot.
5.2 Software implementation
The control program is written in the MATLAB/Simulink environment. The dSPACE
real-time interface installed in the Simulink software converts a written program in the
MATLAB/Simulink into assembly instructions readable for the DS1103 board.

97
ControlDesk software from dSPACE is used as a human machine interface (HMI) and
serves to provide instrumentation, parameterization, measurements and experiment
control.
5.3 Experimental results
To verify the proposed anti-islanding method, experiment results are provided in this
section for, 1) Converter connected to the grid, 2) Converter Islanding with zero
mismatch in active and reactive powers, 3) PFFS scheme, 4) Anti-islanding scheme when
1fQ .
The experimental system specification of the grid, transformer, load and grid-connected
converter are listed in Table 5.1 and 5.2 respectively.
Table 5.1 Experimental system specification of the grid, transformer and the load
Grid voltage 208 V Grid frequency nf 60 Hz
Transformer rated Power 10 kVar Resistance of load R 8.4
Transformer rated primary voltage 208 V Capacitance of load C 330 F
Transformer rated secondary voltage 102 V Inductance of load L 20 mH
Transformer leakage impedance 4% Quality factor of load fQ 1.07
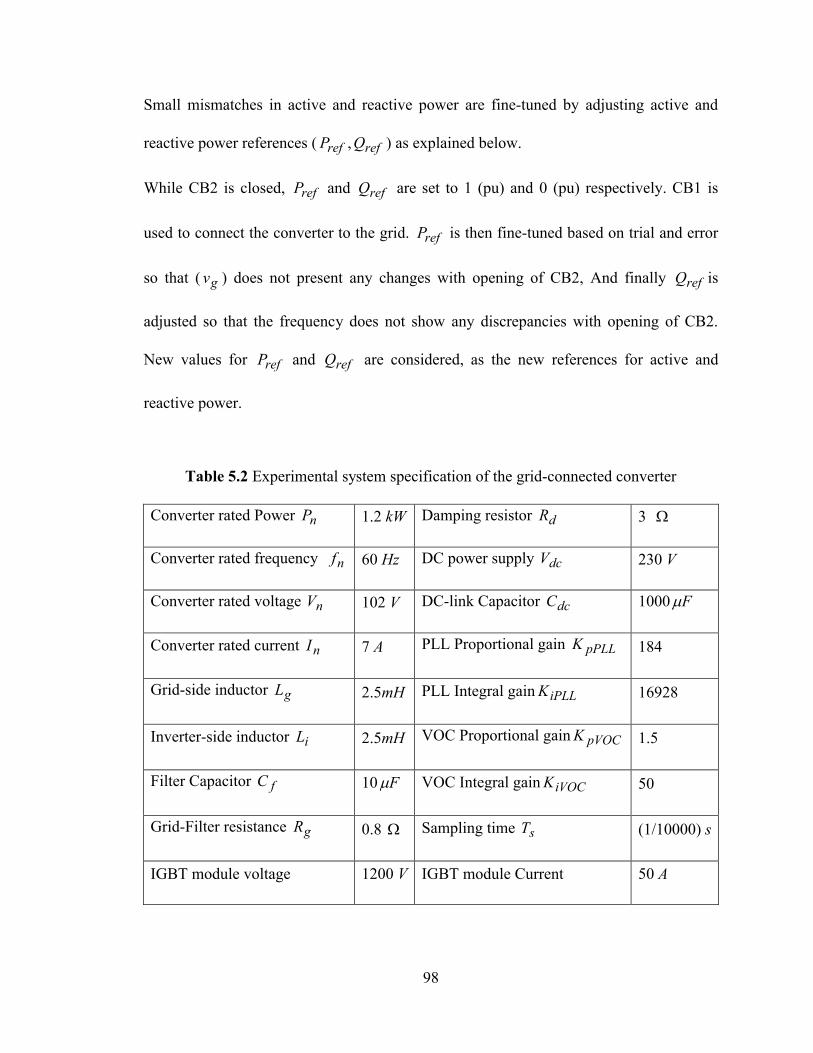
98
Small mismatches in active and reactive power are fine-tuned by adjusting active and
reactive power references ( refP , refQ ) as explained below.
While CB2 is closed, refP and refQ are set to 1 (pu) and 0 (pu) respectively. CB1 is
used to connect the converter to the grid. refP is then fine-tuned based on trial and error
so that ( gv ) does not present any changes with opening of CB2, And finally refQ is
adjusted so that the frequency does not show any discrepancies with opening of CB2.
New values for refP and refQ are considered, as the new references for active and
reactive power.
Table 5.2 Experimental system specification of the grid-connected converter
Converter rated Power nP 1.2 kW Damping resistor dR 3
Converter rated frequency nf 60 Hz DC power supply dcV 230 V
Converter rated voltage nV 102 V DC-link Capacitor dcC 1000 F
Converter rated current nI 7 A PLL Proportional gain pPLLK 184
Grid-side inductor gL 2.5mH PLL Integral gain iPLLK 16928
Inverter-side inductor iL 2.5mH VOC Proportional gain pVOCK 1.5
Filter Capacitor fC 10 F VOC Integral gain iVOCK 50
Grid-Filter resistance gR 0.8 Sampling time sT (1/10000) s
IGBT module voltage 1200 V IGBT module Current 50 A

99
5.3.1 Converter connected to the grid
The results obtained for the voltage, current and the grid phase angle when the
converter operates at nominal power, is given in Figure 5.2. The reactive power is set to
zero, therefore a 180 degree phase shift is observed between the converter’s current and
the grid voltage. It is also verified that THD of the current is smaller than 2%. In Figure
5.3, the VOC response to the step change of the converter’s active power reference is
illustrated.
The converter’s current and its dq components when the converter outputs are set to
100 and 50% of its nominal value are illustrated in Figure 5.4 and 5.5 respectively. PLL
response during start-up is presented in Figure 5.6. It is verified that the settling time of
PLL is 50 milliseconds.
gi
gv
g
Figure 5.2 the grid-connected converter operating at nominal power
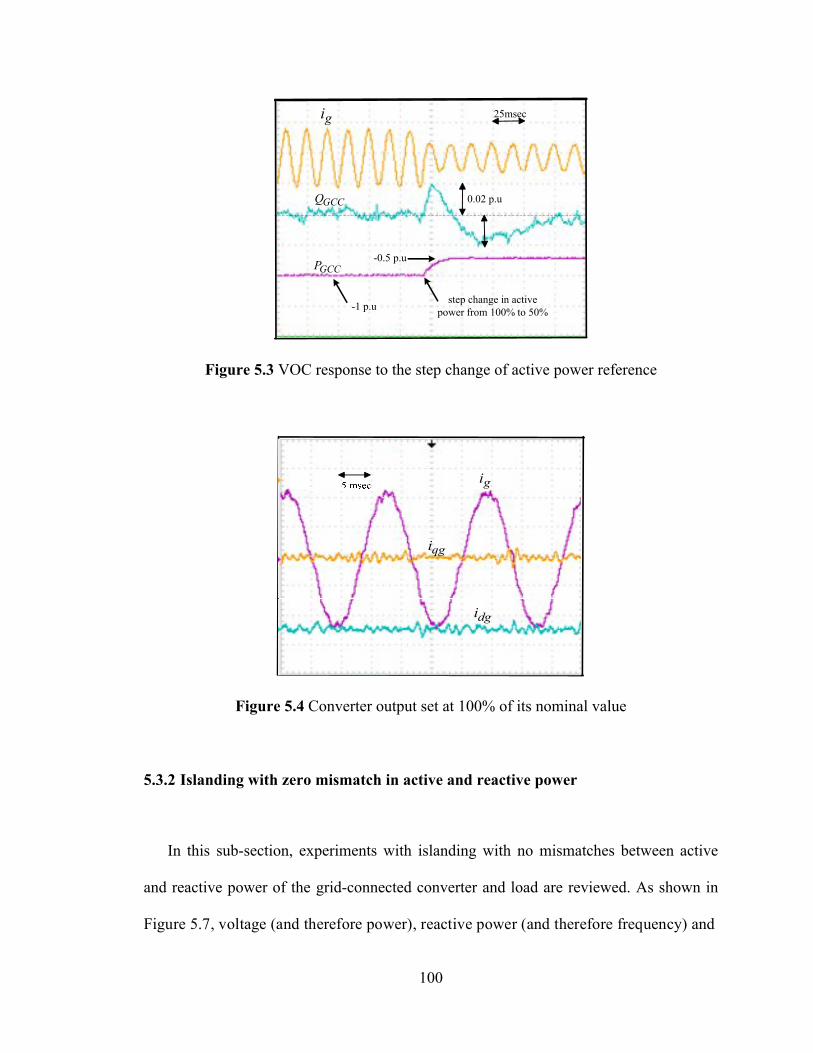
100
25msec
GCCQ
gi
step change in active power from 100% to 50%
GCCP
-1 p.u
-0.5 p.u
0.02 p.u
Figure 5.3 VOC response to the step change of active power reference
gi
dgi
qgi
Figure 5.4 Converter output set at 100% of its nominal value
5.3.2 Islanding with zero mismatch in active and reactive power
In this sub-section, experiments with islanding with no mismatches between active
and reactive power of the grid-connected converter and load are reviewed. As shown in
Figure 5.7, voltage (and therefore power), reactive power (and therefore frequency) and

101
the current are equal before and after islanding.
gi
dgi
qgi
Figure 5.5 Converter output set at 50% of its nominal value
gi
gv
qgv
Figure 5.6 PLL response during start-up
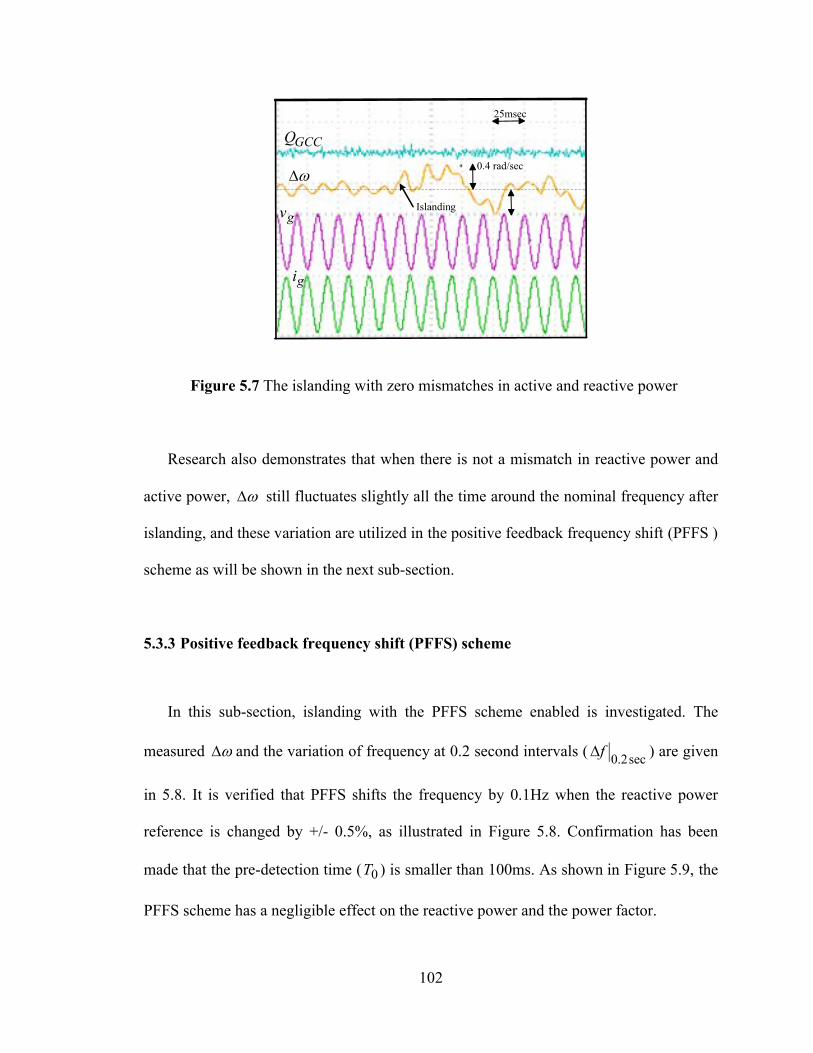
102
25msec
0.4 rad/sec
GCCQ
gi
gv Islanding
Figure 5.7 The islanding with zero mismatches in active and reactive power
Research also demonstrates that when there is not a mismatch in reactive power and
active power, still fluctuates slightly all the time around the nominal frequency after
islanding, and these variation are utilized in the positive feedback frequency shift (PFFS )
scheme as will be shown in the next sub-section.
5.3.3 Positive feedback frequency shift (PFFS) scheme
In this sub-section, islanding with the PFFS scheme enabled is investigated. The
measured and the variation of frequency at 0.2 second intervals ( sec2.0f ) are given
in 5.8. It is verified that PFFS shifts the frequency by 0.1Hz when the reactive power
reference is changed by +/- 0.5%, as illustrated in Figure 5.8. Confirmation has been
made that the pre-detection time ( 0T ) is smaller than 100ms. As shown in Figure 5.9, the
PFFS scheme has a negligible effect on the reactive power and the power factor.

103
5.3.4 Performance of anti-islanding scheme when 1fQ
In this sub-section, the anti-islanding scheme is simulated when 1fQ . The PFFS
scheme shifted the frequency by 0.1Hz as shown in Figure 5.10, and pre-detects the
islanding in less than 100ms, which triggers RPV.
Islanding
250 msec
%5.0refQ
sec2.0f
0.1 Hz
Figure 5.8 PFFS scheme to pre-detect islanding
250msec
GCCQ
Islanding %5.0
Figure 5.9 Reactive power supplied by converter

104
The boundary for reactive power reference, RPVQ , is set at +/- 0.03% ; 1T and 2T are
set at 0.1 s. Experiments demonstrated that frequency is shifted out of the acceptable
range (i.e. 60.5Hz) and the converter stops itself from injecting the current. It can be seen
that the detection time ( 3T ) is smaller than 2s.
%5.0refQ
sec2.0f
3T
0T %3
gi
Figure 5.10 Detection of islanding when 1fQ (over frequency)
%5.0
refQ
sec2.0f
3T
0T %3
gi
Figure 5.11 Detection of islanding when 1fQ (under frequency)
105
In Figure 5.11, the proposed scheme detects the islanding when the frequency drifts
downward, which is different as the minimum required frequency shift is 0.7 Hz, whereas
it is 0.5 Hz when the frequency drifts upward.
5.4 Summary
The proposed anti-islanding method based on the combination of PFFS and RPV
are experimentally verified in this chapter. The prototype of a grid-connected converter
equipped with the proposed AI scheme was built in the laboratory, based on the dSPACE
prototyping system. Experiments are grouped into four categories: 1) steady state and
start-up performance of the grid-connected converter, 2) islanding with zero mismatch in
active and reactive power, 3) converter is only equipped with positive feedback
frequency shift (PFFS), 4) performance of the proposed AI scheme, based on the
experimental results obtained in this chapter. The following conclusion can be made:
The positive feedback frequency shift (PFFS) is only utilized to pre-detect the
islanding in less than 100 ms when 0.1Hz deviation in the frequency is detected in the
0.2s time interval. The active method to detect islanding is triggered only when is called
upon by the PFFS. Therefore, it will not have an effect on the power factor (PF), total
harmonic distortion (THD) and the stability of the network. Most of the active AI
methods, such as Sandia Frequency Shift (SFS), Sandia Voltage Shift (SVS), Active
Frequency Drift with Pulse Chopping Factor (AFDPCF), and Active Frequency Drift
(AFD) degrade power quality, since they continuously inject disturbance into the

106
network. As a result, this method exhibits superior performance in terms of maintaining
power quality compared to other AI methods.

107
Chapter Six
Conclusion
Islanding refers to the condition in which distributed generators (DGs) continue to power a
part of the network while the grid is no longer present. If islanding forms, repair crews may be
faced with unexpected live wires. The equipment of end-users could be damaged because of
changes in operating parameters. In addition, utility equipment and the islanded DGs might be
damaged during re-closing. Therefore as required by IEEE Std. 1547, the distributed generators
(including grid-connected converters) shall detect islanding and cease to inject current within
two seconds of formation of an island [1].
Converter-resident anti-islanding methods are the subject of considerable research as they
can be implemented inside converter firmware without any extra cost to the utility service
provider. They can be classified into passive and active methods. Passive methods work based on
monitoring and detection of any abnormality in the parameters of voltage measured at the
converter output terminals, whereas active methods deliberately generate a disturbance and then
monitor the response for detection.
Converter-resident anti-islanding methods are compared based on three main criteria: 1)
reliability, 2) maintaining power quality and 3) multiple-converters application. The reliability of
the passive methods is limited and therefore passive methods cannot be utilized as stand-alone
entities. In active methods the main challenges are to reduce the power quality degradation and
to make sure that the scheme is working in the multiple-converters application.
108
In this thesis, a novel active anti-islanding method for a three-phase, grid-connected
converter has been developed, simulated and investigated.
The main contributions of the thesis are summarized as follows:
1) A novel active anti-islanding detection scheme, for the three phase grid-connected
converters, has been developed. The proposed hybrid method works based on the
combination of Positive Feedback Frequency Shift (PFFS) and Reactive Power
Variation (RPV) methods, and therefore it combines the features of both methods.
The majority of the active AI methods such as Active Frequency Drift (AFD), Active
Frequency Drift with Pulse Chopping Factor (AFDPCF), Sandia Frequency Shift
(SFS), Sandia Voltage Shift (SVS) degrade power quality, since they continuously
inject disturbance into the network. In the proposed method, the active method to
detect islanding is triggered only when it is called upon by PFFS. Therefore this
method will not have an effect on the power factor (PF), total harmonic distortion
(THD) or the stability of the network. As a result, this method exhibits superior
performance in terms of maintaining power quality compared to other AI methods.
Moreover, the proposed scheme introduces a unique method to detect islanding when
multiple converters are paralleled where many of the AI methods such as Active
Frequency Drift with Pulse Chopping Factor (AFDPCF), Active Frequency Drift
(AFD), Reactive Power Variation (RPV), or the Slip Mode frequency Shift (SMS)
could fail. The proposed method employs the PFFS scheme to synchronize the
injection of the disturbance among converters, whereas in the other mentioned

109
methods the disturbance injected by one converter can cancel the effect of the other
one due to lack of synchronization between them.
2) The performance of the proposed anti-islanding scheme, when single and multiple
inverters are involved, has been verified with simulation in a Matlab/Simulink
environment.
3) The proposed anti-islanding scheme, for a three phase grid-connected converter, has
been experimentally verified. A laboratory prototype of a low-power grid-connected
converter, based on the dSPACE rapid prototyping system, was built. Experiments
were performed to verify the performance of the proposed anti-islanding method.
.
110
References
[1] Teodorescu, R.; Liserre, M.; Rodríguez , P. "Grid Converters for Photovoltaic and Wind
Power Systems", IEEE/Wiley, 2011.
[2] Bollen, M.H.; Hassan, F., "Integration of Distributed Generation in the Power System",
Wiley-IEEE Press, August 2011.
[3] Nehrir, M.H.; Wang, C., "Modeling and Control of Fuel Cells: Distributed Generation
Applications", Wiley-IEEE Press, March 2009.
[4] IEEE Std. 1547-2003, Standard for Interconnecting Distributed Resources with Electric
Power Systems, IEEE, June 2003.
[5] Bower, W., and Ropp, M., ‘Evaluation of Islanding Detection Methods for Utility-
Interactive Inverters in Photovoltaic Systems’. SANDIA Report SAND2002-3591,
Albuquerque, NM: Sandia National Labs, November 2002.
[6] IEC 61727 Ed. 2, Photovoltaic (PV) Systems – Characteristics of the Utility Interface,
December 2004.
[7] Wu, B., "High-Power Converters and AC Drives", Wiley-IEEE Press, March 2006.
[8] Liserre, M.; Blaabjerg, F.; and Hansen, S. ‘Design and Control of an LCL-Filter Based
Three-Phase Active’ Rectifier’. IEEE Transactions on Industrial Applications, 41(5),
September/October 2005, 1281–1291.
[9] Wu, B.; Lang, Y.; Zargari, N. and Kouro, S., "Power Conversion and Control of Wind
systems", Wiley-IEEE Press, 2011
[10] Buso, S.; Mattavelli, P. "Digital Control in Power Electronics",Morgan & Claypool
Publisher, 2006.

111
[11] Evju, E. ‘Fundamentals of Grid Connected Photo-Voltaic Power Electronic Converter
Design’ Master of Science in Energy and Environment Thesis, Norwegian University of
Science and Technology, June 2007.
[12] Liserre, M., Blaabjerg, F. and Dell’Aquila, A., ‘Step-by-Step Design Procedure for a Grid-
Connected Three-Phase PWM Voltage Source Converter’. International Journal of
Electronics, 91(8), August 2004, 445–460.
[13] Yazdani A. and Iravani R., Voltage-Sourced Converters in Power Systems. Piscataway,
NJ: IEEE/Wiley, Feb. 2010.
[14] Ye, Z., Kolwalkar, A., Zhang, Y., Du, P. and Walling, R., ‘Evaluation of Anti-islanding
Schemes Based on Nondetection Zone Concept’. IEEE Transactions on Power
Electronics,19(5), September 2004, 1171–1176.
[15] Ye, Z., Walling, R., Garces, L., Zhou, R., Li, L. and Wang, T., ‘Study and Development of
Anti-Islanding Control for Grid-Connected Inverters’. Report NREL/SR-560-36243,
Golden, CO: National Renewable Energy Laboratory, May 2004.
[16] S.-K. Kim, J.-H. Jeon, H.-K. Choi, and J.-B. Ahn, “Design of frequency shift acceleration
gain for anti-islanding of an inverter-based DG,” in Proc. 13th EPE-PEMC, Sep. 2008, pp.
2555–2560.
[17] Ropp, M. E., Begovic, M. and Rohatgi, A., ‘Analysis and Performance Assessment of the
Active Frequency Drift Method of Islanding Prevention’. IEEE Transaction on Energy
Conversion, 14(3), September 1999, 810–816.
[18] Jung, Y., Choi, J., Yu, B., So, J. and Yu, G., ‘A Novel Active Frequency Drift Method of
Islanding Prevention for the Grid-Connected Photovoltaic Inverter’. In IEEE 36th Power
Electronics Specialists Conference, PESC’05, 2005, pp. 1915–1921.

112
[19] Lopes, L. A. C. and Sun, H., ‘Performance Assessment of Active Frequency Drifting
Islanding Detection Methods’. IEEE Transactions on Energy Conversion, 21(1), March
2006, 171–180.
[20] Stevens, J.; Bonn, R.; Ginn J.; and Sigifredo Gonzalez Development and Testing of an
Approach to Anti-Islanding in Utility-Interconnected Photovoltaic Systems SANDIA
Report SAND2000-1939, Albuquerque, NM: Sandia National Labs, August 2000.
[21] Lopes, L. A. C. and Sun, H., ‘Performance Assessment of Active Frequency Drifting
Islanding Detection Methods’. IEEE Transactions on Energy Conversion, 21(1), March
2006, 171–180.
[22] Jeong, J.B., Kim, H.J., Ahn, K.S. and Kang, C.H., ‘A Novel Method for Anti-Islanding
Using Reactive Power’. in 27th International Telecommunications Conference, INTELEC
’05, September 2005, pp. 101–106.
[23] Ciobotaru, M., Teodorescu, R. and Blaabjerg, F., ‘On-line Grid Impedance Estimation
Based on Harmonic Injection for Grid-Connected PV Inverter’.In IEEE International
Symposium on Industrial Electronics, ISIE 2007, 4–7 June 2007, pp. 2437–2442.
[24] Ciobotaru, M., Teodorescu, R., Rodriguez, P., Timbus, A. and Blaabjerg, F., ‘Online Grid
Impedance Estimation for Single-Phase Grid-Connected Systems Using PQ Variations’. In
IEEE Power Electronics Specialists Conference, PESC 2007, 17–21 June 2007, pp. 2306–
2312.
[25] Karimi, H.; Yazdani, A.; Iravani, R.; , "Negative-Sequence Current Injection for Fast
Islanding Detection of a Distributed Resource Unit," Power Electronics, IEEE
Transactions on , vol.23, no.1, pp.298-307, Jan. 2008
113
[26] Bahrani, B.; Karimi, H.; Iravani, R.; , "Nondetection Zone Assessment of an Active
Islanding Detection Method and its Experimental Evaluation," Power Delivery, IEEE
Transactions on , vol.26, no.2, pp.517-525, April 2011
[27] Jeraputra, C.; Aeloiza, E.C.; Enjeti, P.N.; Choi, S.; , "An improved anti-islanding algorithm
for utility interconnection of multiple distributed fuel cell powered generations," Applied
Power Electronics Conference and Exposition, 2005. APEC 2005. Twentieth Annual IEEE,
vol.1, no., pp.103-108 Vol. 1, 6-10 March 2005.
[28] Seul-Ki Kim; Jin-Hong Jeon; Jong-Bo Ahn; Byongjun Lee; Sae-Hyuk Kwon; , "Frequency-
Shift Acceleration Control for Anti-Islanding of a Distributed-Generation Inverter,"
Industrial Electronics, IEEE Transactions on , vol.57, no.2, pp.494-504, Feb. 2010.
Top Related