


Languages
Pages
Legal


A Data Mining-Based OLAP Aggregation
1
Running head: A DATA MINING-BASED OLAP AGGREGATION
A Data Mining-Based OLAP Aggregation of
Complex Data: Application on XML Documents
Riadh Ben Messaoud, Omar Boussaid, Sabine Loudcher Rabaséda
rbenmessaoud | omar.boussaid | [email protected]
Laboratory ERIC - University of Lyon 2
5 avenue Pierre Mendès-France
69676, Bron Cedex – France
http://eric.univ-lyon2.fr/
A Data Mining-Based OLAP Aggregation
2
ABSTRACT
Nowadays, most organizations deal with complex data having different formats and coming
from different sources. The XML formalism is evolving and becoming a promising solution
for modelling and warehousing these data in decision support systems. Nevertheless, classical
OLAP tools are still not capable to analyze such data. In this paper, we associate OLAP and
data mining to cope advanced analysis on complex data. We provide a generalized OLAP
operator, called OpAC, based on the AHC. OpAC is adapted for all types of data since it deals
with data cubes modelled within XML. Our operator enables significant aggregates of facts
expressing semantic similarities. Evaluation criteria of aggregates’ partitions are proposed in
order to assist the choice of the best partition. Furthermore, we developed a Web application
for our operator. We also provide performance experiments and drive a case study on XML
documents dealing with the breast cancer researches domain.
Keywords: OLAP; data warehouse; data mining; aggregation; agglomerative hierarchical
clustering; evaluation of aggregates, XML documents

A Data Mining-Based OLAP Aggregation
3
INTRODUCTION
Data warehouses were introduced to provide a support enabling to make decisions
from huge amounts of data. A data warehouse is an analysis oriented structure that stores a
large collection of subject oriented, integrated, time variant and non-volatile data (Kimball,
1996; Inmon, 1996). Online analytical processing (OLAP) is a key feature supported by most
data warehouse systems. Based on visualization techniques (Maniatis et al., 2005), OLAP
tools enable exploration and navigation into multidimensional data views, commonly called
data cubes, in order to present interesting information to end users and decision makers.
A data cube is a multidimensional data model used to conceptualize data in a data
warehouse (Chaudahuri & Dayal, 1997). The data cube contains facts or cells that are
measures or values based on a set of dimensions where each dimension consists in a set of
categorical descriptors, called attributes, and it may be organized within hierarchical
structures. Consider for example a retail sales application where the dimensions of interest
may include, Costumer, Product, Location, and Time. If the measure of interest in this
application is sales amount, then an OLAP fact represents the sales measure corresponding to
the previous dimensions according to a single attribute in each dimension.
Dimensions often form a hierarchy. For instance, the Time dimension may form a
day-month-year hierarchy, and the Location dimension may form a city-state-
region hierarchy. Dimensions allow different levels of granularity in the warehouse. For
example, a region corresponds to a high level of granularity whereas a city corresponds
to a low level of granularity. Classical aggregation in OLAP is considered the process of
consolidating data values into a single and summarized one by moving from a hierarchical
level of a dimension to a higher one. Typically, additive data are well suited to be aggregated
by elementary operations (Sum, Average, Max, Min and Count) in a simple computation of

A Data Mining-Based OLAP Aggregation
4
measures. For example, a user wants to observe the sum of sales amount of products
according to years and regions. This aggregation should use attributes to describe the targeted
facts and make computation over their measures.
In the recent years, as more organizations see the web as an integral part of their
communication and business, we have been dealing with a proliferation of new data formats.
These data are complex and quite different and harder to treat than classical ones. They need
new methodologies to be warehoused first, and then to be analyzed. XML (eXtensible
Markup Language) is providing some promising solutions for integrating complex
information from different sources and warehousing them. Many recent works have proposed
some modellingapproaches for XML data warehouses (Golfarelli, Rizzi & Vrdoljak, 2001;
Trujillo, Mora & Song, 2004; Pokornỷ, 2001; Baril & Bellahsène, 2000; Hümmer, Bauer &
Harde, 2003; Rusu, Rahayu & Taniar, 2005; Nassis, Rajagopalapillai, Dillon & Rahayu,
2005). The general purpose of these approaches is to design or to feed warehouse through the
XML formalism. For instance, Golfarelli et al. (2001) affirm that the use of XML will become
a standard for warehousing heterogeneous and complex data in the next few years. This
evolution in the way of warehousing complex data has some drawbacks on modellingand
analysis tasks. In fact, classical OLAP tools are unsuitable and unable to deal with complex
data. For example, when treating images, sounds, videos, texts or even XML documents,
aggregating information with the classical OLAP does not make sense. Indeed, we are not
able to compute a sum or an average operation over such kinds of data.
However, when users analyze complex data, they need more expressive aggregates
than those created from elementary computation of additive measures. We think that OLAP
facts representing complex objects need appropriate tools and new ways of aggregation since
we wish to analyze them. To summarize information about complex data, we should rather
gather their similar facts into a single group and separate dissimilar facts into different groups.

A Data Mining-Based OLAP Aggregation
5
In this case, it is necessary to consider an aggregation by computing both descriptors and
measures. Instead of grouping facts only by computing their measures, we also take their
descriptors into account to obtain aggregates expressing semantic similarities. In order to do
so, we intend to couple OLAP with data mining to create a new type of online aggregation of
complex data.
OLAP and data mining can be viewed as two complementary fields. Associating them
can be a solution to cope with their respective defects. In fact, on the one hand, when
supported by database systems, OLAP has a powerful ability to organize views and structure
data adapted to analysis, but it is restricted to simple navigation and exploration of data which
weakens its analysis power. On the other hand, data mining is not very powerful for
organizing data, but it is known for its descriptive and predictive power, which can discover
knowledge from both simple and complex data. The general issue of coupling data mining
with database systems was already discussed and motivated by Imielinski and Mannila
(1996). The authors argue that data mining sets new challenges to database technology. Their
combination will lead to a second generation of database systems able to manage KDD
(Knowledge Discovery in Databases) applications just as classical ones manage business
applications.
Furthermore, a data cube structure can provide a suitable context for applying data
mining methods. More generally, the association of OLAP and data mining allows elaborated
analysis tasks exceeding the simple exploration of a data cube. Our idea is to take advantage
from OLAP as well as data mining techniques and to integrate them to the same analysis
framework in order to analyze complex objects. In spite of the fact that both OLAP and data
mining were considered two separate fields for a long, several recent works proved the
capability of their association to provide interesting analysis process. In addition to these
works, we have already proposed in (Messaoud, Boussaid & Rabaséda, 2004) a new OLAP

A Data Mining-Based OLAP Aggregation
6
operator, called OpAC (Operator for Aggregation by Clustering), that combines OLAP with
an automatic clustering technique. We use the Agglomerative Hierarchical Clustering (AHC)
as an aggregation strategy for complex data. We proved the interest of this new operator and
its efficiency in creating semantic aggregates over an images data cube. More generally, the
aggregates provided by OpAC give interesting knowledge about the analyzed domain.
In this paper, we propose a generalization of our operator which enables to deal with
all types of data by handling a data cube modeled and fed directly by XML sources. In fact,
since XML is able to represent and structure complex objects collected from different sources
and which have different formats (Darmont, Boussaid, Bentayeb, Rabaséda & Zellouf, 2003),
adapting OpAC to XML will lead to a considerable generalization of its analysis capability. In
order to validate this generalization on a real world domain, we base our current study on
screening mammography data taken from the breast cancer researches. We have structured
these data as XML documents and have modeled them on a multidimensional data cube.
Furthermore, we also propose some evaluation criteria that support the results of our operator.
These criteria aim at assisting the user and helping him/her to choose the best partition of
aggregates that will fit well with his/her analysis requirements.
The development of this paper is organized as follows. In the second section, we
expose a state of the art of works that combine OLAP and data mining. In the third section,
we present an overview of our approach. We also introduce the general context, the XML
screening mammography data cube, and the objectives of our operator. In the fourth section,
we develop a formal background of our approach. The fifth section is a presentation of the
criteria we propose to evaluate the results of our approach. In the sixth section, we describe
the architecture of a Web platform, called MiningCubes , which we have developed to
validate our generalized approach. We also achieve some experiments concerning the
performance and the time processing of this Web application. In the seventh section, we

A Data Mining-Based OLAP Aggregation
7
propose a case study on the XML documents that represent a screening mammography data
cube. Finally, in the eighth section, we draw conclusions from this work and propose some
future research directions.
RELATED WORK TO COUPLING OLAP AND DATA
MINING
The major difficulty of combining OLAP and data mining is that traditional data
mining algorithms are mostly designed with tabular datasets organized in individuals-
variables form (Fayyad, Shapiro, Smyth & Uthurusamy, 1996). Therefore, multidimensional
data are not suited for these algorithms. Nevertheless, a lot of previous works motivated and
proved an interest of coupling OLAP with data mining methods. We distinguish three major
approaches in this field.
The first approach tries to extend the query language of decision support systems in
order to achieve data mining tasks. DBMiner system, proposed by Han (1998), summarizes
this approach. Some extended OLAP operators perform data mining methods such as
association, classification, prediction, clustering and sequencing. Han defines the OLAP
Mining as a new concept that integrates OLAP technology with data mining techniques and
allows to perform analysis on different portions and levels of abstraction of a data cube. He
also introduces the OLAM (On-Line Analytical Mining) as a process of extracting knowledge
from multidimensional databases. He expects that, in the future, OLAM will be a natural
addition to OLAP technology that enhances the power of multidimensional data analysis.
Chen, Dayal and Hsu (2000) discover behavior patterns by mining association rules about
customers from transactional e-commerce data. They extend OLAP functions and use a
distributed OLAP server with a data mining infrastructure and the resulting association rules

A Data Mining-Based OLAP Aggregation
8
are represented in particular cubes called Association Rule Cubes . Goil and
Choudhary (1998) think that dimension hierarchies can be used to provide interesting
information at multiple concept levels. Their approach summarizes information in a data
cube, extends OLAP operators and mines association rules. Some other works consist in
integrating mining functions in the database system using SQL. Chaudhuri (1998) argues that
data mining promises a giant leap over OLAP. He proposes a data mining system based on
extending SQL and constructs data mining methods over relational databases. Chaudhuri,
Fayyad and Bernhardt (1997) developed a client-server middleware that performs a decision
tree classifier over MS SQL Server 7.0 . Meo, Psaila and Ceri (1996) propose a model
that enables a uniform description for the problem of discovering association rules. The model
also extends SQL and provides an operator called MINE RULE.
The second approach consists in adapting multidimensional data inside or outside the
database system and applies classical data mining algorithms on the resulting datasets. This
approach can be viewed according to two strategies. The first one consists in taking advantage
from multidimensional database management system (MDBMS) in order to help the
construction of learning models. In (Laurent, Bouchon-Meunier, Doucet, Gançarski &
Marsala, 2000), the authors propose a cooperation between Oracle Express and a fuzzy
decision tree software (Salammbô). This cooperation allows transferring learning tasks,
storage constraints and data handling to the MDBMS. The second strategy transforms
multidimensional data and makes them usable by data mining methods. For instance, Pinto et
al. (2001) integrate multidimensional information in data sequences and apply on them the
discovery of frequent patterns. In order to apply decision trees on multidimensional data, Goil
and Choudhary (2001) flatten data cubes and extract contingency matrix for each dimension
at each construction step of the tree. Chen, Zhu and Chen (2001) think that OLAP should be
A Data Mining-Based OLAP Aggregation
9
adopted as a pre-processing step in the knowledge discovery process. In the same context,
Maedche, Hotho and Wiese (2000) combine databases with classical data mining systems by
using OLAP engine as interface and treat telecommunication data. In this interface, OLAP
tools create a target data set to generate new hypotheses by applying data mining methods.
Tjioe and Taniar (2005) propose a method for mining association rules in data warehouses.
Based on the multidimensional data organization, this method is capable of extracting
associations from multiple dimensions at multiple levels of abstraction by focusing on
measurements of summarized data. In order to do this, the authors propose to prepare
multidimensional data for the mining process according to four algorithms: VAvg, HAvg,
WMAvg, and ModusFilter . These algorithms prune all rows in the fact table which have
less than the average quantity and provide an “initialized table”. The latter table is used next
for mining both on non-hybrid (non-repeatable predicate) and hybrid (repeatable predicate)
association rules. Fu (2005) proposes an algorithm, called CubeDT, for constructing decision
tree classifiers based on data cubes. This algorithm works on statistic trees which are
representations of multidimensional data especially suitable for the construction of decision
trees.
The third approach is rather based on adapting data mining methods and applying
them directly on multidimensional data. Palpanas (2000) thinks that adapting data mining
algorithms is an interesting solution to provide elaborated analysis and precious knowledge.
Parsaye (1997) claims that decision-support applications must consider data mining within
multiple dimensions. He proposes a theoretical OLAP Data Mining System that
integrates a multidimensional discovery engine in order to perform discovery along multiple
dimensions. Sarawagi, Agrawal and Megiddo (1998) propose to integrate a multidimensional
regression module, called Discovery-driven , in OLAP servers. This module guides the

A Data Mining-Based OLAP Aggregation
10
user to detect relevant areas at various hierarchical levels of a cube. In (Sarawagi, 2001), the
author proposes another tool called iDiff . It detects both relevant areas in a data cube and
the reasons of their presence. The same approach was adopted by Favero and Robin (2001) to
generate quantitative analysis reports from data cubes. They integrate in a platform, called
HYSSOP, a content determination component based on data mining methods. Imielinski,
Khachiyan and Abdulghani (2002) propose a generalized version of association rules called
Cubegrades . The authors claim that association rules can be viewed as the change of an
aggregate's measure due to a change in the cube's structure. They also introduce CGQL
language for querying the Cubegrades . Dong, Han, Lam, Pei and Wang (2001) enhanced
the Cubegrades and introduced constrained gradient analysis. Their proposition focuses on
extracting pairs of cube cells that are quite different in aggregates and similar in dimensions.
Instead of dealing with the whole cube, constraints on significance, probability, and gradient
are added to limit the search range.
These previous works have proved that associating data mining to OLAP is a
promising way to involve elaborated analysis tasks. They affirm that data mining methods are
able to extend OLAP analysis power. In addition to these works, we have proposed in
(Messaoud et al., 2004) another contribution to this field by developing an Operator for
Aggregation by Clustering called OpAC. Besides enhancing classic OLAP with a clustering
method, this operator also couples OLAP and data mining in order to deal with complex data
in multidimensional context. We have shown in (Messaoud et al., 2004) the interest of
applying our approach on a cube of images files, and we have proven the semantic
significance of its facts' aggregates. In this paper, we propose to generalize our operator and
to adapt it in order to handle XML data cubes and apply it on the breast cancer domain.

A Data Mining-Based OLAP Aggregation
11
OVERVIEW AND OBJECTIVES OF OUR APPROACH
Nowadays, in almost any area of scientific research or business application domain,
there is an increasing availability of data. These data are not only becoming larger in size, but
also in complexity. Data have different types, come from heterogeneous sources, and are
supported by different formats. Analyzing and extracting features from these data is therefore
a complex task. To learn from these data, we need analysis tools that can make sense from
them. OLAP is a powerful mean of exploring and extracting pertinent information from data
through multidimensional analysis. In this context, data are organized in multidimensional
views, commonly called data cubes. The construction of a data cube targets a precise analysis
context and describes real world facts. For instance, these facts can be viewed according to
several dimensions such as costumer, Product, Location, and Time. The choice of these
dimensions closely depends on the user and the way (s)he would like to treat the facts
analysis.
In addition to dimensions, an OLAP fact is also evaluated by a set of quantitative
measures such as revenue, profitability, and customer retention. By organizing information
into dimensions and measures, OLAP allows us to follow trends in a customer realm, spot
anomalies across products, compare annual sales in a region by product line or customer type.
Furthermore, a dimension is usually organized according to several hierarchies defining
various levels of data granularity.
Each hierarchal level contains a set of attributes (also called members), and each
attribute may conceptually include other attributes from the hierarchical level immediately
below. For example, as the Location dimension may form the hierarchy city-state-
region , the attribute California from the state level could include Los Angeles, Long
Beach, Oakland, San Diego, and Santa Monica as attributes from the city level. Therefore,

A Data Mining-Based OLAP Aggregation
12
by moving from a hierarchical level to a higher one, attributes are gathered together into
aggregates. In consequence, measures related to the attributes are computed and so
information is summarized to a small number of sets.
In many application domains, a user is sometimes faced to take critical decisions.
Analysis tools should be efficient. For instance, aggregated measures need to reflect
significant values of a set of facts sharing relation deeper than a simple order of membership.
In medicine domain, experts need to see aggregates of objects, like tumors or any other
pathology, that have a maximum number of common medical proprieties. For example, in the
breast cancer research field, associating malign and benign patients in the same aggregate can
cause dramatic consequences.
In the recent years, clinical data were widely treated by data mining techniques in
medicine outcome analysis (Chen & Liu, 2005; Hu et al., 2005). In fact, medicine is one of
the most important application domains where a lot of efforts are needed for structuring and
analysing data in order to enhance the medical sound researches. We also propose to refer our
study to an XML data cube which describes suspicious regions of tumors detected on
mammography screens. We constructed this cube from the Digital Database for Screening
Mammography (DDSM1). In the following, we present the DDSM and the XML data cube of
the screening mammography data.
Presentation of the DDSM
The DDSM is basically a resource used by the mammographic image analysis
research community in order to facilitate sound research in the development of analysis and
learning algorithms (Heath, Bowyer, Kopans, Moore & Jr, 2000). The database contains
approximately 2 600 studies, where each study corresponds to a patient case.

A Data Mining-Based OLAP Aggregation
13
Figure 1. An Example of a patient case study from the DDSM
A patient case is a collection of image and text files containing several medical
information collected along a screening mammography exam. The DDSM contains four types
of patient cases: Normal, Benign without callback, Benign, Cancer. Normal type are
mammograms from screening exams that were read as normal and had a normal screening
exam. Benign without callback cases are exams that had an abnormality that was noteworthy
but did not require the patient to be recalled for any additional workup. In Benign cases,
something suspicious was found and the patient was recalled for some additional workup that
resulted in a benign finding. Cancer type corresponds to cases in which a proven cancer was
found.
As shows Figure 1, a case consists of a set of text and image files. There are an ics
file (ASCII format) which describes general information about a patient, four LJPEG
scanner files (image compressed with lossless JPEG encoding), and zero to four OVERLAY
files. Only cases having suspicious regions in their scanner images are associated to overlay
files. Normal cases are not. An overlay file contains information about the location, the

A Data Mining-Based OLAP Aggregation
14
subtlety value, and a spatial description of the marked suspicious regions. These information
are specified by an expert mammography radiologist.
The XML Cube of the Screening Mammography Data
Since a patient study is composed by several data formats and presented on
heterogeneous supports, we consider it a complex object. To warehouse and analyze such
complex objects, first, we need to structure them and make them homogeneous as well as
possible. In order to do so, we use XML to represent these complex data of screening
mammography and model them in a data cube.
Basically, XML is considered as a particular standard syntax for the exchange of semi-
structured data. The structure of XML, composed of nested custom defined tags, can describe
the meaning of the content itself. XML documents can also be associated and validated
against either a Document Type Definition (DTD) or an XML Schema. Both of them allow
describing the structure of an XML document and to constraint its content. Nowadays, many
works addressed methodologies based on XML for multidimensional design of data
warehouses in order to integrate information from different sources (Golfarelli et al., 2001;
Trujillo et al., 2004; Pokornỷ, 2001; Baril & Bellahsène, 2000; Hümmer et al., 2003; Rusu et
al., 2005; Nassis et al., 2005). Since a large complex amount of data is needed in a decision
making process, the importance of integrating XML in data warehousing environments is
becoming increasingly high. According to Golfarelli et al. (2001), using XML sources for
designing and feeding data warehouse systems will become a standard in the next few years.
Furthermore, as XML source are becoming widely employed, we naturally expect important
evolutions of query languages to extract knowledge from them for decision supports
(Termier, Rousset & Sebag, 2002; Braga, Campi, Ceri, Klemettinen & Lanzi, 2003; Feng &
Dillon, 2005).

A Data Mining-Based OLAP Aggregation
15
In the case of the screening mammography data, an OLAP fact corresponds to a
suspicious region (abnormality) detected by an expert. The set of collected facts concerns
only Benign, Benign without callback, and Cancer patient cases. Normal cases are not
concerned since they do not contain suspicious regions. As shows the conceptual model in
Figure 2, a suspicious region can be analyzed according to several axes: the lesion type, the
assessment code, the subtlety, the pathology, the date of study, the digitizer, the patient age,
etc. A suspicious region is measured by the boundary length of its suspicious region. We have
also added the number of regions having the same abnormality per patient as a derived
measure to the data cube model.
Figure 2. Conceptual model of the screening mammography data cube
The conceptual model of the screening mammography data cube is described with an
XML Schema. An instance of this XML Schema is presented by the XML document of
Figure 3. The fact is associated to the root element of the XML schema, whereas its
dimensions correspond to sub-elements. The measures of a fact are attributes in the root
element, and the attribute value of each dimension is an attribute in the element corresponding

A Data Mining-Based OLAP Aggregation
16
to that dimension. The screening mammography data cube contains a collection of 4 686
XML documents, where each document corresponds to an OLAP fact.
Figure 3. Example of an XML document from the screening mammography data cube
Objectives of our Approach
In OLAP context, hierarchical structure of a dimension induces sets of attributes
organized according to the logical order of membership. Through a dimension, a classical
OLAP aggregation computes measures of facts and gathers these facts into groups according
to the hierarchical order of their attributes in that dimension. For example, in the screening
mammography data cube, according to the age class of patients, we can build aggregates of
suspicious regions as those of Figure 4. In this example, we can note that, in a single
aggregate, detected regions do not have relevant common medical proprieties. They have
different forms and lengths of boundaries. We also note that regions of a single aggregate can

A Data Mining-Based OLAP Aggregation
17
have different types of lesion. Some of them can represent benign tumors while some others
are cancer. For example, according to expert annotations, suspected regions (c), (e) and (g) of
“$40$ to $49$ years old” patients represent cancer tumors whereas the rest of regions are
benign. In the aggregate “$50$ to $59$ years old” patients, an expert declares that only
regions (b) and (c) are cancer. This classical aggregation presented above is fully established
in the conceptual step of the data cube. Therefore, it does not provide to breast cancer experts
significant relations between suspicious regions.
Figure 4. Example of classical OLAP aggregation
We wish to build aggregates of objects having similar medical proprieties. In the case
of the screening mammography data cube, we would like to construct more homogenous
aggregates of suspected regions of tumors. These aggregates should reflect relations between
objects and help experts to extract knowledge from their common proprieties.
The main idea of our operator OpAC is to exploit the cube's facts describing complex
objects in order to provide over them a more significant aggregation. In order to do so, we use
a clustering method and automatically highlight aggregates semantically richer than those
provided by the current OLAP operators. So the clustering method provides a new OLAP
aggregation concept. This aggregation provides hierarchical groups of objects resuming
information and enables navigation through levels of these groups. Existing OLAP tools, like

A Data Mining-Based OLAP Aggregation
18
Slicing operator, can create new restricted aggregates in a cube dimension, too. Therefore,
these tools always need a handmade assistance, whereas our operator is based on a clustering
algorithm that provides automatically relevant aggregates. Furthermore, with classical OLAP
tools, aggregates are created in an intuitive way in order to compare some measure values,
whereas OpAC creates significant aggregates that express deep relations with the cube's
measures. Thus, the construction of such aggregates is interesting to establish a more
elaborated on line analysis context.
According to the above objectives, we choose the AHC as an aggregation method. Our
choice is motivated by the fact that the hierarchical aspect constitutes a relevant analogy
between AHC results and hierarchical structures of dimensions. The objectives and the results
expected for OpAC match perfectly with AHC strategy. Furthermore, AHC adopts an
agglomerative strategy that starts by the finest partition where each individual is considered a
cluster. Therefore, OpAC results include the finest attributes of a dimension. Moreover, AHC
is compatible with the exploratory aspect of OLAP. Its results can also be reused by classical
OLAP operators. In fact, AHC provides several hierarchical partitions. By moving from a
partition level to a higher one, two aggregates are joined together. Conversely, by moving
from a partition level to a lower one, an aggregate is divided into two new ones. These
operations are strongly similar to the classical operators Roll-up and Drill-down. AHC is a
well suited clustering method to summarize information into OLAP aggregates from complex
facts.

A Data Mining-Based OLAP Aggregation
19
FORMAL BACKGROUND OF OUR APPROACH
Individuals and Variables of the Clustering Algorithm
This formalization defines domains of individuals and variables of the clustering
problem. Note that these domains are extracted from a multidimensional environment. Thus,
we should respect some constraints to ensure the statistical and logical validity of the
extracted data. Let Ω be the set of individuals, and Σ be the set of variables. We also assume
that:
C is a data cube having d dimensions and m measures. According to
Figure 2, the XML screening mammography data cube consists of nine
dimensions and two measures, in this case 9=d and 2=m ;
di DDD ,,,,1 KK are the dimensions of C . For example, in Figure 2,
“Subtlety” dimension corresponds to 3D ;
mq MMM ,,,,1 KK are the measures of C . For example, in Figure 2, “Region
length” corresponds to 1M , and “Boundary length” corresponds to 2M ;
di ,,1K∈∀ , the dimension iD contains in hierarchical levels. For instance,
“Patient” dimension ( 8D ) of Figure 2 is composed of two hierarchical levels.
So, we note 28 =n ;
ijh is the thj hierarchical level of iD , where inj ,,1K∈ ;
inj ,,1K∈∀ , the hierarchical level ijh contains ijl attributes (or members);
ijtg is the tht attribute of ijh , where ijlt ,,1K∈ ;
)( ijhG is the set of attributes of ijh .

A Data Mining-Based OLAP Aggregation
20
Let suppose that we intend to aggregate attributes from level ijh . So the user may
choose the dimension iD , the hierarchical level ijh in iD , and even select individuals in
)( ijhG . We assume that selected attributes are elements of Ω . Therefore, we define the set of
individuals as follows:
ijijlijtijij ggghG ,,,,)( 1 KK=⊂Ω (1)
Now, we adopt the following notations:
∗ is a meta-symbol indicating the total aggregate of a dimension;
mq ,,1K∈∀ , we define the measure qM as the function: ℜ→GM q : .
As shows Formula (2), G is the set of d-tuples of all the hierarchical level's attributes
of the cube C including the total aggregates of dimensions:
∗∪××
∗∪××
∗∪=
∗∪=
∈∈∈
=∈
∏
321K
321K
321
321
KKK
K
di
i
nj
dj
nj
ij
nj
j
d
inj
ij
hGhGhGG
hGG
,,1,,1,,1
1
1,,1
)()()(
)(
1
(2)
For example, for the data cube of Figure 2, by using the above notations, we can say
that:
),,,2,(1 ∗∗ KioncalcificatM points out the aggregated value of the length of
all suspicious region having calcification as lesion type and 2 as subtlety code;
),5950,,,(2 laserlumisysoldyearsandbetweenPatientM ∗∗ K points out the
number of suspicious regions of patients between 50 and 59 years old, scanned
by a lumisys laser digitizer.
Remind that the objective of OpAC is to establish a semantic aggregation via a
clustering technique on real data cube facts. In order to do so, we adopt the cube measures as

A Data Mining-Based OLAP Aggregation
21
quantitative variables describing the individuals of Ω . However, it is necessary to satisfy two
fundamental constraints on variables:
First constraint. Hierarchical levels belonging to the dimension iD which is
retained for the individuals can not generate variables. In fact, describing an
individual by a property which contains it does not make logical sense.
Conversely, a variable which specifies a property of an individual would only
describe this one;
Second constraint. In a dimension, only one hierarchical level should be
selected to generate variables. This constraint enables the independence of
variables. In fact, a value taken by an attribute from a hierarchical level can be
calculated from attributes' values belonging to the lower level.
Since Ω is selected, we formulate the possible extracted set of variables Σ as defined
in Formula (3):
( )
∈∈≠
∗∗∗∗∗∗=
∈∀
⊂Σ∈∈∈
mqandlvseachforuniqueisriswith
ggMgV
ltV
sr
nr
srv
nj
ijtq
nj
ijt
ij
sjj
,,1,,,1,,
,,,,,,,,,,
,,1/
,,1,,1,,1
KK
KKK321
K
KKK
(3)
A user can define the set of variables by selecting dimensions sD , hierarchical levels
srh , and measures qM . In order to achieve precise analysis tasks, a user may also select
precise attributes srvg in srh . The selection of srvg depends naturally on the objectives carried
out by the user.

A Data Mining-Based OLAP Aggregation
22
The Agglomerative Hierarchical Clustering Algorithm
Once individuals and variables are selected, we can run the AHC algorithm. We note
X the “individuals-variables” table. X is a ),( pn matrix. Its rows represent individuals of
Ω , and its columns represent variables of Σ . We suppose that n is the number of
individuals, and p is the number of variables.
Dissimilarities between all pairs of individuals are pre-computed. Thus a ),(nn
dissimilarity matrix S is constructed. The dissimilarity of two individuals is computed
according to a distance function. A lot of distance can be used, such as the “Euclidian
distance”. The general term of S is ijs , which corresponds to the distance between the
individuals i and j . The greater ijs is, the less similar individuals i and j are. We sum up
the AHC algorithm by the following steps:
Step 1. The n individuals of X are assigned into n distinct clusters indexed
by nAAA ,, 21 K ;
Step 2. Two distinct clusters iA and jA are picked up such that their
dissimilarity measure is the smallest;
Step 3. The two clusters iA and jA are merged into a new cluster 1+nA . At each
step two clusters are merged to form a new cluster. Therefore, the number of
clusters is reduced by one;
Step 4. Step 2 and 3 are repeated until the number of obtained clusters is
reduced to a required number cn , or the smallest dissimilarity value between
clusters is dropped to a lower threshold.

A Data Mining-Based OLAP Aggregation
23
In the specific context of our operator OpAC, it is up to the user to choose the number
cn of clusters he requires to see at the end of the AHC algorithm. Else, in a default situation,
the AHC algorithm is stopped when it attends a single cluster.
EVALUATION OF AGGREGATES
Recall that we propose to use AHC as an aggregation operator over the attributes of a
cube dimension. For n individuals to classify, the AHC generates n hierarchical partitions.
Like almost all unsupervised mining methods, the main defect of AHC is that it does not give
implicit evaluation of its results. In particular, we do not have any indicator about provided
partitions of clusters. Therefore, it is quite tedious to choose the best partition suited with
analysis objectives. Furthermore, the choice of the best partition is more difficult when we
deal with a great number n of individuals. Usually, it is the expert who decides about the
number of aggregates that corresponds both to the context and to the goal of his analysis.
In data mining literature, many efforts have provided a set of statistical measures for
cluster quality evaluation. We emphasize that in our current study, the terms cluster and class
refer to an OLAP aggregate provided by our operator. Note that unsupervised clustering
methods lack a universal criterion of cluster quality. Any measure of cluster quality in this
field closely depends on the way it is computed. It also depends on the orientations of user's
analysis (Lamirel, François, Shehabi & Hoffmann, 2004). Hence, for our operator, we
propose to use more than one quality criterion. The comparison of many criteria seems
mandatory in order to study the quality of the resulting aggregates and to decide about the
best partition according to user's requirements.
In the following, we present the intra and inter-clusters inertias (Lebart, Morineau &
Fénelon, 1982) and the Ward's method (Ward, 1963) that we used as criteria to measure the
quality of aggregates obtained by OpAC. In addition to these two criteria, we also propose a

A Data Mining-Based OLAP Aggregation
24
new criterion based on the separability of classes (Zighed, Lallich & Muhlenbach, 2002). In
order to formulate these criteria, we assume the following notations:
nωωω ,,, 21 K=Ω is the set of individuals to cluster;
each individual takes the weight )(ωP , and it is described by p numerical
variables pVVV ,,, 21 K ;
let 1,,0 −∈ nk K be the index of AHC iterations (or partitions). 0=k
corresponds to the initial AHC partition where each individual represents a
single cluster. In general, an iteration k corresponds to a partition with kn −
clusters;
in iteration k , clusters iA and jA are merged together, and we move from the
partition 1−k to the partition k . knAAA −,,, 21 K represents the current
partition of Ω ;
in is the size of the cluster iA , i.e. the number of individuals in iA ;
kni −∈∀ ,,0K , the cluster iA takes the weight ∑∈
=iA
i PAPω
ω)()( ;
∑∈
=iAi
i VPAP
AGω
ωω )()()(
1)( is the gravity center of iA ;
∑Ω∈
=ω
ωω )()( VPG is the gravity center of Ω ;
d is the Euclidian distance, and 2d is the Squared Euclidian distance.
Intra and Inter-Clusters Inertias
These criteria derive from the classical measures of inertia (Lebart et al., 1982). They
consist of:
A Data Mining-Based OLAP Aggregation
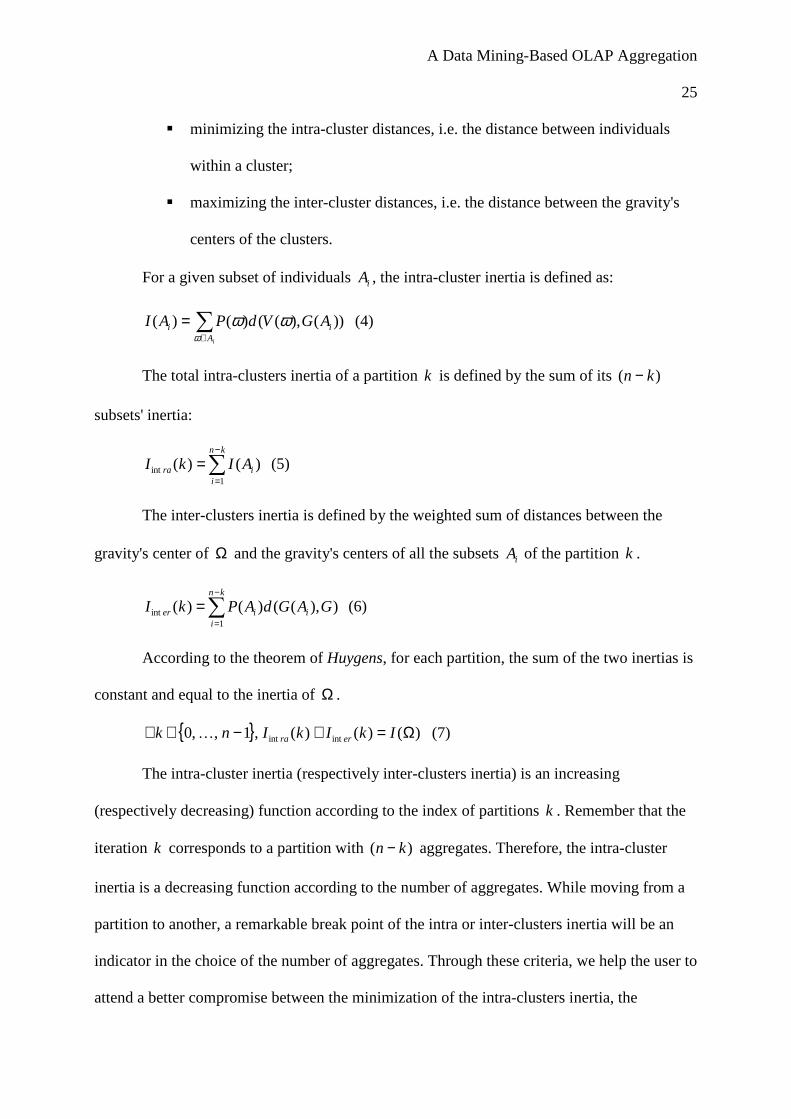
25
minimizing the intra-cluster distances, i.e. the distance between individuals
within a cluster;
maximizing the inter-cluster distances, i.e. the distance between the gravity's
centers of the clusters.
For a given subset of individuals iA , the intra-cluster inertia is defined as:
∑∈
=iA
ii AGVdPAIω
ωω ))(),(()()( (4)
The total intra-clusters inertia of a partition k is defined by the sum of its )( kn −
subsets' inertia:
∑−
=
=kn
iira AIkI
1int )()( (5)
The inter-clusters inertia is defined by the weighted sum of distances between the
gravity's center of Ω and the gravity's centers of all the subsets iA of the partition k .
∑−
=
=kn
iiier GAGdAPkI
1int )),(()()( (6)
According to the theorem of Huygens, for each partition, the sum of the two inertias is
constant and equal to the inertia of Ω .
)()()(,1,,0 intint Ω=+−∈∀ IkIkInk erraK (7)
The intra-cluster inertia (respectively inter-clusters inertia) is an increasing
(respectively decreasing) function according to the index of partitions k . Remember that the
iteration k corresponds to a partition with )( kn − aggregates. Therefore, the intra-cluster
inertia is a decreasing function according to the number of aggregates. While moving from a
partition to another, a remarkable break point of the intra or inter-clusters inertia will be an
indicator in the choice of the number of aggregates. Through these criteria, we help the user to
attend a better compromise between the minimization of the intra-clusters inertia, the

A Data Mining-Based OLAP Aggregation
26
maximization of the inter-clusters inertia, the number of aggregates, the significance of the
aggregates, and the analysis' objectives.
The intra and inter-clusters inertias may present some limits since they have a
monotonous general trend. We also propose to use the Ward's method which is another way
of evaluating the AHC result's by measuring its “merging cost” when moving from a partition
to another.
Ward’s Method
The Ward's methods, proposed in (Ward, 1963), constructs a criterion that considers
what happens to the sum of squared deviations from the gravity centers of two merged
clusters iA and jA . This “merging cost” turns to calculate the Squared Euclidian distance
between the gravity center's of the merged clusters weighted according to their respective
sizes at each AHC iteration. The formula of this criterion is written as follows:
))(),((),( 2ji
ji
jiji AGAGd
nn
nnAAW
+= (8)
At each AHC iteration, this criterion measures variation of internal inertia when two
clusters are merged together. Recall that the aim is to find a partition where its clusters are as
homogenous as possible. This leads to minimize the internal inertia of clusters. Therefore,
when the Ward's method provides a high criterion at iteration k , it implies a great variation of
internal inertia when moving from a partition 1−k to a partition k . This variation is quite an
indicator that helps users to prefer the previous partition 1−k which corresponds to
)1( +− kn aggregates. In general, the Ward's method provides more than one relevant
variation in a hierarchical clustering. Once again, it is up to users to choose the best partition
that provides the best solution to the analysis' objectives.

A Data Mining-Based OLAP Aggregation
27
Note that the two previous criteria are mainly related to the principle of inertia which
measures the homogeneity of clusters. In order to provide a complementary way of evaluating
aggregates, we propose a new alternative criterion that rather measures the quality of
aggregates according to the propriety of separability of classes (Zighed et al., 2002).
Separability Based Criterion
This criterion is derived from the method of separability of classes basically
introduced by Zighed et al. (2002). This criterion starts by constructing a neighborhood graph
for the whole set of objects to aggregate.
A neighborhood graph, also called a proximity graph, is a visual presentation which
displays the overall arrangement of individuals in their space representation. In such a graph,
individuals are presented by points, and two points are connected by an edge if they are, by a
certain measure, close together. Specifically, two points are linked together if there are no
other points in a certain forbidden region defined by these two points.
The Gabriel graph is a particular case of neighbourhood graphs proposed in (Gabriel
& Sokal, 1969). It has been studied in the field of classification as a way to edit and condense
large data sets. In the Gabriel graph, two points A and B are connected if their diametral
sphere (i.e. the sphere such that AB is its diameter) does not contain any other points.
Figure 5 (a) shows a plane representation of a Gabriel graph constructed on a set of objects
described by two variables 1X and 2X .

A Data Mining-Based OLAP Aggregation
28
Figure 5: Principle of the separability based criterion
We assume that Ωg is the Gabriel graph constructed on the whole set Ω of
individuals. At each AHC iteration 1,,0 −∈ nk K , our criterion consists in building for
each constructed cluster iA ( kni −∈ ,,1K ) its own Gabriel graph noted iAg . Remark that:
Ω
−
=
≠ ggkn
iAiU
1
In fact, in a partition of individuals, the union of sub-graphs of its clusters iA
( kni −∈ ,,1K ) does not correspond to the whole graph of Ω .
Let ije , also noted ji ωω ↔ , be the edge that connects two individuals iω and jω
in a neighborhood graph. Each edge ije can be associated to a weight )( ijeP according to the
opposite Euclidean distance that separates its connected points iω and jω .
A Data Mining-Based OLAP Aggregation
29
( )),(
1)(
jijiij d
PePωω
ωω =↔= (9)
The weight associated to edges allows to quantify the importance of each connection
in a neighborhood graph. In fact, two points separated by a large distance are easily separable,
so their connection is relatively weak. Therefore, two close points are less separable, and their
connection is quite strong. In a simple case, we can also consider that all connections in a
neighbourhood graph have the same separability level. Hence, we associate the same weight
( 1)( =ijeP ) for all the edges of the graph.
For each AHC iteration, the “separability based criterion” consists in computing the
sum of new built connections for the Gabriel graphs of clusters iA ( kni −∈ ,,1K ). Let kξ
be the set of the new built edges at iteration k of the AHC. For example, according to
Figure 5, at the iteration 3=k , the cluster 2 is merged with the cluster 3,4. The new built
connections in this case are 32 ↔ and 42 ↔ . Therefore, we note
42,323 ↔↔=ξ . Let )(kJ be the sum of new connections of Gabriel graphs built at
iteration k . )(kJ is written according to the following formula:
∑∈
=ke
ePkJξ
)()( (10)
Our criterion aims at evaluation of separability of clusters for each AHC partition.
Two clusters are more separable when they are connected via a small number of edges with
weak connections. Nevertheless, the importance of new built edges at each iteration should
also take into account the current number of clusters. Thus, the formula of our “separability
based criterion” is written as follows:
kn
eP
kn
kJkS
ke
−=
−=
∑∈ξ
)()(
)( (11)

A Data Mining-Based OLAP Aggregation
30
)(kS computes, per cluster, the ratio of new built edges when AHC merges two
clusters by moving from partition )1( −k to k . In the criterion formula, we divide )(kJ by
)( kn− in order to get a relative evaluation of separability according to the current number of
clusters. When )(kJ has a relative low value compared to other partitions, it means that the
fact of moving from the )1( −k to the k partition, weak connections are built, and therefore,
the merged clusters are quite separable. So, the user may prefer to select the partition )1( −k
rather than the partition k . For example, Figure 5 (c) displays the process of building edges of
the Gabriel graph at each iteration of AHC provided in Figure 5 (b). We suppose in this
example that all connections have the same weight ( 1)( =ijeP ). This example also provides
the number of built edges )(kJ and the criterion value )(kS at each step. We note that )(kS
marks a relative low value for the partition 5=k . This can help the user to select the previous
partition ( 4=k ) with six separable clusters.
IMPLEMENTATION AND EXPERIMENTAL RESULTS
To validate our approach, we have developed a Web based environment platform
called MiningCubes . We have included in this platform an implementation of OpAC. In the
following, we detail the architecture of this Web application and present some performance
experiments that we have led over it.
Architecture of the Web Application
MiningCubes contains a set of OLAP modules like a connection to classical data
cubes via MS SQL Server 2000/Analysis Services, a connection to XML data cubes and an
exploration of multidimensional data. In addition to these OLAP tools, we have also
integrated analysis modules based on data mining methods. Among these, we developed a

A Data Mining-Based OLAP Aggregation
31
module for our operator OpAC which is composed of four components: a Data loader
component from Analysis Services of MS SQL Server 2000 or directly from XML documents,
a Parameter setting interface, a Clustering component that provides aggregates of objects,
and an Aggregates evaluation component to measure the pertinence of partitions of aggregates
according to the criteria presented in the previous section. Figure 6, shows the general
architecture of the OpAC module. In the following, we detail the functions of each
component.
Figure 6: General architecture of the OpAC module
The data loader component. This component connects and loads information
about the structure (labels of dimensions, hierarchical levels and measures),

A Data Mining-Based OLAP Aggregation
32
and the content of a data cube. It can work either on a data cube stored in the
Analysis Services of MS SQL Server 2000 or directly on XML data cubes. To
connect to a data cube on Analysis Services, the data loader component uses
MDX queries (Multidimensional Expressions) to import information about the
cube's structure. In the case of a connection to an XML data cube, the
component uses the DOM (Document Object Model) MSXML to parse the
XML schema that represents the conceptual model of the data cube. The DOM
is also used to load the data of the cube from its corresponding XML
documents. As the application is based on the Web technology, a user should
enter, in a Web form, a cube name, its XML schema and its corresponding
XML documents (see Figure 7). The application will automatically load on the
Web server the XML schema, and the XML documents.
The parameter setting interface. This component assists the user to extract
both individuals and variables from a data cube. It enables navigation into
hierarchical levels of dimensions, selection of attributes ijtg for individuals,
selection of attributes srvg , and selection of measures qM for the variables of
the clustering problem. It also provides a user assistance respecting constraints
which we have defined in the previous formalization.
The clustering component. The clustering component enables the selection of
the dissimilarity measure and the aggregation criterion. We implemented four
dissimilarity measures (the Euclidean Distance, the Squared Euclidean
Distance, the Manhattan Distance, and the Chebychev Distance), and seven
aggregation criteria (the Ward's criterion, the Nearest Neighbor criterion, the
Furthest Neighbor criterion, the Average Distance criterion, the McQueen's

A Data Mining-Based OLAP Aggregation
33
criterion, the Median Clustering criterion, and the Centroid Clustering
criterion). Once the user selects dissimilarity measure and the aggregation
criterion, the clustering component constructs the AHC model, and plots its
results within a dendrogram.
The aggregates evaluation component. This component computes at each
step of the AHC the criteria presented in the previous section. In fact, for each
constructed partition, this component calculates inter and intra-clusters inertias,
and the separability based criterion. When AHC moves from a partition to the
next one, this component also calculates the sum of squared deviations
according to the Ward's method. In the end of the AHC, the aggregates
evaluation component plots the previous criteria results within graphs. Each
graph presents a curve of a criterion according to partitions. This component
gives an idea about the quality of AHC partitions. It also helps the user to
decide about the best number of aggregates he wants to consider.
Figure 7: An XML data cube loaded by MiningCubes

A Data Mining-Based OLAP Aggregation
34
Performances of the Web Application
We have experimentally evaluated performances of our Web application within
datasets of XML documents. We have constructed these datasets by a random sampling on
the whole collection of OLAP facts from the screening mammography data cube presented in
the third section2. Recall that this data cube contains 4 686 OLAP facts, where each fact is
presented by an XML document as shows the example of Figure 3.
The current experiments measure times processing for different situations of input
data and parameters of our operator OpAC supported by the Web application
MiningCubes . We led these series of experiments under Windows XP on a 1.60 GHz PC
with 480 MB of RAM, and an Intel Pentium 4 processor.
Figure 8: (a) Effect of XML documents' number on DOM parsing time. (b) Effect of XML
documents' number on AHC time processing
We have measured the running time of the data loader component for loading XML
documents, and for constructing an XML data cube. The running time of the DOM parser is
summarized by the curve of Figure 8 (a). The general trend of the curve proves that the
parsing time has a linear increasing according to the number of XML documents. Note that
these experiments were achieved on localhost, so in a real client/server architecture, in
addition to the parsing time we should also take into account the communication time of the
used network.

A Data Mining-Based OLAP Aggregation
35
We also evaluated the time processing of the clustering component. According to
Figure 8 (b), the processing time of AHC marks a polynomial increasing according to the
number of documents. Indeed, there are two main expensive steps in the agglomerative
clustering. The first one corresponds to the computation of the pairwise dissimilarity between
all the documents. Let n be the number of XML documents to cluster, the complexity of this
step is )( 2nO . The second step is the repeated selection of the pair of most similar clusters.
During the iteration k , the AHC algorithm requires ))1(( 2−nO time. This lead to an overall
complexity of )( 3nO .
Nevertheless in OLAP context, we should note that we usually deal with data cube
dimensions with relatively small number of attributes. In addition, in the context of our
operator, the AHC complexity would be avoided since a user focus on targeted analysis with
precise, and small number, of facts to aggregate. In the next section, we introduce a real case
study on the XML screening mammography data cube.
APPLICATION ON THE XML SCREENING
MAMMOGRAPHY DATA CUBE
To illustrate the results of our operator, we propose to run it on the screening
mammography data cube presented in Figure 2. We suppose that a user needs to create
aggregates from the attributes of the Scanner name level ( 71h ) of the Scanner image
dimension ( 7D ). We suppose that (s)he selects from )( 71hG a set of 36 mammogram
scanners. Figure 9 shows the set of the selected individuals Ω .

A Data Mining-Based OLAP Aggregation
36
Figure 9: The set Ω of mammogram scanners selected as individuals
In order to generate variables, suppose that the user selects the attributes of the level
Lesion type name ( 12h ) from the Lesion type dimension ( 1D ) and the measure Region length
( 1M ). According to Formula (3), the set of variables is:
Ω∈∈∗∗∗∗=
=Σωω
andhawhere
aMV
i
ii
12
1 ),,,,,,( K (12)
With more explicit terms, according to the available data in this case study, the set Σ
contains the following 11 variables:
1V : Boundary length of suspicious region with calcification type amorphous
2V : Boundary length of suspicious region with calcification type lucent center
3V : Boundary length of suspicious region with calcification type pleomorphic
4V : Boundary length of suspicious region with calcification type punctate
5V : Boundary length of suspicious region with calcification type skin

A Data Mining-Based OLAP Aggregation
37
6V : Boundary length of suspicious region with calcification type vascular
7V : Boundary length of suspicious region with mass shape asymmetric breast
tissue
8V : Boundary length of suspicious region with mass shape irregular
9V : Boundary length of suspicious region with mass shape lobulated
10V : Boundary length of suspicious region with mass shape oval
11V : Boundary length of suspicious region with mass shape round
Now, suppose that the user wants to construct aggregates. If (s)he selects Euclidean
distance as a dissimilarity metric and Ward's criterion as an aggregation strategy, (s)he will
obtain the dendrogram of Figure 10. The user will also obtain evaluation curves of partitions
according to the criteria proposed in the fifth section. Note that the obtained dendrogram is
not easy to interpret. A breast cancer expert would not be able to decide about the best
number of aggregates that fits with his/her analysis objectives. In this case, valuation criteria
included in our operator may provide additional helps for the analysis process. Figure 11
shows resulted graphs of evaluation criteria according to the number of AHC iterations k .

A Data Mining-Based OLAP Aggregation
38
Figure 10: Dendrogram generated by OpAC
We notice that all criteria release remarkable leaps for small numbers of aggregates.
Generally, it is not meaningful to choose partitions with very high or very small number of
aggregates. In fact, a single cluster (including the whole set of individuals) or n clusters
(where each cluster contains a single individual) are two insignificant partitions for the
analysis.

A Data Mining-Based OLAP Aggregation
39
Figure 11: (a) Inertia intra and inter-clusters criteria (b) Ward's criterion (c) Separability
based criterion (equal edges weights) (d) Separability based criterion (weighted edges)
according to the growth of AHC iterations
Recall that the choice of the best partition depends on the evaluation criterion. It also
depends on the analysis objectives of the user. In this case study, suppose that a breast cancer
expert needs to define aggregates of similar suspicious regions. Remember again that an
iteration k corresponds to a number of aggregates equal to )( kn − . By taking into account
the previous analysis objective, an expert can choose the iteration 30=k , which corresponds
to 6 aggregates (36-30). In fact, in Figure 11 (a), the intra-cluster inertia marks a relevant
increase when it moves from the iteration 29=k to 30=k . The Ward's method, in
Figure 11 (b) has an increase tendency when we move from iteration 30=k to 31=k . As we
need to minimize the Ward's indicator, the user can prefer partition of iteration 30=k . We
also see that the two separability based criterion of Figure 11 (c) and 11 (d) have relevant pics
in iteration 30=k which comes after low values in iteration 29=k . Furthermore, knowing
A Data Mining-Based OLAP Aggregation
40
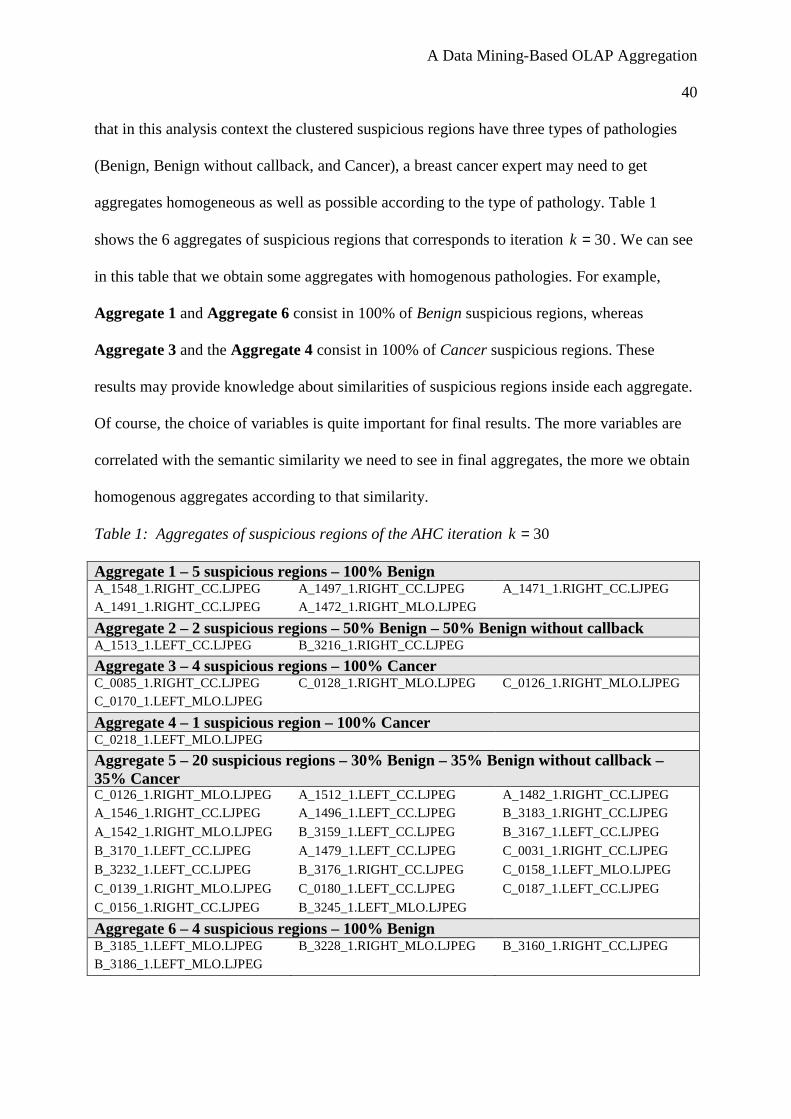
that in this analysis context the clustered suspicious regions have three types of pathologies
(Benign, Benign without callback, and Cancer), a breast cancer expert may need to get
aggregates homogeneous as well as possible according to the type of pathology. Table 1
shows the 6 aggregates of suspicious regions that corresponds to iteration 30=k . We can see
in this table that we obtain some aggregates with homogenous pathologies. For example,
Aggregate 1 and Aggregate 6 consist in 100% of Benign suspicious regions, whereas
Aggregate 3 and the Aggregate 4 consist in 100% of Cancer suspicious regions. These
results may provide knowledge about similarities of suspicious regions inside each aggregate.
Of course, the choice of variables is quite important for final results. The more variables are
correlated with the semantic similarity we need to see in final aggregates, the more we obtain
homogenous aggregates according to that similarity.
Table 1: Aggregates of suspicious regions of the AHC iteration 30=k
Aggregate 1 – 5 suspicious regions – 100% Benign A_1548_1.RIGHT_CC.LJPEG A_1497_1.RIGHT_CC.LJPEG A_1471_1.RIGHT_CC.LJPEG A_1491_1.RIGHT_CC.LJPEG A_1472_1.RIGHT_MLO.LJPEG
Aggregate 2 – 2 suspicious regions – 50% Benign – 50% Benign without callback A_1513_1.LEFT_CC.LJPEG B_3216_1.RIGHT_CC.LJPEG
Aggregate 3 – 4 suspicious regions – 100% Cancer C_0085_1.RIGHT_CC.LJPEG C_0128_1.RIGHT_MLO.LJPEG C_0126_1.RIGHT_MLO.LJPEG C_0170_1.LEFT_MLO.LJPEG
Aggregate 4 – 1 suspicious region – 100% Cancer C_0218_1.LEFT_MLO.LJPEG
Aggregate 5 – 20 suspicious regions – 30% Benign – 35% Benign without callback – 35% Cancer C_0126_1.RIGHT_MLO.LJPEG A_1512_1.LEFT_CC.LJPEG A_1482_1.RIGHT_CC.LJPEG A_1546_1.RIGHT_CC.LJPEG A_1496_1.LEFT_CC.LJPEG B_3183_1.RIGHT_CC.LJPEG
A_1542_1.RIGHT_MLO.LJPEG B_3159_1.LEFT_CC.LJPEG B_3167_1.LEFT_CC.LJPEG
B_3170_1.LEFT_CC.LJPEG A_1479_1.LEFT_CC.LJPEG C_0031_1.RIGHT_CC.LJPEG
B_3232_1.LEFT_CC.LJPEG B_3176_1.RIGHT_CC.LJPEG C_0158_1.LEFT_MLO.LJPEG
C_0139_1.RIGHT_MLO.LJPEG C_0180_1.LEFT_CC.LJPEG C_0187_1.LEFT_CC.LJPEG
C_0156_1.RIGHT_CC.LJPEG B_3245_1.LEFT_MLO.LJPEG
Aggregate 6 – 4 suspicious regions – 100% Benign B_3185_1.LEFT_MLO.LJPEG B_3228_1.RIGHT_MLO.LJPEG B_3160_1.RIGHT_CC.LJPEG B_3186_1.LEFT_MLO.LJPEG

A Data Mining-Based OLAP Aggregation
41
CONCLUSION
In this work, we propose to carry out a new on line analysis context of complex data
like texts, images, sounds and videos. Our approach is based on coupling OLAP with data
mining. The association of the two fields can be a solution to cope with their respective
defects. We have created OpAC, which is a new OLAP aggregation operator based on an
automatic clustering method. Unlike classical OLAP operators, our proposal enables precise
analysis and provides semantic aggregates of complex objects. In this paper, we have
generalized this approach and adapted OpAC to XML data cubes. Nowadays, XML is
becoming a promising solution for warehousing complex data. We provide a formalization of
our operator and define the set of individuals and variables that a user can select from a data
cube. We propose criteria to evaluate the results of our operator. These criteria help users to
select the best partition of aggregates that fits with their analysis requirements. Our approach
is developed under a Web environment according to a client/server architecture that takes into
account data cubes modelled according to XML sources. The implementation of OpAC is
achieved in a general OLAP platform called MiningCubes . We have led some experiments
on the developed application to evaluate the performance and the complexity of our operators.
These experiments proved efficiency of our approach. They showed its capability in handling
XML sources, too. We have also validated our approach through a case study on XML data
cube taken from the breast cancer domain. This application has shown the interest of OpAC
on a real world domain where decisions are quite important and sometimes critical.
This work has proved the interest of associating OLAP and data mining in order to
enhance on line analysis power. We believe that, in the future, this association will provide a
new generation of efficient OLAP operators adapted to complex data. For future work, a lot
of issues need to be addressed. First, we need to think about an automatic approach to

A Data Mining-Based OLAP Aggregation
42
warehouse complex data within XML format. This warehousing step should not simply
transform complex objects into XML documents and store them in a repository. It would also
prepare data and represent them in an interesting way suitable to analysis and adapted to user
requirements. The second issue is devoted to provide OLAP with a predictive power by
associating it to a suitable data mining technique like decision trees or association rules. The
third deals with the formalization of an algebra that defines a general framework of new
operators that couple OLAP and data mining. This algebra should establish a generic formal
background adapted to both classical and new OLAP operators.
REFERENCES
Baril, X., & Bellahsène, Z. (2000). A View Model for XML Documents. In Proceedings of
the 6th International Conference on Object Oriented Information Systems
(OOIS’2000), London, UK, December, (pp. 429-411).
Braga, D., Campi, A., Ceri, S., Klemettinen, M., & Lanzi, P. (2003). Discovering Interesting
Information in XML Data with Association Rules, In Proceedings of the 18th
Symposium on Applied Computing, Florida, USA, March, (pp 450-454).
Chaudhuri, S. (1998). Data Mining and Database Systems: Where is the Intersection? Data
Engineering Bulletin, 21(1), 4-8.
Chaudhuri, S., & Dayal, U. (1997). An Overview of Data Warehousing and OLAP
Technology. SIGMOD Record, 26(1), 65-74.
Chaudhuri, S., Fayyad, U., & Bernhardt, J. (1999). Scalable Classification over SQL
Databases. In Proceedings of the 15th International Conference on Data Engineering
(ICDE’1999), Sydney, Australia, March, (pp 470-479).

A Data Mining-Based OLAP Aggregation
43
Chen, M., Zhu, Q., & Chen, Z. (2001). An Integrated Interactive Environment for Knowledge
Discovery from Heterogeneous Data Resources. Information and Software
Technology, 43, 487-496.
Chen, S. Y., & Liu, X. (2005). Data mining from 1994 to 2004: an application-orientated
review. International Journal of Business Intelligence and Data Mining, Inderscience
Publishers, 1(1), 4-21.
Chen, Q., Dayal, U., & Hsu, M. (2000). An OLAP-based Scalable Web Access Analysis
Engine. In Proceedings of the 2nd International Conference on Data Warehousing
and Knowledge Discovery (DAWAK'2000), London, UK, September, (pp 210-223).
Darmont, J., Boussaid, O., Bentayeb, F., & Zellouf, Y. (2003). Web Multiform Data
Structuring for Warehousing. Multimedia Systems and Applications, 22, 179-194.
Dong, G., Han, J., Lam, J.M.W., Pei, J., & Wang, K. (2001). Mining Multi-Dimensional
Constrained Gradients in Data Cubes. In Proceedings of 27th Very Large Data Bases
Conference (VLDB’2001), Rome, Italy, September, (pp 321-330).
Fayyad, U.M., Shapiro, G.P., Smyth, P., & Uthurusamy, R. (1996). Advances in Knowledge
Discovery and Data Mining. AAAI/MIT Press.
Feng, L., & Dillon, T. (2005). An XML-enabled data mining query language: XML-DMQL.
International Journal of Business Intelligence and Data Mining, Inderscience
Publishers, 1(1), 22-41.
Fu, L. (2005). Novel Efficient Classifiers Based on Data Cube. International Journal of Data
Warehousing and Mining, Idea Group Inc., 1(3), 15-27.
Gabriel, K.R., & Sokal, R.R. (1969). A New Statistical Approach to Geographic Variation
Analysis. Systematic Zoology, 18, 259-278.

A Data Mining-Based OLAP Aggregation
44
Goil, S., & Choudhary, A. (1998). High Performance Multidimensional Analysis and Data
Mining. In Proceedings of High Performance Networking and Computing Conference
(SC'98), Orlando, USA, November.
Goil, S., & Choudhary, A. (2001). PARSIMONY: An Infrastructure for parallel
Multidimensional Analysis and Data Mining. Journal of Parallel and Distributed
Computing, 61, 285-321.
Golfarelli, M., Rizzi, S., & Vrdoljak, B. (2001). Data Warehouse Design from XML Sources.
In Proceedings of the 4th ACM International Workshop on Data Warehousing and
OLAP (DOLAP’2001), Atlanta, Georgia, USA, November, (pp 40-47).
Han, J. (1998). Toward On-line Analytical Mining in Large Databases. SIGMOD Record, 27,
97-107.
Hu, X., Song, I-Y., Han, H., Yoo, I., Prestrud, A. A., Brennan, M. F., & Brooks, A. D. (2005).
Temporal rule induction for clinical outcome analysis. International Journal of
Business Intelligence and Data Mining, Inderscience Publishers, 1(1), 122-136.
Heath, M., Bowyer, K., Kopans, D., Moore, R., & Jr, P.K. (2000). The Digital Database for
Screening Mammography. In Proceedings of the 5th International Workshop on
Digital Mammography, Toronto, Canada, June.
Hümmer, W., Bauer, A., & Harde, G. (2003). XCube: XML for Data Warehouses. In
Proceedings of the 6th ACM International Workshop on Data Warehousing and
OLAP (DOLAP’2003), New Orleans, Louisiana, USA, (pp 33-40).
Imielinski, T., Khachiyan, & L., Abdulghani, A. (2002). Cubegrades: Generalizing
Association Rules. Data Mining and Knowledge Discovery, 6(3), 219-257.
Imielinski, T., & Mannila, H. (1996). A Database Perspective on Knowledge Discovery.
Communication Of The ACM, 39, 58-64.
Inmon, W.H. (1996). Building the Data Warehouse. John Wiley & Sons.

A Data Mining-Based OLAP Aggregation
45
Kimball, R. (1996). The Data Warehouse Toolkit. John Wiley & Sons.
Lamirel, J.C., François, C., Shehabi, A.S., & Hoffmann, M. (2004). New Classification
Quality Estimators for Analysis of Documentary Information: Application to Patent
Analysis and Web Mapping. Scientometrics, 60(3), 445-562.
Laurent, A., Bouchon-Meunier, B., Doucet, A., Gançarski, S., & Marsala, C. (2000). Fuzzy
Data Mining from Multidimensional Databases. In Proceedings of the International
Symposium on Computational Intelligence (ISCI’2000), Kosice, Slovakia, (pp 278-
283)
Lebart, L., Morineau, A., & Fénelon, J.P. (1982). Statistical Data Processing (french edition).
Dunod, Paris.
Maedche, A., Hotho, A., & Wiese, M. (2000). Enhancing Preprocessing in Data-Intensive
Domains using Online-Analytical Processing. In Proceedings of the 2nd International
Conference on Data Warehousing and Knowledge Discovery (DaWaK’2000),
London, UK, September, (pp 258-264).
Maniatis, A., Vassiliadis, P., Skiadopoulos, S., Vassiliou, Y., Mavrogonatos, G., &
Michalarias, I. (2005). A Presentation Model & Non-Traditional Visualization for
OLAP, International Journal of Data Warehousing and Mining, Idea Group Inc.,
1(1), 1-36.
Meo, R., Psaila, G., & Ceri, S. (1996). A New SQL-like Operator for Mining Association
Rules. In Proceedings of the 22nd International Conference on Very Large Data
Bases Conference (VLDB’1996), Bombay, India, September, (pp 122-133).
Messaoud, R. B., Boussaid, O., & Rabaséda, S. (2004). A New OLAP Aggregation Based on
the AHC Technique. In Proceeding of the 7th ACM International Workshop on Data
Warehousing and OLAP (DOLAP’2004), Washington D.C., USA, November, (pp 65-
72).

A Data Mining-Based OLAP Aggregation
46
Nassis, V., Rajagopalapillai, R., Dillon, T.S., & Rahayu, J.W. (2005). Conceptual and
Systematic Design Approach for XML Document Warehouses. International Journal
of Data Warehousing and Mining, Idea Group Inc., 1(3), 63-87.
Palpanas, T. (2000). Knowledge Discovery in Data Warehouses. SIGMOD Record, 29, 88-
100.
Parsaye, K. (1997). OLAP and Data Mining: Bridging the Gap. Database Programming and
Design, 10, 30-37.
Pinto, H., Han, J., Pei, J., Wang, K., Chen, Q., & Dayal, U. (2001). Multi-dimensional
Sequential Pattern Mining. In Proceedings of the 10th ACM International Conference
on Information and Knowledge Management (CIKM’01), Atlanta, USA, November.
Pokornỷ, J. (2001). Modelling Stars Using XML. In Proceedings of the 4 th ACM
International Workshop on Data Warehousing and OLAP (DOLAP’2001), Atlanta,
Georgia, USA, November, (pp 24-31).
Robin, J., & Favero, E. (2001). HYSSOP: Natural Language Generation Meets Knowledge
Discovery in Databases. In Proceedings of the 3rd International Conference on
Information Integration and Web-based Applications and Services (iiWAS’2001),
Linz, Austria, September.
Rusu, L. I., Rahayu, J. W., & Taniar, D. (2005). A Methodology for Building XML Data
Warehouses. International Journal of Data Warehousing and Mining, Idea Group
Inc., 1(2), 23-48.
Sarawgi, S. (2001). iDiff : Informative Summarization of Differences in Multidimensional
Aggregates. Data Mining And Knowledge Discovery, 5, 213-246.
Sarawgi, S., Agrawal, R., & Megiddo, N. (1998). Discovery-driven Exploration of OLAP
Data Cubes. In Proceedings of the 6th International Conference on Extending
Database Technology (EDBT’1998), Valencia, Spain, March.

A Data Mining-Based OLAP Aggregation
47
Termier, A., Rousset, M., & Sebag, M. (2002). TreeFinder: a First Step towards XML Data
Mining. In Proceedings of the 2nd IEEE International Conference on Data Mining
(ICDM’02), Maebashi City, Japan, December, (pp 450-457)
Tjioe, H.C., & Taniar, D. (2005). Mining Association Rules in Data Warehouses.
International Journal of Data Warehousing and Mining, Idea Group Inc., 1(3), 28-62.
Trujillo, J., Lujàn-Mora, S., & Song, I.Y. (2004). Applying UML and XML for Designing and
Interchanging Information for Data Warehouses and OLAP Applications. Journal of
Database Management, 15(1), 41-72.
Ward, J. (1963). Hierarchical Grouping to Optimize an Objective Function. Journal of the
American Statistical Association, 58, 236-244.
Zighed, D., Lallich, S., Muhlenbach, F. (2002). A statistical Approach for Separability of
Classes. In Statistical Learning, Theory and Applications, Paris, France, November.
1 http://marathon.csee.usf.edu/Mammography/Database.html
2 XML documents of the screening mammography data cube are available at: http://eric.univ-
lyon2.fr/~rbenmessaoud/?page=donnees§ion=3
Top Related