


Languages
Pages
Legal


A comparative study of risk assessment methods,
MEHARI & CRAMM with a new formal model of risk
assessment (FoMRA) in Information Systems
Imed El Fray
West Pomeranian University of Technology, Szczecin
Faculty of Computer Science, Szczecin, Poland, [email protected]
Abstract. In this article, we present a comparative study of a developed new
formal mathematical model of risk assessment (FoMRA) with expert methods
of risk assessment in the information systems (IS). Proposed analysis verified
the correctness of theoretical assumptions of developed model. In the paper, the
examples of computations illustrating the application of FoMRA and known
and accepted throughout the world methods of risk assessment: MEHARI and
CRAMM were presented and related to a specific unit of the public
administration operating in Poland.
Keywords: risk assessment in information systems, risk assessment methods,
MEHARI, CRAMM, FoMRA, comparative analysis of risk assessment methods.
1 Introduction
Continuous technological innovations and competition among existing and entering
into the market organizations (firms) enable customer’s access to a wider range of
services and products delivered by the ICT systems [1,2,3]. A rapid development of
the IT systems and growing acceptance of the Internet as a medium (channel) of
products and services distribution, carries both benefits and risks [4,5]. A particular
risk arises from the possibility of unauthorized disclosure, modification or removal of
a larger amount of a significant information without leaving traces of an unauthorized
access [6,7,8]. A particular attention should be paid nowadays to ensure an
appropriate, understandable as a secure, access to such a type of systems [9,10].
The choice of methods to ensure the security of the IT systems in a given
organization should be relevant to the type of risk. A transparent and proactive
approach to the analysis and risk management may not only minimize risk but also
allows achieving a competitive supremacy of the organization [11,12].
Among the methods of risk assessment, a particular attention is paid to the
methods, which can be represented by means of the mathematical models. One of
such models has been developed by us and described in detail in [13]. The advantage
of this formal mathematical model of risk assessment (FoMRA) on the background
of existing models (shown below) is that, it enables the performing of risk assessment
of the information system of the organization according to the ISO/IEC standards
and OECD recommendations.
In this paper, a comparative analysis will be performed in order to demonstrate the
correctness of the FoMRA theoretical assumptions on the background of the expert
methods such as the CRAMM and MEHARI, accepted and applied by many
professionals throughout the world.
2 Description of the risk evaluation methods
Nowadays, amongst about 200 available methods of risk assessment and risk
management [14], only few have found the acceptance of the market, including
COBRA [15], COBIT [16], OCTAVE [17], CRAMM [18] and MEHARI [19]. The
majority of these methods is based on know-how solutions developed by the
independent or governmental organizations of different countries, and is assigned for
the application in the governmental systems and public service organizations. These
methods are not supported by proofs based on formal mathematical models, but they
are only the collections of good practices within the IT Governance [20].
One of the first formalized methods of risk assessment for the information systems,
approved as the government standard in the USA, is the Courtney method [21]. It
considers the risk of information systems in terms of confidentiality, integrity and
availability.
The Courtney method, being a standard in the USA, was developed by Fisher and
others [22,23], but Parker was the first one, who eliminated the weak points of this
method [24]. These weak points, as reported recently in [25,13], are related to the
“human factor” which influences the risk of the incident. Parker, who applied
mathematical knowledge and the experience of the IT experts, has proposed the risk
analysis model containing five phases as described in [24].
The model above is an improved model proposed by Courtney. Most of elaborated
quantitative, qualitative methods (graph-based, static and dynamic, relational and
Markov) uses some or the majority of the assumptions of a standard model proposed
by Parker [26,27,28,29,30]. These methods differ, however, in the approaches to the
identification and classification of the assets, vulnerabilities and risks, the risk value
assessment, the choice of countermeasures, etc. This fact makes the most of the
methods presented above to move in quite different directions, even if the final goal
seems to be the same [14]. In most cases, it is thus impossible to directly compare
results generated by two different methods, and an indirect comparison is hard and
time-consuming, even if conversion mechanisms are obtainable. The important
questions thus become whether these more or less widely used methods are
competent? whether they can properly describe any IT system? and whether they
effectively ensure declared compliance with standards?
Some answers to these questions were provided in the paper [13] we propose a
formal model for risk assessment (FoMRA) based on the experience of experts who
created the MEHARI method and it complies with the requirements and standards’
guidelines for the security of the information systems [simplified model is presented
in Section 2.1].
In this paper, the FoMRA model described in [13], will be a subject of the
comparative analysis aiming, as mentioned above, to demonstrate the correctness of
the theoretical assumptions of the model against the well-known and widely used
methods of risk assessment. The experimental results of the risk analysis should
confirm whether the FoMRA is meaningful, and if it truly describes any information
system, and whether these results are comparable with the results obtained from other
methods.
2.1 Simplified Formal Model of Risk Analysis (FoMRA)
The defined mathematical structures of the standard formal model of risk assessment
(FoMRA), were used to precisely define a graph for calculating risk values [13], and
to define an algorithm of its construction. Briefly, let A be a set of some assets1:
..., ,1 : Ai niaA (1)
Additionally, let us consider the following finite sets:
..., ,1: Vj njvV - a set of vulnerability classes, (2)
..., ,1 : Tk nktT - a set of threat classes, (3)
..., ,1 : Sl nlsS - a set of risk scenarios, (4)
..., ,1 : DPs nsdpDP - a set of measures reducing a potentiality, (5)
..., ,1 : DIt ntdiDI - a set of measures reducing an impact. (6)
The above sets define classes of system assets, vulnerabilities concerning threats,
classes of threats for assets, risk scenarios and measures reducing potentialities and
impacts of threats resulting from assets losses.
Let us assume that there is a given and ordered set of n-values for the
arguments in IS system (according to [13]), corresponding to sets A, V, T, DP, DI, and
M, W, where M and W are subsequent arrays and values reducing threats, risks and
consequences of risk.
In this set Nrr maxmin, , where N is the set of natural numbers,
additional auxiliary functions are defined:
─ *** : Avalue
A - which assigns to a given asset Aa the values
of three basic security parameters: CIA (Confidentiality, Integrity, Availability)
─ : Vvalue
V - which assigns the values of three parameters
depending on AEV (Accident, Error, Voluntary) to a given natural vulnerability
Vv (a so-called “natural exposure”, independent from the security measures
used)
o For A
value , V
value
set null* , where *null is the neutral
value, what means that such a function’s argument value does not have the
defined feature, and no value can therefore be assigned to it.
─ : TvalueT
- assigning a given threat Tt to t value,
1 The numbers
DIDPTSVA nnnnnn ,,,,, further used are some relevantly great natural numbers.
─ NSDPvalueDP
: - assigning given measures reducing the threat
potentiality DPd p to pd value.
Additionally, in order to determine the risk values asW , for any risk scenario s
assigned to an asset a the following arrays are predefined:
─ an array of potentiality reduction nnn
s
potM , which makes a declared value of
measure-reducing potentialities ],,[ kjiW s
pot dependent on jsCM , (for
particular j=dp1, ..., DPndp ) and vulnerability value vvalueV ,
─ an array of impact nnn
s
impM , which makes a declared value of measure-
reducing impacts ],,[ kjiW s
imp dependent on jsCM , (for particular j=di1, ...,
DIndi ),
─ an array of impact reduction nn
as
impM
,, which makes a declared value of
measures-reducing impact ],[, jiW as
imp dependent on the value s
impW
determined from the array nnn
s
impM and the value of an asset avalueA ,
─ an array of risk nnasM
,, which makes a declared value of risk ],[, jiW as
dependent on the value s
potW determined from the array nnn
s
potM and value
as
impW , determined from the array nn
as
impM
,.
jsCM , is a weighted value of the measure reducing the potentiality and impact
of some threat. The following formula (7) shows how to calculate values for
potentiality and impact actions:
5.0)(
minminmax, rP
PRrrCM
i
ii
js (7)
where:
─ DIDPj – represents implemented measure/countermeasure,
─ x - indicates the rounding down of the result x to the number belonging to
the set (to the infimum of x in this set),
─ Ri– is an answer to an audit question (the value 1 or 0),
─ iXi RnosjvalueP ,, – is a value assigned to an i-th question, where X = DP
or DI, which depends on the defined measure type j scenario s and a number of
the question no(Ri) associated with the answer Ri.
The values of defined arrayss
potM , s
impM as
impM , and asM , should depend on the
criticality of business processes in a given organization, and should not be "rigidly"
taken, as proposed in most methods such as CRAMM and MEHARI. The criticality
of the process depends on vulnerability values vvalueV , assets avalueA and the
effectiveness of the implemented measures reducing potentialities
),...,1:( DPs nsdpDP and impacts ),...,1:( DIt ntdpDI .
For these specific arrays, the following sets of arrays are also determined:
}{ ),( :
s
potpot MMDPdps
DPdps
(8)
}{ ),( :
s
impimp MMDIdis
DIdis
(9)
}{ ,
),( :
as
imp
a
imp MMDIdis
DIdis
(10)
}{ ,
),(
as
SAsaMM
(11)
The above brief description of the FoMRA complies with the fundamental
requirements of the ISO standard: ISO/IEC 27005:2011 - Security techniques -
Information security risk management. The FoMRA allows to conduct completely a
comparative analysis with other methods, as shown below.
2.2 Description of methods used in comparative analysis
The choice of the CRAMM and MEHARI methods for comparative analysis has been
made to demonstrate the correctness of the theoretical assumptions of the FoMRA
[13]. These methods are widely accepted by the risk analysis and security
management experts.
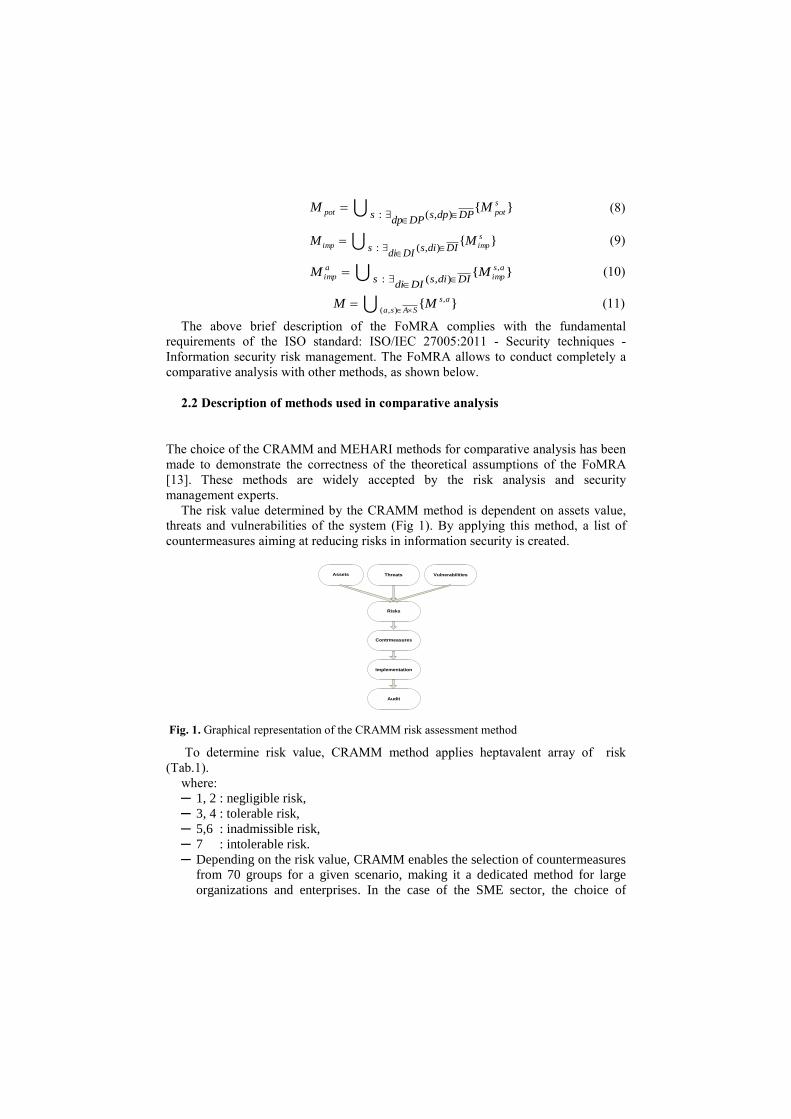
The risk value determined by the CRAMM method is dependent on assets value,
threats and vulnerabilities of the system (Fig 1). By applying this method, a list of
countermeasures aiming at reducing risks in information security is created.
Assets Threats Vulnerabilities
Risks
Contrmeasures
Implementation
Audit
Fig. 1. Graphical representation of the CRAMM risk assessment method
To determine risk value, CRAMM method applies heptavalent array of risk
(Tab.1).
where:
─ 1, 2 : negligible risk,
─ 3, 4 : tolerable risk,
─ 5,6 : inadmissible risk,
─ 7 : intolerable risk.
─ Depending on the risk value, CRAMM enables the selection of countermeasures
from 70 groups for a given scenario, making it a dedicated method for large
organizations and enterprises. In the case of the SME sector, the choice of

countermeasures may not be optimal, since risk does not match the scale of the
risk of failure due to the scale of the enterprise.
Table 1. The array of risk value according the CRAMM method
Threats VL VL VL L L L M M M H H H VH VH VH
Vuln. L M H L M H L M H L M H L M H
Assets/V
alu
e
1 1 1 1 1 1 1 1 1 2 1 2 2 2 2 3
2 1 1 2 1 2 2 2 2 3 2 3 3 3 3 4
3 1 2 2 2 2 2 2 3 3 3 3 4 3 4 4
4 2 2 3 2 3 3 3 3 4 3 4 4 3 4 4
5 2 3 3 3 3 4 3 4 4 4 4 4 4 4 5
6 3 3 4 3 4 4 4 4 5 4 5 5 5 5 6
7 3 4 4 4 4 5 4 5 5 5 5 6 5 6 6
8 4 4 5 4 5 5 5 5 6 5 6 6 6 6 7
9 4 5 5 5 5 6 5 6 6 6 6 7 6 7 7
10 5 5 6 5 6 6 6 6 6 6 7 7 7 7 7
V.L – Very Low, L – Low, M –Medium, H – High, V.H – Very High
According to various reviews [32,33], CRAMM as a commercial tool, should be
used only by the experienced users, since it generates too much information, it is
inflexible and slow. The full analysis can take months, instead of several days.
Unlike CRAMM, the MEHARI method is available as a Know-How knowledge
base (in the Excel File) related to threats, vulnerabilities and threat scenarios
assessment.
The MEHARI method is based on the knowledge of assets, vulnerabilities and
threats identification and classification, and the assessment of risk levels (Fig. 2).
Identify your main
business assets
Diagnose your
vulnerabilities
Assess your risks
Build your plan of action
Fig. 2. Graphical representation of the MEHARI risk assessment method
To determine risk value, the MEHARI method applies tetravalent array of a risk
(Tab. 2).
Table 2. The array of risk value according to the MEHARI method
Impact
4 2 3 4 4
3 2 3 3 4
2 1 2 2 3
1 1 1 1 2
1 2 3 4
Potentiality

where:
─ 1 : negligible risk,
─ 2 : tolerable risk,
─ 3 : inadmissible risk,
─ 4 : intolerable risk.
The risk value in the MEHARI method depends on the potentiality and impact
values for each of the identified risk scenarios. According to various authors [32,33],
the MEHARI method is flexible and dedicated to small and large organizations. The
disadvantage of this method is the lack of data bases of countermeasures which are
reducing risks in information security systems. Moreover, new upgrade issued in the
year 2012, delivering new knowledge base of vulnerabilities, threats, etc., made this
method even more complicated and a little more time-consuming.
Tables 1 and 2 determine the risk values estimation for each type of the
organization for each of the methods mentioned above . They indicate the risk that a
given organization takes into account as: (i)) intolerable (risk demanding the
immediate implementation of countermeasures, despite of the organization budget
and security plans), (ii) inadmissible (risk must be eliminated or minimized sooner or
later, according to the established organization budget and security plans), or (iii)
tolerable (low or insignificant risks - depending on the organization's security policy).
3 Conditions and results of the experiment
To perform a comparative analysis demonstrating the correctness of the theoretical
assumptions of the FoMRA [12], we have to:
─ establish an uniform scale of risk value array (CRAMM, MEHARI, FoMRA),
─ use the same assets, vulnerabilities, threat/risk scenarios for various methods of
risk analysis.
It was assumed for the analysis that the scale of risk value is in the range <1 - 4>.
The assumed scale is not dictated by any requirements, only for ease operation of the
quantitative records (for the MEHARI method and FoMRA), dissimilar to
quantitative-qualitative as CRAMM.
It was also assumed that risk values (MEHARI and FoMRA versus CRAMM)
should be interpreted after transformation as follows:
─ for risk value: 1 = (1,2); 2 = (3,4); 3 = (5,6); 4 = 7 - and they correspond to the
set of values given in (CRAMM and MEHARI). The scale of risk values
according to the FoMRA is flexible [17] and can be matched to any of the above
methods.
Additionally, the following classification system was used:
─ for assets: 1 - less important, 2 - important 3 - very important, 4 - critical
─ vulnerability/threat: 1 = Very Low/Low, 2 = Medium, 3 = High, 4 = Very High
The data derived from the analysis of the IT security of the administrative unit
operating in Poland were used to perform the comparative analysis.
FoMRA was used to perform a pre-audit [13] which allowed to identify
confidentiality (C), integrity (I), and availability (A). Table 3 shows an example of the
identified CIA parameters.

Table 3. The results of the pre-audit of resources and vulnerabilities for a given organization
A Assets ValueA(a) V Vulnerability ValueV(v)
C I A A E V
a1 Data files or data bases accessed
by applications
4 4 3 v1 Distorted data entry or
fiddling of data
null null 3
a5 Written or printed information and
data kept by users and personal
archives
2 2 2 v3 Intentional erasure (direct or
indirect), theft or destruction
of program or data containers
null null 3
a6 Main systems, servers hosting
applications and their peripheral
equipments, shared file servers
null null 4 v5 IT or telecom equipment
breakdown
2 null null
a9 Application software, package or
middleware (executable code)
null null 2 v15 Bug in application program null 4 null
… … … … … … … … … …
For each of the threat scenarios (s1, s2, ..., sn) the risk value asW ,
was calculated. To
calculate the asW ,
value, the results from the audit questionnaire were used. The audit
concerned the implemented dissuasive measures, preventing from potential threats
(measures defined in formula 5) and protective, preventive as well as palliative
measures, depending on the threat type (measures reducing threat, formula 6). The
questionnaire results taken from the MEHARI knowledge base [19] have been used to
perform audit. Similar questionnaires are also available from the OCTAVE [17],
EBIOS [34], CRAMM [18], etc. One should note that the content of the audit
questionnaires may not perfectly match between the analyzed methods (certain audit
questionnaires from the MEHARI contain more details and higher number of
implemented countermeasures as compared to the CRAMM audit questionnaires and
vice versa, for the same hazard risk scenarios).
The situation may happen when one or more of the audit questionnaires will be
covered in one method, while not in the other one (e.g., audit questionnaires related to
the recovery measures in the MEHARI method do not have the coverage in the
CRAMM method, because such measures are not taken into account there). This
situation can ultimately affect the outcome of risk assessment (e.g. risk values).
Table 4 shows a section of the questionnaire for the audit of dissuasive measures
against theft of archives in an office for asset a5 - written or printed information and
data kept by users and personal archives, susceptibility v3 - intentional erasure (direct
or indirect), theft or destruction of a program or data containers and the threat t2 - loss
of data files or documents: theft of data media.
Table 4. Section of the audit questionnaire related to the dissuasive measures of the potential
attackers against theft of archival documents
Monitoring of protected office areas Response (0/1) Valuepi
Is there a complementary video surveillance system, complete and coherent, for protected office areas,
able to detect movement and abnormal behaviour?
1 4
In the case of an alarm, does the surveillance team have the possibility of sending out an intervention
team without delay to verify the cause of the alarm and to take appropriate action?
1 2
Has the security team sufficient resources to cover the eventuality of multiple alarms set off intentionally? 0 4
Is video surveillance material recorded and kept for a long period? 1 1
Is the intrusion detection system itself under surveillance (alarm in the case of shutdown, video auto-
surveillance etc.)?
1 2
Are procedures for surveillance and intervention in the case of abnormal behaviour audited regularly? 1 2
According to formula 7, we calculate the weighted value of measures CMs,j
(CMs,j=1 means that the measure is ineffective and CMs,j = 4 means that it is very

effective) for each identified scenario s. The following example shows the calculation
of CMs,j = dp1 for dissuasive measures taken from table 4 (scenario s15-value in bold):
3115
)212111402141()14(
18 ,
dpjsCM
where:
1/0 - means Yes / No
Table 5 shows the calculation of the weighted values of the CMs,j for exemplary
scenarios of threats. As can be seen from the table, some of CMs, j measures have
value equal to 1. This value may be the result of calculation as above or can be taken
arbitrarily in the absence of such measures (scenario s4 - bold values). For example, in
order to prevent copying the application data files (s4) by a potential hacker, we can
only use the protective measures against copying and/or measure-reducing impacts of
copying. The use of effective dissuasive measures against potential hacker (to
discourage him from performing an attack) is, however, minimal or impossible.
Table 5. An example of the calculated weighted values of CMs, j for exemplary threat scenarios
N0 Scenario -S Parameters’
& ValueA(a)
Parameters’
& ValueV(v)
CMs,j=dp1=
valueDP (dp1)
CMs,j=dp2=
valueDP (dp2)
CMs,j=di1=
valueDI (di1)
CMs,j=di2=
valueDI (di2)
CMs,j=di3=
valueDI (di3)
CIA value AEV value
S4 Repeated copy of application
data files, by a hacker
connecting from outside to an
open port for network remote
maintenance
C a1=4 V v2=3 1 3 4 1 1
S15 Loss of data files or
documents: theft of archives
in an office
A a5=2 V v3=3 3 2 1 2 3
… … … … … … … … … …
Further procedure is the s
potW , s
impW ,as
impW , calculation and
asW ,mentioned above.
For this purpose, the standard values of the risk arrayss
potM ,s
impM , as
impM , and
asM ,
described in detail in [13] were considered. Tables 6,7 and 8 illustrate all the
necessary data to calculate the risk values for the selected threats in an exemplary
administrative unit. Tables cover all the CIA safety parameters and types of actions
using vulnerabilities AEV within FoMRA. The table also includes the results of
analysis performed according to the MEHARI and CRAMM methods. During the risk
assessment with the use of CRAMM and MEHARI methods, the system of resources,
vulnerabilities and risks classification was used. The scale of risk values was set
according to the requirements of both methods. The audit questionnaires from each of
the methods were used during the analysis in accordance to the requirements
described above (with the same resources, vulnerabilities, and threat / risk scenarios).
The results obtained with the use of the FoMRA for 14 out of the 21 scenarios
presented in Table 7, Table 8 and Figure 5 are comparable with those obtained using
CRAMM (Fig. 3). In turn, 16 out of the 21 scenarios are comparable with those
obtained using MEHARI (Fig. 4). Analyzing the results derived from the CRAMM
and MEHARI and given in Table 8, we received comparable results, for which 14 out
of the 21 scenarios overlaps.
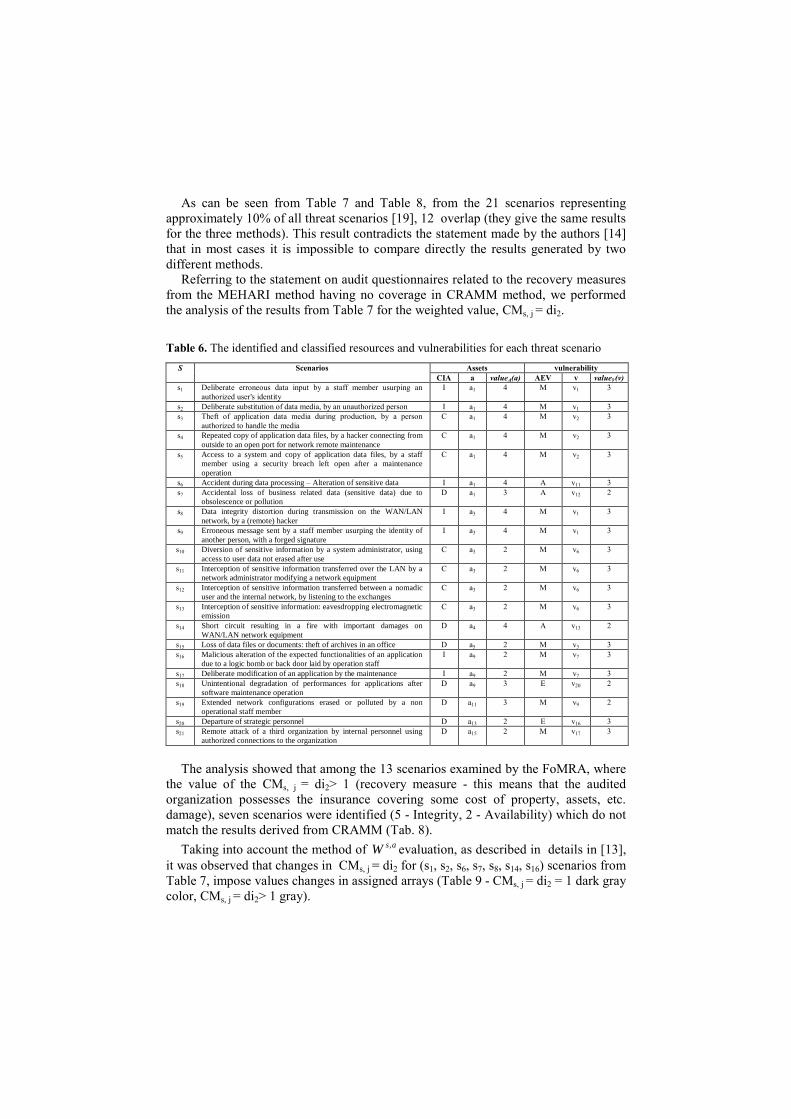
As can be seen from Table 7 and Table 8, from the 21 scenarios representing
approximately 10% of all threat scenarios [19], 12 overlap (they give the same results
for the three methods). This result contradicts the statement made by the authors [14]
that in most cases it is impossible to compare directly the results generated by two
different methods.
Referring to the statement on audit questionnaires related to the recovery measures
from the MEHARI method having no coverage in CRAMM method, we performed
the analysis of the results from Table 7 for the weighted value, CMs, j = di2.
Table 6. The identified and classified resources and vulnerabilities for each threat scenario
S Scenarios Assets vulnerability
CIA a valueA(a) AEV v valueV(v)
s1 Deliberate erroneous data input by a staff member usurping an
authorized user's identity
I a1 4 M v1 3
s2 Deliberate substitution of data media, by an unauthorized person I a1 4 M v1 3
s3 Theft of application data media during production, by a person
authorized to handle the media
C a1 4 M v2 3
s4 Repeated copy of application data files, by a hacker connecting from
outside to an open port for network remote maintenance
C a1 4 M v2 3
s5 Access to a system and copy of application data files, by a staff
member using a security breach left open after a maintenance
operation
C a1 4 M v2 3
s6 Accident during data processing – Alteration of sensitive data I a1 4 A v11 3
s7 Accidental loss of business related data (sensitive data) due to
obsolescence or pollution
D a1 3 A v12 2
s8 Data integrity distortion during transmission on the WAN/LAN
network, by a (remote) hacker
I a3 4 M v1 3
s9 Erroneous message sent by a staff member usurping the identity of
another person, with a forged signature
I a3 4 M v1 3
s10 Diversion of sensitive information by a system administrator, using
access to user data not erased after use
C a3 2 M v6 3
s11 Interception of sensitive information transferred over the LAN by a
network administrator modifying a network equipment
C a3 2 M v6 3
s12 Interception of sensitive information transferred between a nomadic
user and the internal network, by listening to the exchanges
C a3 2 M v6 3
s13 Interception of sensitive information: eavesdropping electromagnetic
emission
C a3 2 M v6 3
s14 Short circuit resulting in a fire with important damages on
WAN/LAN network equipment
D a4 4 A v13 2
s15 Loss of data files or documents: theft of archives in an office D a5 2 M v3 3
s16 Malicious alteration of the expected functionalities of an application
due to a logic bomb or back door laid by operation staff
I a9 2 M v7 3
s17 Deliberate modification of an application by the maintenance I a9 2 M v7 3
s18 Unintentional degradation of performances for applications after
software maintenance operation
D a9 3 E v20 2
s19 Extended network configurations erased or polluted by a non
operational staff member
D a11 3 M v9 2
s20 Departure of strategic personnel D a13 2 E v16 3
s21 Remote attack of a third organization by internal personnel using
authorized connections to the organization
D a15 2 M v17 3
The analysis showed that among the 13 scenarios examined by the FoMRA, where
the value of the CMs, j = di2> 1 (recovery measure - this means that the audited
organization possesses the insurance covering some cost of property, assets, etc.
damage), seven scenarios were identified (5 - Integrity, 2 - Availability) which do not
match the results derived from CRAMM (Tab. 8).
Taking into account the method of asW ,
evaluation, as described in details in [13],
it was observed that changes in CMs, j = di2 for (s1, s2, s6, s7, s8, s14, s16) scenarios from
Table 7, impose values changes in assigned arrays (Table 9 - CMs, j = di2 = 1 dark gray
color, CMs, j = di2> 1 gray).

Table 7. Calculated risk values using FoMRA for selected scenarios on the example of
administrative unit operating in Poland
S Risk value FoMRA
CMs,j=dp1 CMs,j=dp2 Wspot CMs,j=di1 CMs,j=di2 CMs,j=di3 Ws
imp Ws,aimp Ws,a
s1 1 2 3 2 2 1 2 2 2
s2 4 2 2 2 2 1 2 2 2
s3 3 1 3 1 1 1 4 4 4
s4 1 3 2 4 1 1 3 3 3
s5 3 3 2 2 1 1 3 3 3
s6 1 3 2 3 2 4 2 2 2
s7 1 2 2 3 2 3 2 2 2
s8 1 2 3 3 2 1 2 2 2
s9 1 2 3 1 2 1 4 4 4
s10 2 3 2 2 1 1 3 2 2
s11 2 2 3 3 1 1 3 2 2
s12 1 3 2 1 1 1 4 2 2
s13 1 2 3 1 1 1 4 2 2
s14 1 3 2 3 3 3 2 2 2
s15 3 2 2 1 2 3 3 2 2
s16 2 4 1 2 2 1 2 2 1
s17 3 3 2 1 2 1 4 2 2
s18 1 2 2 1 2 3 3 3 3
s19 1 3 2 2 2 3 3 3 3
s20 1 1 3 1 2 4 3 2 2
s21 3 2 2 2 1 1 3 2 2
Table 8. Calculated risk values using CRAMM and MEHARI for selected scenarios on the
example of administrative unit operating in Poland
S Risk value CRAMM Risk value MEHARI
valueA(a) valueV (v) valueT (t) WCRAMM <1,7> WCRAMM <1,4> Wpot Wimp WMEHARI
s1 10 H M 6 3 3 4 4
s2 9 M M 6 3 2 4 3
s3 9 M V.H 7 4 3 4 4
s4 9 M M 6 3 2 3 3
s5 9 L H 6 3 2 3 3
s6 9 M M 6 3 2 3 3
s7 9 M M 5 3 2 2 2
s8 10 H M 6 3 3 2 2
s9 10 H V.H 7 4 3 4 4
s10 3 L H 3 2 2 2 2
s11 4 M M 3 2 3 2 2
s12 4 M V.H 4 2 2 3 3
s13 4 H V.H 4 2 3 2 2
s14 10 L M 6 3 2 2 2
s15 3 L H 3 2 2 2 2
s16 4 L M 3 2 1 2 1
s17 4 L M 3 2 2 2 2
s18 8 H H 6 3 2 2 2
s19 6 M H 5 3 2 3 3
s20 5 H H 4 2 3 2 2
s21 4 M H 4 2 2 2 2
Fig. 3. Risk value assessed
from CRAMM method
Fig. 4. Risk value assessed
from MEHARI method
Fig. 5. Risk value assessed
from FoMRA method

The values, s
potW , s
impW , as
impW , and asW , are read from diagonals of s
potM , s
impM ,
as
impM , ,asM ,
arrays.
Table 9. Impact Arrays s
impM in relation to CIA parameters
Integrity CMs,j=di1 - protective =4 CMs,j=di1 - protective =3 CMs,j=di1 - protective =2 CMs,j=di1 - protective =1
CM
s,j=
di2
_
reco
ver
y
4 1 1 1 1
CM
s,j=
di2
_
reco
ver
y
4 1 1 1 1
CM
s,j=
di2
_
reco
ver
y
4 2 2 1 1
CM
s,j=
di2
_
reco
ver
y
4 4 3 2 1
3 1 1 1 1 3 1 1 1 1 3 2 2 1 1 3 4 3 2 1
2 2 2 2 2 2 2 2 2 2 2 2 2 2 2 2 4 3 2 2
1 3 3 3 3 1 3 3 3 3 1 3 3 3 3 1 4 3 3 3
1 2 3 4 1 2 3 4 1 2 3 4 1 2 3 4
CMs,j=di3 - palliative CMs,j=di3 - palliative CMs,j=di3 - palliative CMs,j=di3 - palliative
Availability CMs,j=di1 - protective =4 CMs,j=di1 - protective =3 CMs,j=di1 - protective =2 CMs,j=di1 - protective =1
CM
s,j=
di2
_
reco
ver
y
4 3 3 2 1
CM
s,j=
di2
_
reco
ver
y
4 3 3 2 1 C
Ms,
j=d
i2_
reco
ver
y
4 3 3 2 1
CM
s,j=
di2
_
reco
ver
y
4 4 3 2 2
3 3 3 2 1 3 3 3 2 1 3 3 3 2 1 3 4 3 3 2
2 3 3 2 2 2 3 3 2 2 2 3 3 3 2 2 4 3 3 3
1 3 3 3 3 1 3 3 3 3 1 3 3 3 3 1 4 3 3 3
1 2 3 4 1 2 3 4 1 2 3 4 1 2 3 4
CMs,j=di3 - palliative CMs,j=di3 - palliative CMs,j=di3 - palliative CMs,j=di3 - palliative
Given the additional asset values (a1, a3, a4, a9) attributed to scenarios (s1, s2, s6, s7,
s8, s14, s16) from Table 6, it was noticed that for assets (a1, a3, a4), classified as very
important or critical, the change in the value s
impW (including CMs, j = di2> 1, gray
color, and CMs, j = di2 = 1 dark gray color) derived from s
impM array, affect the
changes of values in Table 10. All other assets assigned to scenarios (in our case, a9
s16), classified as minor or major ones, do not affect value changes. This situation
may be related to asset value (classified as significant), which is comparable to or
lower than the security cost.
Finally, it can be concluded that by considering recovery measures for losses
related to some assets revealed when determining the risk value, asW ,
from Tab. 11,
for 6 out of the 7 scenarios derived from the FoMRA, a significant effect on the
resulting difference in risk values between this model and a CRAMM method was
observed.
To unambiguously confirm the above statement, an explanation concerning the
lack of changes in risk value reduction, CMs, j = di2> 1 in 6 among 13 scenarios (s9,
s15s17, s18, s19, s20), needs to be found.
Table 10. Array reducing impact Table 11. Array of risk value
ValueA(a)
4 1 2 3 4
3 1 2 3 3
2 1 2 2 2
1 1 1 1 2
1 2 3 4
Wsimp
Ws,aimp
4 2 3 4 4
3 2 3 3 4
2 1 2 2 3
1 1 1 1 2
1 2 3 4
Wspot
For scenarios (s9, s17) associated with the Integrity parameter (Tab.12), at the
absence of the protective measures, changes in the weighted value, CMs,j = di2 do not

affect the obtained value, s
impW from s
impM array (dark gray color for the CMs, j = di2
= 1, gray color for CMs, j = di2> 1).
Table 12. Impact Arrays s
impM in relation to the CIA parameters
Integrity CMs,j=di1 - protective =4 CMs,j=di1 - protective =3 CMs,j=di1 - protective =2 CMs,j=di1 - protective =1
CM
s,j=
di2
_
reco
ver
y
4 1 1 1 1
CM
s,j=
di2
_
reco
ver
y
4 1 1 1 1
CM
s,j=
di2
_
reco
ver
y
4 2 2 1 1
CM
s,j=
di2
_
reco
ver
y
4 4 3 2 1
3 1 1 1 1 3 1 1 1 1 3 2 2 1 1 3 4 3 2 1
2 2 2 2 2 2 2 2 2 2 2 2 2 2 2 2 4 3 2 2
1 3 3 3 3 1 3 3 3 3 1 3 3 3 3 1 4 3 3 3
1 2 3 4 1 2 3 4 1 2 3 4 1 2 3 4
CMs,j=di3 - palliative CMs,j=di3 - palliative CMs,j=di3 - palliative CMs,j=di3 - palliative
Availability CMs,j=di1 - protective =4 CMs,j=di1 - protective =3 CMs,j=di1 - protective =2 CMs,j=di1 - protective =1
CM
s,j=
di2
_
reco
ver
y
4 3 3 2 1
CM
s,j=
di2
_
reco
ver
y
4 3 3 2 1
CM
s,j=
di2
_
reco
ver
y
4 3 3 2 1
CM
s,j=
di2
_
reco
ver
y
4 4 3 2 2
3 3 3 2 1 3 3 3 2 1 3 3 3 2 1 3 4 3 3 2
2 3 3 2 2 2 3 3 2 2 2 3 3 3 2 2 4 3 3 3
1 3 3 3 3 1 3 3 3 3 1 3 3 3 3 1 4 3 3 3
1 2 3 4 1 2 3 4 1 2 3 4 1 2 3 4
CMs,j=di3 - palliative CMs,j=di3 - palliative CMs,j=di3 - palliative CMs,j=di3 - palliative
Other scenarios (s15, s18, s19, s20) associated with the Availability parameter (Table
12) show also no difference for derived values s
impW from the array (CMs, j = di2 = 1
dark gray, and CMs, j = di2 = 2 gray).
As can be seen from the Table 11, noticeable differences in values, s
impW appear for
CMs, j = di2> 2. In a situation where there are no differences in s
impW values for the
weighted value, CMs, j = di2 = 1 and the calculated CMs, j = di2 = 2, the value as
impW , and
asW , determined from the
as
impM , and
asM ,arrays, will be the same for the identified
and classified assets, etc.
Taking into account the derived results, it can be unambiguously stated that by
considering the recovery measures of resulting losses from threats, an effect in
differences of risk values between the FoMRA a CRAMM methods is noticed. The
rationale for the resulting difference is coming out from a different structure of both
methods. According to the literature [32], CRAMM and MEHARI methods are
designed to analyze active risk (preventive measures are planned as a reaction to the
possible risks before they occur). The proposed FoMRA, which is partially based on
the MEHARI method (with the same requirements for asW , assessment [13]) includes
recovery measures, which leads to statement that both, FoMRA and MEHARI method
are dedicated for partial analysis of reactive risk (some preventive measures are
applied "post factum", after the occurrence and identification of a risk and as a
reaction to it).

4 Summary
A comparative analysis of a new model against the well-known and widely used
methods of risk assessment was discussed. The obtained experimental results confirm
the correctness of theoretical assumptions of the FoMRA model. Comparative
analysis of the model gave almost identical results of risk values, assuming lack of the
recovery measures in the FoMRA, oppositely to CRAMM methods. Considering
CRAMM as the most well-known, accepted and used method for risk assessment in
various IT systems (source materials for establishment ISO/IEC 27002 standard [31]),
it can be concluded that the proposed FoMRA is meaningful, it is not difficult and
laborious and can describe really well any information system, as it was shown on the
example of an administrative unit operating in Poland. It can also be adapted to any
organization. Further research is primarily focused on the FoMRA development
towards its adaptation to any method, not only CRAMM or MEHARI. Another,
equally important issue is the possibility of avoiding cost and time-consuming
analyzes in the FoMRA, which must be performed after the introduction of any
changes in the system.
References
1. Datta, A.: Information Technology Capability, Knowledge Assets and Firm Innovation:
A Theoretical Framework for Conceptualizing the Role of Information Technology in
Firm Innovation. International Journal of Strategic Information Technology and
Applications. 2(2011) 9-26
2. Raduan, C. R., Jegak, U., Haslinda, A., Alimin, I.I.: A Conceptual Framework of the
Relationship Between Organizational Resources, Capabilities, Systems, Competitive
Advantage and Performance. Research Journal of International Studies. 12(2009) 45-58
3. Van Kleef, J.A.G., Roome, N.J.: Developing capabilities and competence for sustainable
business management as innovation: a research agenda. Journal of Cleaner Production.
15(2007) 38-51
4. Bhatnagar, A., Ghose, S.: Segmenting consumers based on the benefits and risks of
Internet shopping. Journal of Business Research. 57 (2004) 1352–1360
5. Byeong-Joon, M.: Consumer adoption of the internet as an information search and
product purchase channel: some research hypotheses. Int. J. Internet Marketing and
Advertising. 1(2004) 104-118
6. Bumsuk, J., Ingoo, H., Sangjae L.: Security threats to Internet: a Korean multi-industry
investigation. Information & Management. 38(2001) 487–498
7. Posthumus, S., Solms, R.: A framework for the governance of information security.
Computers & Security. 23(2004) 638–646
8. Baker, W. H., Wallace, L.: Is Information Security Under Control?: Investigating Quality
in Information Security Management. Security & Privacy, IEEE. 5(2007) 36 – 44
9. Yeh, Q-J., Chang, A., J-T.: Threats and countermeasures for information system security:
A cross-industry study. Information & Management. 44(2007) 480–491
10. Ezingeard, J. N., Bowen, S. M.: Triggers of change in information security management
practices. Journal of General Management. 32(2007) 53-72
11. Whitman, M. E., Mattord, H.: Principles of Information Security. 3rd ed., course
technology, Boston, US (2009)
12. Mellado, D., Blanco, C., Sánchez, L. E., Medina, E. F.: A systematic review of security
requirements engineering. Computer Standards & Interfaces. 32(2010) 153–165
13. El Fray, I., Kurkowski, M., Pejas, J., Mackow, W.: A New Mathematical Model for
Analytical Risk Assessment and Prediction in IT Systems. Control and Cybernetics
41(2012) 1-28
14. Mayer, N., Humbert, J. P. : La gestion des risques pour les systèmes d’information.
MISC-Éditions Diamond. 24(2006) 1-7
15. Consultative Objective and Bi-functional Risk Analysis (COBRA): C&A Security Risk
Analysis Group, UK (1991)
16. Control Objectives for Information and related Technology (COBIT). Information
Systems Audit and Control Association. US (2007)
17. Operationally Critical Threat, Asset, and Vulnerability Evaluation (OCTAVE): Carnegie
Mellon University, US (2006)
18. Risk Analysis and Management Method (CRAMM): Central Computing and
Telecommunications Agency. United Kingdom (1987)
19. Méthode Harmonisée d'Analyse de Risques (MEHARI): Club de la Sécurité de
l'Information Français, France (2010)
20. Moeller, R.: IT Audit, Control, and Security. John Wiley & Sons, Inc., Hoboken, New
Jersey, US (2010)
21. Guideline for Automatic Data Processing Risk Analysis: Federal Information Processing
Standard - FIPS 65. National Bureau of Standard, US (1997)
22. Dray, J.: Computer Security and Crime: Implications for Policy and Action. Information
Technology & People. 4(1988) 297-313
23. Fisher, T.: ROI in social media: A look at the arguments. Journal of Database Marketing
& Customer Strategy Management. 16 (2009) 189-195
24. Parker, D. B.: Computer Security Management. Reston Publishing Co., Reston, Virginia,
US (1991)
25. Rainer, R. K., Snyder, C. A., Carr, H. H.: Risk Analysis for Information Technology.
Journal of Management Information Systems archive. 8(1991) 129-147
26. Ferdous, R., Khan, F.I., Veitch, B., Amyotte, P.R.: Methodology for Computer-Aided
Fault Tree Analysis. Process Safety and Environmental Protection. 85(2007) 70–80
27. Andrews, J.D., Ridley L.M.: Application of the cause-consequence diagram method to
static systems. Reliability Engineering & System Safety. 75(2002) 47–58
28. Bartlett, M., Hurdle, E. E., Kelly, E. M.: Integrated system fault diagnostics utilising
digraph and fault tree-based approaches. Reliability Engineering & System Safety.
94(2009) 1107–1115
29. Jacoub, S. M., Ammar, H. H.: A methodology for architectural-level reliability risk
analysis. IEEE Transaction on Software Engineering. 28(2002) 529-547
30. Technical manual - Reliability/availability of electrical & mechanical systems for
command, control, communications, computer, intelligence, surveillance and
reconnaissance . Department of the U.S. Army, US (2007)
31. Information technology – Security techniques – Code of practice for information security
management. ISO/IEC 27002 (2007)
32. Inventory of Risk Management / Risk Assessment Methods. European Network and
information Security Agency. http://rm-inv.enisa.europa.eu/ methods_tools (03/2012)
33. Braun, G.: Information Security Risk Analysis and Decision Modelling. BWI-paper Vrije
Universiteit De Boelelaan HV Amsterdam (2002) 1-27
34. Expression des Besoins et Identification des Objectifs de Sécurité (EBIOS): Direction
Centrale de la Sécurité des Systèmes d’Information, France (2010)
Top Related