


Languages
Pages
Legal


A COMPARATIVE STUDY OF FOURTH GRADE CHILDREN'S
ATTITUDES TOWARD RUNNING \iKEN RUNNING
IS USED AS PUNISHMENT
A Thesis
Presented to
the Division of Health, Physical Educatio~and Recreation
Kansas State Teachers College of Emporia
In Partial Fulfillment
of the Requirements of the Degree
Master of Science
by
John M. "r~eyers
December 1972

T h, , j'.
{ , : :'~:-
r ,jI ~, {
W"t~\ A, ~O.l lU_1 _ Approved for the Major Department
OI,~;1 <::'/(;/ - '0pi/\...- i U £~fV'\
the Graduate Council
",,"1"',"':"'-3\S'~~:,,.3. ".' f.. 'lJ ,.

ACKNOWLEDGMENTS
I extend my deep appreciation to my wife, Connie,
for her assistance and understanding while this study was
in progress.
J.M.M.
i

TABLE OF CONTENTS
ACKNOVITEDGMENTS • Page
i
LIST OF TABLES iv
Chapter
1. INTRODUCTION • 1
The Problem 2
Hypothesis • 3
Assumptions 3
Definition of Terms 3
Limitations 4
Delimitations 4
Method • 4
2. REVIEW OF THE LITERATURE • 8
Development of Scales in Physical Education. 9
Attitude Assessment •••••••..... 12
Attitudes Toward Physical Education •••• 12
Attitudes Toward Physical Education and Other Influencing Factors • • • • • • • • 17
Attitude Change •••••••.•••••. 22
Sports Attitudes • • • • • • • • • • • • • • 24
Punishment • • • • • • • • • • • . • . . . . 26
Summary • • • • • • • • • • • • • • • • • • 28
3. PROCEDURES • 30
Nature of Subjects . 30
Orientation Procedures • )1
ii

• • • • •
Chapter Page
Facilities • • • • • • • • • • • • • • • • • • 33
Testing Procedures • • • • • • • • • • • • • • 35
4. ANALYSIS OF DATA • • • • • • • • • • • • • • • • 36
Description of Groups • • • •.• • • • • • • • 36
Control-Experimental Groupst Pretest • • •• 36
Control-Experimental Groups. Postest •••• 37
Control Groupt Pretest-Postest • • • • • • • 38
Experimental Group, Pretest-Postest • • • • • 39 Boys Control-Experimental I Pretest 40
Boys Control-Experimental. Postest • • • • • 41
Boys Control I Pretest-Postest • • • • • • • • 41
Boys Experimental I Pretest-Postest • • • • • 42
Girls Control, Experimental. Pretest • • • • 43
~irls Control, Experimental. Fostest • • .44•
Girls Control I Pretest-Postest • • • • • • • 45
Girls Experimentall Pretest-Postest • • • • • 46
5. surmY~RY AND CONCLUSIONS '. • • • • • • • • • • • 48
Findings •• • • I • • • • • • • • • • • • • • 48
Conclusions • • • • • • • • • • • • • • • • • 50
Interpretation of Data • • • • • • • • • • • • 51
Recommendations for Further Study • • • • • • 53
BIBLIOGRAPHY • I • •• • • • • • • • • • • • • • • • • 54 APPENDIX A ••
• I • • • • • • • • • • • • • • • • • • 59 APPENDIX B •• • • • • • • • • • • • • • • • • • • • · 61 APPENDIX C •• • • • • • • • • • • • • • • • • • • • · 6)
iii

LIST OF TABLES
Table Page
1. Analysis of Variance of the Sample Means for the Experimental and Control Groups Pretest • • • • 37
2. Analysis of Variance of the Sample Means of the Experimental and Control Groups Pastest • • • • 38
3. Analysis of Variance of the Sample Means of the Control Group, .Pretest and Postest • • • • • • 38
4. Analysis of Variance of the Sample Means of the Experimental Group, Pretest and Postest • • • • 39
5. Analysis of Variance of the Sample Means of the Boys Experimental and Control Groups Pretest • 40
6. Analysis of Variance of the Sample Means of the Boys Experimental and Control Groups Pastest • 41
7. Analysis of Variance of the Sample Means of the Boys Control Group,' Pretest and Postest • • • • 42
8. Analysis of Variance of the Sample Means of the Boys Experimental Group, Pretest and Postest • 43
9. Analysis of Variance of the Sample Means of the Girls Experimental and Control Groups Pretest • 44
10. Analysis of Variance of the Sample Means of the Fostest of the Control and Experimental Groups 45
11. Analysis of Variance of the Sample Means of the Girls Control Group, Pretest and Postest • • • 46
12. Analysis of Variance of the Sample Means for the Girls Experimental Group, Pretest and Postest • 47
iv

Chapter I
INTRODUCTION
Educators and other interested people have long
been searching for the explanation for differences in
attitudes among children with seemingly equal innate
capabilities. Psychologists and social psychologists
have pursued the determinants of attitude development.
The measurement of these attitudes can be surveyedi
described in measurable terms, and can be analyzed and
compared.
The field of education has long been interested
in the attitudes of students and the factors that
contribute to the formation of these attitudes. There
has also been evidence of interest in how and to what
degree physical education experiences influence the
development of various attitudes.
The development of attitudes in the individual
has been the aim of all education programs. It is
necessary to develop attitudes favorable to the direc
tion toward which the individual should move if this
goal is to be achieved. Children begin to form attitudes
at an early age and the elementary school years often
determine the pattern of future concepts and values.
Skills are also being developed at the elementary
school age and running appears to be one of the skills
1

2 that is being practiced. Through various experiences
involving running each elementary school child develops
attitudes that influence his interest in running. If
children are subjected to running as a means of punish
ment; it may be possible to assume that they may develop
a negative attitude toward running. If the previous
example is possible, education must continually examine
its purpose~' objectives, and practices to determine if
it is meeting the needs and interests of the children.
Physical educators should attempt to strengthen the
attitudes and appreciations that children have, or may
develop~ toward physical activity.
It was for this reason and the interest the
researcher had in determining the attitudes of students
when running was used as punishment that this study was
conducted.
The Problem
The problem of this investigation was to assess
the attitudes toward running of fourth grade boys and
girls, when running is used as punishment.
Hypothesis
Attitudes toward running will not significantly
differ when running is used as punishment.

3Assumptions
These assumptions were included for a better
interpretation of the investigation.
1. Running appears to be a natural instinct in
human beings.
2. Fourth grade children do not associate
running with punishment.
3. The attitudes of the fourth grade population
are very similar toward running.
4. The attitudes of fourth grade children toward
running can be measured.
5. The differences in surface; speed and distance
for the two groups run will not be significant.
Definition of Terms
The following terms were defined for a clearer
understanding of the study.
Attitudes. Dushkin states that an "attitude
is a predisposition to respond positively or negatively
to particular objects or issues" (13:680).
Punishment. Defined by Azrin and Holz: "Punish
ment is the consequence of behavior that reduces the
future probability of that behavior" (7:121).
Positive value for rUnning. The incentive or
desire for running comes from within the student himself.

4 Natural instinct. According to Dushkin, natural
instinct is an unlearned, repetitive, biologically based
behavior, specific to a species (1),687).
Limitations
The limitations and delimitations that are
included below may have had some effect on the investi
gation.
1. The influence of parents, siblings, peers,
teachers, and other persons on children were limitations
of this study.
2. The child's physical make-up and ability may
have been an influence on the attitudes of the individual
toward running.
). The environmental factors, such as weather
conditions, may have influenced the children.
Delimitations
1. The population was drawn from eighty-two,
fourth grade boys and girls in the physical education
program at Roeland Park and Roesland Elementary Schools
in Shawnee Mission, Kansas.
2. In the study, running was regulated by the
investigator in an attempt to use running as punishment
and in a controlled situation.
Method
This study involved eighty-two, fourth grade

5boys and girls that were in the physical education
program at Roeland Park and Roesland Elementary Schools
in Shawnee Mission, Kansas.
During the fourth week of school the two groups
of fourth grade boys and girls were administered the
Purdue Master Type Attitude Scales - Form A (see Appendix
A). These scales were developed to measure anyone of a
class of attitude objects. The statements of the scale
are not related to any specific object, but when the name
of the desired object is put at the top of the scale,
the statements can be interpreted meaningfully for any
object for which the scale is intended. The scale that
was used for this study was Attitudes Toward Any
Practice. The name of the desired object that was
placed at the top of the scale was running. The test,.
required approximately fifteen minutes to administer
and has two forms which can be used for pre-test and
post-test without losing any validity or reliability.
All of the instructions for the questionnaire
were given to the students both verbally and by the use
of the chalk board. All questions were answered before
the writing began, which enabled each student to have a
better understanding of the questionnaire procedures.
The directions were written out to insure that both
groups received the same instructions. In order for
the subjects to freely express their feelings the
students were told that the score would not affect

6 their grade, and the test results and names were held in
confidence.
Roeland Park was designated as the experimental
group, and Roesland was the control group. During the
course of the twelve weeks, (twenty-two class meetings),
both groups were involved in soccer, flag football, and
physical fitness during the regular class periods.
When the experimental group, (Roeland Park)
became a discipline problem, the entire group was
punished by running. This punishment occurred twnety
times during the twelve-week period. An example of
group misbehavior was when the class was not paying
attention to instructions. The students were then told
to run as punishment for their misconduct. Other
examples of misbehavior were running in the hall, being
too noisy in the hall, and not keeping the locker rooms
neat.
The control group (Roesland) was exposed to
approximately an equal amount of running, but without
any mention of punishment. The control group was simply
running, maybe for pleasure or because it was a nice day
for running. The attempt was to place emphasis upon
running for enjoyment by using a variety of activities
for running, Some of the examples for running were
races, sprints, jogging, obstacle courses, and movement
education (running fast, slow, tall, short, forward,
backward, etc.).
7 During the time of the study individuals did not
run for punishment, rather, when they ran, they ran as a
group at all times. The groups were never punished for
the discipline of only a few students. When individuals
in either group needed to be punished or when the entire
control group needed to be punished, the form of punish
ment was of a different nature than running.
At the end of the twelve weeks the Purdue
Master Attitude Scale - Form B (see Appendix B) was
again administered to the two fourth grade groups.
Comparisons between the results of the first and second
responses to the test for both groups were then made.
The scoring procedures, reliability and validity are
given in the Manual for the Purdue Master Attitude
Scales (see Appendix C).
Chapter 2
REVIEW OF THE LITERATURE
The problem of this investigation was to assess
the attitudes toward running of fourth grade boys and
girls, when running is used as punishment.
Educators who have sought to develop meaningful
learning experiences have become more aware of the
importance of children'S attitudes. Attitudes expressed
by students are often related to their needs and
interests. When dealing with needs and interests it is
sometimes helpful to determine how children feel about
oertain sUbjects or ideas. There are several methods or
techniques available for the measurement of attitudes in
the field of physical education. Most of the studies
are involved with general attitudes toward physical
education, while some studies compare or relate other
factors to physical education and sports.
Due to the nature of this study, sections on
attitude change and punishment were included. Because
of the possibility of attitude change, a better under
standing of why these changes mayor may not have happened
was important. The use of punishment and non-punishment
in this study required a better understanding of the
nature of punishment, and how it related to fourth grade
children. 8

9The studies reviewed have been classified under
the following groups:
1. Development of Scales in Physical Education
2. Attitude Assessment
3. Attitude Toward Physical Education
4. Attitudes Toward Physical Education and
Other Influencing Factors
5. Attitude Change
6. Sports Attitudes
7. Punishment
8. Summary.
Development of Attitude Scales in Physical Education
Remmers (28:307-318) grouped attitude techniques
under the following headings: self-inventories or
questionnaires; rating scales; tests of conduct, know
ledge, or judgment I and anecdotal records. All of these
may be used with the appropriate methods. The rating
scale is a series of statements of attitudes on which
the pupil is rated along some continuum such as agree
disagree.
The Wear Inventory, constructed by Wear (35:114
126) in 1951, consists of thirty items related to
favorable and unfavorable attitudes toward physical
education as an activity course. The subject indicates
the relative strength of his agreement or disagreement
on each statement by selecting from these five choices:

10 strongly agree, agree, undecided, disagree, strongly
disagree. Responses were secured from 472 men, most of
whom were college freshmen. The reliability of the
inventory was .96 thus indicating that the Wear
Attitude Inventory is a reliable measure of individual
and group attitudes toward physical education.
Wear (35,113-119) developed two equivalent forms
of an attitude test for the purpose of making an
objective measurement of changes in attitude, if any, as
a result of the subject's involvement in planned
experiences. The Wear Inventory, Form A and Form B,
can be used when successive testing is desired, ruling
out the influence of the first response upon a subsequent
response.
Moawad (23:1834) adopted the situation-response
technique of item construction in an attempt to develop
a valid and reliable instrument which could be used to
measure attitudes of the sophomore high school boys
toward physical education. A situation was described
and was followed by five ways of reacting to the specific
situation. The student is asked to select the response
which is the closest to what he actually would have done.
About two hundred items were originally constructed, but
only ninety-five items proved to be useful after being
tested. The ninety-five items were organized into two
equal preliminary forms. Each form was administered to
352 sophomore boys in fifteen Indiana high schools. The

11 split-half method was used and established a reliability
of .915. The final form was found to be a valid and
reliable measure of attitudes toward physical education
for Indiana high school sophomore boys.
Edgington (1415210) developed a 125 item scale for
the purpose of finding a reliable and valid scale to
measure the attitudes of high school freshmen boys toward
physical education. The scale was administered to thirty
freshmen boys. The results showed a reliability of .92
after applying the scale to the Spearman Brown Formula.
The majority of the freshmen boys had a favorable
attitude toward physical education.
The responses of 1)6 men and 1)0 women on the
Wear Physical Education Attitude Inventory (short Form A)
at the University of California were analyzed by Keogh
(1812)9). The purpose of this study was to determine if
students differed in their attitudes toward the general
benefits or values of physical education and if men and
women differ in this concept. There was no difference
between men and women in their attitudes toward physical
education. The subjects endorsed the social, physical,
and emotional values of physical education but conflicted
in their opinions regarding the relative values of a
physical education program in the school curriculum.
In a follow-up study, Keogh (18127) analyzed
stated attitude responses and selected descriptive
information in relation to two groups of men and women

12 who demonstrated extreme attitudes toward physical
education. This group consisted of sixty-nine of the
original 266 subjects whose scores were extremely high
or low. There were no differences between the male and
female within the extreme groups. Again the value of
the physical education program in the school was
questioned.
Attitude Assessment
Two functions of attitude measurement in schools
were established by Remmers, Gage, and Rummel (281;12).
The first shows indications of the degree to Which
pupils have acquired certain attitudes set up as objectives
of instruction (goals for everyone). And second,
attitudes may be evaluated as part of an attempt to
predict interests for adjustment in curricula or
occupations (goals for a particular interest).
Attitudes Toward Physical Education
Campbell (8) conducted a study to determine if
students differ in their attitudes toward physical
education as a result of the size of high school
attended, the program of physical education experienced,
and the nature of academic interests. The Wear Attitude
Inventory, short Form A, was administered to 199 lower
division male students who were enrolled in the required
program at the University of Texas at Austin. The
students also completed a brief questionnaire on which

13 they reported information relative to age, years of
high school physical education, size of high school
attended. college within the university in which they
were enrolled, and class of required physical education
in which they were enrolled. No significant variation in
attitude scores toward physical education was found within
the subgroups. The findings suggest that attitudes
concerning physical education cannot be predicted by
size of high school attended~ by academic interest. or
by preference of physical activity.
A study to measure the attitude toward physical
education of all male lower division students entering
the University of Oregon in September. 1960, was conducted
by Brumbach and Cross (3.10). The Wear Inventory; short
Form A; was administered to students in groups of thirty
during a physical education orientation session. The
subjects filled out a brief questionnaire form on which
they reported information relative to the high school
attended; their physical education background. and
whether or not they had had active duty in the United
States Armed Forces. The data was gathered from 938
students. The mean score for the entire group was 119.72.
The athletes earned a mean score of 122.01 while the non
athletes had a mean score of 114.32. Those groups
having a high mean score had more favorable attitudes
toward physical education than those groups with a
lower mean score. It was found that the more years of

14 physical education the student acquired and the smaller
the high school he attended, the higher his inventory
score tended to be. The non-veteran group had a higher
inventory score than did the veteran group.
Broer, Fox and Way (3t379) conducted a study to
determine the University of Washington freshmen and
sophomore women students' attitudes toward physical
education. The Wear Attitude Inventory was administered
to 1,149 women students who were enrolled in physical
education activity classes. The great majority of the
students expressed a very favorable attitude toward
physical education as an activity class. Scores on the
inventory indicated the attitude toward physical educa
tion as follows: 200-totally strongly favorable
attitude, 160-totally favorable attitude, 120-completely
neutral attitude, 80-totally unfavorable attitude, 40
totally decidedly unfavorable attitude. The mean score
for 1,149 students was found to be 150.5. The mean
scores for students enrolled in various activities waSt
swimming 158.8, softball 153.0, tennis 152.8, canoeing
149.9, tap dance 149.6, folk dance 149.5, modern dance
148.9, fencing 148.4, bowling 146.7, golf 146.4, riding
143.0, archery 142.9, badminton 140.6.
Moyer; Mitchem and Bell (24.515) modified the
Wear Attitude Inventory to determine the attitude of
freshmen and junior women toward the required physical
education program at Northern Illinois University and
15 to evaluate the physical education offerings in terms
of student needs. An eleven question multiple choice
questionnaire vms constructed to gather the additional
information needed for the study. The inventory was
given to 444 freshmen and 387 juniors in nineth-five
physical education sections. The findings indicated a
preference for individual sports~ a highly favorable
attitude toward physical education by both freshmen and
juniors~ and a need for re-evaluation of methods and
interpretation of objectives in teaching the required
program.
Bell and Walters (lr379) studied the attitudes
of college women at the University of Michigan in an
attempt to help evaluate the physical education program.
All freshmen who were taking physical education and
seniors who had taken the required physical education
were studied. A questionnaire consisting of three
parts was constructed to study the attitudes. Part I
was a check list response to find the needed information
on the background of the subjects. Part II consisted of
questions based on the objectives of physical education,
and Part III was the Wear Attitude Inventory. It was
found that individual sports are the physical activities
outside of the physical education class most frequently
engaged in by freshmen and seniors. Group activities
run second. Freshmen women spend more time outside of
class engaged in physical activities than do senior women.
16 Freshmen who have had physical education in high school
have a higher mean attitude toward physical education as
an activity course than freshmen who have had no physical
education in high school.
Mista (22:166) administered the Wear Inventory
and a background questionnaire to 1,126 college ~reshmen
women in private Iowa colleges and found that: (1)
Significant differences in attitudes toward physical
education existed between the following groups of
freshmen women: (a) Those earning interscholastic
athletic letters in high school had more favorable
attitudes than those who did not earn lettersl (b) Those
who participated in organized extra-school physical
activities programs had more favorable attitudes than
those who did not participate in such programsl (c)
Those who lived on farms had more favorable attitudes
than those who did not live on farms, (d) Those who had
high school graduating classes of less than seventy-five
had more favorable attitudes than those from classes
larger than 140, (e) Those who chose teaching careers
had more favorable attitudes than those who chose non
teaching careers, (f) Those rating themselves above
average in physical skills had higher attitudes than
those rating themselves below average in physical
skills, and (g) Those who enjoyed their high school
physical education had more favorable attitudes than
those who did not enjoy their high school physical

17 education, and (2) Significant differences in attitude
toward physical education did not exist between the
following groups of college freshmen women: (a) Those
who had physical education in high school and those who
did not; (b) Those who had a woman teacher in physical
education and those who had a man; (c) Those who took
physical fitness tests and those who did not; (d) Those
from small communities and those from cities.
Attitudes Toward Physical Education and Other InfluencingFactors
An attitude inventory was developed by Drinkwater
(12.575), for the purpose of determining the attitude of
high school girls toward physical education as a career
for women. Likert's techniques of scale constructions
were selected, and statements that applied to the physical
education profession for women were prepared. Each
subject was subjected to statistical analysis to eliminate
ambiguity or poor discriminatory power. Following the
use of the split-half method for determining reliability,
the statements were put into two equal forms with 88
statements half negative and half positive spaced
indiscriminately. The subjects were 208 high school
girls from three schools. Typed instructions were used
to see that each group was given the same instructions.
The total score for each girl was computed and put on a
frequency with other individuals. Those at the top of
the scale were considered more favorable for a physical

18 education career. The top 27% and bottom 27% were selected
for Thurstone's method of testing ambiguity. Conclusions
indicated that scores from this inventory can be taken
toward physical education as a career for women. The test
is apparently both reliable and valid. Form A and B can
both be used for determining attitude change as ,before
and after tests.
Turner (32:3747) employed a modified Wear Attitude
Inventory to determine the relationship between the
quality of three high school physical education programs
for girls in Iowa City, Iowa, and the attitudes expressed
by senior girls toward their respective classes. This
study found no significant relationship between the
quality of physical education programs and the attitude
held by students toward these programs.
The purpose of Isenberger's (17:167) stUdy was to
determine the relationship between the self-attitudes
(self-rated attitudes toward physical education) of
women physical education major students, and measures of
interest and success. A second purpose of this study
was to determine the relationship between the interests
of women physical education major students from three
institutions and 115 women physical education teachers
participated in the various phases of the study. The
"Who Am 1" test was used as a measure of self-attitudes.
Interest was measured by the Strong Vocational Interest
Blank. Success was measured by the Minnesota Teacher

19 Attitude Inventory~ the Scott General Motor Ability Test,
a teacher trait evaluation sheet, semester grades in
physical education in both theory and skill courses, and
total university semester grades. The results of this
study indicated that self-attitudes are not significantly
related to measures of interest and success. A negative,
but significant relationship between semester grades and
self-attitudes, and between physical education skill
grades and self-attitudes was significant for one of the
student groups. A relationship between motor ability
and self-attitudes was indicated. Women physical educa
tion major students scored significantly higher on the
Strong Vocational Interest Blank than did the teachers of
physical education.
Vincent (341502) conducted a study to determine
the roles of strength, efficiency and expressed attitudes
toward physical education in the prediction of success
in physical education activity courses. The Wear Attitude
Inventory was administered to 192 students enrolled in
eight selected physical education classes at the Uni
versity of Georgia. Strength was evaluated by performance
with dynamometers and included the following measure
mentsl right and left grips, push, pull, and back and leg
strength. Efficiency was measured through the calcula
tion of oxygen consumption using an indirect closed
circuit calorimetric technique. The success factor was
taken as the final grade received in the physical

20 education activity course enrolled in for that quarter.
The correlation of the factors showed that the relation
ship between success and strength and attitude were
significant and positive. The relationships between
success and efficiency, and strength and efficiency were
negative. The efficiency attitude correlation was
positive but not significant.
Vincent (331126) had conducted an earlier study
at the University of Georgia that involved 188 women in
a variety of physical education activities, and the Wear
Attitude Inventory. The final grade received for the
activity course was used as the success factor. Attitudes
were analyzed both as to values and as to activities groups,
and correlations were oomputed between attitudes and
success. There was a significant positive relationship
between attitude and success.
In a study conducted by Wessel and Nelson (37:562)
a random selection of two hundred college women from the
non-major required program at Michigan State University
was obtained by using a table of random numbers. During
the first four weeks of the spring all tests were
administered by the instructors in the Department of
Health and Physical Education, the dynamometric strength
measures, (hand grip, back lift, push, and pull) were
used in this study. The Wear Attitude Inventory, short
Form A, was used to measure attitudes toward physical
education. Responses to four additional questions were

21 also used. All correlations were signi~icant1ygreater
than zero at the one percent level o~ confidence,
although the relationships ~ound were low. Back strength
had a closer relationship to the attitude measures than
the other strength measures. The results indicate that
there is a relationship between strength and attitudes
toward physical education as an activity.
A study to determine the relationships between
selected educational and social background ~actors and
the attitudes of college women toward physical education
and certain sports was conducted by Lemen (2011596).
Inventories were administered by ~aculty members of
twenty colleges and universities to ~reshmen and sopho
mores in required physical education c,lasses J 1840
subjects were used in the final tabulations. The
subjects expressed their attitudes toward eleven common
activities by indicating on a seven degree continuum
their reaction to each activity. Attitudes were deter
mined by summing the values o~ each'response.- College
women appear to have favorable attitudes toward
activities and physical education. Relationships exist
between certain social background ~actors and attitudes
toward physical education. The degree ~o which a person
enjoys her physical education program in high school is
related to her attitude, to her ability in sports, and
to leisure participation in sports. College women
prefer to participate in individual sports rather than

22 team sports in their leisure time.
Fisher (1511721) conducted a study to determine
the factors identified with positive and negative attitudes
toward physical education. The Wear Attitude Inventory
was administered to 474 entering college freshmen women
at California State College at Los Angeles. A definite
relationship was found between the attitudes expressed
and the physical education background the girls possessed.
Bullock and Alden (6:60) gave a questionnaire to
192 freshmen women who were enrolled in physical education
courses at the University of Oregon. The three part
questionnaire dealt with the home l~fe and the early play
experiences of the individual" the high school experiences,
and the university physical education situation. Some of
the factors affecting!the attitudes of the freshmen women
toward required physical education were the lack of
opportunity to play with other children during childhood,
the training of the physical education teachers the girls
had in high school, the richness of the school curriculum,
the type and variety of subject matter, the opportunity
to select subject courses, and the element of requirement.
Attitude Change
One hundred and twenty-one items representing
annoyances directly or indirectly related to physical
education were derived from the Harsh study of "Categories
of Annoyances," the results of fifteen interviews, and

23 the Page questionnaire on high school and college
Physical Education participation. Nemson (261336) pre
sented these items to 323 junior and senior high school
boys in a large semi-rural high school. The subjects
expressed their degree of annoyance l with respect to
each item. Those scores were related to a rating of
the boys attitude toward physical education by each
physical education instructor.
The boys who were rated high in attitude toward
physical education indicated that smoking, swearing and
tardiness were the items which annoyed them the most.
Rebelling against compulsive physical education and
various "gripes" included the items most annoying to
the poor attitude group. ~fuile certain sources of
annoyances could be removed (lack of cleanliness and
inadequate facilities) most of them are of a nature that
involve the personality or behavior of other students or
instructors.
Brumback (41211) conducted a study that involved
168 students who were enrolled in six different physical
fitness classes at the University of Oregon. The Wear
Attitude Inventory was administered at the beginning and
at the end of the semester. It was found that the
subjects' mean score went up from 113.3 to 115.5 which
was a significant improvement. A class of twenty-eight
students were involved in a physical fitness course in
Which the instructor gave a more individual and personal

24 type of instruction with a more relaxed atmosphere. It
was found that the classes mean score at the start of
the semester was 119.0 and had risen to 129.70 by the
end of the semester. Again the attitude change was
significant.
Davis (11:7063-7064) conducted a study to
determine if there was a change in the attitude toward
physical education of college freshmen boys during one
semester of participation in a physical education
activity course. The Wear Attitude Inventory was
administered to 265 freshmen and the results indicate
that participation had· little effect in altering
attitudes toward physical education, favorably or
unfavorably.
Sports Attitudes
Craig (10:143) and the National Youth Administra
tion developed a questionnaire to study the attitudes of
the students of the University of Illinois toward
required physical education. The first part asked
questions about the classes that the students had taken
in physical education. The second part dealt with the
classes that the students would like to take. And
finally the third part dealt with attitudes. The
results show that if the students have a wide, well
organized program of physical education activities, the
average college student will select activities high in

25 carryover values and will enjoy taking them.
Stalnaker (311500) conducted a study to determine
the attitude of students and faculty toward inter
collegiate athletics at the University of Minnesota.
The study gave these resultsl both groups favored
intercollegiate athletics, the athletes had a better
attitude than non-athletes, and the students had a better
attitude toward intercollegiate athletics than the faculty.
McAfee (211121) while teaching at Monroe Junior
High School in Inglewood, California, conducted a study
with 857 sixth, seventh, and eighth grade boys. Using
a twenty-item sportsmanship preference record test and
readministration of the test, McAfee discovered that
sportsmanship attitudes grow progressively worse from
sixth to eighth grades. The retest produced a reliability
coefficient of .80.
Bouyer (21282-287) investigated how the reading
of twelve short sport stories to elementary school
pupils will influence their sportsmanship attitudes.
Using 21) fourth, fifth, and sixth graders from two
Oakland, California, elementary schools and dividing them
into an experimental group that was read twelve short
sports stories and a control group that did not hear the
stories, the two groups were compared. The two groups
were very similar in chronological age, mental age, and
I.Q. It was determined that play activities and
literature have little effect on sportsmanship attitudes.

26 The classroom teacher is in a good position to help
develop the proper values and sportsmanship. Thirty
two pupils picked at random from the test group all
gave similar definitions of sportsmanship.
SeYmour (30:338-346) performed a study to see if
participation or non-participation by elementary school
age boys in little league baseball would affect their
sportsmanship attitudes. Using 114 boys who participated
in little league baseball in Atlanta, Georgia, and a
sample group of boys who did not participate, SeYmour
used a series of separate classification tests to reach
this conclusion: there was little change in behavior of
participants in little league baseball. There was no
evidence of decline in sportsmanship attitudes due to
participation in little league baseball.
Punishment
Redl defines punishment as:
A planful attempt by the adult to influence either the behavior or the long-range development of a child or a group of children for its own benefit, by exposing it to an unpleasant experience (27:363).
After punishment is enforced the child first will become
angry and directs this anger toward himself. Analyzing
the situation he resolves not to involve himself in a
situation like that again. This establishes self-
control, insight and temptation resistance. This is a

27 constructive punishment experience.
The matter of timing is the most serious factor
in educational practice. Can a student take the time
relationship between a given offense and punishment
without becoming confused? Can his ego sustain him
throughout the duration of punishment? Can he use the
experience for any future purpose? If the answer is no
to any of these three questions, Redl reports that
punishment is not worth the effort.
The needs and interests of the children must be
met in order to'eliminate serious group problems. These
three major points concerning group-psychological factors
in discipline must be considered. Redl suggests that
one should not be fooled by a discipline problem. One
should understand the individuals and group involved,
and what happened. Before any disciplinary procedures
are taken the following questions must be appraised.
Should the group or individual be punished? What surface
behavior or basic attitudes are under consideration? And
last, will the punishment be effective?
Schain (29:84) states that punishment should
correspond with the severity of the infraction. Punish
ment should follow as soon after the infraction as
possible. The longer the time lapse the less effective
it becomes.
Gesell and rIg (16:210) have found that nine
year olds are relatively easy to discipline and most
28 will accept punishment with good. grace. A person does
not have to be drastic with nine year old children.
Summary
The studies reviewed indicate that there are
several factors that may influence an individual's
attitude toward physical education or sports. Such
examples as opportunity to participate in activities,
size of high school, number of years in physical educa
tion, academic interest, home environment, type of
teachers, strength, success, and social background were
related to attitudes toward physical education and sports.
Other studies related physical education attitudes
to specific activities (softball, tennis, golf, archery,
etc.), and individual versus team games. One study listed
121 items representing annoyances directly or indirectly
related to physical education.
A study more closely related to this investigation
involved the Wear Attitude Inventory and two groups of
physical fitness classes. The first group took the Wear
Inventory at the beginning of the semester and received
a mean score of 113.3. Their mean score at the end of
the semester was 115.5. The second group had an
instructor that gave a more personal and individual
approach with a more relaxed atmosphere. The mean score
for this class rose from 119.0 to 129.70 from the beginn
ing to the end of the semester. This was a more signifi _

29 cant change in positive attitudes toward physical
education. This seems to indicate that attitudes can be
changed by teaching methods.
The literature included for this study involved
types of testing procedures, attitude assessment in the
area of physical education, attitude changes and punish
ment. Before attempting to measure attitudes or compare
any change of attitude it was necessary to evaluate
different types of attitude testing instruments. After
considering the different test prooedures it was necessary
to select a tool that was best suited for this study.
The assessment of attitudes in the area of physical
education gave a better'understanding for the procedures
to be used in this investigation. Factors that involve
attitude change may have had some effect on the direction
or results for this study. Having several variables as
possible elements of attitude change it was necessary to
research the area of punishment because the relationship
of punishment with this investigation.

Chapter J
PROCEDURES
The purpose of this study was to determine whether
or not attitudes toward running would differ when running
was used as punishment or non-punishment. The study was
divided into three parts. First, a questionnaire was given
to evaluate attitudes. Second, the experimental group and
the control group were dealt with differently with respect
to running. And third, the questionnaire was again given
in an attempt to measure any possible change in attitude.
Nature of Subjects
The students chosen for this study were eighty-two
fourth graders from Roesland and Roeland Park Elementary
Schools, Shawnee Mission, Kansas. The subjects were
divided into two groups. The Roeland Park group consisted
of sixteen boys and twenty-three girls. The Hoesland group
had twenty-four boys and nineteen girls. The students had
not been exposed to the physical education teacher for
instruction before the fourth grade. Classes in the fourth
grade for physical education met two days a week for thirty
five minute periods. The two schools were both within the
community of Roeland Park, Kansas, Which eliminated any
major differences in environment and living conditions.
Both schools were a part of the Shawnee Mission School
30

31 District; and before unification in 1969, were a part
of the Roesland School District.
Orientation Procedures
After both groups had taken the Purdue Master
Attitude Test, the Roeland Park fourth graders were
designated the experimental group, and the Roesland fourth
graders were the control group. On twenty occasions both
groups ran distances of approximately two hundred to four
hundred yards.
The experimental group was forced to run all twenty
times as punishment for some type of group misbehavior.
The following are some of the examples of misbehavior and
how the investigation may have dealt with that situation.
On several occasions the class was slow in getting quiet
for the orientation of the activity for that day. ~fuen
this happened the class was told of their misconduct and
as their punishment the subjects were forced to run. Some
times the class was in an activity that required group
cooperation and as sometimes will happen the group would
disagree and begin arguing and shouting. This was another
example of group misbehavior and the class was forced to
run for punishment. Other occasions for group punishment
were not keeping the locker room in order, not following
instructions, being noisy in the hall or running in the
hall. Each time the class was specifically told that they
had misbehaved and had to run as punishment.

32 The students that did not want to run had to stay
after school and run a further distance. However none of
the students elected to stay after school to do the running.
If a student had an injury or was ill that subject was not
forced to run. .Students attempting to take advantage of
an injury and continually complaining in order to avoid the
running were not allowed any privileges that the class
enjoyed and also were required to turn in a written report.
This action eliminated any difficulties with superficial
disabilities. The distances used for running were not
always the same even if the reason for the punishment was
the same.
Before and after the students ran for punishment
it was explained to the group why they were running and
the word punishment was used in the explanation. It might
have been for any of the previously mentioned disciplinary
reasons, but the students understood that they were being
punished. There were twenty-two class meetings with the
experimental group, and the group was punished on twenty
occasions.
When the control group ran, emphasis was placed on
pleasure and fun. The Roesland students did not receive a
reward for their running, however the instructor would
point out positive features in running such as being good
for legs, heart, and general health, and that running is
used in many games.
33 There were several different types of running that
the Roesland students experienced. The control group was
involved in running obstacle courses between swings, around
posts and cones, over gym bars, up and down hills, through
sand, and jumping over objects. Also included in the
variety of activities were sprints, jogging, short races
and long races. The movement education activities that
involved running at different speeds (slow, medium, fast),
at different levels (low, medium, high), and in different
directions (forward, sideway, backward) were also employed.
If students did not wish to run they were encouraged, but
not forced to run. The control group never ran for
punishment. If group punishment was necessary the group
was punished by a method unrelated to running. For both
groups, individuals were not forced to run for disciplinary
reasons. Another method of punishment dissimilar to
running was used for individuals who needed disciplinary
action.
Facilities
Both groups were tested in the gym and on the
playground. The Roeland Park gym surface was tile, and
the playground was blacktop and grass. The Roesland gym
was a hard-wood basketball floor and the playground was
blacktop and grass. Both groups suited out in gym shorts
and some type of gym shoe.

)4 Testing Instrument
The Purdue Master Attitude Scales were selected
because of the practical advantage of being brief, con
venient and containing content validity for many purposes
in their application to measurement and evaluation of
attitudes. These scales have demonstrated validity against
Thurstone's specific scales where they show almost perfect
correlations. The reliability of the scales for various
populations sampled ranged from .71 to .92.
The attitude scales developed by Remmers were
designed to measure attitudes toward any practice. The
practice that was being measured for this study was
running. On the fourth week of school the inventory was
given to the two groups. The test has two forms for
measuring any practice. The purpose for the two forms is
for pretest and postest and to help disguise the overall
evaluation of attitudes. Both forms will reflect the same
attitudes. Form A was used at the beginning of the
experiment. Each group was given the same set of instruc
tions. To help the subjects give a true expression the
students were told they did not have to sign the question
naire, and the results would in no way effect any grades
at school. The word practice was explained as a habit, or
as something that is usually done. The examples of
practices were riding a bike during the week, or the
practice of brushing ones teeth in the morning. The
students then placed the word running in the first line for

35 practices, and each statement was then read twice or more
if requested. As each statement was read the students
would put a plus mark in the box if they agreed with the
statement with respect to running. The box was to be left
blank if the student disagreed with the statement. At the
end of twelve weeks both groups were given the Purdue
Master Attitude Scale--Form B. The same procedures that
were given for Form A also applied for Form B.
On the completion of the postest for the experi
mental group, the students were told about the experiment
and then given the opportunity to discuss questions about
the study. The students were told running would not be a
source of punishment in this instructor's physical education
class again.
Testing Procedures
The statistical method used for this study was the
analysis of variance of the difference between the means
of the experimental and control groups.

Chapter 4
ANALYSIS OF DATA
The purpose of this study was to investigate
attitudes toward running and the relationship of the
attitudes to forms of punishment (experimental group)
and non-punishment (control group). Included in this
chapter are comparisons between the control and experi
mental groups related to the mean attitude score of the
pretest and postest. Analysis of variance was the
statistical tool employed for the computation in this
investigation.
Description of Groups
The control group had a total of forty-three
students, nineteen girls and twenty-four boys. These
students were never forced to run as punishment.
There were thirty-nine children, twenty-three
girls and sixteen boys, in the experimental group. Each
time the group was punished, they were forced to run.
Control-Experimental Groups: Pretest
For the control group a mean score of 8.298 was
achieved on the pretest. The experimental group received
a mean score of 7.838 on the pretest. The sum of squares
for the between groups was 4.313, while the sum of squares
for the within groups was 40.982. The total sum of
36

37 squares for both groups was 45.295.
Table 1
Analysis of Variance of the Sample Means for the Experimental and Control Groups Pretest
Source ss df ros F
between 4.313 1 4.313 8.424* within 40.982 80 0.512 total 45.295 81
*Significant at the .01 level.
From the F-table a value of F > 6.96 was needed
for a ·significant difference at the .01 level. Since an
F-ratio of 8.424 was found. it would be concluded that
the difference between the two sample means was significant
at the .01 level.
The null hypothesis would be rejected as the mean
(8.298) of the control group was significantly higher
than the mean (7.838) of the experimental group.
Control-Experimental Groups, Postest
The postest for the control group resulted in a
mean score of 8.572. The experimental group received a
mean score of 8.195 on the postest. The between groups
had a sum of squares which was 2.910 and the sum of squares
received for the within groups was 32.686. Both groups
had a total sum of squares of 35.596.
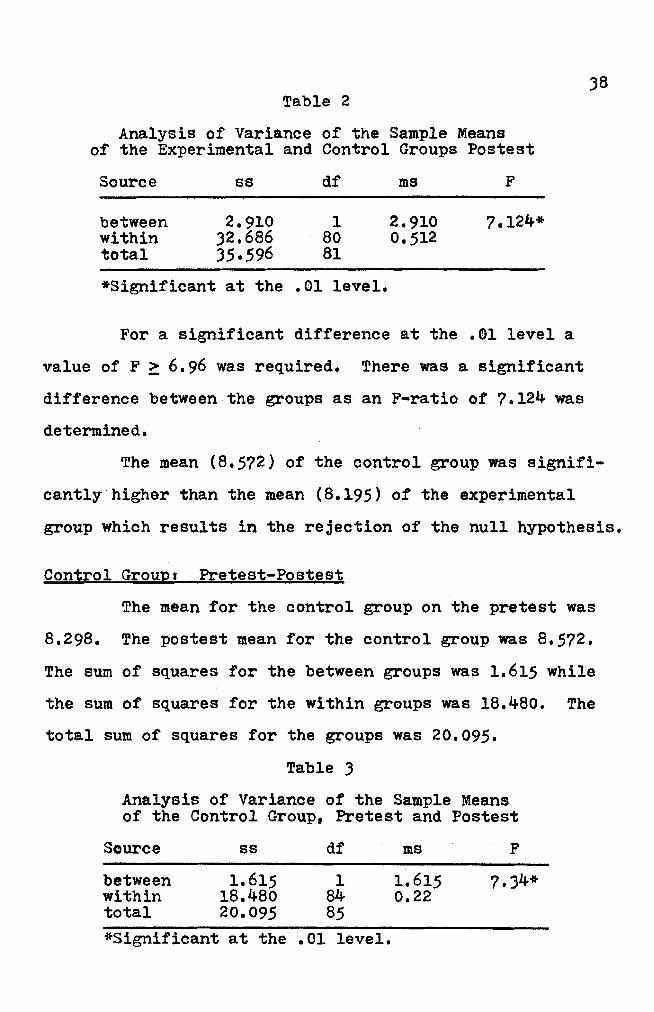
.38 Table 2
Analysis of Variance of the Sample Means of the Experimental and Control Groups Postest
Source ss df ma F
between 2.910 1 2.910 7.124* within .32.686 80 0.512 total 35.596 81
*Significant at the .01 level.
For a significant difference at the .01 level a
value of F ~ 6.96 was required. There was a significant
difference between the groups as an F-ratio of 7.124 was
determined.
The mean (8.572) of the control group was signifi
cantly higher than the mean (8.195) of the experimental
group which results in the rejection of the null hypothesis.
Control Group. Pretest-Postest
The mean for the control group on the pretest was
8.298. The postest mean for the control group was 8.572.
The sum of squares for the between groups was 1.615 while
the sum of squares for the within groups was 18.480. The
total sum of squares for the groups was 20.095.
Table .3
Analysis of Variance of the Sample Means of the Control Group, Pretest and Postest
Source ss df ros F
between 1.615 1 1.615 7 •.34* within 18.480 84 0.22 total 20.095 85 *Significant at the .01 level.

39 An F-value of 6.96 was required to show a significant
difference at the .01 level. The F-ratio of 7.34 shows
that there was a significant difference between the pretest
and postest of the control groups.
By comparing the results it must be concluded that
the null hypothesis was rejected since the mean (8.572)
of the postest was significantly higher than the mean
(8.298) of the pretest.
Experimental Group. Pretest-Postest
The experimental group had a mean score of 7.838
on the pretest. The postest mean score for the experimental
group was 8.195. The between groups had a sum of squares
of 2.476 and the within groups had a sum of squares of
55.192. The total sum of squares was 57.668.
Table 4
Analysis of Variance of the Sample Means of the Experimental Group; Pretest and Postest
Source ss df . ms F
between 2.476 1 2.476 3.410 within 55.192 76 0.726 total 57.668 77
not significant
To show a significant difference at the .05 level
an F-value of 3.98 was needed. The F-ratio of 3.410 shows
there was no significant difference between the pretest and
postest of the experimental group.
The null hypothesis was accepted because the mean

40 (7.8)8) of the pretest was not significantly different
from the mean (8.195) of the postest for the experimental
group.
Boys Control-Experimental I Pretest
The mean score for the boys control group on the
pretest was 8.225. A mean score of 7.794 was attained by
the boys experimental group for the pretest. The sum of
squares for the between groups was 1.785 while the within
groups had a sum of squares of 18.494. These brought a
total sum of squares to 20.280.
Table 5
Analysis of Variance of the Sample Means of the Boys Experimental and Control Groups Pretest
Source ss df ms F
between 1.785 1 1.785 ).670within 18.494 )8 0.487 total 20.280 )9
not significant
An F-va1ue of 4.10 at the .05 level of significance
was needed to show a significant difference. The F-ratio
of ).670 indicated the boys experimental and control groups
were not significantly different on the pretest.
Since the mean (8.225) of the boys control group
pretest was not significantly different than the boys
experimental pretest mean (7.794) the null hypothesis was
accepted.

41 Boys Control-Experimental: Postest
The boys control group received a mean score of 8.704
on the postest. The boys experimental group acquired a
mean score of 7.844 on the postest. The between group had
a sum of squares of 7.107 and the within group reached a
sum of squares of 44.709. These were totaled for a sum of
squares of 51.816.
Table 6
Analysis of Variance of the Sample Means of the Boys Experimental and Control Groups Fostest
Source ss d:f ms F
between 7.107 1 7.107 6.04** within 44.709 38 1.177 total 51.816 39
**Significant at the .05 level.
For a significant di:fference at the .05 level a
value of F ~ 4.10 was required. There was a significant
difference between the sample mean as an F-ratio of 6.04
was attained.
The mean (8.704) of the boys control group was
significant by greater than the mean (7.844) of the boys
experimental group which supports the null hypothesis.
Boys Control: Pretest-Postest
The boys in the control group had a mean score of
8.225 on the pretest. The postest for mean score for the
control group-boys was 8.704. The sum of the squares for
the between groups was 2.755 and the sum of the squares

42 for the within groups was 8.615. The total sum of the
squares was 11.370.
Table 7
Analysis of Variance of the Sample Means of the Boys Control Group, Pretest and Postest
Source ss df ms F
between 2.755 1 2.755 14.718* within 8.615 46 0.187 total 11. 370 47
*Significant at .01 level.
An F-value of 7.21 was required to show a signifi
cant difference at the .01 level. The F-ratio of 14.718
shows that there was a significant difference between the
pretest and postest of the boys control group.
By comparing the results of the boys control group
it must be concluded that the null hypothesis was rejected
since the mean (8.704) of the postest was significantly
higher than the mean (8.225) of the pretest.
Boys Experimental: Pretest-Postest
The boys experimental group had a mean score of
7.794 on the pretest. The postest mean score for the
experimental group was 7.844. The between groups had a
sum of squares of 0.020 and the within groups had a sum
of squares of 54.589. The total sum of squares was
54.609.

43Table 8
Analysis of Variance of the Sample Means of the Boys Experimental Group, Pretest and Fostest
Source ss df rns F
between 0.020 1 0.020 0.011 within 54.589 30 1.820 total 54.609 31
not significant
To show a significant difference at the .05
level an F-value of 4.17 was needed. The F-ratio of 0.011
shows there was no significant difference between the
pretest and postest of the boys in the experimental group.
The null hypothesis was accepted because the mean
(7.794) of the pretest was not significantly different
from the mean (7.844) of the postest for the boys in the
experimental group.
Girls Control. Experimental. Pretest
The mean score for the girls control group on the
pretest was 8.389. A mean score of 7.870 was attained by
the girls experimental group for the pretest. The sum of
squares for the between groups was 2.813 While the within
groups had a sum of squares of 22.147. These brought a
total sum of squares to 24.960.

44 Table 9
Analysis of Variance of the Sample Means of the Girls Experimental and Control Groups Pretest
Source ss df ms F
between 2.813 1 2.813 5.08** within 22.147 40 0.554 total 24.960
**Significant at .05 level.
An F-value of 4.08 at the .05 level of significance
was needed to show a significant difference. The F-ratio
of 5.08 indicates the girls experimental and control
groups were significantly different at the .05 level.
Since the mean (8.389) of the girls control groups
pretest was significantly different from the girls
experimental pretest mean (7.870) the null hypothesis was
rejected.
Girls Control. Experimentalr Fostest
The mean fo~ the girls control group on the pretest
was 8.405. On the pretest the girls experimental group
reached a mean of 8.222. The sum of the squares for the
between groups was 0.350 while the sum of the squares for
the within groups was 17.989. The total Sum of squares
for the groups was 18.339.

45 Table 10
Analysis of Variance of the Sample Means of the Postest of the Control and Experimental Groups
Source ss df ms F
between 0.350 1 0.350 0.780 within 17.989 40 0.448 total 18.339
not significant
An F-value of 4.08 was required to show a signifi
cant difference at the .05 level. The F-ratio of 0.780
shows that there was not a significant difference between
girls control group and the girls experimental group on
the postest.
By comparing the results it must be concluded that
the null hypothesis was accepted since the mean (8.405) of
the girls control group postest was not significantly
higher than the mean (8.222) of the girls experimental
group postest.
Girls Control: ftetest-Postest
The pretest for the girls control group resulted in
a mean score of 8.389. The girls control group received a
mean score of 8.405 on the postest. The between groups had
a sum of squares which was .0024 and the sum of squares for
the within groups was 8.6274. Both groups had a total sum
of squares of 8.6298.

46 Table 11
Analysis of Variance of the Sample Means of the Girls Control Group, Pretest and Postest
Source ss df ms F
between .0024 1 .0024 0.010 within 8.6274 36 .2396 total 8.6298 37
not significant
For a significant difference at the .05 level a
value of F ~ 4.11 was required. There was no significant
difference between the groups as an F-ratio of 0.010 was
determined •
. The mean (8.389) of the pretest was not significant
ly higher than the mean (8.405) of the postest for the
girls control group which indicates the null hypothesis
was accepted.
Girls Experimental: Pretest-Postest
For the girls experimental group a mean score of
7.870 was achieved on the pretest. On the postest the
girls experimental group received a mean score of 8.222.
The sum of squares for the between groups was 1.426,
while the sum of squares for the within groups was 31.508.
The total sum of squares for both groups was 32.934.

47 Table 12
Analysis of Variance of the Sample Means for the Girls Experimental Group, Pretest and Fostest
Souroe ss df ms F
between 1.426 1 1.426 1.992 within 31.508 44 0.716 total 32.934 45
not signifioant
From the F-table a value of F ~ 4.06 was needed for
a significant differenoe at the .05 level. Since an F
ratio of 1.992 was found it would be concluded that the
difference between the two sample means was not significant.
The null hypothesis was accepted as the mean (7.870)
for the girls experimental pretest was not significantly
lower than the mean (8.222) for the girls experimental
postest.

Chapter 5
SUMMARY AND CONCLUSIONS
It was the purpose of this study to assess the
attitudes toward running when running is used as punishment.
The subjects for this study were members of the
1970-71 fourth grade class at Roesland and Roeland Park
Elementary Schools, Shawnee Mission, Kansas. There were
nineteen girls and twenty-four boys at Roesland, and
sixteen boys and twenty-three girls at Roeland Park. The
subjects were given an inventory to determine attitudes
toward running. Following the inventory the two groups
were dealt with differently with respect to running.
Roeland Park students were forced to run for punishment
and Roesland was the control group.
The statistical computation for this study was
the analysis of variance. The mean attitude for the
pretest and postest of both groups was used as the data
for analysis in this investigation.
Findings
The analysis of data revealed the following
findings.
1. On the pretest the mean (8.298) of the control
group was significantly higher than the mean (7.838) of
the experimental group at the .01 level.
48

2. The mean (8.572) of the control group was
significantly higher than the mean (8.l95) of the experi
mental group on the postest at the .01 level.
3. The postest mean (8.572) was significantly
higher than the pretest mean (8.298) for the control
group at the .01 level.
4. There was no significant difference between
the mean (7.838) of the pretest and the mean (8.195) of
the postest for the experimental group.
5. The mean (8.225) of the boys control group
pretest was not significantly different from the mean
(7.794) of the boys experimental group pretest.
6. On the postest, the mean (8.704) of the boys
control group was significantly greater than the mean
(7.844) of the boys experimental group at the .05 level.
7. For the boys control group, the mean (8.704)
on the postest was significantly higher at the .01 level
than the mean (8.225) of the pretest.
8. The mean (7.794) of the pretest was not
significantly different from the mean (7.844) of the
postest for the boys experimental group.
9. On the pretest, the mean (8.389) of the girls
control group was significantly higher at the .05 level
than the mean (7.870) of the girls experimental group.
10. The girls control group mean (8.405) was not
significantly higher than the girls experimental group
mean (8.222) on the postest.

50 11. For the girls control group, the mean (8.389)
of the pretest was not significantly different from the
mean (8.405) of the postest.
12. The mean (7.870) for the girls experimental
pretest was not significantly different from the mean
(8.222) for the girls experimental postest.
Conclusions
Within the limitations of this study the following
conclusions were reached.
1. The control group had a significantly better
attitude toward running than the experimental group at the
onset of the study. This was highly significant at the .01
level.
2. The control group also had a significantly
better attitude toward running than the experimental group
on the postest. This was highly significant at the .01
level.
3. On the postest the control group had a
significantly better attitude toward running than on the
pretest. This was highly significant at the .01 level.
4. The experimental group had no significant
difference in,attitude toward running between the pretest
and postest.
5. There was no significant difference between
the boys control group and the boys experimental group on
the pretest.

516. The attitude toward running for the boys
control group was significantly better than the attitude
for the boys experimental group on the postest. This
significance was at the .05 level.
7. The boys control group had a significantly
better attitude toward running on the postest than the
pretest. This was highly significant at the .01 level.
8. The attitude toward running on the pretest
was not significantly different from the postest for the
boys experimental group.
9. The girls control group had a significantly
better attitude toward running than the girls experimental
group on the pretest. This significance was at the .05
level.
10. There was no significant difference in attitude
between the girls control group and the girls experimental
group on the postest.
11. For the girls control group there was no
significant difference in attitude between the pretest
and postest.
12. T~e pretest and postest revealed no significant
change in attitude for the experimental group.
Interpretation of Data
The findings from this investigation reveal that
students are very likely to develop a more favorable
attitude toward running when students are encouraged to

52 run for enjoyment. The findings also tend to indicate
that forcing students to run as punishment does not
enhance the possibility of improving attitudes toward
running. This might indicate to teachers that encouraging
children to do a particular activity may allow the child
greater potential to enjoy the activity. This further
indicates that activities with a positive value should not
be used as a means of punishment.
It is possible that physical educators are not
allowing students to build a greater desire for running
when running is a means of punishment. It might also be
assumed that other physical activities that are beneficial
to children may not be completely developed if the activity
is used as punishment.
There ,was no significant difference in the change
in attitude toward running between the girls control group
and the girls experimental group. However the boys control
group and the total control group had a significantly
better attitude toward running than the boys experimental
group or the total experimental group.
It was encouraging to the researcher that the
experimental group had some improvement in running attitude
although not nearly to the degree of the control group. It
was hoped that the minimal change in attitude toward run
ning will not be a handicap to the experimental group.

53Recommendations for Further Study
Upon examination of this investigation and its
conclusions, the following recommendations are warranted.
1. Undertake another study of this design using
one, two or three years between the questionnaires.
2. Undertake another study of this design and
use sixth grade, junior high, and high school students.
3. Compare this study with another group of
fourth graders.
4. Compare attitudes toward running between
adults over thirty and elementary children.
5. Design a study that has only a punishment
group and vary the intensity of the punishment.
6. Compare attitudes toward teacher when students
are punished by running.

XHcIV1IDOI'Uns:

BIBLIOGRAPHY
1. Bell, Margaret C., and Etta Walters. "Attitudes of Women at the University of Michigan Toward Physical Education," The Research Quarterly, 241379, December, 1953.
2. Bouyer, George. "Children's Concepts of Sportsmanshipin Fourth, Fifth and Sixth Grades," The Research Quarterly, October, 1963.
3. Broer, Marion R., Katharine S. Fox, and Eunice Way."Attitudes of University of Washington Women Students Toward Physical Education Activity,"The Research Quarterly, 26,379, December, 1955.
4. Brumback, WaYne B. "Effects of a Special ConditioningClass Upon Students' Attitudes Toward Physical.Education," The Research Quarterly, 39.211, March, 1968.
5. , and John A. Cross. "Attitudes Toward PhysicalEducation of Male Students Entering the Universityof Oregon," The Research Quarterly, 36.10, March 1965.
6. Bullock, Marguerite and Florence D. Alden. "Some of the Factors Determining the Attitude of Freshmen Women at the University of Oregon Toward RequiredPhysical Education," The Research Quarterly, 4:60, December, 1933.
7. Campbell, Byron A., and Russell M. Church. Punishment and Aversive Behavior. Appleton-Century-Crofts,1969.
8. Campbell, Donald E. "Students' Attitudes Toward Physical Education," Abstracts of Research Papers,1908, 1969.
9. Campbell, Donald E. "Wear Attitude Inventory Applied to Junior High School Boys," Research Quarterly,391888, December 1968.
10. Craig, H. W. "Sports Interests and Attitudes of Students Enrolled in the Service Curriculum in Physical Education at the University of Illinois." The Research Quarterly, 101143, May, 1939.
55
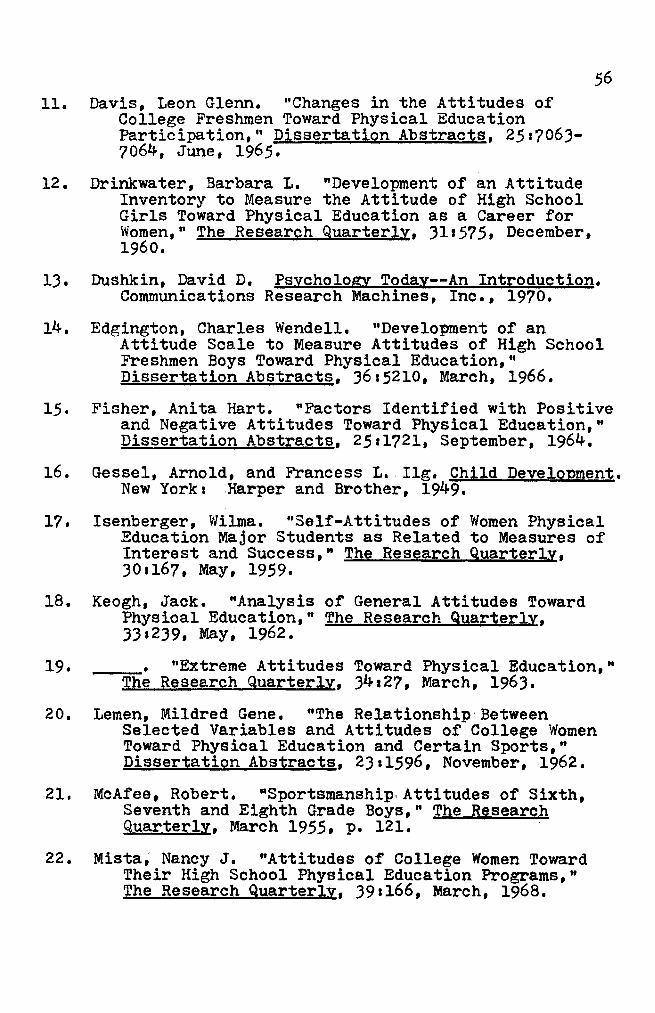
56 11. Davis, Leon Glenn. "Changes in the Attitudes of
College Freshmen Toward Physical Education Participation," Dissertation Abstracts, 251'10637064, June, 1965.
12. Drinkwater, Barbara L. "Development of an Attitude Inventory to Measure the Attitude of High School Girls Toward Physical Education as a Career for Women," The Research QuarterlY, 311575, December,1960.
13. Dushkin, David D. Psychology Today--An Introduction. Communications Research Machines, Inc., 1970.
14. Edgington, Charles Wendell. "Development of an Attitude Scale to Measure Attitudes of High School Freshmen Boys Toward Physical Education," Dissertation Abstracts, 3615210, March, 1966.
15. Fisher, Anita Hart. "Factors Identified with Positive and Negative Attitudes Toward Physical Education," Dissertation Abstracts, 2511721, September, 1964.
16. Gessel, Arnold, and Francess L. Ilg. Child Development.New York 1 Harper and Brother, 1949.
17. Isenberger, Wilma. "Self-Attitudes of Women PhysicalEducation Major Students as Related to Measures of Interest and Success," The Research Quarterly,301167, May, 1959.
18. Keogh, Jack. "Analysis of General Attitudes Toward Physioal Education," The Research Quarterly,331239, May, 1962.
19. • "Extreme Attitudes Toward Physical Education," The Research Quarterly, 34127, March, 1963.
20. Lemen, Mildred Gene. "The Relationship-BetweenSelected Variables and Attitudes of College Women Toward Physical Education and Certain Sports,"Dissertation Abstracts, 2311596, November, 1962.
21. McAfee, Robert. "Sportsmanship, Attitudes of Sixth, Seventh and Eighth Grade Boys," The Research Quarterly, March 1955, p. 121.
22. Mista, Nancy J. "Attitudes of College Women Toward Their High School Physical Education Programs,"The Research Quarterly, 391166, March, 1968.

57 23. Moawad, Sayed Hassan. "A Situation-Response Physical
Education Attitude Scale for Sophomore High School Boys,1I Dissertation Abstracts, 2111834, January,1961.
24. Moyer, Lou Jean, John C. Mitchem, and Mary Bell. "Women's Attitudes Toward Physical Education in the General Education Program at Northern Illinois University,1I The Research Quarterly, 371.515. December, 1966.
2.5. Nash, J. B. liThe Skill Learning Years," Yearbook of
26. Nemson, Edward. IISpecific Annoyances in Realation to Student Attitudes in Physical Education Classes," The Research Quarterly, 201336, October, 1949.
27. Redl, Fritz. When We Deal with Children. Free Press Publishing Co., 1966.
28. Remmers, H. H., N. L.Gage, and Francis J. Rummel. A Practical Introduction to Measurement. New Yorkl Harper and Row, 1965.
29. Schain,' Robert L. Maintain It. Teacher
Discl.p-.J...... HOn VV .... w ...... 0-.2..... _u....
- .. - - - -->
30. Seymour, Emery. "Behavior Characteristics of Partici pants in Little League Baseball," The Research Quarterly, October, 1956, pp. 338-346.
31. Stalnaker ~ John,' IIAttitudes Toward IntercollegiateAthletics,1I School and Society, 37=500, April~ 1933.
32. Turner~ Mary Ann. "Senior Girls' Attitudes Toward High School Physical Education and Their Relationship to Program Quality and Other Factors," Dissertation Abstracts, 2613747, January, 1966.
33. Vincent, Marilyn F. "Attitude of College Women Toward Physical Education and Their Relationship to Success in Physical Education," The Research Quarterly, 381126, March, 1967.
34. • "Prediction of Success in Physical Education Activities from Attitude, Strength, and EfficiencyMeasurements," The Research Quarterly, 381502, October; 1967.

58 35. Wear, C. L. "Evaluation of Attitude Toward Physical
Education As an Activity Course," The Research Quarterly, 221144-126, March, 1951.
36. • "Construction of Equivalent Forms of an Attitude Scale," The Research Quarterly, 261113119, March,' 1955.
37. Wessel', Janet A., and Richard Nelson. "RelationshipsBetween Strength and Attitudes Toward PhysicalEducation Activity Among College Women," 1h! Research Quarterly, 351562, December~ 1962.

APPENDIX A
A Scale for Measuring Attitudes Toward Any Practice--Form A
59

A SCALE FOR 'MEASURING ATTITUDES TOWARD ANY PRACTICE
Form A Edited by H. H. Remmers
Date _
Name (optional) _ Sex (circle one) M F
Age _ Grade _
Directions: Following is a list of statements about practices. Place a plus sign (+) hefore each statement with which you agree with reference to the practice or practices listed at the left of the statements. The person in charge will tell you the practice or practices to write in at the head oC the columns to the left of the statements. Your score will in nO way affect your grade in any course.
I I I I
Has an irresistible attraction Cor me.
I like this practice too well to give it up.
Serves a good purpose.
Develops cooperation.
Should be appreciated by more people.
Has advantages.
There is no reason for stopping this practice.
Is all right in a few cases.
My likes and dislikes for this practice are balanced.
I dislike this practice but I do not object to others liking it.
Isn't so bad but it is ver y boring.
Has several undesirable featur~s.
Should not be tolerated when there are so many better ones.
LiCe would be happier without this practice.
Is a waste oC time and money.
Accomplishes nothing worthwhile either Cor the individual or society. Is the worst thing I know.
Copyright. Purdue Research Foundation. 1960

APPENDIX B
A Scale for Measuring Attitudes Toward Any Practice--Form B
61

A SCALE FOR MEASURING ATTITUDES TOWARD ANY PRACTICE
Form B Edited by H. H. Remmers
Da te _
Name (optional) _ Sex (circle one) M F
Grade _
Age -----------:-~-::.tem Directions: Fol1owing is a list of statements about practices. Place a plus sign (t) before each statt"ment with which you agree with reference to the practice or practices listed at the left of the statements. The person in charge wil1 tel1 you the practice or practices to write in at the head of the columns to the left of the statements. Your score will in nO way affect your grade in any course.
I I / j/ Should be practiced by al1 Americans.
Aids in bringing civilization to a higher level.
Is endorsed by sensible people.
Many things about this practice are essential to normal living. Keeps us from being "one- sided. "
As a rule, is good.
Has mOre merit than rlemerit.
would enjoy this practice if it were changed somewhat.
am not against this practice but neither am I for it.
Isn't absolutely bad but isn't good either.
Is a little foolish.
Has more disadvantages than advantages.
Is annoying.
We would be better off without this practice.
Is not endorsed by sane people.
Serves no purpose.
I hate this practice worse than I hate anything else.
Copyright, Purdue Relearch Foundation, 1960

sat~os apn+l++V ~a+sVPJ anp~~ aq+ ~OJ l~nu~w
a XIONa:ddV
f.lrmN
r'll"n_"flfWiI'ifi3tl?i:""!l"••rntrT ¥ifnll"'iilioe e$Z Ul'.1 tM.r••1#'6tl rvnid'ff:t?'WU.'t«l.,.fjt*+rlirf"iffl''I\',iir h' "Hili/'illt"""! 1m"? tl'!i_i'l&r~"", •• ",-l!p'h y "'~~~~..w.."!,~,.\""'",,",U,,,,~~",,.,)c
MANUAL
I FOR
THE PURDUE MASTER ATTITUDE SCALES
by
H. H. Remmers
Professor, Psycholol!Y and Education
Director, Division of Educational Reference
PURDUE UNIVERSITY
Lafayette, Indiana
I Published by
University Book Store
360 State Street
West Lafayette, Indiana
) Copyright, the Purdue Research Foundation, 1960

lliE PURDUE M.~STER AITITUDE SCALES
Each of these scales is available in twO equivalent forms. A and B. The scales are sepat-ately a"'ailable as follows. Scale to measure attitude toward:
I. Any Sc 1>001 Subject 2. Any Vocation l. Any Institution 4. Any Defined Group 5. Any Propesed Soc.al Action 6. Any Practice 1. Any Home.Making Activity 8. Individual and Group Morale 9. The High School
The Rationale of the Scales
The scaling procedure for each of the scales is the psychophYllical prinCiple that equally often observed differences are rqual. often referred to as the Thursrone att\tude scaling tech
nique. Thursrone concel\;ed thiS psychophY51cai prinCiple as applicable to the scaling of attitude ~tatements rele ...·ant to s~cific attitudes. He and his associates as wdl as ()(ner researcherll did much expenmentatlon t("stlng the overall hypothesis and demonstfated its validity "'l1h referenceto many specific attitude
obJectll~
Thr unique ad"'antage of the Purdue M",stcr Attitude Sc"les i. that a Single scale can validly measure attitude to",ard any one of a large numherof speCifiC attitudes "o'lth a ~no"",'n, adequate degree of rellahdlty. Slncc the experimental "'ork. reqUired In the con~truction of a Single scale requin's perhaps somt.·thing li~e 200 hours, thiS ma~es re''ldily app.:1rcnt the tremendou!'i practical adv(lntage of the:->e 5c",les OH'r those de:o.lgnt.~d for !>~cific altitude ohJect,,>, For eXi1mp le, a sc.'lle to measun" (Ittitud..., toward each of all the eXI!'>tlng vocations IS only theon~tlc"llr.
nO( praccically fea:o-.ible, ~Ince to do so 1'oul\~ n'quire :o.t'ycr:t1 hundred year~ for i1 ~lngle CumpCf('nt o:penrnentt·r. InthL' bn)~h_i2
er conte ... l of p"}'chologlc,,1 te:o.t th,:ul'y a qunl.'ltlOfI fr'om (",'l(fell i. relevam:
1. For detai led discu" .. lon of till' l· ... rl·r·/rnl·IlI,,1 pn)CI',iul t·" in con.tructing such ~c .. fe~ M'e I{l'mrnl'r'~, II. IL Inll"'~~J..~)~~
Opinion "nd Aflliude MI'"..,tlrnllnH, New Yo,": 11.'lpe.' A 1\1t)~.,
19~4. p. 87-94.
"Paniculanzed ",alid"tion is not only deVOId of proper scientific Intere.,t but deceptn'e In It'J promise of practIcal economy •.••. Its ab~urdity IS most C(l~t"nrh argued by the demands of p,.-actlcaleconomy and eff,clencv alone',for a specifiC test for r"\er~' occupatIon and llfesl[uatlon IS It!! logical and Imposs,ble conclUSion," (pp. 5-4-9-550:,_
Recent de~'elopmen[s In attItude measurement ~,a\ e Cenaln theoretical advantages, at least for .:ie\el0F'lIng a sCience of
p!!ycholog~" ExaTpies of such de\'e!opme~t"j are the Cu:rma'1. .~aling techmque and ItS reflnemento<; as ~'ell as t~,e,.semantIC
Dlfferentlal developed b,,' psgood an.:! his as,,>OClates an.:i d',e Q-techmque of Stephenson. The Purdue ~~a .. te-r\tt,tude Scal~"j have the pract,cal advantage of being brief, con\ enlcnt an3 1'\th obvious face and content valIdity for man\' purposes In t~,elr
applicability to measurement and e\aluatlon of attltu.:!es,
Validity
Ikyon.:i their face "altdlt~" these scales ha\e .:!emo'1.strareJ validity both against Thurstone's spe-cif,c sc~l~s ~It~ .'h:cht~.t"\ sho'" typically almost perfect correlatIons a'1..:i l~ dlffe:-,~--:::au,;g
among attitudes knQ~ n to Jlffer among ,a (lOU s ~,oups. E x.1 :-np;es of such valdatlOn are_: :a: attltu.:ie to\ollar.:! SunJa\ ot-!>enac:..:e of Se"'enth-.:ia\' ':\,:hennsrs ".~. other church mem~(";-~_ ;Ke!:e\. Ida B .• "The Construction and E\aluatlon ofa Sca.:t> tv ~~e,\sur('
Attltu.:ie T01"ard :\n\' In:-.: ltut,on." Ru llerl~ ofr'u :-Jut" L'~I\ t"rslt\. Studies In,-\ttl[uJes.'[)e-..:emt-er lQ3 ... pp. 19.3o,:: j:~l!"!~ f<Jr s0":la1 5tudles \5. 5C1er1Cl' S[UJ1CS amongh\~h .. ~h\.10: S~u,~l·n~s. :Sl:an..:e, Ella Belle anJ Rl'rnmt'rs. H. f{ "An FXr,·nmC"1t.l~ Cl'~l'! .,l;z(".:i Master Scale: A SC,lle t\J ~'(".'lsure .-\ttltU,~t' T\.),,'-ar-J :\n\ -::'.::h\."0: SubJect." op. CIL, pp. 84-S-:-.> prt-fl·rcn ...-c f\.)r tht' ml:1.: .. ~n "5.
2. Canell, R. R. rk~Lr~\""n .\nJ \1t'a"\1~-t'mt':'l~ \"1 f\'r",':'l,l!'t\, Yon"t'rs-on-HuJ~,,~-ROlld-l'-lO~ ("~1~~-----
1. F~l\r rl·fl'll'nL't·", t\.... sl'\er.l! of Guttm.1n·sr.'rl'l .. ~l·t'R,·",ml~r5,
op. Cit •• p. lJ~.
4. O~~,,,,-d. C. I. r"t :11. The \1e,hllrnlh'nr "f \h'"nln~. l·rp~n,'l.
llllnvl~' tbt.· L'nl\ot'r-~I(\ ~,fTIT~-;;~;:::-Jl(~~~-
L'nn cr-
SIt)' 0 Chl.:.l~O P.'("!'>s. IQ'l L . 5~ Stl'rhl'n .."n. Will, ,\Ill, !_~t~<:_~'.!~_0J~]~~_~~.Ch,;.l~'"

rInt'!!'. rr''lffttt'nnwW'iiKil.ttllt.'6IYjirhuzut'lnrSfn "] ttuq i If t_S.llyjirf!ilt"""~+\i!i'ioiliib*!"1FIifWlilillT"i'tti It WI 'i ! .-......: " , ~,-""\=""~~-;;~,,,,,,_~~_~~..~._.~;ruC~ ••• ~ ......~_.
enginc('ring (Remmers, H. I-l "Measuring Au jrudcs Toward Vocations:' Ope elL, pp.77-83.); attitudes toward drinking and petting among the memhc..'rs of social fraternities, sororities. Y.W.C.A. members and Sunday school meml>crs (Flues, H. W. "The' ConsrrUCfl0n and ValIdatIOn of a Scale' roMeasure Anirude T01lt'ard Any Practice," op. cit", pp. 64-67.); attitudes roward l\egroes. Chinese. ""hites, Egypclans, Syrians. English, and Jews (Grice. H. H. "The ConstruCflon and \'alidarionof a Generahzed Scale Designed (0 Measure Attitudes T01lt'ard Defined Croups." op. etC. pp.37-46.); attitude to.'ard any home-making acri"'lty (Kellar. ~a(rlJl" "The Construction and Validation of. Scalt' for ~1easunng Attitude To"'ard Any Home-Mak.lng ActiVity," op. cit.. pp. 47-63.). These are only a few sampJt's of experimt'maI studies carned out to construn and valid"te these scales. The interested reader will find furtht'r rt'ports of t'xperimt'ntaI work.. In the monog.raphc Ited above and in t ht' follow1 ng refc renc t's:
I. Ba'eman. R, M. and Remmers, H. H. "A Study of ,he Sh,fting A'ttlude of HI~h School S'uden's "hen SubJec'ed to Favorahle and Unfavorahle Propaganda:' Journal of Social Ps\,cholo,;y, )Q41, 13.394-406.
2. Bateman, R. M. and Remmt'rs. H. H.. "AUitudes of High School Freshmen To.·ard Occupations of Their Choict' Before and After Studying the Occupations hy Means of a Career Rook.,'· Journal of Educatlunal Psv
chology, Decemhr 193Q. 6S7-666.
3. Remmers, H. H. "Attitudes Toward Germans, J,'panese, Jews, and NaZIS as Affected hy the War," Schoul anet Socle,y, January 30, IQO, V. Si. :"0.1466.138-140.
4. (Fd.) Stu,~It.~~ In ACtl(UJ(',;, A Co~~
to So~..!..~I-P!>\'chploblc:d !{co;:e,.'ar-ch ~krhl)..i,>, f\ullc[ln of Purdue Unl\erslt)'. Oe,.·ccmhcr, 1934, 1-112.
5. _, "Chan~e!'o In Attitude ... T(j'A·.,rd Cenu.ln ....
Jap"nesc. Jew,;. anet S.171~. a~ Affcch",t hy tht.: W.,r," School .lnd_ SOClt..'ly, r:ehru'lry Ih, 104b, \'. 63, ~o. 162"1,
118 -119.
6. ~_'Chan~,'~ In AlIilU,k Tuy,:tl\~ C ... rrn.ln ....
Japa.ne!>t', Jew,>, an,' '.171~." Scl ... '\ll.lIlJ.·.."I{-ld\-. lu/1(' 2M. 1947, V. 6S, ~o. 16ryb, 4R4-487. -- __~_. __ o
7. (Fd.) FUI_fll(_·~~{~~'h~~~~..~~!.!fl_I~I:".:_~'!2-I·~
!!. Bullt:1ln of Put'tlilc Unl\,t·,-..lf)·, I)cl-l"rnlwr· It)ltl. I_~t)".
8. f-'unl'f·' S(ll,tal'~ III ,l\fTlllI,I.·, "1'111· ... rtl, Bullclln of Purrl~'-l-'I\~'~~ll)'-'-Pi-l~~--I-~1. --.-----'""
9. "Prop'gand. in,heSchool.- Do,hef:ffec,. Lull" The PublIC OpInIon Qu..~erly, Aprtl 1938, V. 2,
No.2,197-210.
10. Tschechtelin, Sister M.. A•• and Remmers.H. H. "Measuring the Attitudes of Elemenrary School Chddren Toward Their Teacher§:' T!-le Journal of Fdueatlonal
Psychology, MHch 1940, 19S-203.
11. Whisler, Laurence D., and Remmt"r"'S, H. H. "The Effeer of the Election on High Schoo! Pupds' Attttu~es Toward the Two Malor Parties," School and l)oclety. Apnl 17,
1931. V, 4S, ~o. 1164, SS8-S60.
1 12. "A Scale fur ~~('asurlng1ndl.
vidual and Group Moralt"," The Jour~al ~,r Ps ... c~oL?i..::'
1937,4,161-16S.
13, "llherallsm, Opt:mlsm. and
Group ~10rale: A S(ud r of Studt:'m Artltl.l.:!t"s,·' Tr.t' Journal of SocIal Psvchnlo.£l. lc;l18, \'. c;l. 451-467.
14. Williamson, A. COl and Remmers, H. H. "Perslsrerl.Ce of Attitudt's Concernln~ Consenatlon lssuc~," T~.e _',_'u:""-ai of [lpenmt"ntal r~1U-c"rlon, ~1a~ch 10 40, lS4- 301
IS" ""ood, W. F .• and Remmers, H. H. "Chan~e,.'s In :\n :tu~t' To..... ard Germ.lns. Japant:'se. Jt:''''s, an3 \".1115," 5,:-..:",)[ and Soclep,-·. June 28, I Q 47, \ .• 01). "\0. 1600,4S4-48-.
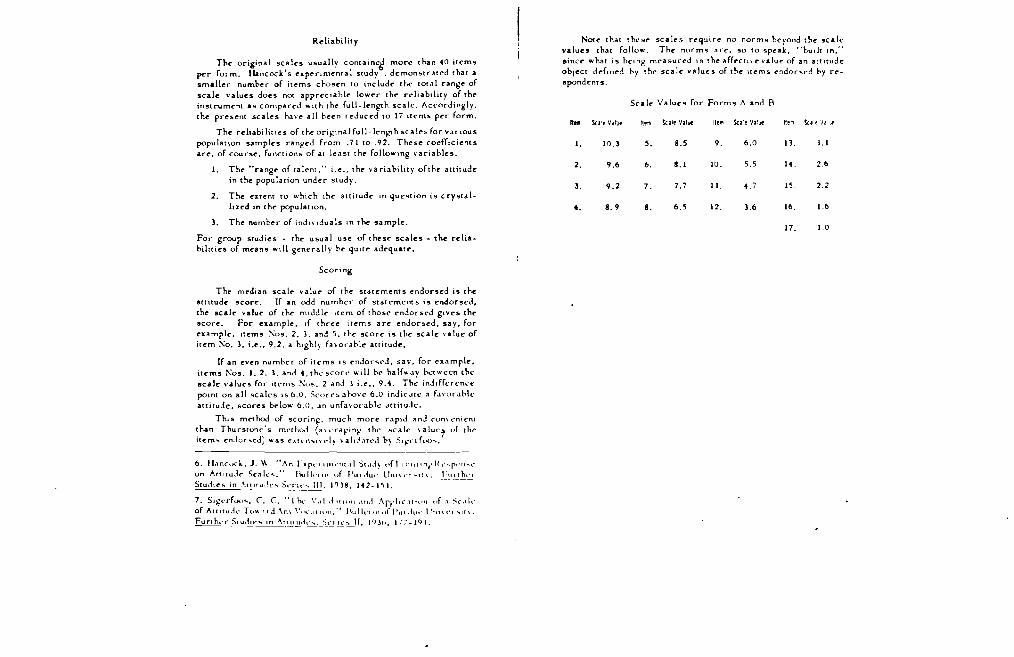
~~'''f'••i%.'6'.lff.'ht:?l'imilf= "'riR. II. itrMPII"ltrtc e%itrwH"iit:l%",,£& '.. iF l"""""i. ' .."';,;*••..;.......w".....~""'''''',_'.~~.M£ •.''.. "t" •• ,.,,, .,",c.",.' .", , 't •.
Rdiability
The original scales us~all)' containcc more than .0 items per form. Hancock's expenmenta: study. demonstrated that a smaller number of items chosen to include the total range of
scale values doC's not appreCiable lower the rdiabdity of the instrument as compared lIl,ith the full-length scale. Accordingly. the present scales have all been reduced to 17 Items per form.
The reltabilitles of the original full-length scales for various population samples ranged from .71 to .Q2. Thest" coefficients are, of course, functions of at least the follOWing variables.
1. The ··range of talent," i.e., the varia.billty of the attitudt"
in the population under study.
2. The extent to which the attitude in question is crystallized in the population.
3. The n\lmber of indl\"lduals in tk sample.
For group studies· the usual use of these scalt"s - the reliabilities of means lIl.. dl generally be qUite adequatt".
Scoring
The median scale value of the statements endorsed is the attitude score. If.Jn odd number of statements is endorsed. [he scale value of the middle Item of those endorsed gives the score. For example. If three items are endor~ed, say. for example, Items :-";05.2, 3, anj 'S. the score is the scale value of i,em :"0. J. i.e., 9.2. a hlghl\' rnorahle attitude.
If an even number of items is enJorscd, say, for example, items Nos. 1.2, 3, and .. , the seon: will be half",.l)' hctween the
scale values for items ~O~. 2 anJ 3 i.e., 9 .... Tht.' inJ.fft.'rt.'nct: point on all scales lS 6.0. Scorf"~ ahove 6.0 indicJtt? a favorahlt." attitude. sco..-es below 6.0, d.n unfavor'ablc: JttituJe.
ThiS method of scoring, much more rapid ~nJ cunvcnit'nl than Thursfunc's method (a\"crat'in~' the scale \alul'~ or the item!:. endor- ..cd) ",-as n:fl·n"lvcl)· \ ald,llc..l by SI~tTflK.h.
6, lbncuck.. J. v... 'f An I'x.rn IUh'IlLll Stu-iy llff IlllllPlt' 1{'· .... r"II'-I·
on AUlluJc Sc~lc .. ," Bulkurl uf I'lll .. lu.· Unl\"I"lfL FUlrhn
StudIes in :\ll11U'~~~~r..:.~~~~, 10lg. 1"2-1~1.
7. Slgl'r·foo .. , C. C. "rh<.' \',dl.t 111011,111,1 "'rpIH·.lIIPfI uf.1 :-;('.d~,
of AUltudl' TOlolo'lrdAn\ \'01.:.11111\1," l~ulkl .. ,,,rIIUl.tllt·l~I\I\t"I"lr\.
Funhl'!:.......~,!!.t~~f_~r~.i~_~t.'.~·~~~JJ. 103h, 1-;'-;'-1"1.
Narc that these' scales require no norms beyond the '!Icale values that folio...... The norms" reo so to ~peak. "budt In,"
since ... hat is being measured i~ the "ffeetl\C''''a!ut'' of an attitude object deflned by the scale values of the Items endorsed by respondents.
Scale Values for Forms A and B
ttflll Scale V31je Itp!tl Seile ValUf lIelll Seai~ VlI~1J'e tl~'" Sen'lJ ~
I. 10.3 5. 8.5 9. 6.0 13. J.I
2. 9.6 6. 8.1 10. 5.5 14. 2.6
3. 9.2 7. 7.7 II. 4.7 15. 2.2
.. 8.9 8. 6.5 12. 3.6 16. 1.6
17. 1.0
Top Related