


Languages
Pages
Legal


For peer review only
A cohort study of trends in the prevalence of pregestational diabetes in pregnancy recorded in United Kingdom general
practice between 1995 and 2012
Journal: BMJ Open
Manuscript ID: bmjopen-2015-009494
Article Type: Research
Date Submitted by the Author: 22-Jul-2015
Complete List of Authors: Coton, Sonia; University College London, Primary Care and Population Health Nazareth, Irwin; University College London, Primary Care and Population
Health Petersen, Irene; University College London, Primary Care and Population Health
<b>Primary Subject Heading</b>:
Diabetes and endocrinology
Secondary Subject Heading: Epidemiology, General practice / Family practice, Obstetrics and gynaecology
Keywords: DIABETES & ENDOCRINOLOGY, Diabetes in pregnancy < DIABETES & ENDOCRINOLOGY, EPIDEMIOLOGY, PRIMARY CARE
For peer review only - http://bmjopen.bmj.com/site/about/guidelines.xhtml
BMJ Open on 10 June 2018 by guest. P
rotected by copyright.http://bm
jopen.bmj.com
/B
MJ O
pen: first published as 10.1136/bmjopen-2015-009494 on 25 January 2016. D
ownloaded from

For peer review only
Title page
Full title:
A cohort study of trends in the prevalence of pregestational diabetes in pregnancy
recorded in United Kingdom general practice between 1995 and 2012
Authors:
Ms Sonia J Coton MSc1
Professor Irwin Nazareth1
Dr Irene Petersen1
1 University College London, Research Department of Primary Care and Population
Health, Rowland Hill Street, London, NW3 2PF, United Kingdom
Corresponding author:
Sonia Coton,
University College London, Research Department of Primary Care and Population
Health, Rowland Hill Street, London, NW3 2PF, United Kingdom
Word count: 2672
Key words:
Diabetes mellitus; Pregnancy; Electronic health records; Prevalence; Epidemiology
Page 1 of 20
For peer review only - http://bmjopen.bmj.com/site/about/guidelines.xhtml
BMJ Open
123456789101112131415161718192021222324252627282930313233343536373839404142434445464748495051525354555657585960
on 10 June 2018 by guest. Protected by copyright.
http://bmjopen.bm
j.com/
BM
J Open: first published as 10.1136/bm
jopen-2015-009494 on 25 January 2016. Dow
nloaded from

For peer review only
Abstract
Objective To describe the characteristics of pregnant women with and without pregestational
diabetes and to estimate the prevalence of pregestational diabetes in pregnant women in United
Kingdom
Methods Pregnant women with and without diabetes aged 16 years and over were identified
within the Health Improvement Network (THIN) primary care database. Data were examined
on: age, body mass index, social deprivation, smoking, ethnicity and glycaemic control. The
prevalence of pregestational diabetes was calculated by diabetes type and calendar year
between 1995 and 2012.
Results Data from 400,700 pregnancies suggests that women with pregestational diabetes
were: older (median: 30, 32 vs 29 years for type 1, type 2 and without diabetes), had higher BMI
(median: 25.2, 30.1 vs 23.9k/m2 for type 1, type 2 and without diabetes) and were registered
with a general practice for longer than pregnant women without diabetes.
The prevalence of type 1 diabetes in pregnancy increased from 1.58 to 4.71 per 1000
pregnancies between 1995 and 2015. For type 2 diabetes the increase was from 2.38 to 5.95
per 1000 pregnancies between 1995 and 2008 followed by a more rapid increase to 13.62 per
1000 pregnancies by 2012
Conclusions Pregnant women with pregestational diabetes were older, had higher BMI and
were registered for longer than women without diabetes. The prevalence of both type 1 and type
2 diabetes increased in pregnancy. The prevalence of type 2 diabetes rose more rapidly with a
marked increase after 2008.
Page 2 of 20
For peer review only - http://bmjopen.bmj.com/site/about/guidelines.xhtml
BMJ Open
123456789101112131415161718192021222324252627282930313233343536373839404142434445464748495051525354555657585960
on 10 June 2018 by guest. Protected by copyright.
http://bmjopen.bm
j.com/
BM
J Open: first published as 10.1136/bm
jopen-2015-009494 on 25 January 2016. Dow
nloaded from

For peer review only
Article Summary
Strengths and limitations of this study
• This study examined the temporal trends in the prevalence of pregestational diabetes in
pregnancy recorded in primary care, over a period of 18 years.
• This study showed the trends in the prevalence of prescribing insulin and oral anti-
diabetics in primary care to women with diabetes during pregnancy over a period of 18
years
• The data source for this study was a large primary care database that is representative
of the UK population with over 3 million active patients
Page 3 of 20
For peer review only - http://bmjopen.bmj.com/site/about/guidelines.xhtml
BMJ Open
123456789101112131415161718192021222324252627282930313233343536373839404142434445464748495051525354555657585960
on 10 June 2018 by guest. Protected by copyright.
http://bmjopen.bm
j.com/
BM
J Open: first published as 10.1136/bm
jopen-2015-009494 on 25 January 2016. Dow
nloaded from

For peer review only
Introduction
Diabetes mellitus is a chronic metabolic disease caused by a decrease in the production of
insulin or sensitivity to insulin. Type 1 diabetes is caused by the destruction of insulin producing
cells in the pancreas and is most commonly diagnosed in childhood. Type 2 diabetes is caused
by cells insensitivity to insulin and insufficient production of insulin. Type 2 diabetes is more
common among adults, although it is becoming increasingly prevalent in adolescents [1].
Pregestational diabetes is one of the commonest chronic conditions affecting pregnancy, in the
UK one in every 250 pregnancies is complicated by pregestational diabetes [2]. And the
prevalence is increasing, in the UK the prevalence of pregestational diabetes increased from 3.1
to 4.7 per 1000 births between 1996-98 and 2002-04 [3].
Diabetes in pregnancy is associated with increased risk of pregnancy complications and
adverse birth outcomes. Pregnancies affected by diabetes in pregnancy are at an increased risk
of spontaneous abortion, caesarean section, congenital anomalies and perinatal mortality [3–7].
The current literature on the prevalence of diabetes in pregnancy is based on samples selected
from hospitals, maternity units or small community based samples [3,8,9]. We used data from
UK primary care records dating back to the 1990s.
The aims of this study were to examine characteristics of pregnant women with and without
pregestational diabetes, and to investigate the time trend in the prevalence of pregestational
diabetes in pregnancy using data from a large primary care database, The Health Improvement
Network (THIN).
Page 4 of 20
For peer review only - http://bmjopen.bmj.com/site/about/guidelines.xhtml
BMJ Open
123456789101112131415161718192021222324252627282930313233343536373839404142434445464748495051525354555657585960
on 10 June 2018 by guest. Protected by copyright.
http://bmjopen.bm
j.com/
BM
J Open: first published as 10.1136/bm
jopen-2015-009494 on 25 January 2016. Dow
nloaded from

For peer review only
Methods
Data Source:
For this study we used the THIN primary care database, which contains longitudinal
anonymised electronic primary care records from 587 general practices, covering approximately
6% of the UK population [10]. The database contains information on: diagnoses, symptoms,
prescriptions, referrals, laboratory tests, basic demographics and social deprivation (recorded
by Townsend score). Diagnoses and symptoms are recorded during consultations by practice
staff using Read codes, a hierarchical coding system used in UK primary care [11].
The THIN database is broadly representative of the UK population in terms of patient
demographics, chronic disease prevalence and death rates [12] and in UK 98% of the
population is registered with a general practitioner [13].
Study Population:
We identified pregnant women aged 16 years and over, who were registered with a general
practice in THIN and delivered a baby between January 1st 1995 and December 31st 2012.
Pregnancies were included after each practice met acceptable computer usage (ACU) [14], and
acceptable mortality rate (AMR) [15]. Using these dates improves the data quality. ACU is
defined as the practice recording on average at least two drug prescriptions and two medical
records per patient per year. AMR is when the practice has comparable mortality rates to the
rest of the UK.
Pregnant women with pregestational diabetes were identified through diagnoses and
prescriptions in their electronic health records. Women that had a single record of diabetes or,
prescription records alone without a diabetic specific diagnostic code were excluded from the
study as we were not certain of their diabetic status. Women with a first record of diabetes
Page 5 of 20
For peer review only - http://bmjopen.bmj.com/site/about/guidelines.xhtml
BMJ Open
123456789101112131415161718192021222324252627282930313233343536373839404142434445464748495051525354555657585960
on 10 June 2018 by guest. Protected by copyright.
http://bmjopen.bm
j.com/
BM
J Open: first published as 10.1136/bm
jopen-2015-009494 on 25 January 2016. Dow
nloaded from

For peer review only
dated after the start of pregnancy were also excluded so that we could be certain we were
studying diabetes types 1 and 2, and not gestational diabetes.
We generated an algorithm for classifying diabetes type using different combinations of four
variables. The algorithm was discussed in a panel including clinicians. The four variables are:
(1) whether a woman had a type specific diagnostic code; (2) the prescription records; (3) age at
first record of diabetes and (4) whether the woman was diagnosed with diabetes prior to
entering the practice. The type specific diagnostic Read code was given the most weight in the
type classification algorithm; if a woman had a non-conflicting type specific Read code then they
were initially classified as having that type of diabetes. Prescriptions were then looked at and if
a woman had received long term oral antidiabetics prescriptions with or without insulin, any oral
antidiabetics without insulin, or no prescriptions they were classified as having type 2 diabetes.
Lastly, for women that had conflicting or no type specific diagnostic Read codes we considered
prescriptions along with age at diagnosis and whether the women were diagnosed prior to
registration. In general if a woman had prescriptions for insulin with or without short term oral
antidiabetics, was less than 35 years old at diagnosis or older than 35 years and diagnosed
after registering with a practice they were classified as having type 1 diabetes, and type 2
diabetes otherwise.
After applying the classification algorithm, if there were women still unclassified then a manual
review of their entire medical records was undertaken.
Maternal Characteristics:
We compared pregnant women with and without diabetes in terms of: age; body mass index
(BMI) prior to pregnancy; smoking (coded as non, former or current); Townsend score (coded
as 1 least deprived to 5 most deprived); ethnicity (coded as white, black, asian, mixed or other);
blood pressure; and HbA1c levels prior to pregnancy. We also created a binary variable
Page 6 of 20
For peer review only - http://bmjopen.bmj.com/site/about/guidelines.xhtml
BMJ Open
123456789101112131415161718192021222324252627282930313233343536373839404142434445464748495051525354555657585960
on 10 June 2018 by guest. Protected by copyright.
http://bmjopen.bm
j.com/
BM
J Open: first published as 10.1136/bm
jopen-2015-009494 on 25 January 2016. Dow
nloaded from

For peer review only
indicating whether a women was overweight or not; women were classified as being overweight
if their BMI≥25kg/m2.
Townsend score [16], is a composite index score of owner-occupation, car ownership,
overcrowding and unemployment based on a patient’s postcode and information from the 2001
census data linked to each patients’ postcode.
Statistical Methods:
Characteristics of pregnant women with and without diabetes were compared using median and
the inter-quartile range (IQR) for continuous variables or number and percent for categorical
variables calculated for by diabetes type and women without diabetes separately. For women
with multiple eligible pregnancies recorded a single pregnancy was selected randomly.
We calculated the prevalence of pregestational diabetes by calendar year of delivery and
diabetes type for the years 1995 to 2012 inclusive. For women with multiple eligible
pregnancies recorded all pregnancies were included in the prevalence calculations.
All analyses were performed using Stata version 13 (StataCorp, College Station, TX USA)
Results
We identified 517,725 pregnancies in THIN between 1st January1995 and 31st December 2012.
We removed 88,661 pregnancies as either they did not meet data quality standards or occurred
before the mother was 16 years of age. A further 28,364 pregnancies were removed because
we could not confirm the diabetic status of the mother before the pregnancy began. The final
cohort consistent of 400,700 pregnancies to 301,712 women recorded in THIN. The majority of
women had a single pregnancy (73%) and only 0.72% of women had four or more pregnancies.
Page 7 of 20
For peer review only - http://bmjopen.bmj.com/site/about/guidelines.xhtml
BMJ Open
123456789101112131415161718192021222324252627282930313233343536373839404142434445464748495051525354555657585960
on 10 June 2018 by guest. Protected by copyright.
http://bmjopen.bm
j.com/
BM
J Open: first published as 10.1136/bm
jopen-2015-009494 on 25 January 2016. Dow
nloaded from
For peer review only
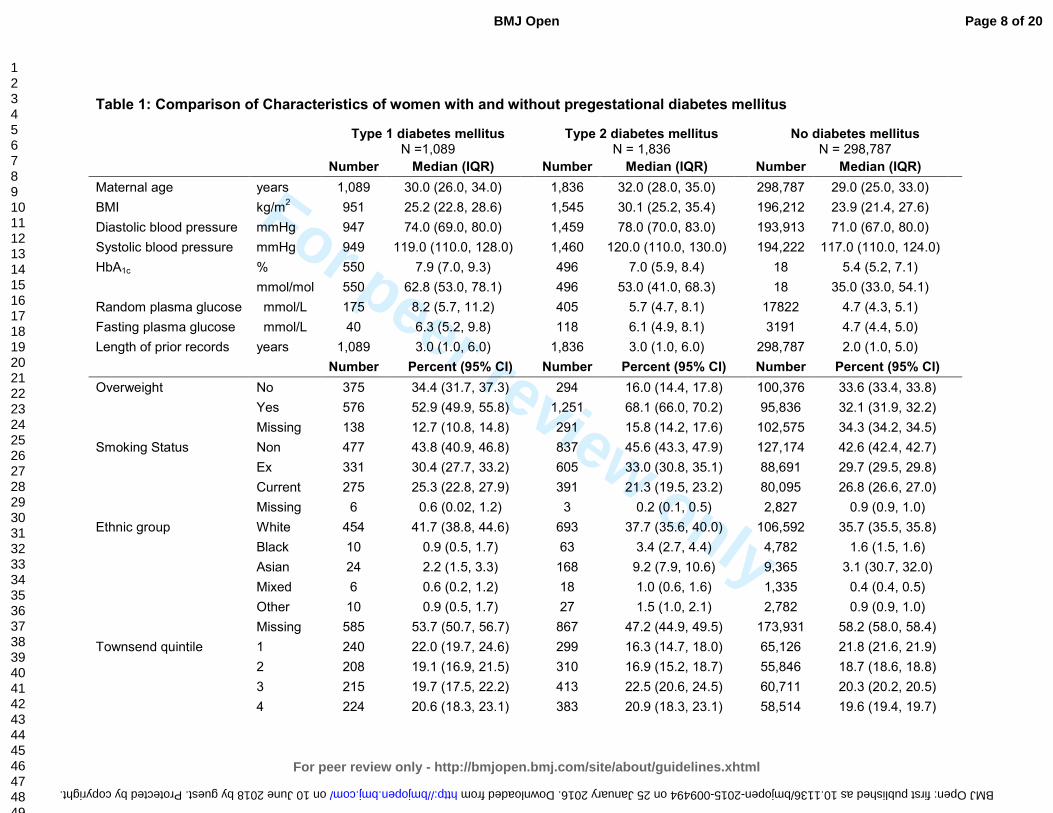
Table 1: Comparison of Characteristics of women with and without pregestational diabetes mellitus
Type 1 diabetes mellitus
N =1,089 Type 2 diabetes mellitus
N = 1,836 No diabetes mellitus
N = 298,787
Number Median (IQR) Number Median (IQR) Number Median (IQR)
Maternal age years 1,089 30.0 (26.0, 34.0) 1,836 32.0 (28.0, 35.0) 298,787 29.0 (25.0, 33.0)
BMI kg/m2
951 25.2 (22.8, 28.6) 1,545 30.1 (25.2, 35.4) 196,212 23.9 (21.4, 27.6)
Diastolic blood pressure mmHg 947 74.0 (69.0, 80.0) 1,459 78.0 (70.0, 83.0) 193,913 71.0 (67.0, 80.0)
Systolic blood pressure mmHg 949 119.0 (110.0, 128.0) 1,460 120.0 (110.0, 130.0) 194,222 117.0 (110.0, 124.0)
HbA1c % 550 7.9 (7.0, 9.3) 496 7.0 (5.9, 8.4) 18 5.4 (5.2, 7.1)
mmol/mol 550 62.8 (53.0, 78.1) 496 53.0 (41.0, 68.3) 18 35.0 (33.0, 54.1)
Random plasma glucose mmol/L 175 8.2 (5.7, 11.2) 405 5.7 (4.7, 8.1) 17822 4.7 (4.3, 5.1)
Fasting plasma glucose mmol/L 40 6.3 (5.2, 9.8) 118 6.1 (4.9, 8.1) 3191 4.7 (4.4, 5.0)
Length of prior records years 1,089 3.0 (1.0, 6.0) 1,836 3.0 (1.0, 6.0) 298,787 2.0 (1.0, 5.0)
Number Percent (95% CI) Number Percent (95% CI) Number Percent (95% CI)
Overweight No 375 34.4 (31.7, 37.3) 294 16.0 (14.4, 17.8) 100,376 33.6 (33.4, 33.8)
Yes 576 52.9 (49.9, 55.8) 1,251 68.1 (66.0, 70.2) 95,836 32.1 (31.9, 32.2)
Missing 138 12.7 (10.8, 14.8) 291 15.8 (14.2, 17.6) 102,575 34.3 (34.2, 34.5)
Smoking Status Non 477 43.8 (40.9, 46.8) 837 45.6 (43.3, 47.9) 127,174 42.6 (42.4, 42.7)
Ex 331 30.4 (27.7, 33.2) 605 33.0 (30.8, 35.1) 88,691 29.7 (29.5, 29.8)
Current 275 25.3 (22.8, 27.9) 391 21.3 (19.5, 23.2) 80,095 26.8 (26.6, 27.0)
Missing 6 0.6 (0.02, 1.2) 3 0.2 (0.1, 0.5) 2,827 0.9 (0.9, 1.0)
Ethnic group White 454 41.7 (38.8, 44.6) 693 37.7 (35.6, 40.0) 106,592 35.7 (35.5, 35.8)
Black 10 0.9 (0.5, 1.7) 63 3.4 (2.7, 4.4) 4,782 1.6 (1.5, 1.6)
Asian 24 2.2 (1.5, 3.3) 168 9.2 (7.9, 10.6) 9,365 3.1 (30.7, 32.0)
Mixed 6 0.6 (0.2, 1.2) 18 1.0 (0.6, 1.6) 1,335 0.4 (0.4, 0.5)
Other 10 0.9 (0.5, 1.7) 27 1.5 (1.0, 2.1) 2,782 0.9 (0.9, 1.0)
Missing 585 53.7 (50.7, 56.7) 867 47.2 (44.9, 49.5) 173,931 58.2 (58.0, 58.4)
Townsend quintile 1 240 22.0 (19.7, 24.6) 299 16.3 (14.7, 18.0) 65,126 21.8 (21.6, 21.9)
2 208 19.1 (16.9, 21.5) 310 16.9 (15.2, 18.7) 55,846 18.7 (18.6, 18.8)
3 215 19.7 (17.5, 22.2) 413 22.5 (20.6, 24.5) 60,711 20.3 (20.2, 20.5)
4 224 20.6 (18.3, 23.1) 383 20.9 (18.3, 23.1) 58,514 19.6 (19.4, 19.7)
Page 8 of 20
For peer review only - http://bmjopen.bmj.com/site/about/guidelines.xhtml
BMJ Open
123456789101112131415161718192021222324252627282930313233343536373839404142434445464748495051525354555657585960
on 10 June 2018 by guest. Protected by copyright. http://bmjopen.bmj.com/ BMJ Open: first published as 10.1136/bmjopen-2015-009494 on 25 January 2016. Downloaded from

For peer review only
5 153 14.0 (12.1, 16.2) 329 17.9 (16.2, 19.7) 44,239 14.8 (14.7, 14.9)
Missing 49 4.5 (3.4, 5.9) 102 5.6 (4.6, 6.7) 14,351 4.8 (4.7, 4.9)
Page 9 of 20
For peer review only - http://bmjopen.bmj.com/site/about/guidelines.xhtml
BMJ Open
123456789101112131415161718192021222324252627282930313233343536373839404142434445464748495051525354555657585960
on 10 June 2018 by guest. Protected by copyright. http://bmjopen.bmj.com/ BMJ Open: first published as 10.1136/bmjopen-2015-009494 on 25 January 2016. Downloaded from

For peer review only
Pregestational diabetes affected 1% of pregnancies from the total cohort: 0.4% (1,466/400,700)
with type 1 diabetes and 0.6% (2,556/400,700) with type 2 diabetes.
For women with more than one pregnancy, a single pregnancy was randomly selected for
comparison between women with and without diabetes. Pregestational diabetes affected 1% of
this partial cohort: 0.4% (1,089/301,712) with type 1 diabetes and 0.6% (1,836/301,712) with
type 2 diabetes (Table 1).
Pregnant women with pregestational diabetes were: older, had higher BMI, were more likely to
be overweight, were less likely to smoke and were registered with a general practice for longer
prior to pregnancy when compared to pregnant women without diabetes. The median age was
30 years, 32 years and 29 years for pregnant women with type 1 diabetes, type 2 diabetes and
without diabetes respectively. The median BMI was 25.2kg/m2, 30.1kg/m2 and 23.9kg/m2 for
pregnant women with type 1 diabetes, type 2 diabetes and without diabetes respectively. Sixty
eight percent of pregnant women with type 2 diabetes were overweight compared with 53% of
pregnant women with type 1 diabetes and 32% of pregnant women without diabetes. The
median length of registration prior to pregnancy was 3 years for pregnant women with both type
1 and type 2 and 2 years for pregnant women without diabetes (Table 1).
Pregnant women with type 1 diabetes had higher blood glucose concentrations when compared
to pregnant women with type 2 diabetes. Median HbA1c concentrations prior to pregnancy were
62.8mmol/mol (7.9%) for women with type 1 diabetes compared to 53.0mmol/mol (7.0%) for
women with type 2 diabetes (Table 1). Pregnant women with type 1 diabetes were also more
likely to have blood glucose control tested prior to pregnancy when compared to pregnant
women with type 2 diabetes; 51% vs 27% for HbA1c, 16% vs 22% for random plasma glucose
and 4% vs 6% for fasting plasma glucose.
Page 10 of 20
For peer review only - http://bmjopen.bmj.com/site/about/guidelines.xhtml
BMJ Open
123456789101112131415161718192021222324252627282930313233343536373839404142434445464748495051525354555657585960
on 10 June 2018 by guest. Protected by copyright.
http://bmjopen.bm
j.com/
BM
J Open: first published as 10.1136/bm
jopen-2015-009494 on 25 January 2016. Dow
nloaded from

For peer review only
Pregnant women with type 2 diabetes were more likely to be non-smokers or ex-smokers, and
were more socially deprived than pregnant women with type 1 diabetes (Table 1). Forty six
percent of pregnant women with type 2 diabetes were non-smokers, and 33% were ex-smokers
at the start of their pregnancy compared to 44% and 30% of pregnant women with type 1
diabetes. Eighteen percent of pregnant women with type 2 diabetes were in the most socially
deprived Townsend quintile compared to 14% of pregnant women with type 1 diabetes (Table
1). Diastolic and systolic blood pressure and ethnicity were similar across the three groups,
although approximately half of the women did not have their ethnicity recorded.
The prevalence of pregestational type 1 diabetes and type 2 diabetes in pregnancy increased
over the study period (Figure 1). The prevalence of type 2 diabetes in pregnancy increased
from 1.58 to 4.71 per 1000 pregnancies between 1995 and 2012, a 62% increase over 17
years. The prevalence of type 2 diabetes in pregnancy increased from 2.38 to 5.95 between
1995 and 2008. After 2008 the prevalence of type 2 diabetes in pregnancy increased more
rapidly from 8.19 to 13.62 per 1000 pregnancies between 2009 and 2012 (Figure 1).
Discussion
Summary of Main Findings
Women with pregestational diabetes were: older, had higher BMI, were more likely to be
overweight, and were registered with a general practice longer prior to pregnancy when
compared to pregnant women without pregestational diabetes. Pregnant women with type 1
diabetes had poorer control of blood glucose concentrations when compared to pregnant
women with and without type 2 diabetes. Pregnant women with type 2 diabetes were more
likely to be: non-smokers and more socially deprived when compared to pregnant women with
and without type 1 diabetes. The prevalence of type 1 and type 2 diabetes in pregnancy
increased between 1995 and 2012 with a sharper rise in type 2 diabetes. The real acceleration
Page 11 of 20
For peer review only - http://bmjopen.bmj.com/site/about/guidelines.xhtml
BMJ Open
123456789101112131415161718192021222324252627282930313233343536373839404142434445464748495051525354555657585960
on 10 June 2018 by guest. Protected by copyright.
http://bmjopen.bm
j.com/
BM
J Open: first published as 10.1136/bm
jopen-2015-009494 on 25 January 2016. Dow
nloaded from

For peer review only
in the prevalence of type 2 diabetes in pregnancy occurred in the last 5 years of the study
period; between 2008 and 2012.
Comparison with Existing Literature
There are few studies with the primary objective to investigate the prevalence of pregestational
diabetes in pregnancy [3,9,17,18], of these studies only one is based in the UK [3]. Bell et al [3]
studied the trends in prevalence of pregestational diabetes in pregnancy in maternity units in the
North of England between 1996 and 2004, and found comparable prevalence of type 1 diabetes
but much lower prevalence of type 2 diabetes than our study. In 2002-04 they found a
prevalence of 3.5 per 1000 births of type 1 and 1.2 per 1000 birth of type 2 diabetes. Of the
non-UK based studies [9,19] López de Andrés et al. [19] found in Spain that the prevalence of
pregestational diabetes increased from 0.2% in 2001 to 0.27% in 2008. Lawrence et al. [9] in
the United States of America also found that the prevalence of pregestational diabetes more
than doubled between 1999 and 2005 from 0.11% to 0.55% equivalent to our findings.
The Confidential Enquiry into Maternal and Child Health (CEMACH) in England, Wales and
Northern Ireland reported prevalence of pregestational diabetes between 1 March 2002 and 28
February 2003 as part of a series of findings [8]. They found a prevalence of type 1 and type 2
diabetes of 2.7 per 1000 births and 1.0 per 1000 births respectively. Our findings are
comparable to CEMACH for the prevalence of type 1 diabetes in pregnancy in 2002; 3.7 per
1000 births, but higher for type 2 diabetes in pregnancy in 2002; 6.4 per 1000 births. The
CEMACH enquiry [8] found pregnant women with type 1 diabetes are different to pregnant
women with type 2 diabetes in terms of age, ethnicity and parity. They found pregnant women
with type 2 diabetes were older than women with type 1 diabetes; median age 33.5 years
compared to 30.0 years respectively. These results compare favourably to the finding
presented in this paper.
Page 12 of 20
For peer review only - http://bmjopen.bmj.com/site/about/guidelines.xhtml
BMJ Open
123456789101112131415161718192021222324252627282930313233343536373839404142434445464748495051525354555657585960
on 10 June 2018 by guest. Protected by copyright.
http://bmjopen.bm
j.com/
BM
J Open: first published as 10.1136/bm
jopen-2015-009494 on 25 January 2016. Dow
nloaded from
For peer review only
Strengths and Limitations
THIN is a large primary care database capturing real life data from primary care and this was a
significant strength of this study. However, THIN was not created for research purposes rather,
it is clinical data entry system.
Firstly, there is a large amount of missing data particularly for overweight and ethnicity
variables. For BMI there is 13%, 16% and 34% missing for pregnant women with type 1
diabetes, type 2 diabetes and without diabetes respectively. Whereas for ethnicity
approximately half of pregnant women have missing data across the three categories; 54%,
47% and 58% for women with type 1 diabetes, type 2 diabetes and without diabetes
respectively.
A potential limitation of this study is underestimation of diabetes. Firstly, we used diagnostic
Read codes, prescriptions and free text entered by GPs to confirm diabetes and we excluded
those with only one recording of diabetes and those receiving prescriptions for anti-diabetics
without a diagnostic code. Secondly, as many of half those with type 2 diabetes are
undiagnosed as symptoms of hyperglycaemia go undetected [20]. Thirdly, the algorithm used
to identify and classify women as type 1 or type 2 diabetic was specific, limiting any false
positive cases of diabetes. Lastly, our data is restricted to general practice attenders and
women with diabetes who receive their care privately or in specialist clinics would have been
missed, contributing to under reporting of prevalence. Despite these considerations, the study
reported higher than expected levels of diabetes then has previously been reported.
Clinical Implications
The increase in both type 1 diabetes and especially type 2 diabetes with a sharp rise in last few
years is of special concern to primary care doctors who have to be prepared to work more
closely with secondary care on timely management of this problem. There is an established link
Page 13 of 20
For peer review only - http://bmjopen.bmj.com/site/about/guidelines.xhtml
BMJ Open
123456789101112131415161718192021222324252627282930313233343536373839404142434445464748495051525354555657585960
on 10 June 2018 by guest. Protected by copyright.
http://bmjopen.bm
j.com/
BM
J Open: first published as 10.1136/bm
jopen-2015-009494 on 25 January 2016. Dow
nloaded from

For peer review only
between diabetes in pregnancy and adverse pregnancy outcomes, including congenital
anomalies, perinatal mortality, spontaneous abortion, and delivery by caesarean section [3,5].
The poorer glycaemic control of women with type 1 diabetes prior to pregnancy compared to
women with type 2 diabetes needs particular attention in terms of its risk to the pregnancy and
the baby.
It is known that two thirds of women with pregestational receive suboptimal preconception care
(8). With the high levels of problems in primary care, general practitioners can play a pivotal
role in delivering preconception care to reduce the risk of adverse outcomes [21–23]. This can
include both preventive management of all women with diabetes of child bearing age and more
specific management of diabetes during pregnancy. There is a growing need for the
development and evaluation of such interventions in primary care.
Acknowledgments
This study was supported by PhD studentship awarded to S.J.C by the School of Primary Care
Research. S.J.C analysed the data and S.J.C, I.P and I.N contributed to the writing of the
paper. The authors do not have any conflict of interests.
Parts of this work have been previously presented at the NIHR SPCR 2014 annual trainees
event at Oxford University.
Ethics Approval
The THIN Scheme was approved by the National Health Service South-East Multi-centre
Research Ethics Committee (MREC), and approval for this study was obtained from CMD
Medical Research’s Scientific Review Committee in March 2014.
Page 14 of 20
For peer review only - http://bmjopen.bmj.com/site/about/guidelines.xhtml
BMJ Open
123456789101112131415161718192021222324252627282930313233343536373839404142434445464748495051525354555657585960
on 10 June 2018 by guest. Protected by copyright.
http://bmjopen.bm
j.com/
BM
J Open: first published as 10.1136/bm
jopen-2015-009494 on 25 January 2016. Dow
nloaded from

For peer review only
Competing Interests
No, there are no competing interests
Contributorship Statement
S.J.C analysed the data and S.J.C, I.P and I.N contributed to the writing of the paper.
Data Sharing Statement
No unpublished data
References 1 Hotu S, Carter B, Watson P, et al. Increasing prevalence of type 2 diabetes in adolescents. J Paediatr
Child Health 2004;40:201–4. doi:10.1111/j.1440-1754.2004.00337.x
2 Department of Health. National Service Framework for Diabetes: Standards. 2001.
3 Bell R, Bailey K, Cresswell T, et al. Trends in prevalence and outcomes of pregnancy in women with
pre-existing type I and type II diabetes. BJOG Int J Obstet Gynaecol 2008;115:445–52.
doi:10.1111/j.1471-0528.2007.01644.x
4 Penney GC, Mair G, Pearson DWM, et al. Outcomes of pregnancies in women with type 1 diabetes
in Scotland: a national population-based study. BJOG Int J Obstet Gynaecol 2003;110:315–8.
5 Casson IF, Clarke CA, Howard CV, et al. Outcomes of pregnancy in insulin dependent diabetic
women: results of a five year population cohort study. Br Med J 1997;315:275–8.
6 Hawthorne G, Robson S, Ryall EA, et al. Prospective population based survey of outcome of
pregnancy in diabetic women: results of the Northern Diabetic Pregnancy Audit, 1994. Br Med J
1997;315:279–81. doi:10.1136/bmj.315.7103.279
7 Confidential Enquiry into Maternal and Child Health. Diabetes in Pregnancy: Are we providing the
best care? Findings of a National Enquiry: England, Wales and Northern Ireland. 2007.
8 Confidential Enquiry into Maternal and Child Health. Pregnancy in Women with Type 1 and Type 2
Diabetes in 2002-03, England, Wales and Northern Ireland. 2005.
9 Lawrence JM, Contreras R, Chen W, et al. Trends in the Prevalence of Preexisting Diabetes and
Gestational Diabetes Mellitus Among a Racially/Ethnically Diverse Population of Pregnant Women,
1999–2005. Diabetes Care 2008;31:899–904. doi:10.2337/dc07-2345
Page 15 of 20
For peer review only - http://bmjopen.bmj.com/site/about/guidelines.xhtml
BMJ Open
123456789101112131415161718192021222324252627282930313233343536373839404142434445464748495051525354555657585960
on 10 June 2018 by guest. Protected by copyright.
http://bmjopen.bm
j.com/
BM
J Open: first published as 10.1136/bm
jopen-2015-009494 on 25 January 2016. Dow
nloaded from

For peer review only
10 http://csdmruk.cegedim.com/. http://www.csdmruk.imshealth.com/
11 Booth N. What are the Read Codes? Health Libr Rev 1994;11:177–82. doi:10.1046/j.1365-
2532.1994.1130177.x
12 Blak BT, Thompson M, Dattani H, et al. Generalisability of The Health Improvement Network (THIN)
database: demographics, chronic disease prevalence and mortality rates. Inform Prim Care
2011;19:251–5.
13 Lis Y, Mann RD. The VAMP research multi-purpose database in the U.K. J Clin Epidemiol
1995;48:431–43. doi:10.1016/0895-4356(94)00137-F
14 Horsfall L, Walters K, Petersen I. Identifying periods of acceptable computer usage in primary care
research databases. Pharmacoepidemiol Drug Saf 2013;22:64–9. doi:10.1002/pds.3368
15 Maguire A, Blak B, Thompson M. The importance of defining periods of complete mortality
reporting using automated data from primary care. Pharmacoepidemiol Drug Saf 2009;18:76–83.
doi:10.1002/pds.1688
16 Townsend P. Deprivation. J Soc Policy 1987;16:125–46. doi:10.1017/S0047279400020341
17 Murphy N, Bulkow L, Schraer C, et al. Prevalence of Diabetes Mellitus in Pregnancy Among Yup’ik
Eskimos, 1987-1988. Diabetes Care 1993;16:315–7. doi:10.2337/diacare.16.1.315
18 Murphy NJ, Bulkow LR, Schraer CD, et al. Prevalence of diabetes mellitus in pregnancy among Yup’ik
Eskimos and Alaska Coastal Indians, 1987-1988. Arctic Med Res 1991;Suppl:423–6.
19 Lopez de Andres A, Jimenez-Garcia R, Carrasco-Garrido P. Trends in pregestational diabetes among
women delivering in Spain, 2001-2008. Int J Gynecol Obstet 2012;117:182–3.
doi:10.1016/j.ijgo.2011.12.006
20 Harris MI. Undiagnosed NIDDM: Clinical and Public Health Issues. Diabetes Care 1993;16:642–52.
doi:10.2337/diacare.16.4.642
21 Temple RC, Aldridge VJ, Murphy HR. Prepregnancy Care and Pregnancy Outcomes in Women With
Type 1 Diabetes. Diabetes Care 2006;29:1744–9. doi:10.2337/dc05-2265
22 Wahabi HA, Alzeidan RA, Bawazeer GA, et al. Preconception care for diabetic women for improving
maternal and fetal outcomes: a systematic review and meta-analysis. Bmc Pregnancy Childbirth
2010;10:63. doi:10.1186/1471-2393-10-63
23 Ray JG, O’brien TE, Chan WS. Preconception care and the risk of congenital anomalies in the
offspring of women with diabetes mellitus: a meta‐analysis. QJM Int J Med 2001;94:435–44.
doi:10.1093/qjmed/94.8.435
Page 16 of 20
For peer review only - http://bmjopen.bmj.com/site/about/guidelines.xhtml
BMJ Open
123456789101112131415161718192021222324252627282930313233343536373839404142434445464748495051525354555657585960
on 10 June 2018 by guest. Protected by copyright.
http://bmjopen.bm
j.com/
BM
J Open: first published as 10.1136/bm
jopen-2015-009494 on 25 January 2016. Dow
nloaded from

For peer review only
Figure legends
Figure 1: Prevalence of pregestational diabetes mellitus in pregnancy by year and diabetes type
Page 17 of 20
For peer review only - http://bmjopen.bmj.com/site/about/guidelines.xhtml
BMJ Open
123456789101112131415161718192021222324252627282930313233343536373839404142434445464748495051525354555657585960
on 10 June 2018 by guest. Protected by copyright.
http://bmjopen.bm
j.com/
BM
J Open: first published as 10.1136/bm
jopen-2015-009494 on 25 January 2016. Dow
nloaded from

For peer review only
Figure 1: Prevalence of pregestational diabetes mellitus in pregnancy by year and diabetes type 886x649mm (96 x 96 DPI)
Page 18 of 20
For peer review only - http://bmjopen.bmj.com/site/about/guidelines.xhtml
BMJ Open
123456789101112131415161718192021222324252627282930313233343536373839404142434445464748495051525354555657585960
on 10 June 2018 by guest. Protected by copyright.
http://bmjopen.bm
j.com/
BM
J Open: first published as 10.1136/bm
jopen-2015-009494 on 25 January 2016. Dow
nloaded from

For peer review only
STROBE 2007 (v4) Statement—Checklist of items that should be included in reports of cohort studies
Section/Topic Item
# Recommendation Reported on page #
Title and abstract 1 (a) Indicate the study’s design with a commonly used term in the title or the abstract 1
(b) Provide in the abstract an informative and balanced summary of what was done and what was found 2
Introduction
Background/rationale 2 Explain the scientific background and rationale for the investigation being reported 4
Objectives 3 State specific objectives, including any prespecified hypotheses 4
Methods
Study design 4 Present key elements of study design early in the paper 5/6
Setting 5 Describe the setting, locations, and relevant dates, including periods of recruitment, exposure, follow-up, and data
collection
5/6
Participants 6 (a) Give the eligibility criteria, and the sources and methods of selection of participants. Describe methods of follow-up 5
(b) For matched studies, give matching criteria and number of exposed and unexposed N/A
Variables 7 Clearly define all outcomes, exposures, predictors, potential confounders, and effect modifiers. Give diagnostic criteria, if
applicable
5-7
Data sources/
measurement
8* For each variable of interest, give sources of data and details of methods of assessment (measurement). Describe
comparability of assessment methods if there is more than one group
6
Bias 9 Describe any efforts to address potential sources of bias
Study size 10 Explain how the study size was arrived at 6
Quantitative variables 11 Explain how quantitative variables were handled in the analyses. If applicable, describe which groupings were chosen and
why
7
Statistical methods 12 (a) Describe all statistical methods, including those used to control for confounding N/A
(b) Describe any methods used to examine subgroups and interactions N/A
(c) Explain how missing data were addressed 7
(d) If applicable, explain how loss to follow-up was addressed N/A
(e) Describe any sensitivity analyses N/A
Results
Page 19 of 20
For peer review only - http://bmjopen.bmj.com/site/about/guidelines.xhtml
BMJ Open
123456789101112131415161718192021222324252627282930313233343536373839404142434445464748495051525354555657585960
on 10 June 2018 by guest. Protected by copyright. http://bmjopen.bmj.com/ BMJ Open: first published as 10.1136/bmjopen-2015-009494 on 25 January 2016. Downloaded from

For peer review only
Participants 13* (a) Report numbers of individuals at each stage of study—eg numbers potentially eligible, examined for eligibility, confirmed
eligible, included in the study, completing follow-up, and analysed
7
(b) Give reasons for non-participation at each stage 7
(c) Consider use of a flow diagram
Descriptive data 14* (a) Give characteristics of study participants (eg demographic, clinical, social) and information on exposures and potential
confounders
8 (table 1)
(b) Indicate number of participants with missing data for each variable of interest 8 (table 1)
(c) Summarise follow-up time (eg, average and total amount) Follow is 9 months
for everyone
(pregnant women)
Outcome data 15* Report numbers of outcome events or summary measures over time 7
Main results 16 (a) Give unadjusted estimates and, if applicable, confounder-adjusted estimates and their precision (eg, 95% confidence
interval). Make clear which confounders were adjusted for and why they were included
9 (figure 1)
(b) Report category boundaries when continuous variables were categorized 6
(c) If relevant, consider translating estimates of relative risk into absolute risk for a meaningful time period N/A
Other analyses 17 Report other analyses done—eg analyses of subgroups and interactions, and sensitivity analyses N/A
Discussion
Key results 18 Summarise key results with reference to study objectives 9
Limitations
Interpretation 20 Give a cautious overall interpretation of results considering objectives, limitations, multiplicity of analyses, results from
similar studies, and other relevant evidence
9-11
Generalisability 21 Discuss the generalisability (external validity) of the study results 10
Other information
Funding 22 Give the source of funding and the role of the funders for the present study and, if applicable, for the original study on
which the present article is based
12
*Give information separately for cases and controls in case-control studies and, if applicable, for exposed and unexposed groups in cohort and cross-sectional studies.
Note: An Explanation and Elaboration article discusses each checklist item and gives methodological background and published examples of transparent reporting. The STROBE
checklist is best used in conjunction with this article (freely available on the Web sites of PLoS Medicine at http://www.plosmedicine.org/, Annals of Internal Medicine at
http://www.annals.org/, and Epidemiology at http://www.epidem.com/). Information on the STROBE Initiative is available at www.strobe-statement.org.
Page 20 of 20
For peer review only - http://bmjopen.bmj.com/site/about/guidelines.xhtml
BMJ Open
123456789101112131415161718192021222324252627282930313233343536373839404142434445464748495051525354555657585960
on 10 June 2018 by guest. Protected by copyright. http://bmjopen.bmj.com/ BMJ Open: first published as 10.1136/bmjopen-2015-009494 on 25 January 2016. Downloaded from

For peer review only
A cohort study of trends in the prevalence of pregestational diabetes in pregnancy recorded in United Kingdom general
practice between 1995 and 2012
Journal: BMJ Open
Manuscript ID bmjopen-2015-009494.R1
Article Type: Research
Date Submitted by the Author: 12-Nov-2015
Complete List of Authors: Coton, Sonia; University College London, Primary Care and Population Health Nazareth, Irwin; University College London, Primary Care and Population
Health Petersen, Irene; University College London, Primary Care and Population Health
<b>Primary Subject Heading</b>:
Diabetes and endocrinology
Secondary Subject Heading: Epidemiology, General practice / Family practice, Obstetrics and gynaecology
Keywords: DIABETES & ENDOCRINOLOGY, Diabetes in pregnancy < DIABETES & ENDOCRINOLOGY, EPIDEMIOLOGY, PRIMARY CARE
For peer review only - http://bmjopen.bmj.com/site/about/guidelines.xhtml
BMJ Open on 10 June 2018 by guest. P
rotected by copyright.http://bm
jopen.bmj.com
/B
MJ O
pen: first published as 10.1136/bmjopen-2015-009494 on 25 January 2016. D
ownloaded from

For peer review only
Title page
Full title:
A cohort study of trends in the prevalence of pregestational diabetes in pregnancy
recorded in United Kingdom general practice between 1995 and 2012
Authors:
Ms Sonia J Coton MSc1
Professor Irwin Nazareth1
Dr Irene Petersen1
1 University College London, Research Department of Primary Care and Population
Health, Rowland Hill Street, London, NW3 2PF, United Kingdom
Corresponding author:
Sonia Coton,
University College London, Research Department of Primary Care and Population
Health, Rowland Hill Street, London, NW3 2PF, United Kingdom
Word count: 2979
Key words:
Diabetes mellitus; Pregnancy; Electronic health records; Prevalence; Epidemiology
Page 1 of 22
For peer review only - http://bmjopen.bmj.com/site/about/guidelines.xhtml
BMJ Open
123456789101112131415161718192021222324252627282930313233343536373839404142434445464748495051525354555657585960
on 10 June 2018 by guest. Protected by copyright.
http://bmjopen.bm
j.com/
BM
J Open: first published as 10.1136/bm
jopen-2015-009494 on 25 January 2016. Dow
nloaded from

For peer review only
Abstract
Objective To describe the characteristics of pregnant women with and without pregestational
diabetes and to estimate the prevalence of pregestational diabetes in pregnant women recorded
in a United Kingdom primary care database.
Methods The data source for this study is The Health Improvement Network (THIN) primary
care database. Pregnant women with and without diabetes aged 16 years and over were
identified using diagnostic Read codes and prescriptions for anti-diabetics from medical records
. Data were examined on: age, body mass index, social deprivation, smoking, ethnicity and
glycaemic control. The prevalence of pregestational diabetes was calculated by diabetes type
and calendar year between 1995 and 2012.
Results Data from 400,434 pregnancies suggests that women with pregestational diabetes
were: older (median: 29, 32 vs 29 years for type 1, type 2 and without diabetes), had higher BMI
(median: 25.0, 30.4 vs 23.9k/m2 for type 1, type 2 and without diabetes) and were registered
with a general practice for longer than pregnant women without diabetes.
The prevalence of type 1 diabetes in pregnancy increased from 1.56 to 4.09 per 1000
pregnancies between 1995 and 2015. For type 2 diabetes the increase was from 2.34 to 5.09
per 1000 pregnancies between 1995 and 2008 followed by a more rapid increase to 10.62 per
1000 pregnancies by 2012
Conclusions Pregnant women with pregestational diabetes were older, had higher BMI and
were registered for longer than women without diabetes. The prevalence of both type 1 and type
2 diabetes increased in pregnancy. The prevalence of type 2 diabetes rose more rapidly with a
marked increase after 2008.
Page 2 of 22
For peer review only - http://bmjopen.bmj.com/site/about/guidelines.xhtml
BMJ Open
123456789101112131415161718192021222324252627282930313233343536373839404142434445464748495051525354555657585960
on 10 June 2018 by guest. Protected by copyright.
http://bmjopen.bm
j.com/
BM
J Open: first published as 10.1136/bm
jopen-2015-009494 on 25 January 2016. Dow
nloaded from

For peer review only
Article Summary
Strengths and limitations of this study
• This study is one of the most comprehensive studies of the prevalence of pregestational
diabetes in pregnancy, based on electronic health records in the UK
• The data source for this study was a large primary care database that is representative
of the UK population with over 3 million active patients
• The study only captures individuals who have been diagnosed with diabetes in primary
care as the primary reason for data collection is patient care and management not
research
Page 3 of 22
For peer review only - http://bmjopen.bmj.com/site/about/guidelines.xhtml
BMJ Open
123456789101112131415161718192021222324252627282930313233343536373839404142434445464748495051525354555657585960
on 10 June 2018 by guest. Protected by copyright.
http://bmjopen.bm
j.com/
BM
J Open: first published as 10.1136/bm
jopen-2015-009494 on 25 January 2016. Dow
nloaded from

For peer review only
Introduction
Diabetes mellitus is a chronic metabolic disease caused by a decrease in the production of
insulin or sensitivity to insulin. Type 1 diabetes is caused by the destruction of insulin producing
cells in the pancreas and is most commonly diagnosed in childhood. Type 2 diabetes is caused
by cells insensitivity to insulin and insufficient production of insulin. Type 2 diabetes is more
common among adults, although it is becoming increasingly prevalent in adolescents [1].
Pregestational diabetes is one of the commonest chronic conditions affecting pregnancy; in the
UK one in every 250 pregnancies is complicated by pregestational diabetes [2]. And the
prevalence is increasing, in the UK the prevalence of pregestational diabetes increased from 3.1
to 4.7 per 1000 births between 1996-98 and 2002-04 [3].
Diabetes in pregnancy is associated with increased risk of pregnancy complications and
adverse birth outcomes. Pregnancies affected by diabetes in pregnancy are at an increased risk
of spontaneous abortion, caesarean section, congenital anomalies and perinatal mortality [3–7].
The current literature on the prevalence of diabetes in pregnancy is based on regional or
national samples selected from hospitals, maternity units or small community based samples
[3,8,9]. We used data from UK primary care records dating back to the 1990s.
The aims of this study were to examine characteristics of pregnant women with and without
pregestational diabetes, and to investigate the time trend in the prevalence of pregestational
diabetes in pregnancy using data from a large primary care database.
Page 4 of 22
For peer review only - http://bmjopen.bmj.com/site/about/guidelines.xhtml
BMJ Open
123456789101112131415161718192021222324252627282930313233343536373839404142434445464748495051525354555657585960
on 10 June 2018 by guest. Protected by copyright.
http://bmjopen.bm
j.com/
BM
J Open: first published as 10.1136/bm
jopen-2015-009494 on 25 January 2016. Dow
nloaded from

For peer review only
Methods
Data Source:
For this study we used The Health improvement Network primary care database, which contains
longitudinal anonymised electronic primary care records from 587 general practices, covering
approximately 6% of the UK population [10]. The database contains information on: diagnoses,
symptoms, prescriptions, referrals, laboratory tests, basic demographics and social deprivation
(recorded by Townsend score). Diagnoses and symptoms are recorded during consultations by
practice staff using Read codes, a hierarchical coding system used in UK primary care [11].
In the UK 98% of the population is registered with a general practitioner (family physician) [12]
and this is reflected by THIN being broadly representative of the UK population in terms of
patient demographics, chronic disease prevalence and death rates [13]. Practices in the THIN
primary care database are located in all nations of the UK, with a slight over-representation of
the South of England [13].
Study Population:
We identified pregnant women aged 16 years and over, who were registered with a general
practice in THIN and delivered a baby between January 1st 1995 and December 31st 2012. Two
data quality measures developed for use within THIN were applied to the data. These data
quality measures were; acceptable computer usage (ACU) date and acceptable mortality rate
(AMR) date [14,15]. [14][15] ACU is defined as the practice recording on average at least two
drug prescriptions and two medical records per patient per year, indicating the practice is using
their computing system fully for data recording. AMR date is when the practice has comparable
mortality rates to the rest of the UK, in accordance with practice size and demography.
Pregnancies were included after the later of each practice specific ACU date and AMR date
criteria. Using data after these dates improves the quality.
Page 5 of 22
For peer review only - http://bmjopen.bmj.com/site/about/guidelines.xhtml
BMJ Open
123456789101112131415161718192021222324252627282930313233343536373839404142434445464748495051525354555657585960
on 10 June 2018 by guest. Protected by copyright.
http://bmjopen.bm
j.com/
BM
J Open: first published as 10.1136/bm
jopen-2015-009494 on 25 January 2016. Dow
nloaded from
For peer review only
Pregnant women with pregestational diabetes were identified through diagnoses and
prescriptions in their electronic health records. Women that only had one diagnostic code for
diabetes or, prescription records alone without a diabetic specific diagnostic code were
excluded from the study as we were not certain of their diabetic status. Women with a first
record of diabetes dated after the start of pregnancy were also excluded so that we could be
certain we were studying diabetes types 1 and 2, and not gestational diabetes.
We generated an algorithm for classifying diabetes type using different combinations of four
variables. The algorithm was discussed in a panel including clinicians. The four variables are:
(1) whether a woman had a type specific diagnostic code; (2) the prescription records; (3) age at
first record of diabetes and (4) whether the woman was diagnosed with diabetes prior to
entering the practice. The type specific diagnostic Read code was given the most weight in the
type classification algorithm; if a woman had a non-conflicting type specific Read code then they
were initially classified as having that type of diabetes. Prescriptions were then looked at and if
a woman had received long term oral antidiabetics prescriptions with or without insulin, any oral
antidiabetics without insulin, or no prescriptions they were classified as having type 2 diabetes.
Lastly, for women that had conflicting or no type specific diagnostic Read codes we considered
prescriptions along with age at diagnosis and whether the women were diagnosed prior to
registration. In general if a woman had prescriptions for insulin with or without short term oral
antidiabetics, was less than 35 years old at diagnosis or older than 35 years and diagnosed
after registering with a practice they were classified as having type 1 diabetes, and type 2
diabetes otherwise.
After applying the classification algorithm, if there were women still unclassified then a manual
review of their entire medical records was undertaken.
Page 6 of 22
For peer review only - http://bmjopen.bmj.com/site/about/guidelines.xhtml
BMJ Open
123456789101112131415161718192021222324252627282930313233343536373839404142434445464748495051525354555657585960
on 10 June 2018 by guest. Protected by copyright.
http://bmjopen.bm
j.com/
BM
J Open: first published as 10.1136/bm
jopen-2015-009494 on 25 January 2016. Dow
nloaded from

For peer review only
Maternal Characteristics:
We compared pregnant women with and without diabetes in terms of: age; body mass index
(BMI) prior to pregnancy; smoking (coded as non, former or current); Townsend score (coded
as 1 least deprived to 5 most deprived); ethnicity (coded as white, black, asian, mixed or other);
blood pressure; and HbA1c levels prior to pregnancy. We also created a binary variable
indicating whether a women was overweight or not; women were classified as being overweight
if their BMI≥25kg/m2. All characteristics, apart from maternal age, ethnicity and Townsend
score, were captured during the 12 months prior to pregnancy. The record nearest to the start
of each pregnancy was taken. Any record of ethnicity prior to pregnancy was selected and the
Townsend score for deprivation quintile nearest to the index pregnancy was taken. Maternal
age was defined as age at the start of pregnancy.
Townsend score [16], is a composite index score of owner-occupation, car ownership,
overcrowding and unemployment based on a patient’s postcode and information from the 2001
census data linked to each patients’ postcode.
Statistical Methods:
Characteristics of pregnant women with and without diabetes were compared using median and
the inter-quartile range (IQR) for continuous variables or number and percent for categorical
variables calculated for by diabetes type and women without diabetes separately. For women
with multiple eligible pregnancies recorded a single pregnancy was selected randomly.
We calculated the prevalence of pregestational diabetes by calendar year of delivery and
diabetes type for the years 1995 to 2012 inclusive. For women with multiple eligible
pregnancies recorded all pregnancies were included in the prevalence calculations.
All analyses were performed using Stata version 13 (StataCorp, College Station, TX USA)
Page 7 of 22
For peer review only - http://bmjopen.bmj.com/site/about/guidelines.xhtml
BMJ Open
123456789101112131415161718192021222324252627282930313233343536373839404142434445464748495051525354555657585960
on 10 June 2018 by guest. Protected by copyright.
http://bmjopen.bm
j.com/
BM
J Open: first published as 10.1136/bm
jopen-2015-009494 on 25 January 2016. Dow
nloaded from

For peer review only
Results
We identified 503,952 pregnancies in THIN between 1st January 1995 and 31st December 2012.
We removed 95,578 pregnancies as they occurred prior to the practice specific AMR and ACU
date and 1,747 pregnancies as they occurred before the mother was 16 years of age. A further
6,193 pregnancies were removed because we could not confirm the diabetic status of the
mother before the pregnancy began. The final cohort consistent of 400,434 pregnancies to
301,794 women recorded in THIN, see Figure 1 for the cohort development flow diagram. The
majority of women had a single pregnancy (55%) and only 2% of women had four or more
pregnancies.
Page 8 of 22
For peer review only - http://bmjopen.bmj.com/site/about/guidelines.xhtml
BMJ Open
123456789101112131415161718192021222324252627282930313233343536373839404142434445464748495051525354555657585960
on 10 June 2018 by guest. Protected by copyright.
http://bmjopen.bm
j.com/
BM
J Open: first published as 10.1136/bm
jopen-2015-009494 on 25 January 2016. Dow
nloaded from
For peer review only
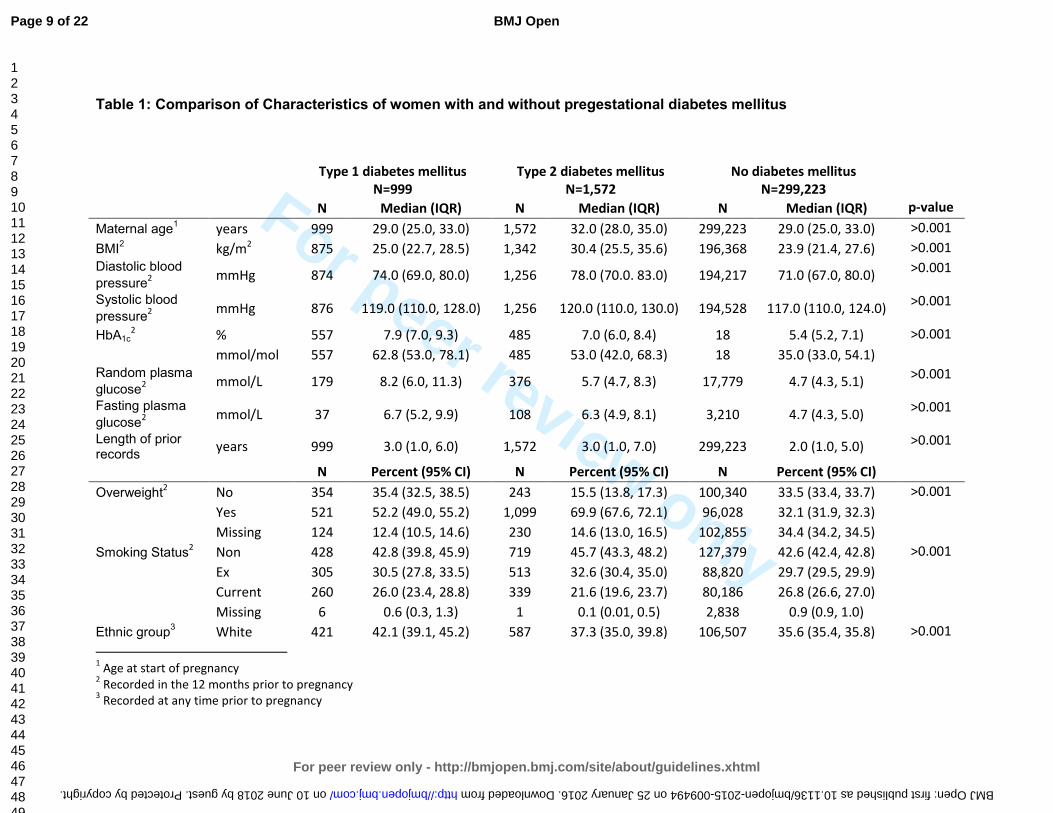
Table 1: Comparison of Characteristics of women with and without pregestational diabetes mellitus
Type 1 diabetes mellitus
N=999
Type 2 diabetes mellitus
N=1,572
No diabetes mellitus
N=299,223
N Median (IQR) N Median (IQR) N Median (IQR) p-value
Maternal age1 years 999 29.0 (25.0, 33.0) 1,572 32.0 (28.0, 35.0) 299,223 29.0 (25.0, 33.0) >0.001
BMI2 kg/m
2 875 25.0 (22.7, 28.5) 1,342 30.4 (25.5, 35.6) 196,368 23.9 (21.4, 27.6) >0.001
Diastolic blood
pressure2
mmHg 874 74.0 (69.0, 80.0) 1,256 78.0 (70.0. 83.0) 194,217 71.0 (67.0, 80.0) >0.001
Systolic blood
pressure2
mmHg 876 119.0 (110.0, 128.0) 1,256 120.0 (110.0, 130.0) 194,528 117.0 (110.0, 124.0) >0.001
HbA1c2 % 557 7.9 (7.0, 9.3) 485 7.0 (6.0, 8.4) 18 5.4 (5.2, 7.1) >0.001
mmol/mol 557 62.8 (53.0, 78.1) 485 53.0 (42.0, 68.3) 18 35.0 (33.0, 54.1)
Random plasma
glucose2
mmol/L 179 8.2 (6.0, 11.3) 376 5.7 (4.7, 8.3) 17,779 4.7 (4.3, 5.1) >0.001
Fasting plasma
glucose2
mmol/L 37 6.7 (5.2, 9.9) 108 6.3 (4.9, 8.1) 3,210 4.7 (4.3, 5.0) >0.001
Length of prior records
years 999 3.0 (1.0, 6.0) 1,572 3.0 (1.0, 7.0) 299,223 2.0 (1.0, 5.0) >0.001
N Percent (95% CI) N Percent (95% CI) N Percent (95% CI)
Overweight2 No 354 35.4 (32.5, 38.5) 243 15.5 (13.8, 17.3) 100,340 33.5 (33.4, 33.7) >0.001
Yes 521 52.2 (49.0, 55.2) 1,099 69.9 (67.6, 72.1) 96,028 32.1 (31.9, 32.3)
Missing 124 12.4 (10.5, 14.6) 230 14.6 (13.0, 16.5) 102,855 34.4 (34.2, 34.5)
Smoking Status2 Non 428 42.8 (39.8, 45.9) 719 45.7 (43.3, 48.2) 127,379 42.6 (42.4, 42.8) >0.001
Ex 305 30.5 (27.8, 33.5) 513 32.6 (30.4, 35.0) 88,820 29.7 (29.5, 29.9)
Current 260 26.0 (23.4, 28.8) 339 21.6 (19.6, 23.7) 80,186 26.8 (26.6, 27.0)
Missing 6 0.6 (0.3, 1.3) 1 0.1 (0.01, 0.5) 2,838 0.9 (0.9, 1.0)
Ethnic group3 White 421 42.1 (39.1, 45.2) 587 37.3 (35.0, 39.8) 106,507 35.6 (35.4, 35.8) >0.001
1 Age at start of pregnancy
2 Recorded in the 12 months prior to pregnancy
3 Recorded at any time prior to pregnancy
Page 9 of 22
For peer review only - http://bmjopen.bmj.com/site/about/guidelines.xhtml
BMJ Open
123456789101112131415161718192021222324252627282930313233343536373839404142434445464748495051525354555657585960
on 10 June 2018 by guest. Protected by copyright. http://bmjopen.bmj.com/ BMJ Open: first published as 10.1136/bmjopen-2015-009494 on 25 January 2016. Downloaded from

For peer review only
Mixed 5 0.5 (0.2, 1.2) 12 0.8 (0.4, 1.3) 1,234 0.4 (0.4, 0.4)
Black 7 0.7 (0.3, 1.5) 56 3.6 (2.8, 4.6) 4,725 1.6 (1.5, 1.6)
Asian 17 1.7 (1.1, 2.7) 138 8.8 (7.5, 10.3) 9,248 3.1 (3.0, 3.2)
Other 9 0.9 (0.5, 1.7) 26 1.7 (1.1, 2.4) 3,369 1.1 (1.1, 1.2)
Missing 540 54.1 (51.0, 57.1) 753 47.9 (45.4, 50.4) 174,140 58.2 (58.0, 58.4)
Townsend quintile
4
1 223 22.3 (19.8, 25.0) 251 16.0 (14.2, 17.9) 65,220 21.6 (21.6, 21.9) >0.001
2 195 19.1 (17.2, 22.1) 263 16.7 (15.0, 18.7) 55,909 18.6 (18.5, 18.8)
3 200 20.0 (17.6, 22.6) 341 21.7 (19.7, 23.8) 60,7815 20.3 (20.2, 20.5)
4 195 19.5 (17.2, 22.1) 344 21.9 (19.9, 24.0) 58,600 19.6 (19.4, 19.7)
5 143 14.3 (12.3, 16.6) 280 17.8 (16.0, 19.8) 44,303 14.8 (14.7, 14.9)
Missing 43 4.3 (3.2, 5.6) 93 5.9 (4.9, 7.2) 14,376 4.8 (4.7, 4.9)
4 Record nearest to the start of the pregnancy was taken
Page 10 of 22
For peer review only - http://bmjopen.bmj.com/site/about/guidelines.xhtml
BMJ Open
123456789101112131415161718192021222324252627282930313233343536373839404142434445464748495051525354555657585960
on 10 June 2018 by guest. Protected by copyright. http://bmjopen.bmj.com/ BMJ Open: first published as 10.1136/bmjopen-2015-009494 on 25 January 2016. Downloaded from

For peer review only
Pregestational diabetes affected 1% of pregnancies from the total cohort: 0.3% (1,303/400,434)
with type 1 diabetes and 0.5% (2,074/400,434) with type 2 diabetes.
For women with more than one pregnancy, a single pregnancy was randomly selected for
comparison between women with and without diabetes. Pregestational diabetes affected 0.85%
of this partial cohort: 0.3% (999/301,794) with type 1 diabetes and 0.5% (1572/301,794) with
type 2 diabetes (Table 1).
Pregnant women with pregestational diabetes were: older, had higher BMI, were more likely to
be overweight, were less likely to smoke and were registered with a general practice for longer
prior to pregnancy when compared to pregnant women without diabetes. The median age was
29 years, 32 years and 29 years for pregnant women with type 1 diabetes, type 2 diabetes and
without diabetes respectively. The median BMI was 25.0kg/m2, 30.4kg/m2 and 23.9kg/m2 for
pregnant women with type 1 diabetes, type 2 diabetes and without diabetes respectively.
Seventy percent of pregnant women with type 2 diabetes were overweight compared with 52%
of pregnant women with type 1 diabetes and 32% of pregnant women without diabetes. The
median length of registration prior to pregnancy was 3 years for pregnant women with both type
1 and type 2 and 2 years for pregnant women without diabetes (Table 1).
Pregnant women with type 1 diabetes had higher blood glucose concentrations when compared
to pregnant women with type 2 diabetes. Median HbA1c concentrations prior to pregnancy were
62.8mmol/mol (7.9%) for women with type 1 diabetes compared to 53.0mmol/mol (7.0%) for
women with type 2 diabetes (Table 1). Pregnant women with type 1 diabetes were also more
likely to have blood glucose control tested prior to pregnancy when compared to pregnant
women with type 2 diabetes; 56% vs 31% for HbA1c, 18% vs 24% for random plasma glucose
and 4% vs 7% for fasting plasma glucose.
Page 11 of 22
For peer review only - http://bmjopen.bmj.com/site/about/guidelines.xhtml
BMJ Open
123456789101112131415161718192021222324252627282930313233343536373839404142434445464748495051525354555657585960
on 10 June 2018 by guest. Protected by copyright.
http://bmjopen.bm
j.com/
BM
J Open: first published as 10.1136/bm
jopen-2015-009494 on 25 January 2016. Dow
nloaded from

For peer review only
Pregnant women with type 2 diabetes were more likely to be non-smokers or ex-smokers, and
were more socially deprived than pregnant women with type 1 diabetes (Table 1). Forty six
percent of pregnant women with type 2 diabetes were non-smokers, and 33% were ex-smokers
at the start of their pregnancy compared to 43% and 31% of pregnant women with type 1
diabetes. Eighteen percent of pregnant women with type 2 diabetes were in the most socially
deprived Townsend quintile compared to 14% of pregnant women with type 1 diabetes (Table
1). Diastolic and systolic blood pressure and ethnicity were similar across the three groups,
although approximately half of the women did not have their ethnicity recorded.
The prevalence of pregestational type 1 diabetes and type 2 diabetes in pregnancy increased
over the study period (Figure 2). The prevalence of type 1 diabetes in pregnancy increased
from 1.56to 4.09 per 1000 pregnancies between 1995 and 2012, a 162% increase over 17
years. The prevalence of type 2 diabetes in pregnancy increased from 2.34to5.09 per 1000
pregnancies between 1995 and 2008. After 2008 the prevalence of type 2 diabetes in
pregnancy increased more rapidly from 6.74 to 10.62 per 1000 pregnancies between 2009 and
2012 (Figure 2). Over the study period, the prevalence of type 2 diabetes in pregnancy
increased by 354%.
Discussion
Summary of Main Findings
Women with pregestational diabetes were: older, had higher BMI, were more likely to be
overweight, and were registered with a general practice longer prior to pregnancy when
compared to pregnant women without pregestational diabetes. The prevalence of type 1 and
type 2 diabetes in pregnancy increased between 1995 and 2012 with a sharper rise in type 2
diabetes, in particular in the last 5 years of the study period.
Page 12 of 22
For peer review only - http://bmjopen.bmj.com/site/about/guidelines.xhtml
BMJ Open
123456789101112131415161718192021222324252627282930313233343536373839404142434445464748495051525354555657585960
on 10 June 2018 by guest. Protected by copyright.
http://bmjopen.bm
j.com/
BM
J Open: first published as 10.1136/bm
jopen-2015-009494 on 25 January 2016. Dow
nloaded from

For peer review only
Comparison with Existing Literature
There are few studies with the primary objective to investigate the prevalence of pregestational
diabetes in pregnancy[3,9,17,18] [3,9,17–22], of these studies only one is based in the UK [3].
Bell et al [3] studied the trends in prevalence of pregestational diabetes in pregnancy in
maternity units in the North of England between 1996 and 2004, and found comparable
prevalence of type 1 diabetes but much lower prevalence of type 2 diabetes than our study. In
2002-04 they found a prevalence of 3.5 per 1000 births of type 1 and 1.2 per 1000 birth of type
2 diabetes. Of the non-UK based studies López de Andrés et al. [21] found in Spain that the
prevalence of pregestational diabetes increased from 0.2% in 2001 to 0.27% in 2008.
Lawrence et al. [9] in the United States of America also found that the prevalence of
pregestational diabetes more than doubled between 1999 and 2005 from 0.11% to 0.55%
equivalent to our findings. Bardenheier et al [19] used state inpatient databases for 19 US states
and found pregestational diabetes increased from 0.65 per 100 deliveries to 0.89 per 100
deliveries between 2000 and 2010. The prevalence is comparable to our study in 2000 but the
prevalence in the US did not increase as rapidly. Feig et al (22) a more recent study using
administrative health claims data for Ontario, Canada found that the prevalence of
pregestational diabetes increased from 0.7% in 1996 to 1.5% in 2010, which are comparable to
our findings for the same years: 0.3% in 1996 to 1.2% in 2010.
The Confidential Enquiry into Maternal and Child Health (CEMACH) in England, Wales and
Northern Ireland reported prevalence of pregestational diabetes between 1 March 2002 and 28
February 2003 as part of a series of findings [8]. They found a prevalence of type 1 and type 2
diabetes of 2.7 per 1000 births and 1.0 per 1000 births respectively. Our findings are
comparable to CEMACH for the prevalence of type 1 diabetes in pregnancy in 2002 but higher
for type 2 diabetes in pregnancy in 2002. The CEMACH enquiry [8] found pregnant women with
type 1 diabetes are different to pregnant women with type 2 diabetes in terms of age, ethnicity
Page 13 of 22
For peer review only - http://bmjopen.bmj.com/site/about/guidelines.xhtml
BMJ Open
123456789101112131415161718192021222324252627282930313233343536373839404142434445464748495051525354555657585960
on 10 June 2018 by guest. Protected by copyright.
http://bmjopen.bm
j.com/
BM
J Open: first published as 10.1136/bm
jopen-2015-009494 on 25 January 2016. Dow
nloaded from

For peer review only
and parity. They found pregnant women with type 2 diabetes were older than women with type
1 diabetes; median age 33.5 years compared to 30.0 years respectively. These results
compare favourably to the findings presented in this paper.
Globally there has been an increase in the prevalence of type 2 diabetes among women of child
bearing age. There have been a number of reviews on the prevalence of type 2 diabetes in
pregnancy [23–25]. Lappolla et al. (24) reported type 2 diabetes affecting between 3.2% and
70% of pregnancies globally compared to our finding of 52% across the study period.
Strengths and Limitations
THIN is a large primary care database capturing real life data from primary care and this was a
significant strength of this study. However, THIN was not created for research purposes rather,
it is clinical data entry system.
Firstly, there is a large amount of missing data particularly for overweight and ethnicity
variables. For BMI there is 13%, 16% and 34% missing for pregnant women with type 1
diabetes, type 2 diabetes and without diabetes respectively. Whereas for ethnicity
approximately half of pregnant women have missing data across the three categories; 54%,
47% and 58% for women with type 1 diabetes, type 2 diabetes and without diabetes
respectively.
A potential limitation of this study is underestimation of diabetes. Firstly, we used diagnostic
Read codes, prescriptions and free text entered by GPs to confirm diabetes and we excluded
those with only one recording of diabetes and those receiving prescriptions for anti-diabetics
without a diagnostic code. Secondly, as many of half those with type 2 diabetes are
undiagnosed as symptoms of hyperglycaemia go undetected [26]. Thirdly, the algorithm used
to identify and classify women as type 1 or type 2 diabetic was specific, limiting any false
positive cases of diabetes. Lastly, our data is restricted to general practice attenders and
Page 14 of 22
For peer review only - http://bmjopen.bmj.com/site/about/guidelines.xhtml
BMJ Open
123456789101112131415161718192021222324252627282930313233343536373839404142434445464748495051525354555657585960
on 10 June 2018 by guest. Protected by copyright.
http://bmjopen.bm
j.com/
BM
J Open: first published as 10.1136/bm
jopen-2015-009494 on 25 January 2016. Dow
nloaded from

For peer review only
women with diabetes who receive their care privately or in specialist clinics would have been
missed, contributing to under reporting of prevalence. Despite these considerations, the study
reported higher than expected levels of diabetes then has previously been reported.
Clinical Implications
The increase in both type 1 diabetes and especially type 2 diabetes with a sharp rise in last few
years is of special concern to primary care doctors who have to be prepared to work more
closely with secondary care on timely management of this problem. There is an established link
between diabetes in pregnancy and adverse pregnancy outcomes, including congenital
anomalies, perinatal mortality, spontaneous abortion, and delivery by caesarean section [3,5].
The poorer glycaemic control of women with type 1 diabetes compared to women with type 2
diabetes prior to pregnancy needs particular attention in terms of its risk to the pregnancy and
the baby.
It is known that two thirds of women with pregestational diabetes receive suboptimal
preconception care [8]. In this study we found that half of women with type 1 diabetes and two
thirds of women with type 2 diabetes did not have a HbA1c recorded in general practice in the
12 months prior to pregnancy. With the high levels of problems in primary care, general
practitioners can play a pivotal role in delivering preconception care to reduce the risk of
adverse outcomes [27–29]. This can include both preventive management of all women with
diabetes of child bearing age and more specific management of diabetes during pregnancy.
There is a growing need for the development and evaluation of such interventions in primary
care.
Footnotes
Contributors
SJC analysed the data and SJC, IP and IN contributed to the writing of the paper.
Page 15 of 22
For peer review only - http://bmjopen.bmj.com/site/about/guidelines.xhtml
BMJ Open
123456789101112131415161718192021222324252627282930313233343536373839404142434445464748495051525354555657585960
on 10 June 2018 by guest. Protected by copyright.
http://bmjopen.bm
j.com/
BM
J Open: first published as 10.1136/bm
jopen-2015-009494 on 25 January 2016. Dow
nloaded from

For peer review only
Parts of this work have been previously presented at the NIHR SPCR 2014 annual trainees
event at Oxford University.
Funding
This study was supported by a PhD studentship awarded to SJC by the NIHR School for
Primary Care Research.
Competing interests
All authors have completed the ICMJE uniform disclosure form at
http://www.icmje.org/coi_disclosure.pdf (available on request from the corresponding author)
and declare: SJC had financial support from the NIHR School for Primary Care Research for the
submitted work; all authors have no financial relationships with any organisations that might
have an interest in the submitted work in the previous 3 years; IP has supervised a PhD student
supported financially by Novo Nordisk outside of the submitted work.
Data sharing
No additional data available.
Ethics Approval
The THIN Scheme was approved by the National Health Service South-East Multi-centre
Research Ethics Committee (MREC), and approval for this study was obtained from CMD
Medical Research’s Scientific Review Committee in March 2014.
References 1 Hotu S, Carter B, Watson P, et al. Increasing prevalence of type 2 diabetes in adolescents. J Paediatr
Child Health 2004;40:201–4. doi:10.1111/j.1440-1754.2004.00337.x
2 Department of Health. National Service Framework for Diabetes: Standards. 2001.
3 Bell R, Bailey K, Cresswell T, et al. Trends in prevalence and outcomes of pregnancy in women with
pre-existing type I and type II diabetes. BJOG Int J Obstet Gynaecol 2008;115:445–52.
doi:10.1111/j.1471-0528.2007.01644.x
4 Penney GC, Mair G, Pearson DWM, et al. Outcomes of pregnancies in women with type 1 diabetes
in Scotland: a national population-based study. BJOG Int J Obstet Gynaecol 2003;110:315–8.
Page 16 of 22
For peer review only - http://bmjopen.bmj.com/site/about/guidelines.xhtml
BMJ Open
123456789101112131415161718192021222324252627282930313233343536373839404142434445464748495051525354555657585960
on 10 June 2018 by guest. Protected by copyright.
http://bmjopen.bm
j.com/
BM
J Open: first published as 10.1136/bm
jopen-2015-009494 on 25 January 2016. Dow
nloaded from

For peer review only
5 Casson IF, Clarke CA, Howard CV, et al. Outcomes of pregnancy in insulin dependent diabetic
women: results of a five year population cohort study. Br Med J 1997;315:275–8.
6 Hawthorne G, Robson S, Ryall EA, et al. Prospective population based survey of outcome of
pregnancy in diabetic women: results of the Northern Diabetic Pregnancy Audit, 1994. Br Med J
1997;315:279–81. doi:10.1136/bmj.315.7103.279
7 Confidential Enquiry into Maternal and Child Health. Diabetes in Pregnancy: Are we providing the
best care? Findings of a National Enquiry: England, Wales and Northern Ireland. 2007.
8 Confidential Enquiry into Maternal and Child Health. Pregnancy in Women with Type 1 and Type 2
Diabetes in 2002-03, England, Wales and Northern Ireland. 2005.
9 Lawrence JM, Contreras R, Chen W, et al. Trends in the Prevalence of Preexisting Diabetes and
Gestational Diabetes Mellitus Among a Racially/Ethnically Diverse Population of Pregnant Women,
1999–2005. Diabetes Care 2008;31:899–904. doi:10.2337/dc07-2345
10 http://csdmruk.cegedim.com/. http://www.csdmruk.imshealth.com/
11 Booth N. What are the Read Codes? Health Libr Rev 1994;11:177–82. doi:10.1046/j.1365-
2532.1994.1130177.x
12 Lis Y, Mann RD. The VAMP research multi-purpose database in the U.K. J Clin Epidemiol
1995;48:431–43. doi:10.1016/0895-4356(94)00137-F
13 Blak BT, Thompson M, Dattani H, et al. Generalisability of The Health Improvement Network (THIN)
database: demographics, chronic disease prevalence and mortality rates. Inform Prim Care
2011;19:251–5.
14 Horsfall L, Walters K, Petersen I. Identifying periods of acceptable computer usage in primary care
research databases. Pharmacoepidemiol Drug Saf 2013;22:64–9. doi:10.1002/pds.3368
15 Maguire A, Blak B, Thompson M. The importance of defining periods of complete mortality
reporting using automated data from primary care. Pharmacoepidemiol Drug Saf 2009;18:76–83.
doi:10.1002/pds.1688
16 Townsend P. Deprivation. J Soc Policy 1987;16:125–46. doi:10.1017/S0047279400020341
17 Murphy NJ, Bulkow LR, Schraer CD, et al. Prevalence of diabetes mellitus in pregnancy among Yup’ik
Eskimos and Alaska Coastal Indians, 1987-1988. Arctic Med Res 1991;Suppl:423–6.
18 Murphy N, Bulkow L, Schraer C, et al. Prevalence of Diabetes Mellitus in Pregnancy Among Yup’ik
Eskimos, 1987-1988. Diabetes Care 1993;16:315–7. doi:10.2337/diacare.16.1.315
19 Bardenheier BH, Imperatore G, Devlin HM, et al. Trends in Pre-Pregnancy Diabetes Among
Deliveries in 19 U.S. States, 2000−2010. Am J Prev Med 2015;48:154–61.
doi:10.1016/j.amepre.2014.08.031
Page 17 of 22
For peer review only - http://bmjopen.bmj.com/site/about/guidelines.xhtml
BMJ Open
123456789101112131415161718192021222324252627282930313233343536373839404142434445464748495051525354555657585960
on 10 June 2018 by guest. Protected by copyright.
http://bmjopen.bm
j.com/
BM
J Open: first published as 10.1136/bm
jopen-2015-009494 on 25 January 2016. Dow
nloaded from

For peer review only
20 Feig DS, Hwee J, Shah BR, et al. Trends in Incidence of Diabetes in Pregnancy and Serious Perinatal
Outcomes: A Large, Population-Based Study in Ontario, Canada, 1996–2010. Diabetes Care
2014;37:1590–6. doi:10.2337/dc13-2717
21 Lopez de Andres A, Jimenez-Garcia R, Carrasco-Garrido P. Trends in pregestational diabetes among
women delivering in Spain, 2001-2008. Int J Gynecol Obstet 2012;117:182–3.
doi:10.1016/j.ijgo.2011.12.006
22 Albrecht SS, Kuklina EV, Bansil P, et al. Diabetes Trends Among Delivery Hospitalizations in the U.S.,
1994–2004. Diabetes Care 2010;33:768–73. doi:10.2337/dc09-1801
23 Feig DS, Palda VA. Type 2 diabetes in pregnancy: a growing concern. The Lancet 2002;359:1690–2.
24 Lapolla A, Dalfra MG, Fedele D. Pregnancy complicated by type 2 diabetes: an emerging problem.
Diabetes Res Clin Pract 2008;80:2–7.
25 Cheung NW, McElduff A, Ross GP. Type 2 diabetes in pregnancy: a wolf in sheep’s clothing. Aust N Z
J Obstet Gynaecol 2005;45:479–83.
26 Harris MI. Undiagnosed NIDDM: Clinical and Public Health Issues. Diabetes Care 1993;16:642–52.
doi:10.2337/diacare.16.4.642
27 Temple RC, Aldridge VJ, Murphy HR. Prepregnancy Care and Pregnancy Outcomes in Women With
Type 1 Diabetes. Diabetes Care 2006;29:1744–9. doi:10.2337/dc05-2265
28 Wahabi HA, Alzeidan RA, Bawazeer GA, et al. Preconception care for diabetic women for improving
maternal and fetal outcomes: a systematic review and meta-analysis. Bmc Pregnancy Childbirth
2010;10:63. doi:10.1186/1471-2393-10-63
29 Ray JG, O’brien TE, Chan WS. Preconception care and the risk of congenital anomalies in the
offspring of women with diabetes mellitus: a meta-analysis. QJM Int J Med 2001;94:435–44.
doi:10.1093/qjmed/94.8.435
Figure legends
Figure 1: Flow diagram of study cohort development
Figure 2: Prevalence of pregestational diabetes mellitus in pregnancy by year and diabetes type
Page 18 of 22
For peer review only - http://bmjopen.bmj.com/site/about/guidelines.xhtml
BMJ Open
123456789101112131415161718192021222324252627282930313233343536373839404142434445464748495051525354555657585960
on 10 June 2018 by guest. Protected by copyright.
http://bmjopen.bm
j.com/
BM
J Open: first published as 10.1136/bm
jopen-2015-009494 on 25 January 2016. Dow
nloaded from

For peer review only
Figure 1: Flow diagram of study cohort development 189x115mm (150 x 150 DPI)
Page 19 of 22
For peer review only - http://bmjopen.bmj.com/site/about/guidelines.xhtml
BMJ Open
123456789101112131415161718192021222324252627282930313233343536373839404142434445464748495051525354555657585960
on 10 June 2018 by guest. Protected by copyright.
http://bmjopen.bm
j.com/
BM
J Open: first published as 10.1136/bm
jopen-2015-009494 on 25 January 2016. Dow
nloaded from

For peer review only
Figure 2: Prevalence of pregestational diabetes mellitus in pregnancy by year and diabetes type 886x649mm (96 x 96 DPI)
Page 20 of 22
For peer review only - http://bmjopen.bmj.com/site/about/guidelines.xhtml
BMJ Open
123456789101112131415161718192021222324252627282930313233343536373839404142434445464748495051525354555657585960
on 10 June 2018 by guest. Protected by copyright.
http://bmjopen.bm
j.com/
BM
J Open: first published as 10.1136/bm
jopen-2015-009494 on 25 January 2016. Dow
nloaded from

For peer review only
STROBE 2007 (v4) Statement—Checklist of items that should be included in reports of cohort studies
Section/Topic Item
# Recommendation Reported on page #
Title and abstract 1 (a) Indicate the study’s design with a commonly used term in the title or the abstract 1
(b) Provide in the abstract an informative and balanced summary of what was done and what was found 2
Introduction
Background/rationale 2 Explain the scientific background and rationale for the investigation being reported 4
Objectives 3 State specific objectives, including any prespecified hypotheses 4
Methods
Study design 4 Present key elements of study design early in the paper 5/6
Setting 5 Describe the setting, locations, and relevant dates, including periods of recruitment, exposure, follow-up, and data
collection
5/6
Participants 6 (a) Give the eligibility criteria, and the sources and methods of selection of participants. Describe methods of follow-up 5
(b) For matched studies, give matching criteria and number of exposed and unexposed N/A
Variables 7 Clearly define all outcomes, exposures, predictors, potential confounders, and effect modifiers. Give diagnostic criteria, if
applicable
5-7
Data sources/
measurement
8* For each variable of interest, give sources of data and details of methods of assessment (measurement). Describe
comparability of assessment methods if there is more than one group
6
Bias 9 Describe any efforts to address potential sources of bias
Study size 10 Explain how the study size was arrived at 6
Quantitative variables 11 Explain how quantitative variables were handled in the analyses. If applicable, describe which groupings were chosen and
why
7
Statistical methods 12 (a) Describe all statistical methods, including those used to control for confounding N/A
(b) Describe any methods used to examine subgroups and interactions N/A
(c) Explain how missing data were addressed 7
(d) If applicable, explain how loss to follow-up was addressed N/A
(e) Describe any sensitivity analyses N/A
Results
Page 21 of 22
For peer review only - http://bmjopen.bmj.com/site/about/guidelines.xhtml
BMJ Open
123456789101112131415161718192021222324252627282930313233343536373839404142434445464748495051525354555657585960
on 10 June 2018 by guest. Protected by copyright. http://bmjopen.bmj.com/ BMJ Open: first published as 10.1136/bmjopen-2015-009494 on 25 January 2016. Downloaded from

For peer review only
Participants 13* (a) Report numbers of individuals at each stage of study—eg numbers potentially eligible, examined for eligibility, confirmed
eligible, included in the study, completing follow-up, and analysed
7 and figure 1
(b) Give reasons for non-participation at each stage 7
(c) Consider use of a flow diagram
Descriptive data 14* (a) Give characteristics of study participants (eg demographic, clinical, social) and information on exposures and potential
confounders
8 (table 1)
(b) Indicate number of participants with missing data for each variable of interest 8 (table 1)
(c) Summarise follow-up time (eg, average and total amount) Follow up is 9
months for everyone
(pregnant women)
Outcome data 15* Report numbers of outcome events or summary measures over time 7
Main results 16 (a) Give unadjusted estimates and, if applicable, confounder-adjusted estimates and their precision (eg, 95% confidence
interval). Make clear which confounders were adjusted for and why they were included
9 (figure 2)
(b) Report category boundaries when continuous variables were categorized 6
(c) If relevant, consider translating estimates of relative risk into absolute risk for a meaningful time period N/A
Other analyses 17 Report other analyses done—eg analyses of subgroups and interactions, and sensitivity analyses N/A
Discussion
Key results 18 Summarise key results with reference to study objectives 9
Limitations
Interpretation 20 Give a cautious overall interpretation of results considering objectives, limitations, multiplicity of analyses, results from
similar studies, and other relevant evidence
9-11
Generalisability 21 Discuss the generalisability (external validity) of the study results 10
Other information
Funding 22 Give the source of funding and the role of the funders for the present study and, if applicable, for the original study on
which the present article is based
12
*Give information separately for cases and controls in case-control studies and, if applicable, for exposed and unexposed groups in cohort and cross-sectional studies.
Note: An Explanation and Elaboration article discusses each checklist item and gives methodological background and published examples of transparent reporting. The STROBE
checklist is best used in conjunction with this article (freely available on the Web sites of PLoS Medicine at http://www.plosmedicine.org/, Annals of Internal Medicine at
http://www.annals.org/, and Epidemiology at http://www.epidem.com/). Information on the STROBE Initiative is available at www.strobe-statement.org.
Page 22 of 22
For peer review only - http://bmjopen.bmj.com/site/about/guidelines.xhtml
BMJ Open
123456789101112131415161718192021222324252627282930313233343536373839404142434445464748495051525354555657585960
on 10 June 2018 by guest. Protected by copyright. http://bmjopen.bmj.com/ BMJ Open: first published as 10.1136/bmjopen-2015-009494 on 25 January 2016. Downloaded from
Top Related