


Languages
Pages
Legal

NYSE: DNR
A Case History of Tracking Water Movement Through
Fracture Systems in the Barnet Shale
March 10-11, 2011
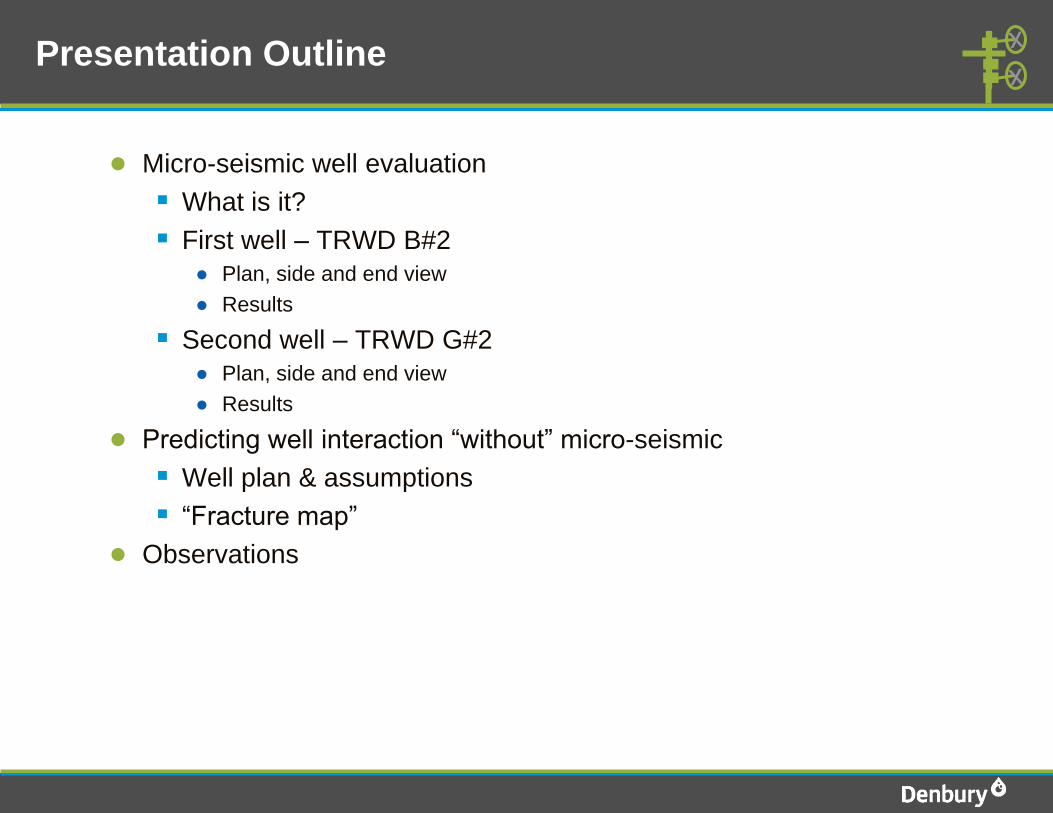
Presentation Outline
● Micro-seismic well evaluation
What is it?
First well – TRWD B#2
● Plan, side and end view
● Results
Second well – TRWD G#2
● Plan, side and end view
● Results
● Predicting well interaction “without” micro-seismic
Well plan & assumptions
“Fracture map”
● Observations
Micro-Seismic Mapping of Fractures
●
●
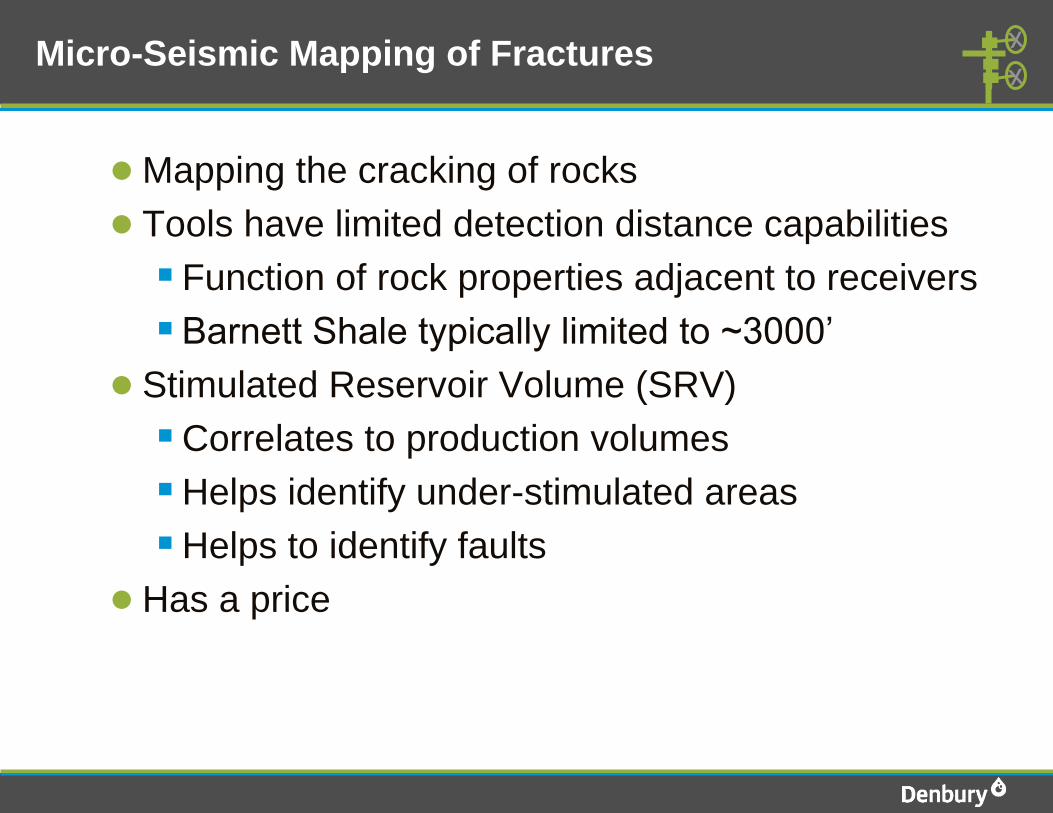
Mapping the cracking of rocks
Tools have limited detection distance capabilities
Function of rock properties adjacent to receivers
Barnett Shale typically limited to ~3000’
●
●
Stimulated Reservoir Volume (SRV)
Correlates to production volumes
Helps identify under-stimulated areas
Helps to identify faults
Has a price
4
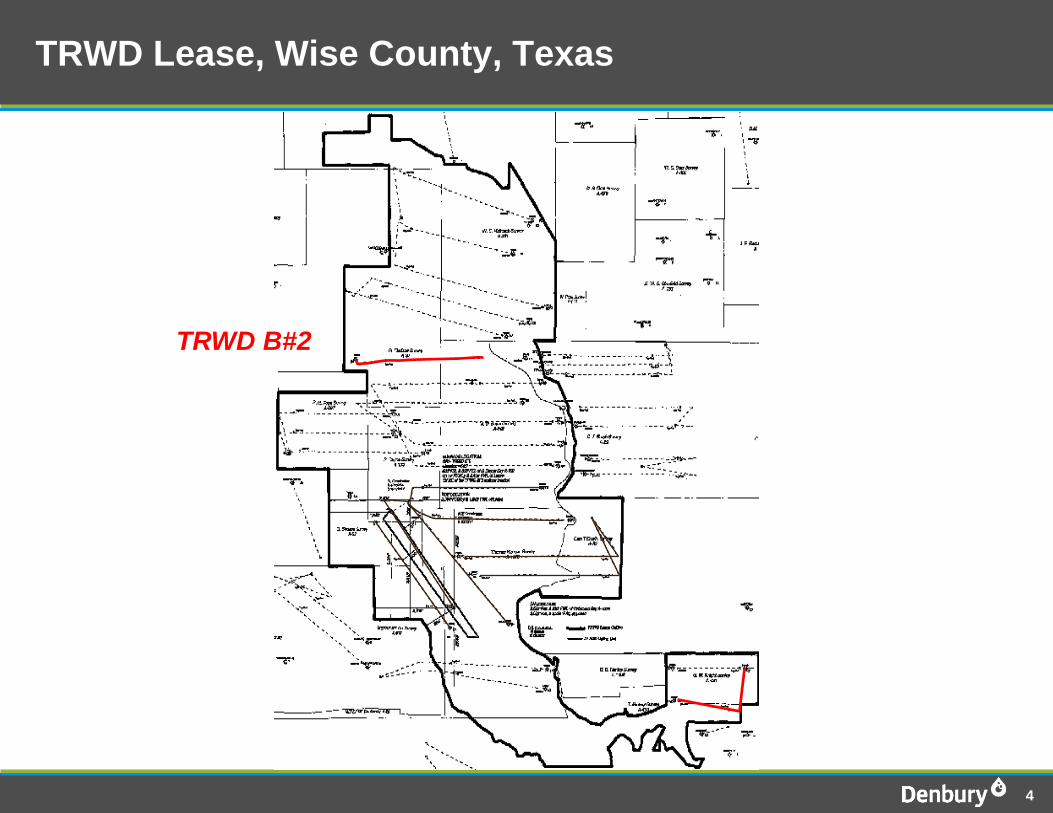
TRWD B#2
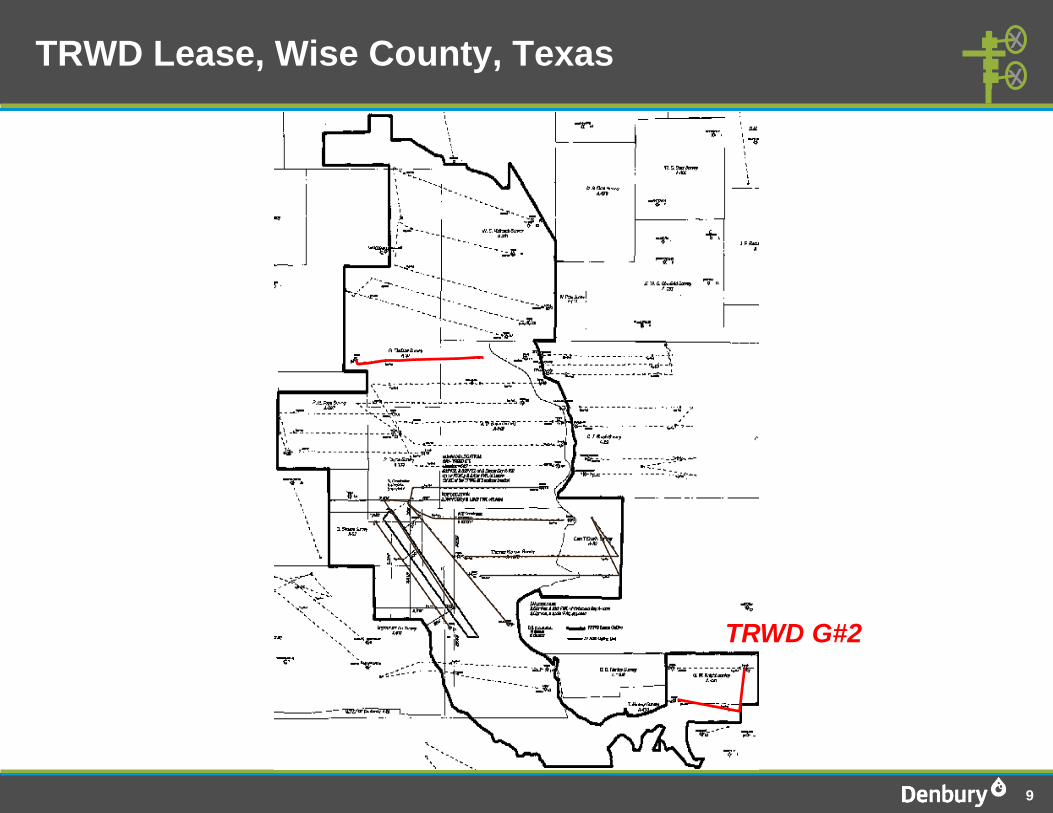
TRWD Lease, Wise County, Texas
5
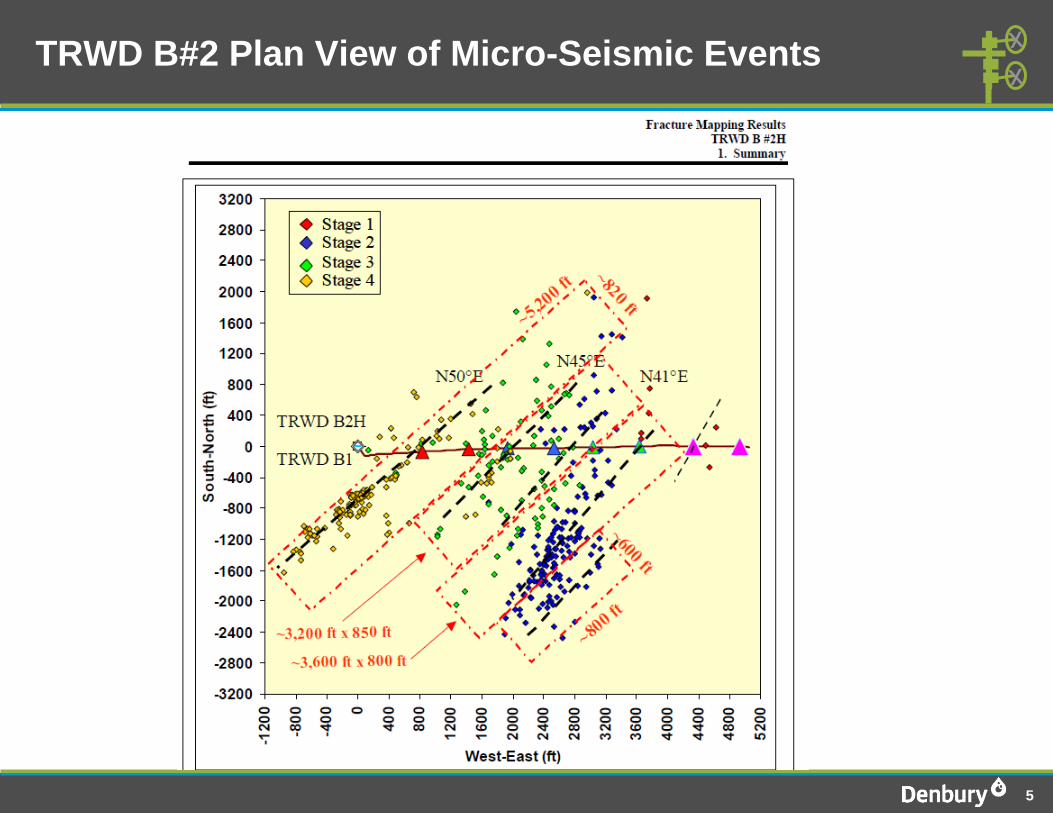
TRWD B#2 Plan View of Micro-Seismic Events

6
TRWD B#2 Side View of Micro-Seismic Events
7
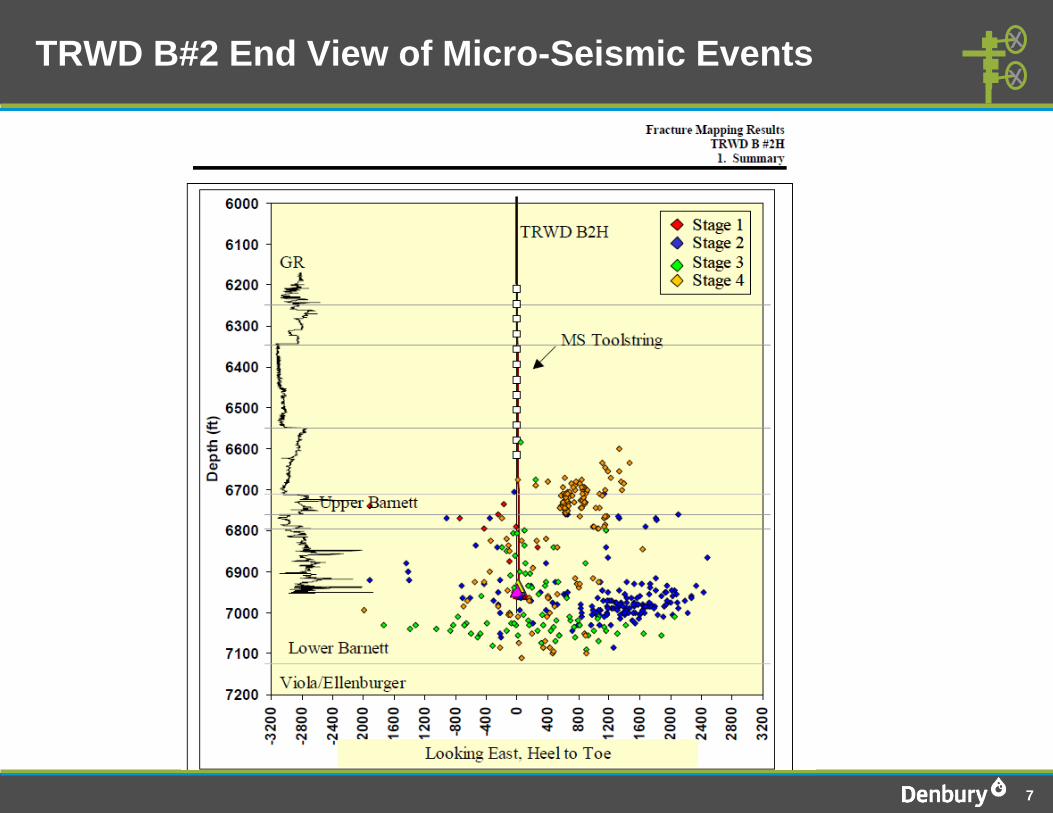
TRWD B#2 End View of Micro-Seismic Events
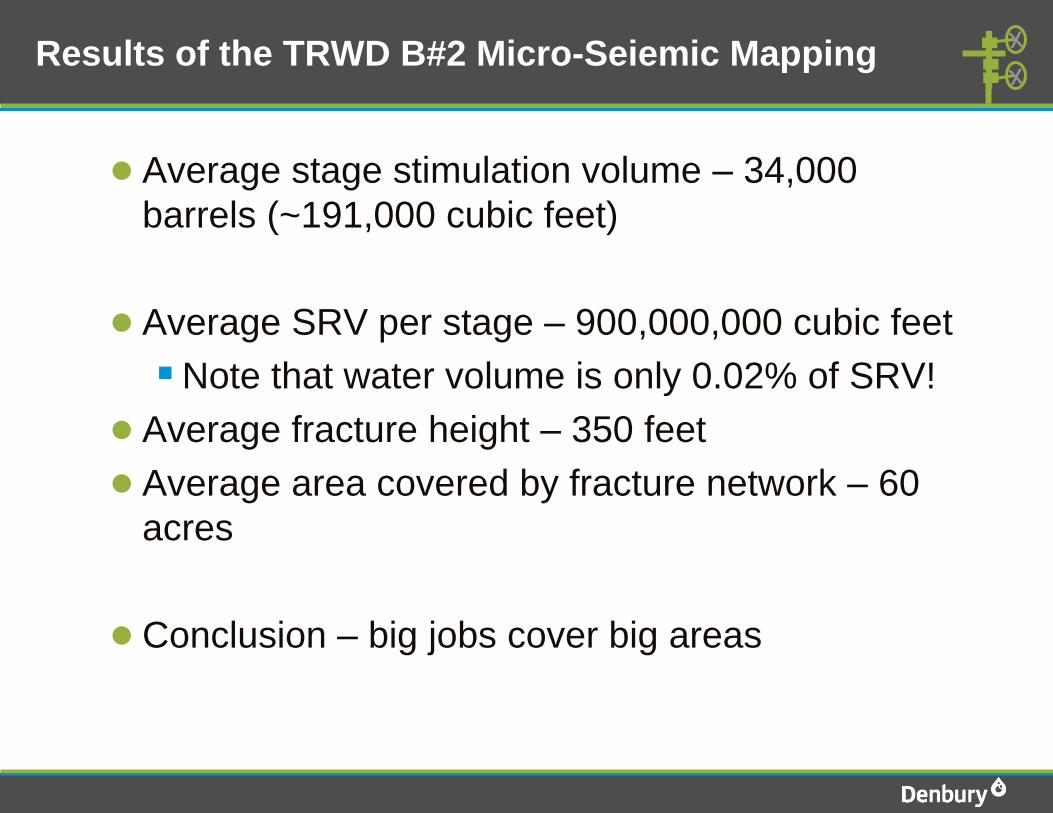
Results of the TRWD B#2 Micro-Seiemic Mapping
● Average stage stimulation volume – 34,000
barrels (~191,000 cubic feet)
● Average SRV per stage – 900,000,000 cubic feet
Note that water volume is only 0.02% of SRV!
●
●
Average fracture height – 350 feet
Average area covered by fracture network – 60
acres
● Conclusion – big jobs cover big areas
9
TRWD G#2
TRWD Lease, Wise County, Texas
10
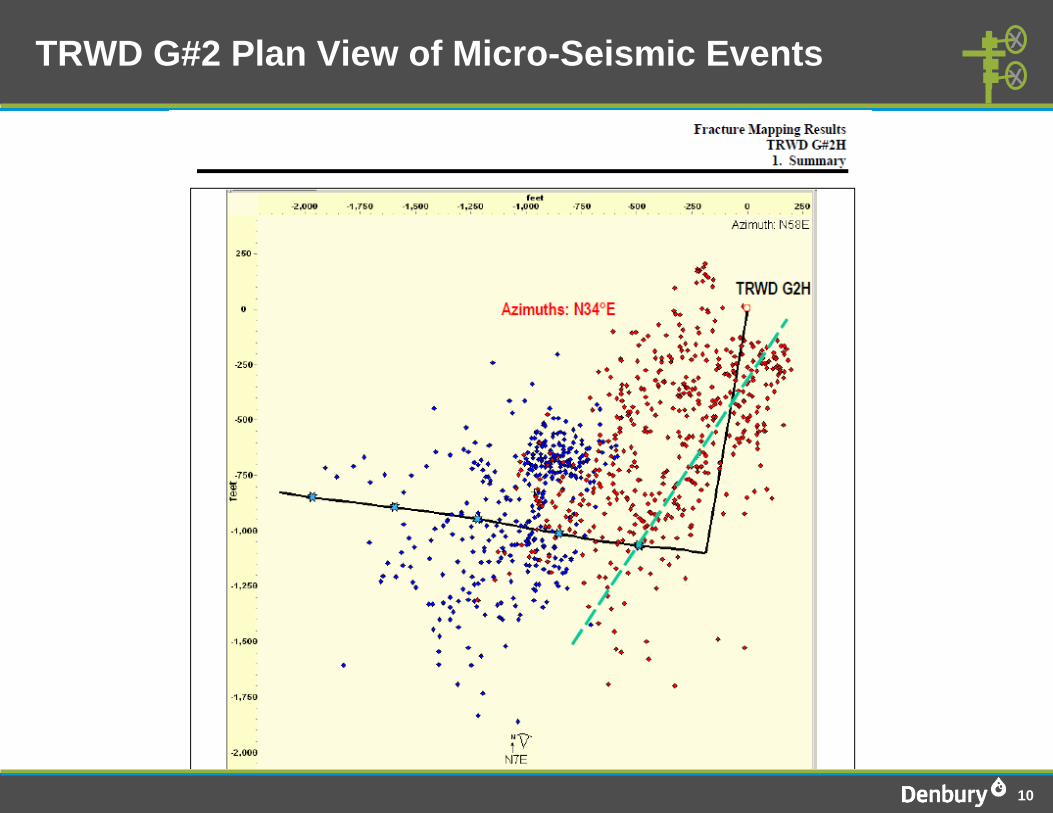
TRWD G#2 Plan View of Micro-Seismic Events
11
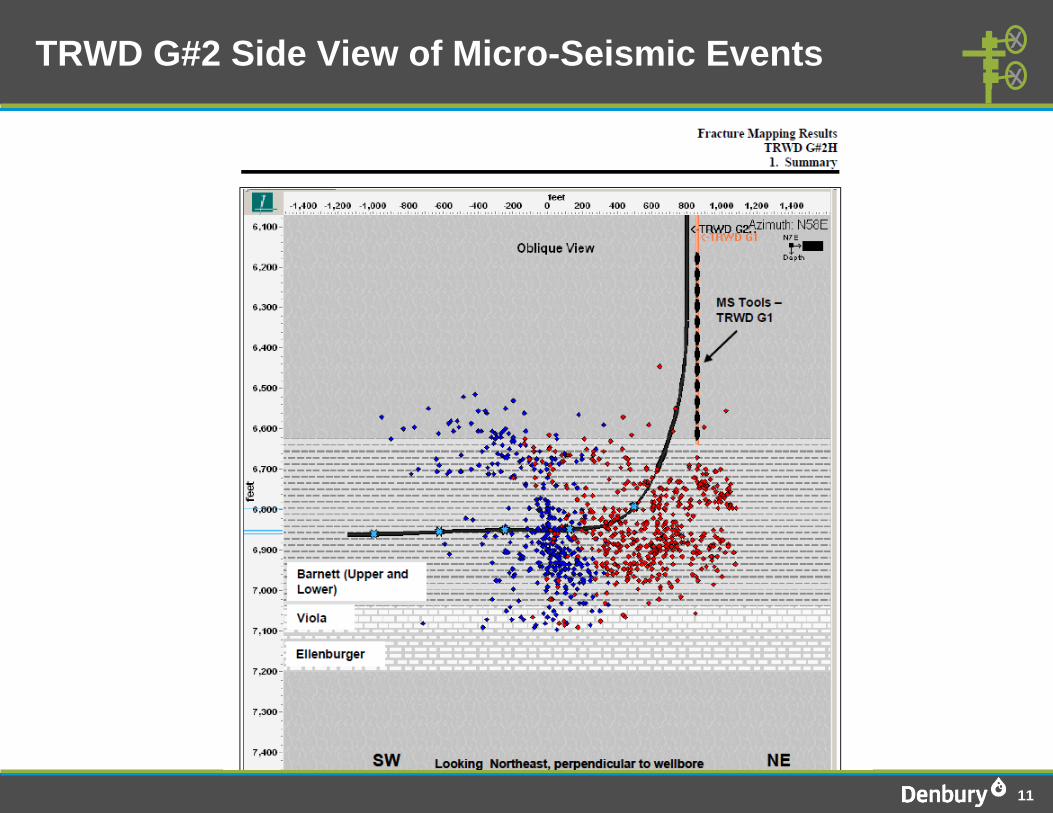
TRWD G#2 Side View of Micro-Seismic Events

12
TRWD G#2 End View of Micro-Seismic Events
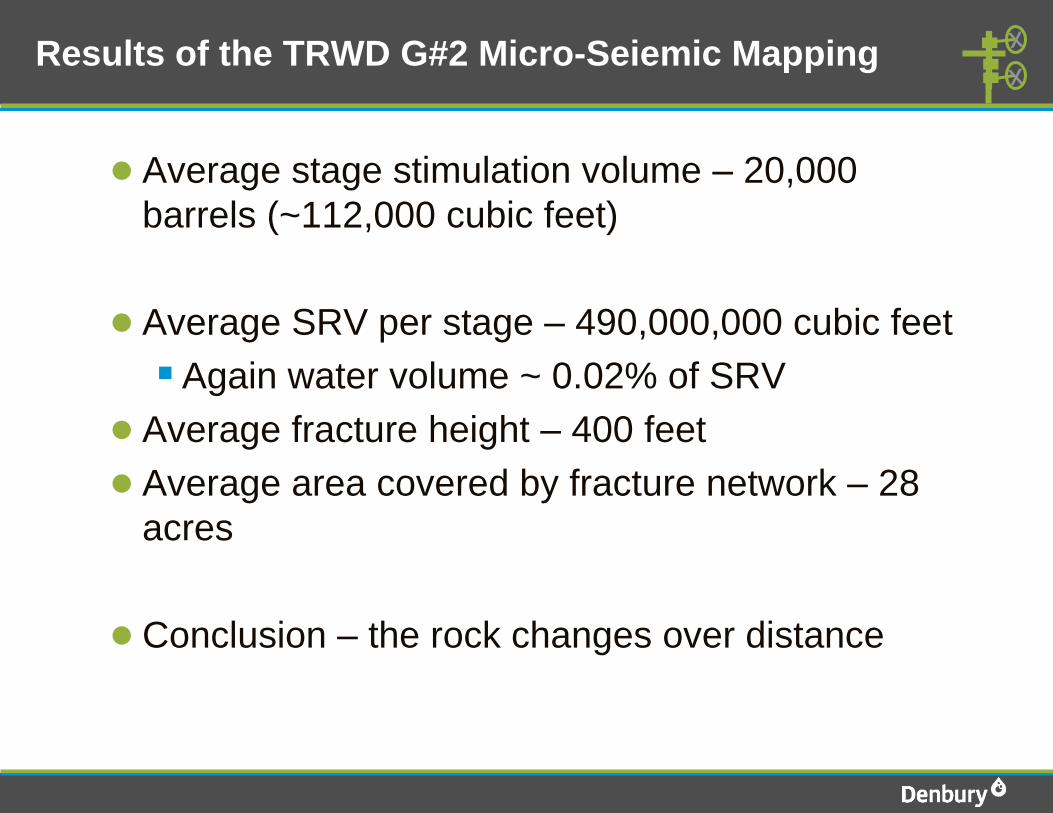
Results of the TRWD G#2 Micro-Seiemic Mapping
● Average stage stimulation volume – 20,000
barrels (~112,000 cubic feet)
●
●
●
Average SRV per stage – 490,000,000 cubic feet
Again water volume ~ 0.02% of SRV
Average fracture height – 400 feet
Average area covered by fracture network – 28
acres
● Conclusion – the rock changes over distance
Case Study Well Specifics and Assumptions
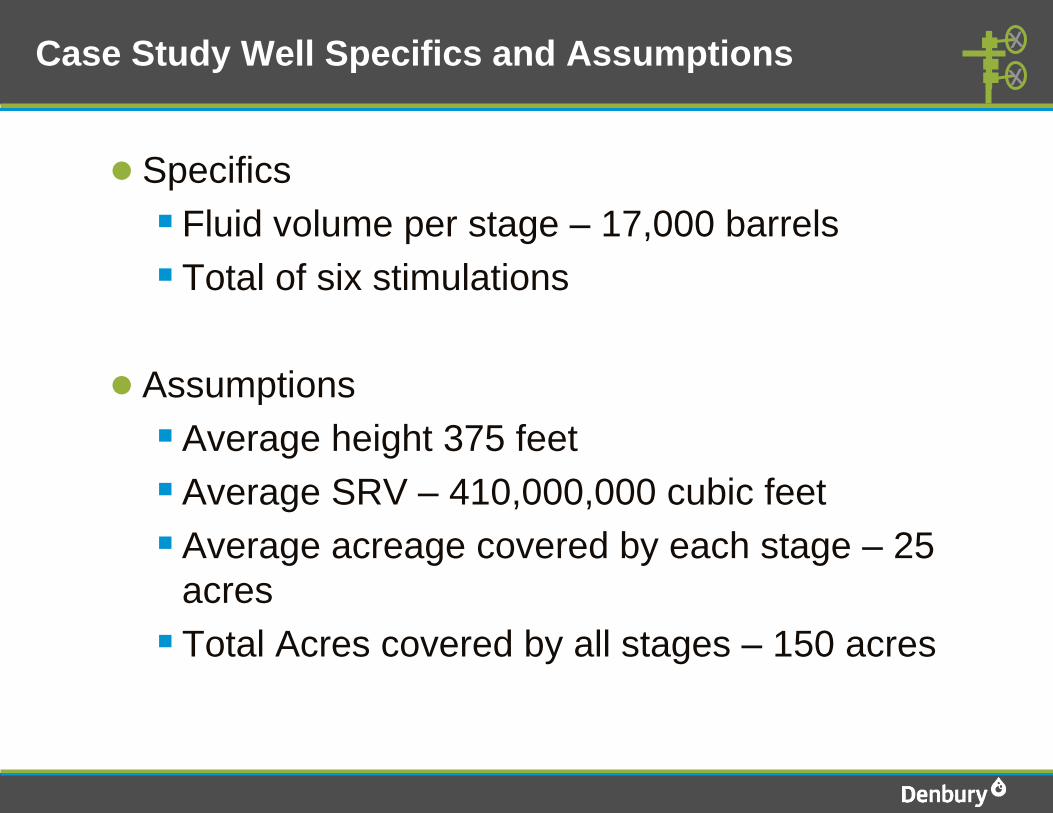
● Specifics
Fluid volume per stage – 17,000 barrels
Total of six stimulations
● Assumptions
Average height 375 feet
Average SRV – 410,000,000 cubic feet
Average acreage covered by each stage – 25
acres
Total Acres covered by all stages – 150 acres
15
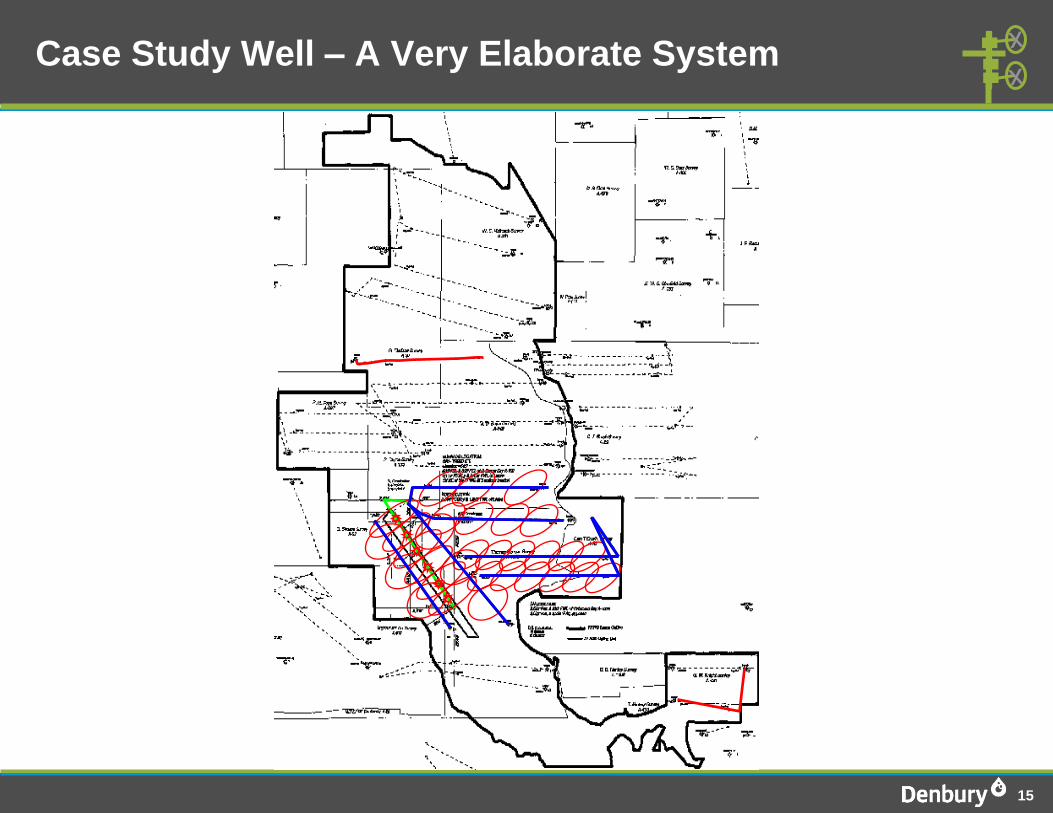
Case Study Well – A Very Elaborate System
Observations from Case Study Well
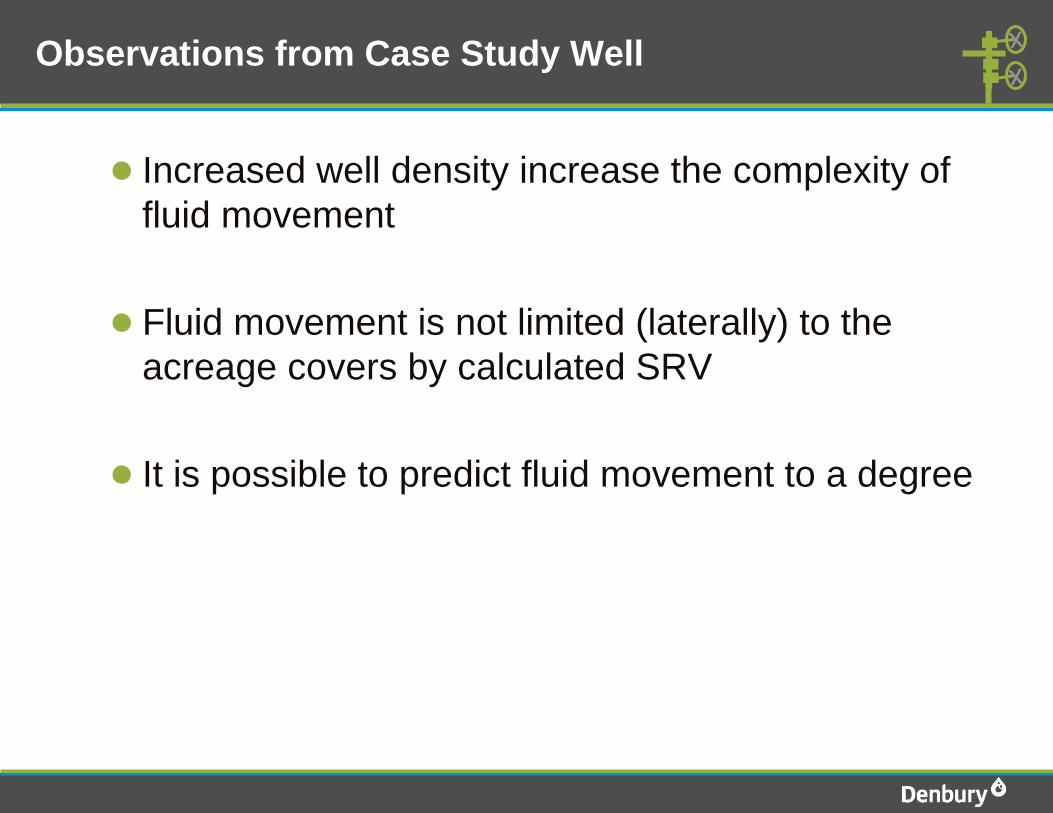
● Increased well density increase the complexity of
fluid movement
●
●
Fluid movement is not limited (laterally) to the
acreage covers by calculated SRV
It is possible to predict fluid movement to a degree

Questions Now or Ask me Later
A Case History of Tracking Water Movement Through Fracture Systems in the Barnett Shale
Pat Handren Denbury Resources, Inc
The statements made during the workshop do not represent the views or opinions of EPA. The
claims made by participants have not been verified or endorsed by EPA. Staged fracturing has been successfully carried out in the Barnett Shale for the past several years. Over the course of these years diagnostic work has been performed to assess the geometry of the complex network of fractures created during the pumping process. One of the tools used to “measure” the parameters of fracture azimuth, length, height and width of what has been termed as stimulated reservoir volume (SRV) is micro-seismic detection. The observed SRV coverage has proved very useful for predicting potential areas of communication between wells with increased density spacing. This tool has provided information that has led to improved stimulation efforts by many operators. In the case study area there were two wells that were observed with micro-seismic mapping. The mapping is based on the detection of small seismic events that occur during the fracturing process. The locations of the events are determined by analyzing the signal received at the monitoring tools. Essentially the event is triangulated by looking at the strength of the signals received by receivers oriented in different directions. This method of analysis provides a “map” of where the fractures could potentially be occurring. The first well was located to the north of the case study well. Four fracture stimulations were done, consisting of approximately 34,000 barrels of water and 340,000 pounds of sand for each stage. The average of the stages was an azimuth of north 45 degrees east and an SRV per stage of about 900,000,000 cubic feet (~21,000 acre-ft). The average height of the SRV was 350’, which means each stimulation stage covered about 60 acres of area. Of interest in this well was the observed growth during the fourth stage. This was the least contained of all the stages, but it was still limited by the lithology change from the Barnett Shale into the Marble Falls formation. The second well was located to the south of the case study well. Two fracture stimulations were performed, consisting of approximately 20,000 barrels of water and 380,000 pounds of sand for each stage. The average of the stages was an azimuth of north 34 degrees east and an SRV per stage of about 490,000,000 cubic feet (~11,000 acre-ft). The average height of the SRV was 400’, which means each stimulation stage covered about 28 acres of area. One of the most important things observed with the Micro-seismic mapping in both wells is that the height growth was well contained to within the Barnett Shale interval.
Even with the tools available to perform fracture diagnostics operators are still faced with challenges that are difficult to predict. As well density increases it becomes increasingly probable that wells will communicate either through previously created fractures or through adjacent wellbores and then into previously created fractures. The occurrence of this type of communication will be reviewed for a well that was fractured in 2009. A typical Barnett Shale well in the area has 9 5/8” surface casing set at 850’ and is cemented to surface to protect fresh water sands. The well is then drilled to a true vertical depth of about 6700’ with a lateral length of approximately 3000’. After drilling to total depth, a 4 ½” production casing string is run to bottom and is cemented in place with cement to 5400’ or higher. The top of cement depth is verified with a cement bond log run on electric line. The well is then ready for stimulation. Each stimulation stage is preceded with perforating of three intervals. The case study well had plans for six staged fracture stimulation. Each stage was scheduled to be pumped at a fluid rate of 100 barrels per minute with an average fluid volume of 17,000 barrels of fluid and 250,000 pounds of sand. If the wells previous evaluated with micro-seismic mapping gave any insight into SRV based on fracture treatment volume, then the estimated SRV would be approximately 410,000,000 cubic feet (~9,400 acre-ft). If an average height is assumed at 375 feet, then the average are covered by each stage would be 25 acres. This would mean that all six stages covered a total of 150 acres. Over the course of performing the stimulations in the well communication was achieved to wells spread over more than 600 acres. The farthest well that was “hit” by water from one of the stimulations was 1,500’ away. A total of six wells were affected by water from the study well’s stimulations. The basic conclusions drawn from the both the micro-seismic mapping and the observations made from the study well is that the stimulations stay reasonably contained within the Barnett Shale interval. As well density increases the complexity of subsequent fracture stimulation interaction with adjacent wells increases. If fracture azimuth is known, then a reasonable estimate of well to well interaction can be predicted.
Top Related