


Languages
Pages
Legal

WCDMA Radio Network Tuning
LZT 123 8000 R3A © Ericsson 2007 - 1 -
WCDMA Radio Network Tuning
STUDENT BOOK LZT 123 8000 R3A
WCDMA Radio Network Tuning
- 2 - © Ericsson 2007 LZT 123 8000 R3A
DISCLAIMER This book is a training document and contains simplifications. Therefore, it must not be considered as a specification of the system. The contents of this document are subject to revision without notice due to ongoing progress in methodology, design and manufacturing. Ericsson assumes no legal responsibility for any error or damage resulting from the usage of this document. This document is not intended to replace the technical documentation that was shipped with your system. Always refer to that technical documentation during operation and maintenance.
© Ericsson 2007 This document was produced by Ericsson. • It is used for training purposes only and may not be copied or
reproduced in any manner without the express written consent of Ericsson.
This Student Book, LZT 123 8000, R3A supports course number LZU 108 6273.
Table of Contents
LZT 123 8000 R3A © Ericsson 2007 - 3 -
Table of Contents
1 WCDMA RAN TUNING INTRODUCTION .....................................5
INTRODUCTION....................................................................................6
WCDMA RAN TUNING..........................................................................9
2 PREPARATIONS.........................................................................13
PREPARATIONS .................................................................................15 HIGH LEVEL RADIO DESIGN REVIEW.........................................................15 DEFINING CLUSTERS AND DRIVE TEST ROUTES ....................................16 DESIGN AND CONSISTENCY CHECK .........................................................18 SITE STATUS .................................................................................................33 SETUP OF DRIVE TEST TOOLS...................................................................33
3 PILOT TUNING............................................................................41
DATA COLLECTION/DRIVE TESTING ...............................................43 TEMS INVESTIGATION .................................................................................43
POSTPROCESSING............................................................................50 DATA COLLECTION.......................................................................................51 ROUTE ANALYSIS .........................................................................................53
ANALYSIS............................................................................................58 PILOT COVERAGE ........................................................................................58 INTERFERENCE ............................................................................................67 SCRAMBLING CODE PLAN VERIFICATION ................................................72 MISSING NEIGHBOR.....................................................................................73
CHANGE PROPOSALS ......................................................................75
4 UE TUNING – CIRCUIT SWITCHED DATA................................79
DATA COLLECTION – UE TUNING ....................................................81 TEMS INVESTIGATION DATA COLLECTION...............................................81
POSTPROCESSING............................................................................86 TEMS INVESTIGATION ROUTE ANALYSIS .................................................86
ANALYSIS............................................................................................88
WCDMA Radio Network Tuning
- 4 - © Ericsson 2007 LZT 123 8000 R3A
ACCESSIBILITY .............................................................................................88 RETAINABILITY..............................................................................................97 INTEGRITY ...................................................................................................105
5 UE TUNING – PACKET DATA..................................................107
TEMS INVESTIGATION – UE PACKET DATA TUNING....................109
TEMS INVESTIGATION KEY PERFORMANCE INDICATORS......... 111 ACCESSIBILITY ...........................................................................................111 RETAINABILITY............................................................................................117 PACKET THROUGHPUT .............................................................................120 PARAMETERS .............................................................................................129 SPREADING FACTOR USAGE....................................................................130
HSDPA INTRODUCTION...................................................................131 HSDPA FEATURE ........................................................................................131 HSDPA TUNING WORKFLOW ....................................................................133 TRAFFIC CASE – SETUP OF A HSDPA CONNECTION ............................137 HS-DSCH CELL SELECTION ......................................................................138 HS-DSCH CELL CHANGE ...........................................................................141 HSDPA THROUGHPUT ...............................................................................144 SYSTEM AND UE CAPABILITIES................................................................150
6 ACRONYMS AND ABBREVIATIONS ..........................................153
Table of Contents
LZT 123 8000 R3A © Ericsson 2007 - 5 -
1 WCDMA RAN Tuning Introduction
Objectives
Upon completion of this chapter the student will be able to:
• Explain the service content of WCDMA RAN Tuning
• Explain the service content of WCDMA RAN Optimization
• Explain the difference between RAN Tuning and RAN Optimization
• Describe the general tuning process
Figure 1.1 Chapter Objectives
WCDMA Radio Network Tuning
- 6 - © Ericsson 2007 LZT 123 8000 R3A
INTRODUCTION It is important to understand the WCDMA RAN tuning and optimization process in order to improve the radio network performance and the perceived end-user quality.
This book is aimed for network engineers who need to understand the main issues in initial tuning an Ericsson WCDMA radio network. It explains the different steps and tools needed to achieve this from an Ericsson perspective. Common radio related problems are presented and analyzed and the purpose is to create a deeper understanding of radio network tuning, resulting in improvements in radio network performance.
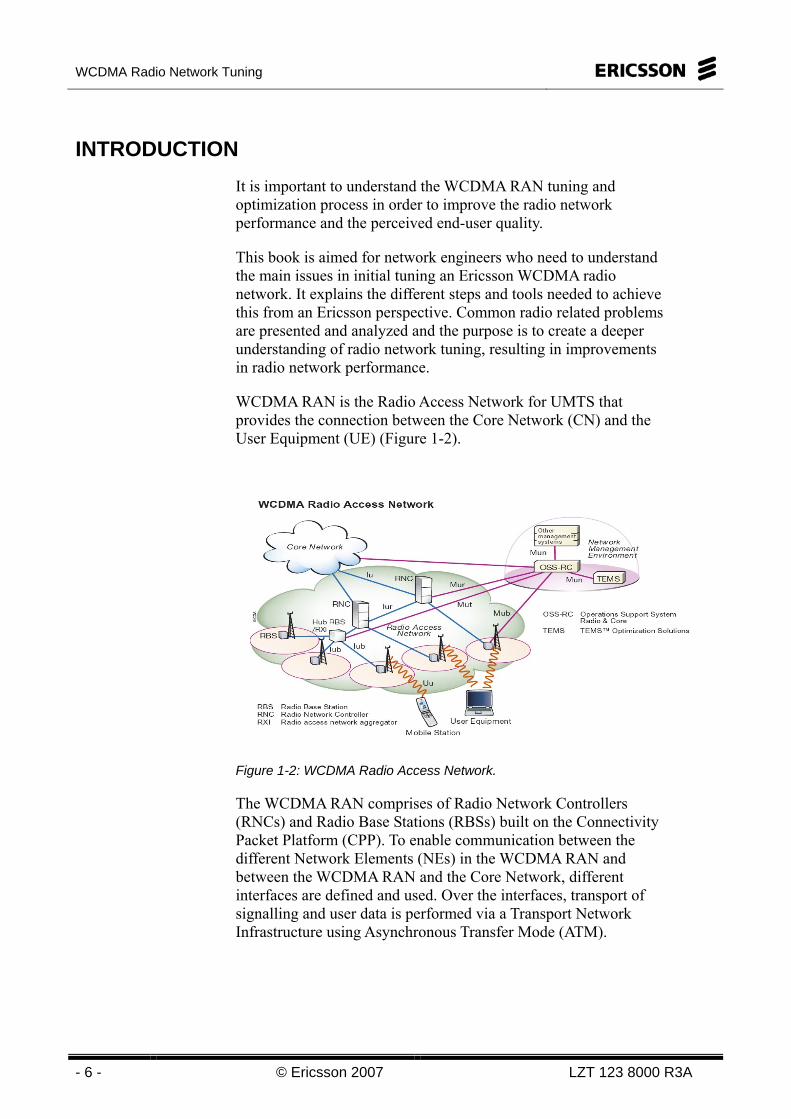
WCDMA RAN is the Radio Access Network for UMTS that provides the connection between the Core Network (CN) and the User Equipment (UE) (Figure 1-2).
Figure 1-2: WCDMA Radio Access Network.
The WCDMA RAN comprises of Radio Network Controllers (RNCs) and Radio Base Stations (RBSs) built on the Connectivity Packet Platform (CPP). To enable communication between the different Network Elements (NEs) in the WCDMA RAN and between the WCDMA RAN and the Core Network, different interfaces are defined and used. Over the interfaces, transport of signalling and user data is performed via a Transport Network Infrastructure using Asynchronous Transfer Mode (ATM).
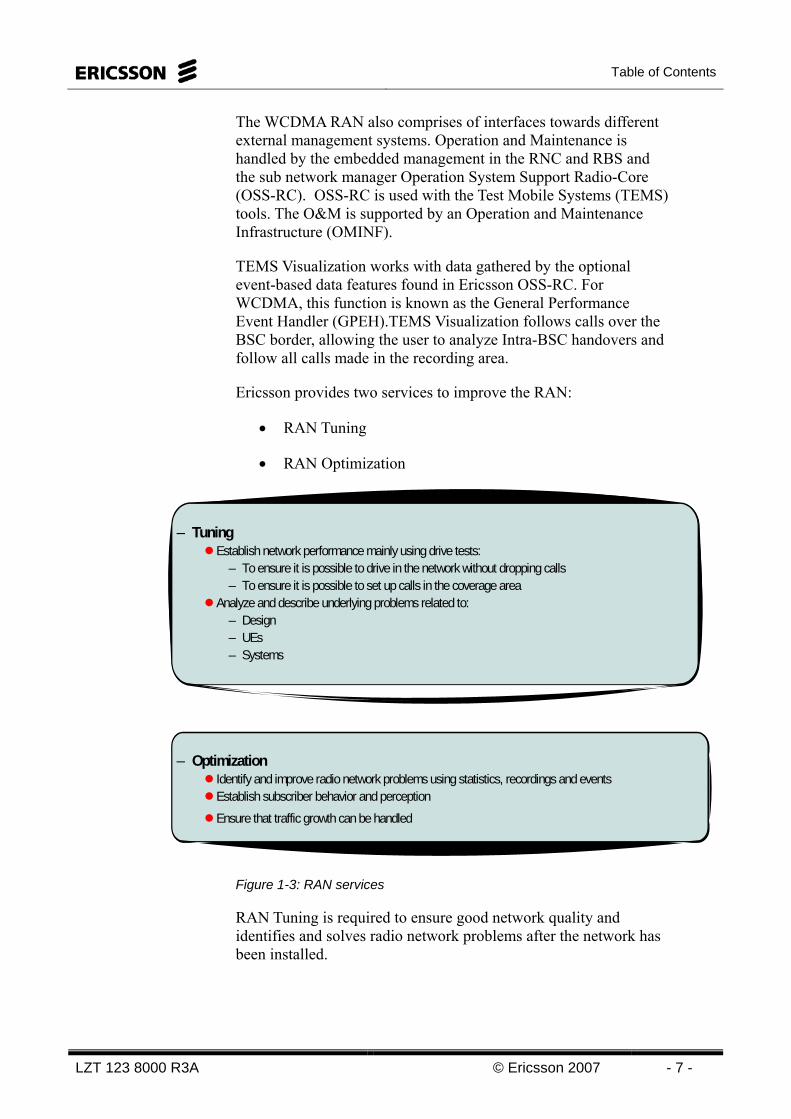
Table of Contents
LZT 123 8000 R3A © Ericsson 2007 - 7 -
The WCDMA RAN also comprises of interfaces towards different external management systems. Operation and Maintenance is handled by the embedded management in the RNC and RBS and the sub network manager Operation System Support Radio-Core (OSS-RC). OSS-RC is used with the Test Mobile Systems (TEMS) tools. The O&M is supported by an Operation and Maintenance Infrastructure (OMINF).
TEMS Visualization works with data gathered by the optional event-based data features found in Ericsson OSS-RC. For WCDMA, this function is known as the General Performance Event Handler (GPEH).TEMS Visualization follows calls over the BSC border, allowing the user to analyze Intra-BSC handovers and follow all calls made in the recording area.
Ericsson provides two services to improve the RAN:
• RAN Tuning
• RAN Optimization
– TuningEstablish network performance mainly using drive tests:
– To ensure it is possible to drive in the network without dropping calls– To ensure it is possible to set up calls in the coverage area
Analyze and describe underlying problems related to:– Design– UEs– Systems
– OptimizationIdentify and improve radio network problems using statistics, recordings and eventsEstablish subscriber behavior and perception
Ensure that traffic growth can be handled
Figure 1-3: RAN services
RAN Tuning is required to ensure good network quality and identifies and solves radio network problems after the network has been installed.
WCDMA Radio Network Tuning
- 8 - © Ericsson 2007 LZT 123 8000 R3A
RAN tuning is done to provide operators with a detailed understanding of the underlying problems to address, such as network design, UEs and system. It is performed when all necessary nodes in the area are installed and operational and when the network is stable and not yet commercially used. It is also performed when new sites are installed in already commercially launched areas.
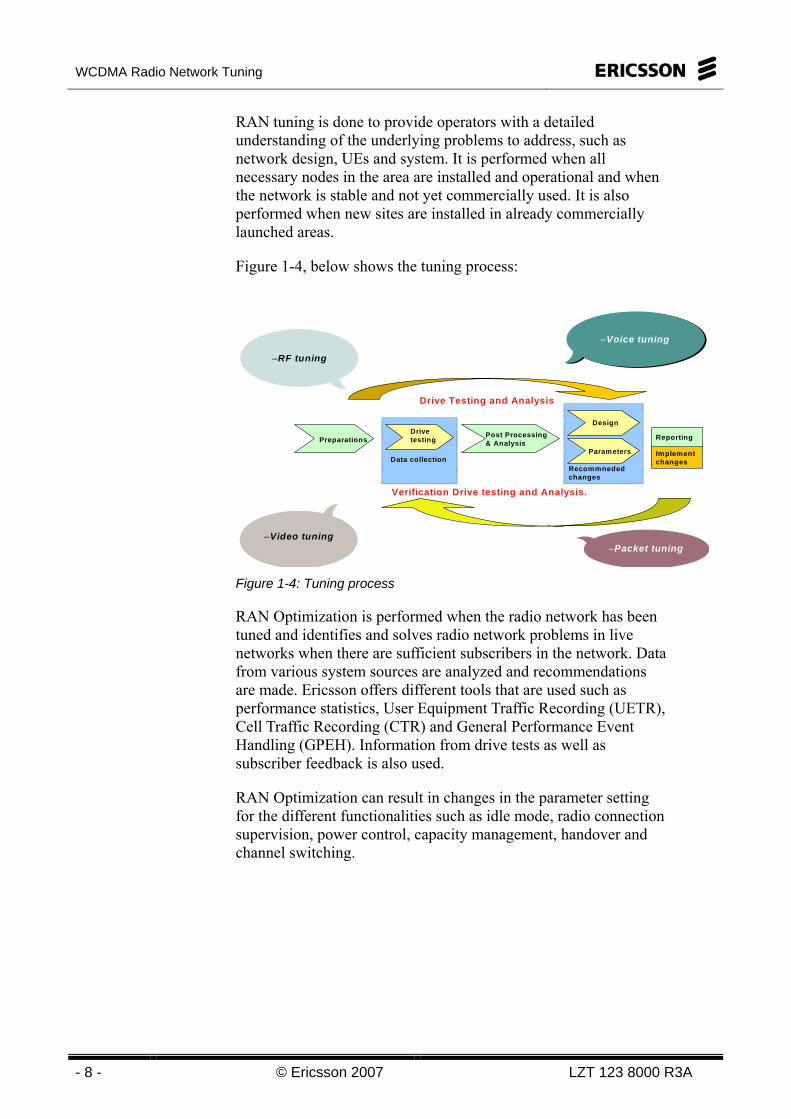
Figure 1-4, below shows the tuning process:
–Voice tuning
–Packet tuning–Video tuning
–RF tuning
Preparations
Data collection
Post Processing & Analysis
Design
Parameters
Drive testing Reporting
Recommneded changes
Verification Drive testing and Analysis.
Drive Testing and Analysis
Implement changes
Figure 1-4: Tuning process
RAN Optimization is performed when the radio network has been tuned and identifies and solves radio network problems in live networks when there are sufficient subscribers in the network. Data from various system sources are analyzed and recommendations are made. Ericsson offers different tools that are used such as performance statistics, User Equipment Traffic Recording (UETR), Cell Traffic Recording (CTR) and General Performance Event Handling (GPEH). Information from drive tests as well as subscriber feedback is also used.
RAN Optimization can result in changes in the parameter setting for the different functionalities such as idle mode, radio connection supervision, power control, capacity management, handover and channel switching.
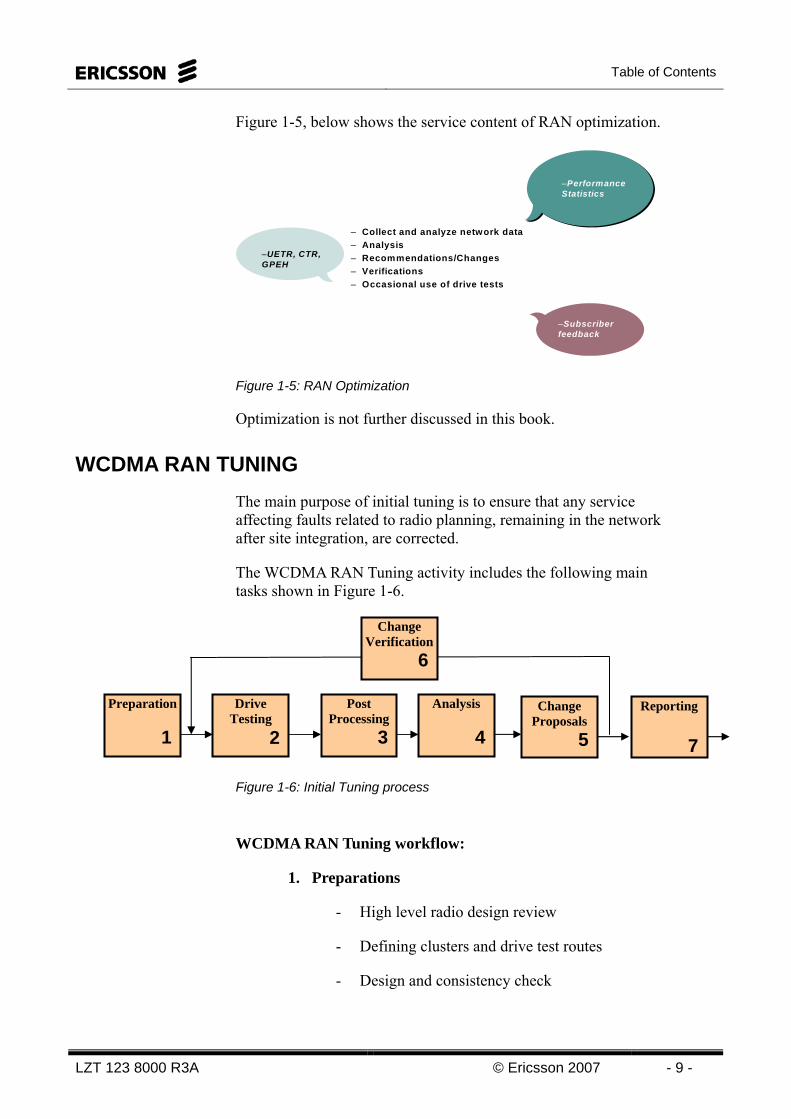
Table of Contents
LZT 123 8000 R3A © Ericsson 2007 - 9 -
Figure 1-5, below shows the service content of RAN optimization.
– Collect and analyze network data– Analysis– Recommendations/Changes– Verifications– Occasional use of drive tests
–Performance Statistics
–Subscriber feedback
–UETR, CTR, GPEH
Figure 1-5: RAN Optimization
Optimization is not further discussed in this book.
WCDMA RAN TUNING The main purpose of initial tuning is to ensure that any service affecting faults related to radio planning, remaining in the network after site integration, are corrected.
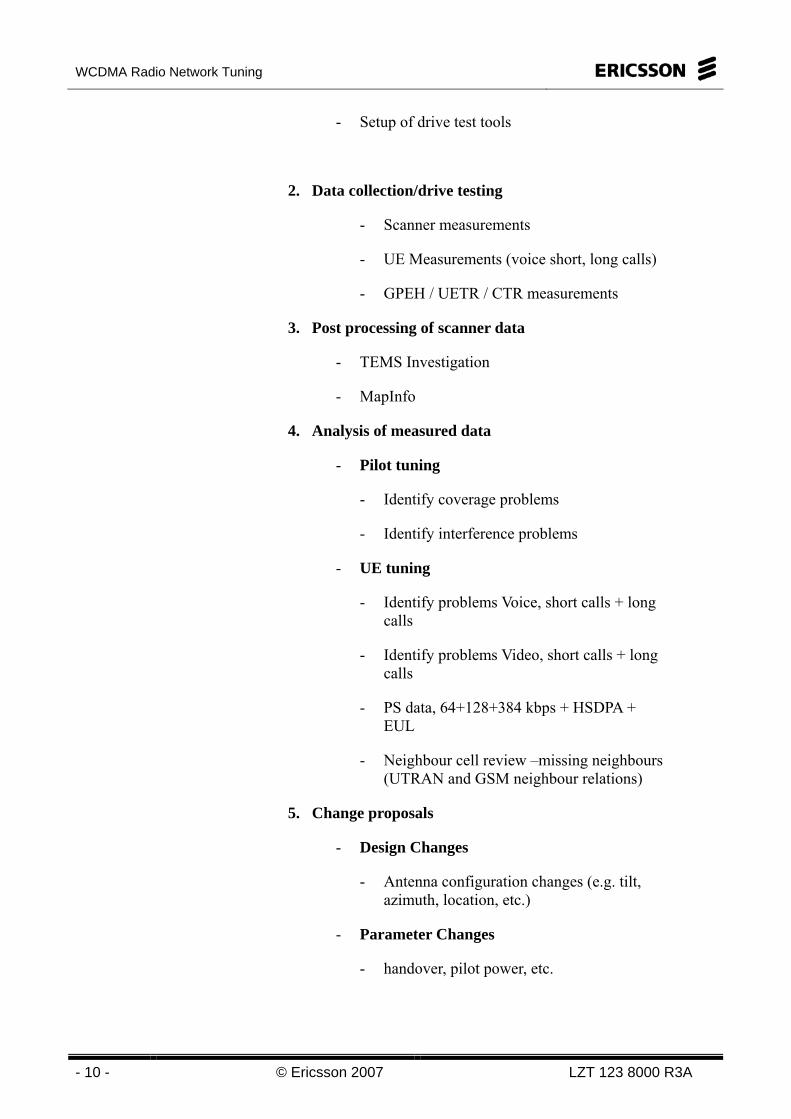
The WCDMA RAN Tuning activity includes the following main tasks shown in Figure 1-6.
Figure 1-6: Initial Tuning process
WCDMA RAN Tuning workflow:
1. Preparations
- High level radio design review
- Defining clusters and drive test routes
- Design and consistency check
Drive Testing
2
Preparation
1
Analysis
4
Post Processing 3
Change Verification
6
Change Proposals
5
Reporting
7
WCDMA Radio Network Tuning
- 10 - © Ericsson 2007 LZT 123 8000 R3A
- Setup of drive test tools
2. Data collection/drive testing
- Scanner measurements
- UE Measurements (voice short, long calls)
- GPEH / UETR / CTR measurements
3. Post processing of scanner data
- TEMS Investigation
- MapInfo
4. Analysis of measured data
- Pilot tuning
- Identify coverage problems
- Identify interference problems
- UE tuning
- Identify problems Voice, short calls + long calls
- Identify problems Video, short calls + long calls
- PS data, 64+128+384 kbps + HSDPA + EUL
- Neighbour cell review –missing neighbours (UTRAN and GSM neighbour relations)
5. Change proposals
- Design Changes
- Antenna configuration changes (e.g. tilt, azimuth, location, etc.)
- Parameter Changes
- handover, pilot power, etc.

Table of Contents
LZT 123 8000 R3A © Ericsson 2007 - 11 -
6. Change Verification
- Perform steps 2 – 6 again with same service mix after implementation of changes
- Perform steps 2-6 for new service mix (see step 2) after implementation of changes
7. Reporting
When the pilot tuning is finished the UE tuning starts, however for every cluster and for the total network a report should be written. The report is done when the proposed changes are implemented and verified.
- Cluster status
- KPI for each tuned cluster
- Other

WCDMA Radio Network Tuning
- 12 - © Ericsson 2007 LZT 123 8000 R3A
Intentionally blank

Table of Contents
LZT 123 8000 R3A © Ericsson 2007 - 13 -
2 Preparations
Objectives
Upon completion of this chapter the student will be able to:
• Make the preparations necessary to perform RAN Tuning
• Define clusters and drive test routes
• Perform a design and consistency check
• Setup drive test tools
Figure 2-1: Chapter Objectives

WCDMA Radio Network Tuning
- 14 - © Ericsson 2007 LZT 123 8000 R3A
Intentionally blank
Table of Contents
LZT 123 8000 R3A © Ericsson 2007 - 15 -
PREPARATIONS This will normally start with a meeting with cell planners and operations personnel in order to discuss the content of the tuning and time plan. The following steps should be specified and agreed upon.
• High Level Radio Design Review
• Key Performance Indicators (KPI)
• Defining Clusters and Drive Test Routes
• Design and Consistency Check
• Setup of drive test tools
The purpose of preparation phase is to gather necessary information and plan for drive test activities. This includes also what should be checked prior to start drive testing.
HIGH LEVEL RADIO DESIGN REVIEW
The purpose of this activity is to get a general understanding on how the radio network is designed without dig in-depth. This implies collecting information that brings us a view over the network. The input to this activity can be the following:
• Composite pilot coverage (Ec/No) plots.
• Composite pilot coverage (RSCP) plots.
• DL/UL DPDCH coverage plots.
• Power setting on CPICH and downlink DPDCH for voice, CS and PS.
• Antenna radiation patterns (horizontal and vertical), including the maximum antenna gain.
• Transmit and receive reference points, the transmit and receive reference points are needed to define the transmit power and receive sensitivity, as well as the transmit and receive losses.
WCDMA Radio Network Tuning
- 16 - © Ericsson 2007 LZT 123 8000 R3A
• Tilt type (mechanical and/or electrical) if any, tilt interval (+/- degrees).
• If Tower Mounted Amplifiers are used.
• Site configuration (e.g. positions, antenna configuration and pattern, Remote Electrical tilt, feeder losses, common control channel power allocation, number of carriers).
• Design criteria (e.g. degree of coverage, Ec/No levels, RSCP targets, service types, etc).
• Average antenna height and high located sites.
• Blocking/shadowing due to natural or man-made obstructions.
• Prediction model used (Fine tuning of Okumura Hata model based on field measurements).
• Part of this information is based on predictions. In case there are plots from drive testing, they should be considered instead.
DEFINING CLUSTERS AND DRIVE TEST ROUTES
For practical reasons it is necessary to divide the radio network into a number of clusters and limit the cluster size to a number of sites that are easy to handle. The following criteria should be considered when defining clusters and planning drive test routes.
• Plan clusters with maximum 10-15 sites. The clusters should be within one RNC and within at least one transmission Hub.
• Define which sites should belong to which cluster.
• Make sure the routes pass through all cells and important areas within the cluster and they should be planned so that important roads are included.
• The routes should have as little overlap as possible.
• Individual routes should be planned so that they are limited to areas with similar coverage requirements, e.g. urban, suburban and rural areas.
• The routes should be planned so that soft/softer handover can be observed in representative and important areas.
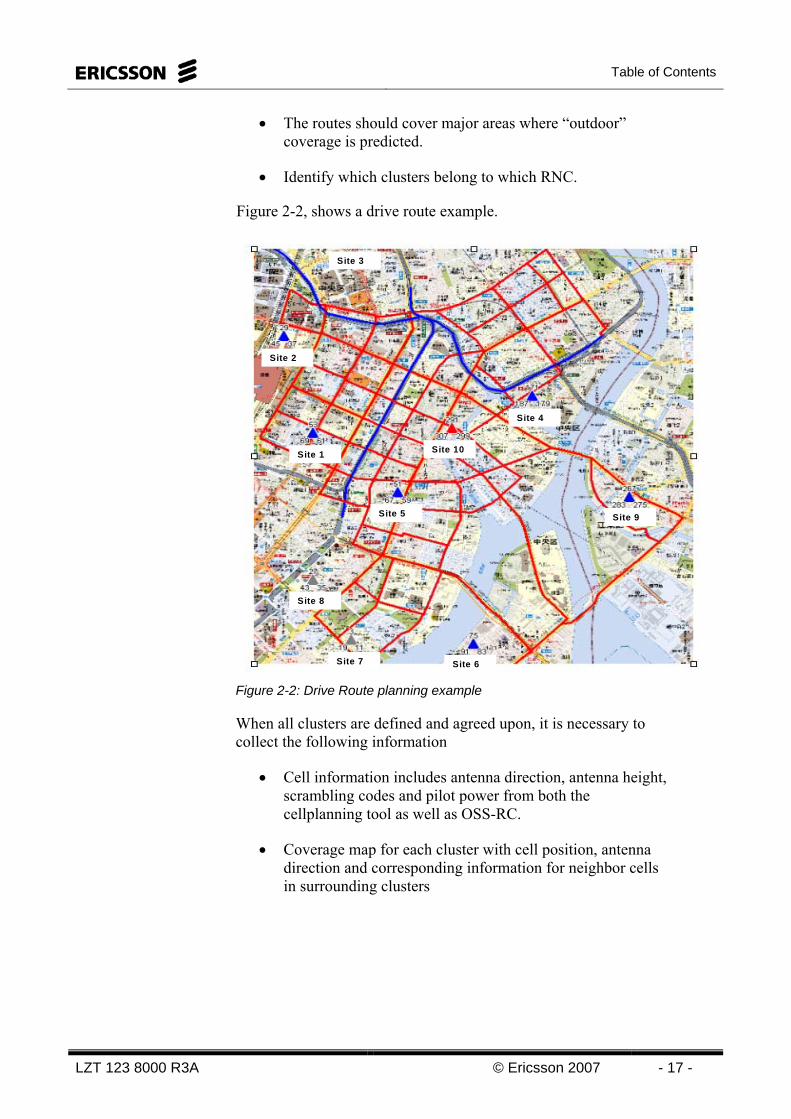
Table of Contents
LZT 123 8000 R3A © Ericsson 2007 - 17 -
• The routes should cover major areas where “outdoor” coverage is predicted.
• Identify which clusters belong to which RNC.
Figure 2-2, shows a drive route example.
Site 1
Site 2
Site 3
Site 4
Site 5
Site 6Site 7
Site 8
Site 9
Site 10
Figure 2-2: Drive Route planning example
When all clusters are defined and agreed upon, it is necessary to collect the following information
• Cell information includes antenna direction, antenna height, scrambling codes and pilot power from both the cellplanning tool as well as OSS-RC.
• Coverage map for each cluster with cell position, antenna direction and corresponding information for neighbor cells in surrounding clusters
WCDMA Radio Network Tuning
- 18 - © Ericsson 2007 LZT 123 8000 R3A
DESIGN AND CONSISTENCY CHECK
The purpose of design check is to find inconsistencies in the network and fix them prior to drive testing. By fixing inconsistencies we save time and speed up the tuning process.
Here, parameter values, Scrambling Code plan and neighbor cell plan is investigated to find any errors. Note that it is important to do checks as often as possible as most networks are expanding and new sites are added.
The consistency check can be done in several ways. By using the built –in OSS-RC consistency check or by using the OSS-RC Bulk CM. The most convenient way is to use the built in consistency check, however the OSS-RC Bulk CM some additional data can be checked
OSS-RC Built-in consistency check
The Consistency Check application is used to check that network elements in the WCDMA Radio Access Network (RAN) have consistent data. If data is not consistent between Network Elements problems in the network can occur. Using the Consistency Check interface, you can select network elements and check that they are consistent. This is done by selecting network elements and applying 'rules' to check against. The results of a consistency check can be displayed in a report.
The Consistency Check application is primarily used in planned configurations to help ensure error-free configurations. Consistency Check can be used in the valid area also and is useful in troubleshooting the valid configuration.
There are two separate categories of data consistency for which there are two separate tools to detect and automatically repair (if possible):
• Iub Consistency Check - ensuring that the Iub interface is correctly configured between the RNC and RBS.
• Sub-network Consistency Check - ensuring that the cell, relation and area configuration across RNCs is consistent.
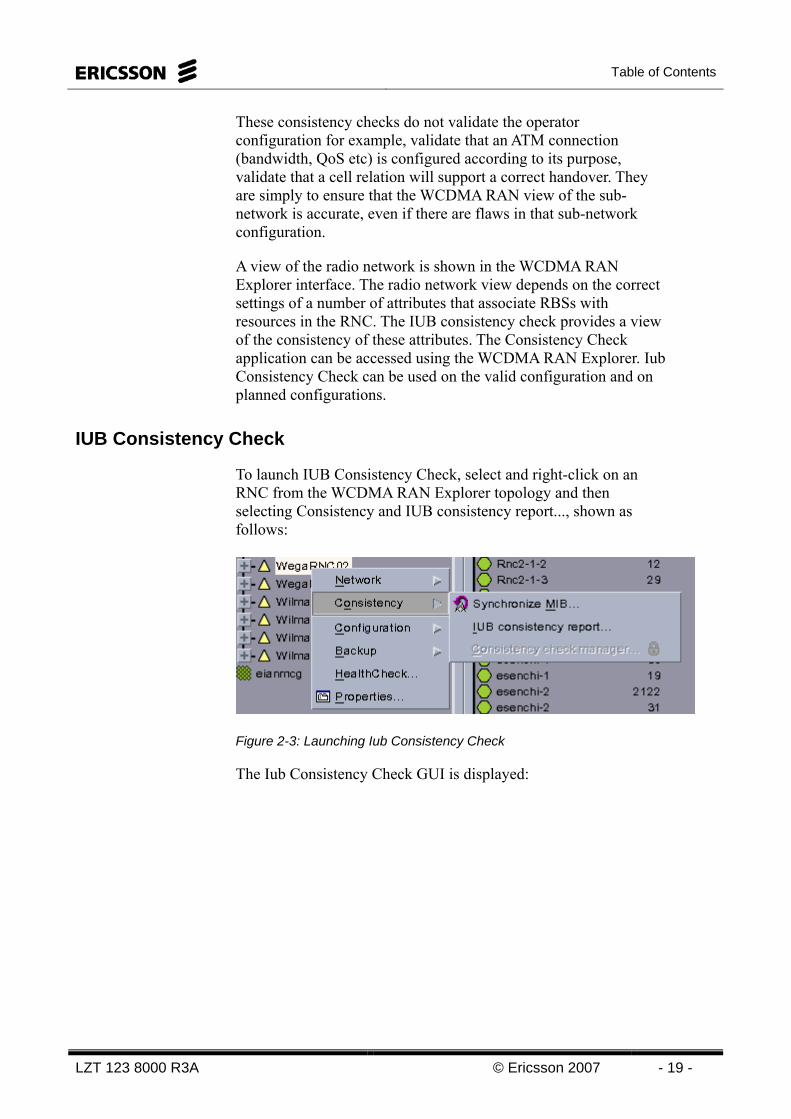
Table of Contents
LZT 123 8000 R3A © Ericsson 2007 - 19 -
These consistency checks do not validate the operator configuration for example, validate that an ATM connection (bandwidth, QoS etc) is configured according to its purpose, validate that a cell relation will support a correct handover. They are simply to ensure that the WCDMA RAN view of the sub-network is accurate, even if there are flaws in that sub-network configuration.
A view of the radio network is shown in the WCDMA RAN Explorer interface. The radio network view depends on the correct settings of a number of attributes that associate RBSs with resources in the RNC. The IUB consistency check provides a view of the consistency of these attributes. The Consistency Check application can be accessed using the WCDMA RAN Explorer. Iub Consistency Check can be used on the valid configuration and on planned configurations.
IUB Consistency Check
To launch IUB Consistency Check, select and right-click on an RNC from the WCDMA RAN Explorer topology and then selecting Consistency and IUB consistency report..., shown as follows:
Figure 2-3: Launching Iub Consistency Check
The Iub Consistency Check GUI is displayed:
WCDMA Radio Network Tuning
- 20 - © Ericsson 2007 LZT 123 8000 R3A
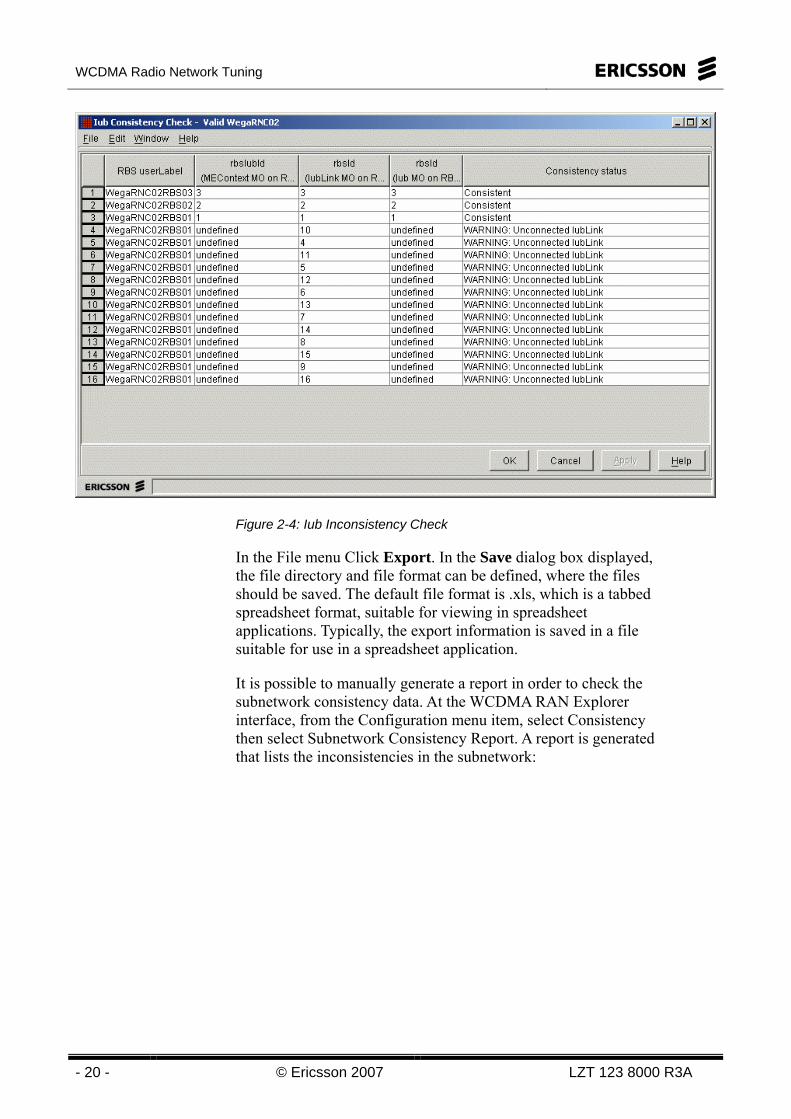
Figure 2-4: Iub Inconsistency Check
In the File menu Click Export. In the Save dialog box displayed, the file directory and file format can be defined, where the files should be saved. The default file format is .xls, which is a tabbed spreadsheet format, suitable for viewing in spreadsheet applications. Typically, the export information is saved in a file suitable for use in a spreadsheet application.
It is possible to manually generate a report in order to check the subnetwork consistency data. At the WCDMA RAN Explorer interface, from the Configuration menu item, select Consistency then select Subnetwork Consistency Report. A report is generated that lists the inconsistencies in the subnetwork:
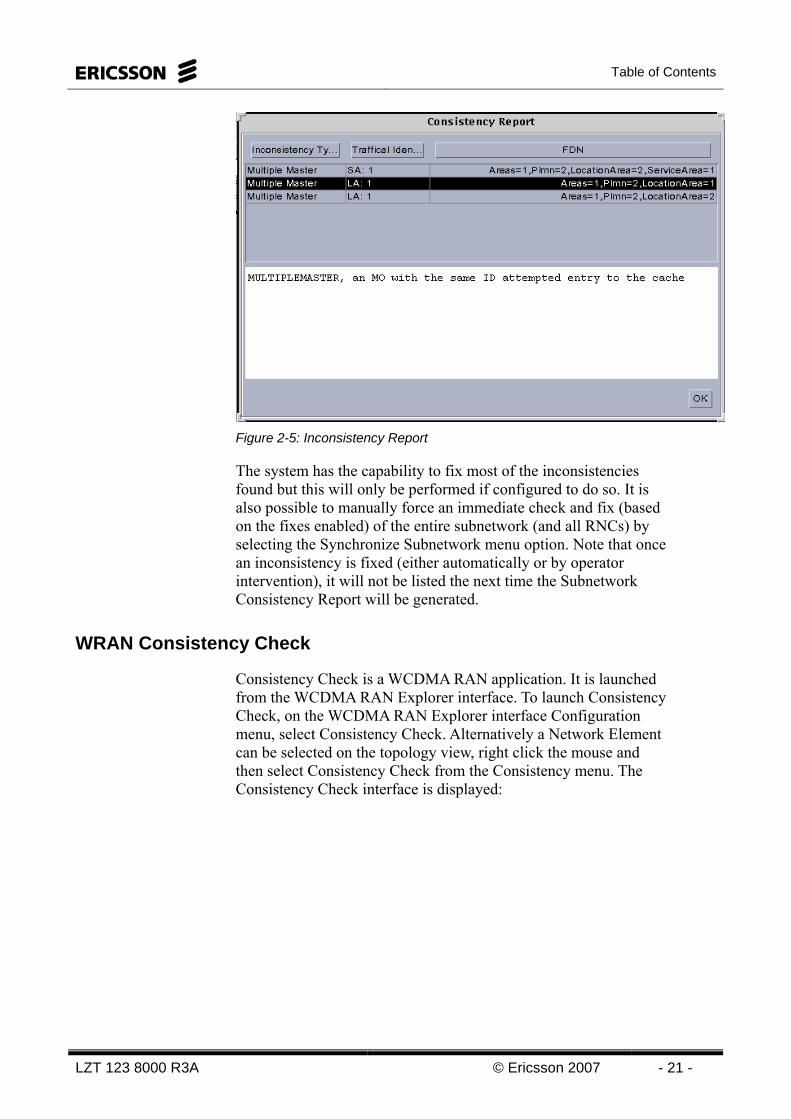
Table of Contents
LZT 123 8000 R3A © Ericsson 2007 - 21 -
Figure 2-5: Inconsistency Report
The system has the capability to fix most of the inconsistencies found but this will only be performed if configured to do so. It is also possible to manually force an immediate check and fix (based on the fixes enabled) of the entire subnetwork (and all RNCs) by selecting the Synchronize Subnetwork menu option. Note that once an inconsistency is fixed (either automatically or by operator intervention), it will not be listed the next time the Subnetwork Consistency Report will be generated.
WRAN Consistency Check
Consistency Check is a WCDMA RAN application. It is launched from the WCDMA RAN Explorer interface. To launch Consistency Check, on the WCDMA RAN Explorer interface Configuration menu, select Consistency Check. Alternatively a Network Element can be selected on the topology view, right click the mouse and then select Consistency Check from the Consistency menu. The Consistency Check interface is displayed:
WCDMA Radio Network Tuning
- 22 - © Ericsson 2007 LZT 123 8000 R3A
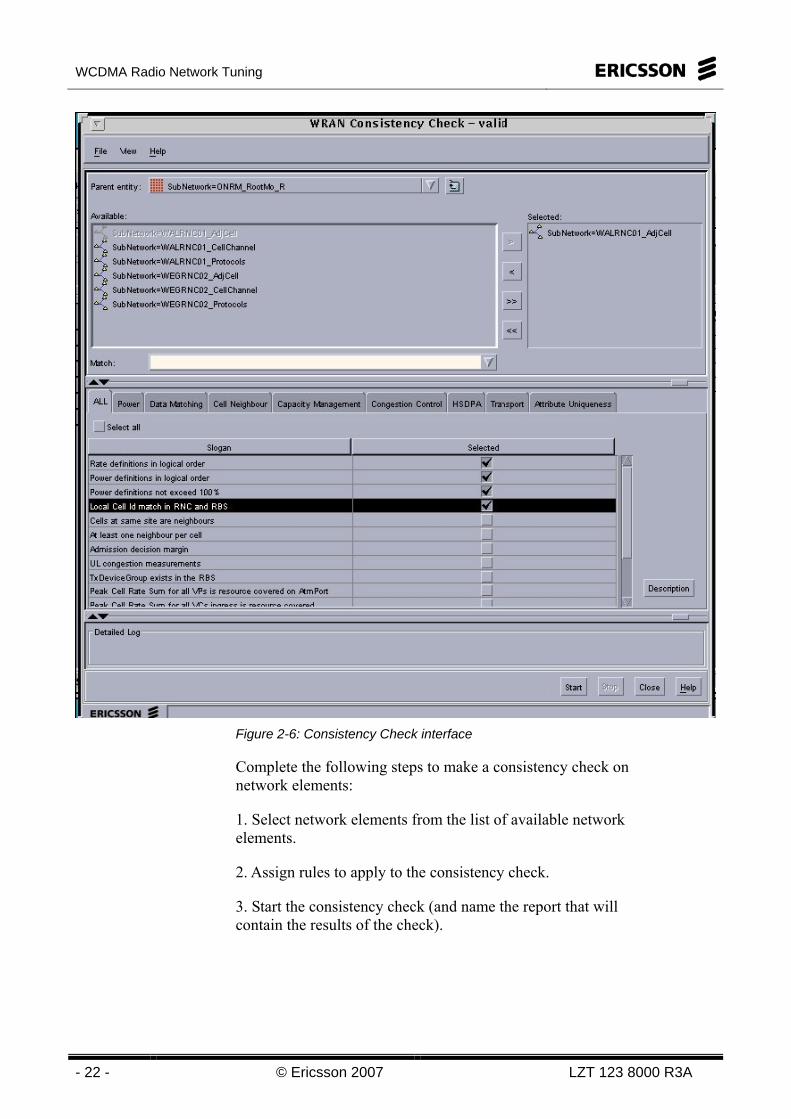
Figure 2-6: Consistency Check interface
Complete the following steps to make a consistency check on network elements:
1. Select network elements from the list of available network elements.
2. Assign rules to apply to the consistency check.
3. Start the consistency check (and name the report that will contain the results of the check).

Table of Contents
LZT 123 8000 R3A © Ericsson 2007 - 23 -
To select the network elements, first select a Parent Entity. If there are a number of parent entities they are listed. Network Elements contained in the Parent Entity are listed in the Available list. To select network elements from the Available list, click on a network element to highlight it and click the > button. The network element is displayed in the Selected list.
Rules determine the checks performed by consistency check. There are a number of rules you can apply to check aspects of the network, illustrated as follows:
Figure 2-7: Consistency Check Rules
The tabs show aspects of the network that can be checked. A number of rules apply to these aspects. For example, the Data Matching tab the rule Local Cell ID in RNC and RBS can be applied. The following individual tabs can be selected and select rules within the tabs:
• Power
• Data Matching
• Cell Neighbour
• Capacity Management
• Congestion Control
• HSDPA (High Speed Downlink Packet Access)
• Transport
• Attribute Uniqueness
WCDMA Radio Network Tuning
- 24 - © Ericsson 2007 LZT 123 8000 R3A
Click the Start button to start a consistency check. A consistency check generates a report file (.xml format) to show the results of the check. A dialog box is displayed to show the default name of report that will be generated. The default filename is generated from the current date and time. You can accept the default name or enter a new name. Click OK to start the consistency check. When the check is complete a message is displayed.
Consistency Check Reports
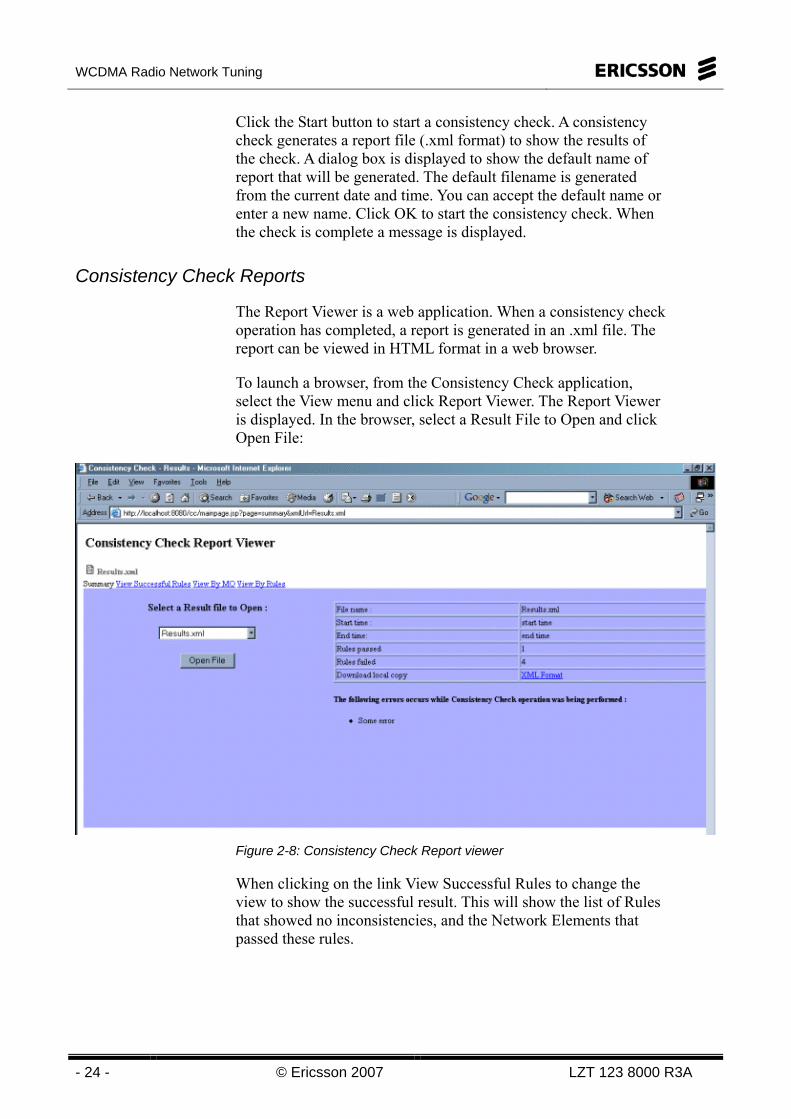
The Report Viewer is a web application. When a consistency check operation has completed, a report is generated in an .xml file. The report can be viewed in HTML format in a web browser.
To launch a browser, from the Consistency Check application, select the View menu and click Report Viewer. The Report Viewer is displayed. In the browser, select a Result File to Open and click Open File:
Figure 2-8: Consistency Check Report viewer
When clicking on the link View Successful Rules to change the view to show the successful result. This will show the list of Rules that showed no inconsistencies, and the Network Elements that passed these rules.
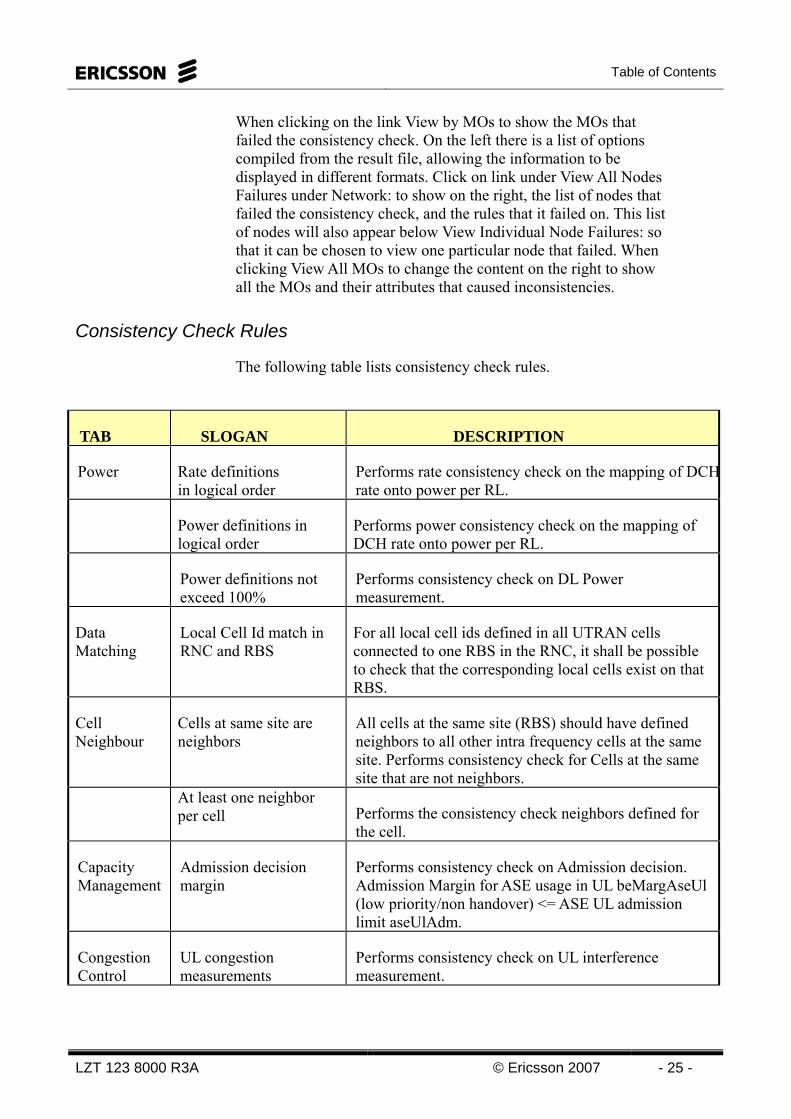
Table of Contents
LZT 123 8000 R3A © Ericsson 2007 - 25 -
When clicking on the link View by MOs to show the MOs that failed the consistency check. On the left there is a list of options compiled from the result file, allowing the information to be displayed in different formats. Click on link under View All Nodes Failures under Network: to show on the right, the list of nodes that failed the consistency check, and the rules that it failed on. This list of nodes will also appear below View Individual Node Failures: so that it can be chosen to view one particular node that failed. When clicking View All MOs to change the content on the right to show all the MOs and their attributes that caused inconsistencies.
Consistency Check Rules
The following table lists consistency check rules.
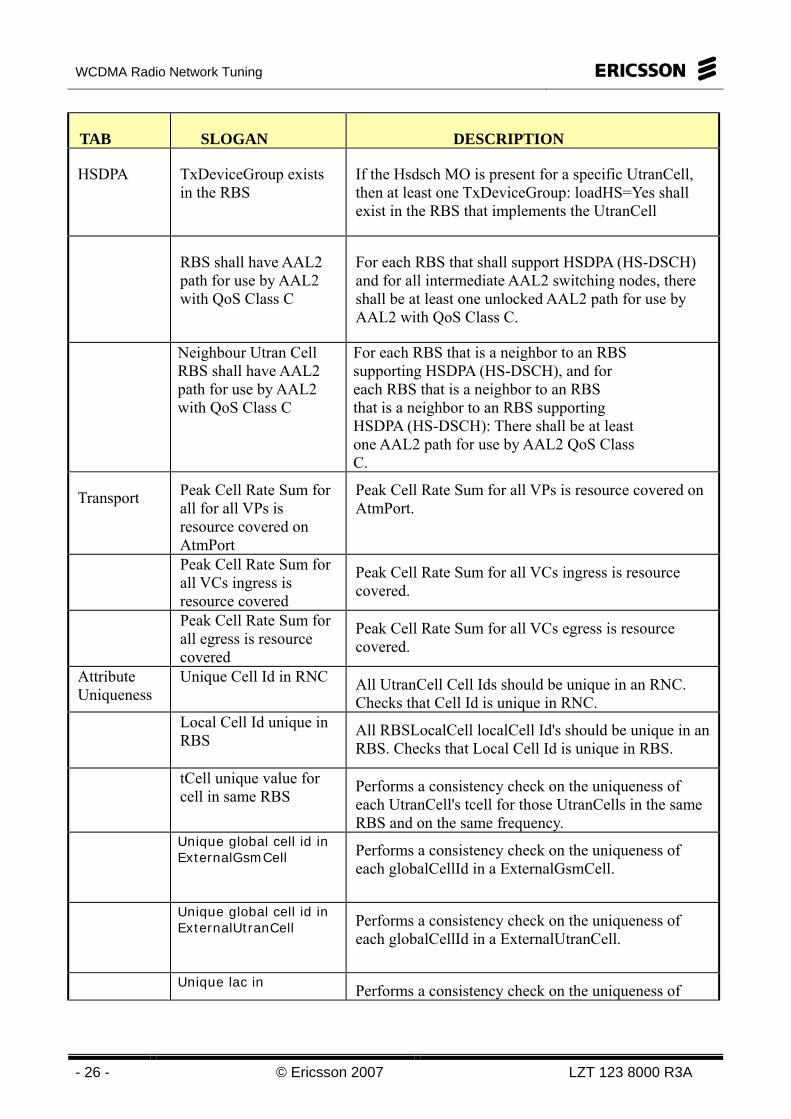
TAB SLOGAN DESCRIPTION
Power Rate definitions in logical order
Performs rate consistency check on the mapping of DCHrate onto power per RL.
Power definitions in logical order
Performs power consistency check on the mapping of DCH rate onto power per RL.
Power definitions not exceed 100%
Performs consistency check on DL Power measurement.
Data Matching
Local Cell Id match in RNC and RBS
For all local cell ids defined in all UTRAN cells connected to one RBS in the RNC, it shall be possible to check that the corresponding local cells exist on that RBS.
Cell Neighbour
Cells at same site are neighbors
All cells at the same site (RBS) should have defined neighbors to all other intra frequency cells at the same site. Performs consistency check for Cells at the same site that are not neighbors.
At least one neighbor per cell Performs the consistency check neighbors defined for
the cell.
Capacity Management
Admission decision margin
Performs consistency check on Admission decision. Admission Margin for ASE usage in UL beMargAseUl (low priority/non handover) <= ASE UL admission limit aseUlAdm.
Congestion Control
UL congestion measurements
Performs consistency check on UL interference measurement.
WCDMA Radio Network Tuning
- 26 - © Ericsson 2007 LZT 123 8000 R3A
TAB SLOGAN DESCRIPTION
HSDPA
TxDeviceGroup exists in the RBS
If the Hsdsch MO is present for a specific UtranCell, then at least one TxDeviceGroup: loadHS=Yes shall exist in the RBS that implements the UtranCell
RBS shall have AAL2 path for use by AAL2 with QoS Class C
For each RBS that shall support HSDPA (HS-DSCH) and for all intermediate AAL2 switching nodes, there shall be at least one unlocked AAL2 path for use by AAL2 with QoS Class C.
Neighbour Utran Cell RBS shall have AAL2 path for use by AAL2 with QoS Class C
For each RBS that is a neighbor to an RBS supporting HSDPA (HS-DSCH), and for each RBS that is a neighbor to an RBS that is a neighbor to an RBS supporting HSDPA (HS-DSCH): There shall be at least one AAL2 path for use by AAL2 QoS Class C.
Transport Peak Cell Rate Sum for all for all VPs is resource covered on AtmPort
Peak Cell Rate Sum for all VPs is resource covered on AtmPort.
Peak Cell Rate Sum for all VCs ingress is resource covered
Peak Cell Rate Sum for all VCs ingress is resource covered.
Peak Cell Rate Sum for all egress is resource covered
Peak Cell Rate Sum for all VCs egress is resource covered.
Attribute Uniqueness
Unique Cell Id in RNC All UtranCell Cell Ids should be unique in an RNC.
Checks that Cell Id is unique in RNC. Local Cell Id unique in
RBS
All RBSLocalCell localCell Id's should be unique in an RBS. Checks that Local Cell Id is unique in RBS.
tCell unique value for cell in same RBS
Performs a consistency check on the uniqueness of each UtranCell's tcell for those UtranCells in the same RBS and on the same frequency.
Unique global cell id in ExternalGsmCell
Performs a consistency check on the uniqueness of each globalCellId in a ExternalGsmCell.
Unique global cell id in ExternalUtranCell
Performs a consistency check on the uniqueness of each globalCellId in a ExternalUtranCell.
Unique lac in Performs a consistency check on the uniqueness of
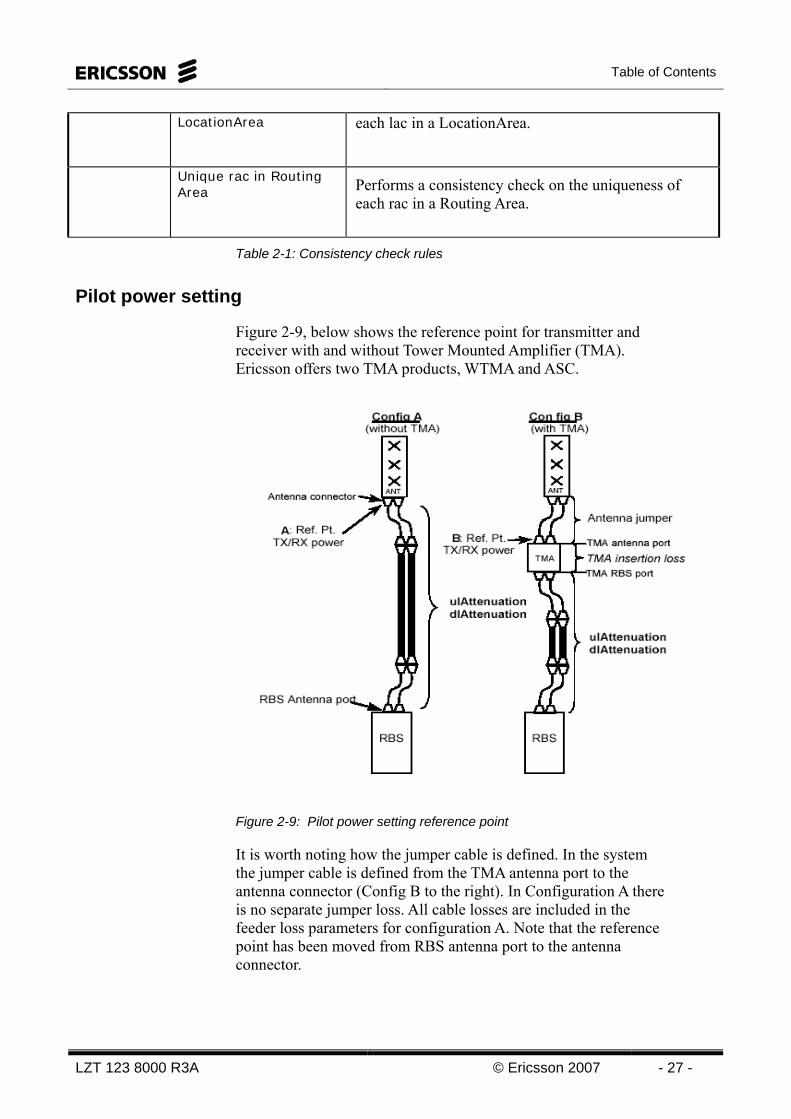
Table of Contents
LZT 123 8000 R3A © Ericsson 2007 - 27 -
LocationArea
each lac in a LocationArea.
Unique rac in Routing Area
Performs a consistency check on the uniqueness of each rac in a Routing Area.
Table 2-1: Consistency check rules
Pilot power setting
Figure 2-9, below shows the reference point for transmitter and receiver with and without Tower Mounted Amplifier (TMA). Ericsson offers two TMA products, WTMA and ASC.
Figure 2-9: Pilot power setting reference point
It is worth noting how the jumper cable is defined. In the system the jumper cable is defined from the TMA antenna port to the antenna connector (Config B to the right). In Configuration A there is no separate jumper loss. All cable losses are included in the feeder loss parameters for configuration A. Note that the reference point has been moved from RBS antenna port to the antenna connector.
WCDMA Radio Network Tuning
- 28 - © Ericsson 2007 LZT 123 8000 R3A
The pilot power setting at the system reference point, equal in all cells, is now calculated with the following equation:
ASCfCPICHsettingCPICH LLPP −−= dim,dim,,
where
PCPICH,setting is the setting of the parameter primaryCpichPower
PCPICH,dim is the dimensioned pilot power value at the RBS antenna port
Lf,dim is the dimensioned feeder loss value for the network
LASC is the insertion loss of the TMA, including jumper loss
The pilot power and the feeder losses are entered into the system with the parameters primaryCpichPower, ulattenuation and dlattenuation.
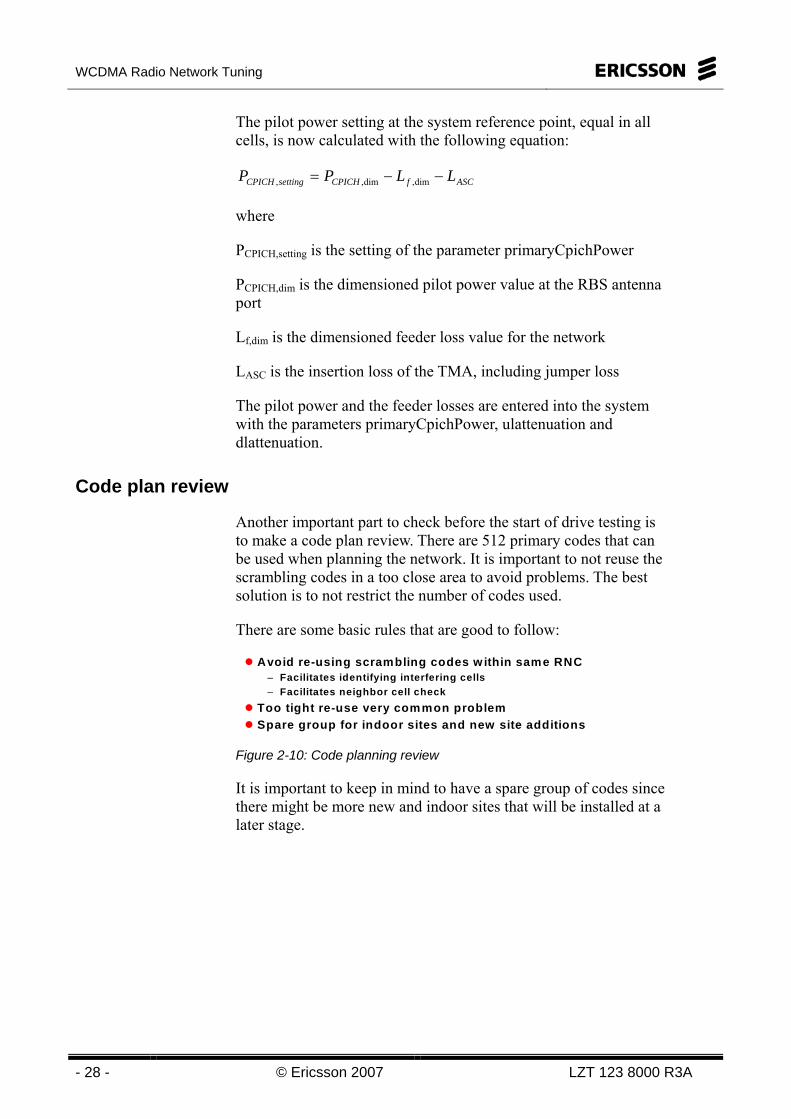
Code plan review
Another important part to check before the start of drive testing is to make a code plan review. There are 512 primary codes that can be used when planning the network. It is important to not reuse the scrambling codes in a too close area to avoid problems. The best solution is to not restrict the number of codes used.
There are some basic rules that are good to follow:
Avoid re-using scrambling codes w ithin same RNC– Facilitates identifying interfering cells– Facilitates neighbor cell check
Too tight re-use very common problemSpare group for indoor sites and new site additions
Figure 2-10: Code planning review
It is important to keep in mind to have a spare group of codes since there might be more new and indoor sites that will be installed at a later stage.
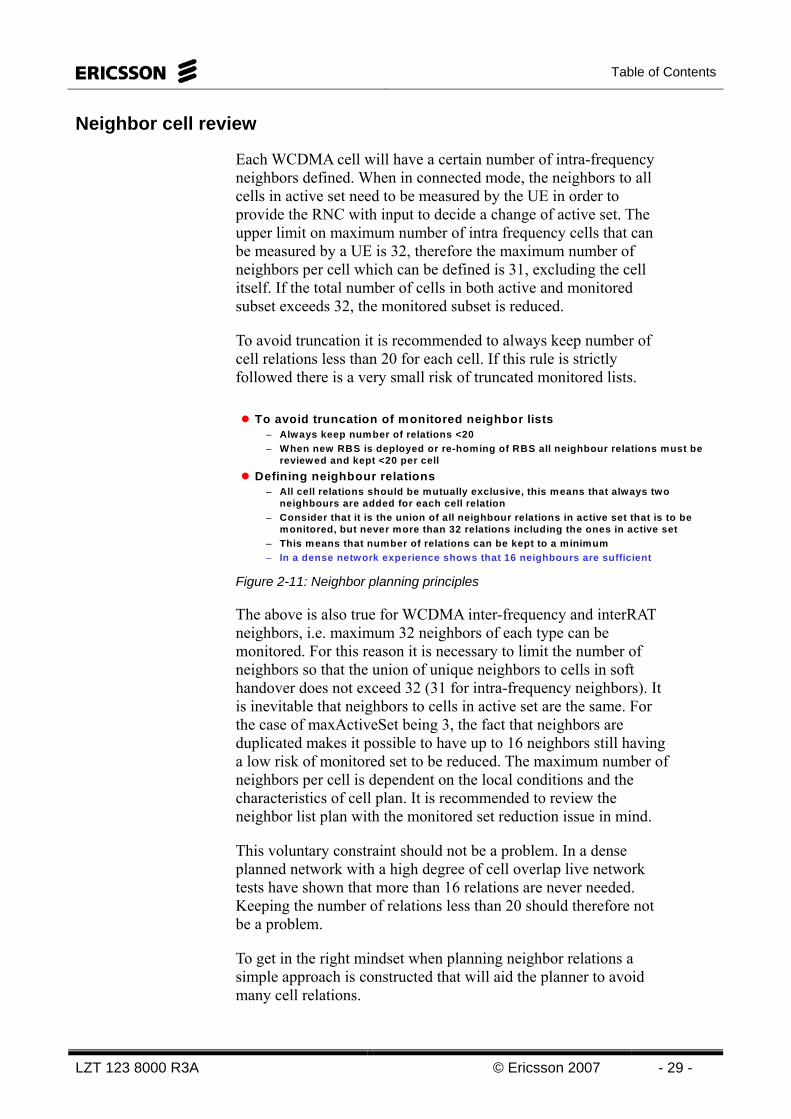
Table of Contents
LZT 123 8000 R3A © Ericsson 2007 - 29 -
Neighbor cell review
Each WCDMA cell will have a certain number of intra-frequency neighbors defined. When in connected mode, the neighbors to all cells in active set need to be measured by the UE in order to provide the RNC with input to decide a change of active set. The upper limit on maximum number of intra frequency cells that can be measured by a UE is 32, therefore the maximum number of neighbors per cell which can be defined is 31, excluding the cell itself. If the total number of cells in both active and monitored subset exceeds 32, the monitored subset is reduced.
To avoid truncation it is recommended to always keep number of cell relations less than 20 for each cell. If this rule is strictly followed there is a very small risk of truncated monitored lists.
To avoid truncation of monitored neighbor lists– Always keep number of relations <20– When new RBS is deployed or re-homing of RBS all neighbour relations must be
reviewed and kept <20 per cellDefining neighbour relations
– All cell relations should be mutually exclusive, this means that always two neighbours are added for each cell relation
– Consider that it is the union of all neighbour relations in active set that is to be monitored, but never more than 32 relations including the ones in active set
– This means that number of relations can be kept to a minimum– In a dense network experience shows that 16 neighbours are sufficient
Figure 2-11: Neighbor planning principles
The above is also true for WCDMA inter-frequency and interRAT neighbors, i.e. maximum 32 neighbors of each type can be monitored. For this reason it is necessary to limit the number of neighbors so that the union of unique neighbors to cells in soft handover does not exceed 32 (31 for intra-frequency neighbors). It is inevitable that neighbors to cells in active set are the same. For the case of maxActiveSet being 3, the fact that neighbors are duplicated makes it possible to have up to 16 neighbors still having a low risk of monitored set to be reduced. The maximum number of neighbors per cell is dependent on the local conditions and the characteristics of cell plan. It is recommended to review the neighbor list plan with the monitored set reduction issue in mind.
This voluntary constraint should not be a problem. In a dense planned network with a high degree of cell overlap live network tests have shown that more than 16 relations are never needed. Keeping the number of relations less than 20 should therefore not be a problem.
To get in the right mindset when planning neighbor relations a simple approach is constructed that will aid the planner to avoid many cell relations.
WCDMA Radio Network Tuning
- 30 - © Ericsson 2007 LZT 123 8000 R3A
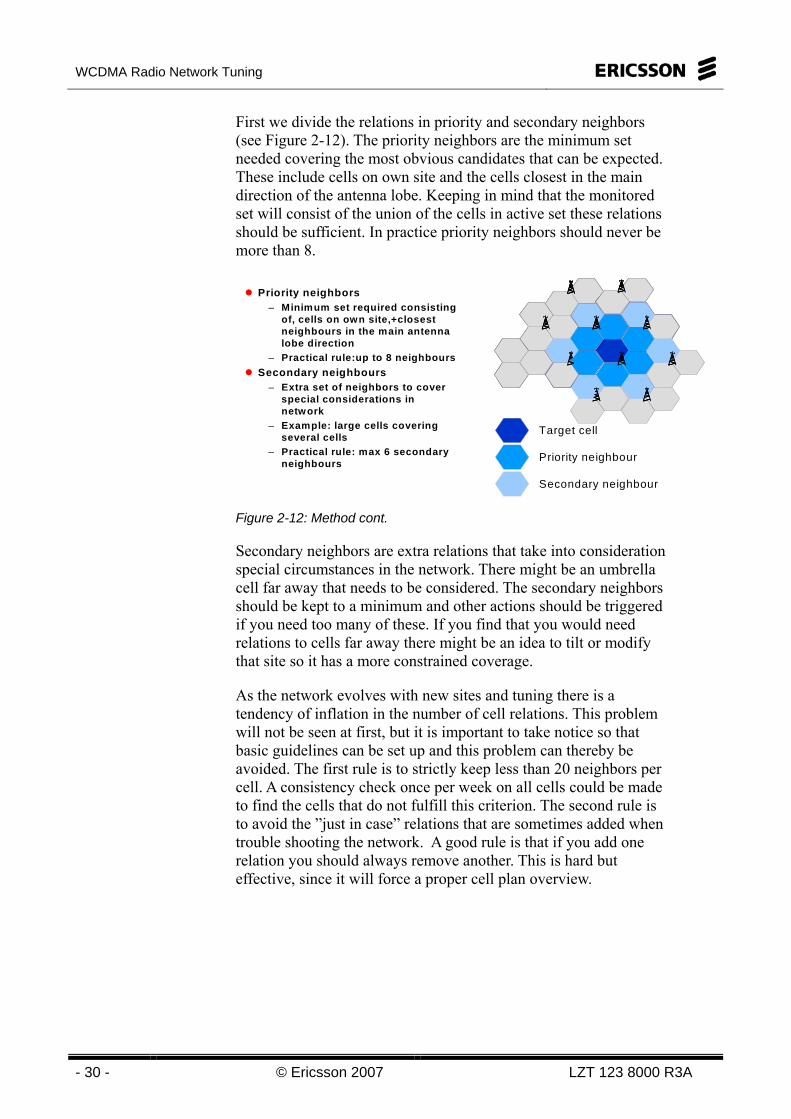
First we divide the relations in priority and secondary neighbors (see Figure 2-12). The priority neighbors are the minimum set needed covering the most obvious candidates that can be expected. These include cells on own site and the cells closest in the main direction of the antenna lobe. Keeping in mind that the monitored set will consist of the union of the cells in active set these relations should be sufficient. In practice priority neighbors should never be more than 8.
A1
Priority neighbors– Minimum set required consisting
of, cells on own site,+closest neighbours in the main antenna lobe direction
– Practical rule:up to 8 neighboursSecondary neighbours
– Extra set of neighbors to cover special considerations in network
– Example: large cells covering several cells
– Practical rule: max 6 secondary neighbours
C3C2
C1B3
B2
B1
G3G2
Target cell
Priority neighbour
Secondary neighbour
Figure 2-12: Method cont.
Secondary neighbors are extra relations that take into consideration special circumstances in the network. There might be an umbrella cell far away that needs to be considered. The secondary neighbors should be kept to a minimum and other actions should be triggered if you need too many of these. If you find that you would need relations to cells far away there might be an idea to tilt or modify that site so it has a more constrained coverage.
As the network evolves with new sites and tuning there is a tendency of inflation in the number of cell relations. This problem will not be seen at first, but it is important to take notice so that basic guidelines can be set up and this problem can thereby be avoided. The first rule is to strictly keep less than 20 neighbors per cell. A consistency check once per week on all cells could be made to find the cells that do not fulfill this criterion. The second rule is to avoid the ”just in case” relations that are sometimes added when trouble shooting the network. A good rule is that if you add one relation you should always remove another. This is hard but effective, since it will force a proper cell plan overview.
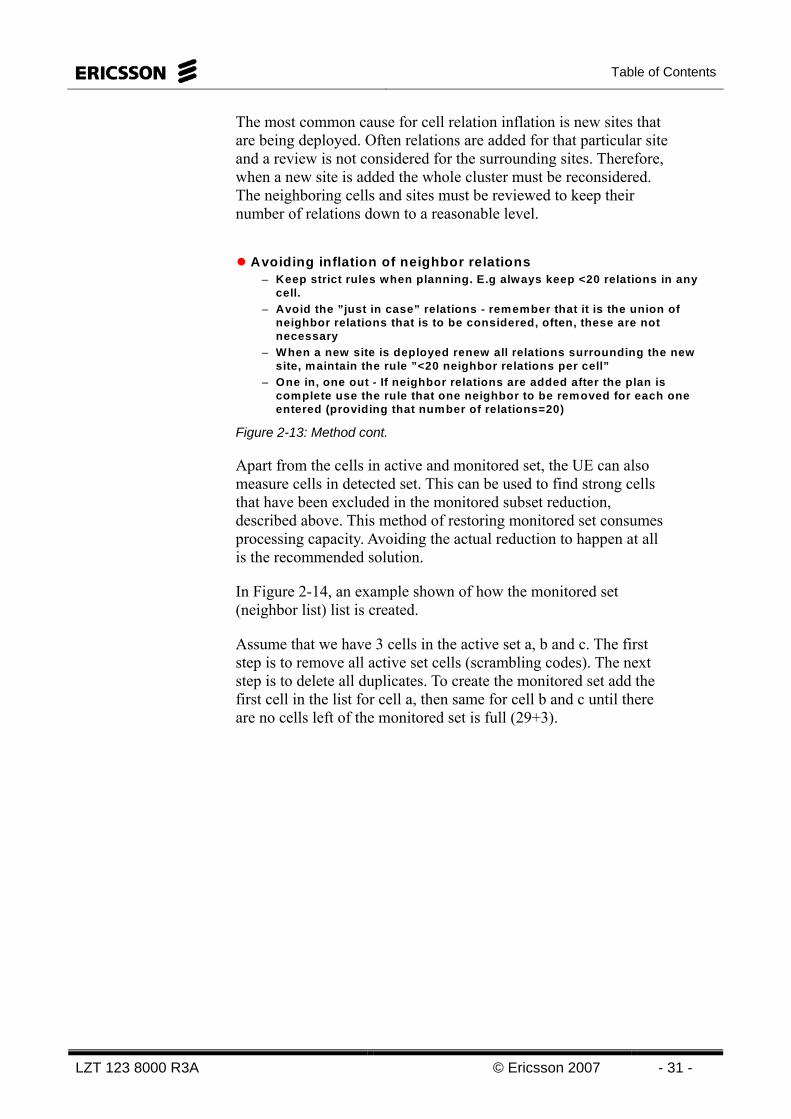
Table of Contents
LZT 123 8000 R3A © Ericsson 2007 - 31 -
The most common cause for cell relation inflation is new sites that are being deployed. Often relations are added for that particular site and a review is not considered for the surrounding sites. Therefore, when a new site is added the whole cluster must be reconsidered. The neighboring cells and sites must be reviewed to keep their number of relations down to a reasonable level.
Avoiding inflation of neighbor relations– Keep strict rules when planning. E.g always keep <20 relations in any
cell.– Avoid the ”just in case” relations - remember that it is the union of
neighbor relations that is to be considered, often, these are not necessary
– When a new site is deployed renew all relations surrounding the new site, maintain the rule ”<20 neighbor relations per cell”
– One in, one out - If neighbor relations are added after the plan is complete use the rule that one neighbor to be removed for each one entered (providing that number of relations=20)
Figure 2-13: Method cont.
Apart from the cells in active and monitored set, the UE can also measure cells in detected set. This can be used to find strong cells that have been excluded in the monitored subset reduction, described above. This method of restoring monitored set consumes processing capacity. Avoiding the actual reduction to happen at all is the recommended solution.
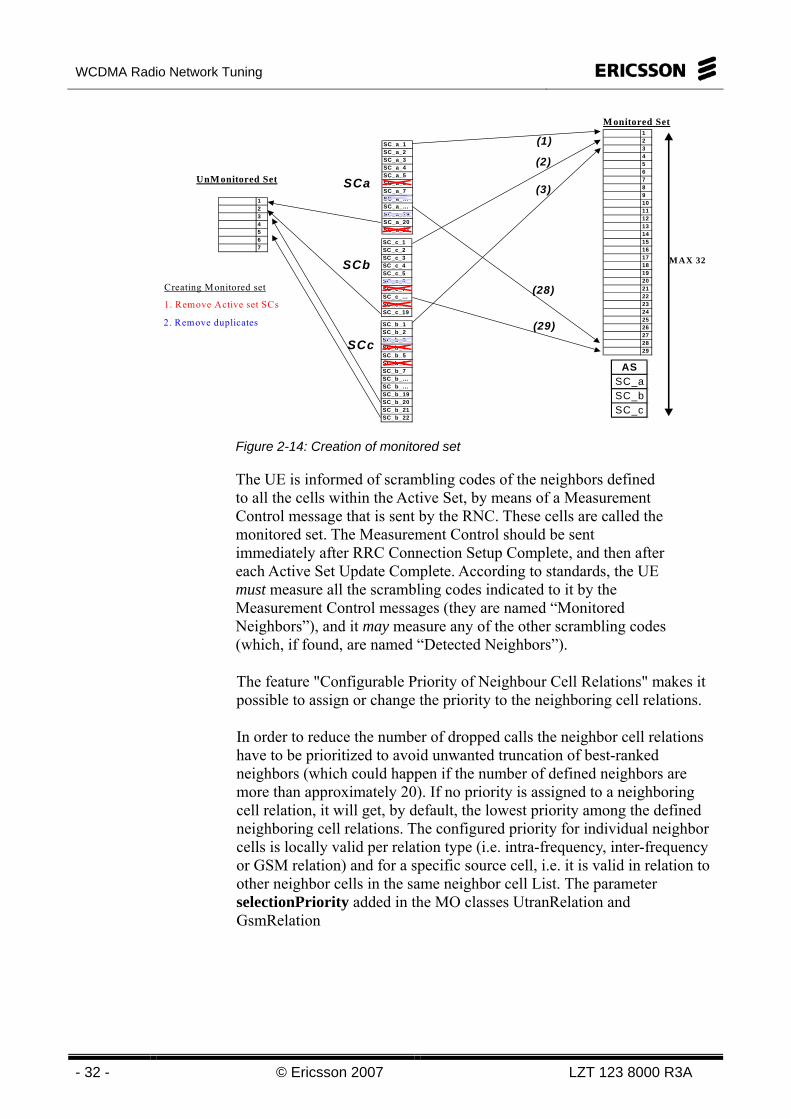
In Figure 2-14, an example shown of how the monitored set (neighbor list) list is created.
Assume that we have 3 cells in the active set a, b and c. The first step is to remove all active set cells (scrambling codes). The next step is to delete all duplicates. To create the monitored set add the first cell in the list for cell a, then same for cell b and c until there are no cells left of the monitored set is full (29+3).
WCDMA Radio Network Tuning
- 32 - © Ericsson 2007 LZT 123 8000 R3A
SC_a_1SC_a_2SC_a_3SC_a_4SC_a_5SC_a_6SC_a_7SC_a_…SC_a_…SC_a_19SC_a_20SC_a_21
SC_b_1SC_b_2SC_b_3SC_b_4SC_b_5SC_b_6SC_b_7SC_b_…SC_b_…SC_b_19SC_b_20SC_b_21SC_b_22
SC_c_1SC_c_2SC_c_3SC_c_4SC_c_5SC_c_6SC_c_7SC_c_…SC_c_…SC_c_19
SCa
SCc
SCb
1234567891011121314151617181920212223242526272829
(1)
(2)
(3)
(28)
(29)
ASSC_aSC_bSC_c
1234567
UnM onitored Set
M onitored Set
MAX 32
1. Remove Active set SCs
2. Remove duplicates
Creating Monitored set
Figure 2-14: Creation of monitored set
The UE is informed of scrambling codes of the neighbors defined to all the cells within the Active Set, by means of a Measurement Control message that is sent by the RNC. These cells are called the monitored set. The Measurement Control should be sent immediately after RRC Connection Setup Complete, and then after each Active Set Update Complete. According to standards, the UE must measure all the scrambling codes indicated to it by the Measurement Control messages (they are named “Monitored Neighbors”), and it may measure any of the other scrambling codes (which, if found, are named “Detected Neighbors”).
The feature "Configurable Priority of Neighbour Cell Relations" makes it possible to assign or change the priority to the neighboring cell relations.
In order to reduce the number of dropped calls the neighbor cell relations have to be prioritized to avoid unwanted truncation of best-ranked neighbors (which could happen if the number of defined neighbors are more than approximately 20). If no priority is assigned to a neighboring cell relation, it will get, by default, the lowest priority among the defined neighboring cell relations. The configured priority for individual neighbor cells is locally valid per relation type (i.e. intra-frequency, inter-frequency or GSM relation) and for a specific source cell, i.e. it is valid in relation to other neighbor cells in the same neighbor cell List. The parameter selectionPriority added in the MO classes UtranRelation and GsmRelation
Table of Contents
LZT 123 8000 R3A © Ericsson 2007 - 33 -
SITE STATUS
The purpose of checking the site status is to make sure that all sites are on air in the specific area were the drive tests should take place.
Checking the site status also includes checking that there are no swapped feeders and checking the overall performance of the site. These things are very hard to find during a drive test and checking this will decrease the amount of time spent on hardware faults and configuration faults.
SETUP OF DRIVE TEST TOOLS
Setting up the drive test tools are done in two steps:
• Configuration
• Physical setup
Configuration
For a drive test the following information has to be available
• Voice test numbers with a answering machine connected (usually a MSC number given by the operator)
• FTP Server address and login for uploading and downloading data
• APN configuration of the SIM card
• Test files in various sizes (1025kb, 3MB etc.) depending on the demanded PS tests
• TEMS Cell file (Sites date configuration)
Creating a TEMS cel file
The TEMS Cel file, CEL format is a unified version allowing both GSM and WCDMA cells in the same file. TEMS Investigation can present information on individual cells in the UMTS network. In particular, it is possible to draw cells on maps and to display cell names in various windows. Cell data is also made use of in logfile reports.
Cell data can be provided in two ways:
WCDMA Radio Network Tuning
- 34 - © Ericsson 2007 LZT 123 8000 R3A
• in a plain-text XML file (*.xml) whose format is common to several TEMS products.
• in a file with a plain-text, TEMS Investigation specific format (*.cel). The current version of this format allows mixing of both GSM and WCDMA cells in one file.
Excel
If a spreadsheet application to edit CEL files is used, be sure to save them in tab-delimited plain text format. Otherwise, unwanted characters might be inserted which prevent TEMS Investigation from interpreting the file correctly.
The file is in ASCII format with tab-delimited data. Each row should not contain more than 600 characters, including <CR><NL>. There is no restriction on the number of cells in the file, but very large cell files will slow the application down noticeably.
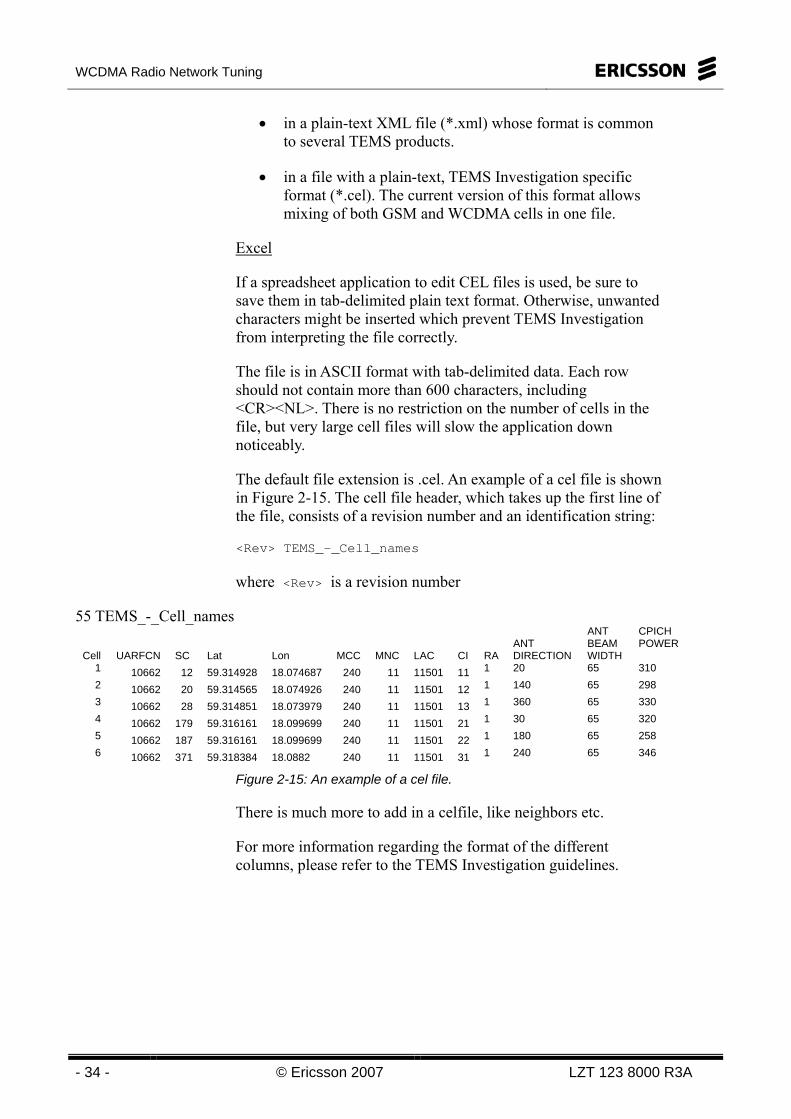
The default file extension is .cel. An example of a cel file is shown in Figure 2-15. The cell file header, which takes up the first line of the file, consists of a revision number and an identification string:
<Rev> TEMS_-_Cell_names
where <Rev> is a revision number
55 TEMS_-_Cell_names Cell UARFCN SC Lat Lon MCC MNC LAC CI
RA
ANT DIRECTION
ANT BEAM WIDTH
CPICH POWER
1 10662 12 59.314928 18.074687 240 11 11501 11 1 20 65 310 2 10662 20 59.314565 18.074926 240 11 11501 12 1 140 65 298 3 10662 28 59.314851 18.073979 240 11 11501 13 1 360 65 330 4 10662 179 59.316161 18.099699 240 11 11501 21 1 30 65 320 5 10662 187 59.316161 18.099699 240 11 11501 22 1 180 65 258 6 10662 371 59.318384 18.0882 240 11 11501 31 1 240 65 346
Figure 2-15: An example of a cel file.
There is much more to add in a celfile, like neighbors etc.
For more information regarding the format of the different columns, please refer to the TEMS Investigation guidelines.
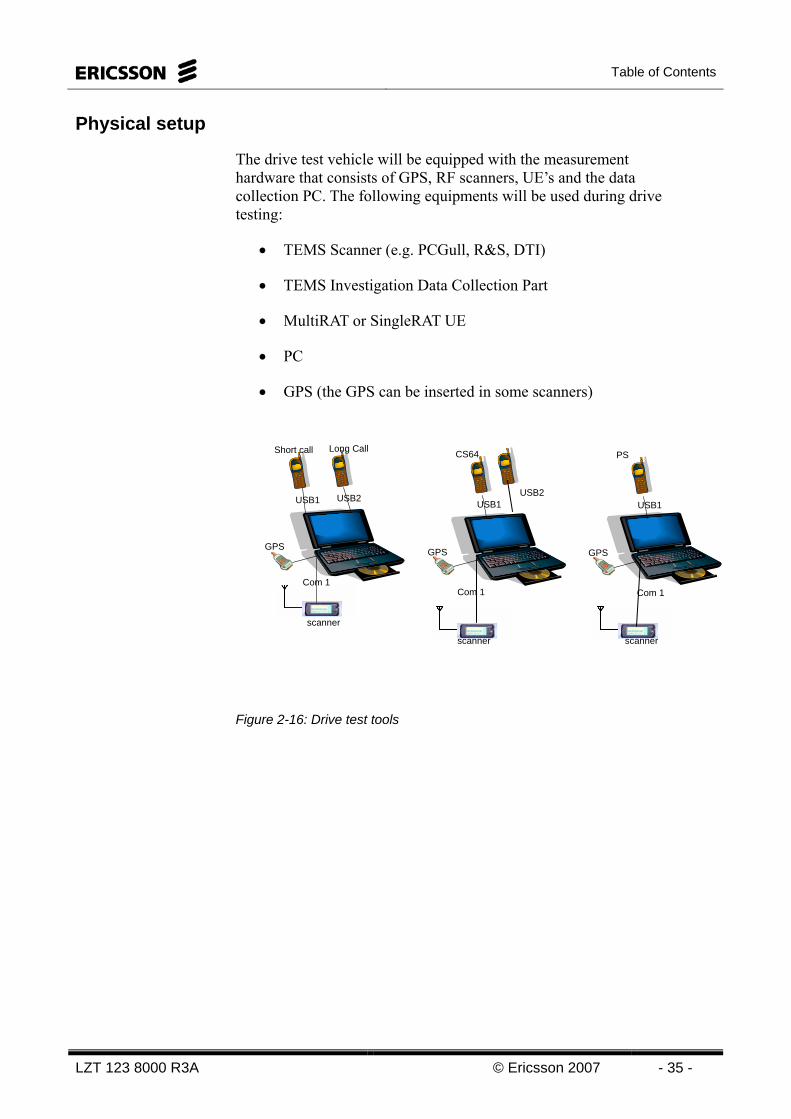
Table of Contents
LZT 123 8000 R3A © Ericsson 2007 - 35 -
Physical setup
The drive test vehicle will be equipped with the measurement hardware that consists of GPS, RF scanners, UE’s and the data collection PC. The following equipments will be used during drive testing:
• TEMS Scanner (e.g. PCGull, R&S, DTI)
• TEMS Investigation Data Collection Part
• MultiRAT or SingleRAT UE
• PC
• GPS (the GPS can be inserted in some scanners)
Figure 2-16: Drive test tools
USB2 USB1
Com 1
scanner
Short call Long Call
USB1
CS64
GPS GPS
USB1
PS
GPS
USB2
scanner scanner
Com 1 Com 1
WCDMA Radio Network Tuning
- 36 - © Ericsson 2007 LZT 123 8000 R3A
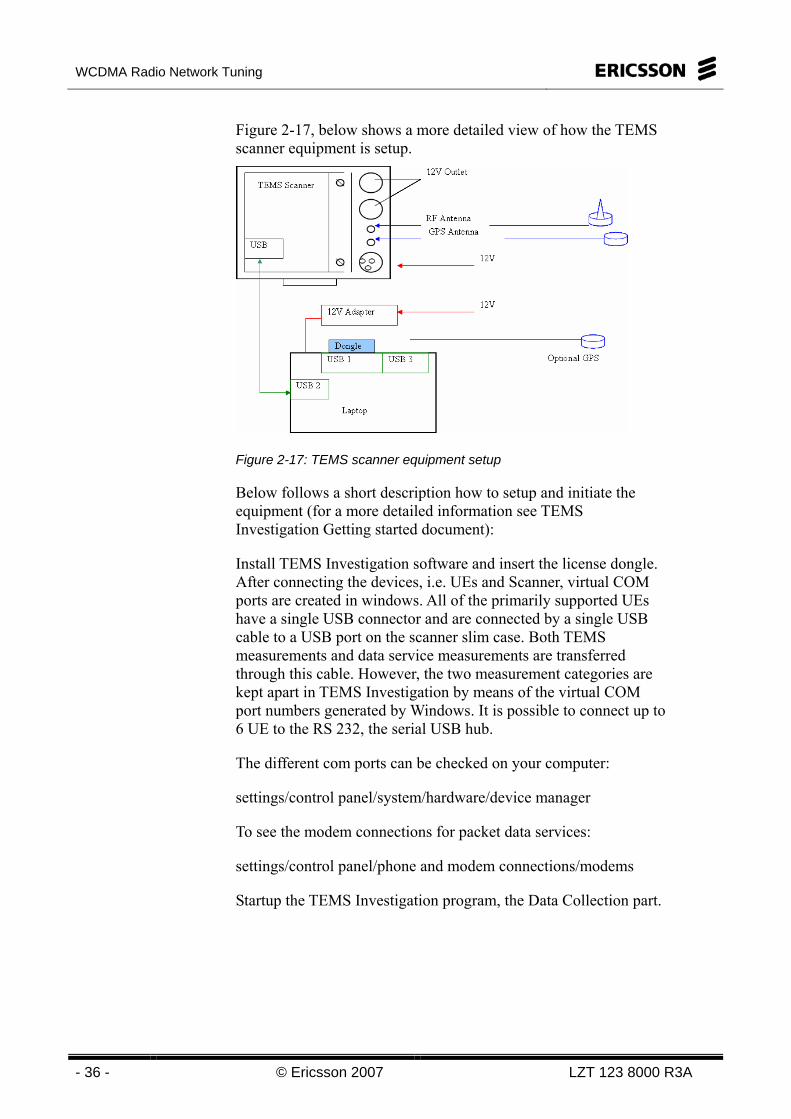
Figure 2-17, below shows a more detailed view of how the TEMS scanner equipment is setup.
Figure 2-17: TEMS scanner equipment setup
Below follows a short description how to setup and initiate the equipment (for a more detailed information see TEMS Investigation Getting started document):
Install TEMS Investigation software and insert the license dongle. After connecting the devices, i.e. UEs and Scanner, virtual COM ports are created in windows. All of the primarily supported UEs have a single USB connector and are connected by a single USB cable to a USB port on the scanner slim case. Both TEMS measurements and data service measurements are transferred through this cable. However, the two measurement categories are kept apart in TEMS Investigation by means of the virtual COM port numbers generated by Windows. It is possible to connect up to 6 UE to the RS 232, the serial USB hub.
The different com ports can be checked on your computer:
settings/control panel/system/hardware/device manager
To see the modem connections for packet data services:
settings/control panel/phone and modem connections/modems
Startup the TEMS Investigation program, the Data Collection part.
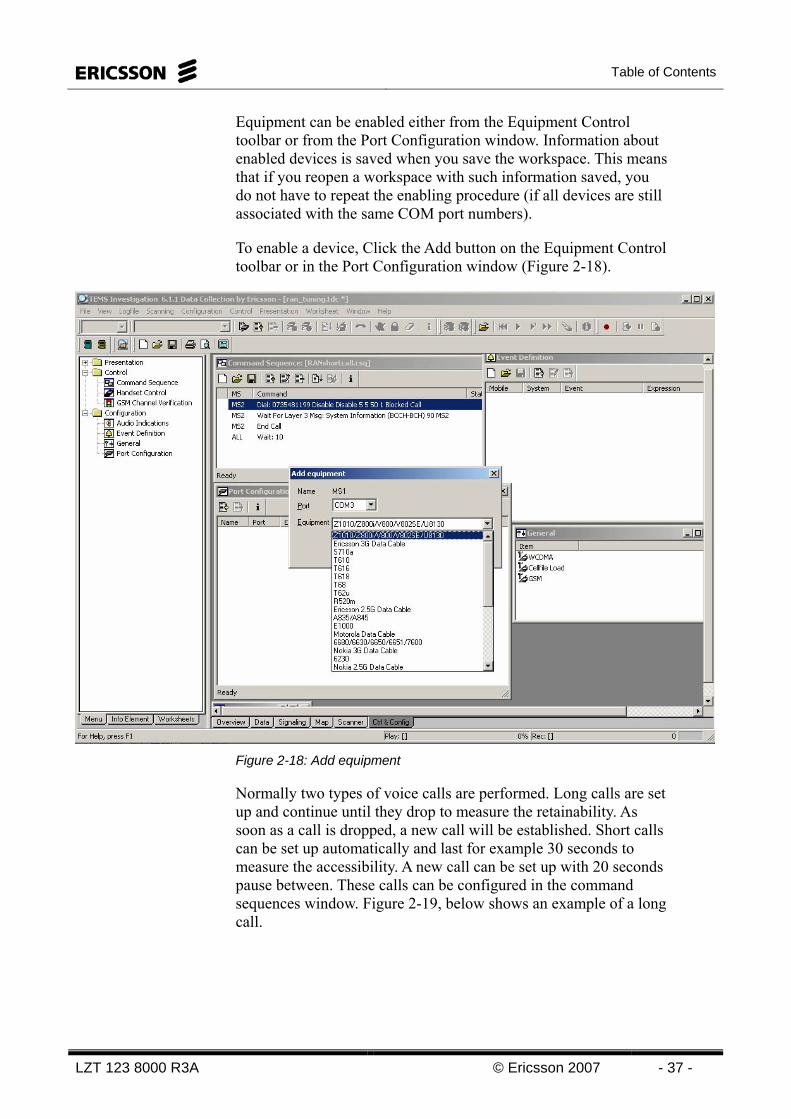
Table of Contents
LZT 123 8000 R3A © Ericsson 2007 - 37 -
Equipment can be enabled either from the Equipment Control toolbar or from the Port Configuration window. Information about enabled devices is saved when you save the workspace. This means that if you reopen a workspace with such information saved, you do not have to repeat the enabling procedure (if all devices are still associated with the same COM port numbers).
To enable a device, Click the Add button on the Equipment Control toolbar or in the Port Configuration window (Figure 2-18).
Figure 2-18: Add equipment
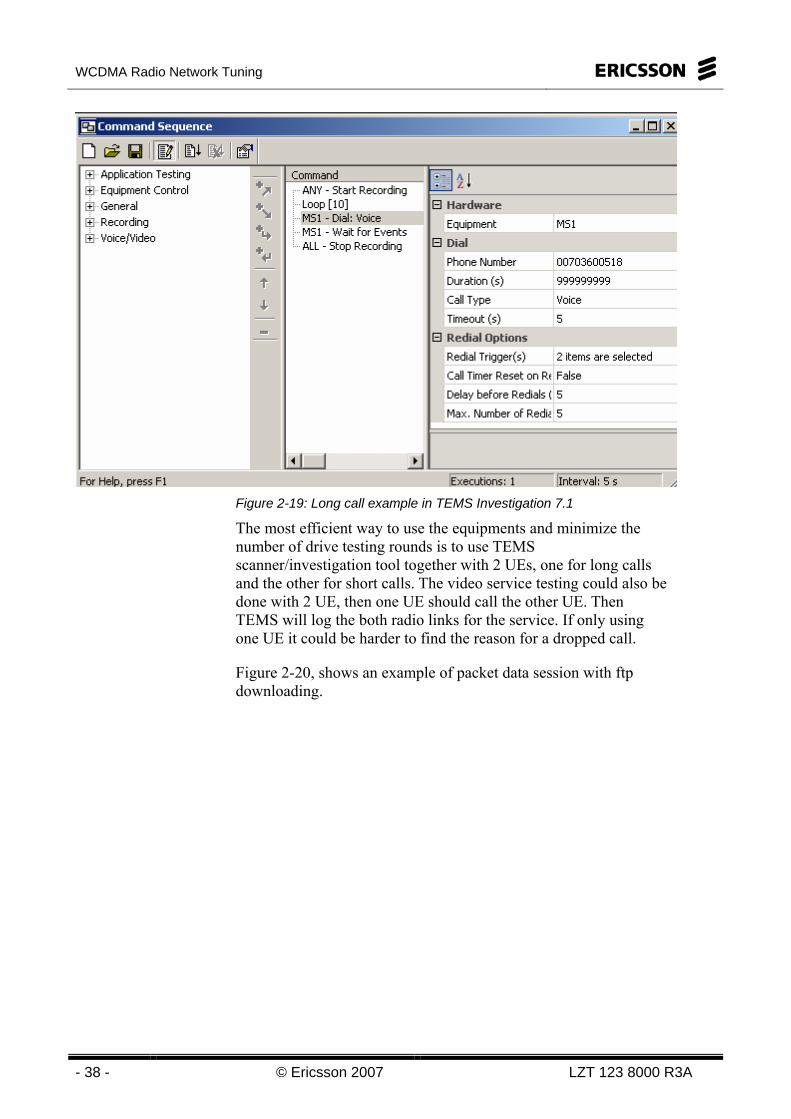
Normally two types of voice calls are performed. Long calls are set up and continue until they drop to measure the retainability. As soon as a call is dropped, a new call will be established. Short calls can be set up automatically and last for example 30 seconds to measure the accessibility. A new call can be set up with 20 seconds pause between. These calls can be configured in the command sequences window. Figure 2-19, below shows an example of a long call.
WCDMA Radio Network Tuning
- 38 - © Ericsson 2007 LZT 123 8000 R3A
Figure 2-19: Long call example in TEMS Investigation 7.1
The most efficient way to use the equipments and minimize the number of drive testing rounds is to use TEMS scanner/investigation tool together with 2 UEs, one for long calls and the other for short calls. The video service testing could also be done with 2 UE, then one UE should call the other UE. Then TEMS will log the both radio links for the service. If only using one UE it could be harder to find the reason for a dropped call.
Figure 2-20, shows an example of packet data session with ftp downloading.
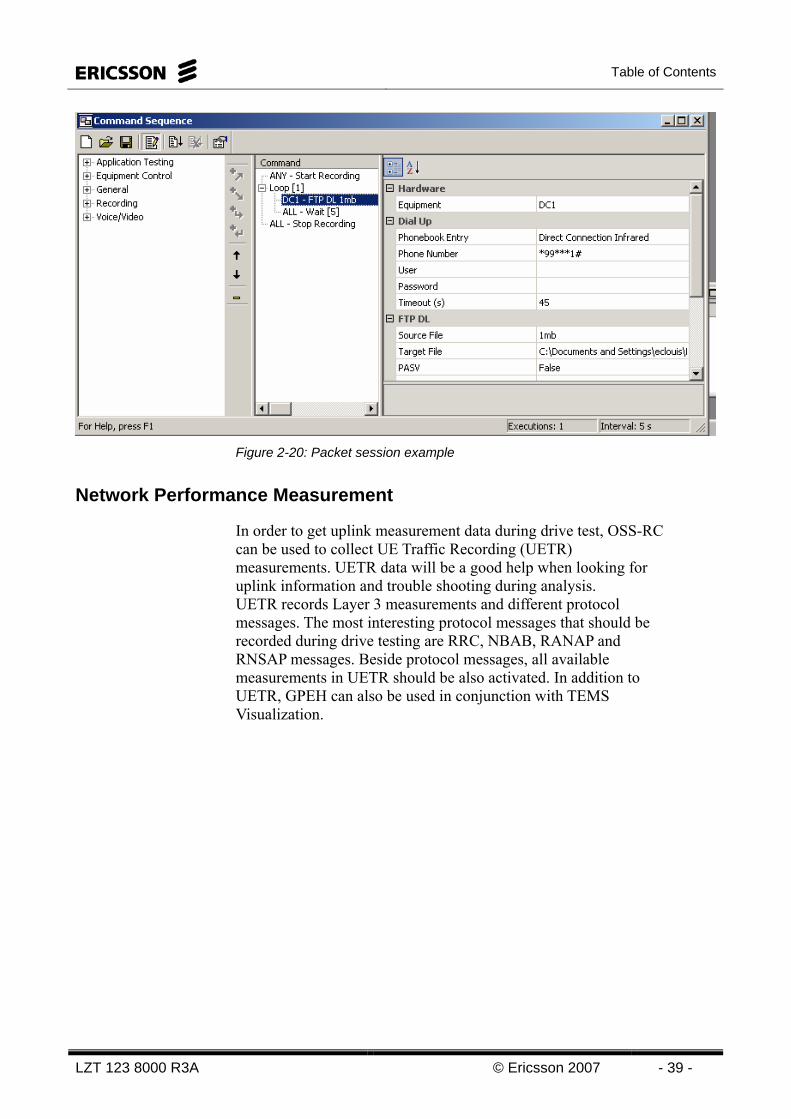
Table of Contents
LZT 123 8000 R3A © Ericsson 2007 - 39 -
Figure 2-20: Packet session example
Network Performance Measurement
In order to get uplink measurement data during drive test, OSS-RC can be used to collect UE Traffic Recording (UETR) measurements. UETR data will be a good help when looking for uplink information and trouble shooting during analysis. UETR records Layer 3 measurements and different protocol messages. The most interesting protocol messages that should be recorded during drive testing are RRC, NBAB, RANAP and RNSAP messages. Beside protocol messages, all available measurements in UETR should be also activated. In addition to UETR, GPEH can also be used in conjunction with TEMS Visualization.
WCDMA Radio Network Tuning
- 40 - © Ericsson 2007 LZT 123 8000 R3A
Intentionally blank
Table of Contents
LZT 123 8000 R3A © Ericsson 2007 - 41 -
3 Pilot Tuning
Objectives
Upon completion of this chapter the student will be able to:
• Explain and perform the process of pilot tuning
• Explain what data to collect with TEMS Scanner
• Collect and export TEMS Scanner data
• Post process data using TEMS Investigation Data collection and, TEMS Investigation Route Analysis
• Analyze and interpret the collected data in order to improve:
o Coverage
o Interference
o Missing neighbor cases
• Implement changes in order to improve the performance.
Figure 3-1: Chapter Objectives
WCDMA Radio Network Tuning
- 42 - © Ericsson 2007 LZT 123 8000 R3A
Intentionally blank

Table of Contents
LZT 123 8000 R3A © Ericsson 2007 - 43 -
DATA COLLECTION/DRIVE TESTING Currently there is a number of data collection/drive testing tools to be used:
• TEMS Investigation
• GPEH / UETR
Prior to start of drive testing check that for concerned clusters
• All cells in cluster and neighbors to cluster are operational and allowed for access
• No other activities are planned in cluster during drive testing
• No other activities are planned on the core network side during drive testing or know which activities are planned
During the first drive test phase, TEMS Investigation is used to perform scanner measurements as well as voice call measurements.
The scanner measurements are used to evaluate the CPICH coverage and quality of the radio environment, whereas the UE measurements give a first impression of system performance.
TEMS INVESTIGATION
The following parts describe how data is collected with TEMS Investigation in the initial tuning part.
Figure 3-2: Pilot scanning plus voice call measurements
Short call Long call

WCDMA Radio Network Tuning
- 44 - © Ericsson 2007 LZT 123 8000 R3A
The main difference between GSM and WCDMA is that in the GSM case, the main source of interference is cells using co- or adjacent frequencies, whereas in WCDMA, all cells are transmitting with the same frequency (1 carrier case). Thus all signals from channels not included in the active set cause interference. Most interference thus often comes from the neighboring cells that are currently outside the active set.
Geographical areas in the cluster where the coverage or interference targets are not met or where the coverage or interference deviates from the design criteria should be analyzed.
Scanner Measurements
The Scanner Measurements obtained during the drive test phase are used to evaluate
• SCH offset problems
• Crossed feeder issues (DL) 10-20 % of sites
• Code plan verification
• Coverage verification, i.e. reasonable CPICH setting and correct antenna direction.
• Interference problems, i.e. cell overlap and pilot pollution.
• Handover areas can be used to detect missing neighbors.
The basic measurements of the scanner are:
• CPICH RSCP
and
• CPICH Ec/No
The received signal code power (RSCP) is the received power of the CPICH channel. The serving cell RSCP equals the value of Ec, which is a pure coverage indicator in an unloaded network.
The Ec/No distribution is of great interest in the network characterization, as this describes how much load it is possible to have in the network and to indicate excessive interference from common channels. Furthermore Ec/No is used for pilot detection and channel estimation.
Figure 3-3, shows the 3GPP measurement definitions.
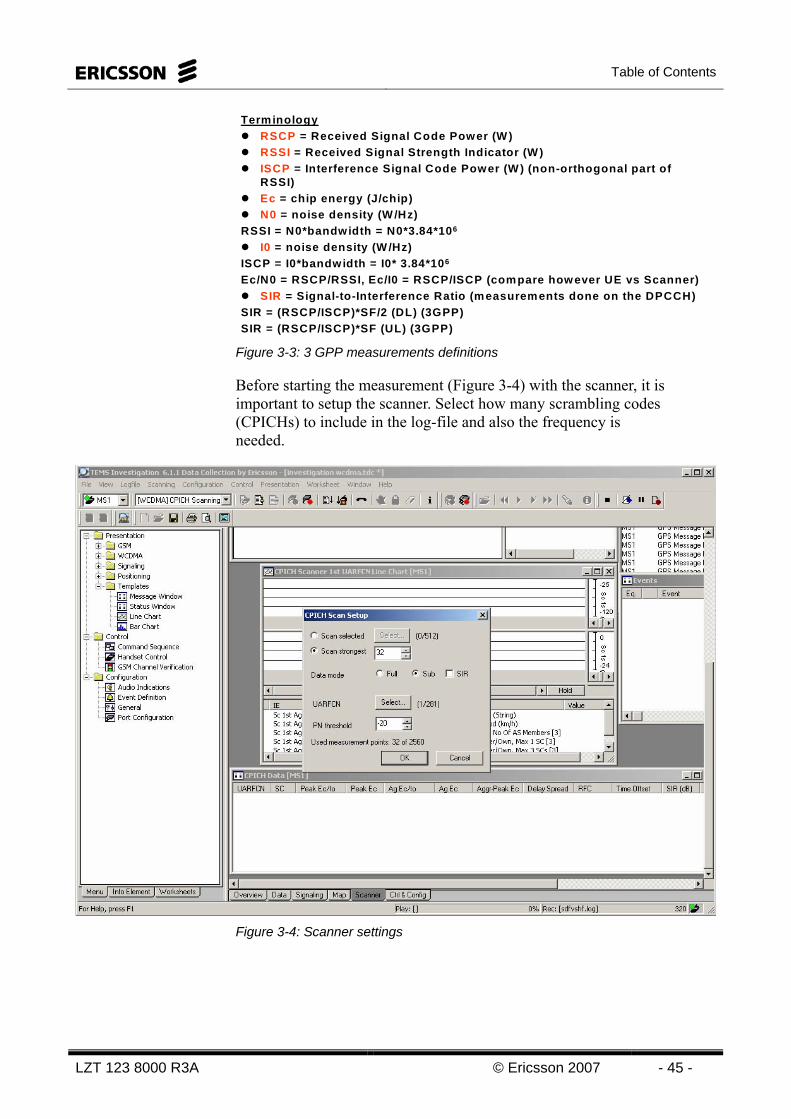
Table of Contents
LZT 123 8000 R3A © Ericsson 2007 - 45 -
TerminologyRSCP = Received Signal Code Power (W )RSSI = Received Signal Strength Indicator (W )ISCP = Interference Signal Code Power (W ) (non-orthogonal part of RSSI)Ec = chip energy (J/chip)N0 = noise density (W /Hz)
RSSI = N0*bandwidth = N0*3.84*106
I0 = noise density (W /Hz)ISCP = I0*bandwidth = I0* 3.84*106
Ec/N0 = RSCP/RSSI, Ec/I0 = RSCP/ISCP (compare however UE vs Scanner)SIR = Signal-to-Interference Ratio (measurements done on the DPCCH)
SIR = (RSCP/ISCP)*SF/2 (DL) (3GPP)SIR = (RSCP/ISCP)*SF (UL) (3GPP)
Figure 3-3: 3 GPP measurements definitions
Before starting the measurement (Figure 3-4) with the scanner, it is important to setup the scanner. Select how many scrambling codes (CPICHs) to include in the log-file and also the frequency is needed.
Figure 3-4: Scanner settings
WCDMA Radio Network Tuning
- 46 - © Ericsson 2007 LZT 123 8000 R3A
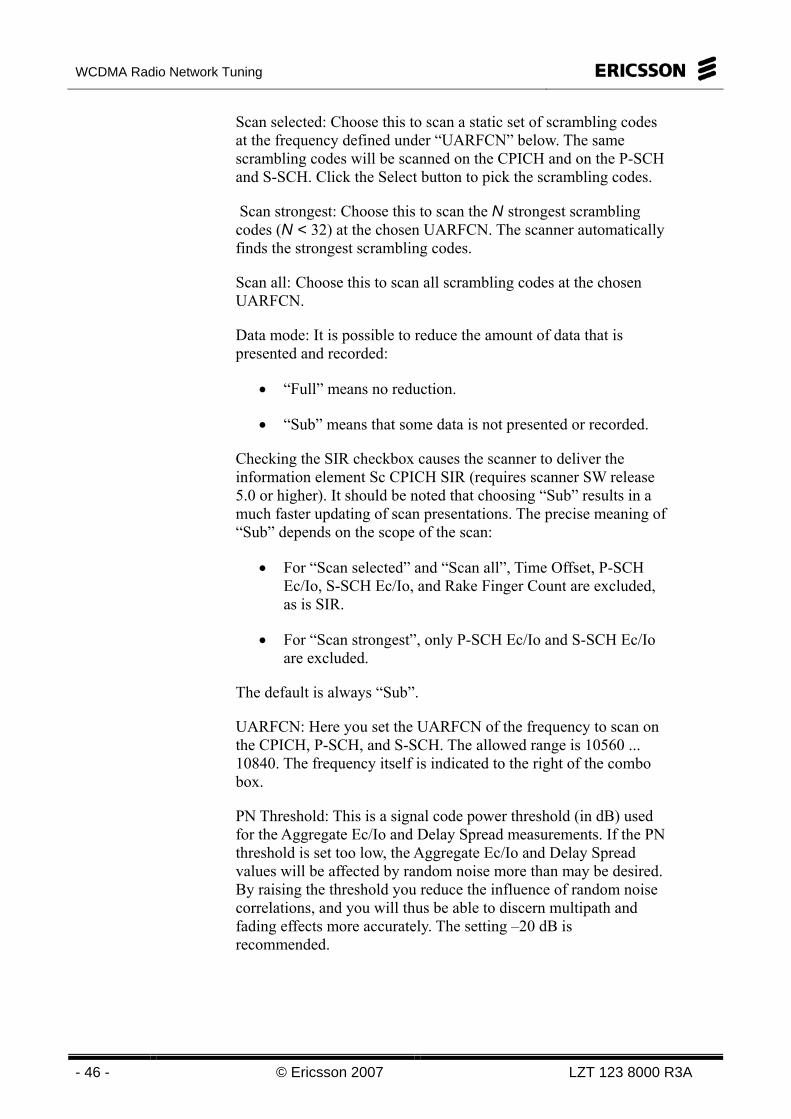
Scan selected: Choose this to scan a static set of scrambling codes at the frequency defined under “UARFCN” below. The same scrambling codes will be scanned on the CPICH and on the P-SCH and S-SCH. Click the Select button to pick the scrambling codes.
Scan strongest: Choose this to scan the N strongest scrambling codes (N < 32) at the chosen UARFCN. The scanner automatically finds the strongest scrambling codes.
Scan all: Choose this to scan all scrambling codes at the chosen UARFCN.
Data mode: It is possible to reduce the amount of data that is presented and recorded:
• “Full” means no reduction.
• “Sub” means that some data is not presented or recorded.
Checking the SIR checkbox causes the scanner to deliver the information element Sc CPICH SIR (requires scanner SW release 5.0 or higher). It should be noted that choosing “Sub” results in a much faster updating of scan presentations. The precise meaning of “Sub” depends on the scope of the scan:
• For “Scan selected” and “Scan all”, Time Offset, P-SCH Ec/Io, S-SCH Ec/Io, and Rake Finger Count are excluded, as is SIR.
• For “Scan strongest”, only P-SCH Ec/Io and S-SCH Ec/Io are excluded.
The default is always “Sub”.
UARFCN: Here you set the UARFCN of the frequency to scan on the CPICH, P-SCH, and S-SCH. The allowed range is 10560 ... 10840. The frequency itself is indicated to the right of the combo box.
PN Threshold: This is a signal code power threshold (in dB) used for the Aggregate Ec/Io and Delay Spread measurements. If the PN threshold is set too low, the Aggregate Ec/Io and Delay Spread values will be affected by random noise more than may be desired. By raising the threshold you reduce the influence of random noise correlations, and you will thus be able to discern multipath and fading effects more accurately. The setting –20 dB is recommended.
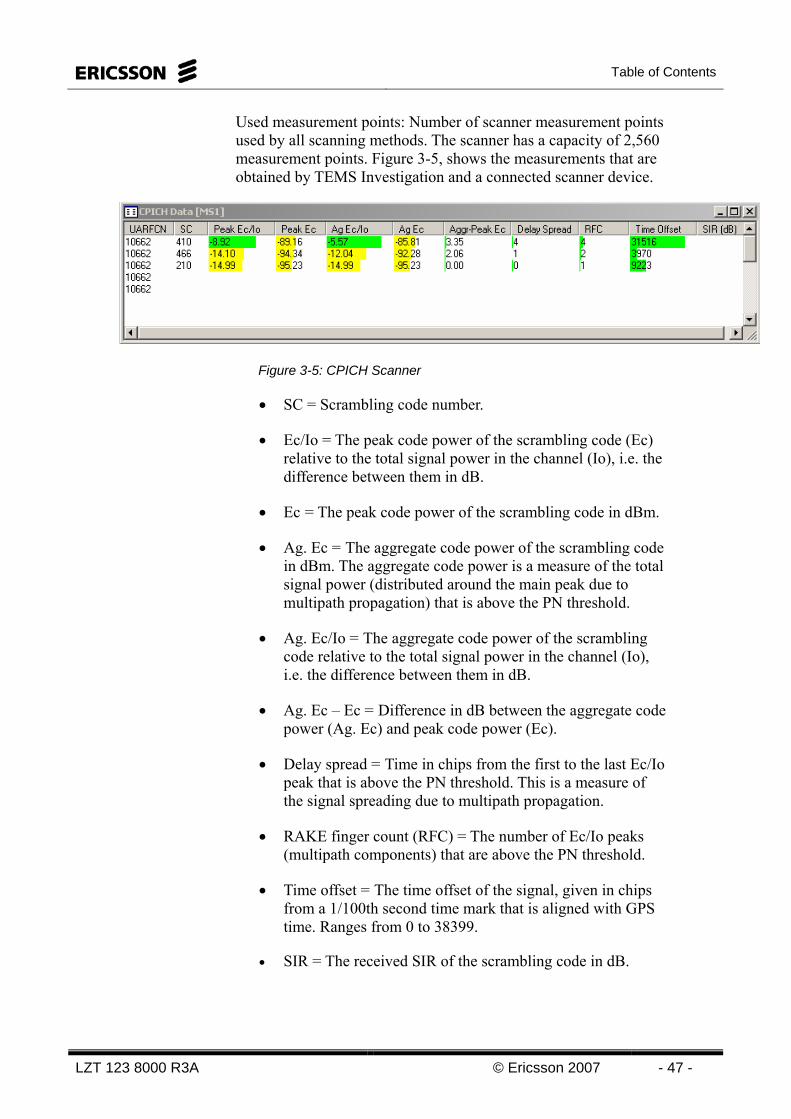
Table of Contents
LZT 123 8000 R3A © Ericsson 2007 - 47 -
Used measurement points: Number of scanner measurement points used by all scanning methods. The scanner has a capacity of 2,560 measurement points. Figure 3-5, shows the measurements that are obtained by TEMS Investigation and a connected scanner device.
Figure 3-5: CPICH Scanner
• SC = Scrambling code number.
• Ec/Io = The peak code power of the scrambling code (Ec) relative to the total signal power in the channel (Io), i.e. the difference between them in dB.
• Ec = The peak code power of the scrambling code in dBm.
• Ag. Ec = The aggregate code power of the scrambling code in dBm. The aggregate code power is a measure of the total signal power (distributed around the main peak due to multipath propagation) that is above the PN threshold.
• Ag. Ec/Io = The aggregate code power of the scrambling code relative to the total signal power in the channel (Io), i.e. the difference between them in dB.
• Ag. Ec – Ec = Difference in dB between the aggregate code power (Ag. Ec) and peak code power (Ec).
• Delay spread = Time in chips from the first to the last Ec/Io peak that is above the PN threshold. This is a measure of the signal spreading due to multipath propagation.
• RAKE finger count (RFC) = The number of Ec/Io peaks (multipath components) that are above the PN threshold.
• Time offset = The time offset of the signal, given in chips from a 1/100th second time mark that is aligned with GPS time. Ranges from 0 to 38399.
• SIR = The received SIR of the scrambling code in dB.

WCDMA Radio Network Tuning
- 48 - © Ericsson 2007 LZT 123 8000 R3A
Figure 3-6, shows the difference between peak and aggregated sample values.
Ec/Io (peak)
PN Threshold
Aggregated Ec/Io
Delay Spread (Chips)
Figure 3-6: Peak, Aggregated Power
The CPICH Scanner Line Chart is synchronized with the CPICH Scanner window. Like other line charts, it is completely user-configurable, but the default configuration is as follows (Figure 3-7).
Figure 3-7: CPICH Scanner Line Chart

Table of Contents
LZT 123 8000 R3A © Ericsson 2007 - 49 -
In general the TEMS logfiles contain a complete set of information, all according to what earlier defined in the measurement settings. However when exporting the logfiles into MapInfo or Text files the content of the target file must be specified as described here below.
Figure 3-8: Export of scanner log files
The TEMS logfiles can be exported as text files or MapInfo files (mif or tab files). Before exporting the files from TEMS you have to select the Information Elements (IE) that you want to export. It should be noted also that in order to get the right information in the export file (both text and MapInfo) you have to edit the arguments in the TEMS Information Element selection window. By that you can generate customized columns as desired for the tuning purpose.
Select IEs to export and edit the arguments to get the correct information in the export file.
Note that TEMS Investigation exported files takes a lot of space.
Synchronization
During the cell search procedure, the UE searches for a cell and determines the DL scrambling code and frame synchronization of that cell through the Primary SCH and Secondary SCH. The slot timing of the cell can be obtained by detecting the peaks in the TEMS SCH Timeslot window.

WCDMA Radio Network Tuning
- 50 - © Ericsson 2007 LZT 123 8000 R3A
Figure 3-9: TEMS Investigation Data Collection SCH Timeslot Scanner Bar Chart window
In order to secure a faster and reliable cell search procedure, Synchronization channels, coming from different cells, should arrive at UE location sufficiently separated in time (to avoid collisions). Sectors belonging to the same site are synchronized why the parameter SCH time offset for all sectors must be set according to the default parameter setting.
POSTPROCESSING Currently there are a number of ways of post processing the collected data that can be used during initial tuning activities to facilitate the whole process:
• TEMS Investigation
o Data Collection Part
o Route Analysis Part
• MapInfo

Table of Contents
LZT 123 8000 R3A © Ericsson 2007 - 51 -
When analyzing the logfiles from a cluster it is important to get an overview of the clusters performance. This could be done in two ways:
1. Through the TEMS Investigation Data collection part, generate the logfile report over all the logfiles that are involved in the cluster drive test, in order to find the clusters limitations considering Ec and Ec/No levels on a basic level
2. Through the TEMS Investigation Route Analysis part, generate scatter charts in order to find the clusters limitations considering Ec and Ec/No levels
The second step is to analyze whether the Ec or Ec/No levels differ from the designed values.
DATA COLLECTION
TEMS Investigation Data Collection has a report generator (in the log file menu) and can therefore be used to post process collected data from UE and scanner.
Figure 3-10, shows an example of different events that can be selected for a TEMS Investigation report. Based on the events chosen, plots will be generated.

WCDMA Radio Network Tuning
- 52 - © Ericsson 2007 LZT 123 8000 R3A
Figure 3-10: TEMS Investigation Data Collection report generator window
In order to get a quick snapshot of the cluster’s coverage, a graph can easily be generated with the TEMS software (Report Generator).

Table of Contents
LZT 123 8000 R3A © Ericsson 2007 - 53 -
Figure 3-11, below shows an example of the Scanner plot diagram generated with the report generator in the Data Collection part. To assess both Ec/No and RSCP in each measurement point gives a better indication of the coverage characteristics compared to doing it separately.
RSCP + Ec/No RSCP distribution
0%
10%
20%
30%
40%
50%
60%
70%
80%
90%
100%
-30 -32 -34 -36 -38 -40 -42 -44 -46 -48 -50 -52 -54 -56 -58 -60 -62 -64 -66 -68 -70 -72 -74 -76 -78 -80 -82 -84 -86 -88 -90
RSCP[dBm ]
0
20
40
60
80
100
120
140
160
Ec/Io distribution
0%
10%
20%
30%
40%
50%
60%
70%
80%
90%
100%
0 -1 -2 -3 -4 -5 -6 -7 -8 -9 -10 -11 -12 -16
Ec/Io [dB]
0
50
100
150
200
250
300
350
RSCP(90%): -74 dBm or better
Ec/No(90%): -5 dB or better
Both RSCP andEc/Io requirement has to be fulfilled!!
Both RSCP andEc/Io requirement has to be fulfilled!!
Figure 3-11: TEMS Investigation report generator showing RSCP and Ec/No conditions
ROUTE ANALYSIS
The main key feature of TEMS Investigation Route Analysis is to enable the user to create the Tuning report fast and easy (for an example of report, see appendix). The WCDMA RAN Tuning Report has a simple user interface wizard. WCDMA RAN Tuning report tool offers a large range of charts and tables for the report. It allows the user to choose which charts and tables shall be created.
The output report is in Microsoft Word format. It provides the flexibility for user to change what the report template will contain. The report template is a Word Template file (*.dot). It supports log files from TEMS Investigation for both UE and Scanner (Figure 3-12).
WCDMA Radio Network Tuning
- 54 - © Ericsson 2007 LZT 123 8000 R3A
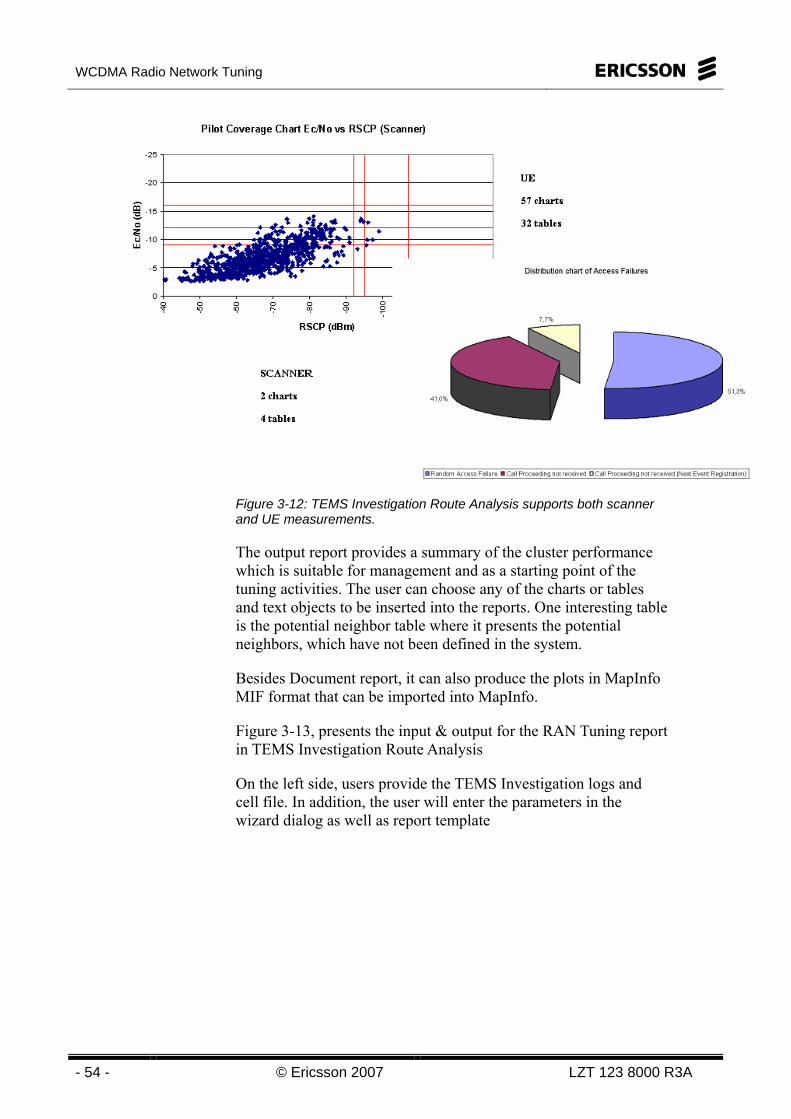
Figure 3-12: TEMS Investigation Route Analysis supports both scanner and UE measurements.
The output report provides a summary of the cluster performance which is suitable for management and as a starting point of the tuning activities. The user can choose any of the charts or tables and text objects to be inserted into the reports. One interesting table is the potential neighbor table where it presents the potential neighbors, which have not been defined in the system.
Besides Document report, it can also produce the plots in MapInfo MIF format that can be imported into MapInfo.
Figure 3-13, presents the input & output for the RAN Tuning report in TEMS Investigation Route Analysis
On the left side, users provide the TEMS Investigation logs and cell file. In addition, the user will enter the parameters in the wizard dialog as well as report template
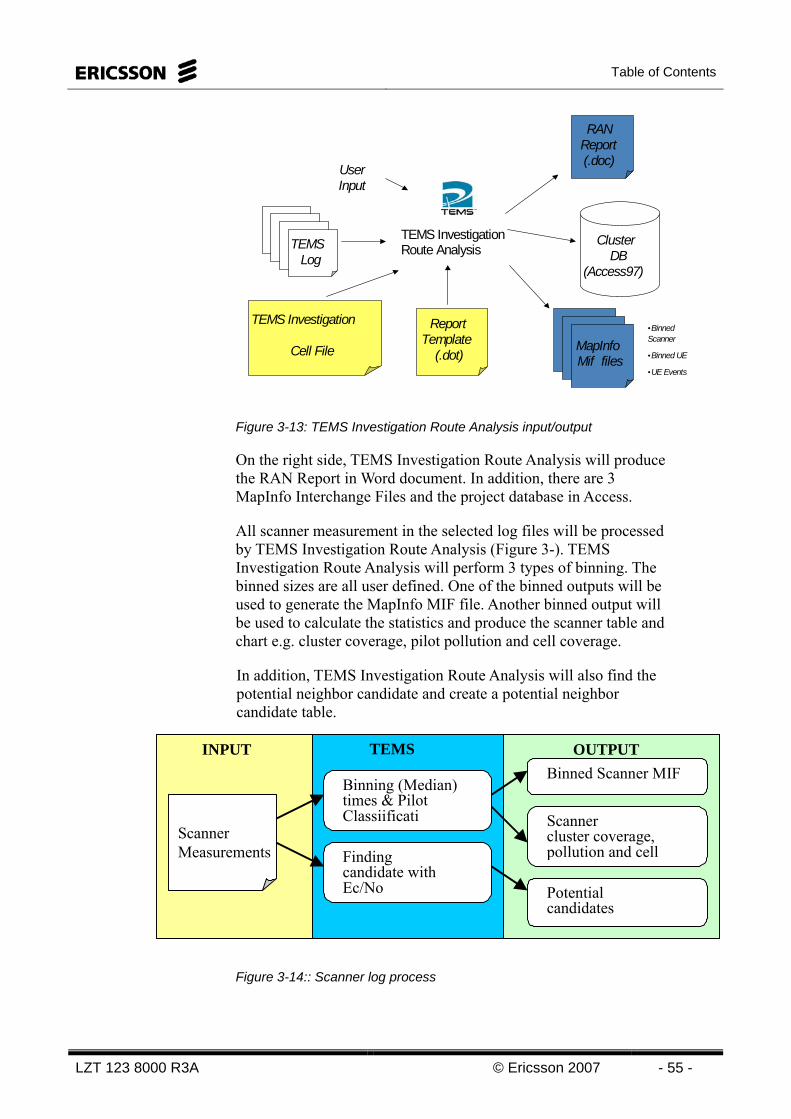
Table of Contents
LZT 123 8000 R3A © Ericsson 2007 - 55 -
TEMS Log
Cluster DB
(Access97)
RAN Report (.doc)
ReportTemplate
(.dot)MapInfo Mif files
TEMS InvestigationRoute Analysis
User Input
• Binned Scanner
• Binned UE
• UE Events
TEMS Investigation
Cell File
Figure 3-13: TEMS Investigation Route Analysis input/output
On the right side, TEMS Investigation Route Analysis will produce the RAN Report in Word document. In addition, there are 3 MapInfo Interchange Files and the project database in Access.
All scanner measurement in the selected log files will be processed by TEMS Investigation Route Analysis (Figure 3-). TEMS Investigation Route Analysis will perform 3 types of binning. The binned sizes are all user defined. One of the binned outputs will be used to generate the MapInfo MIF file. Another binned output will be used to calculate the statistics and produce the scanner table and chart e.g. cluster coverage, pilot pollution and cell coverage.
In addition, TEMS Investigation Route Analysis will also find the potential neighbor candidate and create a potential neighbor candidate table.
Figure 3-14:: Scanner log process
Scanner Measurements
Binning (Median) times & Pilot Classiificati
Finding candidate with Ec/No
Binned Scanner MIF
Scanner cluster coverage, pollution and cell
Potential candidates
INPUT TEMS OUTPUT
WCDMA Radio Network Tuning
- 56 - © Ericsson 2007 LZT 123 8000 R3A
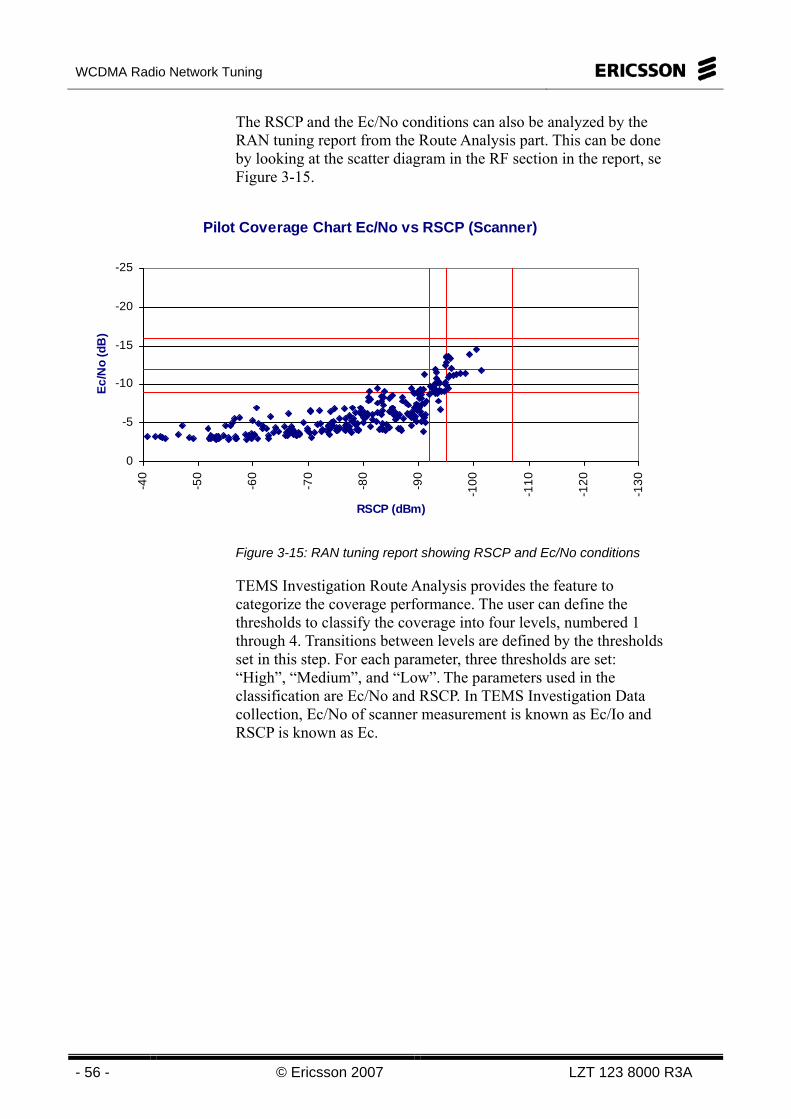
The RSCP and the Ec/No conditions can also be analyzed by the RAN tuning report from the Route Analysis part. This can be done by looking at the scatter diagram in the RF section in the report, se Figure 3-15.
Pilot Coverage Chart Ec/No vs RSCP (Scanner)
-25
-20
-15
-10
-5
0
-130
-120
-110
-100-9
0
-80
-70
-60
-50
-40
RSCP (dBm)
Ec/N
o (d
B)
Figure 3-15: RAN tuning report showing RSCP and Ec/No conditions
TEMS Investigation Route Analysis provides the feature to categorize the coverage performance. The user can define the thresholds to classify the coverage into four levels, numbered 1 through 4. Transitions between levels are defined by the thresholds set in this step. For each parameter, three thresholds are set: “High”, “Medium”, and “Low”. The parameters used in the classification are Ec/No and RSCP. In TEMS Investigation Data collection, Ec/No of scanner measurement is known as Ec/Io and RSCP is known as Ec.

Table of Contents
LZT 123 8000 R3A © Ericsson 2007 - 57 -
Figure 3-16: Pilot Classification
Using three users defined Ec/No thresholds and three user defined RSCP threshold (High, Medium and Low), TEMS Investigation Route Analysis categorize the coverage performance into four levels where Level 1 is the best performance.
Figure 3-17, shows an example of the conditions used in the categorization.
Pilot Coverage
Class
Condition
Level 1 Ec/No >= Ec/No High AND RSCP >= RSCP High
Level 2
(Ec/No >= Ec/No Medium AND RSCP >= RSCP Medium) AND (Ec/No < Ec/No High OR RSCP < RSCP High)
Level 3
(Ec/No >= Ec/No Low AND RSCP >= RSCP Low) AND (Ec/No < Ec/No Medium OR RSCP < RSCP Medium)
Level 4 Ec/No >= Ec/No Low OR RSCP >= RSCP Low Figure 3-17: Scanner pilot coverage
WCDMA Radio Network Tuning
- 58 - © Ericsson 2007 LZT 123 8000 R3A
ANALYSIS The pilot channel measurements are very useful to verify handover and cell re-selections as well as to evaluate radio propagation characteristics. Even though the measured signal quality only reflects the performance of the DL channel it adds valuable information about the expected network performance both in DL and UL. Analysis of the following areas is covered briefly:
• Pilot Coverage
• Interference
• Scrambling Code plan
• Missing neighbor
PILOT COVERAGE
When checking the pilot coverage it is important that the measured level is the same as the designed level. When it differs from the designed value it indicates either coverage holes or pilot pollution.
These are the actions that should be taken:
1. Is there a difference between the designed level and the measured level?
2. Correct pilot in the correct area? Swapped feeders? Overshooting cells, no dominating cell?
Coverage Verification
Which tool to use for the coverage verification depends very much on the users preference. One method could be to import the TEMS logfiles to TCPU and comparing the measured coverage with predicted coverage.
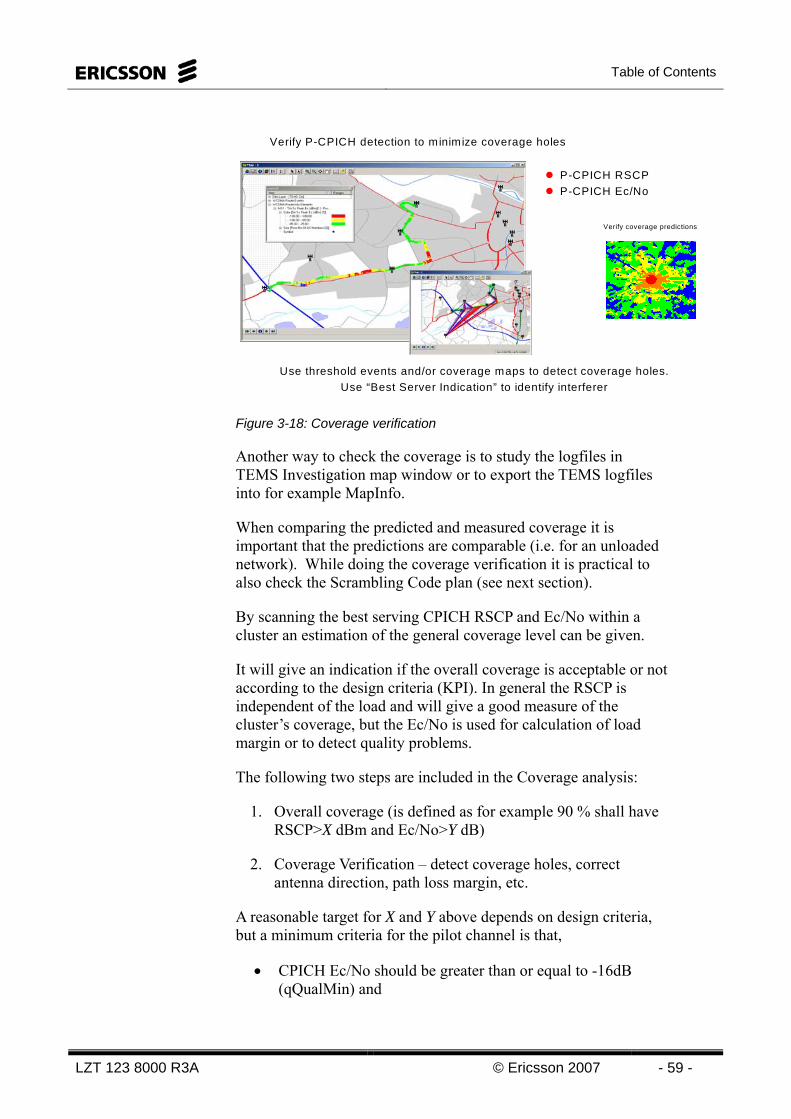
Table of Contents
LZT 123 8000 R3A © Ericsson 2007 - 59 -
Verify P-CPICH detection to minimize coverage holes
P-CPICH RSCPP-CPICH Ec/No
Verify coverage predictions
Use threshold events and/or coverage maps to detect coverage holes.Use “Best Server Indication” to identify interferer
Figure 3-18: Coverage verification
Another way to check the coverage is to study the logfiles in TEMS Investigation map window or to export the TEMS logfiles into for example MapInfo.
When comparing the predicted and measured coverage it is important that the predictions are comparable (i.e. for an unloaded network). While doing the coverage verification it is practical to also check the Scrambling Code plan (see next section).
By scanning the best serving CPICH RSCP and Ec/No within a cluster an estimation of the general coverage level can be given.
It will give an indication if the overall coverage is acceptable or not according to the design criteria (KPI). In general the RSCP is independent of the load and will give a good measure of the cluster’s coverage, but the Ec/No is used for calculation of load margin or to detect quality problems.
The following two steps are included in the Coverage analysis:
1. Overall coverage (is defined as for example 90 % shall have RSCP>X dBm and Ec/No>Y dB)
2. Coverage Verification – detect coverage holes, correct antenna direction, path loss margin, etc.
A reasonable target for X and Y above depends on design criteria, but a minimum criteria for the pilot channel is that,
• CPICH Ec/No should be greater than or equal to -16dB (qQualMin) and

WCDMA Radio Network Tuning
- 60 - © Ericsson 2007 LZT 123 8000 R3A
• CPICH RSCP should be greater than or equal to -111dBm (qRxLevMin).
No suitable cell if RSCP < qRxLevMin or Ec/No < qQualMin
Figure 3-19: shows an example of a plot of RSCP.
It is important to detect the areas where the pilot coverage is bad.

Table of Contents
LZT 123 8000 R3A © Ericsson 2007 - 61 -
Coverage holes
Figure 3-20, shows how a coverage hole can appear due to that CPICH power is too low.
Figure 3-20: Coverage hole
One solution to this problem is to add a new site at the problematic area. Other solutions could be to up tilt the antenna (if possible) or to increase the CPICH power.
An example of a coverage hole can be found in Figure 3-21.
Figure 3-21: Example of a coverage hole in Route Analysis

WCDMA Radio Network Tuning
- 62 - © Ericsson 2007 LZT 123 8000 R3A
Another case can be when a problem cell situated on a downhill slope has bad coverage close to the site but good far from the site. The tilt is 0 degrees electrical and 4 degrees mechanical. One solution in this case is to change the antenna to 6 degrees electrical tilt and the mechanical tilt to 0.
Swapped feeders
Each cell will have two feeders, TX/RX and a RX feeder to each antenna.
Figure 3-22:: The feeder connections on top of the RBS cabinet.
In order to find swapped feeders, a test should be performed by walking/driving round the site. This is to secure that each SC is on the right cell.
Figure 3-23: The walk -around the site should be done in both directions.
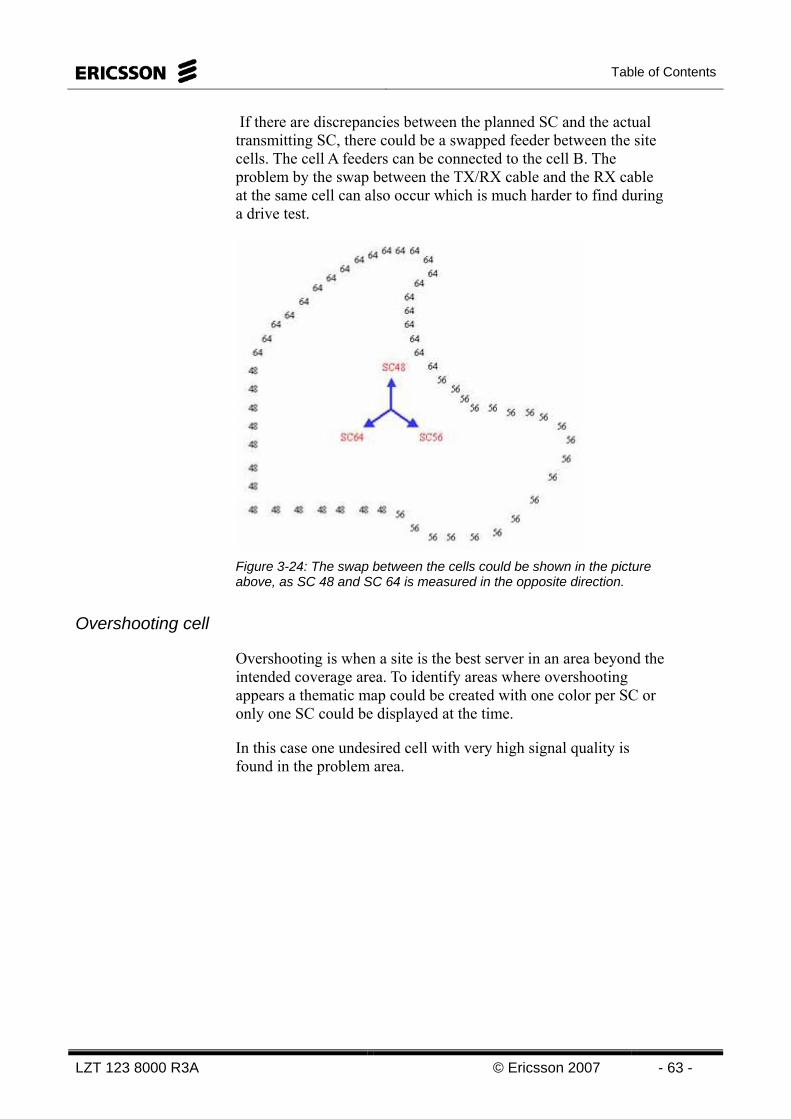
Table of Contents
LZT 123 8000 R3A © Ericsson 2007 - 63 -
If there are discrepancies between the planned SC and the actual transmitting SC, there could be a swapped feeder between the site cells. The cell A feeders can be connected to the cell B. The problem by the swap between the TX/RX cable and the RX cable at the same cell can also occur which is much harder to find during a drive test.
Figure 3-24: The swap between the cells could be shown in the picture above, as SC 48 and SC 64 is measured in the opposite direction.
Overshooting cell
Overshooting is when a site is the best server in an area beyond the intended coverage area. To identify areas where overshooting appears a thematic map could be created with one color per SC or only one SC could be displayed at the time.
In this case one undesired cell with very high signal quality is found in the problem area.

WCDMA Radio Network Tuning
- 64 - © Ericsson 2007 LZT 123 8000 R3A
Figure 3-25:: Overshooting problem
The simplest solution to this problem is to include the undesired cell in the neighboring cell list. This means that the interferer now becomes a useful radio link. The drawback of this solution is that it creates more unnecessary handovers. If the overshooting cell is physically far away to the problem area it is not the best solution from handover point of view.
Another solution then is to change the antenna configuration of the overshooting cell, e.g. tilting down the antenna, redirecting the antenna orientation or reduce the antenna height. With this solution, uplink/downlink coverage imbalance problem will not occur in the interferer because both uplink/downlink pathloss is modified simultaneously. Moreover, the interferer probably will cover fever UEs, and transmit a lower total downlink power. This means that its downlink interference contribution might be further decreased. The main drawback to this solution is that neighboring cells of the interferer will cover a larger area and will thus absorb additional UEs. The risk of high blocking rate therefore increases in these cells. Moreover, due to transmit high power, they might become interferers if their coverage areas are not well defined.
A third possible solution is to decrease the CPICH power of the undesired cell. The drawbacks of this third solution are that reducing the CPICH power, the downlink channel estimation in the UE is affected. This influences the downlink quality. In the end the UE might request more power the RBS. When the CPICH power is reduced, the maximum allowed downlink DPCH power decreases.
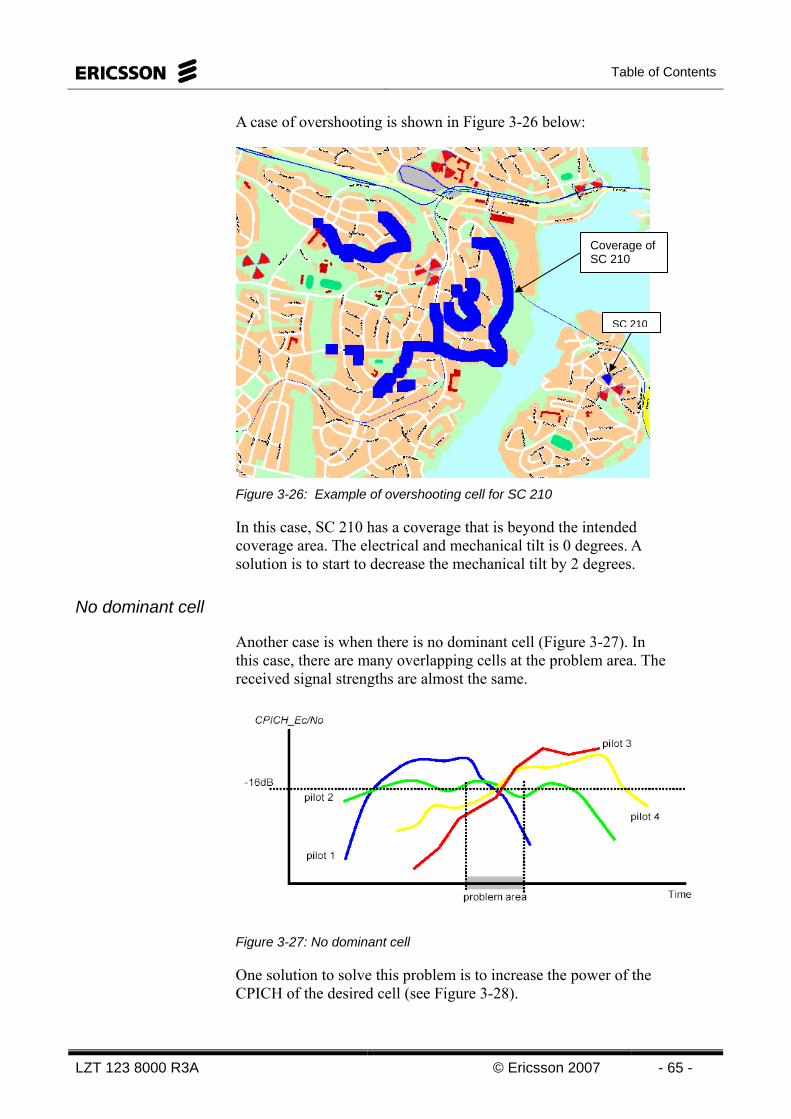
Table of Contents
LZT 123 8000 R3A © Ericsson 2007 - 65 -
A case of overshooting is shown in Figure 3-26 below:
Figure 3-26: Example of overshooting cell for SC 210
In this case, SC 210 has a coverage that is beyond the intended coverage area. The electrical and mechanical tilt is 0 degrees. A solution is to start to decrease the mechanical tilt by 2 degrees.
No dominant cell
Another case is when there is no dominant cell (Figure 3-27). In this case, there are many overlapping cells at the problem area. The received signal strengths are almost the same.
Figure 3-27: No dominant cell
One solution to solve this problem is to increase the power of the CPICH of the desired cell (see Figure 3-28).
Coverage of SC 210
SC 210
WCDMA Radio Network Tuning
- 66 - © Ericsson 2007 LZT 123 8000 R3A
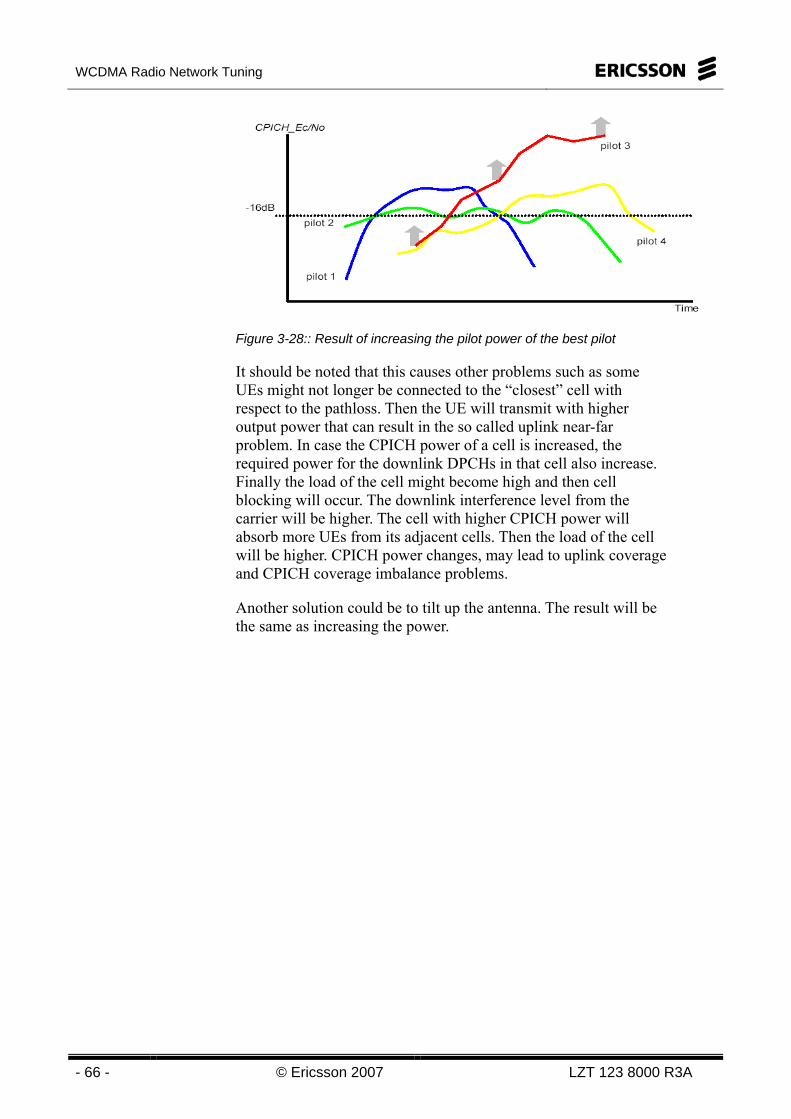
Figure 3-28:: Result of increasing the pilot power of the best pilot
It should be noted that this causes other problems such as some UEs might not longer be connected to the “closest” cell with respect to the pathloss. Then the UE will transmit with higher output power that can result in the so called uplink near-far problem. In case the CPICH power of a cell is increased, the required power for the downlink DPCHs in that cell also increase. Finally the load of the cell might become high and then cell blocking will occur. The downlink interference level from the carrier will be higher. The cell with higher CPICH power will absorb more UEs from its adjacent cells. Then the load of the cell will be higher. CPICH power changes, may lead to uplink coverage and CPICH coverage imbalance problems.
Another solution could be to tilt up the antenna. The result will be the same as increasing the power.
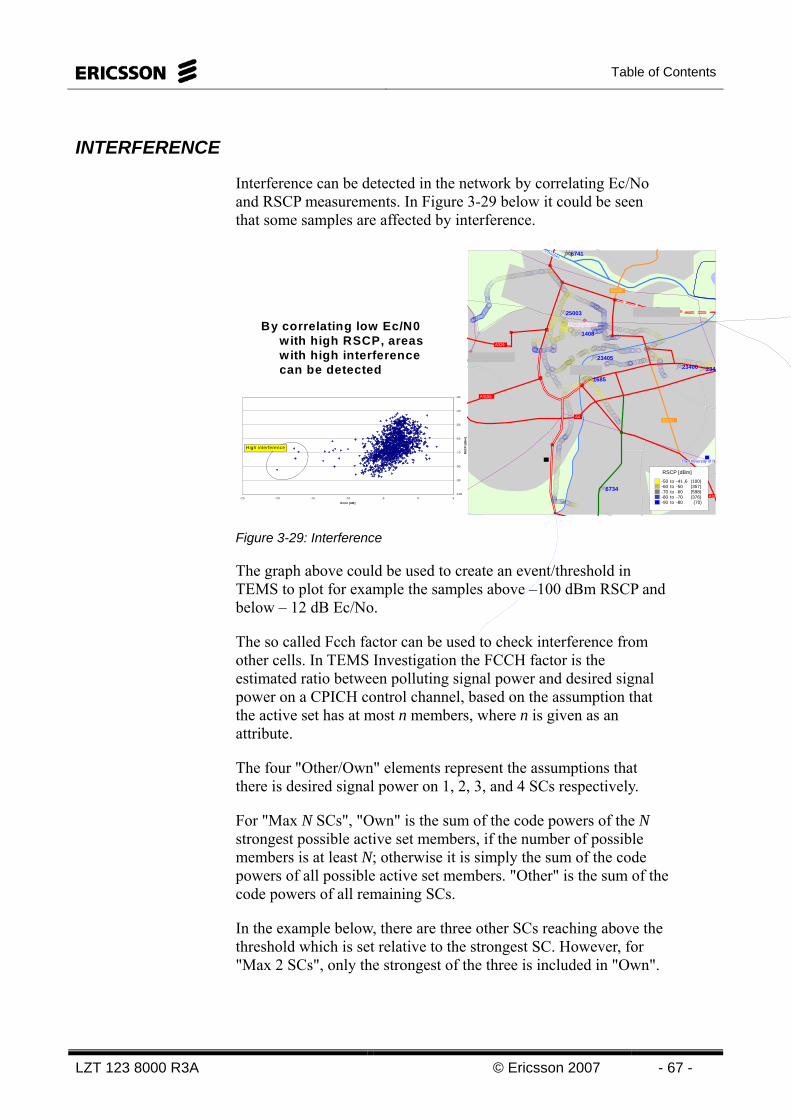
Table of Contents
LZT 123 8000 R3A © Ericsson 2007 - 67 -
INTERFERENCE
Interference can be detected in the network by correlating Ec/No and RSCP measurements. In Figure 3-29 below it could be seen that some samples are affected by interference.
By correlating low Ec/N0 with high RSCP, areas with high interference can be detected
-100
-90
-80
-70
-60
-50
-40
-30
-25 -20 -15 -10 -5 0 5
Ec/Io [dB]
RSC
P [d
Bm
]
High interference
ennetennetennKennetKennKennetKennetKennKennet
ThamesThamesThamesThamesThamesThamesThamesThamesThamesThamesThamesThamesThamesThamesThamesThamesThamesThamesThamesThamesThamesThamesThamesThamesThamesThamesThamesThamesThamesThamesThamesThamesThamesThamesThamesThamesThamesThamesThamesThamesThamesThamesThamesThamesThamesThamesThamesThamesThames
B3031
B4009
A4
A32
A4155
A329
Reading StationReading StationReading StationReading StationReading StationReading StationReading StationReading StationReading Station
est Stationest Stationest Stationest Stationest StationWest StationWest StationWest Stationest Station
ReadingReadingReadingReadingReadingReadingReadingReadingReading
Museum of ReadingMuseum of ReadingMuseum of ReadingMuseum of ReadingMuseum of ReadingMuseum of ReadingMuseum of ReadingMuseum of ReadingMuseum of Reading
The University of ReThe University of ReThe University of ReThe University of RThe University of RThe University of RThe University of RThe University of RThe University of R
1408
1685
23400 234
23405
25003
6734
6741
RSCP [dBm]
-50 to -41 ,6 (100)-60 to -50 (357)-70 to -60 (598)-80 to -70 (376)-90 to -80 (70)
Figure 3-29: Interference
The graph above could be used to create an event/threshold in TEMS to plot for example the samples above –100 dBm RSCP and below – 12 dB Ec/No.
The so called Fcch factor can be used to check interference from other cells. In TEMS Investigation the FCCH factor is the estimated ratio between polluting signal power and desired signal power on a CPICH control channel, based on the assumption that the active set has at most n members, where n is given as an attribute.
The four "Other/Own" elements represent the assumptions that there is desired signal power on 1, 2, 3, and 4 SCs respectively.
For "Max N SCs", "Own" is the sum of the code powers of the N strongest possible active set members, if the number of possible members is at least N; otherwise it is simply the sum of the code powers of all possible active set members. "Other" is the sum of the code powers of all remaining SCs.
In the example below, there are three other SCs reaching above the threshold which is set relative to the strongest SC. However, for "Max 2 SCs", only the strongest of the three is included in "Own".
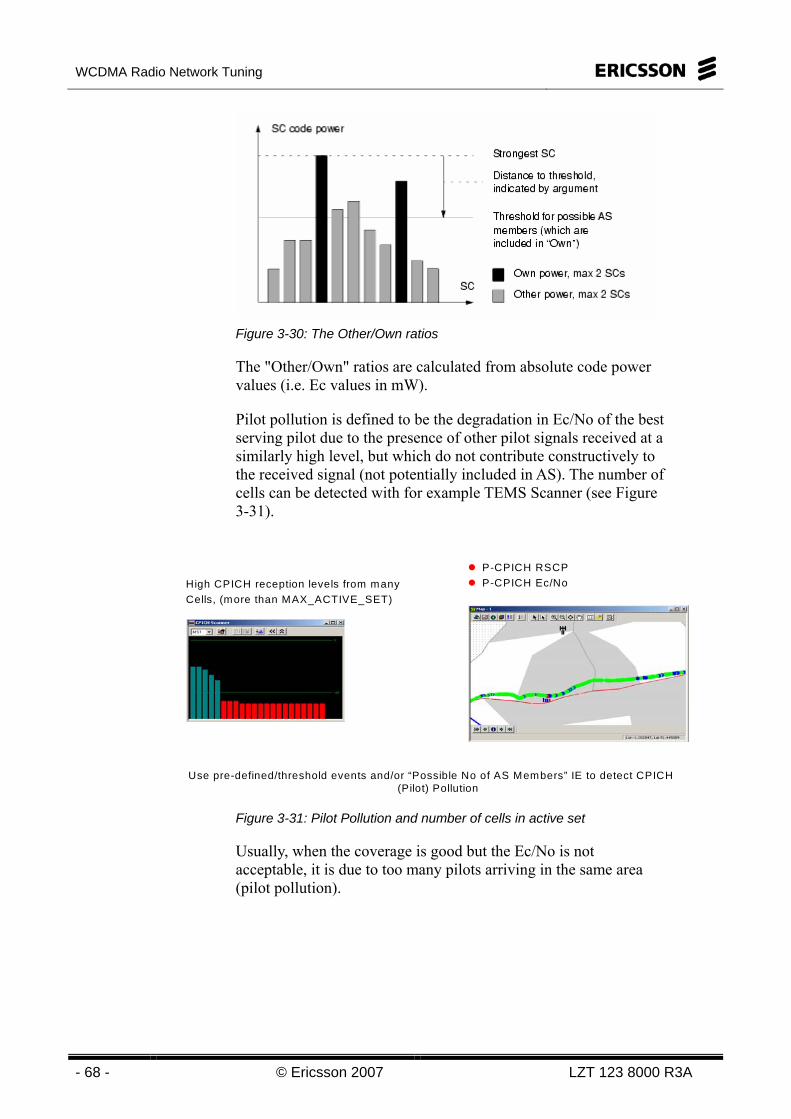
WCDMA Radio Network Tuning
- 68 - © Ericsson 2007 LZT 123 8000 R3A
Figure 3-30: The Other/Own ratios
The "Other/Own" ratios are calculated from absolute code power values (i.e. Ec values in mW).
Pilot pollution is defined to be the degradation in Ec/No of the best serving pilot due to the presence of other pilot signals received at a similarly high level, but which do not contribute constructively to the received signal (not potentially included in AS). The number of cells can be detected with for example TEMS Scanner (see Figure 3-31).
P-CPICH RSCPP-CPICH Ec/NoHigh CPICH reception levels from many
Cells, (more than MAX_ACTIVE_SET)
Use pre-defined/threshold events and/or “Possible No of AS Members” IE to detect CPICH (Pilot) Pollution
Figure 3-31: Pilot Pollution and number of cells in active set
Usually, when the coverage is good but the Ec/No is not acceptable, it is due to too many pilots arriving in the same area (pilot pollution).
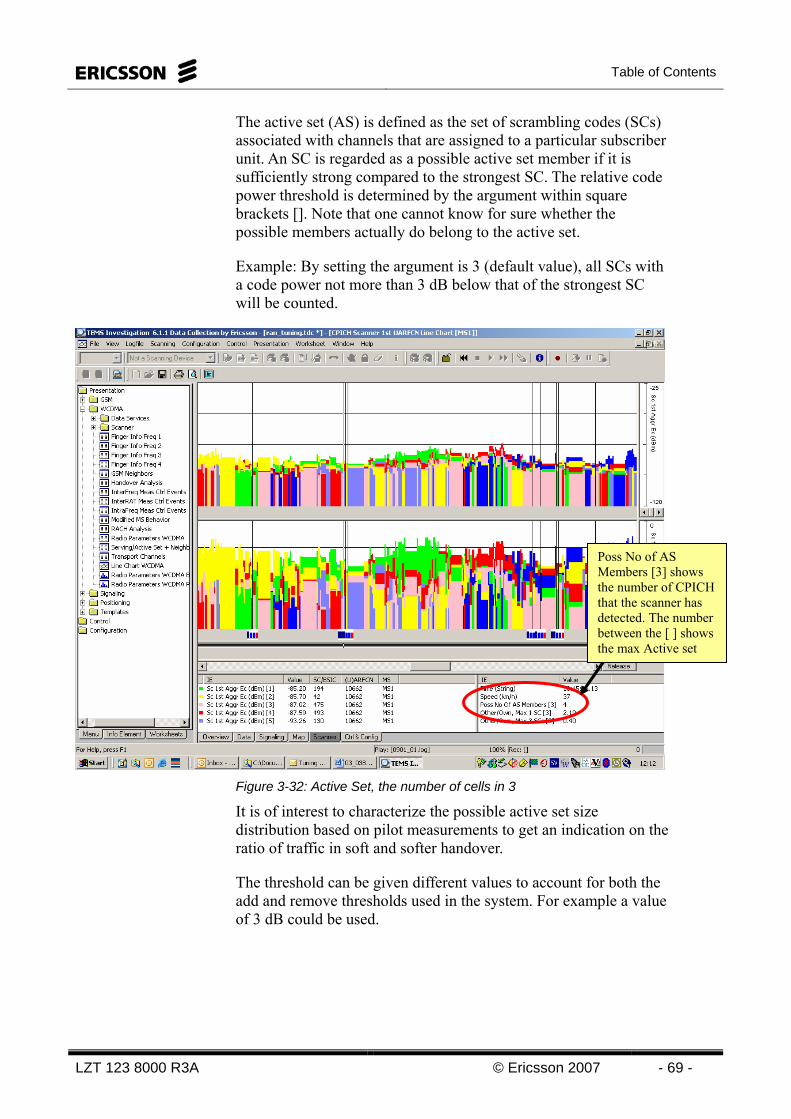
Table of Contents
LZT 123 8000 R3A © Ericsson 2007 - 69 -
The active set (AS) is defined as the set of scrambling codes (SCs) associated with channels that are assigned to a particular subscriber unit. An SC is regarded as a possible active set member if it is sufficiently strong compared to the strongest SC. The relative code power threshold is determined by the argument within square brackets []. Note that one cannot know for sure whether the possible members actually do belong to the active set.
Example: By setting the argument is 3 (default value), all SCs with a code power not more than 3 dB below that of the strongest SC will be counted.
Figure 3-32: Active Set, the number of cells in 3
It is of interest to characterize the possible active set size distribution based on pilot measurements to get an indication on the ratio of traffic in soft and softer handover.
The threshold can be given different values to account for both the add and remove thresholds used in the system. For example a value of 3 dB could be used.
Poss No of AS Members [3] shows the number of CPICH that the scanner has detected. The number between the [ ] shows the max Active set
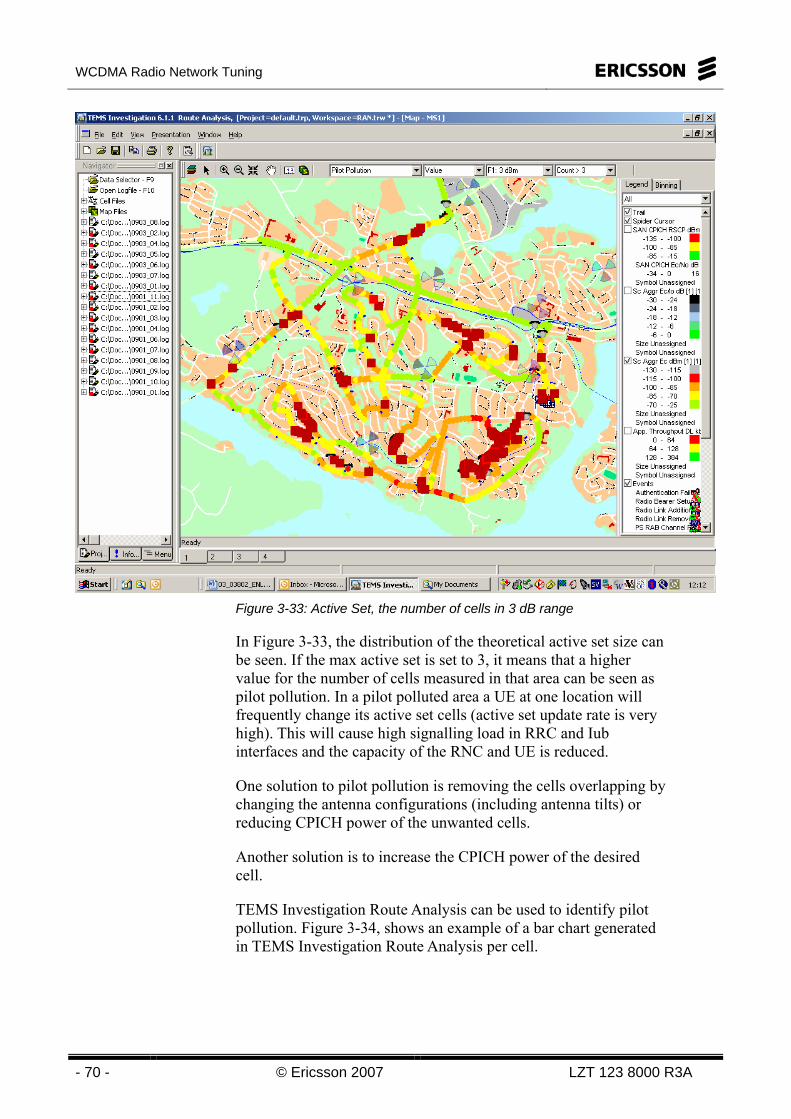
WCDMA Radio Network Tuning
- 70 - © Ericsson 2007 LZT 123 8000 R3A
Figure 3-33: Active Set, the number of cells in 3 dB range
In Figure 3-33, the distribution of the theoretical active set size can be seen. If the max active set is set to 3, it means that a higher value for the number of cells measured in that area can be seen as pilot pollution. In a pilot polluted area a UE at one location will frequently change its active set cells (active set update rate is very high). This will cause high signalling load in RRC and Iub interfaces and the capacity of the RNC and UE is reduced.
One solution to pilot pollution is removing the cells overlapping by changing the antenna configurations (including antenna tilts) or reducing CPICH power of the unwanted cells.
Another solution is to increase the CPICH power of the desired cell.
TEMS Investigation Route Analysis can be used to identify pilot pollution. Figure 3-34, shows an example of a bar chart generated in TEMS Investigation Route Analysis per cell.
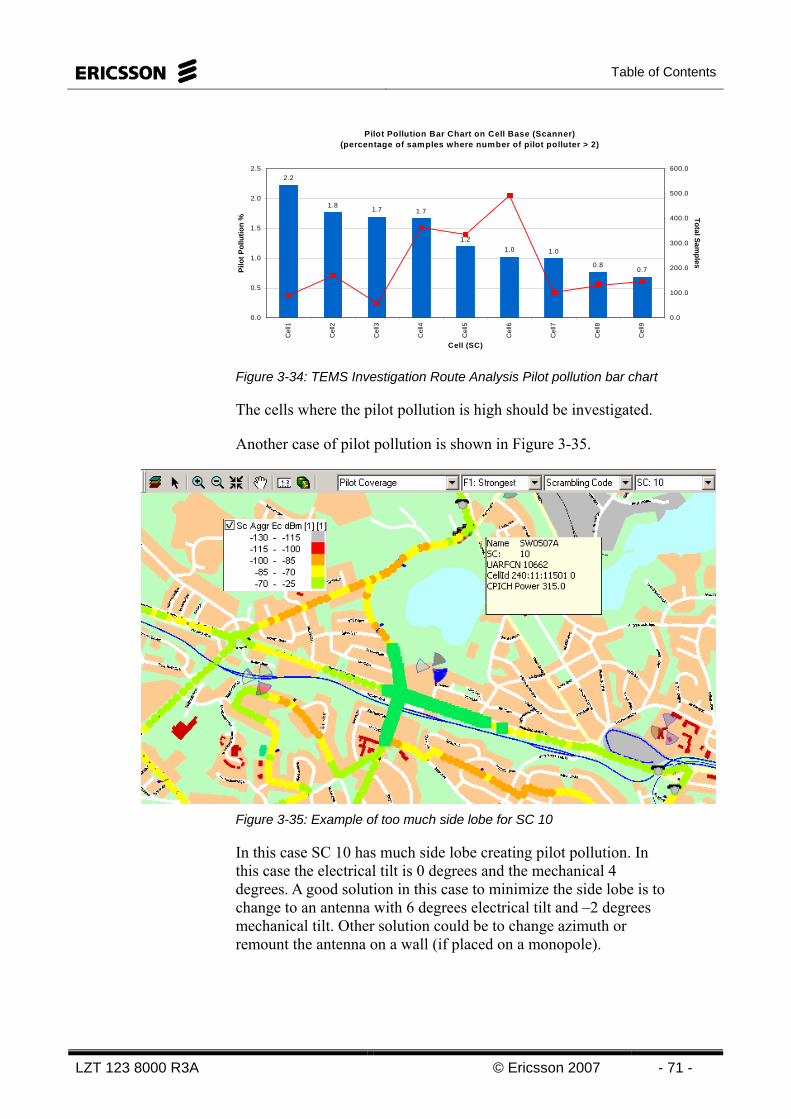
Table of Contents
LZT 123 8000 R3A © Ericsson 2007 - 71 -
Pilot Pollution Bar Chart on Cell Base (Scanner)(percentage of samples where number of pilot polluter > 2)
2.2
1.8 1.7 1.7
1.21.0 1.0
0.80.7
0.0
0.5
1.0
1.5
2.0
2.5
Cel
l1
Cel
l2
Cel
l3
Cel
l4
Cel
l5
Cel
l6
Cel
l7
Cel
l8
Cel
l9
Cell (SC)
Pilo
t Pol
lutio
n %
0.0
100.0
200.0
300.0
400.0
500.0
600.0
Total Samples
Figure 3-34: TEMS Investigation Route Analysis Pilot pollution bar chart
The cells where the pilot pollution is high should be investigated.
Another case of pilot pollution is shown in Figure 3-35.
Figure 3-35: Example of too much side lobe for SC 10
In this case SC 10 has much side lobe creating pilot pollution. In this case the electrical tilt is 0 degrees and the mechanical 4 degrees. A good solution in this case to minimize the side lobe is to change to an antenna with 6 degrees electrical tilt and –2 degrees mechanical tilt. Other solution could be to change azimuth or remount the antenna on a wall (if placed on a monopole).

WCDMA Radio Network Tuning
- 72 - © Ericsson 2007 LZT 123 8000 R3A
SCRAMBLING CODE PLAN VERIFICATION
Pilot Scanner measurements are useful to verify the Scrambling Code plan as it could give an indication of a possible swapped TX feeder’s occurrence.
The Best Server CPICH measurements are used to verify that all cells in the cluster have been assigned the correct SC according to plan. In order to verify the SC plan you can plot the drive test routes of the cluster with each SC (in different colors) and compare to SC coverage plot (TCPU). As an example the SC can be plotted one by one in the Route Analysis part in order to see how far each cell is covering.
Figure 3-36: Example of a plotted SC, in this case SC226
When detecting a Scrambling code that covers wrong direction it is important to check if the actual SC plan (according to design) is implemented correctly in RNC or if it is a case of for example swapped feeders.
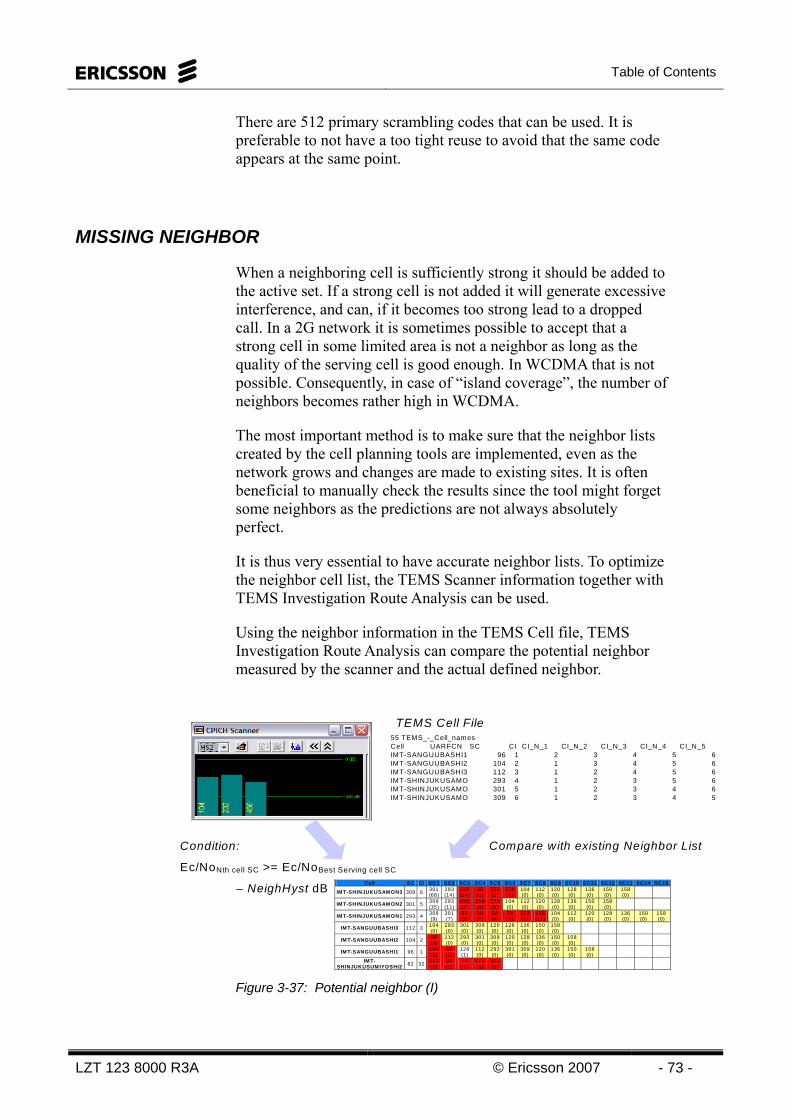
Table of Contents
LZT 123 8000 R3A © Ericsson 2007 - 73 -
There are 512 primary scrambling codes that can be used. It is preferable to not have a too tight reuse to avoid that the same code appears at the same point.
MISSING NEIGHBOR
When a neighboring cell is sufficiently strong it should be added to the active set. If a strong cell is not added it will generate excessive interference, and can, if it becomes too strong lead to a dropped call. In a 2G network it is sometimes possible to accept that a strong cell in some limited area is not a neighbor as long as the quality of the serving cell is good enough. In WCDMA that is not possible. Consequently, in case of “island coverage”, the number of neighbors becomes rather high in WCDMA.
The most important method is to make sure that the neighbor lists created by the cell planning tools are implemented, even as the network grows and changes are made to existing sites. It is often beneficial to manually check the results since the tool might forget some neighbors as the predictions are not always absolutely perfect.
It is thus very essential to have accurate neighbor lists. To optimize the neighbor cell list, the TEMS Scanner information together with TEMS Investigation Route Analysis can be used.
Using the neighbor information in the TEMS Cell file, TEMS Investigation Route Analysis can compare the potential neighbor measured by the scanner and the actual defined neighbor.
Cell SC CI SC1 SC2 SC3 SC4 SC5 SC6 SC7 SC8 SC9 SC10 SC11 SC12 SC13 SC14 SC15
IM T-SHINJUKUSAM ON3 309 6 301 (68)
293 (14)
106 (14)
90 (1)
236 (1)
220 (1)
104 (0)
112 (0)
120 (0)
128 (0)
136 (0)
150 (0)
158 (0)
IM T-SHINJUKUSAM ON2 301 5 309 (35)
293 (11)
220 (3)
228 (8)
173 (1)
104 (0)
112 (0)
120 (0)
128 (0)
136 (0)
150 (0)
158 (0)
IM T-SHINJUKUSAM ON1 293 4 309 (9)
301 (7)
82 (3)
90 (7)
58 (4)
74 (1)
173 (1)
106 (11)
104 (0)
112 (0)
120 (0)
128 (0)
136 (0)
150 (0)
158 (0)
IM T-SANGUUBASHI3 112 3 104 (0)
293 (0)
301 (0)
309 (0)
120 (0)
128 (0)
136 (0)
150 (0)
158 (0)
IM T-SANGUUBASHI2 104 2 96 (3)
112 (0)
293 (0)
301 (0)
309 (0)
120 (0)
128 (0)
136 (0)
150 (0)
158 (0)
IM T-SANGUUBASHI1 96 1 104 (3)
88 (2)
128 (1)
112 (0)
293 (0)
301 (0)
309 (0)
120 (0)
136 (0)
150 (0)
158 (0)
IM T-SHINJUKUSUM IYOSHI2 82 32 293
(3) 90 (3)
74 (7)
173 (3)
301 (1)
55 TEMS_-_Cell_namesCell UARFCN SC CI CI_N_1 CI_N_2 CI_N_3 CI_N_4 CI_N_5IMT-SANGUUBASHI1 96 1 2 3 4 5 6IMT-SANGUUBASHI2 104 2 1 3 4 5 6IMT-SANGUUBASHI3 112 3 1 2 4 5 6IMT-SHINJUKUSAMO 293 4 1 2 3 5 6IMT-SHINJUKUSAMO 301 5 1 2 3 4 6IMT-SHINJUKUSAMO 309 6 1 2 3 4 5
Condition:
Ec/NoNth cell SC >= Ec/NoBest Serving cell SC
– NeighHyst dB
Compare with existing Neighbor List
TEMS Cell File
Figure 3-37: Potential neighbor (I)
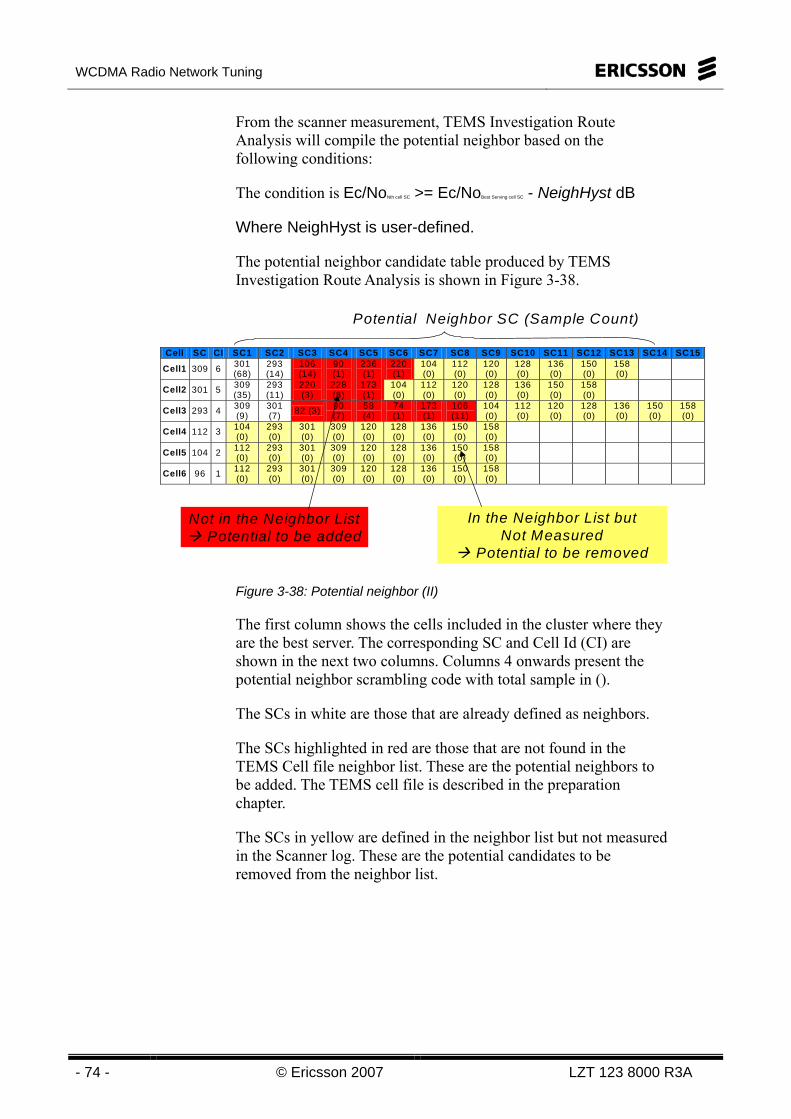
WCDMA Radio Network Tuning
- 74 - © Ericsson 2007 LZT 123 8000 R3A
From the scanner measurement, TEMS Investigation Route Analysis will compile the potential neighbor based on the following conditions:
The condition is Ec/NoNth cell SC >= Ec/NoBest Serving cell SC - NeighHyst dB
Where NeighHyst is user-defined.
The potential neighbor candidate table produced by TEMS Investigation Route Analysis is shown in Figure 3-38.
Cell SC CI SC1 SC2 SC3 SC4 SC5 SC6 SC7 SC8 SC9 SC10 SC11 SC12 SC13 SC14 SC15
Cell1 309 6 301 (68)
293 (14)
106 (14)
90 (1)
236 (1)
220 (1)
104 (0)
112 (0)
120 (0)
128 (0)
136 (0)
150 (0)
158 (0)
Cell2 301 5 309 (35)
293 (11)
220 (3)
228 (8)
173 (1)
104 (0)
112 (0)
120 (0)
128 (0)
136 (0)
150 (0)
158 (0)
Cell3 293 4 309 (9)
301 (7) 82 (3) 90
(7) 58 (4)
74 (1)
173 (1)
106 (11)
104 (0)
112 (0)
120 (0)
128 (0)
136 (0)
150 (0)
158 (0)
Cell4 112 3 104 (0)
293 (0)
301 (0)
309 (0)
120 (0)
128 (0)
136 (0)
150 (0)
158 (0)
Cell5 104 2 112 (0)
293 (0)
301 (0)
309 (0)
120 (0)
128 (0)
136 (0)
150 (0)
158 (0)
Cell6 96 1 112 (0)
293 (0)
301 (0)
309 (0)
120 (0)
128 (0)
136 (0)
150 (0)
158 (0)
Potential Neighbor SC (Sample Count)
Not in the Neighbor ListPotential to be added
In the Neighbor List butNot Measured
Potential to be removed
Figure 3-38: Potential neighbor (II)
The first column shows the cells included in the cluster where they are the best server. The corresponding SC and Cell Id (CI) are shown in the next two columns. Columns 4 onwards present the potential neighbor scrambling code with total sample in ().
The SCs in white are those that are already defined as neighbors.
The SCs highlighted in red are those that are not found in the TEMS Cell file neighbor list. These are the potential neighbors to be added. The TEMS cell file is described in the preparation chapter.
The SCs in yellow are defined in the neighbor list but not measured in the Scanner log. These are the potential candidates to be removed from the neighbor list.

Table of Contents
LZT 123 8000 R3A © Ericsson 2007 - 75 -
CHANGE PROPOSALS Prior to evaluating the site changes it is necessary to study the following (together with customer or similar RF person with site knowledge):
• Site photos (panorama)
• Building height, blocking, obstructions or risk for shadowing (not allowing excessive down tilt), antenna installation drawings and photos.
• Tilt type, the type of antenna tilt used in this sector, i.e., mechanical and/or electrical, or none.
• Antenna radiation patterns (horizontal and vertical), the antenna radiation patterns are needed, including the maximum antenna gain.
Below, there are some possible solutions described to combat overshooting and other coverage problems:
Antenna tilt
Antennas can be tilted in two different ways:
• Mechanically: When an antenna is mechanically tilted, the gain in the main direction is reduced, whereas the gain in other directions might be less affected.
• Electrically: When an antenna is electrically tilted, the gain is reduced in all directions.
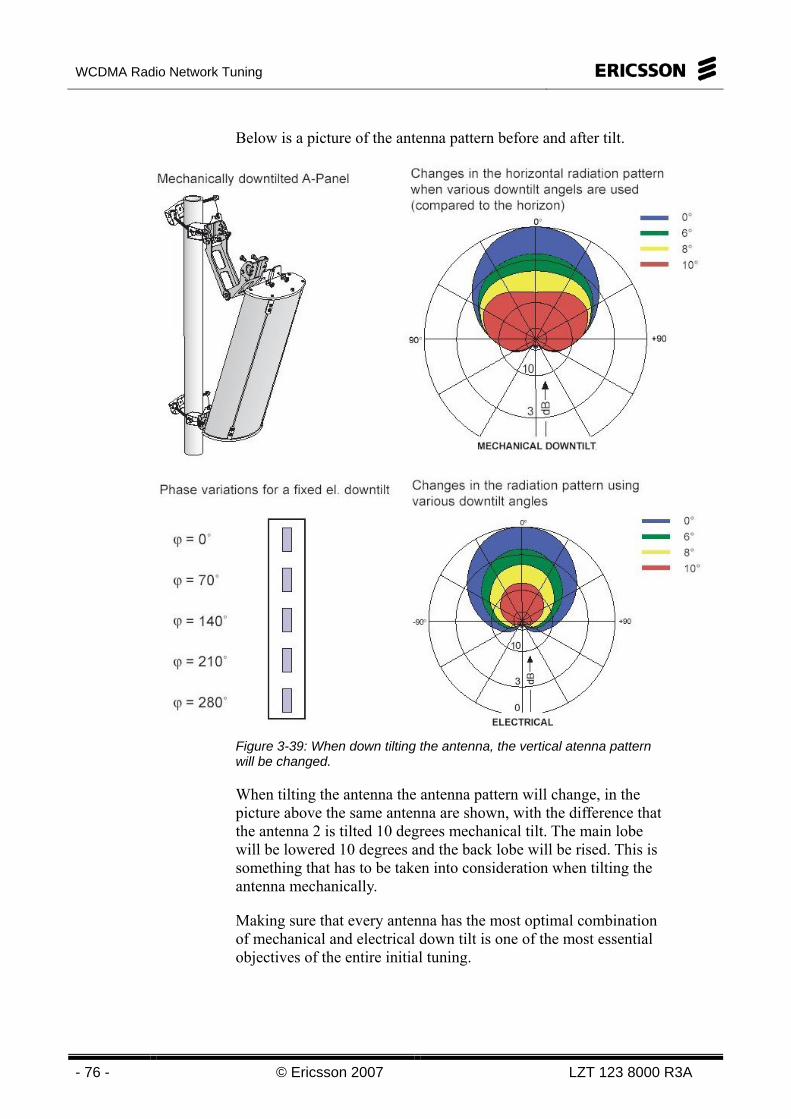
WCDMA Radio Network Tuning
- 76 - © Ericsson 2007 LZT 123 8000 R3A
Below is a picture of the antenna pattern before and after tilt.
Figure 3-39: When down tilting the antenna, the vertical atenna pattern will be changed.
When tilting the antenna the antenna pattern will change, in the picture above the same antenna are shown, with the difference that the antenna 2 is tilted 10 degrees mechanical tilt. The main lobe will be lowered 10 degrees and the back lobe will be rised. This is something that has to be taken into consideration when tilting the antenna mechanically.
Making sure that every antenna has the most optimal combination of mechanical and electrical down tilt is one of the most essential objectives of the entire initial tuning.

Table of Contents
LZT 123 8000 R3A © Ericsson 2007 - 77 -
The RET, Remote Electrical Tilt, allows remote antenna electrical down tilt by means of phase shifting the antenna elements. The RET unit contains a communications interface and a step motor to engage the antenna’s tilt mechanism.It is controlled via the Antenna System Controller (ASC). The access to the RET functionality is provided via the BTS Element Manager and via OSS-RC, however in order to support Ericsson’s remote antenna tilting solution, the RET unit as well as the Antenna System Controller (ASC) is mandatory.
Antenna change
It is often desired that an antenna would cover a narrower or wider area. In such a case, a cost-efficient solution is to change the antenna. In most Ericsson systems, the vast majority of antennas are 65-degree. Changing to a narrower 30-degree antenna does limit the coverage area to the main direction. It should however be noted that narrow antennas tend to have relatively large side lobes. For a wider coverage area, for example a 90-degree antenna could be tried.
Antenna azimuth change
As the antenna azimuth is changed, the lobe is re-directed towards a new area; Coverage is lost in the main direction but improved in the new direction.
When changing the azimuth it is important to check that lack of coverage in some area is not due to some other obstacle, as an azimuth change will have very little effect in such a case.
Antenna location on the roof or mast
The final location on the rooftop of an antenna sometimes has a very significant impact on the performance. Antennas mounted high above the rooftop might have a back lobe that causes interference. Similarly, the antenna might overshoot in its main direction and might be moved down. Moving down such an antenna so that some roof structure provides a back lobe obstacle can improve the performance.
Another possibility would be that an antenna is obstructed on the roof or by a nearby building so that the coverage area is not good enough. Such antennas should be moved to a better location.
Changes including moving antennas are often expensive and might include new negotiations with the building owner and possibly new building permits. It is thus important to be sure an improvement can be achieved prior to implementation.
WCDMA Radio Network Tuning
- 78 - © Ericsson 2007 LZT 123 8000 R3A
Pilot power reduction
As the power of CPICH (Common Pilot Channel) is reduced, the pilot signal of the cell becomes weaker both in its intended coverage area as well as in the areas where it causes interference and pilot pollution. While the reduction of pilot pollution is good, the reduction of pilot power in the intended coverage area might have negative consequences. The most obvious problem that arises is that the handover border is moved closer to the cell with reduced CPICH power. Thus, the demands on neighboring cells to cope with the radio environment increase. After a CPICH power change, it is necessary to verify performance both in the area where improvement was intended as well as in the ordinary coverage area of the cell.
Switch off sectors
Occasionally, it might be necessary to switch off an individual sector of a cell if it provides only limited coverage, but adds significant interference or causes pilot pollution.
Table of Contents
LZT 123 8000 R3A © Ericsson 2007 - 79 -
4 UE Tuning – Circuit Switched Data
Objectives
Upon completion of this chapter the student will be able to:
• Explain the process of UE tuning circuit switched data
• Define and show different performance indicators using TEMS Investigation Route Analysis
• Explain accessibility
• Explain retainability
• Explain integrity
Figure 4-1: Chapter Objectives

WCDMA Radio Network Tuning
- 80 - © Ericsson 2007 LZT 123 8000 R3A
Intentionally blank
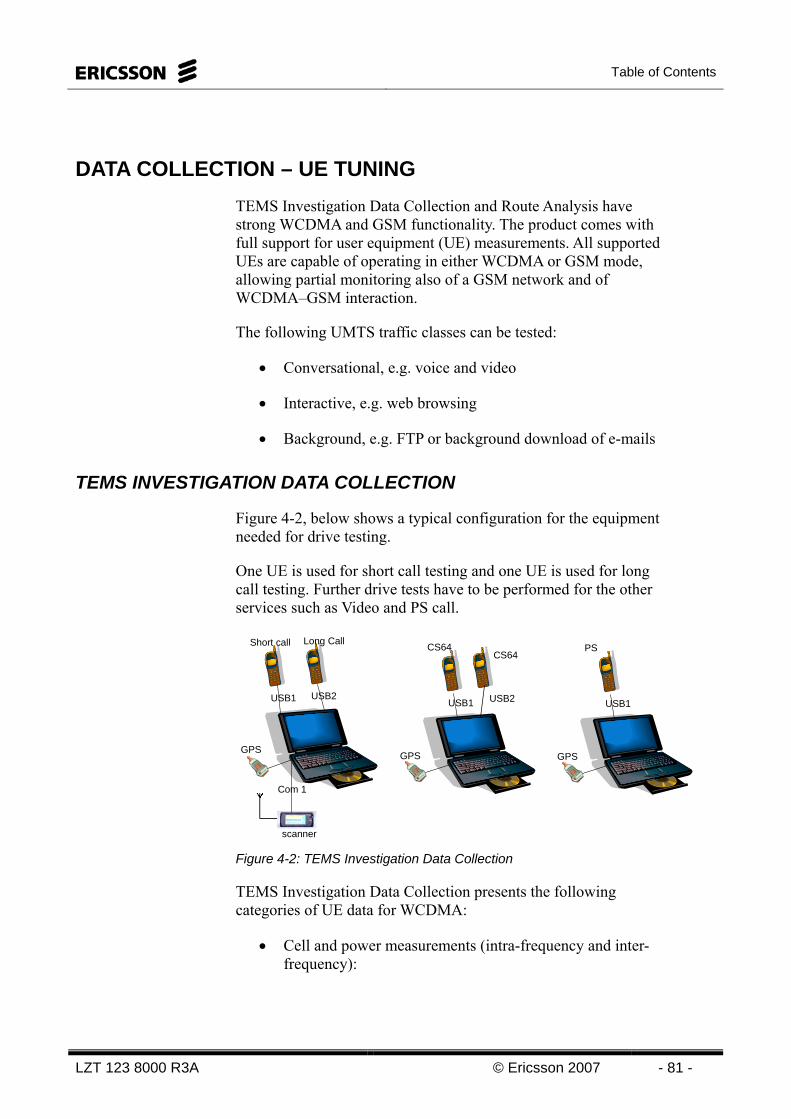
Table of Contents
LZT 123 8000 R3A © Ericsson 2007 - 81 -
DATA COLLECTION – UE TUNING TEMS Investigation Data Collection and Route Analysis have strong WCDMA and GSM functionality. The product comes with full support for user equipment (UE) measurements. All supported UEs are capable of operating in either WCDMA or GSM mode, allowing partial monitoring also of a GSM network and of WCDMA–GSM interaction.
The following UMTS traffic classes can be tested:
• Conversational, e.g. voice and video
• Interactive, e.g. web browsing
• Background, e.g. FTP or background download of e-mails
TEMS INVESTIGATION DATA COLLECTION
Figure 4-2, below shows a typical configuration for the equipment needed for drive testing.
One UE is used for short call testing and one UE is used for long call testing. Further drive tests have to be performed for the other services such as Video and PS call.
USB2 USB1
Com 1
scanner
Short call Long Call
USB1
CS64
GPS GPS
USB1
PS
GPS
USB2
CS64
Figure 4-2: TEMS Investigation Data Collection
TEMS Investigation Data Collection presents the following categories of UE data for WCDMA:
• Cell and power measurements (intra-frequency and inter-frequency):
WCDMA Radio Network Tuning
- 82 - © Ericsson 2007 LZT 123 8000 R3A
– Composition of active set/monitored neighbor set
– CPICH Ec/No, RSCP, and TxPower measurements
– Pathloss
– UE Tx Power
– UTRA Carrier RSSI
– RRC State
• Downlink Inner loop power control: SIR, Target SIR
• BLER (block error rate) by transport channel
• Signaling: RRC/NAS messages
• Uplink signal strength, uplink interference
• Soft handover tracking
• GSM neighbor measurements (i.e. while still in WCDMA mode)
A subset of this data (mainly RRC/NAS messages) is used to derive a number of predefined events, including call, handover, active set modification, and PDP context events.
From one or several logfiles the user can generate a report in HTML format, which summarizes the data in the logfiles.
Logfiles can be exported as plain-text ASCII files with tab-separated columns (extension .fmt), conveniently viewed with a spreadsheet program. The user specifies precisely what data to export, down to individual values of complex information elements. Logfiles can also be exported in formats that are compatible with the following applications:
• MapInfo
• ArcView
• Planet
Site data can be imported in any of these formats:
• Text format, tab separated (.cel)
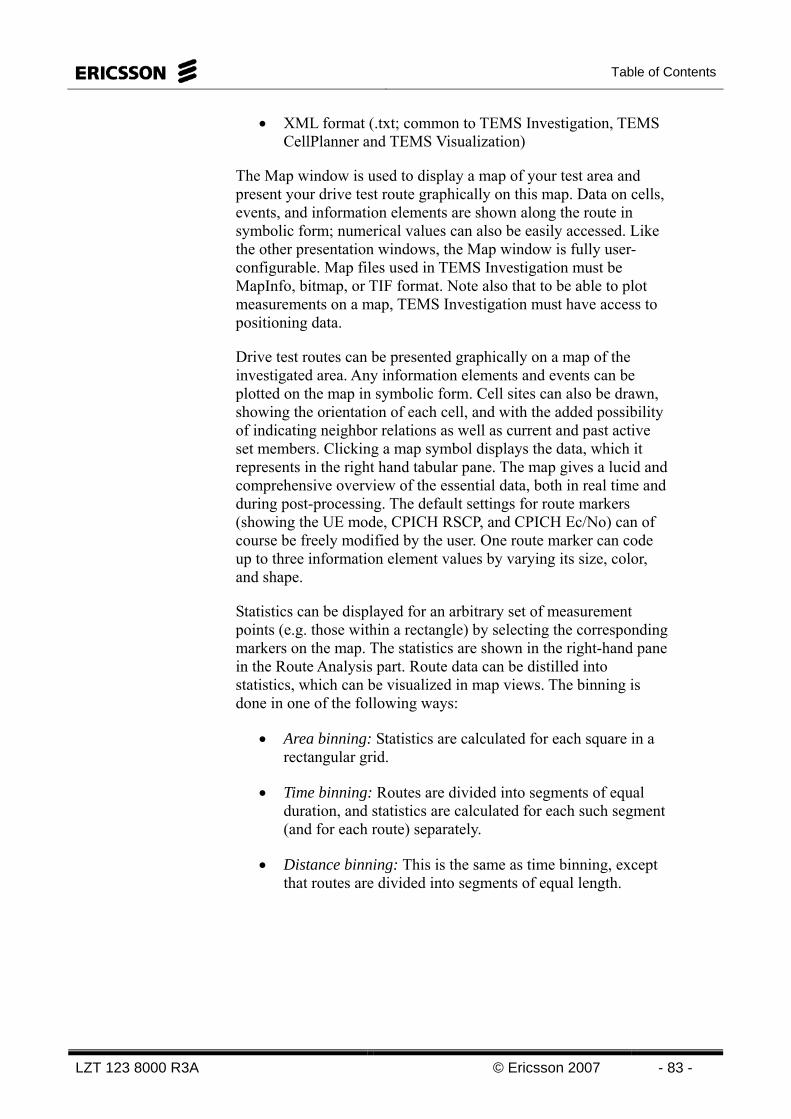
Table of Contents
LZT 123 8000 R3A © Ericsson 2007 - 83 -
• XML format (.txt; common to TEMS Investigation, TEMS CellPlanner and TEMS Visualization)
The Map window is used to display a map of your test area and present your drive test route graphically on this map. Data on cells, events, and information elements are shown along the route in symbolic form; numerical values can also be easily accessed. Like the other presentation windows, the Map window is fully user-configurable. Map files used in TEMS Investigation must be MapInfo, bitmap, or TIF format. Note also that to be able to plot measurements on a map, TEMS Investigation must have access to positioning data.
Drive test routes can be presented graphically on a map of the investigated area. Any information elements and events can be plotted on the map in symbolic form. Cell sites can also be drawn, showing the orientation of each cell, and with the added possibility of indicating neighbor relations as well as current and past active set members. Clicking a map symbol displays the data, which it represents in the right hand tabular pane. The map gives a lucid and comprehensive overview of the essential data, both in real time and during post-processing. The default settings for route markers (showing the UE mode, CPICH RSCP, and CPICH Ec/No) can of course be freely modified by the user. One route marker can code up to three information element values by varying its size, color, and shape.
Statistics can be displayed for an arbitrary set of measurement points (e.g. those within a rectangle) by selecting the corresponding markers on the map. The statistics are shown in the right-hand pane in the Route Analysis part. Route data can be distilled into statistics, which can be visualized in map views. The binning is done in one of the following ways:
• Area binning: Statistics are calculated for each square in a rectangular grid.
• Time binning: Routes are divided into segments of equal duration, and statistics are calculated for each such segment (and for each route) separately.
• Distance binning: This is the same as time binning, except that routes are divided into segments of equal length.
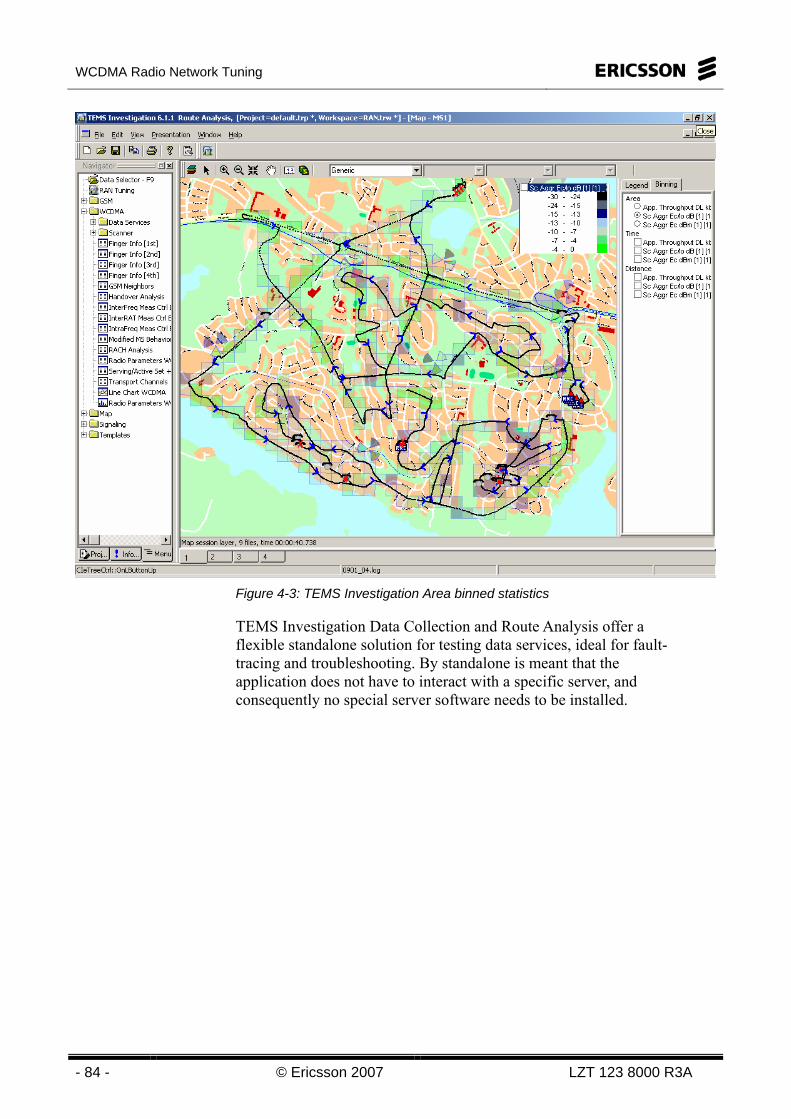
WCDMA Radio Network Tuning
- 84 - © Ericsson 2007 LZT 123 8000 R3A
Figure 4-3: TEMS Investigation Area binned statistics
TEMS Investigation Data Collection and Route Analysis offer a flexible standalone solution for testing data services, ideal for fault-tracing and troubleshooting. By standalone is meant that the application does not have to interact with a specific server, and consequently no special server software needs to be installed.
Table of Contents
LZT 123 8000 R3A © Ericsson 2007 - 85 -
In Figure 4-4 below there is an example of a command sequence with a short call. The UE is calling to a fixed test number in the network.
Figure 4-4: TEMS Investigation Data Collection short call command sequence
When creating a voice command sequence, a test number must be available. This number is set in the MSC. In the figure above the MS1 is dialing a test number. However a UE can also call another UE in the sequence.
To create a command sequence, the cntrl & config tab in TEMS Investigation Data Collection part should be used.
1. Add a command by choosing what type of command that should be added. Choose Recording and start the logfile recording. Then choose the General tab to choose the Loop function . Enter the Equipment name that should be used for the short call command sequence. In this case it is MS1. The Test number should be entered. Redial on event should be enabled. This is to ensure that the UE is dialing the number if the call is blocked. The event should be “blocked call”.
2. Add a general command; wait for an event. This will create a short call of 90 seconds but also catch a dropped call in 3G by this method. The target equipment should be the same as dialing (MS2).
3. Add a recording command – stop the recording
WCDMA Radio Network Tuning
- 86 - © Ericsson 2007 LZT 123 8000 R3A
POSTPROCESSING Currently there are a number of ways of post processing the collected data that can be used during initial tuning activities to facilitate the whole process:
• TEMS Investigation
o Data Collection Part
o Route Analysis Part
• MapInfo
When analyzing the logfiles from a cluster it is important to get an overview of the clusters performance. This is done through the following steps:
3. Through the TEMS Investigation Route Analysis part, generate scatter charts in order to find the clusters limitations considering Ec and Ec/No levels
4. Through the TEMS Investigation Route Analysis part, the data selector will find the blocked and dropped calls
5. ACCESSIBILITY - Analyzing the blocked calls through the Route Analysis and the Data collection part.
6. RETAINABILITY - Analyzing the dropped calls through the Route Analysis and the Data collection part
When analyzing the blocked and dropped calls it is necessary to find if they are blocked and dropped in the same area. It is also necessary to find if it is only the short or long call UE that has the problem.
TEMS INVESTIGATION ROUTE ANALYSIS
TEMS Investigation Route Analysis provides RAN Tuning report to get a summary of the performance in the network. With this report, the user can quickly identify the overall performance of the cluster and the problem cells.
The output from RAN Tuning consists of a report in Microsoft Word format and optionally a set of MapInfo files. The contents of the report are customized in the RAN Tuning setup wizard. The report layout is governed by Microsoft Word templates (DOT files).
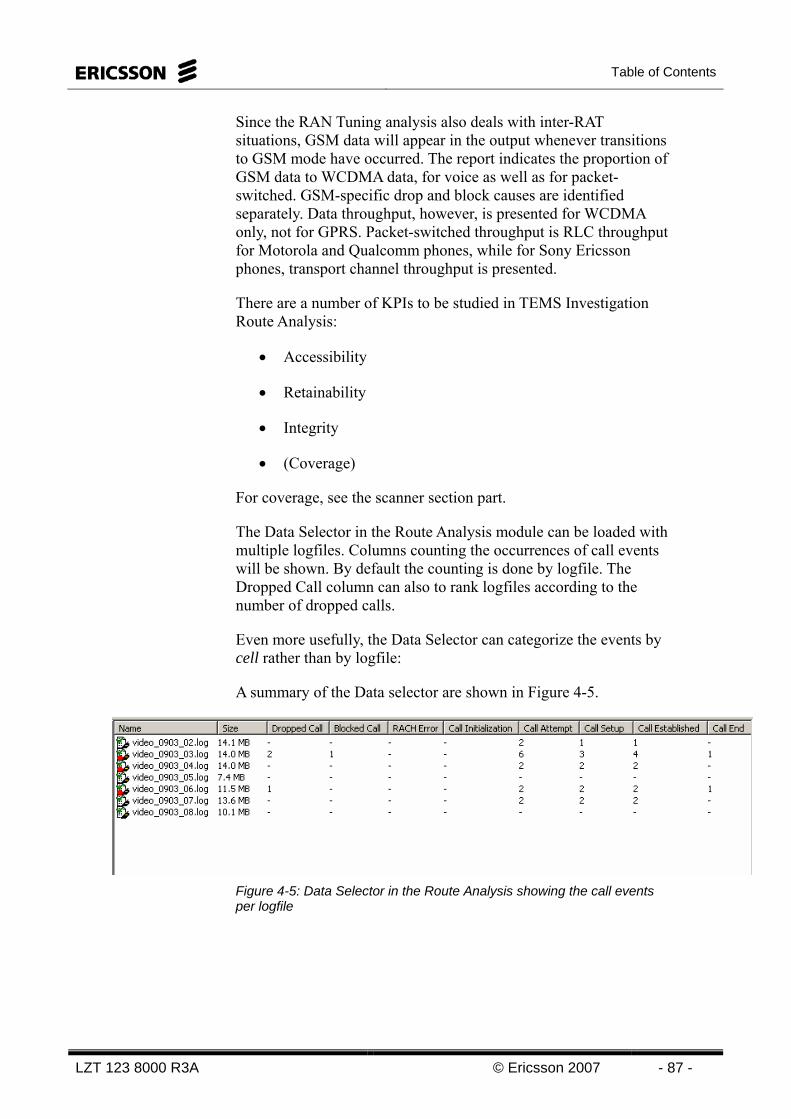
Table of Contents
LZT 123 8000 R3A © Ericsson 2007 - 87 -
Since the RAN Tuning analysis also deals with inter-RAT situations, GSM data will appear in the output whenever transitions to GSM mode have occurred. The report indicates the proportion of GSM data to WCDMA data, for voice as well as for packet-switched. GSM-specific drop and block causes are identified separately. Data throughput, however, is presented for WCDMA only, not for GPRS. Packet-switched throughput is RLC throughput for Motorola and Qualcomm phones, while for Sony Ericsson phones, transport channel throughput is presented.
There are a number of KPIs to be studied in TEMS Investigation Route Analysis:
• Accessibility
• Retainability
• Integrity
• (Coverage)
For coverage, see the scanner section part.
The Data Selector in the Route Analysis module can be loaded with multiple logfiles. Columns counting the occurrences of call events will be shown. By default the counting is done by logfile. The Dropped Call column can also to rank logfiles according to the number of dropped calls.
Even more usefully, the Data Selector can categorize the events by cell rather than by logfile:
A summary of the Data selector are shown in Figure 4-5.
Figure 4-5: Data Selector in the Route Analysis showing the call events per logfile
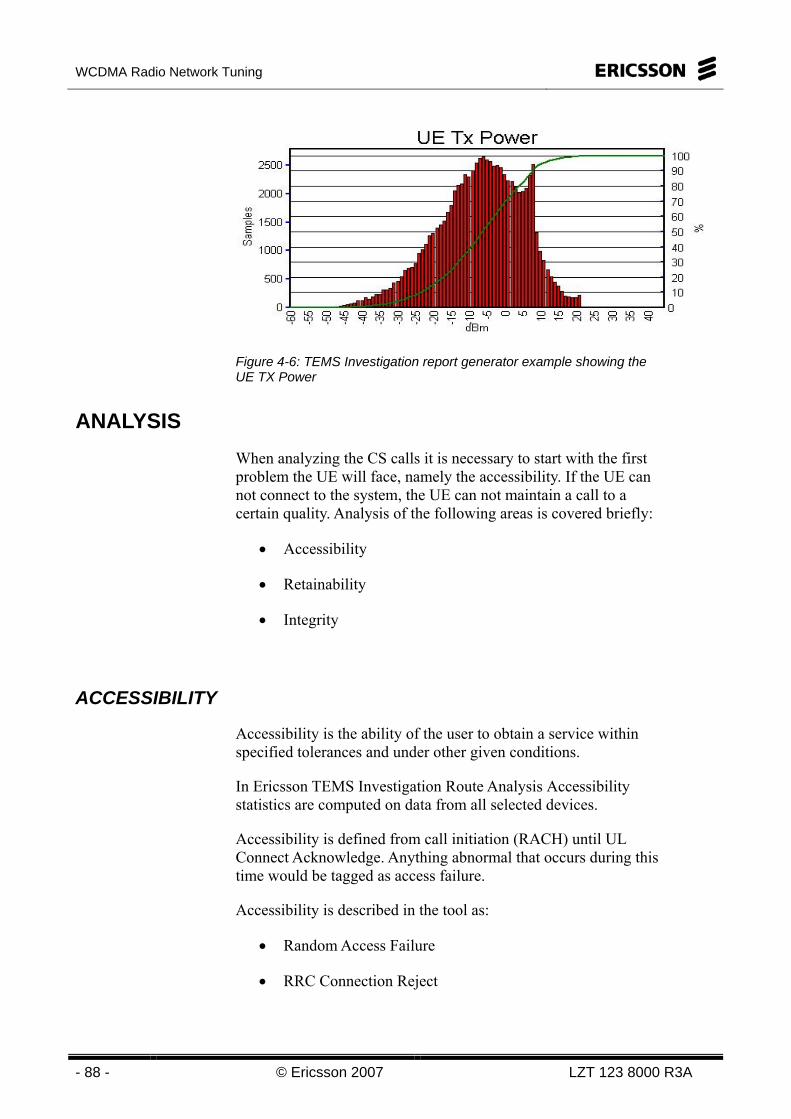
WCDMA Radio Network Tuning
- 88 - © Ericsson 2007 LZT 123 8000 R3A
Figure 4-6: TEMS Investigation report generator example showing the UE TX Power
ANALYSIS When analyzing the CS calls it is necessary to start with the first problem the UE will face, namely the accessibility. If the UE can not connect to the system, the UE can not maintain a call to a certain quality. Analysis of the following areas is covered briefly:
• Accessibility
• Retainability
• Integrity
ACCESSIBILITY
Accessibility is the ability of the user to obtain a service within specified tolerances and under other given conditions.
In Ericsson TEMS Investigation Route Analysis Accessibility statistics are computed on data from all selected devices.
Accessibility is defined from call initiation (RACH) until UL Connect Acknowledge. Anything abnormal that occurs during this time would be tagged as access failure.
Accessibility is described in the tool as:
• Random Access Failure
• RRC Connection Reject
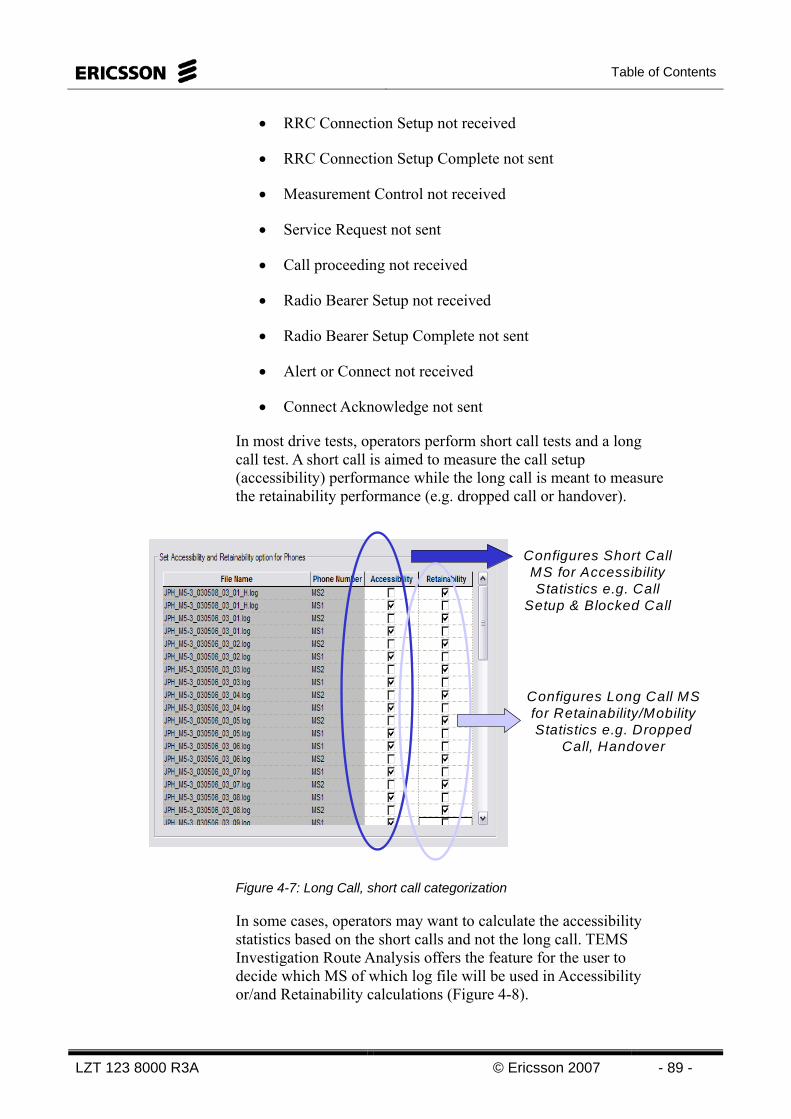
Table of Contents
LZT 123 8000 R3A © Ericsson 2007 - 89 -
• RRC Connection Setup not received
• RRC Connection Setup Complete not sent
• Measurement Control not received
• Service Request not sent
• Call proceeding not received
• Radio Bearer Setup not received
• Radio Bearer Setup Complete not sent
• Alert or Connect not received
• Connect Acknowledge not sent
In most drive tests, operators perform short call tests and a long call test. A short call is aimed to measure the call setup (accessibility) performance while the long call is meant to measure the retainability performance (e.g. dropped call or handover).
Configures Short Call MS for Accessibility Statistics e.g. Call
Setup & Blocked Call
Configures Long Call MS for Retainability/Mobility Statistics e.g. Dropped
Call, Handover
Figure 4-7: Long Call, short call categorization
In some cases, operators may want to calculate the accessibility statistics based on the short calls and not the long call. TEMS Investigation Route Analysis offers the feature for the user to decide which MS of which log file will be used in Accessibility or/and Retainability calculations (Figure 4-8).
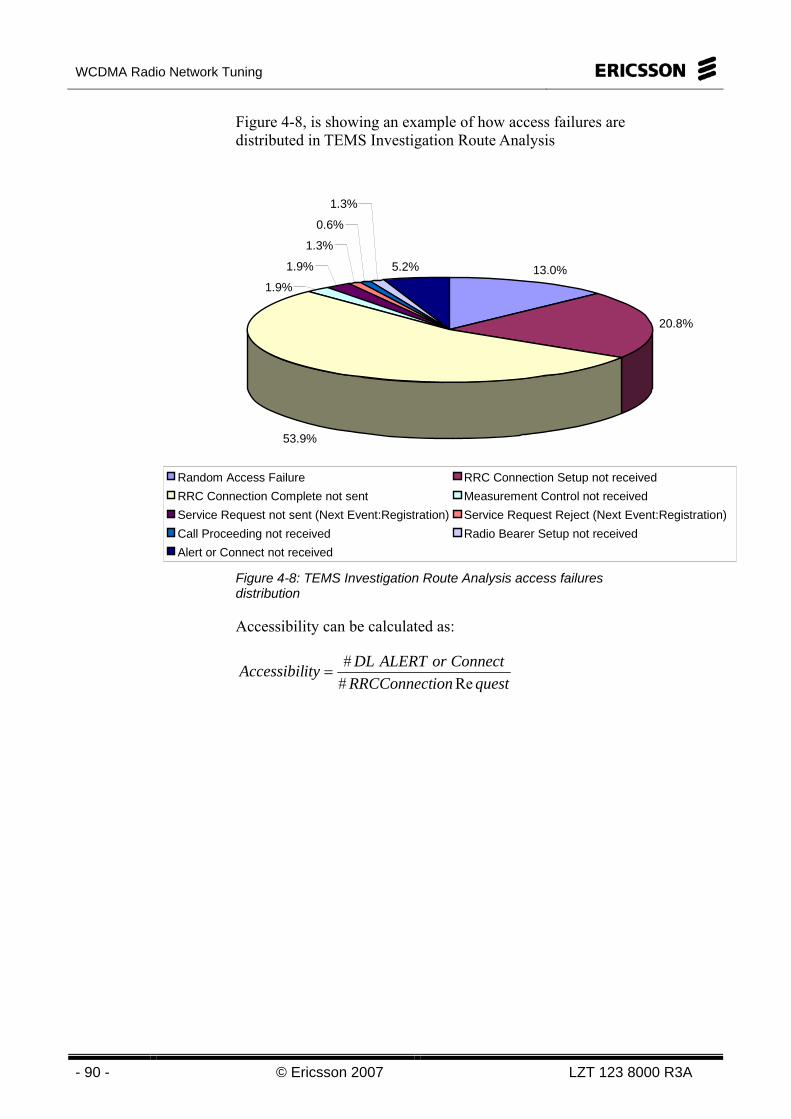
WCDMA Radio Network Tuning
- 90 - © Ericsson 2007 LZT 123 8000 R3A
Figure 4-8, is showing an example of how access failures are distributed in TEMS Investigation Route Analysis
Figure 4-8: TEMS Investigation Route Analysis access failures distribution
Accessibility can be calculated as:
questionRRCConnectConnectorALERTDLityAccessibilRe#
#=
13.0%
20.8%
53.9%
1.9%
1.9%
1.3%
0.6%
1.3%
5.2%
Random Access Failure RRC Connection Setup not receivedRRC Connection Complete not sent Measurement Control not receivedService Request not sent (Next Event:Registration) Service Request Reject (Next Event:Registration)Call Proceeding not received Radio Bearer Setup not receivedAlert or Connect not received
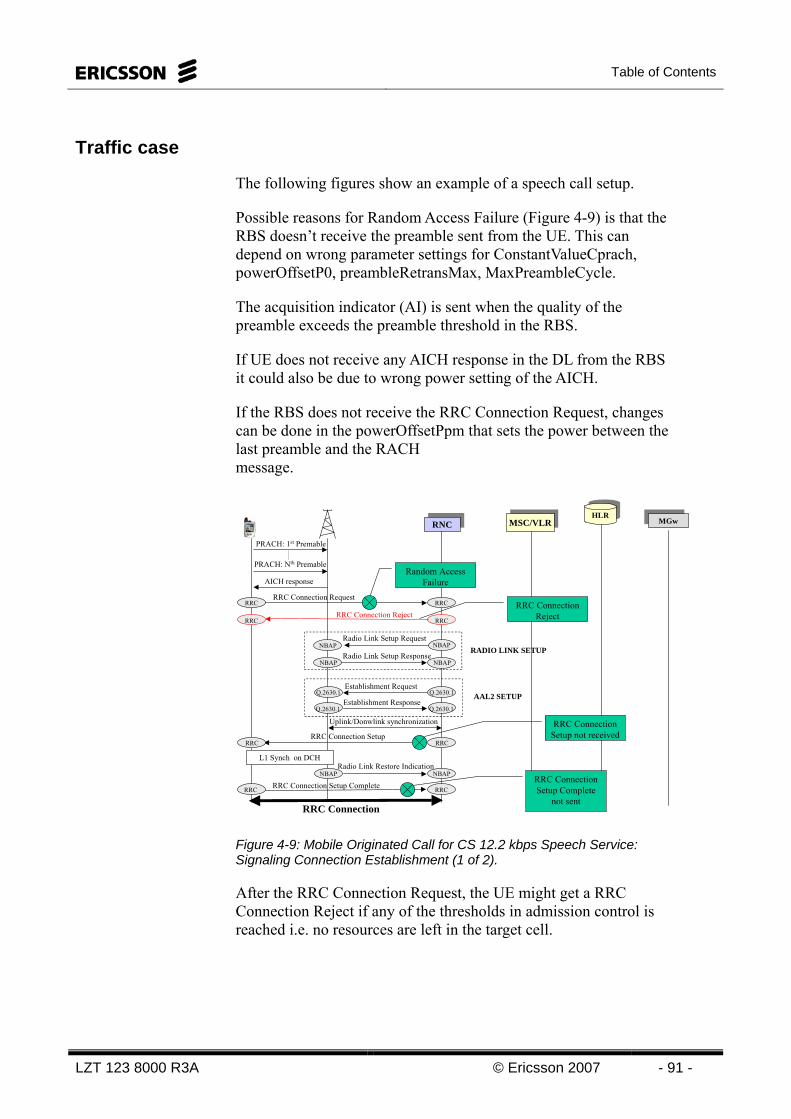
Table of Contents
LZT 123 8000 R3A © Ericsson 2007 - 91 -
Traffic case
The following figures show an example of a speech call setup.
Possible reasons for Random Access Failure (Figure 4-9) is that the RBS doesn’t receive the preamble sent from the UE. This can depend on wrong parameter settings for ConstantValueCprach, powerOffsetP0, preambleRetransMax, MaxPreambleCycle.
The acquisition indicator (AI) is sent when the quality of the preamble exceeds the preamble threshold in the RBS.
If UE does not receive any AICH response in the DL from the RBS it could also be due to wrong power setting of the AICH.
If the RBS does not receive the RRC Connection Request, changes can be done in the powerOffsetPpm that sets the power between the last preamble and the RACH message.
RNCRNC MSC/VLRMSC/VLRMGwMGw
HLRHLR
L1 Synch on DCH
RRC Connection
PRACH: 1st Premable
PRACH: Nth Premable
AICH response
RRC Connection Request
Radio Link Setup Request
Radio Link Setup Response
RRC Connection Setup
RRC Connection Setup Complete
Q.2630.1
Q.2630.1
Q.2630.1
NBAP
Q.2630.1
NBAPNBAP
NBAP
RRC RRC
RRC RRC
NBAP NBAP
RRC RRC
Establishment Request
Establishment Response
RADIO LINK SETUP
AAL2 SETUP
Radio Link Restore Indication
Random Access Failure
RRC Connection RejectRRC RRC
RRC Connection Reject
RRC Connection Setup not received
RRC Connection Setup Complete
not sent
Uplink/Donwlink synchronization
Figure 4-9: Mobile Originated Call for CS 12.2 kbps Speech Service: Signaling Connection Establishment (1 of 2).
After the RRC Connection Request, the UE might get a RRC Connection Reject if any of the thresholds in admission control is reached i.e. no resources are left in the target cell.
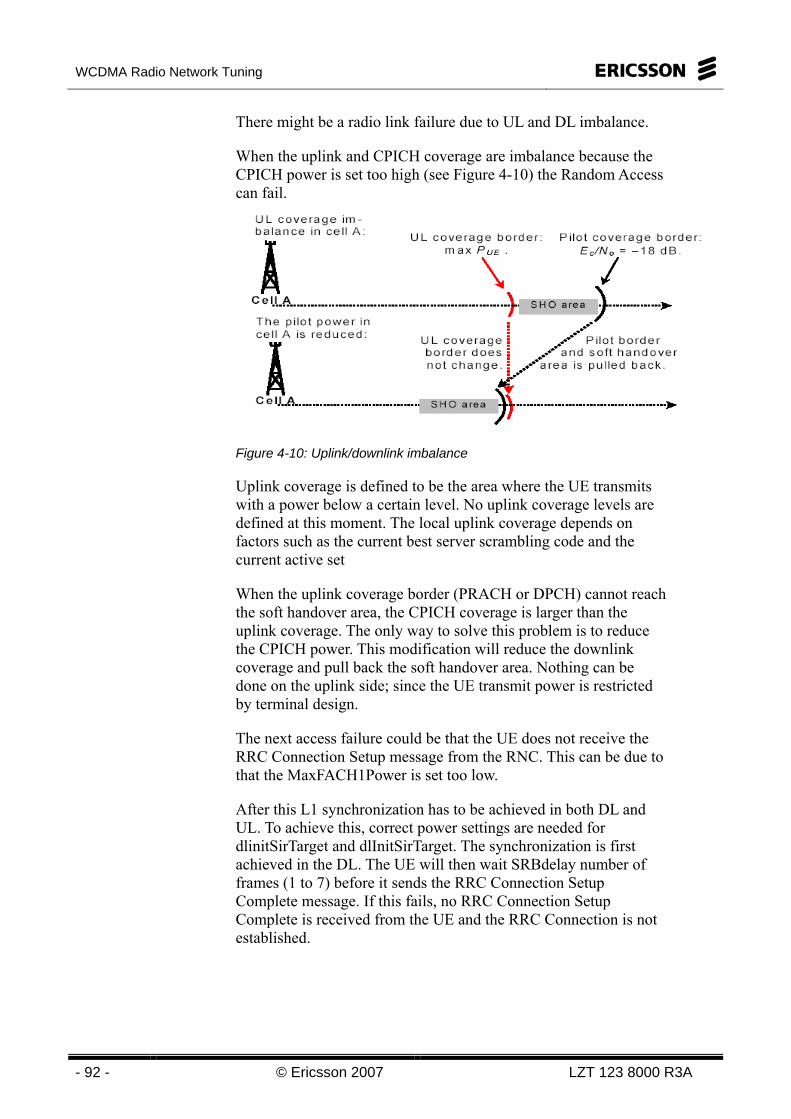
WCDMA Radio Network Tuning
- 92 - © Ericsson 2007 LZT 123 8000 R3A
There might be a radio link failure due to UL and DL imbalance.
When the uplink and CPICH coverage are imbalance because the CPICH power is set too high (see Figure 4-10) the Random Access can fail.
Figure 4-10: Uplink/downlink imbalance
Uplink coverage is defined to be the area where the UE transmits with a power below a certain level. No uplink coverage levels are defined at this moment. The local uplink coverage depends on factors such as the current best server scrambling code and the current active set
When the uplink coverage border (PRACH or DPCH) cannot reach the soft handover area, the CPICH coverage is larger than the uplink coverage. The only way to solve this problem is to reduce the CPICH power. This modification will reduce the downlink coverage and pull back the soft handover area. Nothing can be done on the uplink side; since the UE transmit power is restricted by terminal design.
The next access failure could be that the UE does not receive the RRC Connection Setup message from the RNC. This can be due to that the MaxFACH1Power is set too low.
After this L1 synchronization has to be achieved in both DL and UL. To achieve this, correct power settings are needed for dlinitSirTarget and dlInitSirTarget. The synchronization is first achieved in the DL. The UE will then wait SRBdelay number of frames (1 to 7) before it sends the RRC Connection Setup Complete message. If this fails, no RRC Connection Setup Complete is received from the UE and the RRC Connection is not established.
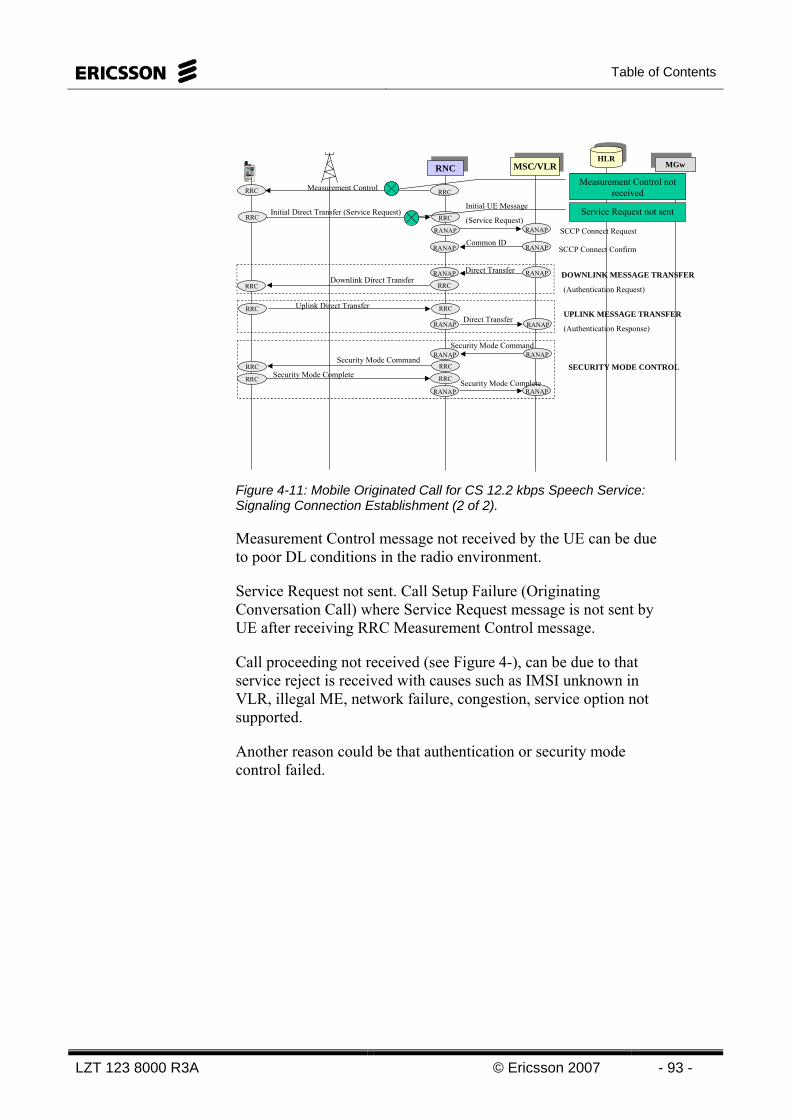
Table of Contents
LZT 123 8000 R3A © Ericsson 2007 - 93 -
RNCRNC MSC/VLRMSC/VLRMGwMGw
HLRHLR
Measurement Control RRC RRC
Initial Direct Transfer (Service Request)RRC RRC
SCCP Connect Confirm
Initial UE Message
(Service Request)
RANAPRANAP Direct Transfer
RRC RRCDownlink Direct Transfer DOWNLINK MESSAGE TRANSFER
(Authentication Request)
RANAPRANAP
RRC RRCUplink Direct TransferUPLINK MESSAGE TRANSFER
(Authentication Response)Direct Transfer
RANAPRANAPSecurity Mode Command
RRC RRCSecurity Mode Command
SECURITY MODE CONTROL
RANAP RANAP
RRC RRCSecurity Mode CompleteSecurity Mode Complete
Measurement Control not received
Service Request not sent
RANAPRANAP
RANAP RANAPCommon ID
SCCP Connect Request
Figure 4-11: Mobile Originated Call for CS 12.2 kbps Speech Service: Signaling Connection Establishment (2 of 2).
Measurement Control message not received by the UE can be due to poor DL conditions in the radio environment.
Service Request not sent. Call Setup Failure (Originating Conversation Call) where Service Request message is not sent by UE after receiving RRC Measurement Control message.
Call proceeding not received (see Figure 4-), can be due to that service reject is received with causes such as IMSI unknown in VLR, illegal ME, network failure, congestion, service option not supported.
Another reason could be that authentication or security mode control failed.
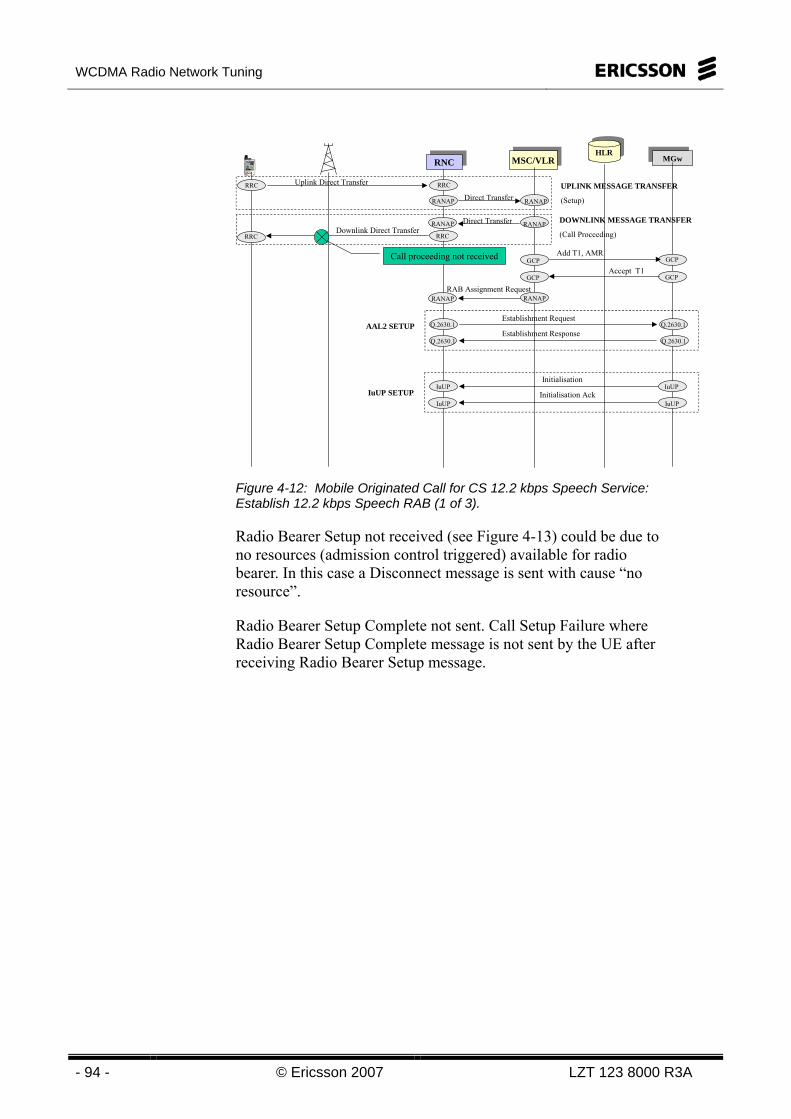
WCDMA Radio Network Tuning
- 94 - © Ericsson 2007 LZT 123 8000 R3A
RNCRNC MSC/VLRMSC/VLRMGwMGw
HLRHLR
RANAPRANAP
RRC RRCDownlink Direct Transfer
UPLINK MESSAGE TRANSFER
(Setup)
DOWNLINK MESSAGE TRANSFER
(Call Proceeding)
Direct Transfer
RAB Assignment RequestRANAP RANAP
Q.2630.1Q.2630.1Establishment Request
Establishment ResponseQ.2630.1 Q.2630.1
AAL2 SETUP
GCP GCP
GCP GCP
Add T1, AMR
Accept T1
Direct Transfer RANAPRANAP
RRC RRCUplink Direct Transfer
Call proceeding not received
IuUPIuUPInitialisation
Initialisation AckIuUP IuUP
IuUP SETUP
Figure 4-12: Mobile Originated Call for CS 12.2 kbps Speech Service: Establish 12.2 kbps Speech RAB (1 of 3).
Radio Bearer Setup not received (see Figure 4-13) could be due to no resources (admission control triggered) available for radio bearer. In this case a Disconnect message is sent with cause “no resource”.
Radio Bearer Setup Complete not sent. Call Setup Failure where Radio Bearer Setup Complete message is not sent by the UE after receiving Radio Bearer Setup message.
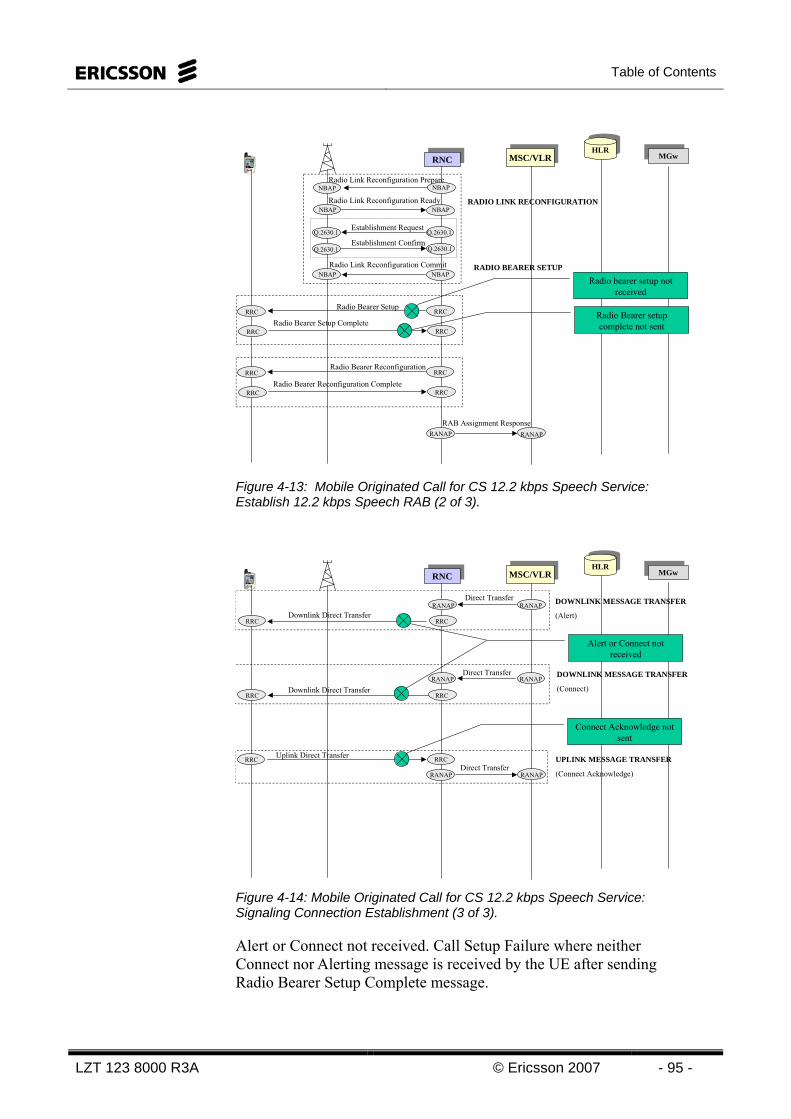
Table of Contents
LZT 123 8000 R3A © Ericsson 2007 - 95 -
RNCRNC MSC/VLRMSC/VLRMGwMGw
HLRHLR
RAB Assignment ResponseRANAP RANAP
RADIO BEARER SETUP
RRCRRC
RRCRRC
Radio Bearer Setup
Radio Bearer Setup Complete
RRCRRC
RRCRRC
Radio Bearer Reconfiguration
Radio Bearer Reconfiguration Complete
Radio bearer setup not received
Radio Bearer setup complete not sent
Radio Link Reconfiguration Prepare
Radio Link Reconfiguration ReadyNBAP
NBAPNBAP
NBAPRADIO LINK RECONFIGURATION
Q.2630.1Q.2630.1Establishment Request
Establishment ConfirmQ.2630.1 Q.2630.1
NBAPNBAPRadio Link Reconfiguration Commit
Figure 4-13: Mobile Originated Call for CS 12.2 kbps Speech Service: Establish 12.2 kbps Speech RAB (2 of 3).
RNCRNC MSC/VLRMSC/VLRMGwMGw
HLRHLR
DOWNLINK MESSAGE TRANSFER
(Alert)
UPLINK MESSAGE TRANSFER
(Connect Acknowledge)
DOWNLINK MESSAGE TRANSFER
(Connect)
RANAP RANAP
RANAP RANAP
RANAP RANAP
RRC
RRC
RRC
RRC
RRC
RRC
Direct Transfer
Direct Transfer
Direct TransferUplink Direct Transfer
Downlink Direct Transfer
Downlink Direct Transfer
Alert or Connect not received
Connect Acknowledge not sent
Figure 4-14: Mobile Originated Call for CS 12.2 kbps Speech Service: Signaling Connection Establishment (3 of 3).
Alert or Connect not received. Call Setup Failure where neither Connect nor Alerting message is received by the UE after sending Radio Bearer Setup Complete message.

WCDMA Radio Network Tuning
- 96 - © Ericsson 2007 LZT 123 8000 R3A
Connect Acknowledge not sent. Call Setup Failure where Connect Acknowledge message is not sent by UE after receiving Alert or Connect message.
The signaling tab in TEMS Investigation Data Collection (Figure 4-) covers important parts to study such as events, mode reports, L3 and L2 messages.
Figure 4-15: Signaling tab
Table of Contents
LZT 123 8000 R3A © Ericsson 2007 - 97 -
The purpose of events is to signify various interesting occurrences, mostly relating to the operation of the user equipment. Events are generated by the TEMS Investigation Data Collection software based on data received from the UE or other connected devices. Some examples of events in TEMS Investigation Data Collection are Blocked Call, Dropped Call, PDP Context Activation Failure, and Radio Link Addition Failure, all relating to the UE’s network connection. Events pertaining to calls and handover are generated in both GSM and WCDMA mode. Events are a vital part of TEMS Investigation Data Collection presentations and are often instrumental in directing the workflow of the network engineer. In combination with the searching and synchronization features of the application, events can save a lot of time in the troubleshooting and optimization process.
In the mode reports from the UE, e.g. concerning channel configuration, RACH parameters, and power control (these reports contain additional information not distilled into information elements) can be seen.
RETAINABILITY
Retainability is the ability of the user to keep a service, once it has been accessed, under given conditions for a requested period of time.
Retainability (drop call) are computed in TEMS Investigation Route Analysis are computed on data from all selected devices.
Retainability is defined as after UL: Connect Acknowledge, anything abnormal that occurs during this time would be tagged as drop call.
Every dropped call is classified according to the conditions prior to the drop. Drop call reasons are classified according to several radio environment criteria where the thresholds are user-defined.
The following user parameters are changeable in the user interface for Drop Call Classification:
• Drop RSCP
• Drop Ec/No
• Drop TxPower
• Drop DL BLER
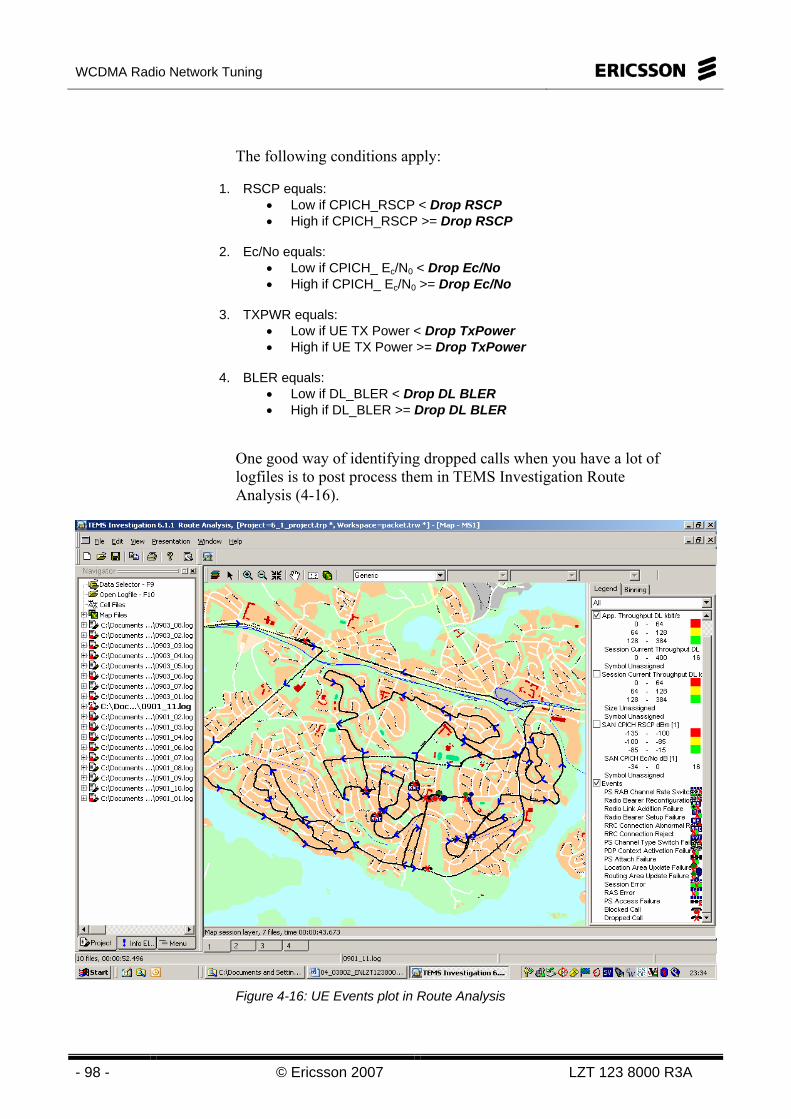
WCDMA Radio Network Tuning
- 98 - © Ericsson 2007 LZT 123 8000 R3A
The following conditions apply:
1. RSCP equals: • Low if CPICH_RSCP < Drop RSCP • High if CPICH_RSCP >= Drop RSCP
2. Ec/No equals: • Low if CPICH_ Ec/N0 < Drop Ec/No • High if CPICH_ Ec/N0 >= Drop Ec/No
3. TXPWR equals: • Low if UE TX Power < Drop TxPower • High if UE TX Power >= Drop TxPower
4. BLER equals: • Low if DL_BLER < Drop DL BLER • High if DL_BLER >= Drop DL BLER
One good way of identifying dropped calls when you have a lot of logfiles is to post process them in TEMS Investigation Route Analysis (4-16).
Figure 4-16: UE Events plot in Route Analysis
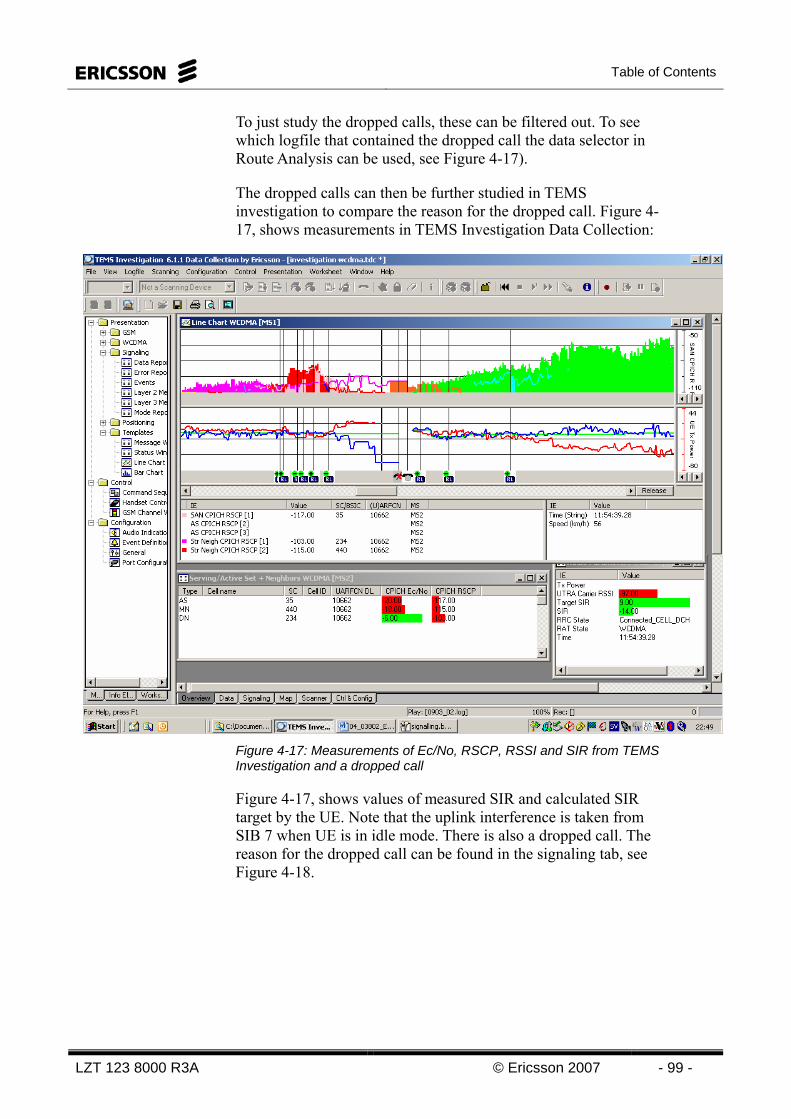
Table of Contents
LZT 123 8000 R3A © Ericsson 2007 - 99 -
To just study the dropped calls, these can be filtered out. To see which logfile that contained the dropped call the data selector in Route Analysis can be used, see Figure 4-17).
The dropped calls can then be further studied in TEMS investigation to compare the reason for the dropped call. Figure 4-17, shows measurements in TEMS Investigation Data Collection:
Figure 4-17: Measurements of Ec/No, RSCP, RSSI and SIR from TEMS Investigation and a dropped call
Figure 4-17, shows values of measured SIR and calculated SIR target by the UE. Note that the uplink interference is taken from SIB 7 when UE is in idle mode. There is also a dropped call. The reason for the dropped call can be found in the signaling tab, see Figure 4-18.
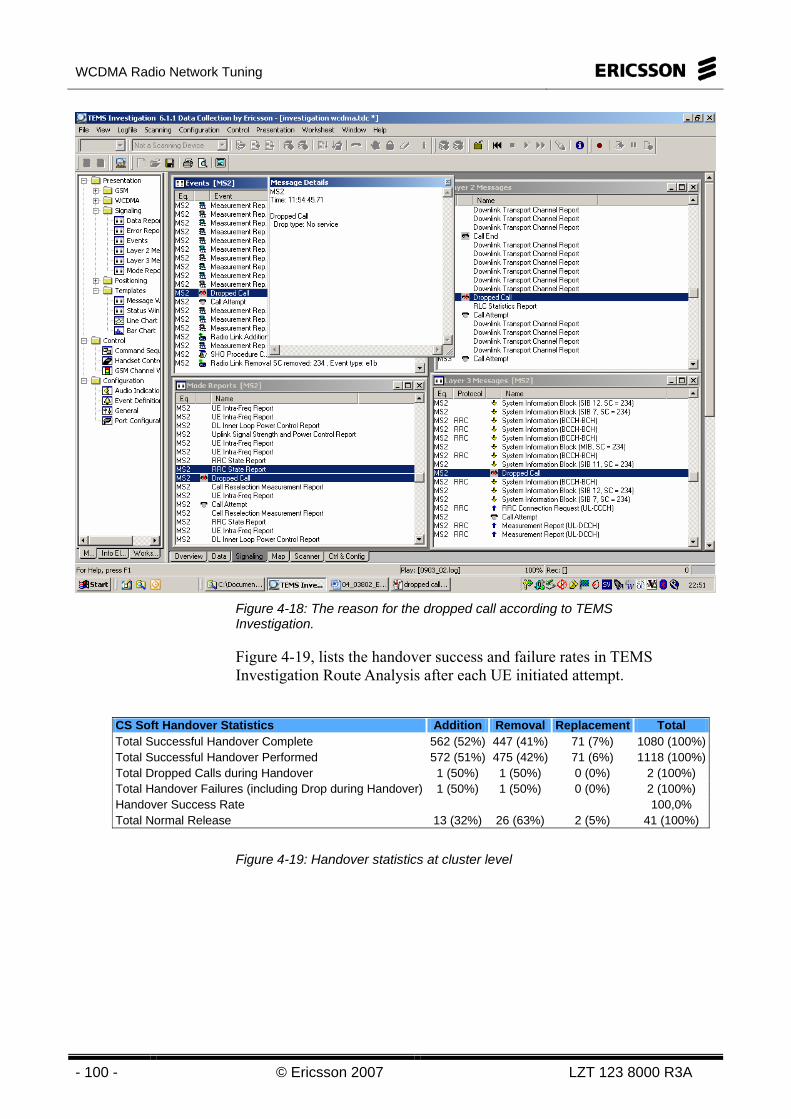
WCDMA Radio Network Tuning
- 100 - © Ericsson 2007 LZT 123 8000 R3A
Figure 4-18: The reason for the dropped call according to TEMS Investigation.
Figure 4-19, lists the handover success and failure rates in TEMS Investigation Route Analysis after each UE initiated attempt.
Figure 4-19: Handover statistics at cluster level
CS Soft Handover Statistics Addition Removal Replacement Total Total Successful Handover Complete 562 (52%) 447 (41%) 71 (7%) 1080 (100%)Total Successful Handover Performed 572 (51%) 475 (42%) 71 (6%) 1118 (100%)Total Dropped Calls during Handover 1 (50%) 1 (50%) 0 (0%) 2 (100%) Total Handover Failures (including Drop during Handover) 1 (50%) 1 (50%) 0 (0%) 2 (100%) Handover Success Rate 100,0% Total Normal Release 13 (32%) 26 (63%) 2 (5%) 41 (100%)
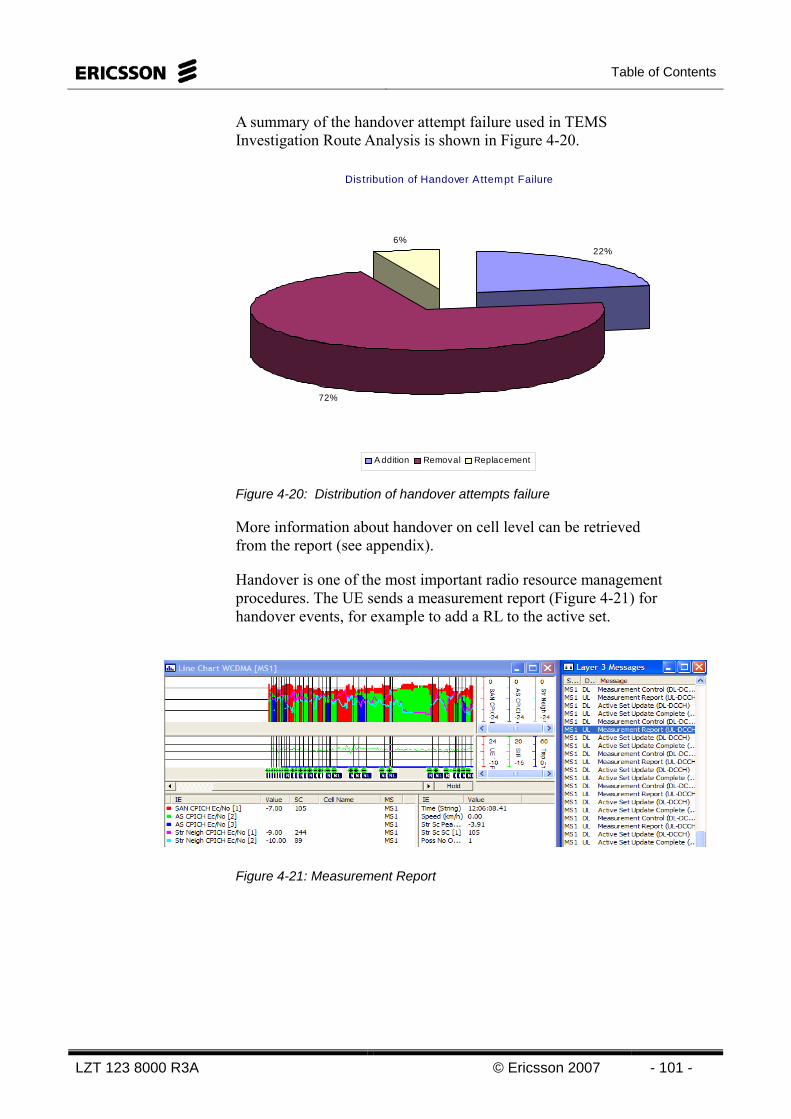
Table of Contents
LZT 123 8000 R3A © Ericsson 2007 - 101 -
A summary of the handover attempt failure used in TEMS Investigation Route Analysis is shown in Figure 4-20.
Distribution of Handover Attempt Failure
22%
72%
6%
A ddition Removal Replacement
Figure 4-20: Distribution of handover attempts failure
More information about handover on cell level can be retrieved from the report (see appendix).
Handover is one of the most important radio resource management procedures. The UE sends a measurement report (Figure 4-21) for handover events, for example to add a RL to the active set.
Figure 4-21: Measurement Report
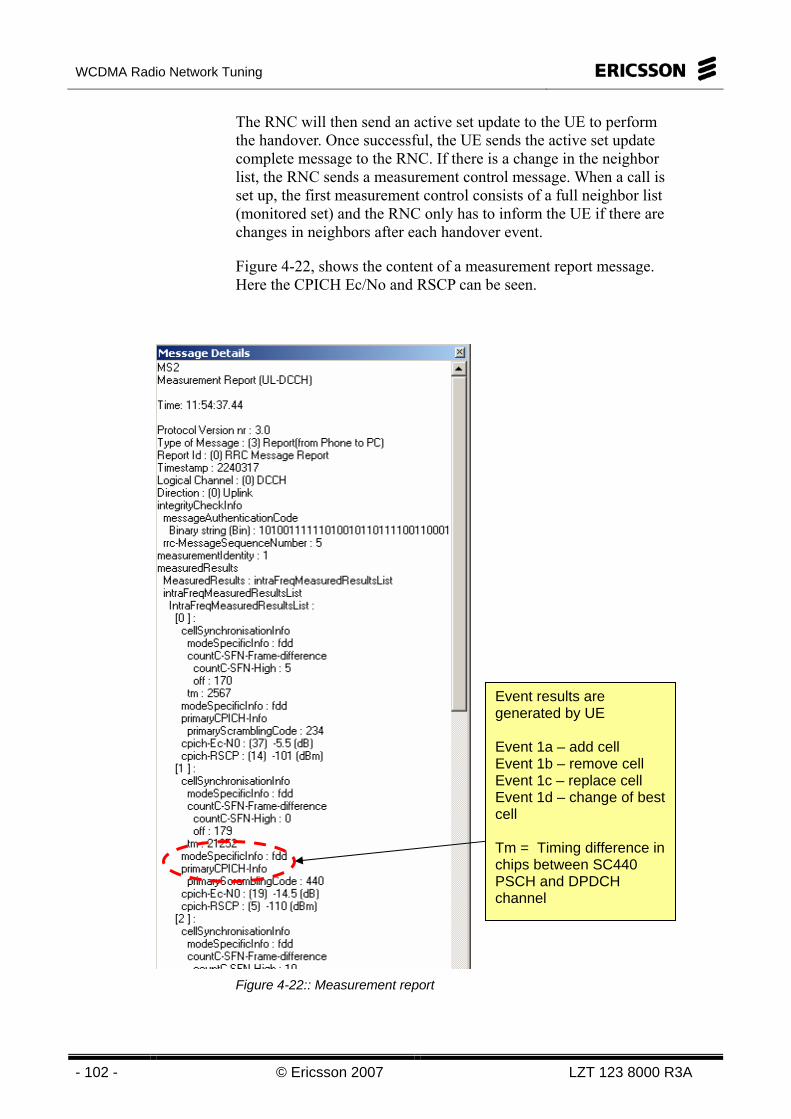
WCDMA Radio Network Tuning
- 102 - © Ericsson 2007 LZT 123 8000 R3A
The RNC will then send an active set update to the UE to perform the handover. Once successful, the UE sends the active set update complete message to the RNC. If there is a change in the neighbor list, the RNC sends a measurement control message. When a call is set up, the first measurement control consists of a full neighbor list (monitored set) and the RNC only has to inform the UE if there are changes in neighbors after each handover event.
Figure 4-22, shows the content of a measurement report message. Here the CPICH Ec/No and RSCP can be seen.
Figure 4-22:: Measurement report
Event results are generated by UE Event 1a – add cell Event 1b – remove cell Event 1c – replace cell Event 1d – change of best cell Tm = Timing difference in chips between SC440 PSCH and DPDCH channel
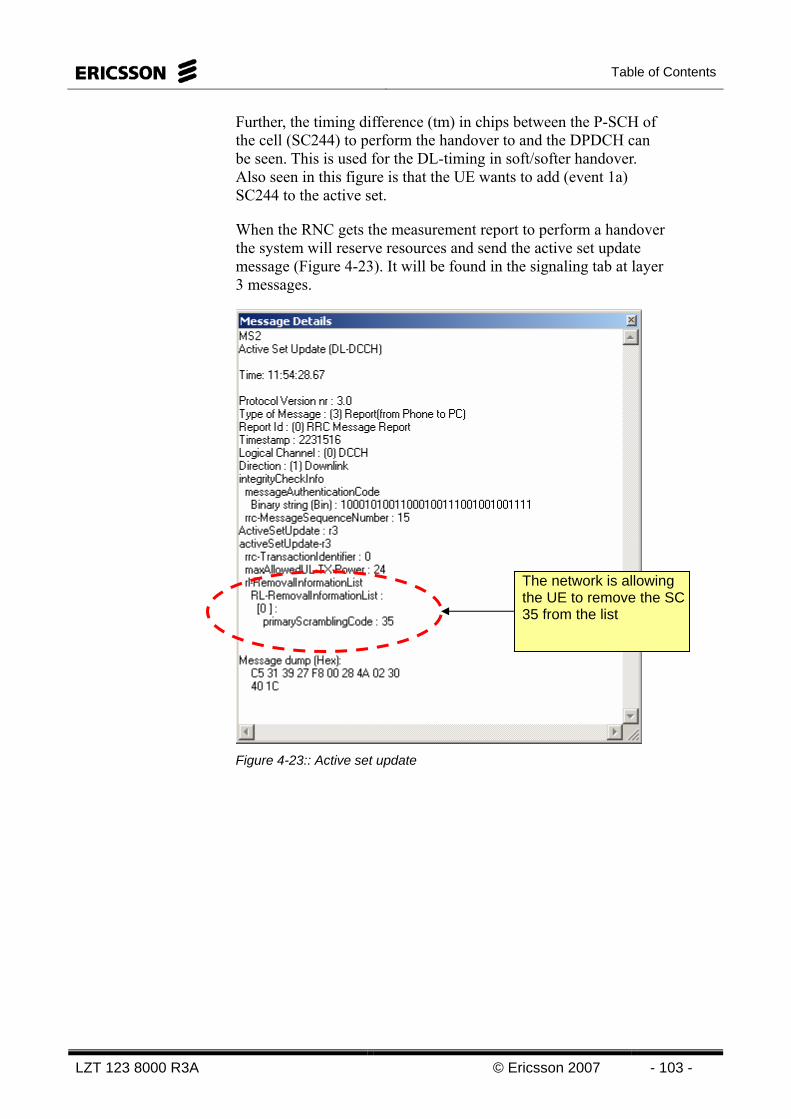
Table of Contents
LZT 123 8000 R3A © Ericsson 2007 - 103 -
Further, the timing difference (tm) in chips between the P-SCH of the cell (SC244) to perform the handover to and the DPDCH can be seen. This is used for the DL-timing in soft/softer handover. Also seen in this figure is that the UE wants to add (event 1a) SC244 to the active set.
When the RNC gets the measurement report to perform a handover the system will reserve resources and send the active set update message (Figure 4-23). It will be found in the signaling tab at layer 3 messages.
Figure 4-23:: Active set update
The network is allowing the UE to remove the SC 35 from the list
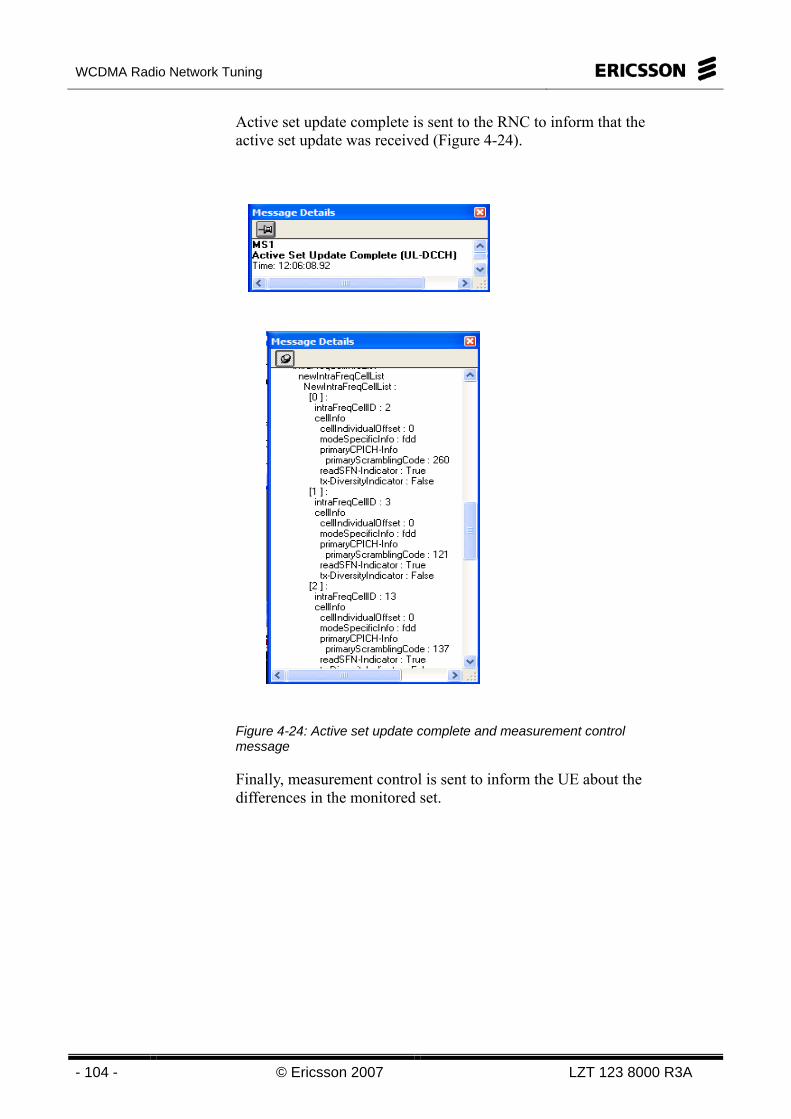
WCDMA Radio Network Tuning
- 104 - © Ericsson 2007 LZT 123 8000 R3A
Active set update complete is sent to the RNC to inform that the active set update was received (Figure 4-24).
Figure 4-24: Active set update complete and measurement control message
Finally, measurement control is sent to inform the UE about the differences in the monitored set.
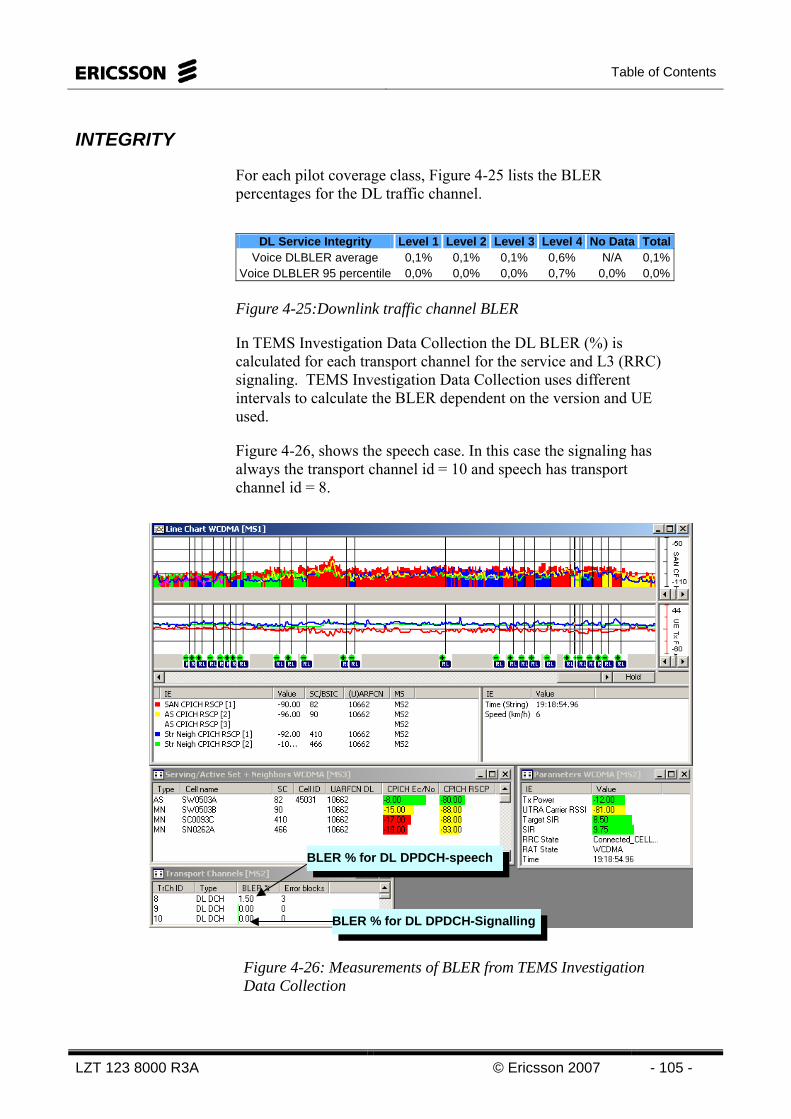
Table of Contents
LZT 123 8000 R3A © Ericsson 2007 - 105 -
INTEGRITY
For each pilot coverage class, Figure 4-25 lists the BLER percentages for the DL traffic channel.
DL Service Integrity Level 1 Level 2 Level 3 Level 4 No Data TotalVoice DLBLER average 0,1% 0,1% 0,1% 0,6% N/A 0,1%
Voice DLBLER 95 percentile 0,0% 0,0% 0,0% 0,7% 0,0% 0,0%
Figure 4-25:Downlink traffic channel BLER
In TEMS Investigation Data Collection the DL BLER (%) is calculated for each transport channel for the service and L3 (RRC) signaling. TEMS Investigation Data Collection uses different intervals to calculate the BLER dependent on the version and UE used.
Figure 4-26, shows the speech case. In this case the signaling has always the transport channel id = 10 and speech has transport channel id = 8.
BLER % for DL DPDCH-speechBLER % for DL DPDCH-speech
BLER % for DL DPDCH-SignallingBLER % for DL DPDCH-Signalling
Figure 4-26: Measurements of BLER from TEMS Investigation Data Collection

WCDMA Radio Network Tuning
- 106 - © Ericsson 2007 LZT 123 8000 R3A
Intentionally blank

Table of Contents
LZT 123 8000 R3A © Ericsson 2007 - 107 -
5 UE Tuning – Packet Data
Objectives
Upon completion of this chapter the student will be able to:
• Define and show different performance indicators using TEMS Investigation Route Analysis
• Explain accessibility
• Explain retainability
• Explain throughput
• Explain spreading factor usage
Figure 5-1: Chapter Objectives

WCDMA Radio Network Tuning
- 108 - © Ericsson 2007 LZT 123 8000 R3A
Intentionally blank
Table of Contents
LZT 123 8000 R3A © Ericsson 2007 - 109 -
TEMS INVESTIGATION – UE PACKET DATA TUNING UE Packet Data Tuning is often done after the network has been scanned and UE voice tuned. Most of the problems have already been found such as swapped feeders, wrong SC, pilot pollution and coverage problems.
The Serving GPRS Support Node (SGSN) performs all necessary functions in order to handle the packet switched services to and from the UE. The SGSN forwards incoming and outgoing IP packets addressed to/from an UE that is attached within the SGSN Service Area (SA). The SGSN provides packet routing and transfer to and from the SGSN Service Area. The SGSN also provides functions such as ciphering and authentication, session management and mobility management.
Preparations for the UE Packet Tuning should be done thoroughly. It is important to test both uplink and downlink capacity and quality. It is essential to be able to send data to an ftp server as well as download data from the same server. Many times there is a need of password and user data in order to connect to the server. The data sent and downloaded should be of two sorts, a small file and a much larger file. The packet data application http should also be tested. The packet data service availability is completely different than the voice service availability.
Data traffic can be generated from within the TEMS Investigation program, without any need for running a third-party application in parallel. FTP, HTTP, and ping sessions can be conducted directly using command sequences (a utility for recording and assigning sequences of commands to the UE). Parameters such as throughput and ping delay rates are measured at the application level, that is, they faithfully reflect the user-experienced performance of the services.
Data service measurements and reports include:
• Current uplink throughput at application level (kbit/s)
• Current downlink throughput at application level (kbit/s)
• Mean uplink throughput for current session at application level (kbit/s)
• Mean downlink throughput for current session at application level (kbit/s)
WCDMA Radio Network Tuning
- 110 - © Ericsson 2007 LZT 123 8000 R3A
• Bytes received and bytes sent at application level since dialup
• Bytes received and bytes sent at application level during current session
• Uplink and downlink throughput at RLC level (bytes/s)
• Ping delay (ms)
• Ping size (bytes)
• Connection duration
• Session duration
• IP address assigned to RAS client
A number of events report on the progress of the data testing, among them the following:
• RAS Dial
• RAS Hangup
• Session Start
• Session End
• Ping Success
• Ping Response
• Ping Timeout
Table of Contents
LZT 123 8000 R3A © Ericsson 2007 - 111 -
TEMS INVESTIGATION KEY PERFORMANCE INDICATORS TEMS Investigation provides Key Performance Indicator tables to get a summary of the performance in the network. With these charts and tables, the user can quickly identify the overall performance of the cluster and the problem cells.
There are a number of KPIs to be studied in TEMS Investigation:
• Accessibility
• Retainability
• Mobility
• Throughput
• Spreading Factor Usage
• (Coverage)
For coverage, see the pilot tuning part. For mobility regarding R99 traffic, see the circuit switched data tuning part.
ACCESSIBILITY
A packet call starts when a connection switches from the idle mode to one of the active states, and ends when the connection is switched back to the idle mode or when the UE is turned off. A packet call can consist of several sessions. In many cases traffic and average data rates are given based on a packet call. It is useful to convert this type of data to traffic based on sessions, since that is what will determine the interference as well as the hardware requirements for the radio access network.
There are periods of silence in between transmission where the dedicated channel is still allocated, but only the control channel is active. This may be if there is no data to send. This bursty behavior is typical of a packet application. The session length is defined from the time a dedicated channel is allocated to the time where the channel is released and the user is disconnected or moved to a common channel.
The Internet Protocol is the network layer protocol for packet switched data. IP allows the use of standard IP routing equipment in the transport network. This means that operators can carry their packet domain data from the WCDMA RAN over an IP core
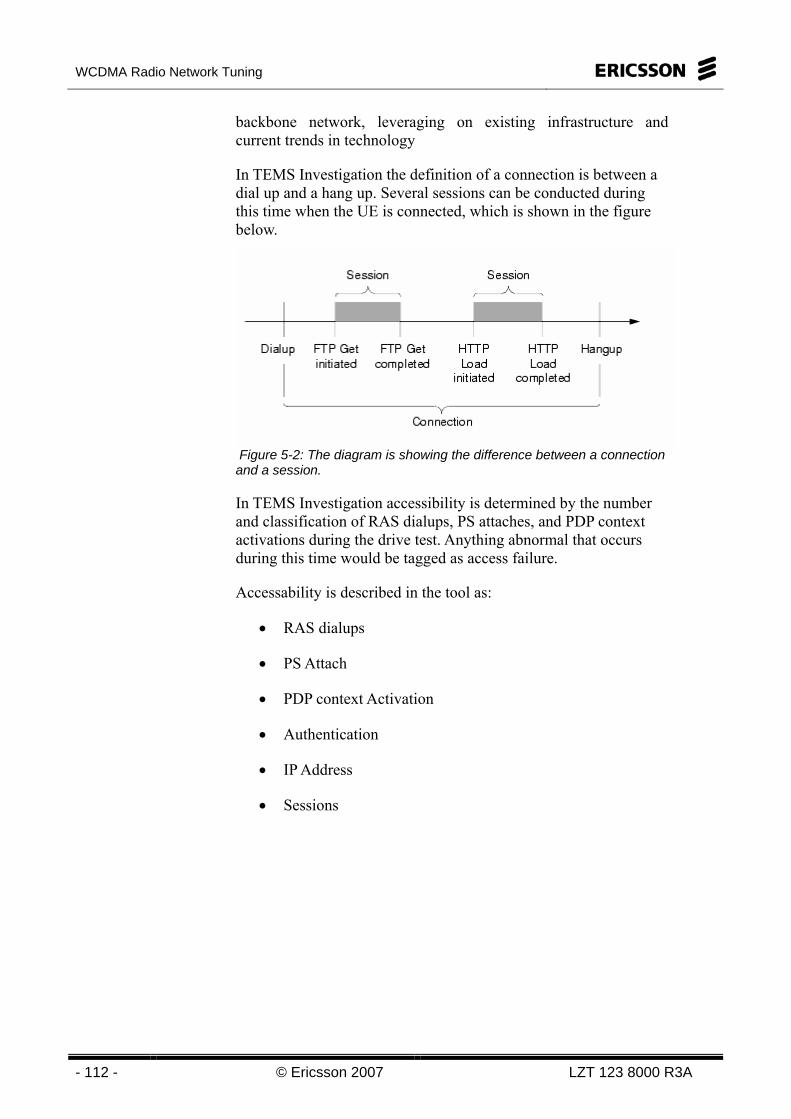
WCDMA Radio Network Tuning
- 112 - © Ericsson 2007 LZT 123 8000 R3A
backbone network, leveraging on existing infrastructure and current trends in technology
In TEMS Investigation the definition of a connection is between a dial up and a hang up. Several sessions can be conducted during this time when the UE is connected, which is shown in the figure below.
Figure 5-2: The diagram is showing the difference between a connection and a session.
In TEMS Investigation accessibility is determined by the number and classification of RAS dialups, PS attaches, and PDP context activations during the drive test. Anything abnormal that occurs during this time would be tagged as access failure.
Accessability is described in the tool as:
• RAS dialups
• PS Attach
• PDP context Activation
• Authentication
• IP Address
• Sessions

Table of Contents
LZT 123 8000 R3A © Ericsson 2007 - 113 -
An example of how access failures for packet data are distributed in TEMS Investigation Route Analysis are shown in Figure 5-3.
Distribution chart of PS RAS Error
67%
33%
block reason: other no ppp control protocols configured
Figure 5-3: TEMS Investigation Route Analysis access failures distribution
The uplink accessibility performance of the cluster is given in the Table 1 for each pilot coverage class
PS Data Accessibility Statistics Level 1 Level
2 Level 3 Level 4 No Data Total
Total PS RAS Dialup 0 (0%) 0 (0%) 0 (0%) 0 (0%) 28 (100%) 28 (100%)Total PS RAS Dialup Success 0 (0%) 0 (0%) 0 (0%) 0 (0%) 19 (100%) 19 (100%)Total PS Attach 0 (0%) 0 (0%) 0 (0%) 0 (0%) 1 (100%) 1 (100%)Total PS Attach Failure 0 0 0 0 0 0 Total PDP Context Activation 9 (39%) 0 (0%) 11 (48%) 1 (4%) 2 (9%) 23 (100%)Total PDP Context Reject 0 0 0 0 0 0 PS RAS Dialup Success Rate 67,9% PS Attach Success Rate 100,0% PDP Context Activation Success Rate 100,0%
Table 1 Cluster-level PS Accessibility Statistics
PS Setup Time Statistics Min Average MaxPS Attach 0,0 1,3 17,1PDP Context Activation 1,0 1,7 2,0PS Access 6,0 7,1 18,0
Table 2 PS Setup Time Statistics
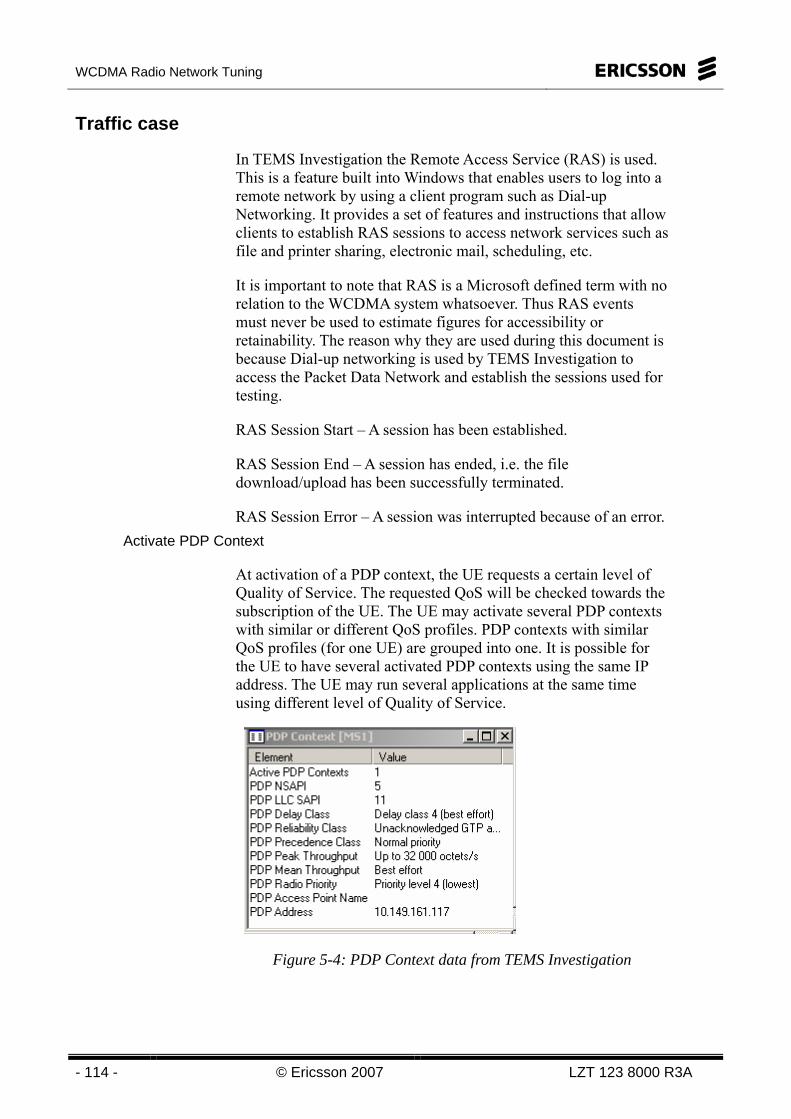
WCDMA Radio Network Tuning
- 114 - © Ericsson 2007 LZT 123 8000 R3A
Traffic case
In TEMS Investigation the Remote Access Service (RAS) is used. This is a feature built into Windows that enables users to log into a remote network by using a client program such as Dial-up Networking. It provides a set of features and instructions that allow clients to establish RAS sessions to access network services such as file and printer sharing, electronic mail, scheduling, etc.
It is important to note that RAS is a Microsoft defined term with no relation to the WCDMA system whatsoever. Thus RAS events must never be used to estimate figures for accessibility or retainability. The reason why they are used during this document is because Dial-up networking is used by TEMS Investigation to access the Packet Data Network and establish the sessions used for testing.
RAS Session Start – A session has been established.
RAS Session End – A session has ended, i.e. the file download/upload has been successfully terminated.
RAS Session Error – A session was interrupted because of an error. Activate PDP Context
At activation of a PDP context, the UE requests a certain level of Quality of Service. The requested QoS will be checked towards the subscription of the UE. The UE may activate several PDP contexts with similar or different QoS profiles. PDP contexts with similar QoS profiles (for one UE) are grouped into one. It is possible for the UE to have several activated PDP contexts using the same IP address. The UE may run several applications at the same time using different level of Quality of Service.
Figure 5-4: PDP Context data from TEMS Investigation
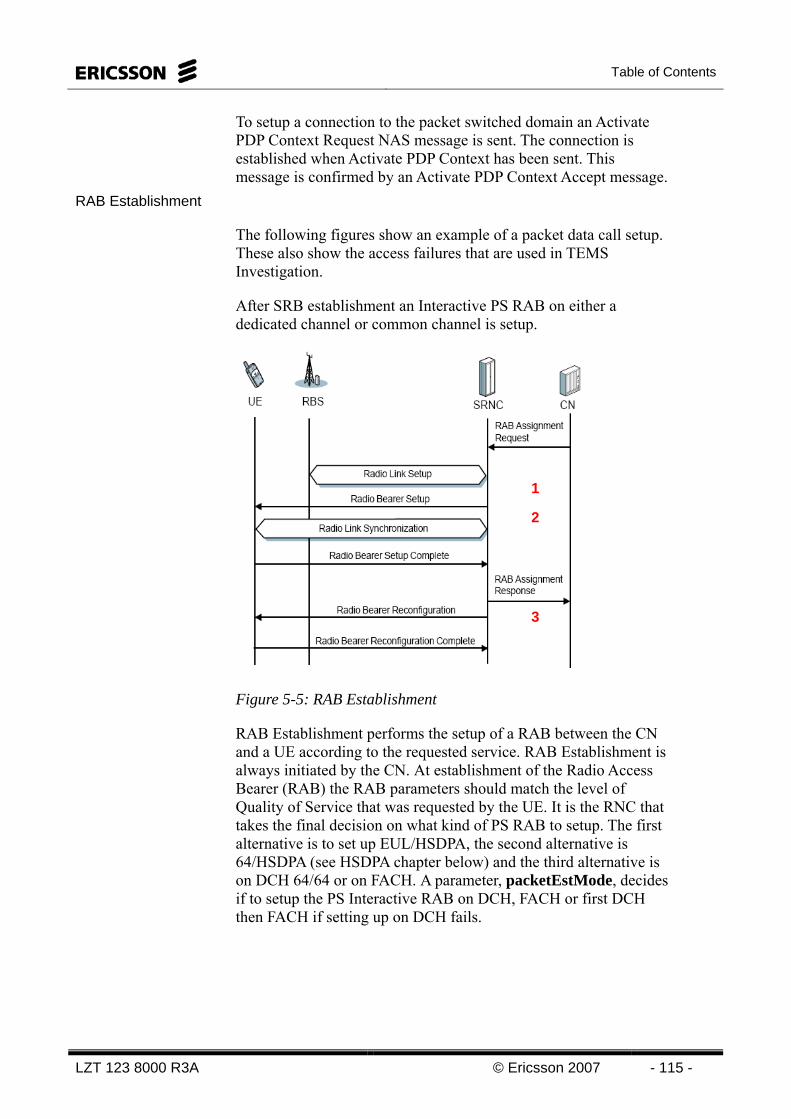
Table of Contents
LZT 123 8000 R3A © Ericsson 2007 - 115 -
To setup a connection to the packet switched domain an Activate PDP Context Request NAS message is sent. The connection is established when Activate PDP Context has been sent. This message is confirmed by an Activate PDP Context Accept message.
RAB Establishment
The following figures show an example of a packet data call setup. These also show the access failures that are used in TEMS Investigation.
After SRB establishment an Interactive PS RAB on either a dedicated channel or common channel is setup.
Figure 5-5: RAB Establishment
RAB Establishment performs the setup of a RAB between the CN and a UE according to the requested service. RAB Establishment is always initiated by the CN. At establishment of the Radio Access Bearer (RAB) the RAB parameters should match the level of Quality of Service that was requested by the UE. It is the RNC that takes the final decision on what kind of PS RAB to setup. The first alternative is to set up EUL/HSDPA, the second alternative is 64/HSDPA (see HSDPA chapter below) and the third alternative is on DCH 64/64 or on FACH. A parameter, packetEstMode, decides if to setup the PS Interactive RAB on DCH, FACH or first DCH then FACH if setting up on DCH fails.
1
2
3
WCDMA Radio Network Tuning
- 116 - © Ericsson 2007 LZT 123 8000 R3A
1. The Radio Link Setup procedure includes activities such as setting up the new radio link, AAL2 connections, power control settings for the new dedicated channel, permission from Admission Control to enter the cell, allocating scrambling codes and DL channelization code. The UE is ordered to setup the new RAB according to the data received in the Radio Bearer Set up message.
2. The Radio Link Synchronization procedure ensures that a layer 2 protocol stack for a dedicated channel is established in the RNC. It also synchronizes the downlink transport channels between the RNC and the RBS. The RBS starts transmission on the new radio link and layer 1 synchronization is achieved between the RBS and the UE.
3. A Radio Bearer Setup Complete message is sent from the UE to the SRNC. Measurements are now initiated for Soft/Softer Handover and Channel switching. A Radio Bearer Reconfiguration procedure is performed in order to reconfigure AM RLC parameters related to SRBs and the existing Interactive PS RAB. A Radio Bearer Reconfiguration procedure is performed in order to reconfigure AM RLC parameters related to SRBs and the existing Interactive PS RAB.
To release the PDP context, a Deactivate PDP Context Request message is sent from the UE to the CN. This message is followed by a Deactivate PDP Context Accept message.
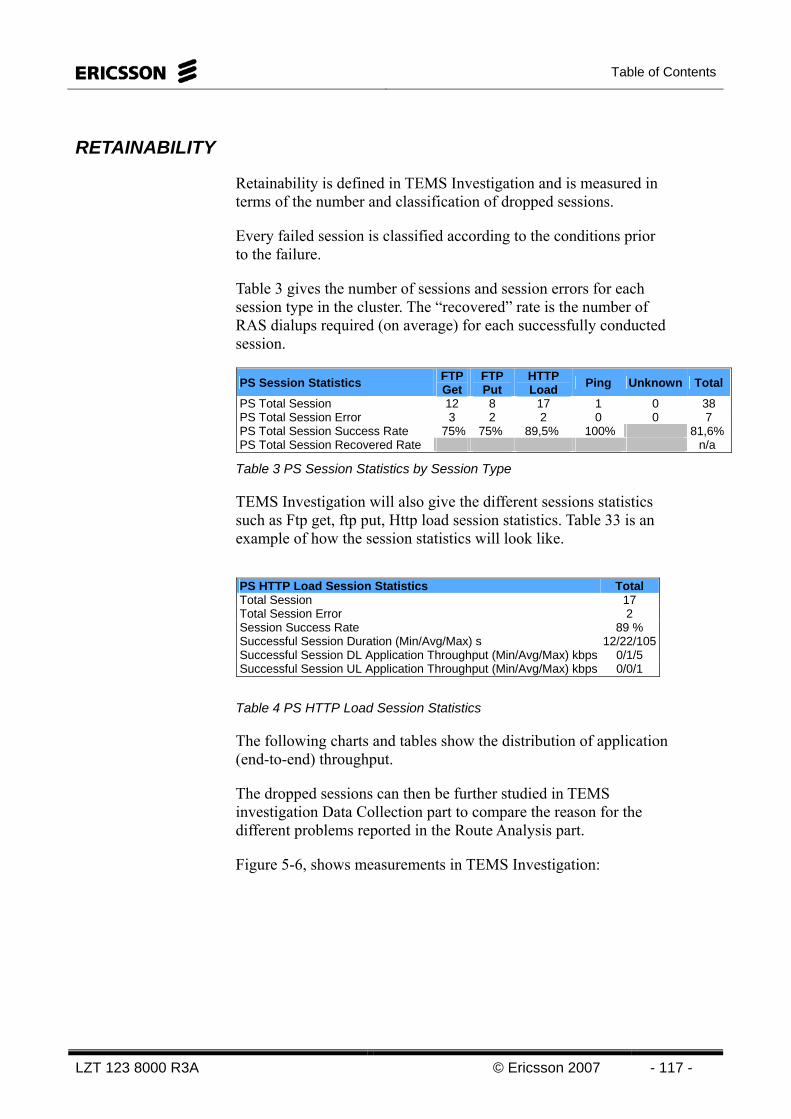
Table of Contents
LZT 123 8000 R3A © Ericsson 2007 - 117 -
RETAINABILITY
Retainability is defined in TEMS Investigation and is measured in terms of the number and classification of dropped sessions.
Every failed session is classified according to the conditions prior to the failure.
Table 3 gives the number of sessions and session errors for each session type in the cluster. The “recovered” rate is the number of RAS dialups required (on average) for each successfully conducted session.
PS Session Statistics FTP Get
FTP Put
HTTP Load Ping Unknown Total
PS Total Session 12 8 17 1 0 38 PS Total Session Error 3 2 2 0 0 7 PS Total Session Success Rate 75% 75% 89,5% 100% 81,6% PS Total Session Recovered Rate n/a
Table 3 PS Session Statistics by Session Type
TEMS Investigation will also give the different sessions statistics such as Ftp get, ftp put, Http load session statistics. Table 33 is an example of how the session statistics will look like.
PS HTTP Load Session Statistics Total Total Session 17 Total Session Error 2 Session Success Rate 89 % Successful Session Duration (Min/Avg/Max) s 12/22/105Successful Session DL Application Throughput (Min/Avg/Max) kbps 0/1/5 Successful Session UL Application Throughput (Min/Avg/Max) kbps 0/0/1
Table 4 PS HTTP Load Session Statistics
The following charts and tables show the distribution of application (end-to-end) throughput.
The dropped sessions can then be further studied in TEMS investigation Data Collection part to compare the reason for the different problems reported in the Route Analysis part.
Figure 5-6, shows measurements in TEMS Investigation:
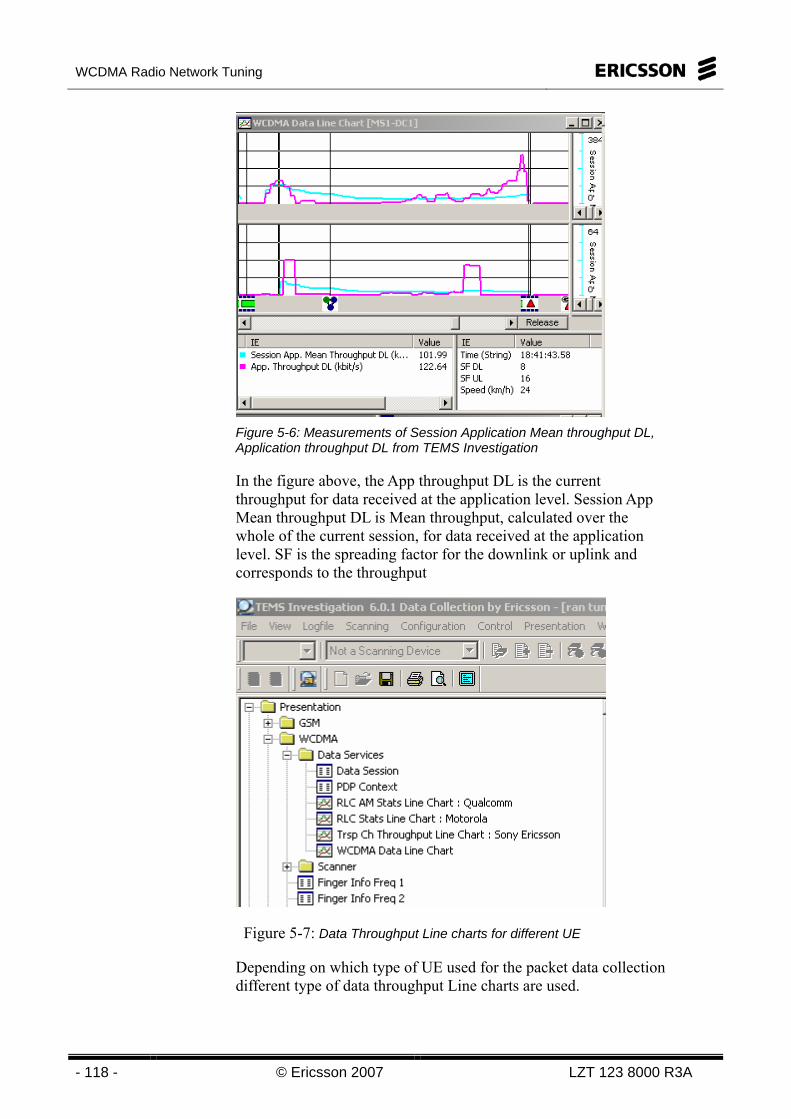
WCDMA Radio Network Tuning
- 118 - © Ericsson 2007 LZT 123 8000 R3A
Figure 5-6: Measurements of Session Application Mean throughput DL, Application throughput DL from TEMS Investigation
In the figure above, the App throughput DL is the current throughput for data received at the application level. Session App Mean throughput DL is Mean throughput, calculated over the whole of the current session, for data received at the application level. SF is the spreading factor for the downlink or uplink and corresponds to the throughput
Figure 5-7: Data Throughput Line charts for different UE
Depending on which type of UE used for the packet data collection different type of data throughput Line charts are used.
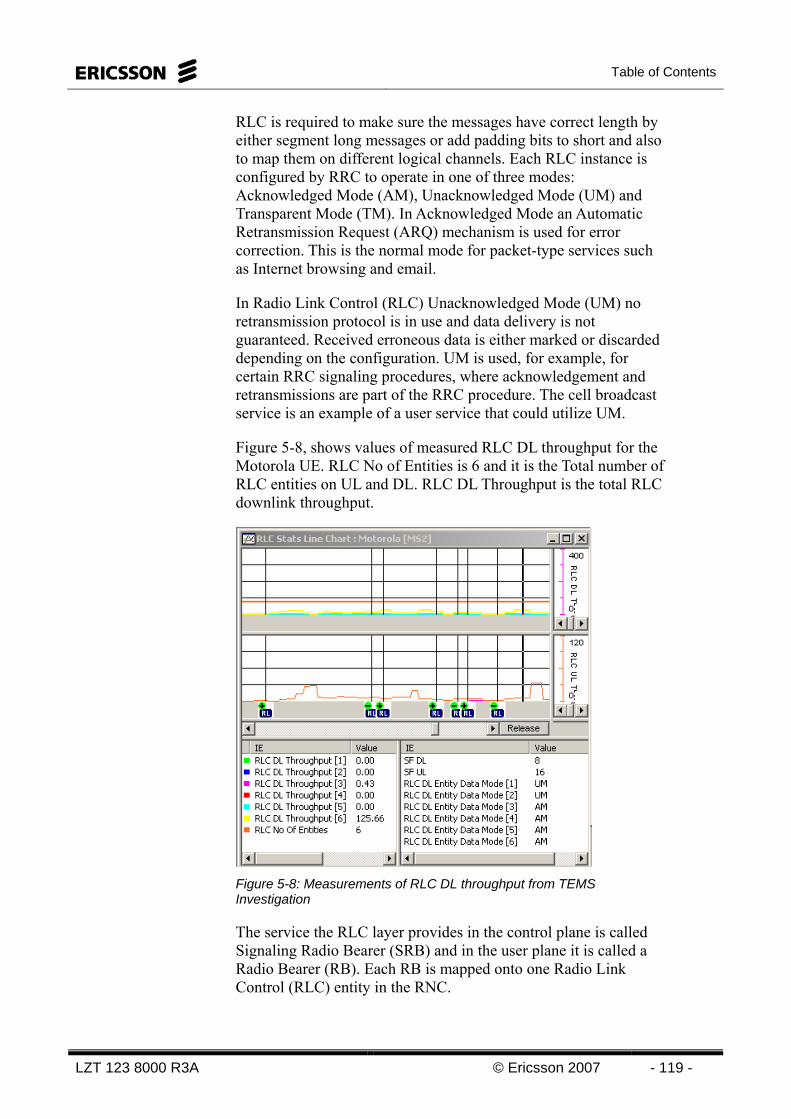
Table of Contents
LZT 123 8000 R3A © Ericsson 2007 - 119 -
RLC is required to make sure the messages have correct length by either segment long messages or add padding bits to short and also to map them on different logical channels. Each RLC instance is configured by RRC to operate in one of three modes: Acknowledged Mode (AM), Unacknowledged Mode (UM) and Transparent Mode (TM). In Acknowledged Mode an Automatic Retransmission Request (ARQ) mechanism is used for error correction. This is the normal mode for packet-type services such as Internet browsing and email.
In Radio Link Control (RLC) Unacknowledged Mode (UM) no retransmission protocol is in use and data delivery is not guaranteed. Received erroneous data is either marked or discarded depending on the configuration. UM is used, for example, for certain RRC signaling procedures, where acknowledgement and retransmissions are part of the RRC procedure. The cell broadcast service is an example of a user service that could utilize UM.
Figure 5-8, shows values of measured RLC DL throughput for the Motorola UE. RLC No of Entities is 6 and it is the Total number of RLC entities on UL and DL. RLC DL Throughput is the total RLC downlink throughput.
Figure 5-8: Measurements of RLC DL throughput from TEMS Investigation
The service the RLC layer provides in the control plane is called Signaling Radio Bearer (SRB) and in the user plane it is called a Radio Bearer (RB). Each RB is mapped onto one Radio Link Control (RLC) entity in the RNC.

WCDMA Radio Network Tuning
- 120 - © Ericsson 2007 LZT 123 8000 R3A
Every RLC entity communicates with its peer entity in the UE with one or more logical channels. The type of data that is transported defines the logical channels. They are divided into two groups;
Control Channels
– Broadcast Control Channel (BCCH, DL)
– Paging Control Channel (PCCH, DL)
– Common Control Channel (CCCH, DL & UL)
– Dedicated Control Channel (DCCH, DL & UL)
Traffic Channels
– Dedicated Traffic Channel (DTCH, DL & UL)
– Common Traffic Channel (CTCH, DL)
PACKET THROUGHPUT
Throughput is defined as the perceived user data rate from the application layer. This means that the throughput will never reach the peak rate, since the TCP and IP overhead, plus retransmissions, have to be taken into account. The throughput can be expressed per session, per bearer or per cell.
It is important when dimensioning to know if these overheads have been taken into account in the requirement.
Session throughput and Thold are illustrated in Figure 5-9 below.
Figure 5-9: Packet Call showing Session throughput and THold

Table of Contents
LZT 123 8000 R3A © Ericsson 2007 - 121 -
Throughput is associated with the speed and time the data is transferred in the system on the radio interface. However a closer look for the accessability and the channel switching statistics should be done when examining the throughput statistics for the packet data sessions.
Distribution chart of PS Application Downlink Throughput Range
7%
37%56%
App throughput < 64 kps 64 kps <= App throughput < 128 kbps128 kps <= App throughput < 384 kbps
Figure 5-10: PS Application Downlink throughput in TEMS Investigation
In TEMS Investigation the Best Server throughput is measured and reported in a table that shows the application throughput and RLC/transport channel (low-level) throughput per cell. Please note that the low-level throughput is measured differently for different handsets.
The Application (end-to-end) throughput is also measured and reported in different tables and charts.
PS Binned Application Throughput Statistics Min (kbps)
Average (kbps)
Max (kbps)
Average Application DL 1,0 65,7 367,0 Average Application UL 1,0 7,0 39,0 Median Application DL Throughput for spreading factor = 32 1,0 38,6 122,0 Median Application DL Throughput for spreading factor = 16 1,0 49,7 169,0 Median Application DL Throughput for spreading factor = 8 4,0 92,5 367,0
Table 5 PS Binned Application-level Throughput Statistics
App Throughput DL Median <= 64
kbps
64 kbps<App Throughput DL
Median <= 128 kbps
128 kbps<App Throughput DL
Median
Any App Throughput DL
Median Ec/No >= -4 38,59 49,73 92,59 60,31 -4 > Ec / No >= -8 64,00 54,61 93,92 70,84 -8 > Ec / No >= -12 0,00 0,00 0,00 0,00 Ec/No < -12 0,00 0,00 0,00 0,00

WCDMA Radio Network Tuning
- 122 - © Ericsson 2007 LZT 123 8000 R3A
App Throughput DL Median <= 64
kbps
64 kbps<App Throughput DL
Median <= 128 kbps
128 kbps<App Throughput DL
Median
Any App Throughput DL
Median Any Ec/No 39,40 49,74 92,47 60,54
Table 6 PS Application-level Throughput vs. Ec/No
Best Server SC
RLC DL Throughput
Avg
Application DL Throughput
Avg
RLC UL Throughput
Avg
Application UL Throughput
Avg
Spreading factor >=
32
Spreading factor >=
16
Spreading factor >=
8 Cell1 35 54,00 8,00 4,00 1,00 0,00 0,00 0,00 Cell1 35 0,00 48,00 0,00 26,00 0,00 0,00 0,00 Cell1 35 82,00 52,00 4,00 0,00 0,00 82,00 0,00 Cell1 35 203,00 122,00 7,00 0,00 0,00 0,00 203,00 Cell2 226 92,00 52,00 6,00 0,00 0,00 92,00 0,00 Cell2 226 0,00 10,00 0,00 2,00 0,00 0,00 0,00 Cell2 226 65,00 52,00 4,00 0,00 65,00 0,00 0,00 Cell2 226 63,00 52,00 2,00 0,00 63,00 0,00 0,00 Cell3 122 22,00 10,00 9,00 3,00 0,00 22,00 0,00
Table 7 An example of st Server Throughput on cell level
Channel Switching
Interactive/background Packet data services, e.g. web browsing, and sending email, typically generate bursty traffic with varying bandwidth demand. Static allocation of resources would be very inefficient. The Channel Switching function allows optimization of available resources by switching the UE between different channel types or different bit rates depending on user activity and resource availability. When user activity is low the UE is switched from a dedicated channel to a common channel so that the dedicated radio resources are available to other users. Also depending on throughput, coverage and resource availability the user can be switched from a dedicated channel to another one with higher or a lower bit rate.
The Channel Switching Algorithms can be triggered either by the UE or the RNC, depending on the behavior of the uplink and downlink, respectively. All of the Channel Switching evaluation algorithms have event triggered measurements, meaning that measurement reports are sent only when necessary. This means that the actual measurements are processed before reporting. The Channel Switching Algorithms use buffer load, throughput, and transmitted code power as input to the algorithms.
Buffer load: The buffer load is defined as the minimum of the Radio Link Control (RLC) transmission window and the sum of bytes in the SDU buffers and retransmission buffers of some of the RLC instances (each interactive RAB connection consists of five RLC instances).
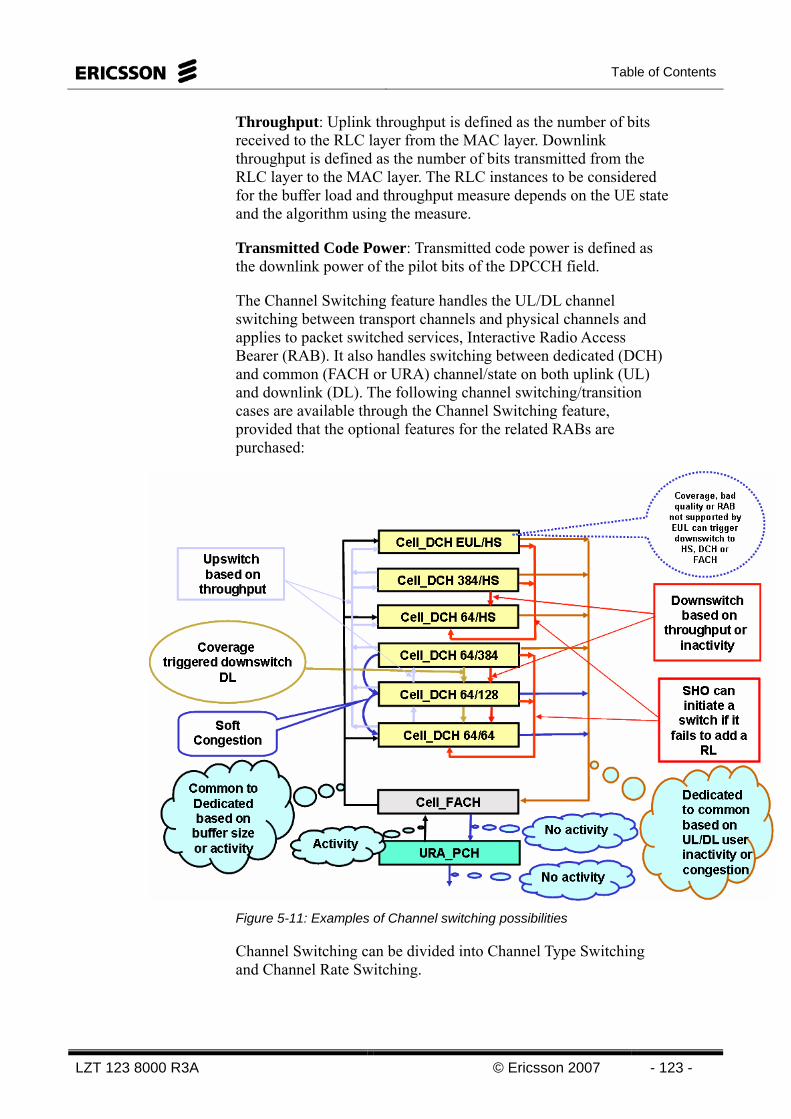
Table of Contents
LZT 123 8000 R3A © Ericsson 2007 - 123 -
Throughput: Uplink throughput is defined as the number of bits received to the RLC layer from the MAC layer. Downlink throughput is defined as the number of bits transmitted from the RLC layer to the MAC layer. The RLC instances to be considered for the buffer load and throughput measure depends on the UE state and the algorithm using the measure.
Transmitted Code Power: Transmitted code power is defined as the downlink power of the pilot bits of the DPCCH field.
The Channel Switching feature handles the UL/DL channel switching between transport channels and physical channels and applies to packet switched services, Interactive Radio Access Bearer (RAB). It also handles switching between dedicated (DCH) and common (FACH or URA) channel/state on both uplink (UL) and downlink (DL). The following channel switching/transition cases are available through the Channel Switching feature, provided that the optional features for the related RABs are purchased:
Figure 5-11: Examples of Channel switching possibilities
Channel Switching can be divided into Channel Type Switching and Channel Rate Switching.
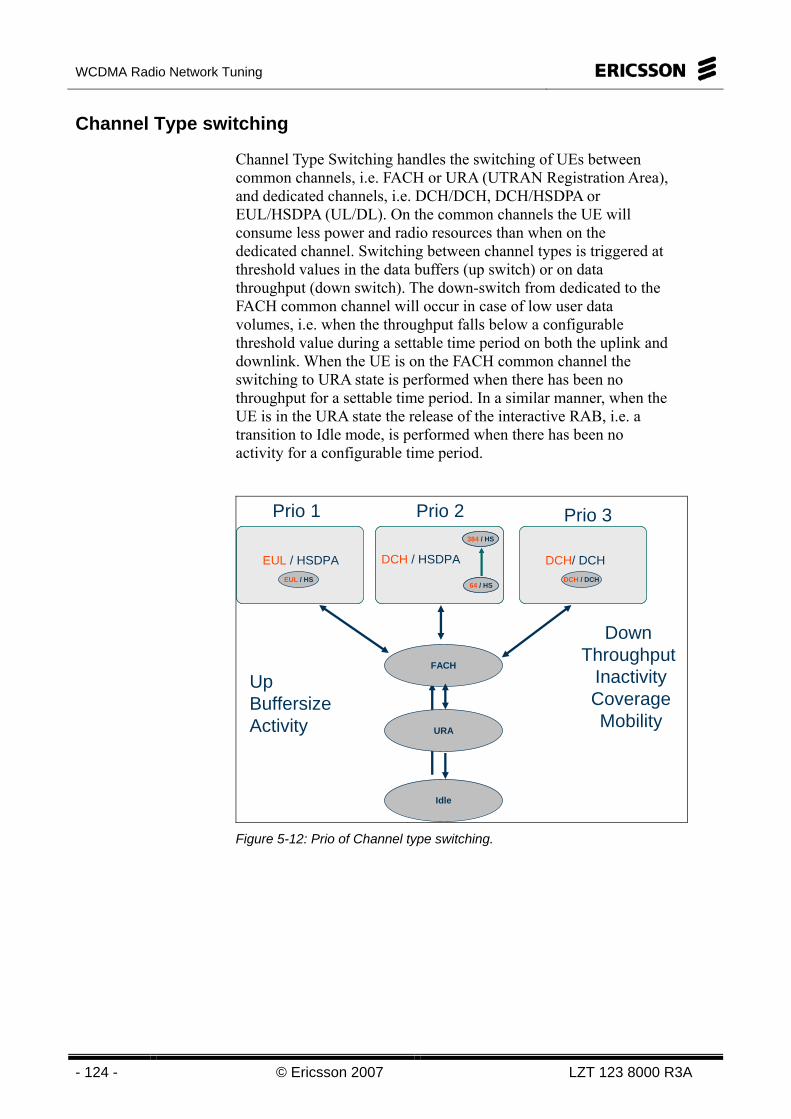
WCDMA Radio Network Tuning
- 124 - © Ericsson 2007 LZT 123 8000 R3A
Channel Type switching
Channel Type Switching handles the switching of UEs between common channels, i.e. FACH or URA (UTRAN Registration Area), and dedicated channels, i.e. DCH/DCH, DCH/HSDPA or EUL/HSDPA (UL/DL). On the common channels the UE will consume less power and radio resources than when on the dedicated channel. Switching between channel types is triggered at threshold values in the data buffers (up switch) or on data throughput (down switch). The down-switch from dedicated to the FACH common channel will occur in case of low user data volumes, i.e. when the throughput falls below a configurable threshold value during a settable time period on both the uplink and downlink. When the UE is on the FACH common channel the switching to URA state is performed when there has been no throughput for a settable time period. In a similar manner, when the UE is in the URA state the release of the interactive RAB, i.e. a transition to Idle mode, is performed when there has been no activity for a configurable time period.
EUL / HSDPAEUL / HS
EUL / HSDPAEUL / HS
DCH / HSDPA
384 / HS
64 / HS
DCH / HSDPA
384 / HS
64 / HS
384 / HS
64 / HS
FACH
Idle
Down Throughput
InactivityCoverageMobility
DCH/ DCHDCH / DCH
DCH/ DCHDCH / DCH
Prio 1 Prio 2 Prio 3
Up Buffersize Activity URA
Figure 5-12: Prio of Channel type switching.
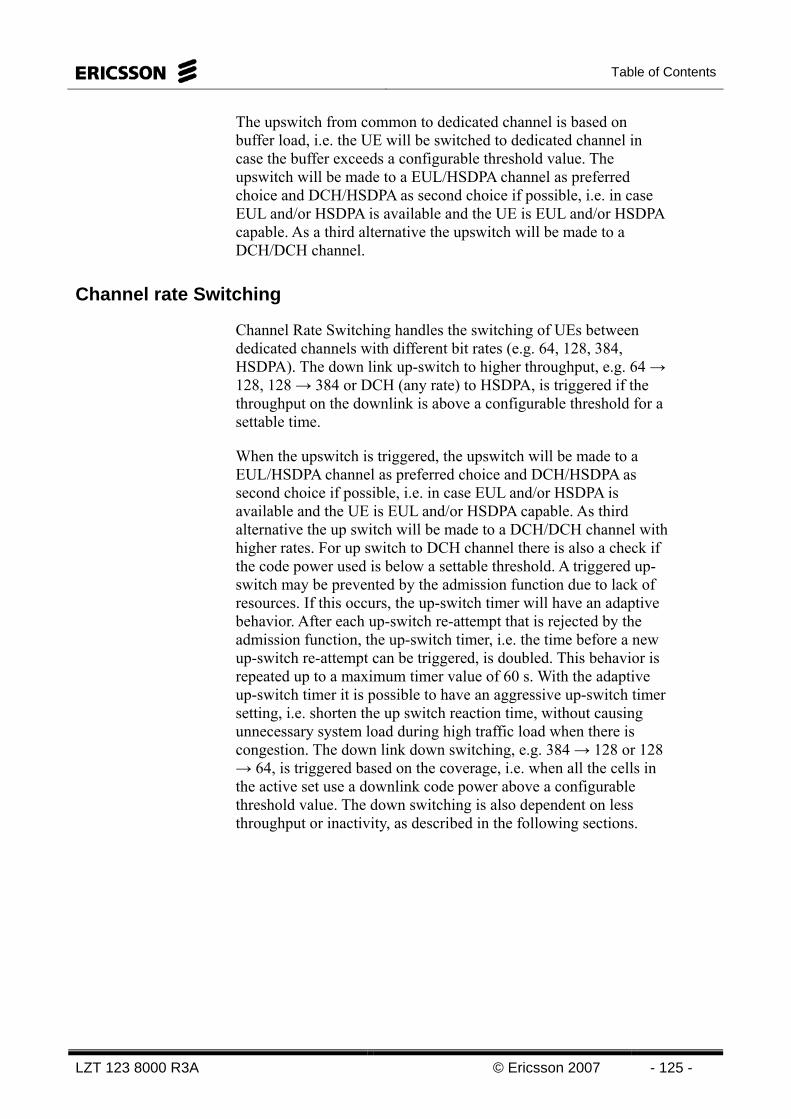
Table of Contents
LZT 123 8000 R3A © Ericsson 2007 - 125 -
The upswitch from common to dedicated channel is based on buffer load, i.e. the UE will be switched to dedicated channel in case the buffer exceeds a configurable threshold value. The upswitch will be made to a EUL/HSDPA channel as preferred choice and DCH/HSDPA as second choice if possible, i.e. in case EUL and/or HSDPA is available and the UE is EUL and/or HSDPA capable. As a third alternative the upswitch will be made to a DCH/DCH channel.
Channel rate Switching
Channel Rate Switching handles the switching of UEs between dedicated channels with different bit rates (e.g. 64, 128, 384, HSDPA). The down link up-switch to higher throughput, e.g. 64 → 128, 128 → 384 or DCH (any rate) to HSDPA, is triggered if the throughput on the downlink is above a configurable threshold for a settable time.
When the upswitch is triggered, the upswitch will be made to a EUL/HSDPA channel as preferred choice and DCH/HSDPA as second choice if possible, i.e. in case EUL and/or HSDPA is available and the UE is EUL and/or HSDPA capable. As third alternative the up switch will be made to a DCH/DCH channel with higher rates. For up switch to DCH channel there is also a check if the code power used is below a settable threshold. A triggered up-switch may be prevented by the admission function due to lack of resources. If this occurs, the up-switch timer will have an adaptive behavior. After each up-switch re-attempt that is rejected by the admission function, the up-switch timer, i.e. the time before a new up-switch re-attempt can be triggered, is doubled. This behavior is repeated up to a maximum timer value of 60 s. With the adaptive up-switch timer it is possible to have an aggressive up-switch timer setting, i.e. shorten the up switch reaction time, without causing unnecessary system load during high traffic load when there is congestion. The down link down switching, e.g. 384 → 128 or 128 → 64, is triggered based on the coverage, i.e. when all the cells in the active set use a downlink code power above a configurable threshold value. The down switching is also dependent on less throughput or inactivity, as described in the following sections.
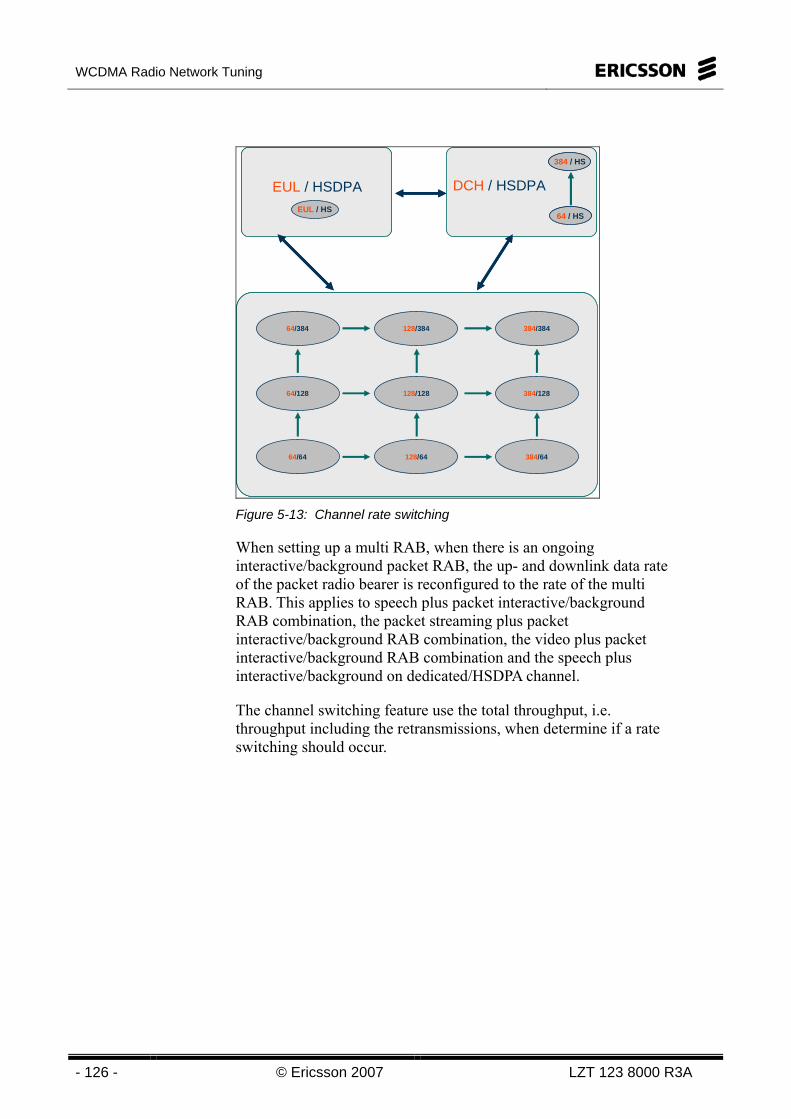
WCDMA Radio Network Tuning
- 126 - © Ericsson 2007 LZT 123 8000 R3A
EUL / HSDPAEUL / HS
DCH / HSDPA
384 / HS
64 / HS
128/6464/64 384/64
128/12864/128 384/128
128/38464/384 384/384
EUL / HSDPAEUL / HS
EUL / HSDPAEUL / HS
DCH / HSDPA
384 / HS
64 / HS
384 / HS
64 / HS
128/6464/64 384/64
128/12864/128 384/128
128/38464/384 384/384
128/6464/64 384/64
128/12864/128 384/128
128/38464/384 384/384
Figure 5-13: Channel rate switching
When setting up a multi RAB, when there is an ongoing interactive/background packet RAB, the up- and downlink data rate of the packet radio bearer is reconfigured to the rate of the multi RAB. This applies to speech plus packet interactive/background RAB combination, the packet streaming plus packet interactive/background RAB combination, the video plus packet interactive/background RAB combination and the speech plus interactive/background on dedicated/HSDPA channel.
The channel switching feature use the total throughput, i.e. throughput including the retransmissions, when determine if a rate switching should occur.
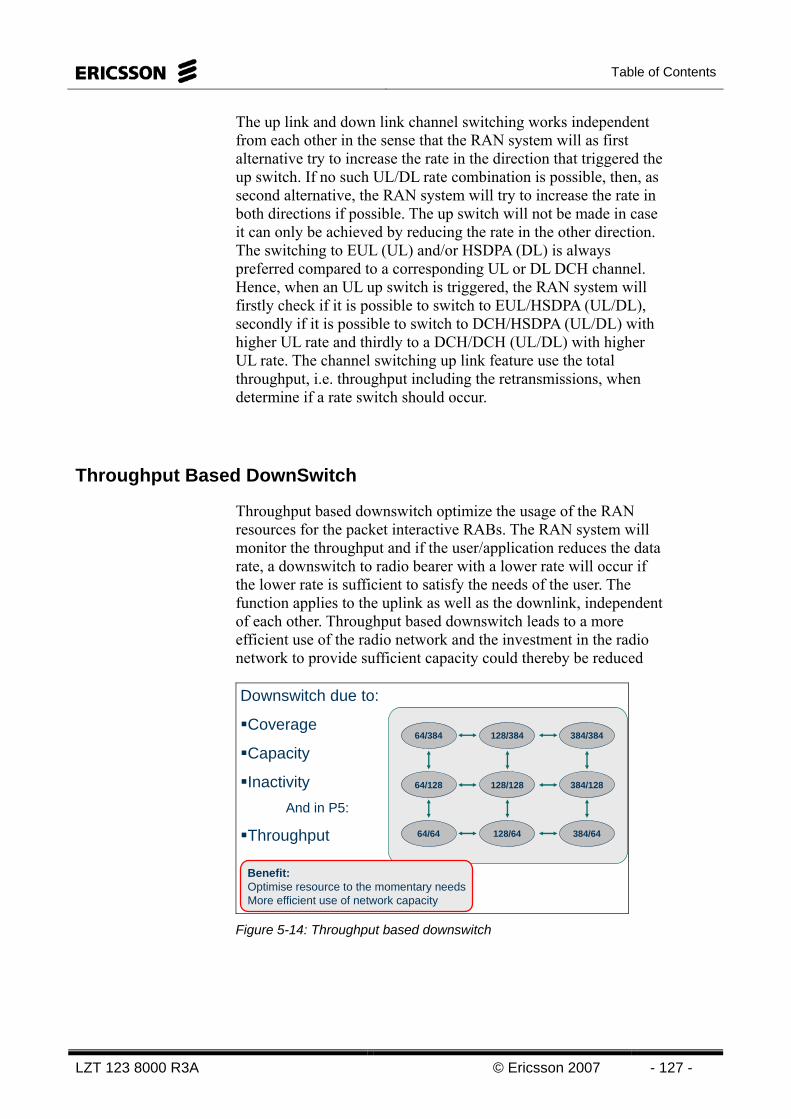
Table of Contents
LZT 123 8000 R3A © Ericsson 2007 - 127 -
The up link and down link channel switching works independent from each other in the sense that the RAN system will as first alternative try to increase the rate in the direction that triggered the up switch. If no such UL/DL rate combination is possible, then, as second alternative, the RAN system will try to increase the rate in both directions if possible. The up switch will not be made in case it can only be achieved by reducing the rate in the other direction. The switching to EUL (UL) and/or HSDPA (DL) is always preferred compared to a corresponding UL or DL DCH channel. Hence, when an UL up switch is triggered, the RAN system will firstly check if it is possible to switch to EUL/HSDPA (UL/DL), secondly if it is possible to switch to DCH/HSDPA (UL/DL) with higher UL rate and thirdly to a DCH/DCH (UL/DL) with higher UL rate. The channel switching up link feature use the total throughput, i.e. throughput including the retransmissions, when determine if a rate switch should occur.
Throughput Based DownSwitch
Throughput based downswitch optimize the usage of the RAN resources for the packet interactive RABs. The RAN system will monitor the throughput and if the user/application reduces the data rate, a downswitch to radio bearer with a lower rate will occur if the lower rate is sufficient to satisfy the needs of the user. The function applies to the uplink as well as the downlink, independent of each other. Throughput based downswitch leads to a more efficient use of the radio network and the investment in the radio network to provide sufficient capacity could thereby be reduced
128/6464/64 384/64
128/12864/128 384/128
128/38464/384 384/384
128/6464/64 384/64
128/12864/128 384/128
128/38464/384 384/384
Downswitch due to:
Coverage
Capacity
InactivityAnd in P5:
Throughput
Benefit:Optimise resource to the momentary needsMore efficient use of network capacity
Figure 5-14: Throughput based downswitch
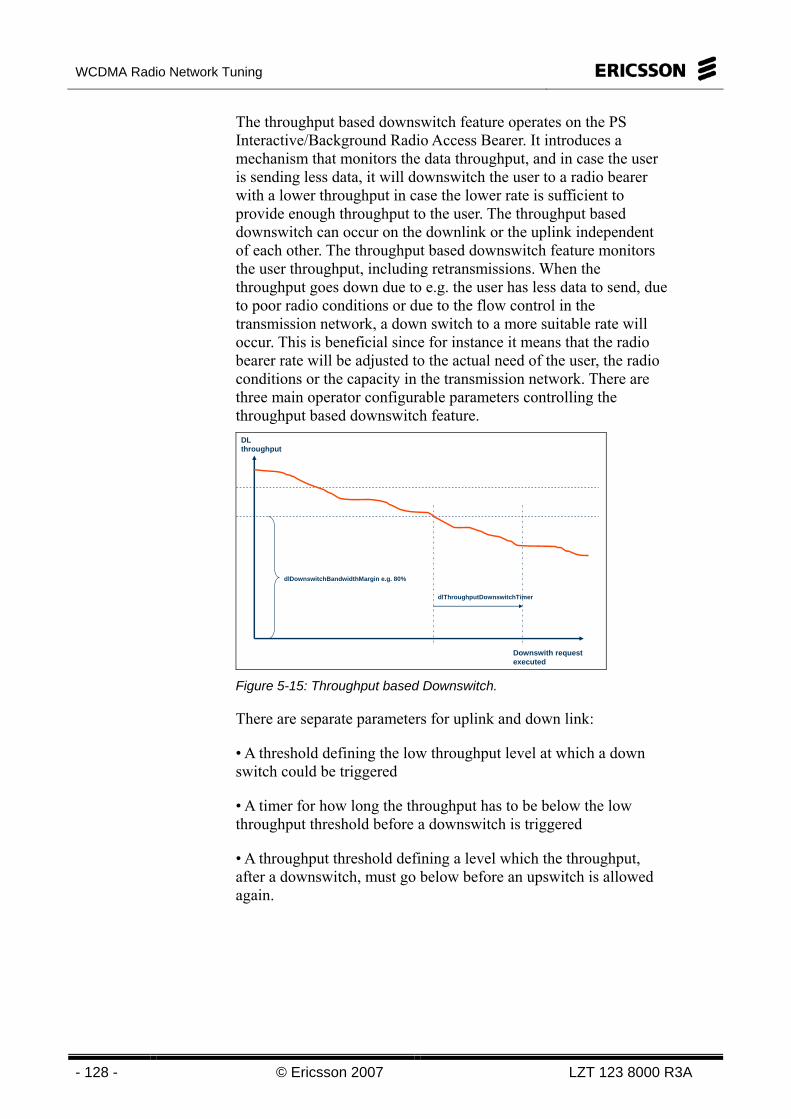
WCDMA Radio Network Tuning
- 128 - © Ericsson 2007 LZT 123 8000 R3A
The throughput based downswitch feature operates on the PS Interactive/Background Radio Access Bearer. It introduces a mechanism that monitors the data throughput, and in case the user is sending less data, it will downswitch the user to a radio bearer with a lower throughput in case the lower rate is sufficient to provide enough throughput to the user. The throughput based downswitch can occur on the downlink or the uplink independent of each other. The throughput based downswitch feature monitors the user throughput, including retransmissions. When the throughput goes down due to e.g. the user has less data to send, due to poor radio conditions or due to the flow control in the transmission network, a down switch to a more suitable rate will occur. This is beneficial since for instance it means that the radio bearer rate will be adjusted to the actual need of the user, the radio conditions or the capacity in the transmission network. There are three main operator configurable parameters controlling the throughput based downswitch feature.
DL throughput
dlDownswitchBandwidthMargin e.g. 80%
dlThroughputDownswitchTimer
Downswith request executed
Figure 5-15: Throughput based Downswitch.
There are separate parameters for uplink and down link:
• A threshold defining the low throughput level at which a down switch could be triggered
• A timer for how long the throughput has to be below the low throughput threshold before a downswitch is triggered
• A throughput threshold defining a level which the throughput, after a downswitch, must go below before an upswitch is allowed again.
Table of Contents
LZT 123 8000 R3A © Ericsson 2007 - 129 -
With suitable setting of the last parameter it is possible to avoid oscillating up/down switch or that a radio bearer with a too high data rate is unnecessarily used. This may otherwise happen, when the application data rate is above the typical upswitch threshold (Channel Switching) for the radio bearer, but still below the maximum rate of the radio bearer.
PARAMETERS
dlThroughputAllowUpswitchThreshold: Downlink throughput threshold which the throughput must have been below in order to allow an upswitch. If set to 0, this parameter is not in use.
dlDownswitchBandwidthMargin: Downlink throughput threshold required for triggering a downswitch of the downlink, expressed as a percentage of the maximum channel capacity of next lower rate. If set to 0, downswitch request will never be issued irrespective of user throughput.
dlThroughputDownswitchTimer: Time during which the downlink throughput must be higher than that specified by dlDownswitchBandwidthMargin before an downswitch request is issued.
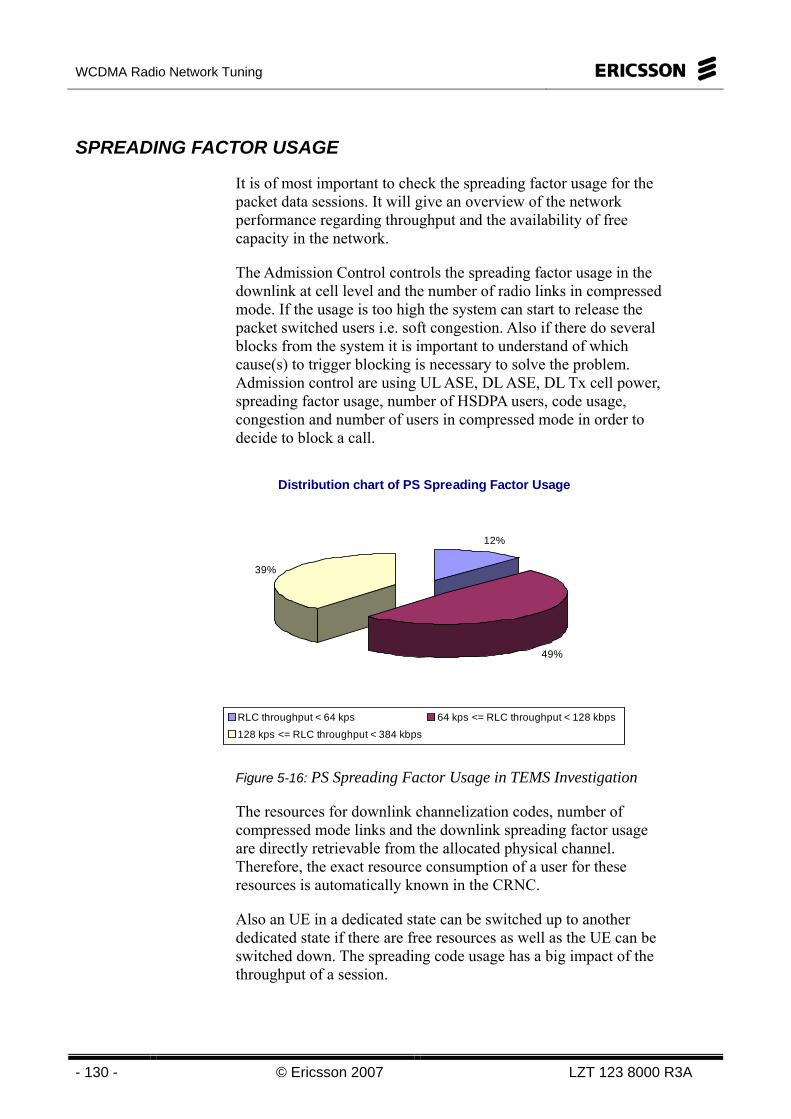
WCDMA Radio Network Tuning
- 130 - © Ericsson 2007 LZT 123 8000 R3A
SPREADING FACTOR USAGE
It is of most important to check the spreading factor usage for the packet data sessions. It will give an overview of the network performance regarding throughput and the availability of free capacity in the network.
The Admission Control controls the spreading factor usage in the downlink at cell level and the number of radio links in compressed mode. If the usage is too high the system can start to release the packet switched users i.e. soft congestion. Also if there do several blocks from the system it is important to understand of which cause(s) to trigger blocking is necessary to solve the problem. Admission control are using UL ASE, DL ASE, DL Tx cell power, spreading factor usage, number of HSDPA users, code usage, congestion and number of users in compressed mode in order to decide to block a call.
Distribution chart of PS Spreading Factor Usage
12%
49%
39%
RLC throughput < 64 kps 64 kps <= RLC throughput < 128 kbps128 kps <= RLC throughput < 384 kbps
Figure 5-16: PS Spreading Factor Usage in TEMS Investigation
The resources for downlink channelization codes, number of compressed mode links and the downlink spreading factor usage are directly retrievable from the allocated physical channel. Therefore, the exact resource consumption of a user for these resources is automatically known in the CRNC.
Also an UE in a dedicated state can be switched up to another dedicated state if there are free resources as well as the UE can be switched down. The spreading code usage has a big impact of the throughput of a session.
Table of Contents
LZT 123 8000 R3A © Ericsson 2007 - 131 -
HSDPA INTRODUCTION The operators will implement WCDMA High-Speed Downlink Packet Access to gain more throughput per cell and higher bit rate per user. HSDPA is useful mainly in good radio channel conditions (e.g. high C/I, Low speed). On the other hand HSDPA will use the excess power in the cell, which means lower C/I.
The HSDPA concept is based on the following features:
Shared channel transmission
Higher-order modulation
Short transmission time interval (TTI)
Fast link adaptation
Fast scheduling
Fast hybrid automatic-repeat-request (ARQ).
The new transport channel type, using multi-code transmission, is shared dynamically in time and code domain among multiple users. HS-DSCH is rate controlled, higher bit rates: 2 - 14.4 Mbps. Encoding rate, number of channelization codes and modulation type adapted, are based on available power and CQI (Channel Quality Indicator) information from the UE. The adaptation is on 2 ms transmission time interval (TTI), e.g. 500 times/sec. This means the round trip delay is reduced on the air interface and the Fast Link Adaptation, Fast Radio Channel-dependent Scheduling and Fast hybrid ARQ with soft combining are possible.
HSDPA FEATURE
A higher-order modulation, 16QAM in complement to QPSK is used for higher peak bit rates. 16QAM allows for twice the peak data rate compared to QPSK but it will be more sensitive to interference. With HSDPA higher system capacity is achieved, 2 - 3 times more. The 16QAM is an optional feature in the Node B that will be implemented in P5.
WCDMA Radio Network Tuning
- 132 - © Ericsson 2007 LZT 123 8000 R3A
Fast Link Adaptation, data rate adapted to radio conditions on 2 ms time basis, adjusts transmission parameters to match instantaneous radio channel conditions, i.e. path loss, shadowing, interference variations and fast multi-path fading. There is no power control as such at the channels but the adaptation is based upon the CQI, Channel Quality Indicator, which is sent regularly from the UE to the RBS and is based on CPICH measurement on serving cell. The CQI indicates the downlink radio quality and the volume of data that can be transmitted to the UE. This factor is used to prioritize users with good channel conditions, which also leads to higher system throughput.
In order to increase the throughput more channelization codes can be dedicated to the HS traffic. However in P4 the codes will then not be available for R99 traffic. There are max 5 codes, SF16, reserved for HSDPA traffic in P4 and in P5 up to 15 codes can be used. In P5 some of the codes will be fixed and some of the codes will be dynamically dedicated to HSDPA.
With Fast Hybrid ARQ will re-transmissions of erroneous packets processed in the RBS be faster and soft combining of multiple transmission attempts to improve performance is used in the UE.
With Fast Radio Channel-dependent Scheduling is scheduling of users on 2 ms time basis. Scheduling implies which UE to transmit to at a given time instant based on radio channel quality and targeting fading peaks. In P4 there are only Round Robin and the Proportional Fair scheduling algorithm available. In P5 it is possible to select between six different algorithms:
- Round Robin
- Proportional Fair – low fairness
- Proportional Fair – medium fairness
- Proportional Fair – high fairness
- Max CQI
- Equal Rate
If the flexible scheduler is disabled only Round Robin and Proportional Fair- medium fairness can be selected.
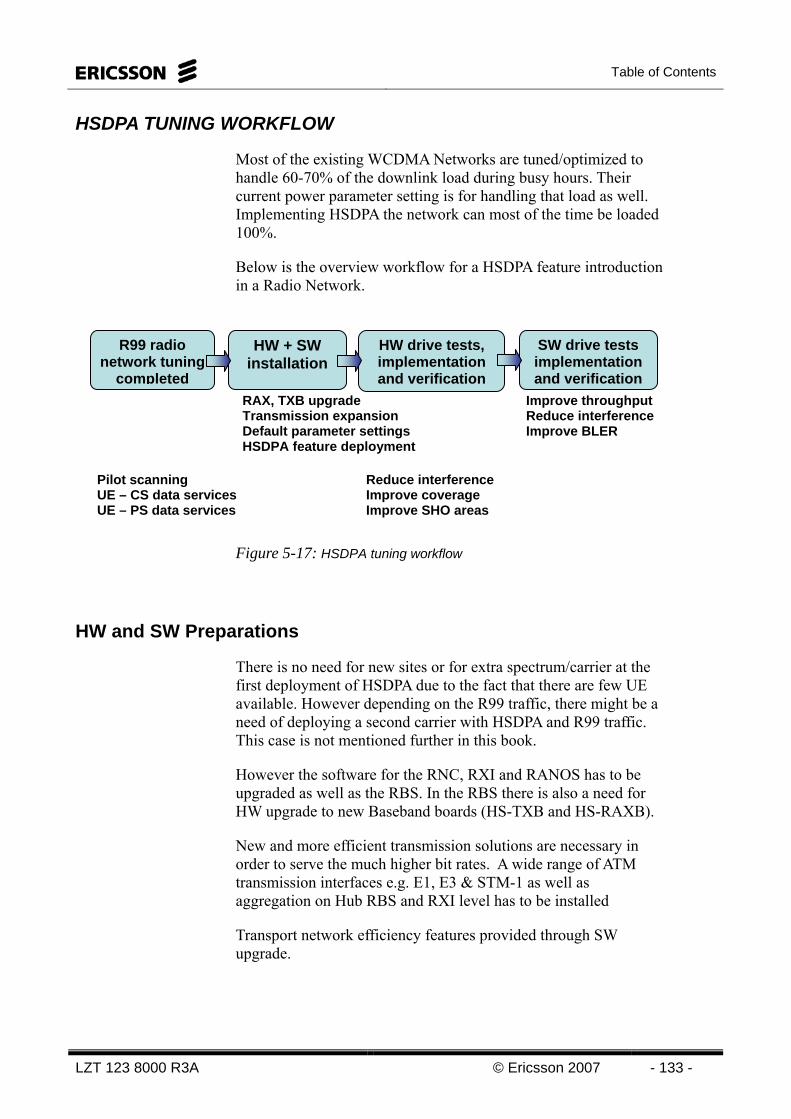
Table of Contents
LZT 123 8000 R3A © Ericsson 2007 - 133 -
HSDPA TUNING WORKFLOW
Most of the existing WCDMA Networks are tuned/optimized to handle 60-70% of the downlink load during busy hours. Their current power parameter setting is for handling that load as well. Implementing HSDPA the network can most of the time be loaded 100%.
Below is the overview workflow for a HSDPA feature introduction in a Radio Network.
Figure 5-17: HSDPA tuning workflow
HW and SW Preparations
There is no need for new sites or for extra spectrum/carrier at the first deployment of HSDPA due to the fact that there are few UE available. However depending on the R99 traffic, there might be a need of deploying a second carrier with HSDPA and R99 traffic. This case is not mentioned further in this book.
However the software for the RNC, RXI and RANOS has to be upgraded as well as the RBS. In the RBS there is also a need for HW upgrade to new Baseband boards (HS-TXB and HS-RAXB).
New and more efficient transmission solutions are necessary in order to serve the much higher bit rates. A wide range of ATM transmission interfaces e.g. E1, E3 & STM-1 as well as aggregation on Hub RBS and RXI level has to be installed
Transport network efficiency features provided through SW upgrade.
R99 radio network tuning
completed
HW + SW installation
HW drive tests, implementation and verification
SW drive tests implementation and verification
Pilot scanning UE – CS data servicesUE – PS data services
RAX, TXB upgrade Transmission expansion Default parameter settings HSDPA feature deployment
Reduce interference Improve coverage Improve SHO areas
Improve throughput Reduce interference Improve BLER

WCDMA Radio Network Tuning
- 134 - © Ericsson 2007 LZT 123 8000 R3A
The SGSN needs to be configured for the HSDPA traffic as well. However this is not further mentioned in this book.
Interference
After implementing HSDPA and having full loaded system the overall interference floor will increase and consequently the overall C/I will be lower. This because the network most probably as a best been tuned to handle around 70% of the load but now the load can go up to 100%. Retuning of the network may not be necessary if the R99 tuning were done properly.
Increasing a non-power-control-channel, e.g. pilot, means more power into the neighboring cells and hence higher interference in them as well. This high interference will cause higher power consumption per user and therefore lower cell capacity. The only way then to have lower interference is to retune the network or to retune specific parts of the network.
To have cells with as less coverage “islands” and as less overlapping (outside SHO areas) as possible. Then the power is located in areas where it is used and minimized the power in areas when it disturbs as interference. This means need of retuning.
Figure 5-18: Tilting antennas is an efficient way to reduce the interference.
Depending on the operators design and tuning the whole network needs to be retuned to get better C/I everywhere. This because the network most probably as a best has been tuned to handle around 70% of the load but now the load can go up to 100%. This should not be mixed with above where it is based on a user/RAB (or common channels), when here covers the capacity in the cell.
High sites generate interference outside the planned coverage area
Tilting antenna is an efficient way of achieving confined cells

Table of Contents
LZT 123 8000 R3A © Ericsson 2007 - 135 -
Handover Areas
HSDPA will not use SHO but hard HO, i.e. Cell Change, (no macro diversity). This means in the SHO areas (cell borders) the HSDPA, which is already sensitive to interference, will be more sensitive and therefore retuning may be needed to optimize the original SHO regions more.
After implementing HSDPA high data speed PS radio bearers e.g. PS384 may not need same coverage requirement as before and need to be retuned.
HS-DSCH is not power controlled but rate controlled, higher bit rates: 2 - 14.4 Mbps. Encoding rate, number of channelization codes and modulation type adapted are based on available power. To have a higher bit rates more power is needed.
Parameters
HSDPA will take the excess power in the RBS after common channels and dedicated channels have taken their part.
The average power utilization in the network will increase with HSDPA
Figure 5-19: HSDPA will take whatever power that is left in RBS
Power
time
CCH power
HSDPA power
DCH power
Admission control threshold
Max cell power
Power
time
CCH power
HSDPA power
DCH power
Admission control threshold
Max cell power
WCDMA Radio Network Tuning
- 136 - © Ericsson 2007 LZT 123 8000 R3A
Power of the Common Channels, e.g. CPICH and SCH should be increased and verified. This because with 100% cell load the Pilot (CPICH) or other common channel should remain their quality in the cell. The power of non-HSDPA common channels is always set relatively to the primary common pilot channel power (primaryCpichPower). These settings are chosen so that they ensure sufficient quality where the CPICH can be detected. Current deployed networks show that the default settings are robust and give good performance, both in terms of accessibility and retainability. Tuning common channel settings should be done primarily through modifying primaryCpichPower, hence trading coverage for capacity.
Max power of the DCH (other RABs) should be increased and verified. This because with 100% cell load the DCH channel should remain their quality in the cell border, where they are using their max power. The uplink (UL) dedicated control channel HS-DPCCH provides fast feedback of HARQ acknowledgements and the Channel Quality Indicator (CQI) on the UL. Reliable reception of the HS-DPCCH is essential for good HSDPA performance.
Power control of HS-DPCCH is given as an offset relative to UL DPDCH and there are different values depending on whether or not the UE is in soft handover. The reason for this is that the HS-DPCCH terminates in the RBS and is only received in the serving HS-DSCH cell. This implies that HS-DPCCH might have performance degradation when it is power controlled by multiple cells and the serving cell is not the best cell in the UL. Therefore higher power offset values are used when the UE is in soft handover and lower offsets otherwise. The drawback with the higher settings necessary for successful reception of HS-DPCCH is the higher resource cost (UL interference will increase). Therefore it is important to set these parameters correctly considering this trade-off.
The updates of the power offset parameters are triggered by the RNC when the numbers of Radio Links in the Active Set are changed.

Table of Contents
LZT 123 8000 R3A © Ericsson 2007 - 137 -
TRAFFIC CASE – SETUP OF A HSDPA CONNECTION
HSDPA Basic Concepts:
Channels
There are one new transport channel and three new physical channels when HSDPA is implemented in the cell:
- HS-DSCH; (DL) transport channel carrying userdata and L2 signaling.
- HS-PDSCH; (DL) the physical channel carrying the transport channel.
- HS-SCCH; (DL) physical channel carrying information of to which UE (H-RNTI) and how to decode (TRFRI, Transport Format Related Information) the user data sent on HS-DSCH.
- HS-DPCCH: (UL) physical channel for CQI and ACK/NAK information to the RBS
- A-DCH: Associated Dedicated Channel: Dedicated channels in uplink and downlink associated to the HS-DSCH channel. UL is for SRB + 64kbps or 384 kbps RAB and DL for 3.4 kbps SRB.
HSDPA Cell
"Best Cell": Active Set cell, HS-DSCH enabled, with the best quality based on the latest UE reported Primary CPICH measurements.
Serving HS-DSCH cell: The cell associated with the UTRAN access point performing transmission and reception of the serving HS-DSCH radio link for a given UE. The serving HS-DSCH cell is always part of the current Active Set of the UE.
Serving HS-DSCH Node B: the Node B controlling the serving HS-DSCH cell.
Serving HS-DSCH radio link: The radio link that the HS-PDSCH physical channel(s) allocated to the UE belongs to.
Suitable HS-DSCH Cell: This is a cell that satisfies the following conditions that make it a valid cell to cater the serving HS-DSCH radio link:
- Cell in the current Active Set.
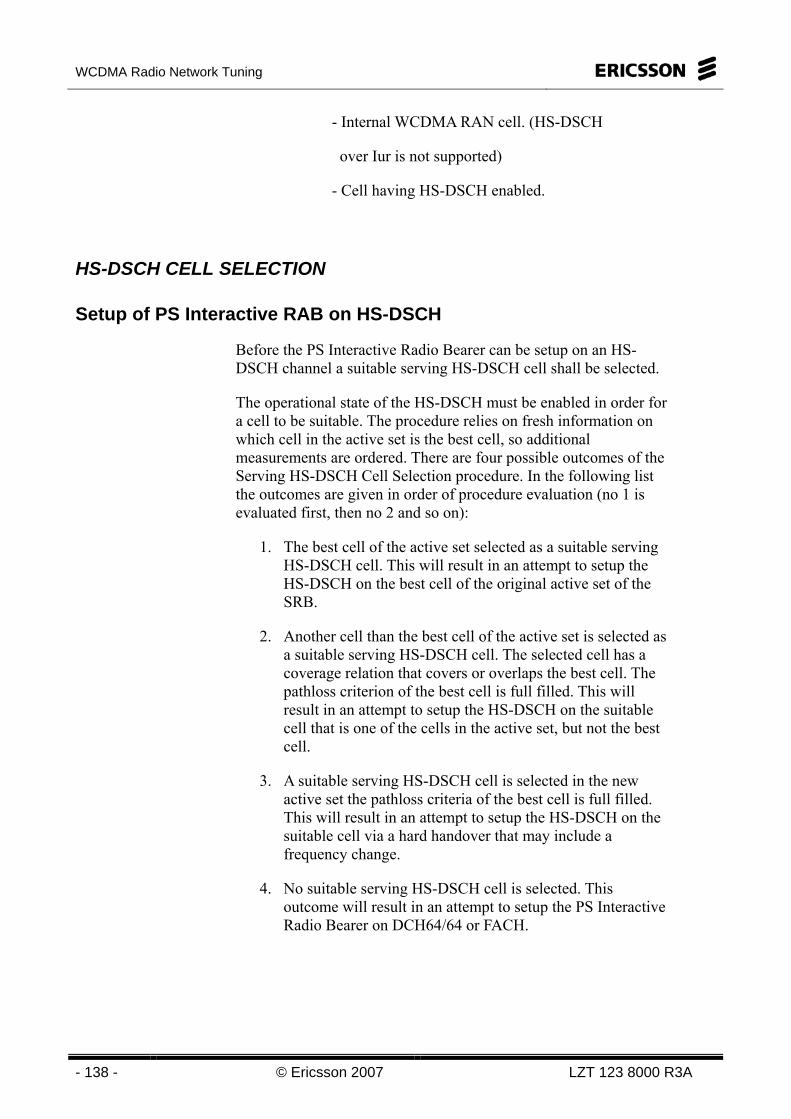
WCDMA Radio Network Tuning
- 138 - © Ericsson 2007 LZT 123 8000 R3A
- Internal WCDMA RAN cell. (HS-DSCH
over Iur is not supported)
- Cell having HS-DSCH enabled.
HS-DSCH CELL SELECTION
Setup of PS Interactive RAB on HS-DSCH
Before the PS Interactive Radio Bearer can be setup on an HS-DSCH channel a suitable serving HS-DSCH cell shall be selected.
The operational state of the HS-DSCH must be enabled in order for a cell to be suitable. The procedure relies on fresh information on which cell in the active set is the best cell, so additional measurements are ordered. There are four possible outcomes of the Serving HS-DSCH Cell Selection procedure. In the following list the outcomes are given in order of procedure evaluation (no 1 is evaluated first, then no 2 and so on):
1. The best cell of the active set selected as a suitable serving HS-DSCH cell. This will result in an attempt to setup the HS-DSCH on the best cell of the original active set of the SRB.
2. Another cell than the best cell of the active set is selected as a suitable serving HS-DSCH cell. The selected cell has a coverage relation that covers or overlaps the best cell. The pathloss criterion of the best cell is full filled. This will result in an attempt to setup the HS-DSCH on the suitable cell that is one of the cells in the active set, but not the best cell.
3. A suitable serving HS-DSCH cell is selected in the new active set the pathloss criteria of the best cell is full filled. This will result in an attempt to setup the HS-DSCH on the suitable cell via a hard handover that may include a frequency change.
4. No suitable serving HS-DSCH cell is selected. This outcome will result in an attempt to setup the PS Interactive Radio Bearer on DCH64/64 or FACH.
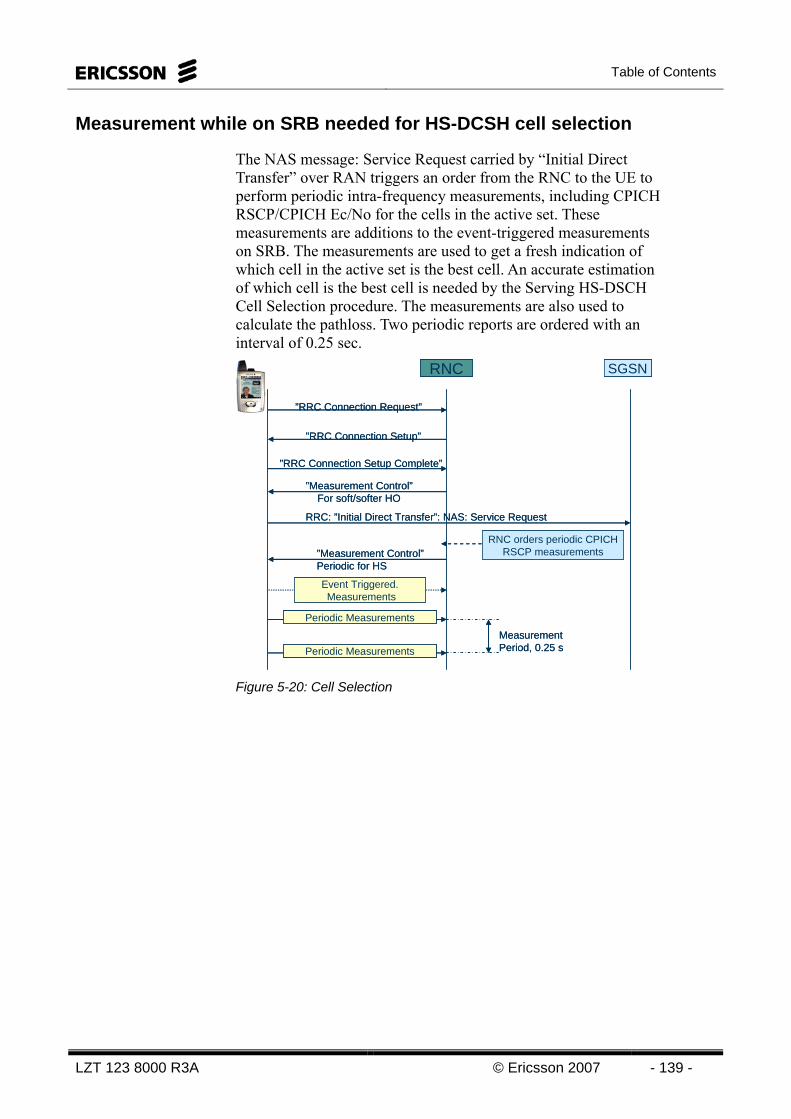
Table of Contents
LZT 123 8000 R3A © Ericsson 2007 - 139 -
Measurement while on SRB needed for HS-DCSH cell selection
The NAS message: Service Request carried by “Initial Direct Transfer” over RAN triggers an order from the RNC to the UE to perform periodic intra-frequency measurements, including CPICH RSCP/CPICH Ec/No for the cells in the active set. These measurements are additions to the event-triggered measurements on SRB. The measurements are used to get a fresh indication of which cell in the active set is the best cell. An accurate estimation of which cell is the best cell is needed by the Serving HS-DSCH Cell Selection procedure. The measurements are also used to calculate the pathloss. Two periodic reports are ordered with an interval of 0.25 sec.
SGSNRNC
Event Triggered.Measurements
Periodic Measurements
Periodic MeasurementsMeasurementPeriod, 0.25 s
”Measurement Control”Periodic for HS
RRC: ”Initial Direct Transfer”: NAS: Service Request
”Measurement Control”For soft/softer HO
”RRC Connection Setup Complete”
”RRC Connection Setup”
”RRC Connection Request”
RNC orders periodic CPICHRSCP measurements
Figure 5-20: Cell Selection
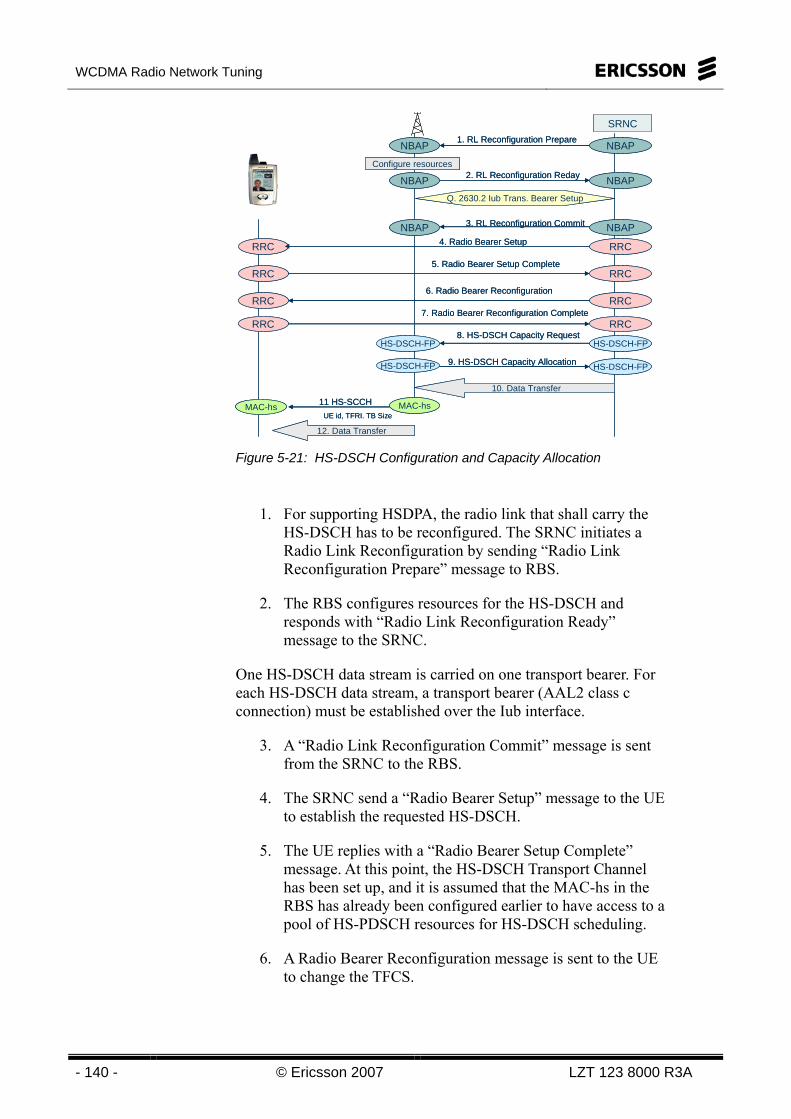
WCDMA Radio Network Tuning
- 140 - © Ericsson 2007 LZT 123 8000 R3A
SRNC
NBAP
HS-DSCH-FP
HS-DSCH-FP HS-DSCH-FP
RRCRRC
RRC RRC
NBAPNBAP
NBAPNBAP
NBAP 1. RL Reconfiguration Prepare
Configure resources2. RL Reconfiguration Reday
3. RL Reconfiguration Commit
Q. 2630.2 Iub Trans. Bearer Setup
6. Radio Bearer Reconfiguration
7. Radio Bearer Reconfiguration Complete
MAC-hs
HS-DSCH-FP
11 HS-SCCHUE id, TFRI. TB Size
12. Data Transfer
8. HS-DSCH Capacity Request
9. HS-DSCH Capacity Allocation
RRC RRC
RRCRRC 4. Radio Bearer Setup
5. Radio Bearer Setup Complete
10. Data Transfer
MAC-hs
Figure 5-21: HS-DSCH Configuration and Capacity Allocation
1. For supporting HSDPA, the radio link that shall carry the HS-DSCH has to be reconfigured. The SRNC initiates a Radio Link Reconfiguration by sending “Radio Link Reconfiguration Prepare” message to RBS.
2. The RBS configures resources for the HS-DSCH and responds with “Radio Link Reconfiguration Ready” message to the SRNC.
One HS-DSCH data stream is carried on one transport bearer. For each HS-DSCH data stream, a transport bearer (AAL2 class c connection) must be established over the Iub interface.
3. A “Radio Link Reconfiguration Commit” message is sent from the SRNC to the RBS.
4. The SRNC send a “Radio Bearer Setup” message to the UE to establish the requested HS-DSCH.
5. The UE replies with a “Radio Bearer Setup Complete” message. At this point, the HS-DSCH Transport Channel has been set up, and it is assumed that the MAC-hs in the RBS has already been configured earlier to have access to a pool of HS-PDSCH resources for HS-DSCH scheduling.
6. A Radio Bearer Reconfiguration message is sent to the UE to change the TFCS.
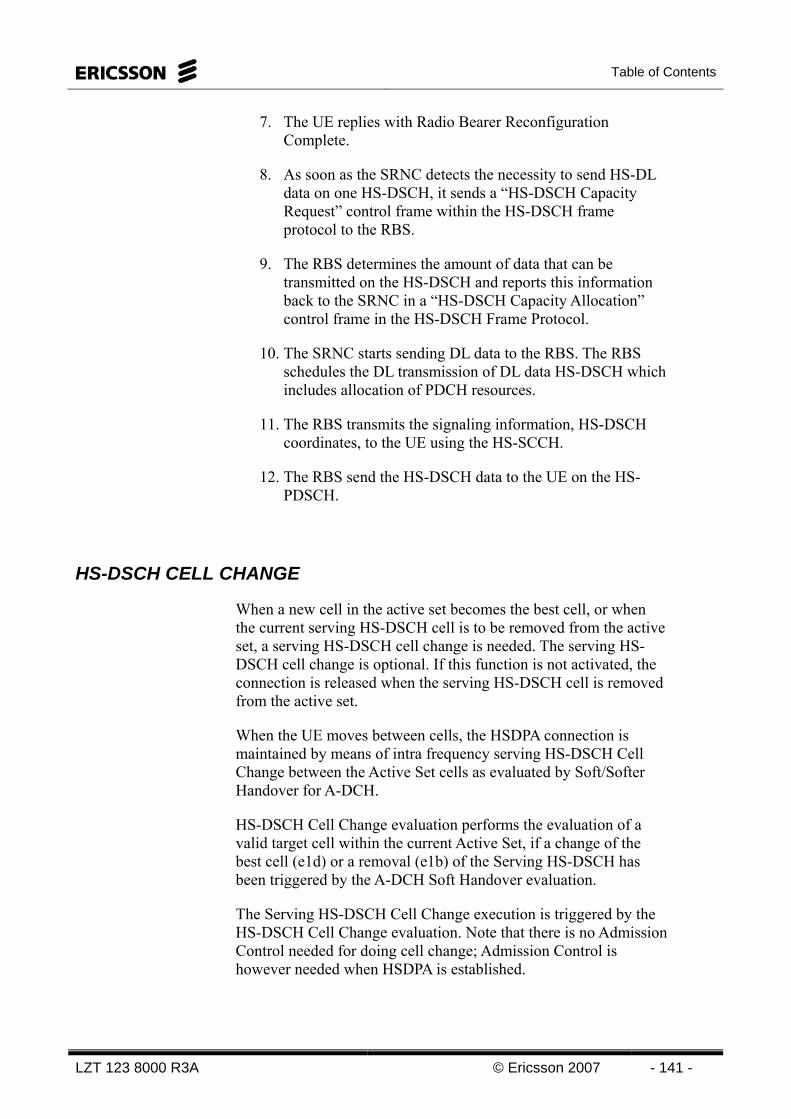
Table of Contents
LZT 123 8000 R3A © Ericsson 2007 - 141 -
7. The UE replies with Radio Bearer Reconfiguration Complete.
8. As soon as the SRNC detects the necessity to send HS-DL data on one HS-DSCH, it sends a “HS-DSCH Capacity Request” control frame within the HS-DSCH frame protocol to the RBS.
9. The RBS determines the amount of data that can be transmitted on the HS-DSCH and reports this information back to the SRNC in a “HS-DSCH Capacity Allocation” control frame in the HS-DSCH Frame Protocol.
10. The SRNC starts sending DL data to the RBS. The RBS schedules the DL transmission of DL data HS-DSCH which includes allocation of PDCH resources.
11. The RBS transmits the signaling information, HS-DSCH coordinates, to the UE using the HS-SCCH.
12. The RBS send the HS-DSCH data to the UE on the HS-PDSCH.
HS-DSCH CELL CHANGE
When a new cell in the active set becomes the best cell, or when the current serving HS-DSCH cell is to be removed from the active set, a serving HS-DSCH cell change is needed. The serving HS-DSCH cell change is optional. If this function is not activated, the connection is released when the serving HS-DSCH cell is removed from the active set.
When the UE moves between cells, the HSDPA connection is maintained by means of intra frequency serving HS-DSCH Cell Change between the Active Set cells as evaluated by Soft/Softer Handover for A-DCH.
HS-DSCH Cell Change evaluation performs the evaluation of a valid target cell within the current Active Set, if a change of the best cell (e1d) or a removal (e1b) of the Serving HS-DSCH has been triggered by the A-DCH Soft Handover evaluation.
The Serving HS-DSCH Cell Change execution is triggered by the HS-DSCH Cell Change evaluation. Note that there is no Admission Control needed for doing cell change; Admission Control is however needed when HSDPA is established.
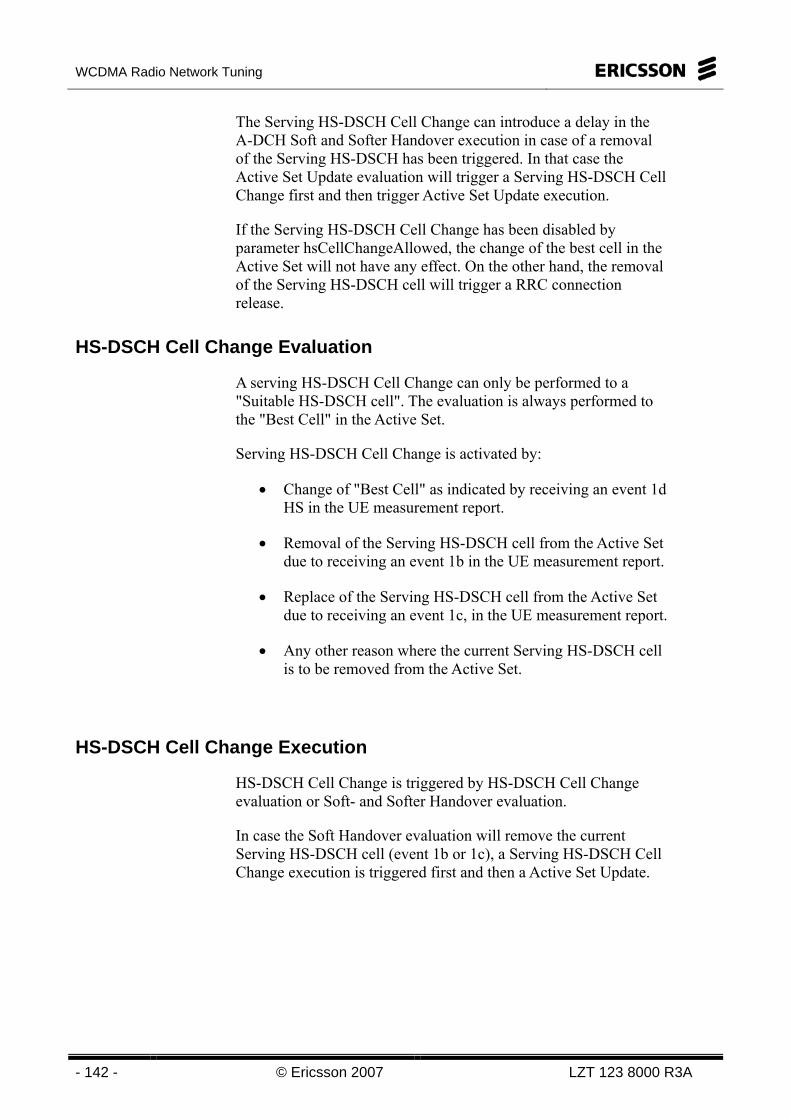
WCDMA Radio Network Tuning
- 142 - © Ericsson 2007 LZT 123 8000 R3A
The Serving HS-DSCH Cell Change can introduce a delay in the A-DCH Soft and Softer Handover execution in case of a removal of the Serving HS-DSCH has been triggered. In that case the Active Set Update evaluation will trigger a Serving HS-DSCH Cell Change first and then trigger Active Set Update execution.
If the Serving HS-DSCH Cell Change has been disabled by parameter hsCellChangeAllowed, the change of the best cell in the Active Set will not have any effect. On the other hand, the removal of the Serving HS-DSCH cell will trigger a RRC connection release.
HS-DSCH Cell Change Evaluation
A serving HS-DSCH Cell Change can only be performed to a "Suitable HS-DSCH cell". The evaluation is always performed to the "Best Cell" in the Active Set.
Serving HS-DSCH Cell Change is activated by:
• Change of "Best Cell" as indicated by receiving an event 1d HS in the UE measurement report.
• Removal of the Serving HS-DSCH cell from the Active Set due to receiving an event 1b in the UE measurement report.
• Replace of the Serving HS-DSCH cell from the Active Set due to receiving an event 1c, in the UE measurement report.
• Any other reason where the current Serving HS-DSCH cell is to be removed from the Active Set.
HS-DSCH Cell Change Execution
HS-DSCH Cell Change is triggered by HS-DSCH Cell Change evaluation or Soft- and Softer Handover evaluation.
In case the Soft Handover evaluation will remove the current Serving HS-DSCH cell (event 1b or 1c), a Serving HS-DSCH Cell Change execution is triggered first and then a Active Set Update.
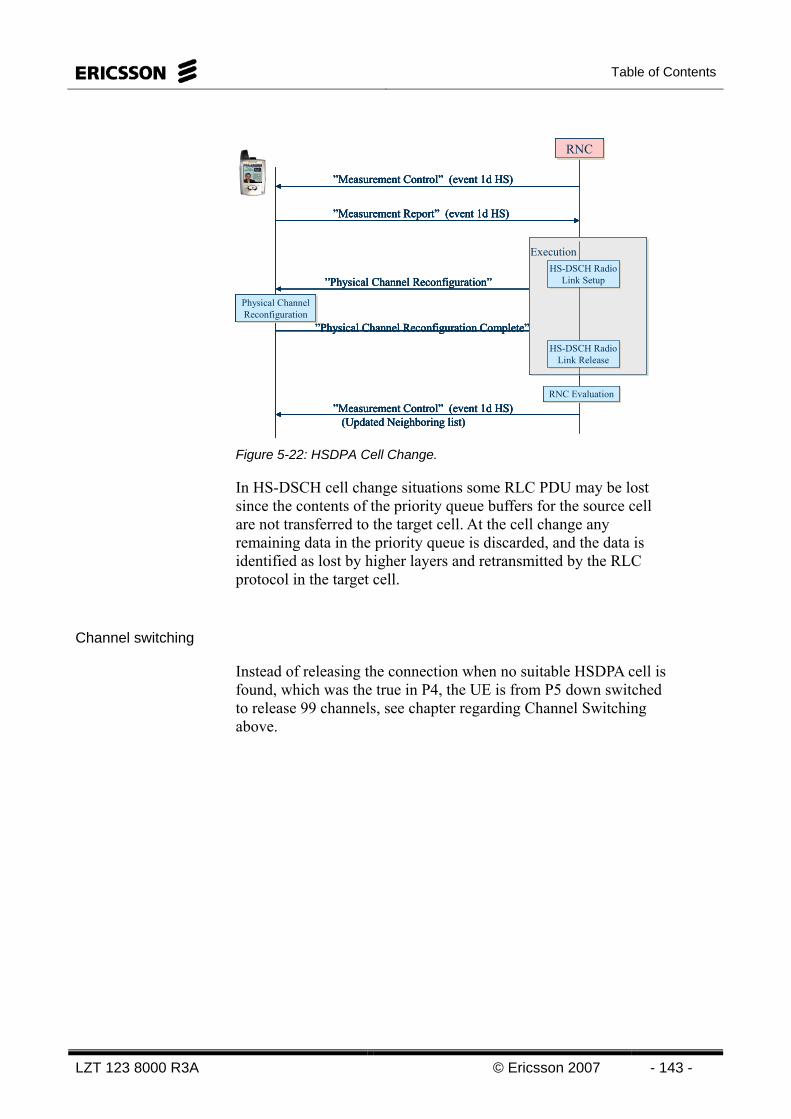
Table of Contents
LZT 123 8000 R3A © Ericsson 2007 - 143 -
RNCRNC
”Measurement Control” (event 1d HS)
”Measurement Report” (event 1d HS)
”Measurement Control” (event 1d HS)(Updated Neighboring list)
HS-DSCH RadioLink Setup
HS-DSCH RadioLink Setup
HS-DSCH RadioLink Release
HS-DSCH RadioLink Release
Execution
”Physical Channel Reconfiguration”
”Physical Channel Reconfiguration Complete”
Physical ChannelReconfiguration
Physical ChannelReconfiguration
RNC EvaluationRNC Evaluation
Figure 5-22: HSDPA Cell Change.
In HS-DSCH cell change situations some RLC PDU may be lost since the contents of the priority queue buffers for the source cell are not transferred to the target cell. At the cell change any remaining data in the priority queue is discarded, and the data is identified as lost by higher layers and retransmitted by the RLC protocol in the target cell.
Channel switching
Instead of releasing the connection when no suitable HSDPA cell is found, which was the true in P4, the UE is from P5 down switched to release 99 channels, see chapter regarding Channel Switching above.

WCDMA Radio Network Tuning
- 144 - © Ericsson 2007 LZT 123 8000 R3A
HSDPA THROUGHPUT
Throughput for R99 traffic is defined as the perceived user data rate from the application layer. This means that the throughput will never reach the peak rate, since the TCP and IP overhead, and retransmissions, have to be taken into account. The throughput can be expressed per session, per bearer or per cell.
In HSDPA the throughput are calculated in a different way. The throughput for HSDPA is calculated differently from the other RAB due to the fact that there is a new protocol involved, the MAC-HS.
The throughput for HSDPA can be divided in different categories, as shown in the picture below.
Figure 5-23: HSDPA Throughput concept.
Application throughput is defined as TCP/IP to end-to-end throughput. It is the net payload throughput and is considered to be error free. It is measured every second.
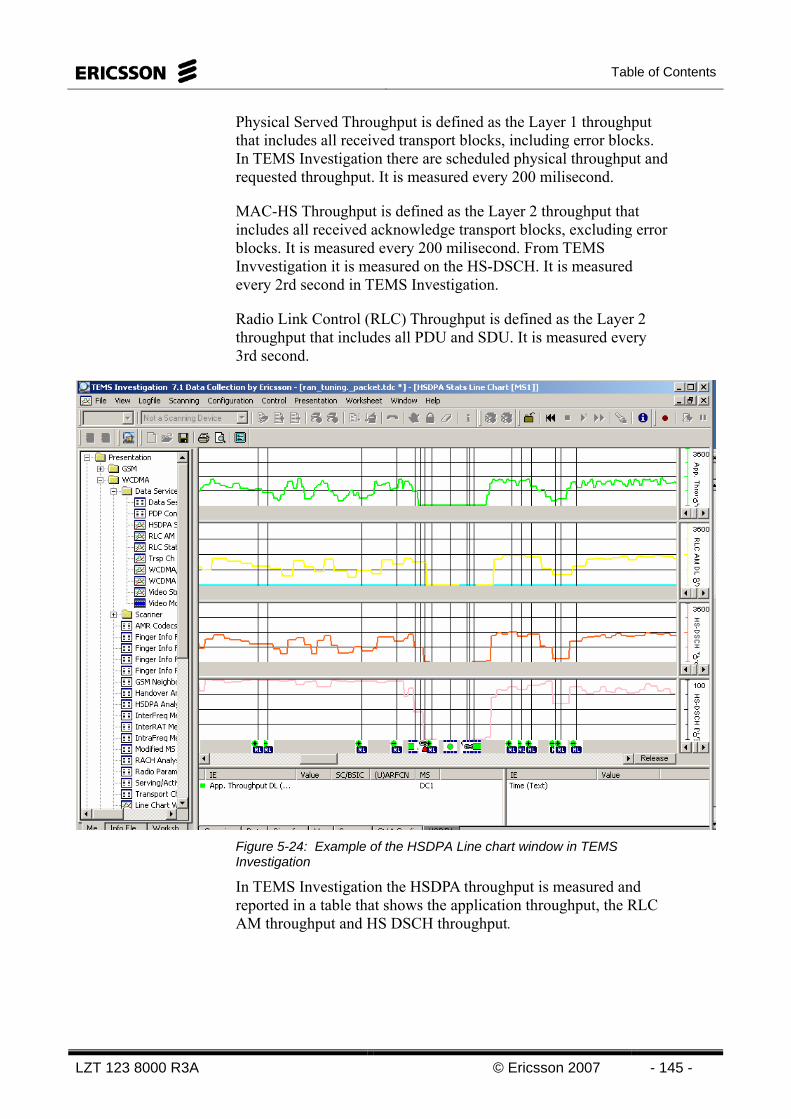
Table of Contents
LZT 123 8000 R3A © Ericsson 2007 - 145 -
Physical Served Throughput is defined as the Layer 1 throughput that includes all received transport blocks, including error blocks. In TEMS Investigation there are scheduled physical throughput and requested throughput. It is measured every 200 milisecond.
MAC-HS Throughput is defined as the Layer 2 throughput that includes all received acknowledge transport blocks, excluding error blocks. It is measured every 200 milisecond. From TEMS Invvestigation it is measured on the HS-DSCH. It is measured every 2rd second in TEMS Investigation.
Radio Link Control (RLC) Throughput is defined as the Layer 2 throughput that includes all PDU and SDU. It is measured every 3rd second.
Figure 5-24: Example of the HSDPA Line chart window in TEMS Investigation
In TEMS Investigation the HSDPA throughput is measured and reported in a table that shows the application throughput, the RLC AM throughput and HS DSCH throughput.
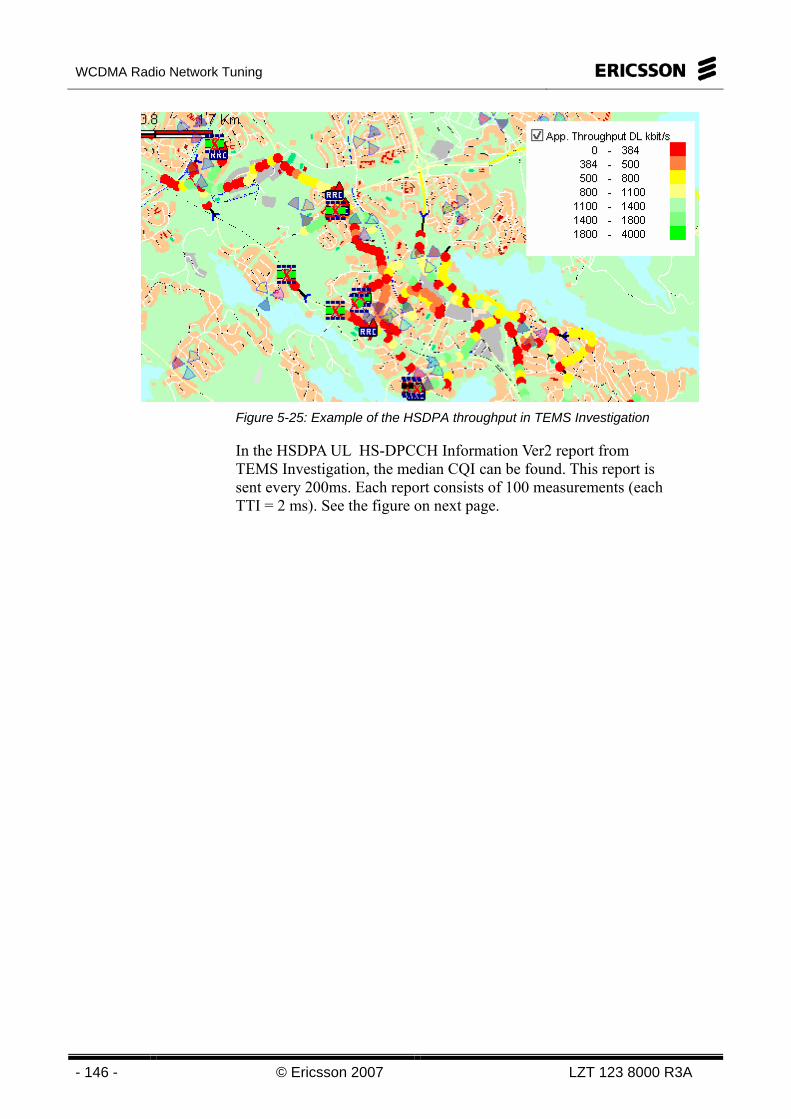
WCDMA Radio Network Tuning
- 146 - © Ericsson 2007 LZT 123 8000 R3A
Figure 5-25: Example of the HSDPA throughput in TEMS Investigation
In the HSDPA UL HS-DPCCH Information Ver2 report from TEMS Investigation, the median CQI can be found. This report is sent every 200ms. Each report consists of 100 measurements (each TTI = 2 ms). See the figure on next page.
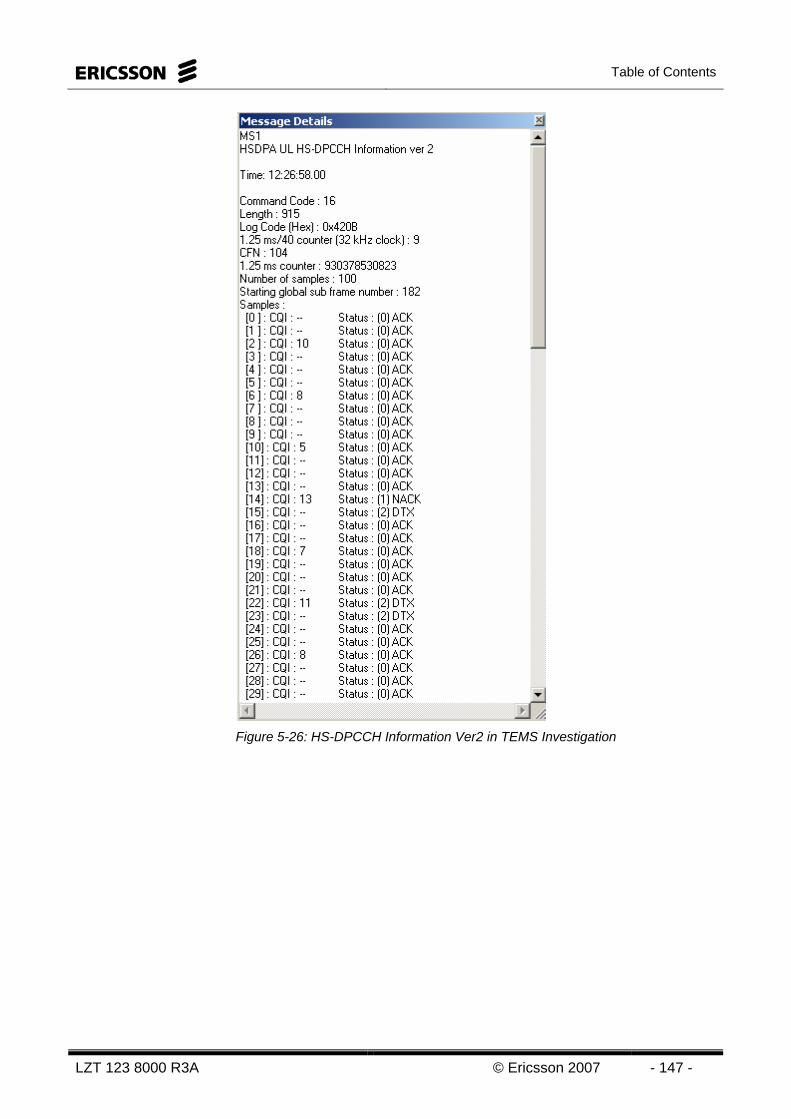
Table of Contents
LZT 123 8000 R3A © Ericsson 2007 - 147 -
Figure 5-26: HS-DPCCH Information Ver2 in TEMS Investigation
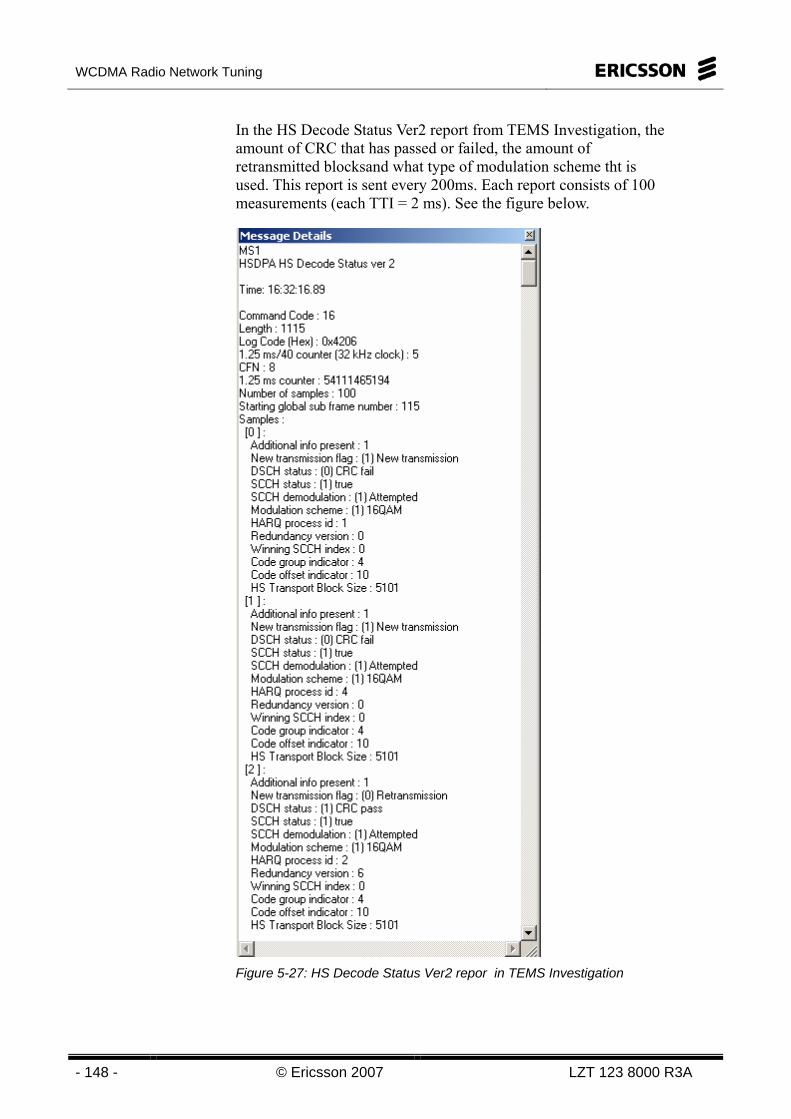
WCDMA Radio Network Tuning
- 148 - © Ericsson 2007 LZT 123 8000 R3A
In the HS Decode Status Ver2 report from TEMS Investigation, the amount of CRC that has passed or failed, the amount of retransmitted blocksand what type of modulation scheme tht is used. This report is sent every 200ms. Each report consists of 100 measurements (each TTI = 2 ms). See the figure below.
Figure 5-27: HS Decode Status Ver2 repor in TEMS Investigation
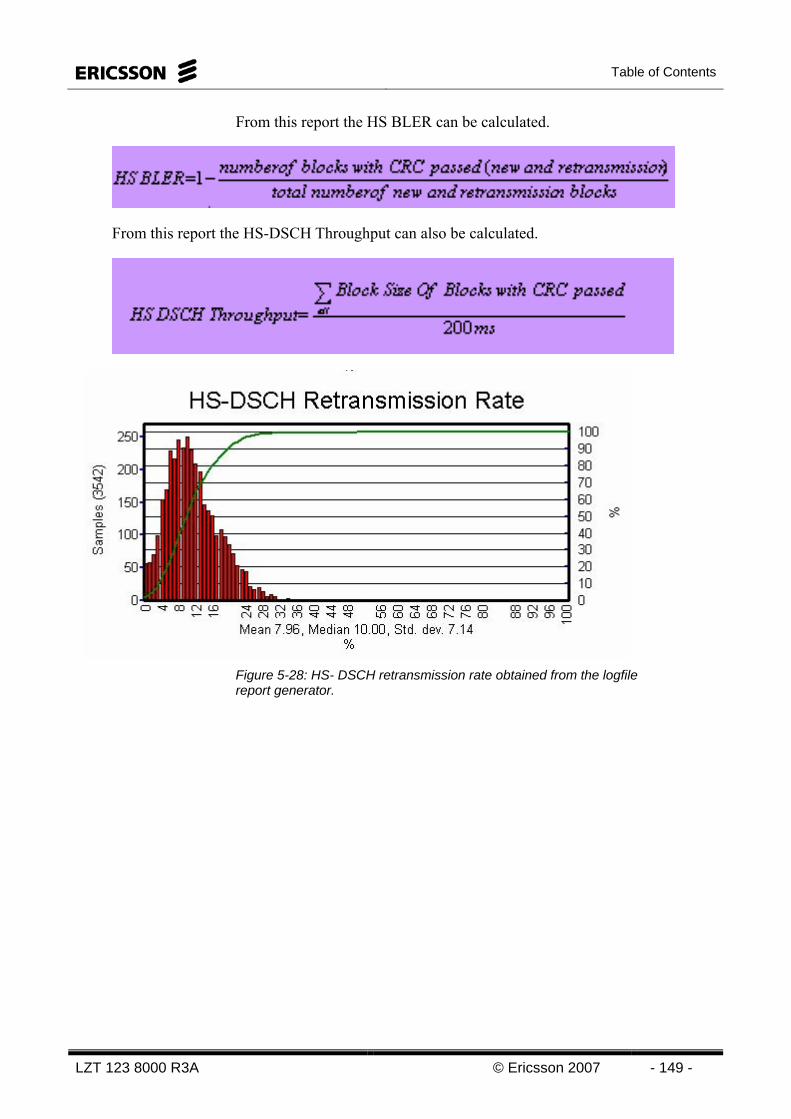
Table of Contents
LZT 123 8000 R3A © Ericsson 2007 - 149 -
From this report the HS BLER can be calculated.
From this report the HS-DSCH Throughput can also be calculated.
Figure 5-28: HS- DSCH retransmission rate obtained from the logfile report generator.
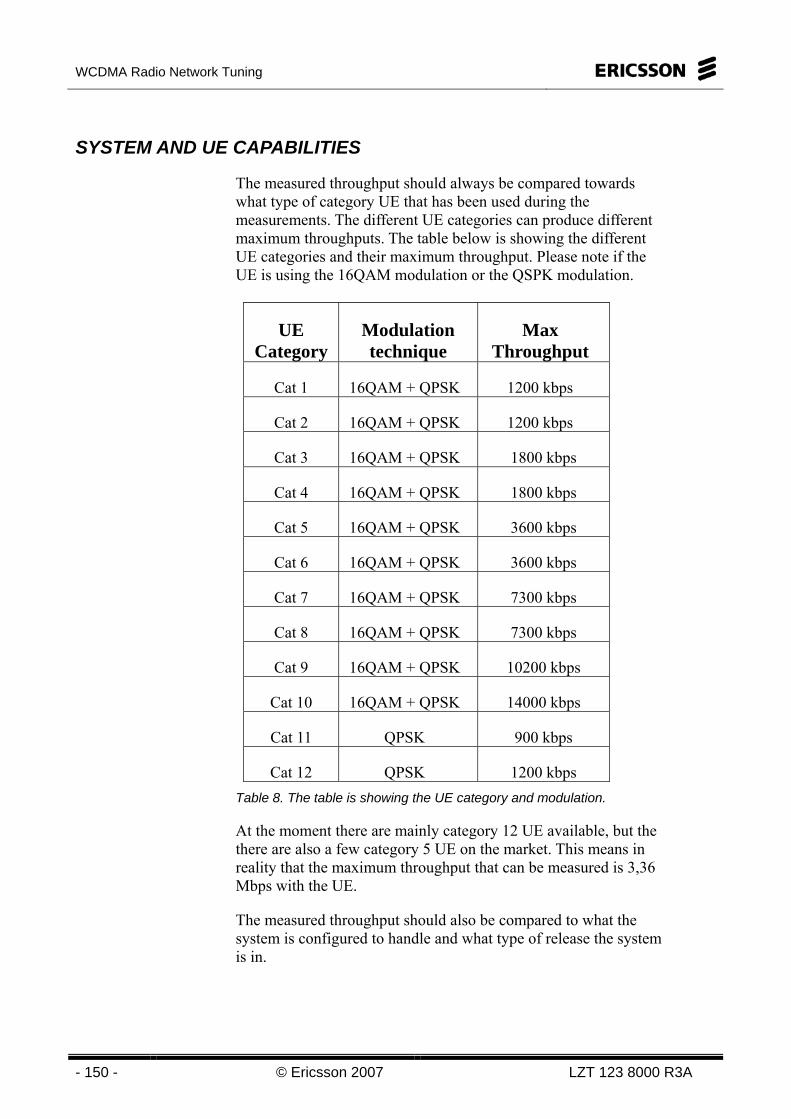
WCDMA Radio Network Tuning
- 150 - © Ericsson 2007 LZT 123 8000 R3A
SYSTEM AND UE CAPABILITIES
The measured throughput should always be compared towards what type of category UE that has been used during the measurements. The different UE categories can produce different maximum throughputs. The table below is showing the different UE categories and their maximum throughput. Please note if the UE is using the 16QAM modulation or the QSPK modulation.
UE Category
Modulation technique
Max Throughput
Cat 1 16QAM + QPSK 1200 kbps
Cat 2 16QAM + QPSK 1200 kbps
Cat 3 16QAM + QPSK 1800 kbps
Cat 4 16QAM + QPSK 1800 kbps
Cat 5 16QAM + QPSK 3600 kbps
Cat 6 16QAM + QPSK 3600 kbps
Cat 7 16QAM + QPSK 7300 kbps
Cat 8 16QAM + QPSK 7300 kbps
Cat 9 16QAM + QPSK 10200 kbps
Cat 10 16QAM + QPSK 14000 kbps
Cat 11 QPSK 900 kbps
Cat 12 QPSK 1200 kbps Table 8. The table is showing the UE category and modulation.
At the moment there are mainly category 12 UE available, but the there are also a few category 5 UE on the market. This means in reality that the maximum throughput that can be measured is 3,36 Mbps with the UE.
The measured throughput should also be compared to what the system is configured to handle and what type of release the system is in.
Table of Contents
LZT 123 8000 R3A © Ericsson 2007 - 151 -
In P4 there is a maximum of 5 channelization codes, and then the amount is fixed. With 5 channelization codes dedicated to HSDPA and a 16QAM modulation the maximum throughput delivered by the system is 4,32 Mbps.
In P5 the maximum of channelization codes that can be used is 15. The number is not fixed but multiplexed depending on how many HSDPA users that are on the cell as well as the availability of codes in the channelization tree. The maximum rate that the system can deliver in P5 is therefore 13,9 Mbps, application throughput.
WCDMA Radio Network Tuning
- 152 - © Ericsson 2007 LZT 123 8000 R3A
Intentionally blank
WCDMA Radio Network Tuning
LZT 123 8000 R3A © Ericsson 2007 - 153 -
6 Acronyms and Abbreviations
WCDMA Radio Network Tuning
- 154 - © Ericsson 2007 LZT 123 8000 R3A
Intentionally Blank
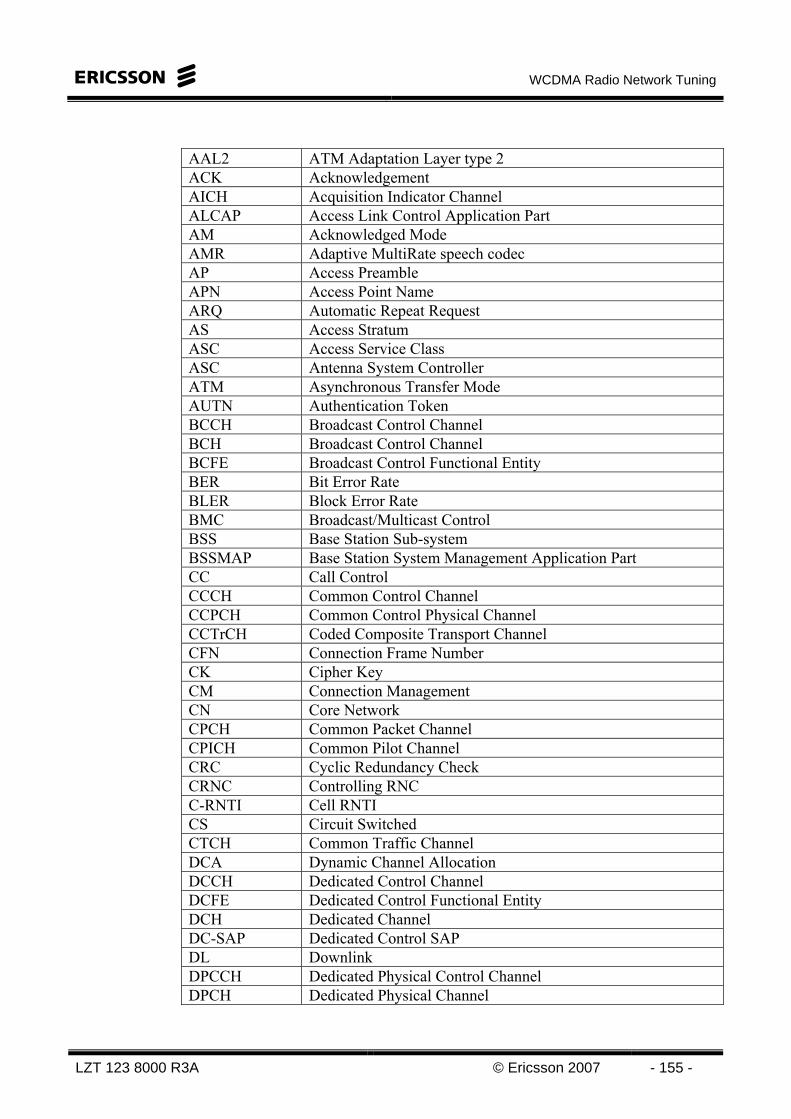
WCDMA Radio Network Tuning
LZT 123 8000 R3A © Ericsson 2007 - 155 -
AAL2 ATM Adaptation Layer type 2 ACK Acknowledgement AICH Acquisition Indicator Channel ALCAP Access Link Control Application Part AM Acknowledged Mode AMR Adaptive MultiRate speech codec AP Access Preamble APN Access Point Name ARQ Automatic Repeat Request AS Access Stratum ASC Access Service Class ASC Antenna System Controller ATM Asynchronous Transfer Mode AUTN Authentication Token BCCH Broadcast Control Channel BCH Broadcast Control Channel BCFE Broadcast Control Functional Entity BER Bit Error Rate BLER Block Error Rate BMC Broadcast/Multicast Control BSS Base Station Sub-system BSSMAP Base Station System Management Application Part CC Call Control CCCH Common Control Channel CCPCH Common Control Physical Channel CCTrCH Coded Composite Transport Channel CFN Connection Frame Number CK Cipher Key CM Connection Management CN Core Network CPCH Common Packet Channel CPICH Common Pilot Channel CRC Cyclic Redundancy Check CRNC Controlling RNC C-RNTI Cell RNTI CS Circuit Switched CTCH Common Traffic Channel DCA Dynamic Channel Allocation DCCH Dedicated Control Channel DCFE Dedicated Control Functional Entity DCH Dedicated Channel DC-SAP Dedicated Control SAP DL Downlink DPCCH Dedicated Physical Control Channel DPCH Dedicated Physical Channel

WCDMA Radio Network Tuning
- 156 - © Ericsson 2007 LZT 123 8000 R3A
DRAC Dynamic Resource Allocation Control DRNC Drift RNC DRNS Drift RNS DRX Discontinuous Reception DSCH Downlink Shared Channel DTCH Dedicated Traffic Channel DTX Discontinuous Transmission EP Elementary Procedure FACH Forward Access Channel FAUSCH Fast Uplink Signalling Channel FDD Frequency Division Duplex FFS For Further Study FN Frame Number FP Frame Protocol FTP File Transfer Protocol ID Identifier GSM Global System for Mobile Communication HSDPA High Speed Downlink Packet Access HTTP Hyper-Text Transfer Protocol IE Information element IMEI International Mobile Equipment Identity IMSI International Mobile Subscriber Identity IRAT Inter Radio Access Technology Change IP Internet Protocol ISCP Interference on Signal Code Power KPI Key Performance Indicators KSI Key Set Identifier L1 Layer 1 L2 Layer 2 L3 Layer 3 LAI Location Area Identity MAC Medium Access Control MAC The Message Authentication Code included in AUTN,
computed using f1 MCC Mobile Country Code MM Mobility Management MNC Mobile Network Code MO Mobile Originating Call MS Mobile Station MSC Mobile services Switching Centre MT Mobile Terminal MTC Mobile Terminated Call NAS Non Access Stratum NBAP Node B Application Protocol Nt-SAP Notification SAP NW Network
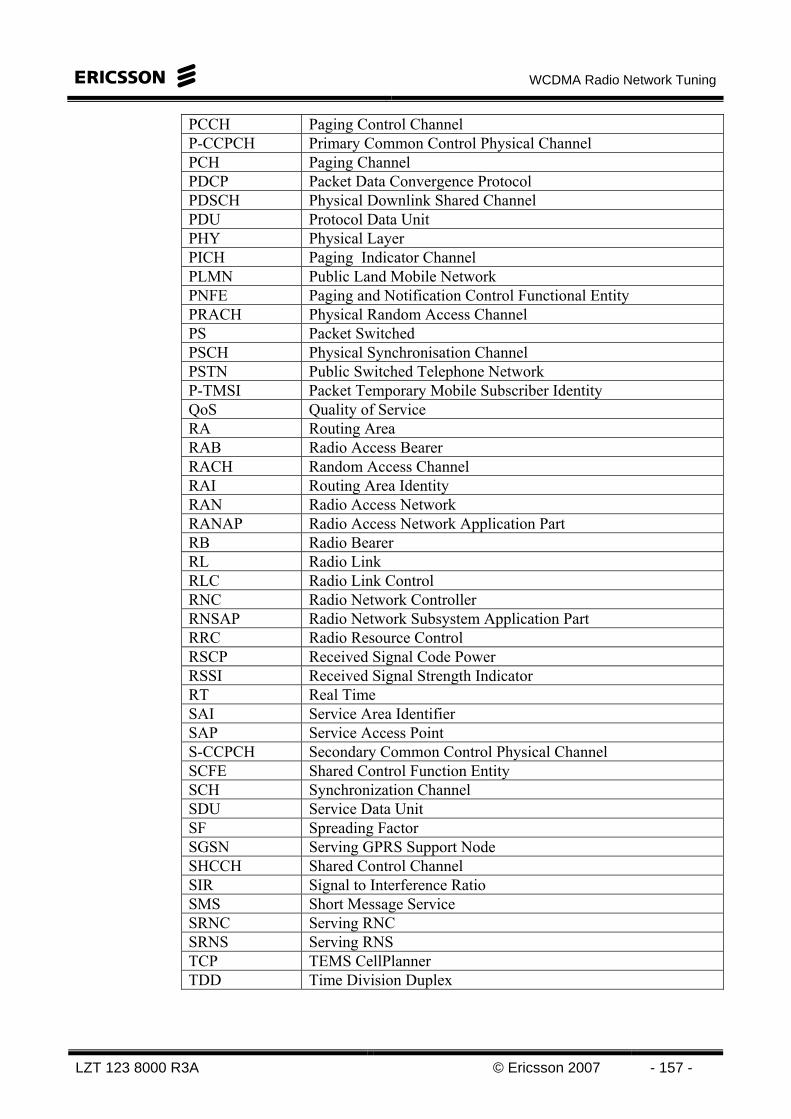
WCDMA Radio Network Tuning
LZT 123 8000 R3A © Ericsson 2007 - 157 -
PCCH Paging Control Channel P-CCPCH Primary Common Control Physical Channel PCH Paging Channel PDCP Packet Data Convergence Protocol PDSCH Physical Downlink Shared Channel PDU Protocol Data Unit PHY Physical Layer PICH Paging Indicator Channel PLMN Public Land Mobile Network PNFE Paging and Notification Control Functional Entity PRACH Physical Random Access Channel PS Packet Switched PSCH Physical Synchronisation Channel PSTN Public Switched Telephone Network P-TMSI Packet Temporary Mobile Subscriber Identity QoS Quality of Service RA Routing Area RAB Radio Access Bearer RACH Random Access Channel RAI Routing Area Identity RAN Radio Access Network RANAP Radio Access Network Application Part RB Radio Bearer RL Radio Link RLC Radio Link Control RNC Radio Network Controller RNSAP Radio Network Subsystem Application Part RRC Radio Resource Control RSCP Received Signal Code Power RSSI Received Signal Strength Indicator RT Real Time SAI Service Area Identifier SAP Service Access Point S-CCPCH Secondary Common Control Physical Channel SCFE Shared Control Function Entity SCH Synchronization Channel SDU Service Data Unit SF Spreading Factor SGSN Serving GPRS Support Node SHCCH Shared Control Channel SIR Signal to Interference Ratio SMS Short Message Service SRNC Serving RNC SRNS Serving RNS TCP TEMS CellPlanner TDD Time Division Duplex

WCDMA Radio Network Tuning
- 158 - © Ericsson 2007 LZT 123 8000 R3A
TE Terminal Equipment TEID Tunnel Endpoint Identifier TEMS Test Mobile System TF Transport Format TFC Transport Format Combination TFCI Transport Format Combination Indicator TFCS Transport Format Combination Set TM Transparent Mode TMA Tower Mounted Amplifier TMSI Temporary Mobile Subscriber Identity TPC Transmit Power Control Tr Transparent TrCH Transport Channel TTI Transmission Time Interval Tx Transmission UARFCN UMTS Absolute Radio Frequency Channel Number UE User Equipment UL Uplink UM Unacknowledged Mode UMTS Universal Mobile Telecommunication System UNACK Unacknowledgement URA UTRAN Registration Area UTRA UMTS Terrestrial Radio Access UTRAN UMTS Terrestrial Radio Access Network VLR Visitor Location Register WCDMA Wideband Code Division Multiple Access
Top Related