


![[Webinar] Supercharge Your Law Firm Revenue with NewLaw and Big Four Sales Methods (John Grimley)](https://static.fdocuments.net/doc/165x107/58ed84841a28ab4c568b45c3/webinar-supercharge-your-law-firm-revenue-with-newlaw-and-big-four-sales.jpg)


Languages
Pages
Legal


5 Ways to Supercharge Your Mobile
Revenue with Call Intelligence
JULIA STEAD, INVOCA
STEVE BURNETT, OBILITY
@NEILPATEL#KissWebinar @Kissmetrics #Callintelligence
#KissWebinar
@thuelmadsen

JULIA STEAD Director of Demand Generation, Invoca
@JuliaStead
STEVE BURNETT Senior SEM Manager, Obility
@ObilityB2B

@NEILPATEL#KissWebinar @Kissmetrics #Callintelligence
#KissWebinar
@JuliaStead @ObilityB2B
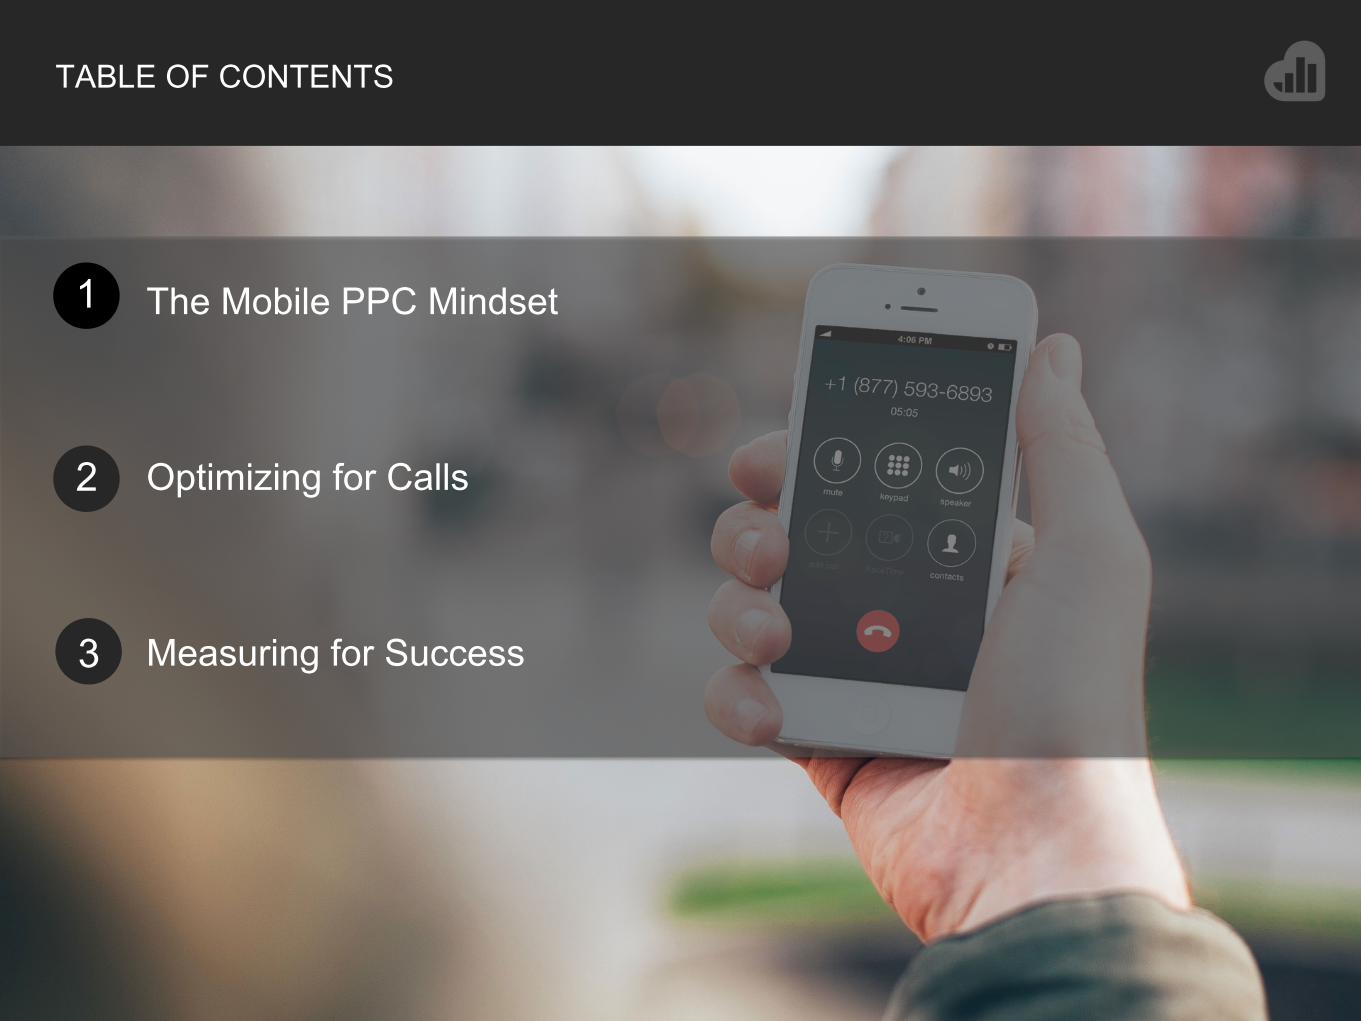
1 The Mobile PPC Mindset
2
3 Measuring for Success
TABLE OF CONTENTS
Optimizing for Calls

WATCH WEBINAR RECORDING NOW

The Mobile PPC Mindset
HOW CALLS FIT INTO THE CUSTOMER EXPERIENCE

THE WORLD HAS GONE MOBILE……
51% of Emails are Opened on Mobile
SEARCH
Mobile Search to Overtook Desktop
Search in 2015
ADS
Mobile Ad Spending Growing at 3x Non-Mobile
Digital Spending
SOCIAL
100% of Facebook’s Revenue Growth is Coming from Mobile

AND ITS CHANGING CONSUMER BEHAVIOR…
vs.
This is a computer.
This is a phone.

MOBILE SEARCH DRIVES BILLIONS OF CALLS
61% of mobile searches result in
call
70+ Billion inbound calls via mobile search by 2016

AND CALLS DRIVE REVENUE
Calls convert at a much higher rate than web leads.
1-2% for clicks
30-50% for calls

66% Advertisers that consider calls the most valuable
type of lead

ARE YOU LETTING SEARCHERS CALL?
Basics: Click-to-call ads • Including a phone number increases click
through rates by 6-8% • 70% of mobile searchers have used the
call button

TWEET OF THE DAY
“57% of sales teams prefer receiving inbound calls to web leads, but only 22% of marketers use PPC call extensions.”
@NEILPATEL
@Kissmetrics @Invoca #KissWebinar #callintelligence

ARE YOU LETTING SEARCHERS CALL?
Must-haves: • Always add numbers on landing pages, forms • Include all types of offers (eBooks, Social Pages,
Webinars)

YOU MAY BE SURPRISED…
70% of our calls from paid search come from a landing page, not the ad.
31%
69%
Call directly from ad (Call Extensions)
Call from landing page

YOU MAY BE SURPRISED…
White papers drive 10% of our calls.
58% 23%
10%
3% 3% 3%
Web Content Product Offer Whitepaper eBook Blog Other
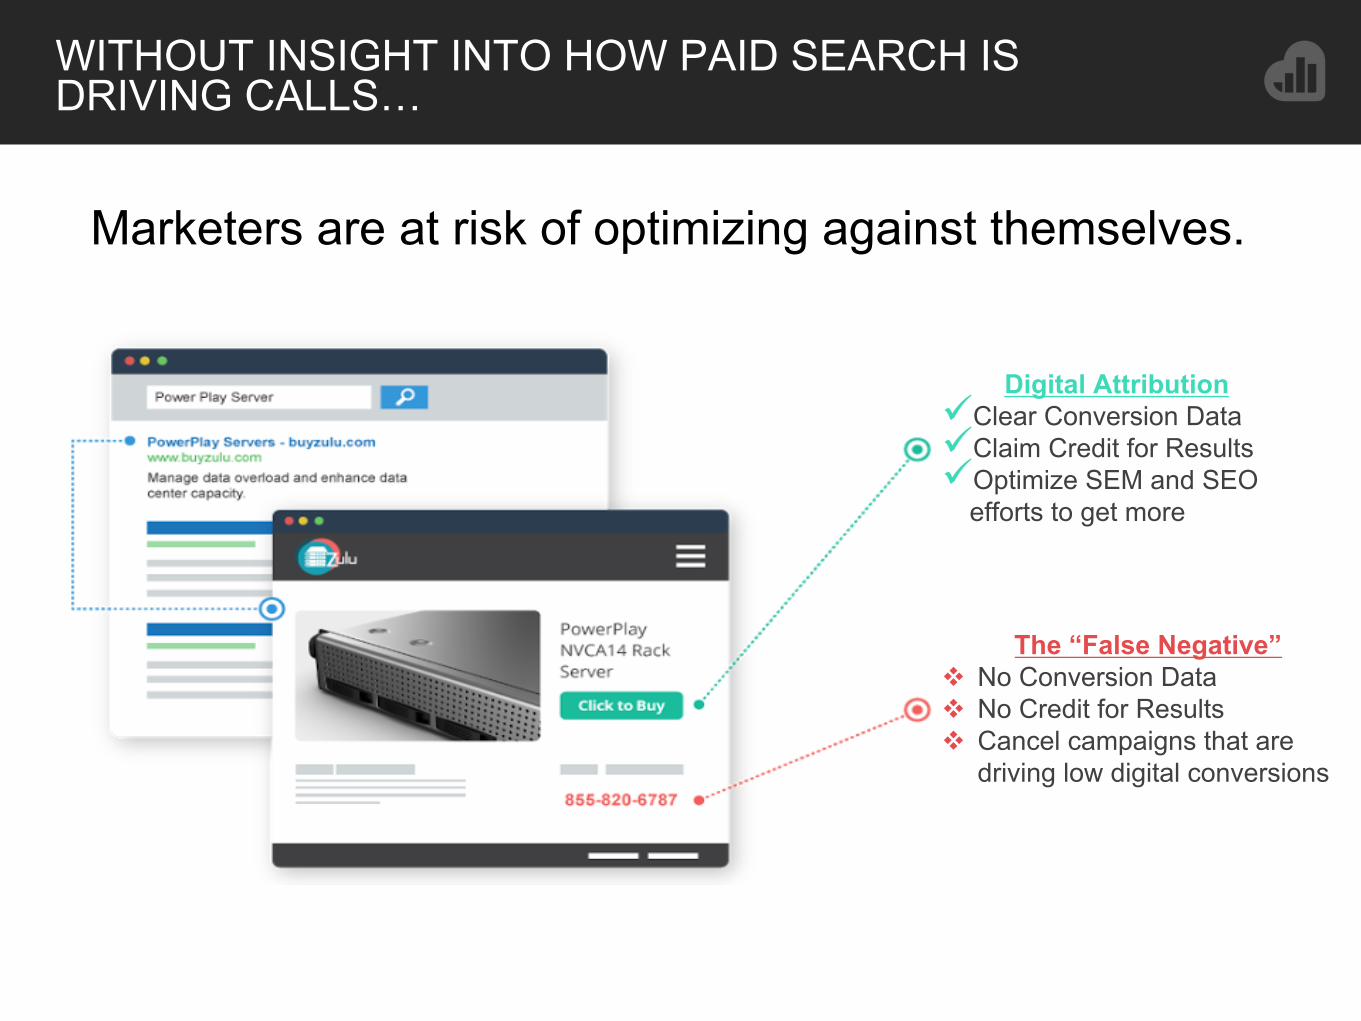
WITHOUT INSIGHT INTO HOW PAID SEARCH IS DRIVING CALLS…
Digital Attribution ! Clear Conversion Data ! Claim Credit for Results ! Optimize SEM and SEO
efforts to get more
The “False Negative” " No Conversion Data " No Credit for Results " Cancel campaigns that are
driving low digital conversions
Marketers are at risk of optimizing against themselves.

COUNTING CALLS ISN’T ENOUGH
With calls, quality has a huge impact on ROI and revenue.
Optimizing for Calls
CHECKLIST FOR DRIVING BETTER ROI AND MORE REVENUE

CHECKLIST FOR OPTIMIZATION
! Are your campaigns driving prospect vs customer service calls? - Set appropriate IVR filtering & routing rules to match caller with right recipient
CHECKLIST FOR OPTIMIZATION
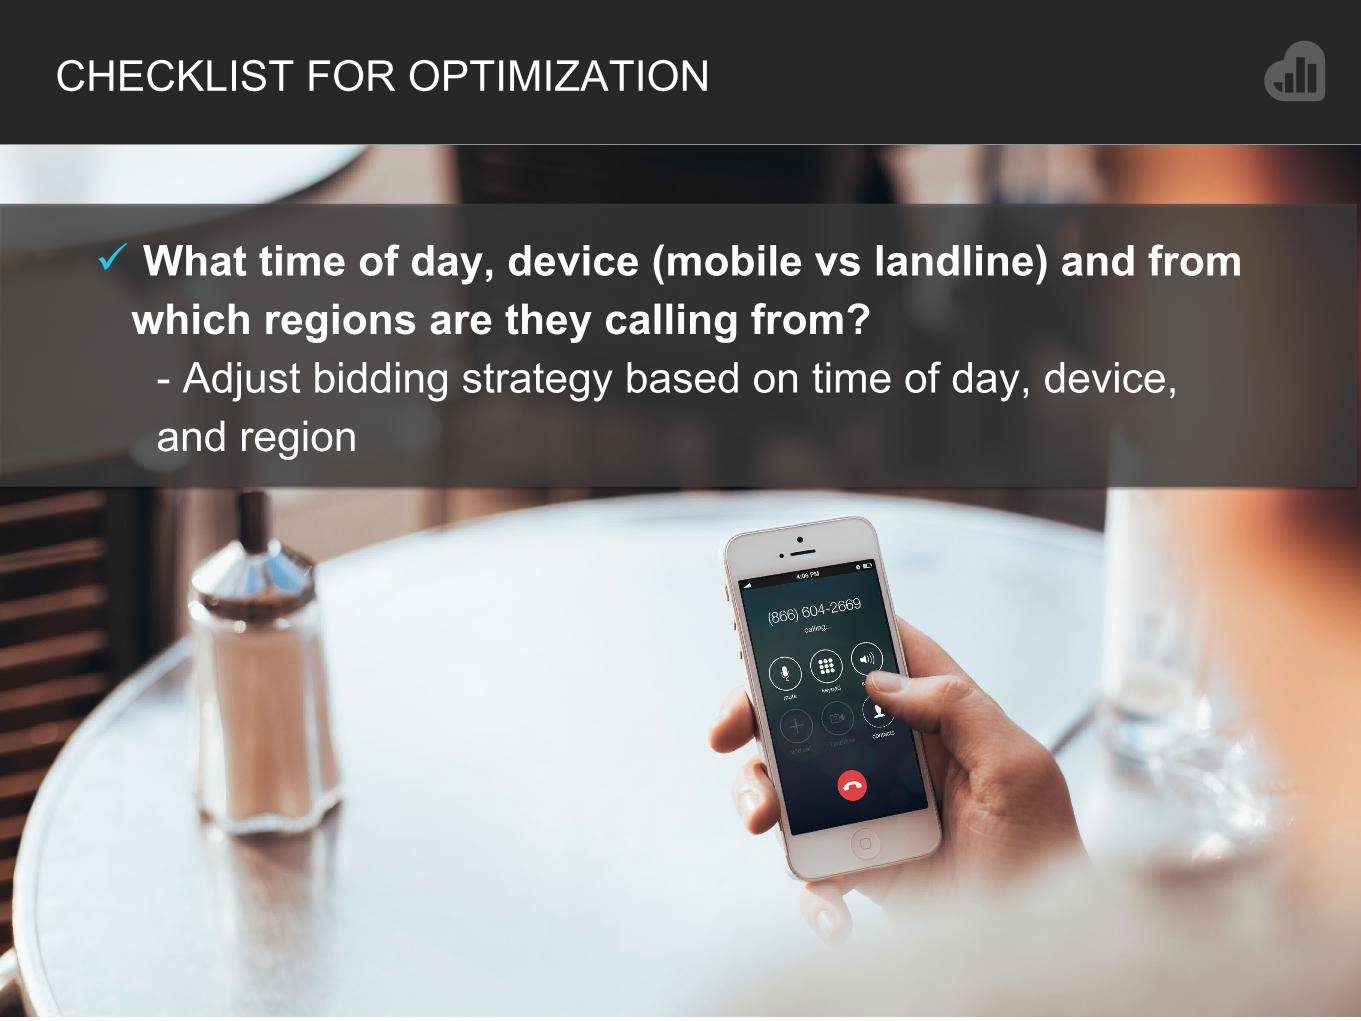
! What time of day, device (mobile vs landline) and from which regions are they calling from? - Adjust bidding strategy based on time of day, device, and region
CHECKLIST FOR OPTIMIZATION
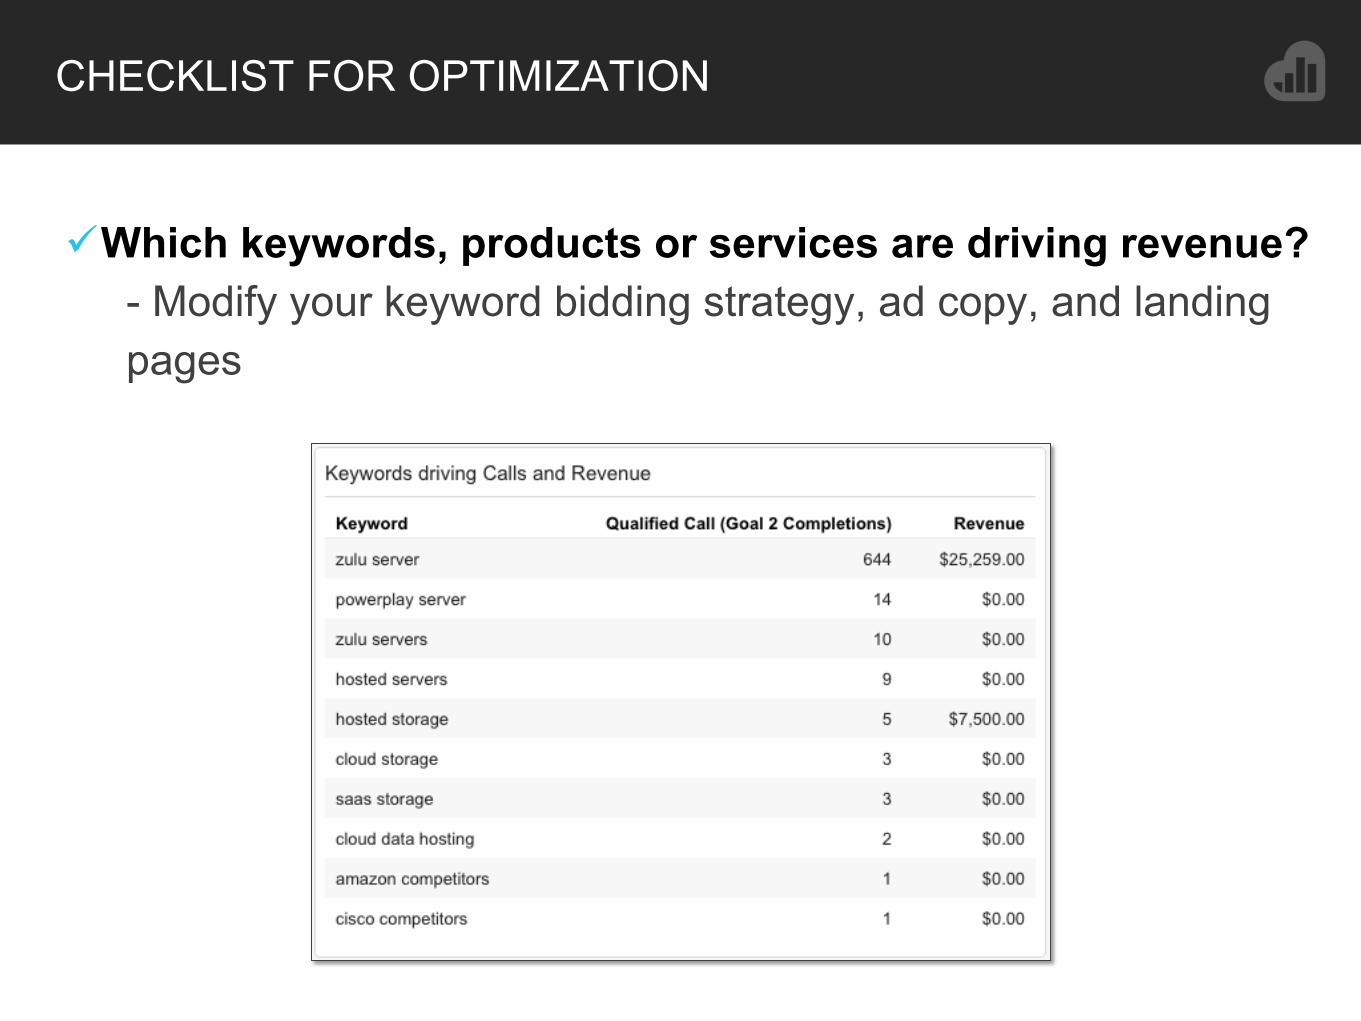
! Which keywords, products or services are driving revenue? - Modify your keyword bidding strategy, ad copy, and landing pages

DRIVE A MORE TARGETED CROSS-CHANNEL EXPERIENCE
# Get real-time data synced into your bid management systems # Leverage this offline conversion data for more accurate re-targeting
across all digital channels

GET BETTER SALES ALIGNMENT, CLOSED-LOOP ROI
! Create call leads in real-time just like digital leads ! Give sales/call center team insight into why they’re calling
Real-time call data
Measuring for Success
NEW KPI FOR CLOSED LOOP REPORTING
LOG IN WITH GOOGLE
Start Your Free Kissmetrics Trial

1 Let your prospects call
2
3 Create a better customer experience with filtering, routing, and retargeting data from calls
KEY TAKEAWAYS
Measure call quality, not quantity
Look beyond conversions – focus on revenue 4

FRONT END PERFORMANCE MEASUREMENT
• Clicks • Calls • Source • Campaign • Ad Group
Platform KPI’s
Top Funnel
• Analytics
Front End Data
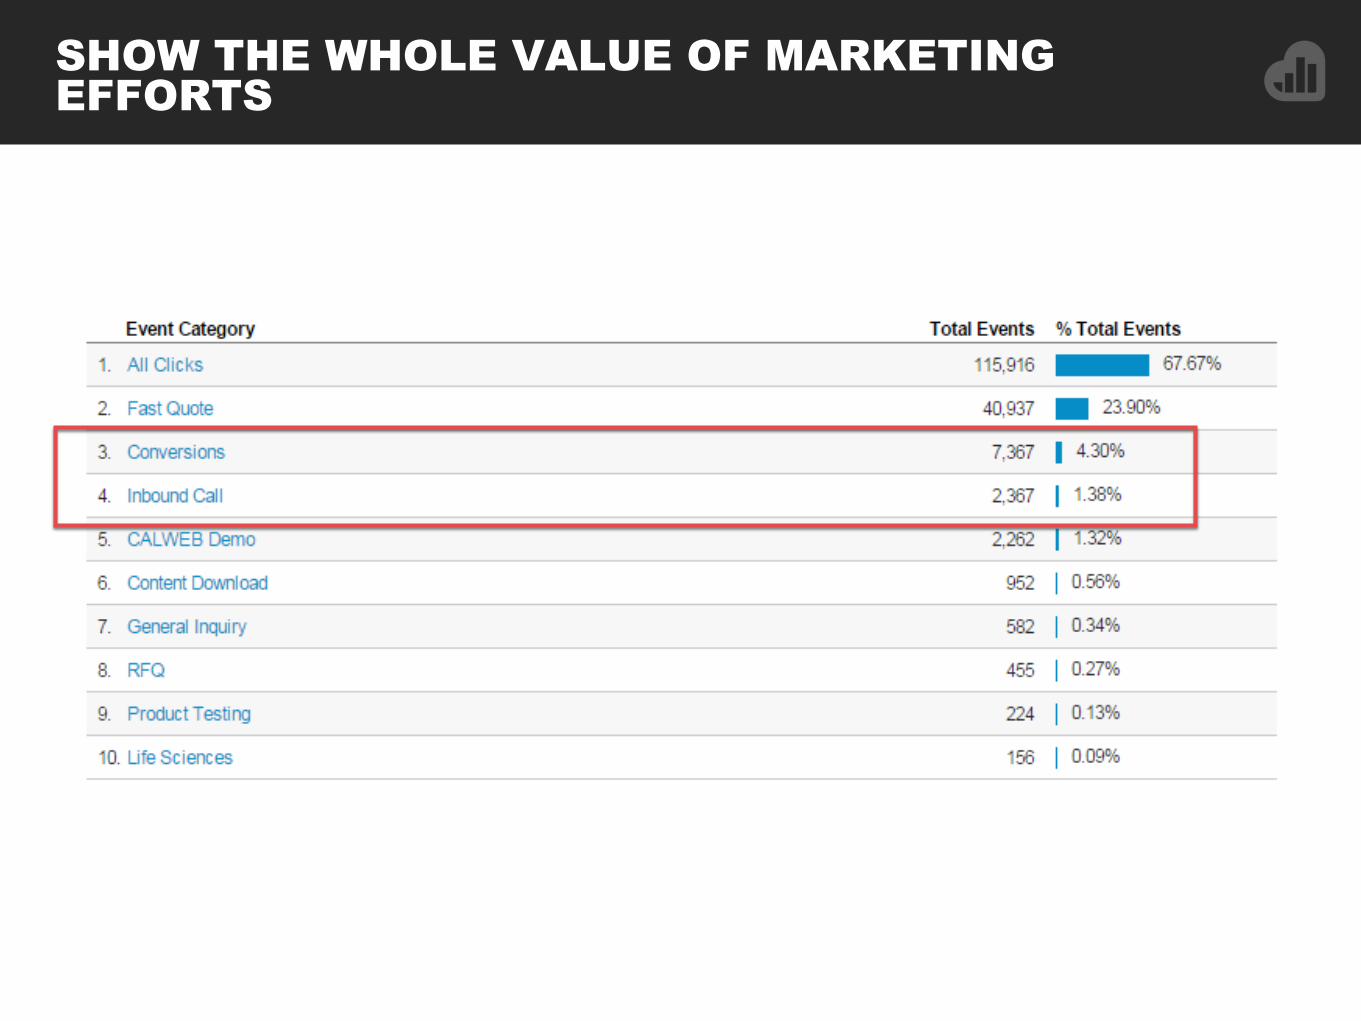
SHOW THE WHOLE VALUE OF MARKETING EFFORTS

SHOW THE WHOLE VALUE OF MARKETING EFFORTS

SHOW THE WHOLE VALUE OF MARKETING EFFORTS
Conversion)Name Sum)of)ConversionsFastQuote 1,349Phone1Calls 1,166Grand)Total 2,515
Spend CPA)(no)calls) CPA)(with)calls)$149,740.77 $111.00 $59.54

SHOW THE WHOLE VALUE OF MARKETING EFFORTS
! At the campaign level, without phone calls campaign optimization looks very different
! Without the ability to include phone calls, CPA is almost double
! Several key campaigns would have been minimized or turned off completely
! With phone calls, CPA is way below target
Campaigns FastQuote Phone1Calls Costs CPA1(no1phone1calls) CPA1(with1phone1calls)Campaign(1 8 233 $20,146 $2,518.26 $83.59Campaign(2 267 183 $22,840 $85.54 $50.76Campaign(3 29 125 $11,633 $401.14 $75.54Campaign(4 223 100 $4,329 $19.41 $13.40Campaign(5 248 69 $12,364 $49.85 $39.00Campaign(6 46 50 $8,282 $180.04 $86.27Campaign(7 44 45 $5,689 $129.29 $63.92Campaign(8 17 38 $5,107 $300.38 $92.85Campaign(9 41 37 $4,536 $110.64 $58.16Campaign(10 40 34 $6,759 $168.98 $91.34Campaign(11 94 34 $8,490 $90.32 $66.33Campaign(12 1 32 $3,611 $3,610.97 $109.42Campaign(13 60 32 $3,992 $66.53 $43.39Campaign(14 6 18 $2,406 $400.98 $100.24Campaign(15 10 18 $1,983 $198.29 $70.82Campaign(16 21 18 $1,833 $87.30 $47.01Campaign(17 16 $503 $0.00 $31.46Campaign(18 18 16 $2,547 $141.48 $74.90Campaign(19 26 14 $3,999 $153.82 $99.98Campaign(20 100 10 $7,673 $76.73 $69.76Campaign(21 8 $1,015 $0.00 $126.83Campaign(22 12 8 $1,377 $114.73 $68.84Campaign(23 4 8 $2,126 $531.45 $177.15Campaign(24 7 6 $641 $91.55 $49.29Campaign(25 4 $518 $0.00 $129.58Campaign(26 11 3 $2,547 $231.51 $181.90Campaign(27 1 2 $54 $53.99 $18.00Campaign(28 7 2 $794 $113.44 $88.23Campaign(29 2 1 $1,116 $557.77 $371.84Campaign(30 6 1 $425 $70.76 $60.65Campaign(31 1 $401 $0.00 $401.22Totals: 1,349 1,166 149734.3 $111.00 $59.54

MID-FUNNEL PERFORMANCE MEASUREMENT
• Cost Data • Keyword Data • Impressions • Clicks • Calls
Platform KPI’s
Mid Funnel
• Adwords • Bing
Platform Data
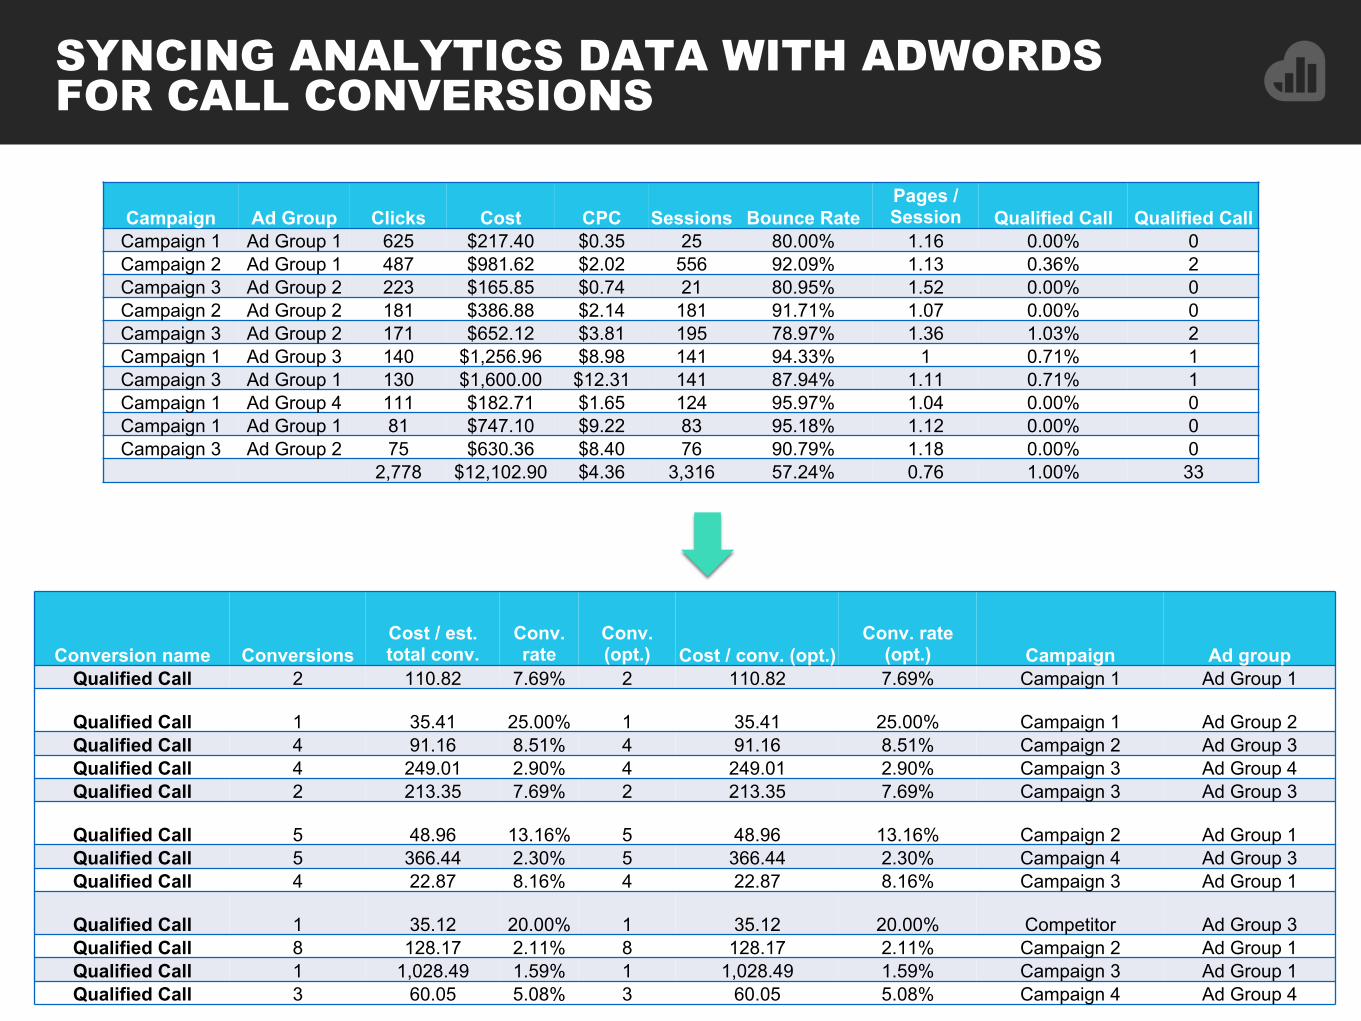
SYNCING ANALYTICS DATA WITH ADWORDS FOR CALL CONVERSIONS
Conversion name Conversions Cost / est. total conv.
Conv. rate
Conv. (opt.) Cost / conv. (opt.)
Conv. rate (opt.) Campaign Ad group
Qualified Call 2 110.82 7.69% 2 110.82 7.69% Campaign 1 Ad Group 1
Qualified Call 1 35.41 25.00% 1 35.41 25.00% Campaign 1 Ad Group 2 Qualified Call 4 91.16 8.51% 4 91.16 8.51% Campaign 2 Ad Group 3 Qualified Call 4 249.01 2.90% 4 249.01 2.90% Campaign 3 Ad Group 4 Qualified Call 2 213.35 7.69% 2 213.35 7.69% Campaign 3 Ad Group 3
Qualified Call 5 48.96 13.16% 5 48.96 13.16% Campaign 2 Ad Group 1 Qualified Call 5 366.44 2.30% 5 366.44 2.30% Campaign 4 Ad Group 3 Qualified Call 4 22.87 8.16% 4 22.87 8.16% Campaign 3 Ad Group 1
Qualified Call 1 35.12 20.00% 1 35.12 20.00% Competitor Ad Group 3 Qualified Call 8 128.17 2.11% 8 128.17 2.11% Campaign 2 Ad Group 1 Qualified Call 1 1,028.49 1.59% 1 1,028.49 1.59% Campaign 3 Ad Group 1 Qualified Call 3 60.05 5.08% 3 60.05 5.08% Campaign 4 Ad Group 4
Campaign Ad Group Clicks Cost CPC Sessions Bounce Rate Pages / Session Qualified Call Qualified Call
Campaign 1 Ad Group 1 625 $217.40 $0.35 25 80.00% 1.16 0.00% 0 Campaign 2 Ad Group 1 487 $981.62 $2.02 556 92.09% 1.13 0.36% 2 Campaign 3 Ad Group 2 223 $165.85 $0.74 21 80.95% 1.52 0.00% 0 Campaign 2 Ad Group 2 181 $386.88 $2.14 181 91.71% 1.07 0.00% 0 Campaign 3 Ad Group 2 171 $652.12 $3.81 195 78.97% 1.36 1.03% 2 Campaign 1 Ad Group 3 140 $1,256.96 $8.98 141 94.33% 1 0.71% 1 Campaign 3 Ad Group 1 130 $1,600.00 $12.31 141 87.94% 1.11 0.71% 1 Campaign 1 Ad Group 4 111 $182.71 $1.65 124 95.97% 1.04 0.00% 0 Campaign 1 Ad Group 1 81 $747.10 $9.22 83 95.18% 1.12 0.00% 0 Campaign 3 Ad Group 2 75 $630.36 $8.40 76 90.79% 1.18 0.00% 0
2,778 $12,102.90 $4.36 3,316 57.24% 0.76 1.00% 33

ACCURATELY REFLECT COST AND CONVERSION DATA
Campaign Name Clicks Impressions CTR Cost Avg. CPC Conversions CVR Cost/Conv.
Call Conv.
Total Conv.
Actual CPC
Display 1,364 511,442 0.91% $2,858.82 $2.14 27 1.73% $105.88 19 46 $62.15
Display Campaign 1 586 275,521 0.21% $1,518.75 $2.59 17 2.90% $89.34 10 27 $56.25
Display Campaign 2 335 10,846 3.09% $134.63 $0.40 2 0.60% $67.32 0 2 $67.32
Display Campaign 3 380 167,325 0.23% $1,025.35 $2.70 7 1.84% $146.48 8 15 $68.36
Display Campaign 4 63 57,750 0.11% $180.09 $2.86 1 1.59% $180.09 1 2 $90.05
Search 736 62,039 1.70% $3,572.47 $5.90 39 4.73% $91.60 22 61 $58.57
Search Campaign 1 160 19,962 0.80% $1,152.81 $7.21 4 2.50% $288.20 5 9 $128.09
Search Campaign 2 340 7,164 4.75% $678.80 $2.00 26 7.65% $26.11 10 36 $18.86
Search Campaign 3 181 23,901 0.76% $1,363.97 $7.54 6 3.31% $227.33 6 12 $113.66
Search Campaign 4 55 11,012 0.50% $376.89 $6.85 3 5.45% $125.63 1 4 $94.22
Retargeting 402 172,353 0.33% $504.03 $1.31 12 3.31% $42.00 0 12 $42.00
Retargeting Campaign 1 111 53,776 0.21% $89.56 $0.81 5 4.50% $17.91 0 5 $17.91
Retargeting Campaign 2 131 16,467 0.80% $194.64 $1.49 2 1.53% $97.32 0 2 $97.32
Retargeting Campaign 3 65 51,136 0.13% $129.56 $1.99 4 6.15% $32.39 0 4 $32.39
Retargeting Campaign 4 95 50,974 0.19% $90.27 $0.95 1 1.05% $90.27 0 1 $90.27
Grand Total 3,827 1,382,243 0.28% $18,422.52 $4.81 124 3.24% $148.57 74 198 $93.04
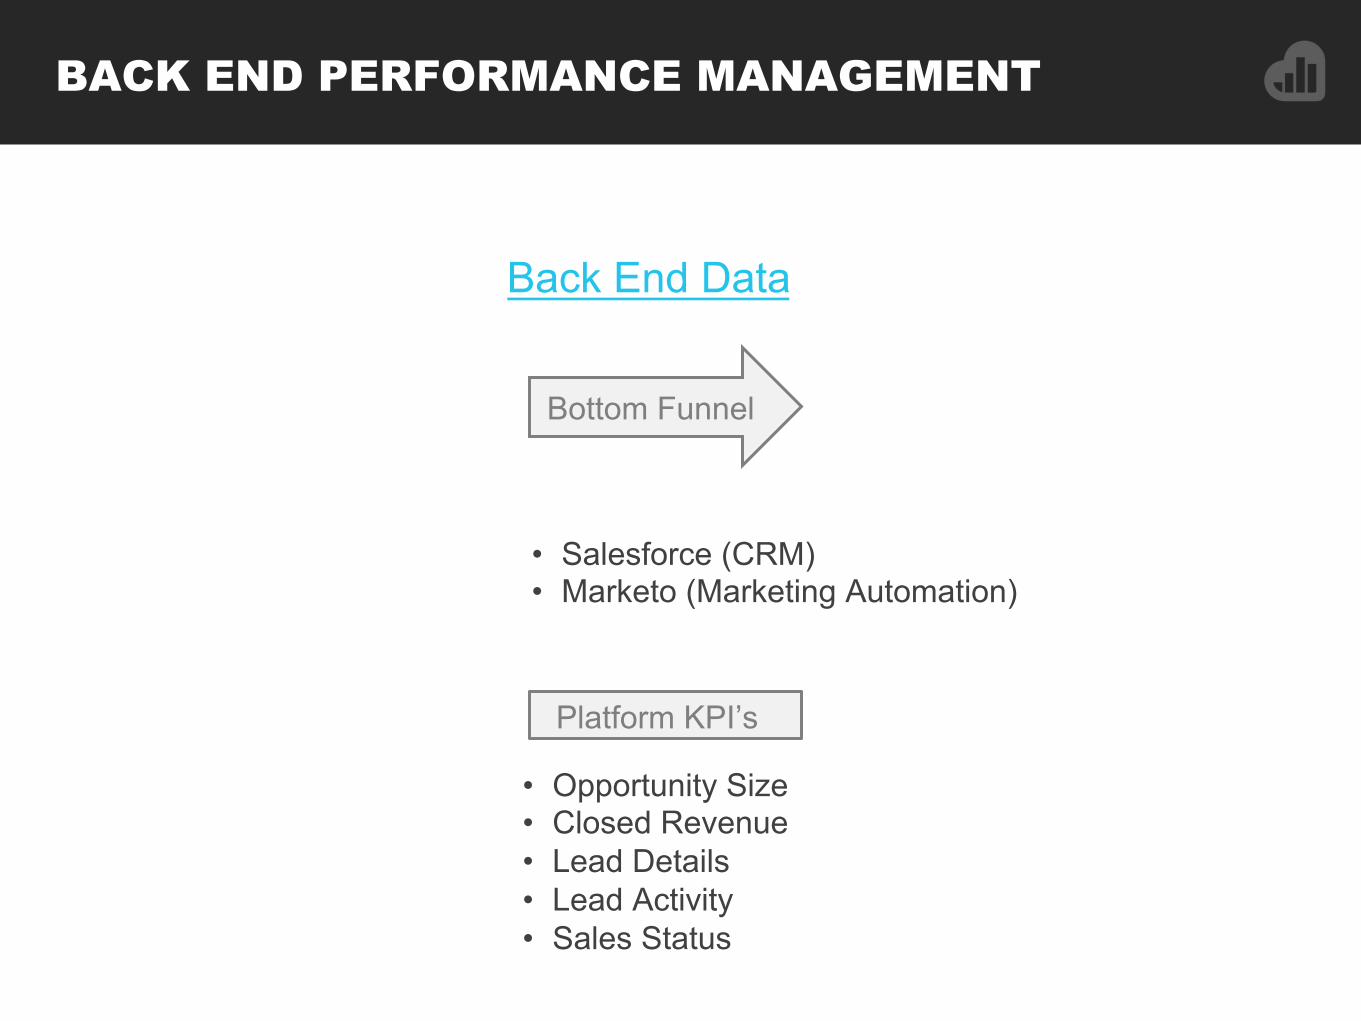
BACK END PERFORMANCE MANAGEMENT
• Opportunity Size • Closed Revenue • Lead Details • Lead Activity • Sales Status
Platform KPI’s
Bottom Funnel
• Salesforce (CRM) • Marketo (Marketing Automation)
Back End Data

SHOW THE WHOLE VALUE OF MARKETING EFFORTS
! Keyword level data is available even in instances where there is no “click”
! Designate a phone number(s) from the bank of numbers for strategies that may not require a traceable action (like call extensions)

BACKEND PERFORMANCE DATA
! Tie Salesforce leads back to the paid search call campaigns that drove them
First Name Last Name Title Company / Account Lead Source Acquisition Program
Sample Name Sample Last Name Marketing Title Sample Company Paid Search Call Extensions Paid Search Adwords Sample Name Sample Last Name Marketing Title Sample Company Paid Search Call Extensions Paid Search Adwords Sample Name Sample Last Name Marketing Title Sample Company Paid Search Call Extensions Paid Search Adwords Sample Name Sample Last Name Marketing Title Sample Company Paid Search Call Extensions Paid Search Adwords Sample Name Sample Last Name Marketing Title Sample Company Paid Search PS (Google) Sample Offer Sample Name Sample Last Name Marketing Title Sample Company Paid Search PS (Google) Sample Offer Sample Name Sample Last Name Marketing Title Sample Company Paid Search PS (Google) Sample Offer Sample Name Sample Last Name Marketing Title Sample Company Paid Search PS (Google) Sample Offer Sample Name Sample Last Name Marketing Title Sample Company Paid Search PS (Google) Sample Offer Sample Name Sample Last Name Marketing Title Sample Company Paid Search PS (Google) Sample Offer Sample Name Sample Last Name Marketing Title Sample Company Paid Search PS (Google) Sample Offer Sample Name Sample Last Name Marketing Title Sample Company Paid Search PS (Google) Sample Offer Sample Name Sample Last Name Marketing Title Sample Company Paid Search PS (Google) Sample Offer
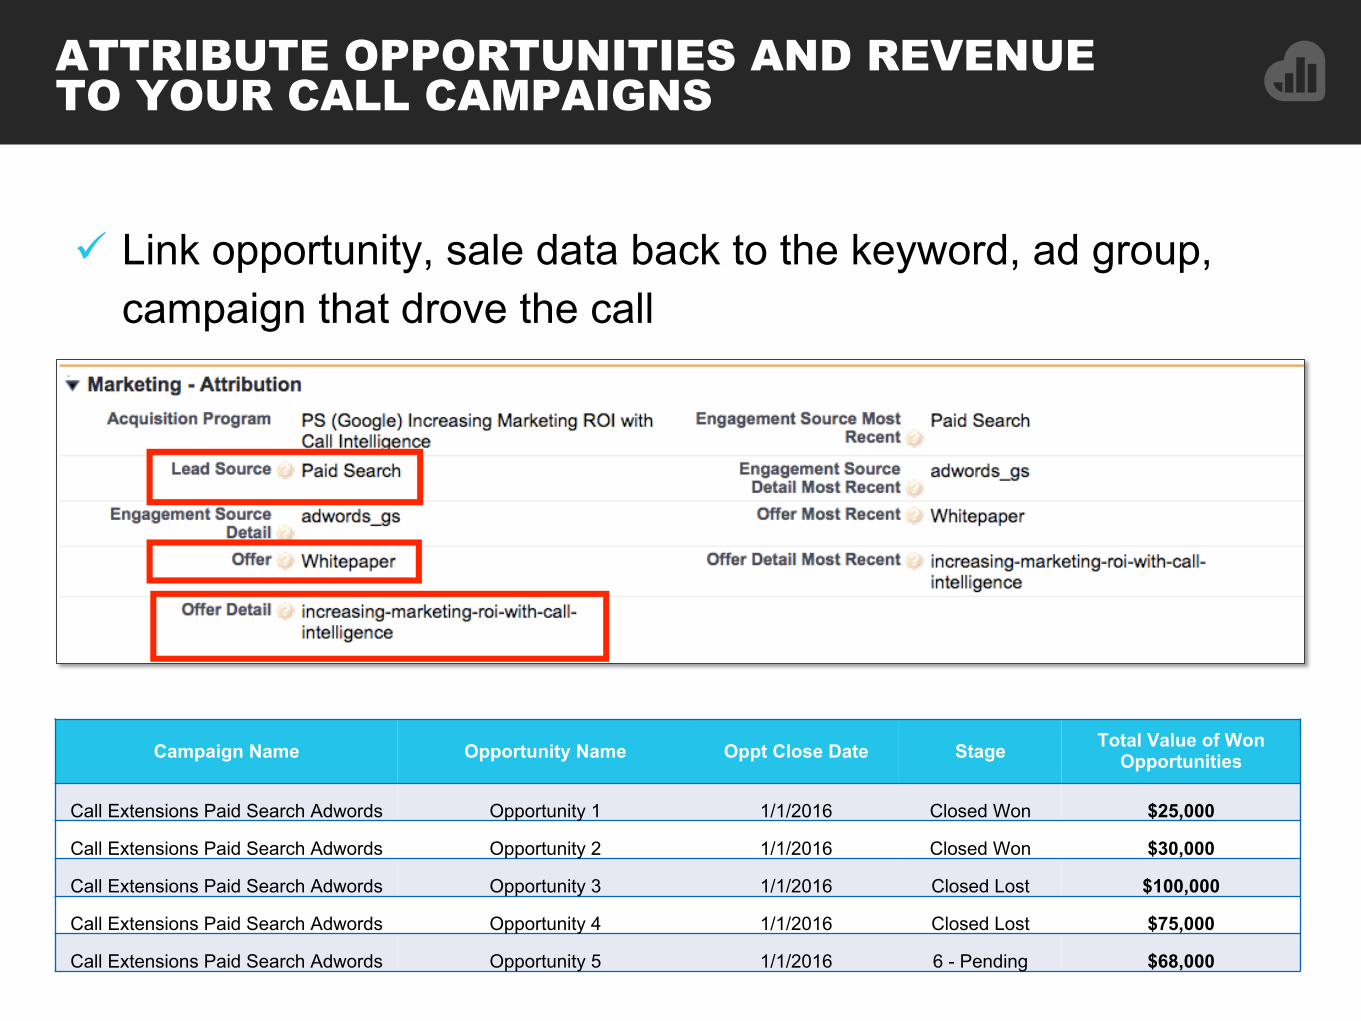
ATTRIBUTE OPPORTUNITIES AND REVENUE TO YOUR CALL CAMPAIGNS
! Link opportunity, sale data back to the keyword, ad group, campaign that drove the call
Campaign Name Opportunity Name Oppt Close Date Stage Total Value of Won Opportunities
Call Extensions Paid Search Adwords Opportunity 1 1/1/2016 Closed Won $25,000
Call Extensions Paid Search Adwords Opportunity 2 1/1/2016 Closed Won $30,000
Call Extensions Paid Search Adwords Opportunity 3 1/1/2016 Closed Lost $100,000
Call Extensions Paid Search Adwords Opportunity 4 1/1/2016 Closed Lost $75,000
Call Extensions Paid Search Adwords Opportunity 5 1/1/2016 6 - Pending $68,000

COMPLETE ATTRIBUTION MEASUREMENT
• Clicks • Calls • Source • Campaign • Ad Group
Platform KPI’s
Top Funnel
• Analytics
Front End Data
• Adwords • Bing
Platform Data
Platform KPI’s
Mid Funnel
• Cost Data • Keyword Data • Impressions • Clicks • Calls
• Opportunity Size • Closed Revenue • Lead Details • Lead Activity • Sales Status
• Salesforce • Marketo
Back End Data
Platform KPI’s
Bottom Funnel
Questions?
JULIA STEAD Director of Demand Generation, Invoca
@JuliaStead
STEVE BURNETT Senior SEM Manager, Obility
@ObilityB2B
Top Related