


Languages
Pages
Legal

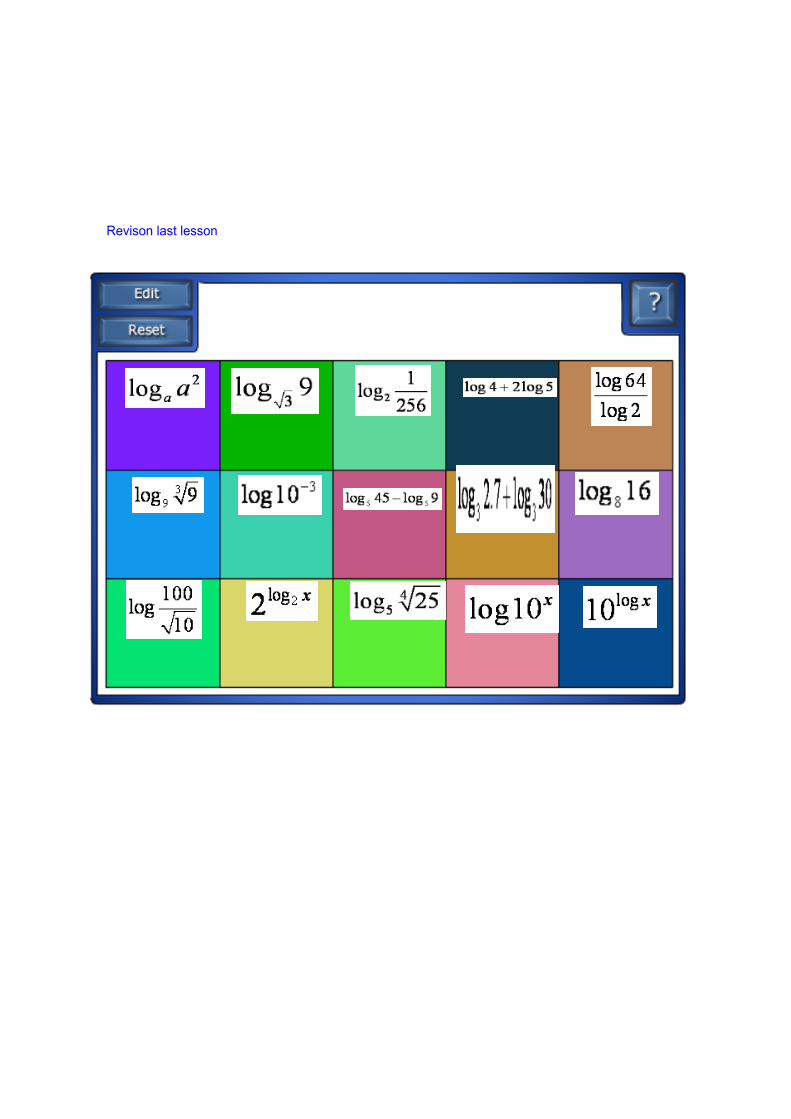
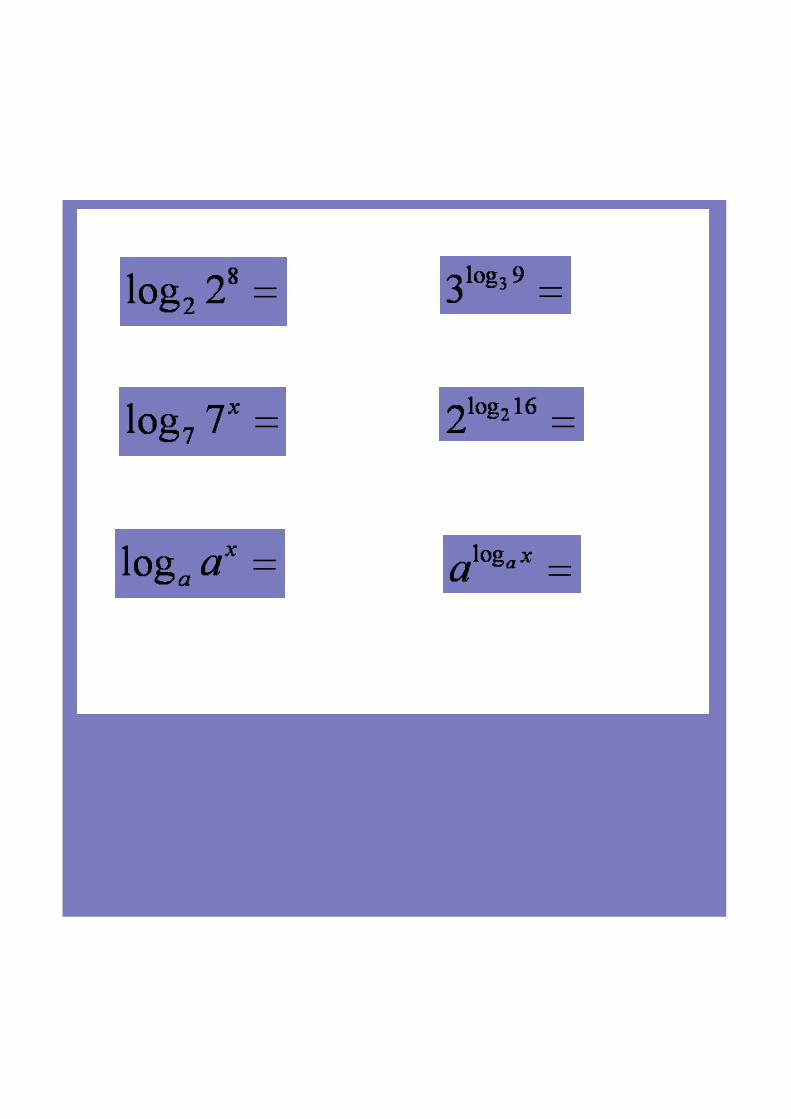
Revison last lesson
Exponential & Logarithmic functions
To explore the properties of exponential and logarithmic functions and their graphs.
To understand the nature and behavior of exponential growth and decay.
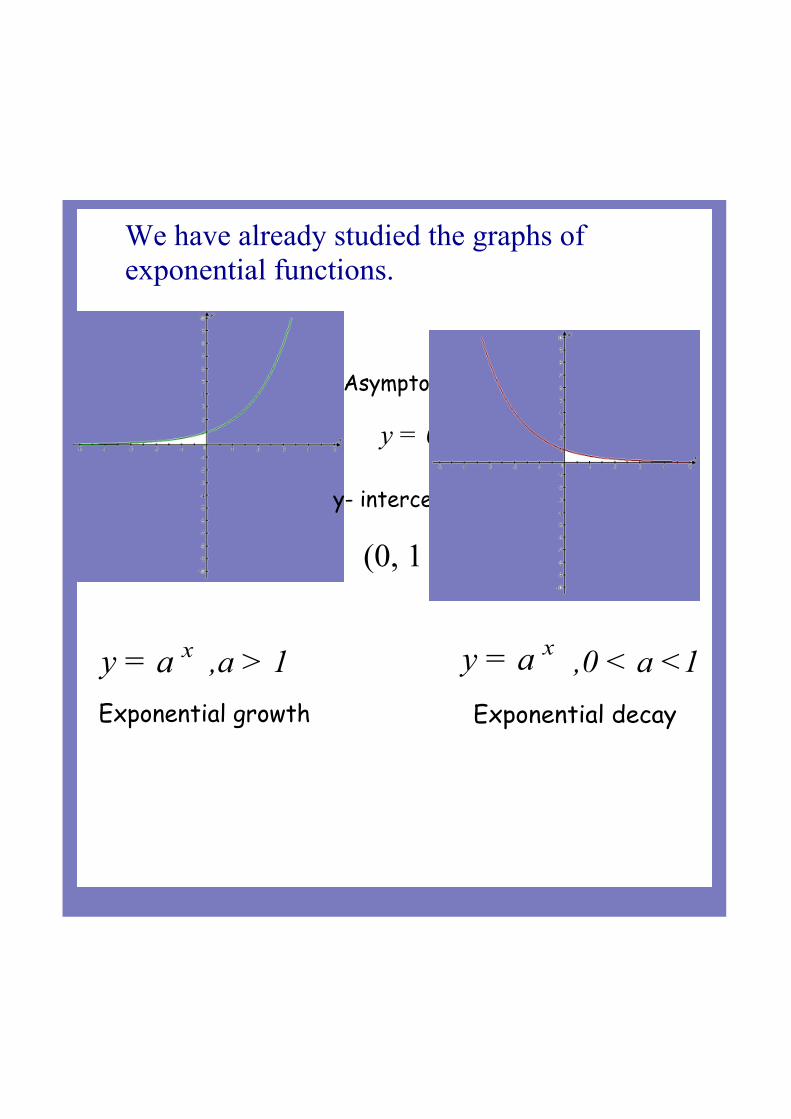
y = a x ,a > 1 Exponential growth
Asymptote:
y = 0
y- intercept:
(0, 1 )
We have already studied the graphs of exponential functions.
y = a x ,0 < a <1 Exponential decay
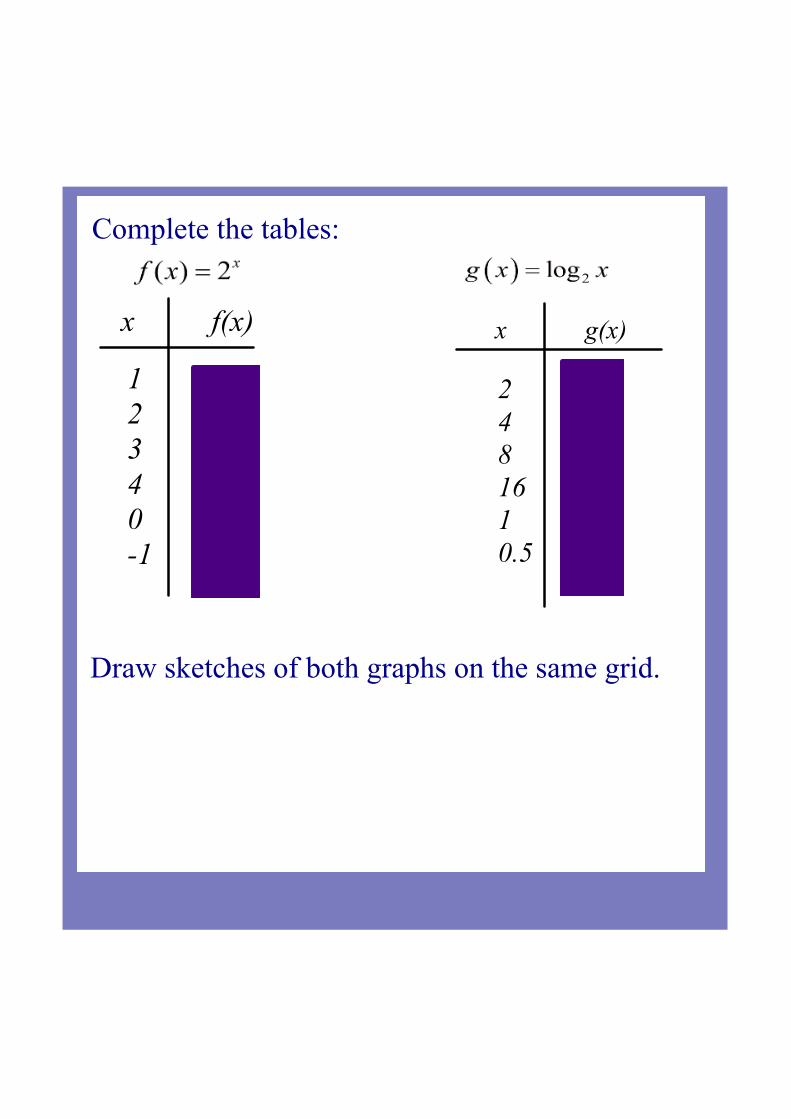
x f(x)
1 22 43 84 160 11 0.5
2 14 28 316 41 00.5 1
x g(x)
Complete the tables:
Draw sketches of both graphs on the same grid.
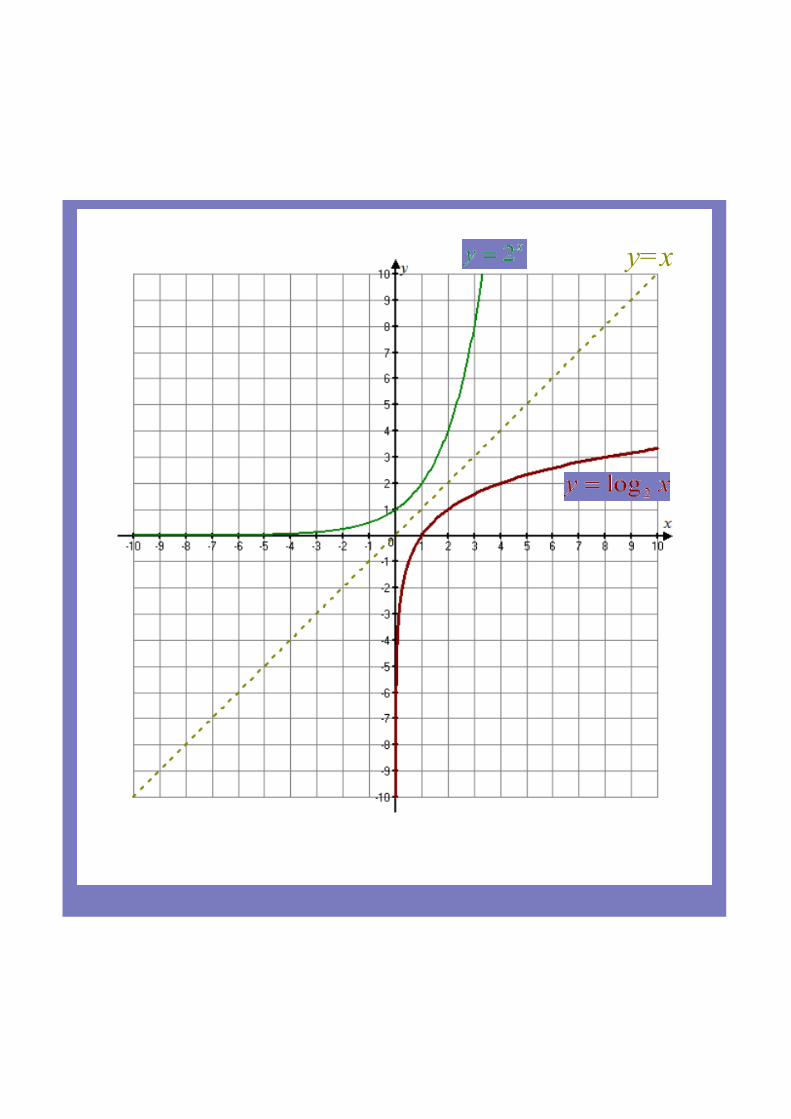
y=x
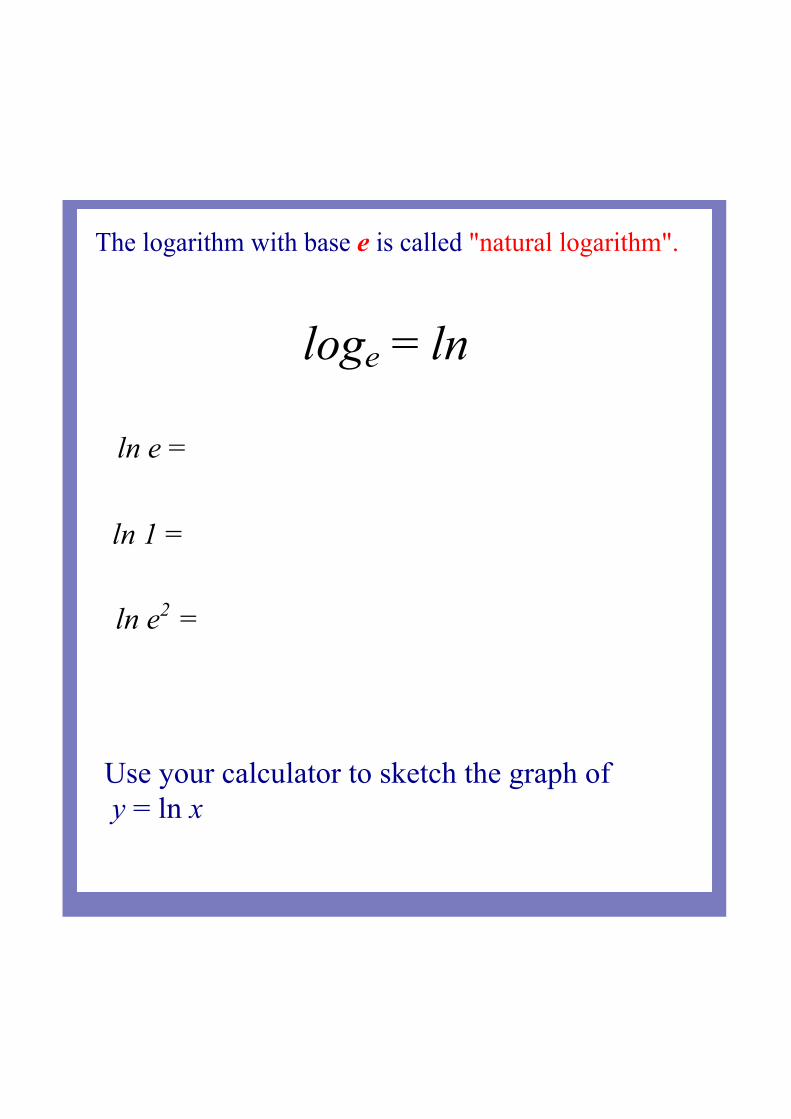
The logarithm with base e is called "natural logarithm".
loge = ln
ln e =
ln 1 =
ln e2 =
Use your calculator to sketch the graph of y = ln x
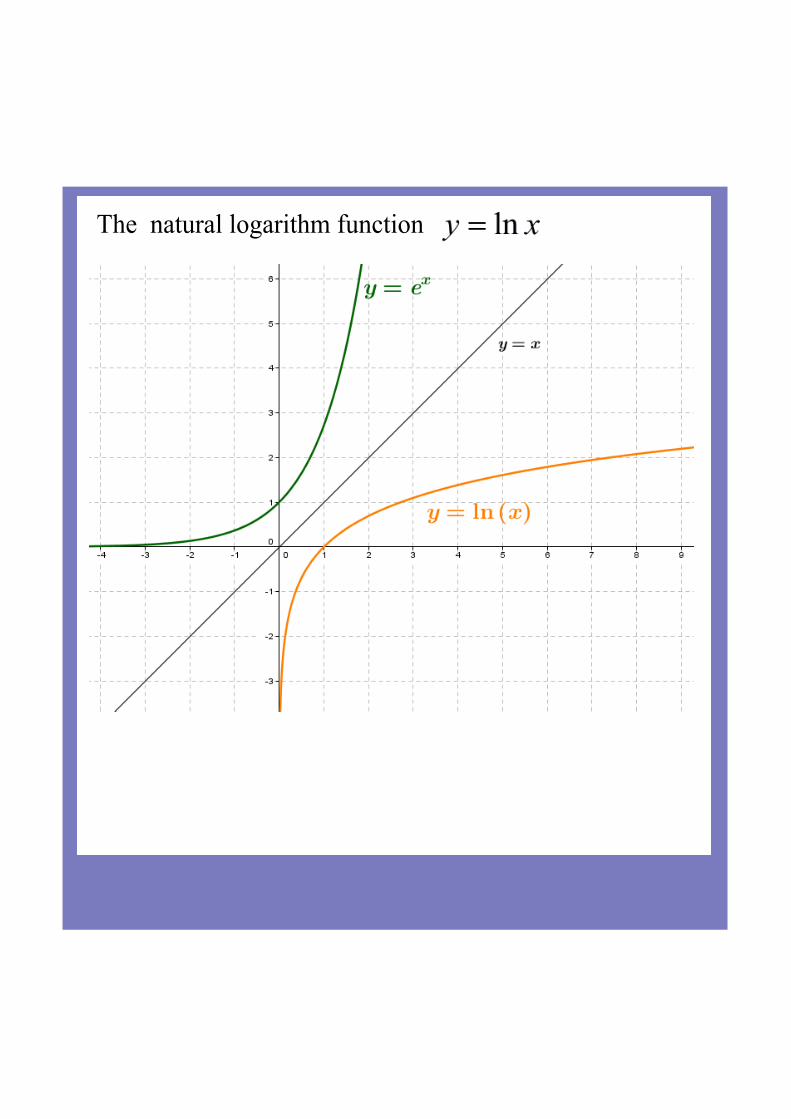
The natural logarithm function
ln e =
ln 1 =
ln e2 =
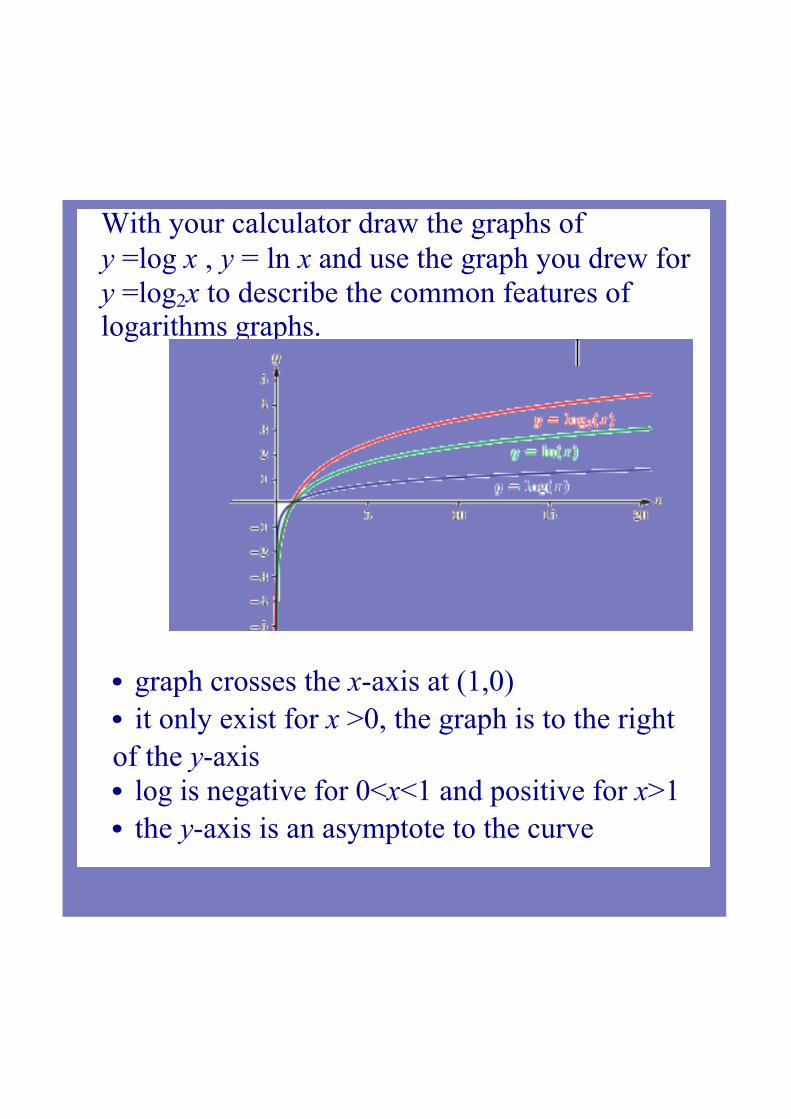
With your calculator draw the graphs of y =log x , y = ln x and use the graph you drew for y =log2x to describe the common features of logarithms graphs.
• graph crosses the xaxis at (1,0)• it only exist for x >0, the graph is to the right of the yaxis• log is negative for 0<x<1 and positive for x>1• the yaxis is an asymptote to the curve
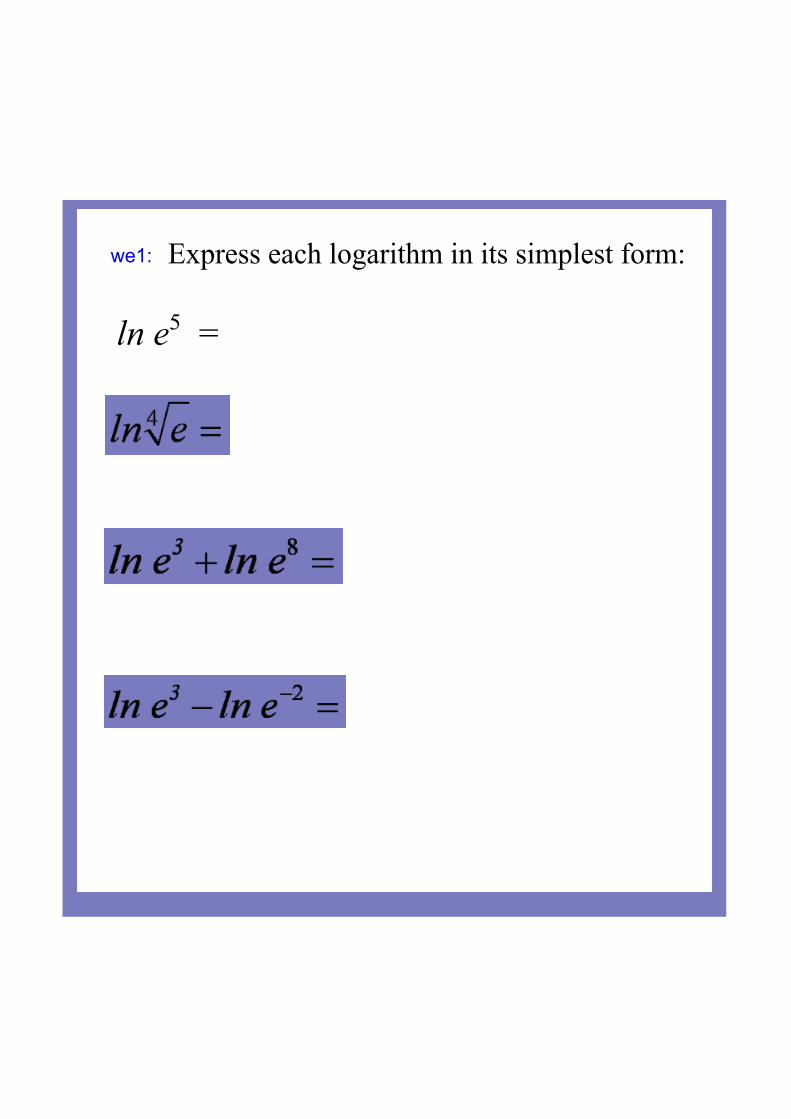
we1: Express each logarithm in its simplest form:
ln e5 =
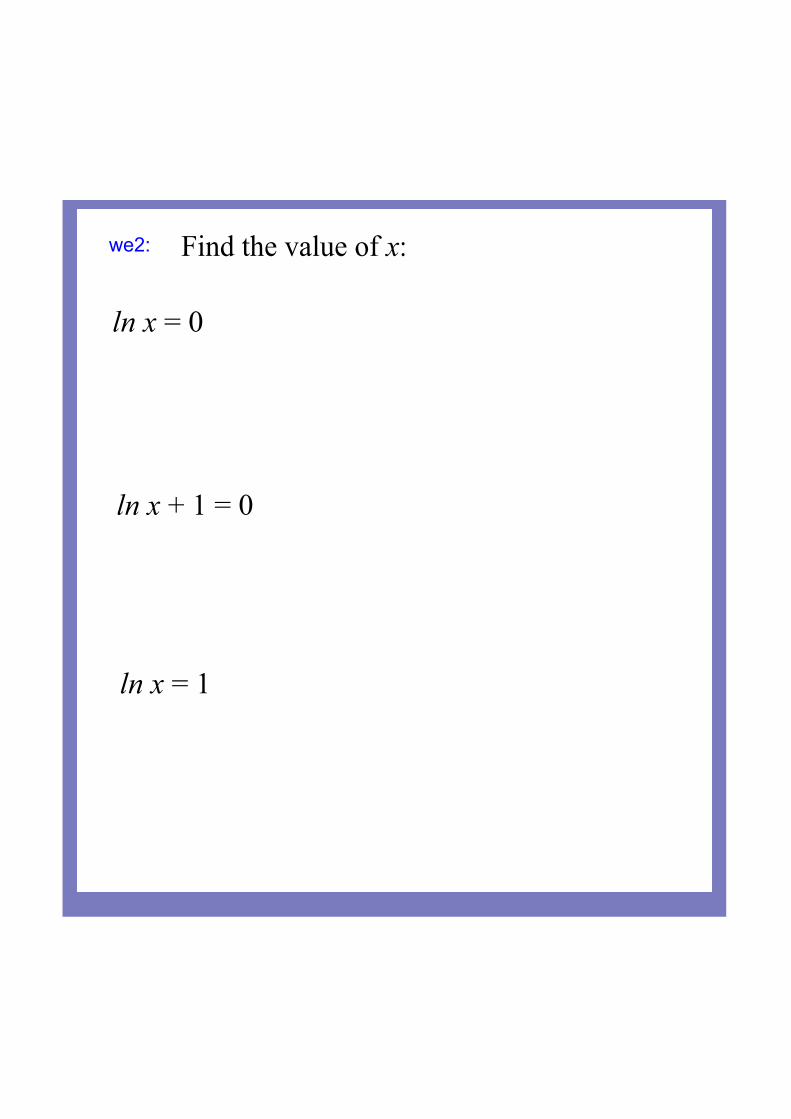
we2: Find the value of x:
ln x = 0
ln x + 1 = 0
ln x = 1
Book page 62 Ex 2F

http://www.youtube.com/watch?v=FQA2rkpBSY&feature=player_embedded#at=10
Top Related