


Languages
Pages
Legal


C I’C C: T
www.educateiowa.gov/ccpublications/
C C
T A
Tables, Fall Enrollment 2
Table of Contents
2-1. Historical Enrollment Since 1965.......................... ...............................................................................2
2-2. Enrollment Summary, Latest 5 years......................................................................................................3
2-3. Summary of Credit Hours, Latest Five Years.........................................................................................3
2-4. Credit Hours Per Student, Latest Five Years..........................................................................................4
2-5--2-9. Enrollment by Status, Latest Five Years.....................................................................................5-6
2-10--2-14. Enrollment by Program, Latest Five Years.............................................................................7-8
Tables, Section 2 | 1
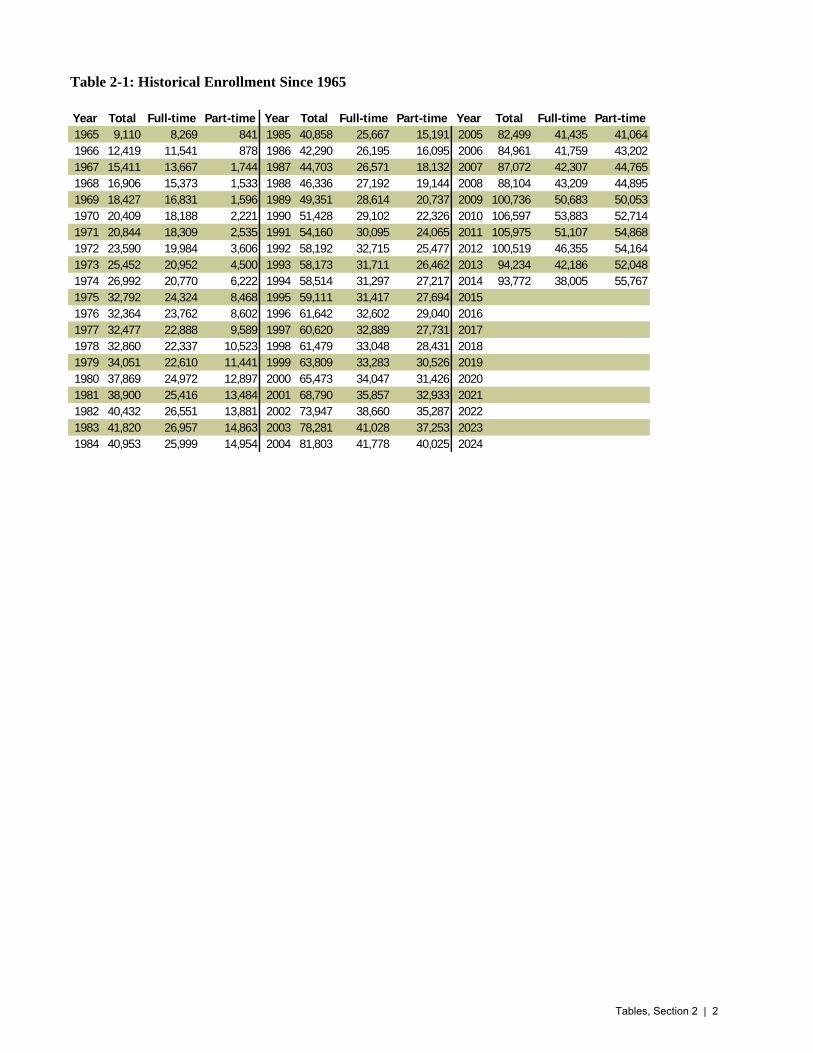
Table 2-1: Historical Enrollment Since 1965
Year Total Full-time Part-time Year Total Full-time Part-time Year Total Full-time Part-time
1965 9,110 8,269 841 1985 40,858 25,667 15,191 2005 82,499 41,435 41,064
1966 12,419 11,541 878 1986 42,290 26,195 16,095 2006 84,961 41,759 43,202
1967 15,411 13,667 1,744 1987 44,703 26,571 18,132 2007 87,072 42,307 44,765
1968 16,906 15,373 1,533 1988 46,336 27,192 19,144 2008 88,104 43,209 44,895
1969 18,427 16,831 1,596 1989 49,351 28,614 20,737 2009 100,736 50,683 50,053
1970 20,409 18,188 2,221 1990 51,428 29,102 22,326 2010 106,597 53,883 52,714
1971 20,844 18,309 2,535 1991 54,160 30,095 24,065 2011 105,975 51,107 54,868
1972 23,590 19,984 3,606 1992 58,192 32,715 25,477 2012 100,519 46,355 54,164
1973 25,452 20,952 4,500 1993 58,173 31,711 26,462 2013 94,234 42,186 52,048
1974 26,992 20,770 6,222 1994 58,514 31,297 27,217 2014 93,772 38,005 55,767
1975 32,792 24,324 8,468 1995 59,111 31,417 27,694 2015
1976 32,364 23,762 8,602 1996 61,642 32,602 29,040 2016
1977 32,477 22,888 9,589 1997 60,620 32,889 27,731 2017
1978 32,860 22,337 10,523 1998 61,479 33,048 28,431 2018
1979 34,051 22,610 11,441 1999 63,809 33,283 30,526 2019
1980 37,869 24,972 12,897 2000 65,473 34,047 31,426 2020
1981 38,900 25,416 13,484 2001 68,790 35,857 32,933 2021
1982 40,432 26,551 13,881 2002 73,947 38,660 35,287 2022
1983 41,820 26,957 14,863 2003 78,281 41,028 37,253 2023
1984 40,953 25,999 14,954 2004 81,803 41,778 40,025 2024
Tables, Section 2 | 2

Table 2-2: Enrollment Summary, Latest 5 Years
College 2010 2011 2012 2013 2014
Northeast 5,136 5,053 5,025 5,201 4,934
North Iowa Area 3,744 3,557 3,278 3,207 2,950
Iowa Lakes 3,474 3,258 3,041 2,650 2,391
Northwest Iowa 1,648 1,544 1,605 1,607 1,576
Iowa Central 6,204 6,298 6,216 5,697 5,686
Iowa Valley 3,154 3,054 3,117 3,141 2,987
Hawkeye 6,664 6,238 5,963 5,802 5,291
Eastern Iowa 9,365 9,839 8,474 8,694 8,143
Kirkwood 18,456 17,610 16,661 15,345 14,268
Des Moines Area 24,658 25,425 23,685 20,167 23,526
Western Iowa Tech 6,421 6,787 6,424 6,330 6,398
Iowa Western 6,799 7,176 7,367 6,991 6,623
Southwestern 1,753 1,762 1,666 1,573 1,600
Indian Hills 5,520 5,033 4,885 4,604 4,412
Southeastern 3,601 3,341 3,112 3,225 2,987
Total 106,597 105,975 100,519 94,234 93,772
Table 2-3: Summary of Credit Hours, Latest 5 Years
College 2010 2011 2012 2013 2014
Northeast 50,181 47,116 45,644 44,382 41,323
North Iowa Area 37,732 36,161 32,800 31,282 28,546
Iowa Lakes 38,988 34,920 31,940 27,586 24,519
Northwest Iowa 16,240 15,290 15,161 14,551 13,887
Iowa Central 64,119 65,466 64,287 58,038 58,303
Iowa Valley 34,888 32,733 33,575 32,104 30,258
Hawkeye 68,928 65,302 61,214 58,713 52,961
Eastern Iowa 85,275 87,325 73,161 71,887 65,438
Kirkwood 184,662 174,911 160,560 146,892 122,766
Des Moines Area 211,828 217,840 200,689 177,957 190,915
Western Iowa Tech 60,649 62,525 57,528 55,509 55,985
Iowa Western 73,313 75,930 76,351 72,170 69,220
Southwestern 17,798 17,710 16,419 15,304 15,855
Indian Hills 43,949 38,957 37,898 34,624 33,331
Southeastern 37,586 33,915 31,232 31,747 28,927
Total 1,026,136 1,006,101 938,456 872,744 832,233
Tables, Section 2 | 3

Table 2-4: Credit Hours Per Student, Latest 5 Years
College 2010 2011 2012 2013 2014
Northeast 9.77 9.32 9.08 8.53 8.38
North Iowa Area 10.08 10.17 10.01 9.75 9.68
Iowa Lakes 11.22 10.72 10.50 10.41 10.25
Northwest Iowa 9.85 9.90 9.45 9.05 8.81
Iowa Central 10.34 10.39 10.34 10.19 10.25
Iowa Valley 11.06 10.72 10.77 10.22 10.13
Hawkeye 10.34 10.47 10.27 10.12 10.01
Eastern Iowa 9.11 8.88 8.63 8.27 8.04
Kirkwood 10.01 9.93 9.64 9.57 8.60
Des Moines Area 8.59 8.57 8.47 8.82 8.12
Western Iowa Tech 9.45 9.21 8.96 8.77 8.75
Iowa Western 10.78 10.58 10.36 10.32 10.45
Southwestern 10.15 10.05 9.86 9.73 9.91
Indian Hills 7.96 7.74 7.76 7.52 7.55
Southeastern 10.44 10.15 10.04 9.84 9.68
Total 9.63 9.49 9.34 9.26 8.88
Tables, Section 2 | 4
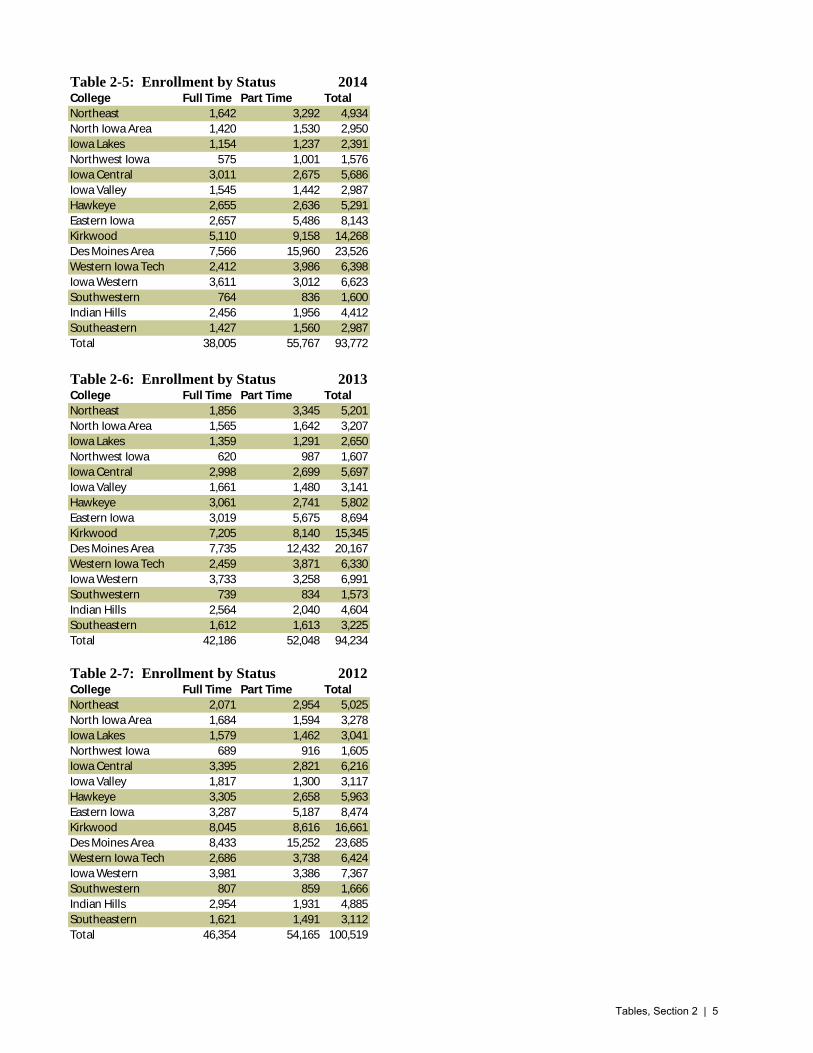
Table 2-5: Enrollment by Status 2014College Full Time Part Time Total
Northeast 1,642 3,292 4,934
North Iowa Area 1,420 1,530 2,950
Iowa Lakes 1,154 1,237 2,391
Northwest Iowa 575 1,001 1,576
Iowa Central 3,011 2,675 5,686
Iowa Valley 1,545 1,442 2,987
Hawkeye 2,655 2,636 5,291
Eastern Iowa 2,657 5,486 8,143
Kirkwood 5,110 9,158 14,268
Des Moines Area 7,566 15,960 23,526
Western Iowa Tech 2,412 3,986 6,398
Iowa Western 3,611 3,012 6,623
Southwestern 764 836 1,600
Indian Hills 2,456 1,956 4,412
Southeastern 1,427 1,560 2,987
Total 38,005 55,767 93,772
Table 2-6: Enrollment by Status 2013College Full Time Part Time Total
Northeast 1,856 3,345 5,201
North Iowa Area 1,565 1,642 3,207
Iowa Lakes 1,359 1,291 2,650
Northwest Iowa 620 987 1,607
Iowa Central 2,998 2,699 5,697
Iowa Valley 1,661 1,480 3,141
Hawkeye 3,061 2,741 5,802
Eastern Iowa 3,019 5,675 8,694
Kirkwood 7,205 8,140 15,345
Des Moines Area 7,735 12,432 20,167
Western Iowa Tech 2,459 3,871 6,330
Iowa Western 3,733 3,258 6,991
Southwestern 739 834 1,573
Indian Hills 2,564 2,040 4,604
Southeastern 1,612 1,613 3,225
Total 42,186 52,048 94,234
Table 2-7: Enrollment by Status 2012College Full Time Part Time Total
Northeast 2,071 2,954 5,025
North Iowa Area 1,684 1,594 3,278
Iowa Lakes 1,579 1,462 3,041
Northwest Iowa 689 916 1,605
Iowa Central 3,395 2,821 6,216
Iowa Valley 1,817 1,300 3,117
Hawkeye 3,305 2,658 5,963
Eastern Iowa 3,287 5,187 8,474
Kirkwood 8,045 8,616 16,661
Des Moines Area 8,433 15,252 23,685
Western Iowa Tech 2,686 3,738 6,424
Iowa Western 3,981 3,386 7,367
Southwestern 807 859 1,666
Indian Hills 2,954 1,931 4,885
Southeastern 1,621 1,491 3,112
Total 46,354 54,165 100,519
Tables, Section 2 | 5

Table 2-8: Enrollment by Status 2011College Full Time Part Time Total
Northeast 2,195 2,858 5,053
North Iowa Area 1,903 1,654 3,557
Iowa Lakes 1,770 1,488 3,258
Northwest Iowa 727 817 1,544
Iowa Central 3,492 2,806 6,298
Iowa Valley 1,795 1,259 3,054
Hawkeye 3,551 2,687 6,238
Eastern Iowa 4,125 5,714 9,839
Kirkwood 9,129 8,481 17,610
Des Moines Area 9,508 15,917 25,425
Western Iowa Tech 3,083 3,704 6,787
Iowa Western 4,071 3,105 7,176
Southwestern 876 886 1,762
Indian Hills 3,085 1,948 5,033
Southeastern 1,797 1,544 3,341
Total 51,107 54,868 105,975
Table 2-9: Enrollment by Status 2010College Full Time Part Time Total
Northeast 2,511 2,625 5,136
North Iowa Area 2,028 1,716 3,744
Iowa Lakes 2,042 1,432 3,474
Northwest Iowa 742 906 1,648
Iowa Central 3,401 2,803 6,204
Iowa Valley 1,947 1,207 3,154
Hawkeye 3,787 2,877 6,664
Eastern Iowa 4,210 5,155 9,365
Kirkwood 10,011 8,445 18,456
Des Moines Area 9,629 15,029 24,658
Western Iowa Tech 3,041 3,380 6,421
Iowa Western 3,982 2,817 6,799
Southwestern 903 850 1,753
Indian Hills 3,557 1,963 5,520
Southeastern 2,092 1,509 3,601
Total 53,883 52,714 106,597
Tables, Section 2 | 6

Table 2-10: Enrollment by Program 2014College College Parallel Career Option CTE Combination Total
Northeast 3,208 0 1,726 0 4,934
North Iowa Area 2,298 8 644 0 2,950
Iowa Lakes 1,325 204 837 25 2,391
Northwest Iowa 1,011 27 538 0 1,576
Iowa Central 4,184 238 1,264 0 5,686
Iowa Valley 2,368 34 585 0 2,987
Hawkeye 3,521 0 1,769 1 5,291
Eastern Iowa 4,856 0 3,286 1 8,143
Kirkwood 9,035 41 5,192 0 14,268
Des Moines Area 17,973 1,734 3,819 0 23,526
Western Iowa Tech 4,089 0 2,309 0 6,398
Iowa Western 4,451 0 2,172 0 6,623
Southwestern 1,096 0 504 0 1,600
Indian Hills 1,700 3 2,709 0 4,412
Southeastern 2,242 79 666 0 2,987
Total 63,357 2,368 28,020 27 93,772
Table 2-11: Enrollment by Program 2013College College Parallel Career Option CTE Combination Total
Northeast 3,280 0 1,921 0 5,201
North Iowa Area 2,371 95 679 62 3,207
Iowa Lakes 1,193 546 888 23 2,650
Northwest Iowa 988 51 568 0 1,607
Iowa Central 4,211 299 1,186 1 5,697
Iowa Valley 2,558 147 436 0 3,141
Hawkeye 3,847 0 1,955 0 5,802
Eastern Iowa 5,310 0 3,382 2 8,694
Kirkwood 9,619 134 5,591 1 15,345
Des Moines Area 14,553 1,907 3,707 0 20,167
Western Iowa Tech 4,062 1 2,267 0 6,330
Iowa Western 4,634 0 2,357 0 6,991
Southwestern 1,050 7 516 0 1,573
Indian Hills 1,845 0 2,759 0 4,604
Southeastern 2,345 216 664 0 3,225
Total 61,866 3,403 28,876 89 94,234
Table 2-12: Enrollment by Program 2012College College Parallel Career Option CTE Combination Total
Northeast 2,992 0 2,033 0 5,025
North Iowa Area 2,273 275 728 2 3,278
Iowa Lakes 1,415 553 1,009 64 3,041
Northwest Iowa 962 55 588 0 1,605
Iowa Central 4,456 300 1,459 1 6,216
Iowa Valley 2,514 160 443 0 3,117
Hawkeye 3,930 0 2,033 0 5,963
Eastern Iowa 5,237 0 3,231 6 8,474
Kirkwood 10,003 503 6,155 0 16,661
Des Moines Area 17,579 2,365 3,741 0 23,685
Western Iowa Tech 3,990 2 2,432 0 6,424
Iowa Western 4,963 0 2,404 0 7,367
Southwestern 1,159 70 437 0 1,666
Indian Hills 2,123 10 2,752 0 4,885
Southeastern 2,168 254 690 0 3,112
Total 65,764 4,547 30,135 73 100,519
Tables, Section 2 | 7

Table 2-13: Enrollment by Program 2011College College Parallel Career Option CTE Combination Total
Northeast 2,948 0 2,105 0 5,053
North Iowa Area 2,269 497 790 1 3,557
Iowa Lakes 1,476 620 1,147 15 3,258
Northwest Iowa 820 64 658 2 1,544
Iowa Central 4,345 321 1,624 3 6,293
Iowa Valley 2,472 154 428 0 3,054
Hawkeye 4,067 0 2,170 1 6,238
Eastern Iowa 6,119 8 3,709 3 9,839
Kirkwood 10,280 544 6,784 2 17,610
Des Moines Area 18,609 2,843 3,973 0 25,425
Western Iowa Tech 3,937 36 2,814 0 6,787
Iowa Western 4,888 0 2,288 0 7,176
Southwestern 1,196 135 431 0 1,762
Indian Hills 2,158 12 2,862 1 5,033
Southeastern 2,366 205 770 0 3,341
Total 67,950 5,439 32,553 28 105,970
Table 2-14: Enrollment by Program 2010College College Parallel Career Option CTE Combination Total
Northeast 2,815 0 2,321 0 5,136
North Iowa Area 2,207 709 826 2 3,744
Iowa Lakes 1,440 725 1,280 29 3,474
Northwest Iowa 946 68 633 1 1,648
Iowa Central 4,333 328 1,542 1 6,204
Iowa Valley 2,537 159 458 0 3,154
Hawkeye 3,797 0 2,867 0 6,664
Eastern Iowa 5,707 10 3,647 1 9,365
Kirkwood 10,942 540 6,974 0 18,456
Des Moines Area 18,139 2,199 3,758 562 24,658
Western Iowa Tech 3,594 44 2,783 0 6,421
Iowa Western 4,624 1 2,174 0 6,799
Southwestern 1,129 136 459 29 1,753
Indian Hills 2,436 13 3,066 5 5,520
Southeastern 2,438 267 896 0 3,601
Total 67,084 5,199 33,684 630 106,597
Tables, Section 2 | 8

Tables, Fiscal Year Credit Enrollment and Demographics 3
Table of Contents
3-1. Unduplicated Credit Enrollment, Latest Five Years...............................................................................2
3-2. Credit Hours, Latest Five Years..............................................................................................................2
3-3--3-7. Enrollment by Type of Program, Latest Five Years.....................................................................3-5
3-8--3-12. Program Enrollment by Federal Career Clusters, Latest Five Years.......................................6-10
3-13--3-17. Race and Ethnicity of Credit Enrollment Students, Latest Five Years................................11-13
3-18--3-22. Age of Credit Enrollment Students, Latest Five Years........................................................14-16
3-23. Gender of Credit Enrollment Students, Latest Five Years..................................................................17
3-24--3-28. Residency of Credit Enrollment Students, Latest Five Years.............................................18-20
3-29--3.31. Enrollment in Developmental Education, Latest Three Years.............................................21-22
3-32--3-34. Race and Ethnicity of Developmental Education Students, Latest Three Years.................23-24
3-35--3-37. Developmental Courses, Latest Three Years.......................................................................25-27
3-38--3-40. Age of Developmental Education Students, Latest Three Years.........................................28-29
Tables, Section 3 | 1

2012
College 2010 2011 2012 2013 2014 Average Change
Northeast 7,741 7,490 7,236 7,174 7,153 -2.0
North Iowa Area 5,201 4,994 4,655 4,247 4,014 -6.3
Iowa Lakes 4,774 4,784 4,474 4,197 3,790 -5.6
Northwest 2,486 2,534 2,452 2,598 2,631 1.4
Iowa Central 8,657 9,159 8,813 8,733 7,669 -3.0
Iowa Valley 4,460 4,363 4,279 4,232 4,320 -0.8
Hawkeye 9,464 9,791 9,525 9,132 9,144 -0.9
Eastern Iowa 13,452 14,423 14,504 13,200 13,591 0.3
Kirkwood 25,658 26,222 25,069 23,422 21,916 -3.9
Des Moines Area 35,483 38,099 38,624 36,365 36,877 1.0
Western Iowa Tech 8,196 8,802 8,747 8,541 8,539 1.0
Iowa Western 8,097 9,034 9,725 9,971 9,586 4.3
Southwestern 2,211 2,335 2,286 2,151 1,957 -3.0
Indian Hills 8,065 8,106 7,440 6,946 5,999 -7.1
Southeastern 5,230 5,004 4,640 4,479 4,040 -6.3
Total 149,175 155,140 152,469 145,388 141,226 -1.4
College 2010 2011 2012 2013 2014 Average Change
Northeast 118,145 112,594 103,918 100,946 94,916 -5.3
North Iowa Area 80,476 78,489 74,101 67,050 61,692 -6.4
Iowa Lakes 84,096 85,787 76,037 69,316 61,140 -7.7
Northwest 35,260 35,842 34,342 35,219 33,945 -0.9
Iowa Central 135,545 145,112 143,253 140,453 122,709 -2.5
Iowa Valley 73,990 74,486 69,329 69,889 66,073 -2.8
Hawkeye 141,643 145,035 137,166 130,158 124,428 -3.2
Eastern Iowa 182,627 192,596 188,135 165,197 159,874 -3.3
Kirkwood 397,813 406,155 380,671 345,555 311,999 -5.9
Des Moines Area 478,186 499,585 490,370 460,097 458,089 -1.1
Western Iowa Tech 111,094 124,995 112,011 106,334 111,033 0.0
Iowa Western 139,617 154,220 161,186 160,324 150,945 2.0
Southwestern 36,586 39,082 36,911 34,470 31,315 -3.8
Indian Hills 135,617 139,839 126,174 121,030 94,010 -8.8
Southeastern 86,246 80,883 70,704 67,522 60,656 -8.4
Total 2,236,939 2,314,697 2,204,306 2,073,559 1,942,822 -3.5
3-2. LATEST FIVE FISCAL YEARS CREDIT HOURS
3-1. LATEST FIVE FISCAL YEARS UNDUPLICATED CREDIT ENROLLMENT
Tables, Section 3 | 2
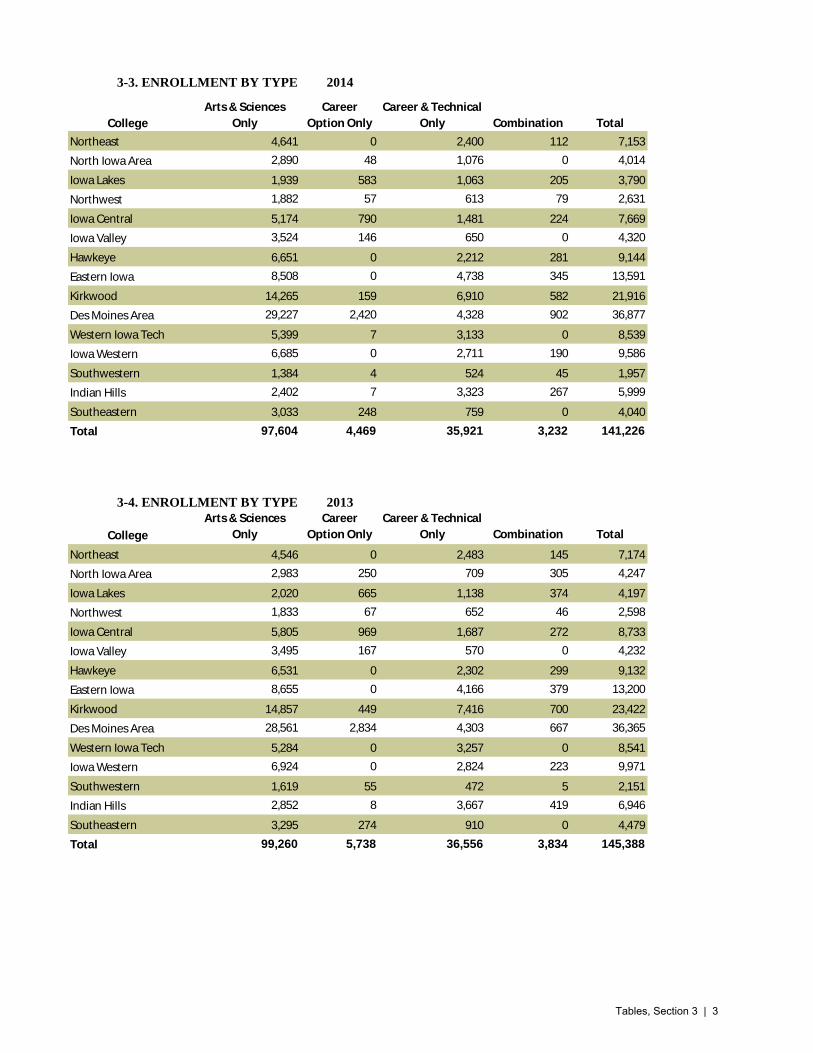
3-3. ENROLLMENT BY TYPE 2014
College
Arts & Sciences
Only
Career
Option Only
Career & Technical
Only Combination Total
Northeast 4,641 0 2,400 112 7,153
North Iowa Area 2,890 48 1,076 0 4,014
Iowa Lakes 1,939 583 1,063 205 3,790
Northwest 1,882 57 613 79 2,631
Iowa Central 5,174 790 1,481 224 7,669
Iowa Valley 3,524 146 650 0 4,320
Hawkeye 6,651 0 2,212 281 9,144
Eastern Iowa 8,508 0 4,738 345 13,591
Kirkwood 14,265 159 6,910 582 21,916
Des Moines Area 29,227 2,420 4,328 902 36,877
Western Iowa Tech 5,399 7 3,133 0 8,539
Iowa Western 6,685 0 2,711 190 9,586
Southwestern 1,384 4 524 45 1,957
Indian Hills 2,402 7 3,323 267 5,999
Southeastern 3,033 248 759 0 4,040
Total 97,604 4,469 35,921 3,232 141,226
3-4. ENROLLMENT BY TYPE 2013
College
Arts & Sciences
Only
Career
Option Only
Career & Technical
Only Combination Total
Northeast 4,546 0 2,483 145 7,174
North Iowa Area 2,983 250 709 305 4,247
Iowa Lakes 2,020 665 1,138 374 4,197
Northwest 1,833 67 652 46 2,598
Iowa Central 5,805 969 1,687 272 8,733
Iowa Valley 3,495 167 570 0 4,232
Hawkeye 6,531 0 2,302 299 9,132
Eastern Iowa 8,655 0 4,166 379 13,200
Kirkwood 14,857 449 7,416 700 23,422
Des Moines Area 28,561 2,834 4,303 667 36,365
Western Iowa Tech 5,284 0 3,257 0 8,541
Iowa Western 6,924 0 2,824 223 9,971
Southwestern 1,619 55 472 5 2,151
Indian Hills 2,852 8 3,667 419 6,946
Southeastern 3,295 274 910 0 4,479
Total 99,260 5,738 36,556 3,834 145,388
Tables, Section 3 | 3

3-5. ENROLLMENT BY TYPE 2012
College
Arts & Sciences
Only
Career
Option Only
Career & Technical
Only Combination Total
Northeast 4,471 0 2,621 144 7,236
North Iowa Area 3,005 419 774 457 4,655
Iowa Lakes 2,142 733 1,311 288 4,474
Northwest 1,632 73 697 50 2,452
Iowa Central 5,867 825 1,842 279 8,813
Iowa Valley 3,539 197 543 0 4,279
Hawkeye 6,830 0 2,360 335 9,525
Eastern Iowa 9,262 0 4,709 533 14,504
Kirkwood 15,432 652 8,144 841 25,069
Des Moines Area 29,778 3,601 4,446 799 38,624
Western Iowa Tech 5,174 0 3,573 0 8,747
Iowa Western 6,783 0 2,743 199 9,725
Southwestern 1,646 142 431 67 2,286
Indian Hills 3,188 13 3,708 531 7,440
Southeastern 3,399 249 992 0 4,640
Total 102,148 6,904 38,894 4,523 152,469
3-6. ENROLLMENT BY TYPE 2011
College
Arts & Sciences
Only
Career
Option Only
Career & Technical
Only Combination Total
Northeast 4,405 0 2,916 169 7,490
North Iowa Area 3,081 633 806 474 4,994
Iowa Lakes 2,180 823 1,488 293 4,784
Northwest 1,706 73 699 56 2,534
Iowa Central 6,022 928 1,892 317 9,159
Iowa Valley 3,559 193 611 0 4,363
Hawkeye 5,779 0 3,740 272 9,791
Eastern Iowa 9,249 14 4,740 420 14,423
Kirkwood 16,233 662 8,480 847 26,222
Des Moines Area 29,248 2,836 4,335 1,680 38,099
Western Iowa Tech 4,900 51 3,851 0 8,802
Iowa Western 6,254 1 2,550 229 9,034
Southwestern 1,659 148 449 79 2,335
Indian Hills 3,425 13 4,060 608 8,106
Southeastern 3,523 334 1,147 0 5,004
Total 101,223 6,709 41,764 5,444 155,140
Tables, Section 3 | 4

3-7. ENROLLMENT BY TYPE 2010
College
Arts & Sciences
Only
Career
Option Only
Career & Technical
Only Combination Total
Northeast 4,576 0 2,968 197 7,741
North Iowa Area 3,123 725 922 431 5,201
Iowa Lakes 2,211 885 1,413 265 4,774
Northwest 1,707 61 658 60 2,486
Iowa Central 5,577 800 1,984 296 8,657
Iowa Valley 3,571 231 658 0 4,460
Hawkeye 5,617 0 3,559 288 9,464
Eastern Iowa 8,573 5 4,470 404 13,452
Kirkwood 16,275 550 7,996 837 25,658
Des Moines Area 26,868 2,791 4,063 1,761 35,483
Western Iowa Tech 4,559 46 3,591 0 8,196
Iowa Western 5,656 4 2,222 215 8,097
Southwestern 1,561 148 403 99 2,211
Indian Hills 3,394 12 4,088 571 8,065
Southeastern 3,792 261 1,177 0 5,230
Total 97,060 6,519 40,172 5,424 149,175
Tables, Section 3 | 5

3-8. PROGRAM ENROLLMENT BASED ON FEDERAL CAREER CLUSTERS* 2014
No
rthe
ast
No
rth Io
wa A
rea
Iow
a Lakes
No
rthw
est
Iow
a Ce
ntral
Iow
a Valle
y
Haw
keye
Eastern
Iow
a
Kirkw
oo
d
De
s Mo
ine
s Are
a
We
stern
Iow
a Tech
Iow
a We
stern
Sou
thw
este
rn
Ind
ian H
ills
Sou
the
astern
To
tal*
Agriculture, Food and
Natural Resources 280 53 171 18 58 116 294 137 784 389 26 81 45 174 32 2,658
Architecture and
Construction 125 37 167 186 38 44 113 189 434 252 162 72 61 94 44 2,018
Arts, A/V Technology and
Communications 32 46 17 99 15 201 49 110 350 290 138 25 16 38 1,426
Business, Management and
Administration 205 92 229 73 117 74 140 724 835 820 412 68 81 103 174 4,147
Education and Training 22 40 132 66 81 341
Finance 118 40 115 33 95 17 61 133 281 364 150 76 27 114 31 1,655
Government and Public
Administration 0 0 0 0 0 0 0 0 0 0 0 0 0 0 0 0
Health Science 1,240 592 696 221 592 259 715 2,171 3,208 1,336 1,233 1,707 169 1,516 288 15,943
Hospitality and Tourism 10 70 94 1 302 333 277 16 90 85 1,278
Human Services 136 1 63 321 48 86 236 248 1,180 132 54 47 28 2,580
Information Technology 107 41 31 11 19 25 97 293 661 562 52 135 53 311 46 2,444
Law, Public Safety and
Security 5 21 95 264 57 163 25 133 730 221 113 136 1,963
Manufacturing 136 116 70 109 483 78 406 462 324 602 159 106 55 687 130 3,923
Marketing, Sales and Service 42 11 17 13 99 139 308 45 68 742Science, Technology,
Engineering and
Mathematics 5 1 2 37 31 13 36 1 31 27 35 2 221Transportation, Distribution
and Logistics 106 87 114 94 319 18 145 357 303 442 145 220 60 341 58 2,809
College Transfer (Parallel) 4,753 2,890 2,129 1,959 5,384 3,524 6,932 8,853 14,837 30,083 5,399 6,875 1,428 2,669 3,033 100,748
Total 7,290 4,014 4,015 2,721 7,920 4,320 9,452 13,984 22,666 37,828 8,539 9,798 2,004 6,305 4,040 144,896
*Totals may be greater than enrollment since students may be in one or more clusters. Definitions of Career Clusters can be obtained from http://www.careerclusters.org/.
Tables, Section 3 | 6

3-9. PROGRAM ENROLLMENT BASED ON FEDERAL CAREER CLUSTERS* 2013
No
rthe
ast
No
rth Io
wa A
rea
Iow
a Lakes
No
rthw
est
Iow
a Ce
ntral
Iow
a Valle
y
Haw
keye
Eastern
Iow
a
Kirkw
oo
d
De
s Mo
ine
s Are
a
We
stern
Iow
a Tech
Iow
a We
stern
Sou
thw
este
rn
Ind
ian H
ills
Sou
the
astern
To
tal*
Agriculture, Food and
Natural Resources 268 46 176 12 73 128 291 146 764 329 21 89 43 158 18 2,562
Architecture and
Construction 138 38 194 212 45 38 80 137 450 225 175 127 57 115 51 2,082
Arts, A/V Technology and
Communications 55 1 75 23 96 16 195 62 191 337 286 130 27 15 54 1,563
Business, Management and
Administration 367 186 372 133 288 67 241 655 1,384 1,328 493 182 93 175 216 6,180
Education and Training 20 34 4 129 20 83 290
Finance 13 46 10 69
Government and Public
Administration 0 0 0 0 0 0 0 0 0 0 0 0 0 0 0 0
Health Science 1,311 563 826 240 749 274 759 2,207 3,646 1,226 1,464 1,786 171 1,939 439 17,600
Hospitality and Tourism 17 74 115 193 404 273 102 112 1,290
Human Services 136 6 83 409 44 94 169 120 1,263 148 70 51 29 2,622
Information Technology 129 64 37 14 26 26 92 299 713 564 46 133 52 368 44 2,607
Law, Public Safety and
Security 13 130 87 291 59 190 18 195 923 244 125 140 2,415
Manufacturing 98 86 82 74 546 64 386 353 373 500 159 74 35 659 137 3,626
Marketing, Sales and Service 40 17 16 4 118 165 337 41 67 805Science, Technology,
Engineering and
Mathematics 3 24 2 48 6 21 65 22 22 31 1 245
Transportation, Distribution
and Logistics 99 71 179 63 290 11 190 290 219 435 128 208 55 377 55 2,670
College Transfer (Parallel) 4,691 3,278 2,383 1,876 6,062 3,495 6,830 9,034 15,497 29,198 5,284 7,147 1,624 3,271 3,295 102,965
Total 7,348 4,560 4,586 2,647 9,038 4,232 9,466 13,618 24,236 37,067 8,541 10,220 2,157 7,396 4,479 149,591
*Totals may be greater than enrollment since students may be in one or more clusters. Definitions of Career Clusters can be obtained from http://www.careerclusters.org/.
Tables, Section 3 | 7
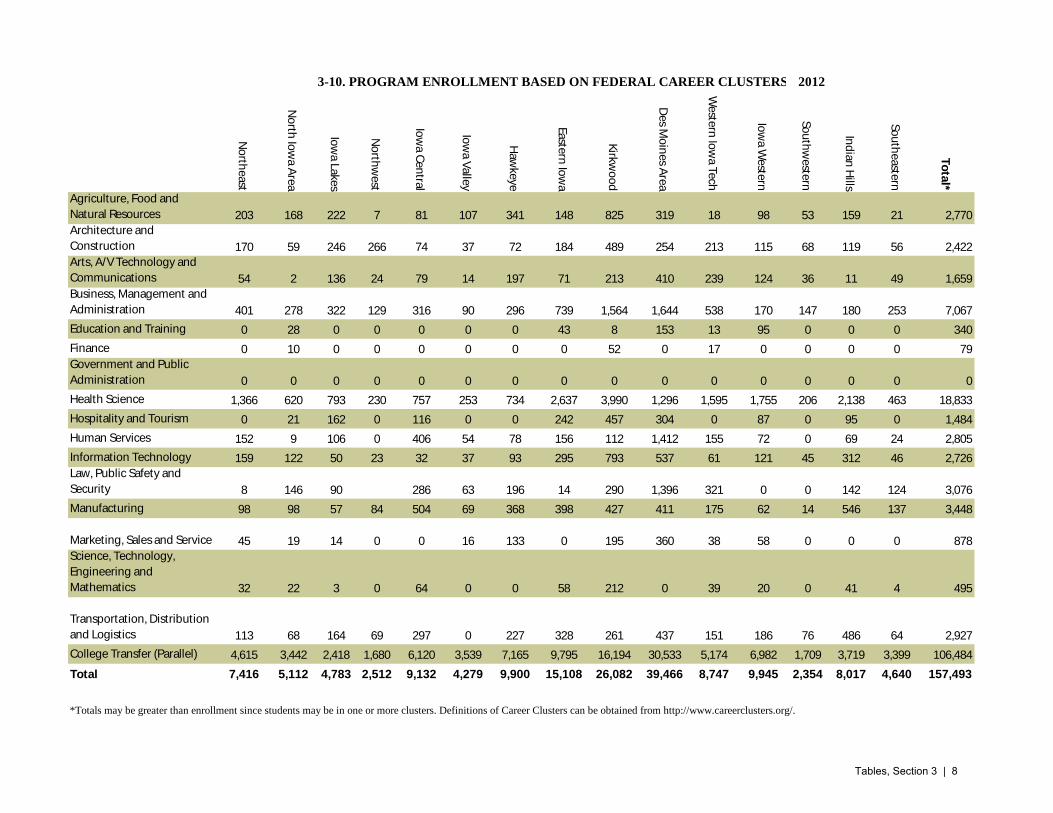
3-10. PROGRAM ENROLLMENT BASED ON FEDERAL CAREER CLUSTERS* 2012
No
rthe
ast
No
rth Io
wa A
rea
Iow
a Lakes
No
rthw
est
Iow
a Ce
ntral
Iow
a Valle
y
Haw
keye
Eastern
Iow
a
Kirkw
oo
d
De
s Mo
ine
s Are
a
We
stern
Iow
a Tech
Iow
a We
stern
Sou
thw
este
rn
Ind
ian H
ills
Sou
the
astern
To
tal*
Agriculture, Food and
Natural Resources 203 168 222 7 81 107 341 148 825 319 18 98 53 159 21 2,770
Architecture and
Construction 170 59 246 266 74 37 72 184 489 254 213 115 68 119 56 2,422
Arts, A/V Technology and
Communications 54 2 136 24 79 14 197 71 213 410 239 124 36 11 49 1,659
Business, Management and
Administration 401 278 322 129 316 90 296 739 1,564 1,644 538 170 147 180 253 7,067
Education and Training 0 28 0 0 0 0 0 43 8 153 13 95 0 0 0 340
Finance 0 10 0 0 0 0 0 0 52 0 17 0 0 0 0 79
Government and Public
Administration 0 0 0 0 0 0 0 0 0 0 0 0 0 0 0 0
Health Science 1,366 620 793 230 757 253 734 2,637 3,990 1,296 1,595 1,755 206 2,138 463 18,833
Hospitality and Tourism 0 21 162 0 116 0 0 242 457 304 0 87 0 95 0 1,484
Human Services 152 9 106 0 406 54 78 156 112 1,412 155 72 0 69 24 2,805
Information Technology 159 122 50 23 32 37 93 295 793 537 61 121 45 312 46 2,726
Law, Public Safety and
Security 8 146 90 286 63 196 14 290 1,396 321 0 0 142 124 3,076
Manufacturing 98 98 57 84 504 69 368 398 427 411 175 62 14 546 137 3,448
Marketing, Sales and Service 45 19 14 0 0 16 133 0 195 360 38 58 0 0 0 878Science, Technology,
Engineering and
Mathematics 32 22 3 0 64 0 0 58 212 0 39 20 0 41 4 495
Transportation, Distribution
and Logistics 113 68 164 69 297 0 227 328 261 437 151 186 76 486 64 2,927
College Transfer (Parallel) 4,615 3,442 2,418 1,680 6,120 3,539 7,165 9,795 16,194 30,533 5,174 6,982 1,709 3,719 3,399 106,484
Total 7,416 5,112 4,783 2,512 9,132 4,279 9,900 15,108 26,082 39,466 8,747 9,945 2,354 8,017 4,640 157,493
*Totals may be greater than enrollment since students may be in one or more clusters. Definitions of Career Clusters can be obtained from http://www.careerclusters.org/.
Tables, Section 3 | 8
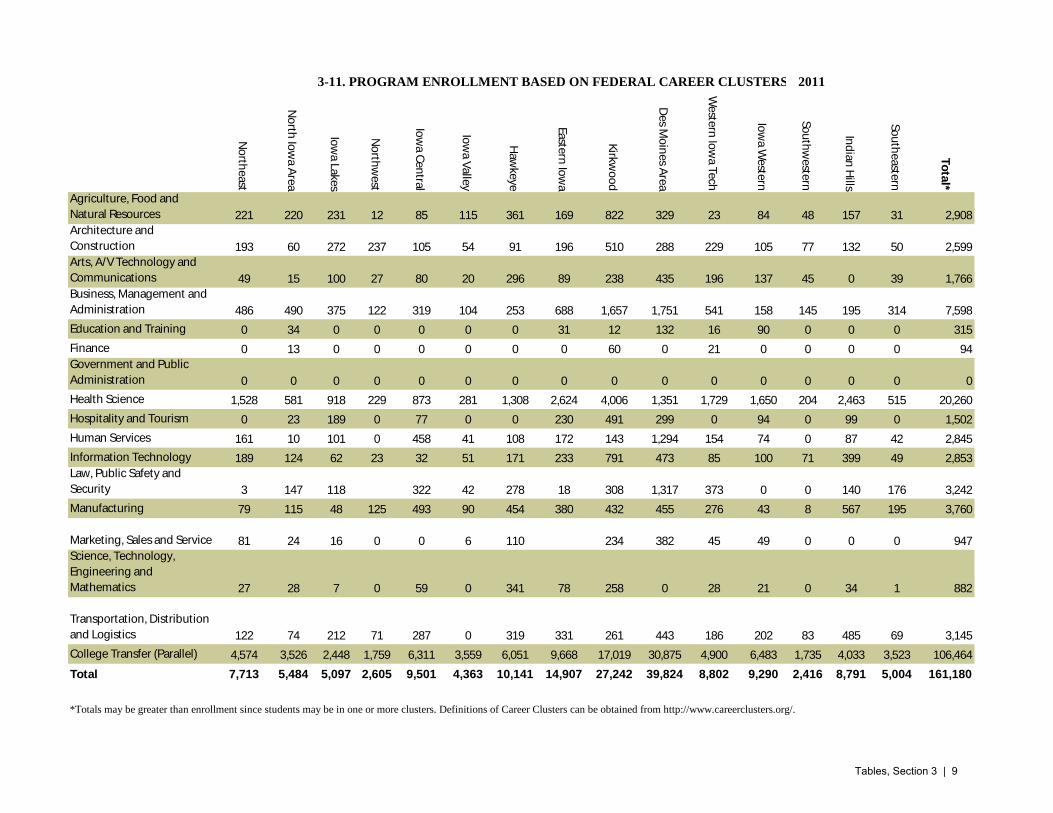
3-11. PROGRAM ENROLLMENT BASED ON FEDERAL CAREER CLUSTERS* 2011
No
rthe
ast
No
rth Io
wa A
rea
Iow
a Lakes
No
rthw
est
Iow
a Ce
ntral
Iow
a Valle
y
Haw
keye
Eastern
Iow
a
Kirkw
oo
d
De
s Mo
ine
s Are
a
We
stern
Iow
a Tech
Iow
a We
stern
Sou
thw
este
rn
Ind
ian H
ills
Sou
the
astern
To
tal*
Agriculture, Food and
Natural Resources 221 220 231 12 85 115 361 169 822 329 23 84 48 157 31 2,908
Architecture and
Construction 193 60 272 237 105 54 91 196 510 288 229 105 77 132 50 2,599
Arts, A/V Technology and
Communications 49 15 100 27 80 20 296 89 238 435 196 137 45 0 39 1,766
Business, Management and
Administration 486 490 375 122 319 104 253 688 1,657 1,751 541 158 145 195 314 7,598
Education and Training 0 34 0 0 0 0 0 31 12 132 16 90 0 0 0 315
Finance 0 13 0 0 0 0 0 0 60 0 21 0 0 0 0 94
Government and Public
Administration 0 0 0 0 0 0 0 0 0 0 0 0 0 0 0 0
Health Science 1,528 581 918 229 873 281 1,308 2,624 4,006 1,351 1,729 1,650 204 2,463 515 20,260
Hospitality and Tourism 0 23 189 0 77 0 0 230 491 299 0 94 0 99 0 1,502
Human Services 161 10 101 0 458 41 108 172 143 1,294 154 74 0 87 42 2,845
Information Technology 189 124 62 23 32 51 171 233 791 473 85 100 71 399 49 2,853
Law, Public Safety and
Security 3 147 118 322 42 278 18 308 1,317 373 0 0 140 176 3,242
Manufacturing 79 115 48 125 493 90 454 380 432 455 276 43 8 567 195 3,760
Marketing, Sales and Service 81 24 16 0 0 6 110 234 382 45 49 0 0 0 947Science, Technology,
Engineering and
Mathematics 27 28 7 0 59 0 341 78 258 0 28 21 0 34 1 882
Transportation, Distribution
and Logistics 122 74 212 71 287 0 319 331 261 443 186 202 83 485 69 3,145
College Transfer (Parallel) 4,574 3,526 2,448 1,759 6,311 3,559 6,051 9,668 17,019 30,875 4,900 6,483 1,735 4,033 3,523 106,464
Total 7,713 5,484 5,097 2,605 9,501 4,363 10,141 14,907 27,242 39,824 8,802 9,290 2,416 8,791 5,004 161,180
*Totals may be greater than enrollment since students may be in one or more clusters. Definitions of Career Clusters can be obtained from http://www.careerclusters.org/.
Tables, Section 3 | 9

3-12. PROGRAM ENROLLMENT BASED ON FEDERAL CAREER CLUSTERS* 2010
No
rthe
ast
No
rth Io
wa A
rea
Iow
a Lakes
No
rthw
est
Iow
a Ce
ntral
Iow
a Valle
y
Haw
keye
Eastern
Iow
a
Kirkw
oo
d
De
s Mo
ine
s Are
a
We
stern
Iow
a Tech
Iow
a We
stern
Sou
thw
este
rn
Ind
ian H
ills
Sou
the
astern
To
tal*
Agriculture, Food and
Natural Resources 226 193 233 14 78 93 296 135 822 337 20 85 43 74 34 2,683
Architecture and
Construction 227 88 234 236 84 77 101 189 494 357 257 73 89 120 56 2,682
Arts, A/V Technology and
Communications 67 25 108 20 94 19 287 79 254 382 181 120 33 42 1,711
Business, Management and
Administration 557 525 398 100 379 122 212 609 1,152 1,883 520 155 158 192 278 7,240
Education and Training 0 42 0 0 0 0 0 35 18 139 9 67 0 0 0 310
Finance 0 10 0 0 0 0 0 0 84 0 23 0 0 0 0 117
Government and Public
Administration 0 0 0 0 0 0 0 0 0 0 0 0 0 0 0 0
Health Science 1,555 686 949 203 903 324 1,310 2,431 3,673 1,260 1,663 1,457 201 2,437 525 19,577
Hospitality and Tourism 0 27 101 0 73 0 0 158 471 257 0 73 0 89 0 1,249
Human Services 151 9 105 0 366 62 114 171 137 1,168 137 59 0 87 47 2,613
Information Technology 167 122 62 25 41 50 165 211 803 438 107 87 73 472 45 2,868
Law, Public Safety and
Security 6 148 135 0 323 41 255 23 274 1,218 351 0 0 135 121 3,030
Manufacturing 70 125 57 124 437 91 448 372 417 383 158 56 0 652 223 3,613
Marketing, Sales and Service 82 20 16 0 0 10 101 0 547 493 49 58 0 0 0 1,376Science, Technology,
Engineering and
Mathematics 22 34 13 0 71 0 308 221 219 0 17 16 0 34 1 956
Transportation, Distribution
and Logistics 114 75 192 69 276 0 297 303 260 400 145 156 58 458 66 2,869
College Transfer (Parallel) 4,773 3,525 2,454 1,765 5,843 3,571 5,905 8,977 17,059 28,586 4,559 5,871 1,658 3,962 3,792 102,300
Total 8,017 5,654 5,057 2,556 8,968 4,460 9,799 13,914 26,684 37,301 8,196 8,333 2,313 8,712 5,230 155,194
*Totals may be greater than enrollment since students may be in one or more clusters. Definitions of Career Clusters can be obtained from http://www.careerclusters.org/.
Tables, Section 3 | 10

3-13. RACE AND ETHNICITY OF CREDIT ENROLLMENT STUDENTS 2014
College
American
Indian Asian Black Hispanic
Hawaiian/
Pacific
Islander White
Two or
more
races
No
Response Total
Northeast 17 34 190 110 6 6,575 32 189 7,153
North Iowa Area 9 60 165 189 1 3,543 42 5 4,014
Iowa Lakes 21 120 166 146 13 3,230 13 81 3,790
Northwest 20 40 16 101 1 2,297 34 122 2,631
Iowa Central 39 113 935 492 13 5,496 75 506 7,669
Iowa Valley 63 215 259 420 5 2,855 0 503 4,320
Hawkeye 33 207 786 282 8 7,687 141 0 9,144
Eastern Iowa 66 295 975 1,155 25 9,991 366 718 13,591
Kirkwood 92 933 1,739 816 22 15,662 449 2,203 21,916
Des Moines Area 141 1,294 2,455 2,274 35 28,288 894 1,496 36,877
Western Iowa Tech 146 218 252 1,080 15 6,151 125 552 8,539
Iowa Western 151 251 840 608 21 7,291 22 402 9,586
Southwestern 5 20 40 80 4 1,759 34 15 1,957
Indian Hills 24 55 261 228 5 4,911 75 440 5,999
Southeastern 35 68 161 182 5 3,363 132 94 4,040
Total 862 3,923 9,240 8,163 179 109,099 2,434 7,326 141,226
3-14. RACE AND ETHNICITY OF CREDIT ENROLLMENT STUDENTS 2013
College
American
Indian Asian Black Hispanic
Hawaiian/
Pacific
Islander White
Two or
more
races
No
Response Total
Northeast 20 35 190 127 10 6,532 38 222 7,174
North Iowa Area 10 51 169 195 3 3,742 43 34 4,247
Iowa Lakes 20 136 149 157 0 3,602 13 120 4,197
Northwest 17 26 10 83 0 2,308 24 130 2,598
Iowa Central 27 112 969 515 19 6,572 78 441 8,733
Iowa Valley 75 202 262 344 3 2,800 34 512 4,232
Hawkeye 31 174 792 261 10 7,730 133 1 9,132
Eastern Iowa 97 313 1,033 1,074 32 9,762 233 656 13,200
Kirkwood 116 970 1,936 800 27 17,040 420 2,113 23,422
Des Moines Area 151 1,177 2,530 2,078 26 27,804 842 1,757 36,365
Western Iowa Tech 141 173 206 839 11 5,842 121 1,208 8,541
Iowa Western 144 247 826 586 21 7,916 20 211 9,971
Southwestern 7 20 39 78 1 1,961 41 4 2,151
Indian Hills 40 60 261 204 5 5,743 81 552 6,946
Southeastern 39 51 221 176 4 3,778 121 89 4,479
Total 935 3,747 9,593 7,517 172 113,132 2,242 8,050 145,388
Tables, Section 3 | 11
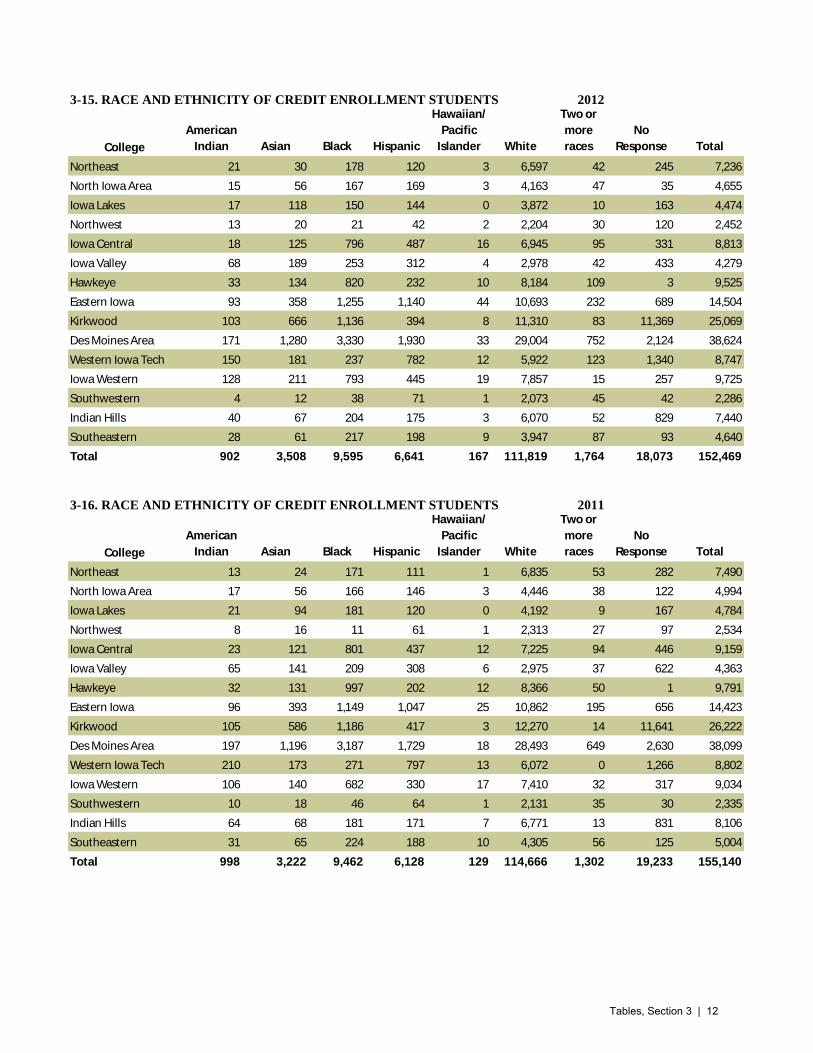
3-15. RACE AND ETHNICITY OF CREDIT ENROLLMENT STUDENTS 2012
College
American
Indian Asian Black Hispanic
Hawaiian/
Pacific
Islander White
Two or
more
races
No
Response Total
Northeast 21 30 178 120 3 6,597 42 245 7,236
North Iowa Area 15 56 167 169 3 4,163 47 35 4,655
Iowa Lakes 17 118 150 144 0 3,872 10 163 4,474
Northwest 13 20 21 42 2 2,204 30 120 2,452
Iowa Central 18 125 796 487 16 6,945 95 331 8,813
Iowa Valley 68 189 253 312 4 2,978 42 433 4,279
Hawkeye 33 134 820 232 10 8,184 109 3 9,525
Eastern Iowa 93 358 1,255 1,140 44 10,693 232 689 14,504
Kirkwood 103 666 1,136 394 8 11,310 83 11,369 25,069
Des Moines Area 171 1,280 3,330 1,930 33 29,004 752 2,124 38,624
Western Iowa Tech 150 181 237 782 12 5,922 123 1,340 8,747
Iowa Western 128 211 793 445 19 7,857 15 257 9,725
Southwestern 4 12 38 71 1 2,073 45 42 2,286
Indian Hills 40 67 204 175 3 6,070 52 829 7,440
Southeastern 28 61 217 198 9 3,947 87 93 4,640
Total 902 3,508 9,595 6,641 167 111,819 1,764 18,073 152,469
3-16. RACE AND ETHNICITY OF CREDIT ENROLLMENT STUDENTS 2011
College
American
Indian Asian Black Hispanic
Hawaiian/
Pacific
Islander White
Two or
more
races
No
Response Total
Northeast 13 24 171 111 1 6,835 53 282 7,490
North Iowa Area 17 56 166 146 3 4,446 38 122 4,994
Iowa Lakes 21 94 181 120 0 4,192 9 167 4,784
Northwest 8 16 11 61 1 2,313 27 97 2,534
Iowa Central 23 121 801 437 12 7,225 94 446 9,159
Iowa Valley 65 141 209 308 6 2,975 37 622 4,363
Hawkeye 32 131 997 202 12 8,366 50 1 9,791
Eastern Iowa 96 393 1,149 1,047 25 10,862 195 656 14,423
Kirkwood 105 586 1,186 417 3 12,270 14 11,641 26,222
Des Moines Area 197 1,196 3,187 1,729 18 28,493 649 2,630 38,099
Western Iowa Tech 210 173 271 797 13 6,072 0 1,266 8,802
Iowa Western 106 140 682 330 17 7,410 32 317 9,034
Southwestern 10 18 46 64 1 2,131 35 30 2,335
Indian Hills 64 68 181 171 7 6,771 13 831 8,106
Southeastern 31 65 224 188 10 4,305 56 125 5,004
Total 998 3,222 9,462 6,128 129 114,666 1,302 19,233 155,140
Tables, Section 3 | 12
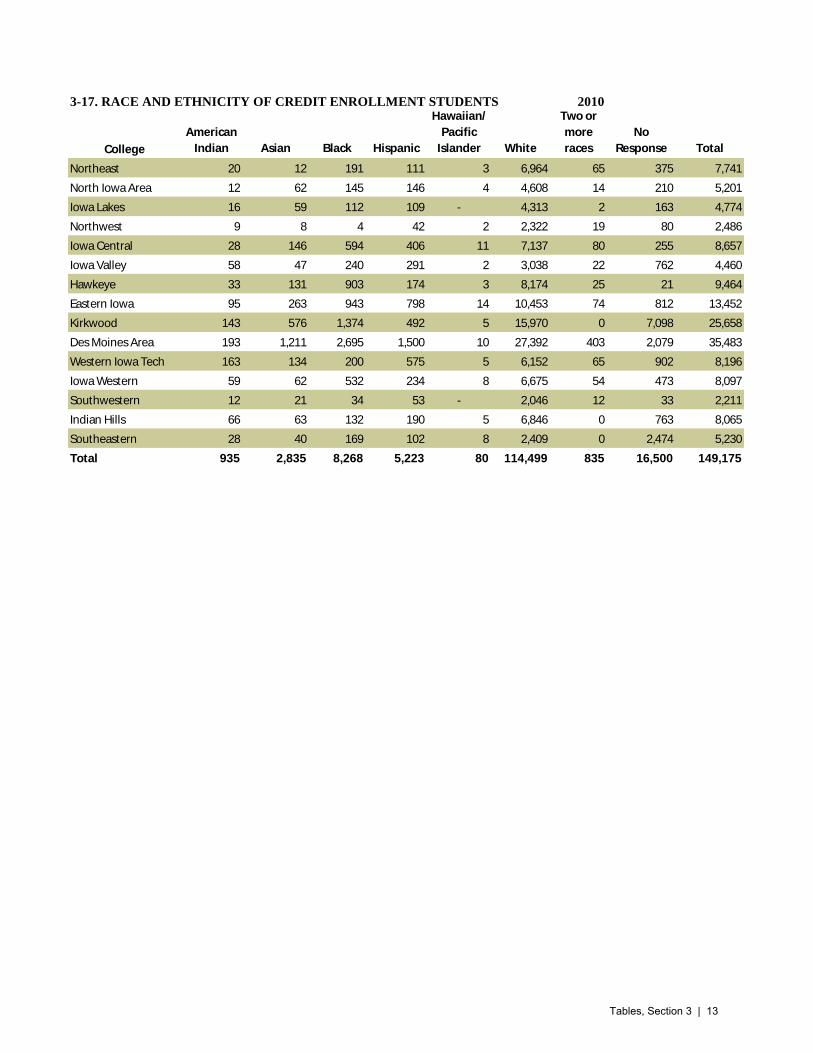
3-17. RACE AND ETHNICITY OF CREDIT ENROLLMENT STUDENTS 2010
College
American
Indian Asian Black Hispanic
Hawaiian/
Pacific
Islander White
Two or
more
races
No
Response Total
Northeast 20 12 191 111 3 6,964 65 375 7,741
North Iowa Area 12 62 145 146 4 4,608 14 210 5,201
Iowa Lakes 16 59 112 109 - 4,313 2 163 4,774
Northwest 9 8 4 42 2 2,322 19 80 2,486
Iowa Central 28 146 594 406 11 7,137 80 255 8,657
Iowa Valley 58 47 240 291 2 3,038 22 762 4,460
Hawkeye 33 131 903 174 3 8,174 25 21 9,464
Eastern Iowa 95 263 943 798 14 10,453 74 812 13,452
Kirkwood 143 576 1,374 492 5 15,970 0 7,098 25,658
Des Moines Area 193 1,211 2,695 1,500 10 27,392 403 2,079 35,483
Western Iowa Tech 163 134 200 575 5 6,152 65 902 8,196
Iowa Western 59 62 532 234 8 6,675 54 473 8,097
Southwestern 12 21 34 53 - 2,046 12 33 2,211
Indian Hills 66 63 132 190 5 6,846 0 763 8,065
Southeastern 28 40 169 102 8 2,409 0 2,474 5,230
Total 935 2,835 8,268 5,223 80 114,499 835 16,500 149,175
Tables, Section 3 | 13

3-18. AGE OF CREDIT ENROLLMENT STUDENTS 2014
College
17 &
Under 18-22 23-26 27-30 31-39 40-55 Over 55
No
Response Total
Northeast 1,427 3,604 785 417 511 358 48 3 7,153
North Iowa Area 528 2,350 345 206 303 252 30 0 4,014
Iowa Lakes 627 2,031 407 198 295 188 30 14 3,790
Northwest 459 1,568 271 96 142 76 16 3 2,631
Iowa Central 1,218 4,026 691 422 671 540 100 1 7,669
Iowa Valley 690 2,468 406 196 310 214 36 0 4,320
Hawkeye 1,152 5,074 1,230 538 626 463 60 1 9,144
Eastern Iowa 2,577 5,966 1,660 951 1,275 1,006 148 8 13,591
Kirkwood 2,654 10,758 3,119 1,560 2,091 1,514 217 3 21,916
Des Moines Area 8,250 16,641 4,066 2,251 2,996 2,257 396 20 36,877
Western Iowa Tech 1,609 3,825 1,037 590 807 580 82 9 8,539
Iowa Western 1,073 5,365 1,131 659 808 485 54 11 9,586
Southwestern 349 1,043 168 106 154 122 15 0 1,957
Indian Hills 890 2,778 668 434 618 460 92 59 5,999
Southeastern 649 1,922 449 294 416 283 27 0 4,040
Total 24,152 69,419 16,433 8,918 12,023 8,798 1,351 132 141,226
% of Total 17.1 49.2 11.6 6.3 8.5 6.2 1.0 0.1 100.0
3-19. AGE OF CREDIT ENROLLMENT STUDENTS 2013
College
17 &
Under 18-22 23-26 27-30 31-39 40-55 Over 55
No
Response Total
Northeast 1,248 3,732 735 414 566 412 64 3 7,174
North Iowa Area 462 2,430 385 253 367 299 48 3 4,247
Iowa Lakes 643 2,200 435 255 333 261 45 25 4,197
Northwest 414 1,540 234 114 181 94 13 8 2,598
Iowa Central 1,320 4,480 797 484 845 693 114 0 8,733
Iowa Valley 531 2,477 383 240 306 244 45 6 4,232
Hawkeye 1,103 4,954 1,232 586 672 520 64 1 9,132
Eastern Iowa 2,151 5,810 1,524 1,000 1,444 1,110 160 1 13,200
Kirkwood 2,473 11,306 3,329 1,843 2,461 1,747 249 14 23,422
Des Moines Area 8,020 15,894 3,980 2,367 3,142 2,526 411 25 36,365
Western Iowa Tech 1,462 3,786 1,035 639 863 649 103 4 8,541
Iowa Western 1,057 5,520 1,168 724 876 576 49 1 9,971
Southwestern 345 1,130 201 122 202 128 23 0 2,151
Indian Hills 865 3,135 777 567 802 632 107 61 6,946
Southeastern 527 2,142 517 360 501 373 55 4 4,479
Total 22,621 70,536 16,732 9,968 13,561 10,264 1,550 156 145,388
% of Total 15.6 48.5 11.5 6.9 9.3 7.1 1.1 0.1 100.0
Tables, Section 3 | 14

3-20. AGE OF CREDIT ENROLLMENT STUDENTS 2012
College
17 &
Under 18-22 23-26 27-30 31-39 40-55 Over 55
No
Response Total
Northeast 1,152 3,694 779 444 631 474 61 1 7,236
North Iowa Area 482 2,558 453 284 433 383 61 1 4,655
Iowa Lakes 665 2,339 429 287 385 299 50 20 4,474
Northwest 365 1,416 227 135 174 109 18 8 2,452
Iowa Central 1,247 4,510 771 523 839 772 139 12 8,813
Iowa Valley 497 2,447 417 242 358 273 41 4 4,279
Hawkeye 1,092 5,204 1,268 632 687 576 66 0 9,525
Eastern Iowa 2,061 6,309 1,775 1,270 1,689 1,238 162 0 14,504
Kirkwood 2,328 11,999 3,583 2,133 2,782 1,943 277 24 25,069
Des Moines Area 7,620 16,797 4,437 2,834 3,614 2,813 476 33 38,624
Western Iowa Tech 1,305 3,807 1,134 704 926 747 106 18 8,747
Iowa Western 994 5,324 1,145 682 940 580 52 8 9,725
Southwestern 342 1,150 213 161 226 174 20 0 2,286
Indian Hills 848 3,182 890 646 931 772 127 44 7,440
Southeastern 508 2,203 542 404 541 392 46 4 4,640
Total 21,506 72,939 18,063 11,381 15,156 11,545 1,702 177 152,469
% of Total 14.1 47.8 11.8 7.5 9.9 7.6 1.1 0.1 100.0
3-21. AGE OF CREDIT ENROLLMENT STUDENTS 2011
College
17 &
Under 18-22 23-26 27-30 31-39 40-55 Over 55
No
Response Total
Northeast 1,094 3,824 794 482 651 559 71 15 7,490
North Iowa Area 592 2,683 463 303 489 410 45 9 4,994
Iowa Lakes 717 2,375 451 337 447 362 58 37 4,784
Northwest 344 1,471 216 145 178 131 24 25 2,534
Iowa Central 1,291 4,603 838 601 907 775 96 48 9,159
Iowa Valley 481 2,462 384 273 383 330 42 8 4,363
Hawkeye 1,049 5,304 1,291 688 774 620 65 0 9,791
Eastern Iowa 1,864 6,355 1,813 1,253 1,705 1,257 169 7 14,423
Kirkwood 2,337 12,681 3,677 2,270 2,857 2,130 254 16 26,222
Des Moines Area 7,297 16,747 4,275 2,866 3,486 2,930 447 51 38,099
Western Iowa Tech 1,196 3,754 1,111 694 1,036 874 123 14 8,802
Iowa Western 862 5,087 1,023 611 835 567 49 0 9,034
Southwestern 329 1,202 212 142 242 186 22 0 2,335
Indian Hills 819 3,448 965 703 994 932 163 82 8,106
Southeastern 495 2,329 599 435 592 497 54 3 5,004
Total 20,767 74,325 18,112 11,803 15,576 12,560 1,682 315 155,140
% of Total 13.4 47.9 11.7 7.6 10.0 8.1 1.1 0.2 100.0
Tables, Section 3 | 15

3-22. AGE OF CREDIT ENROLLMENT STUDENTS 2010
College
17 &
Under 18-22 23-26 27-30 31-39 40-55 Over 55
No
Response Total
Northeast 1,067 4,052 832 513 607 614 52 4 7,741
North Iowa Area 641 2,759 448 316 496 458 77 6 5,201
Iowa Lakes 711 2,435 418 320 434 364 51 41 4,774
Northwest 386 1,412 211 138 152 129 20 38 2,486
Iowa Central 1,240 4,588 783 537 760 636 76 37 8,657
Iowa Valley 509 2,415 375 272 363 401 106 19 4,460
Hawkeye 1,081 5,252 1,170 655 696 560 50 0 9,464
Eastern Iowa 1,680 5,979 1,666 1,177 1,548 1,261 135 6 13,452
Kirkwood 2,222 12,774 3,643 2,174 2,610 1,968 249 18 25,658
Des Moines Area 5,825 16,412 4,204 2,616 3,230 2,751 412 33 35,483
Western Iowa Tech 987 3,766 996 653 890 639 82 183 8,196
Iowa Western 767 4,609 941 535 710 493 42 0 8,097
Southwestern 330 1,100 189 155 213 190 34 0 2,211
Indian Hills 716 3,379 930 729 953 1,013 201 144 8,065
Southeastern 445 2,339 635 494 630 615 60 12 5,230
Total 18,607 73,271 17,441 11,284 14,292 12,092 1,647 541 149,175
% of Total 12.5 49.1 11.7 7.6 9.6 8.1 1.1 0.4 100.0
Tables, Section 3 | 16

M % F % M % F % M % F % M % F % M % F %
Northeast 3,101 40.1 4,640 59.9 2,947 39.3 4,543 60.7 2,867 39.6 4,369 60.4 2,905 40.5 4,269 59.5 2,912 40.7 4,241 59.3
North Iowa Area 2,336 44.9 2,865 55.1 2,195 44.0 2,799 56.0 1,999 42.9 2,656 57.1 1,809 42.6 2,438 57.4 1,789 44.6 2,225 55.4
Iowa Lakes 2,080 44.0 2,646 56.0 2,161 45.2 2,620 54.8 1,984 44.4 2,483 55.6 1,876 44.7 2,320 55.3 1,661 43.8 2,129 56.2
Northwest 1,112 44.7 1,374 55.3 1,109 43.8 1,425 56.2 1,089 44.4 1,363 55.6 1,073 41.3 1,525 58.7 1,116 42.4 1,515 57.6
Iowa Central 4,216 48.7 4,441 51.3 4,328 47.3 4,829 52.7 4,199 47.6 4,614 52.4 4,137 47.4 4,596 52.6 3,718 48.5 3,951 51.5
Iowa Valley 1,963 44.0 2,496 56.0 1,884 43.2 2,473 56.8 1,807 42.3 2,467 57.7 1,772 41.9 2,454 58.1 1,857 43.0 2,458 57.0
Hawkeye 4,294 45.4 5,170 54.6 4,321 44.1 5,470 55.9 4,161 43.7 5,364 56.3 3,956 43.3 5,176 56.7 4,014 43.9 5,130 56.1
Eastern Iowa 5,776 42.9 7,676 57.1 6,085 42.2 8,338 57.8 6,224 42.9 8,280 57.1 5,706 43.2 7,494 56.8 5,899 43.4 7,692 56.6
Kirkwood 12,047 47.1 13,523 52.9 12,243 46.7 13,978 53.3 11,670 46.6 13,399 53.4 11,148 47.6 12,274 52.4 10,692 48.8 11,224 51.2
Des Moines Area 16,009 45.1 19,474 54.9 17,443 45.8 20,656 54.2 17,696 45.8 20,928 54.2 16,938 46.6 19,427 53.4 17,183 46.6 19,694 53.4
Western Iowa Tech 3,368 41.7 4,700 58.3 3,620 41.2 5,177 58.8 3,594 41.1 5,153 58.9 3,576 41.9 4,965 58.1 3,576 41.9 4,962 58.1
Iowa Western 3,546 43.8 4,551 56.2 3,881 43.0 5,153 57.0 4,162 42.8 5,560 57.2 4,412 44.2 5,559 55.8 4,233 44.2 5,352 55.8
Southwestern 793 35.9 1,418 64.1 909 38.9 1,426 61.1 836 36.6 1,450 63.4 809 37.6 1,342 62.4 780 39.9 1,177 60.1
Indian Hills 3,284 42.9 4,375 57.1 3,230 41.5 4,551 58.5 2,947 41.0 4,240 59.0 2,854 41.7 3,982 58.3 2,537 42.9 3,375 57.1
Southeastern 2,010 38.4 3,220 61.6 1,971 39.4 3,033 60.6 1,738 37.5 2,902 62.5 1,735 38.7 2,744 61.3 1,596 39.5 2,444 60.5
Total 65,935 44.4 82,569 55.6 68,327 44.1 86,471 55.9 66,973 44.0 85,228 56.0 64,706 44.5 80,565 55.5 63,563 45.0 77,569 55.0
Note: Unknown students were omitted from the chart. In fiscal year 2010: 671 (0.5%); 2011: 342 (0.2%); fiscal year 2012: 268 (0.2%); fiscal year 2013: 117 (0.1%); fiscal year 2014:
94 (0.1%).
3-23. GENDER OF CREDIT ENROLLMENT STUDENTS
College201420132010 2011 2012
Tables, Section 3 | 17
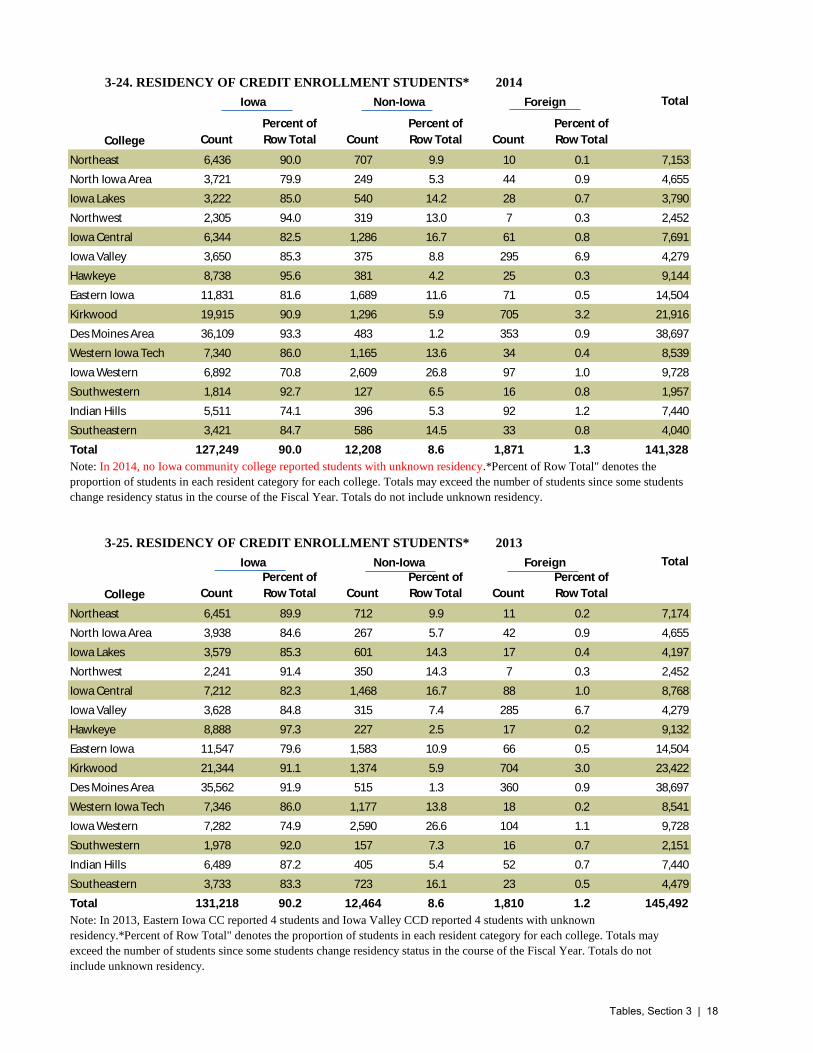
3-24. RESIDENCY OF CREDIT ENROLLMENT STUDENTS* 2014
Total
College Count
Percent of
Row Total Count
Percent of
Row Total Count
Percent of
Row Total
Northeast 6,436 90.0 707 9.9 10 0.1 7,153
North Iowa Area 3,721 79.9 249 5.3 44 0.9 4,655
Iowa Lakes 3,222 85.0 540 14.2 28 0.7 3,790
Northwest 2,305 94.0 319 13.0 7 0.3 2,452
Iowa Central 6,344 82.5 1,286 16.7 61 0.8 7,691
Iowa Valley 3,650 85.3 375 8.8 295 6.9 4,279
Hawkeye 8,738 95.6 381 4.2 25 0.3 9,144
Eastern Iowa 11,831 81.6 1,689 11.6 71 0.5 14,504
Kirkwood 19,915 90.9 1,296 5.9 705 3.2 21,916
Des Moines Area 36,109 93.3 483 1.2 353 0.9 38,697
Western Iowa Tech 7,340 86.0 1,165 13.6 34 0.4 8,539
Iowa Western 6,892 70.8 2,609 26.8 97 1.0 9,728
Southwestern 1,814 92.7 127 6.5 16 0.8 1,957
Indian Hills 5,511 74.1 396 5.3 92 1.2 7,440
Southeastern 3,421 84.7 586 14.5 33 0.8 4,040
Total 127,249 90.0 12,208 8.6 1,871 1.3 141,328
3-25. RESIDENCY OF CREDIT ENROLLMENT STUDENTS* 2013
Total
College Count
Percent of
Row Total Count
Percent of
Row Total Count
Percent of
Row Total
Northeast 6,451 89.9 712 9.9 11 0.2 7,174
North Iowa Area 3,938 84.6 267 5.7 42 0.9 4,655
Iowa Lakes 3,579 85.3 601 14.3 17 0.4 4,197
Northwest 2,241 91.4 350 14.3 7 0.3 2,452
Iowa Central 7,212 82.3 1,468 16.7 88 1.0 8,768
Iowa Valley 3,628 84.8 315 7.4 285 6.7 4,279
Hawkeye 8,888 97.3 227 2.5 17 0.2 9,132
Eastern Iowa 11,547 79.6 1,583 10.9 66 0.5 14,504
Kirkwood 21,344 91.1 1,374 5.9 704 3.0 23,422
Des Moines Area 35,562 91.9 515 1.3 360 0.9 38,697
Western Iowa Tech 7,346 86.0 1,177 13.8 18 0.2 8,541
Iowa Western 7,282 74.9 2,590 26.6 104 1.1 9,728
Southwestern 1,978 92.0 157 7.3 16 0.7 2,151
Indian Hills 6,489 87.2 405 5.4 52 0.7 7,440
Southeastern 3,733 83.3 723 16.1 23 0.5 4,479
Total 131,218 90.2 12,464 8.6 1,810 1.2 145,492
Iowa Non-Iowa Foreign
Note: In 2014, no Iowa community college reported students with unknown residency.*Percent of Row Total" denotes the
proportion of students in each resident category for each college. Totals may exceed the number of students since some students
change residency status in the course of the Fiscal Year. Totals do not include unknown residency.
Iowa Non-Iowa Foreign
Note: In 2013, Eastern Iowa CC reported 4 students and Iowa Valley CCD reported 4 students with unknown
residency.*Percent of Row Total" denotes the proportion of students in each resident category for each college. Totals may
exceed the number of students since some students change residency status in the course of the Fiscal Year. Totals do not
include unknown residency.
Tables, Section 3 | 18
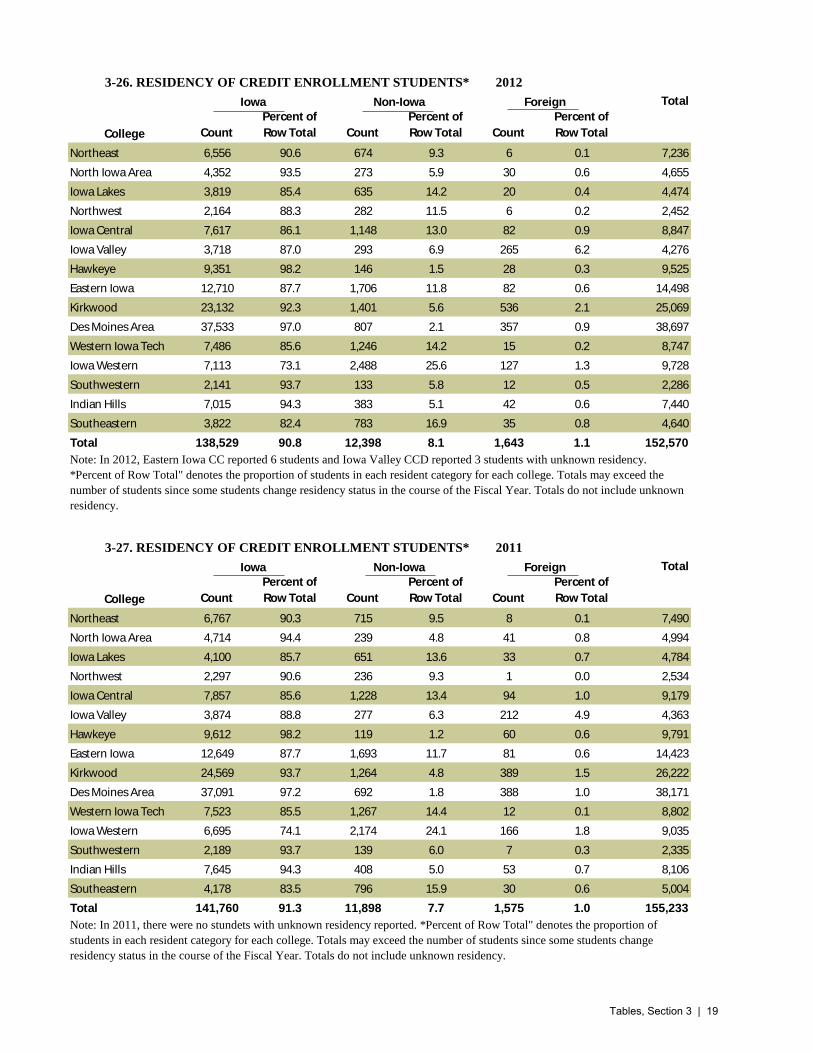
3-26. RESIDENCY OF CREDIT ENROLLMENT STUDENTS* 2012
Total
College Count
Percent of
Row Total Count
Percent of
Row Total Count
Percent of
Row Total
Northeast 6,556 90.6 674 9.3 6 0.1 7,236
North Iowa Area 4,352 93.5 273 5.9 30 0.6 4,655
Iowa Lakes 3,819 85.4 635 14.2 20 0.4 4,474
Northwest 2,164 88.3 282 11.5 6 0.2 2,452
Iowa Central 7,617 86.1 1,148 13.0 82 0.9 8,847
Iowa Valley 3,718 87.0 293 6.9 265 6.2 4,276
Hawkeye 9,351 98.2 146 1.5 28 0.3 9,525
Eastern Iowa 12,710 87.7 1,706 11.8 82 0.6 14,498
Kirkwood 23,132 92.3 1,401 5.6 536 2.1 25,069
Des Moines Area 37,533 97.0 807 2.1 357 0.9 38,697
Western Iowa Tech 7,486 85.6 1,246 14.2 15 0.2 8,747
Iowa Western 7,113 73.1 2,488 25.6 127 1.3 9,728
Southwestern 2,141 93.7 133 5.8 12 0.5 2,286
Indian Hills 7,015 94.3 383 5.1 42 0.6 7,440
Southeastern 3,822 82.4 783 16.9 35 0.8 4,640
Total 138,529 90.8 12,398 8.1 1,643 1.1 152,570
3-27. RESIDENCY OF CREDIT ENROLLMENT STUDENTS* 2011
Total
College Count
Percent of
Row Total Count
Percent of
Row Total Count
Percent of
Row Total
Northeast 6,767 90.3 715 9.5 8 0.1 7,490
North Iowa Area 4,714 94.4 239 4.8 41 0.8 4,994
Iowa Lakes 4,100 85.7 651 13.6 33 0.7 4,784
Northwest 2,297 90.6 236 9.3 1 0.0 2,534
Iowa Central 7,857 85.6 1,228 13.4 94 1.0 9,179
Iowa Valley 3,874 88.8 277 6.3 212 4.9 4,363
Hawkeye 9,612 98.2 119 1.2 60 0.6 9,791
Eastern Iowa 12,649 87.7 1,693 11.7 81 0.6 14,423
Kirkwood 24,569 93.7 1,264 4.8 389 1.5 26,222
Des Moines Area 37,091 97.2 692 1.8 388 1.0 38,171
Western Iowa Tech 7,523 85.5 1,267 14.4 12 0.1 8,802
Iowa Western 6,695 74.1 2,174 24.1 166 1.8 9,035
Southwestern 2,189 93.7 139 6.0 7 0.3 2,335
Indian Hills 7,645 94.3 408 5.0 53 0.7 8,106
Southeastern 4,178 83.5 796 15.9 30 0.6 5,004
Total 141,760 91.3 11,898 7.7 1,575 1.0 155,233
Iowa Non-Iowa Foreign
Note: In 2012, Eastern Iowa CC reported 6 students and Iowa Valley CCD reported 3 students with unknown residency.
*Percent of Row Total" denotes the proportion of students in each resident category for each college. Totals may exceed the
number of students since some students change residency status in the course of the Fiscal Year. Totals do not include unknown
residency.
Iowa Non-Iowa Foreign
Note: In 2011, there were no stundets with unknown residency reported. *Percent of Row Total" denotes the proportion of
students in each resident category for each college. Totals may exceed the number of students since some students change
residency status in the course of the Fiscal Year. Totals do not include unknown residency.
Tables, Section 3 | 19

3-28. RESIDENCY OF CREDIT ENROLLMENT STUDENTS* 2010
Total
College Count
Percent of
Row Total Count
Percent of
Row Total Count
Percent of
Row Total
Northeast 7,000 90.4 726 9.4 15 0.2 7,741
North Iowa Area 4,939 95.0 225 4.3 37 0.7 5,201
Iowa Lakes 4,164 87.2 586 12.3 24 0.5 4,774
Northwest 2,323 93.4 163 6.6 0 0.0 2,486
Iowa Central 7,615 87.7 959 11.0 106 1.2 8,680
Iowa Valley 4,048 90.8 266 6.0 145 3.3 4,459
Hawkeye 9,305 98.3 87 0.9 72 0.8 9,464
Eastern Iowa 12,027 89.4 1,345 10.0 80 0.6 13,452
Kirkwood 24,109 94.0 1,190 4.6 358 1.4 25,657
Des Moines Area 34,687 97.6 482 1.4 360 1.0 35,529
Western Iowa Tech 7,122 86.9 1,074 13.1 0 0.0 8,196
Iowa Western 6,193 76.4 1,764 21.8 144 1.8 8,101
Southwestern 2,092 94.6 111 5.0 8 0.4 2,211
Indian Hills 7,642 94.8 382 4.7 41 0.5 8,065
Southeastern 4,394 84.0 803 15.4 33 0.6 5,230
Total 137,660 92.2 10,163 6.8 1,423 1.0 149,246
Note: In 2010, Iowa Valley reported 9 students with an unknown residency, Eastern Iowa reported seven students without a
residency, and Kirkwood reported four students. *Percent of Row Total" denotes the proportion of students in each resident
category for each college. Totals may exceed the number of students since some students change residency status in the course
of the Fiscal Year. Totals do not include unknown residency.
Iowa Non-Iowa Foreign
Tables, Section 3 | 20

3-29. ENROLLMENT IN DEVELOPMENTAL EDUCATION* 2014
College Students Credit Hours Male Percent Female Percent
Northeast 1,205 5,620 497 41.2 708 58.8
North Iowa Area 893 3,219 385 43.1 508 56.9
Iowa Lakes 793 1,276 415 52.3 378 47.7
Northwest 8 27 2 25.0 6 75.0
Iowa Central 1,630 9,700 684 42.0 946 58.0
Iowa Valley 790 3,661 376 47.7 413 52.3
Hawkeye 1,319 7,450 572 43.4 747 56.6
Eastern Iowa 1,906 10,884 719 37.7 1,187 62.3
Kirkwood 3,596 19,653 1,680 46.7 1,916 53.3
Des Moines Area 2,846 15,738 1,120 39.4 1,726 60.6
Western Iowa Tech 821 4,155 248 30.2 573 69.8
Iowa Western 2,215 11,143 980 44.2 1,235 55.8
Southwestern 160 592 69 43.1 91 56.9
Indian Hills 326 991 99 30.4 227 69.6
Southeastern 763 2,582 301 39.4 462 60.6
Total 19,271 96,691 8,147 42.3 11,123 57.7
3-30. ENROLLMENT IN DEVELOPMENTAL EDUCATION* 2013
College Students Credit Hours Male Percent Female Percent
Northeast 1,325 6,289 530 40.0 795 60.0
North Iowa Area 1,030 3,648 444 43.1 586 56.9
Iowa Lakes 1,014 1,677 488 48.1 526 51.9
Northwest 5 15 1 20.0 4 80.0
Iowa Central 1,665 10,012 710 42.6 955 57.4
Iowa Valley 871 4,076 418 48.0 452 52.0
Hawkeye 1,454 8,440 613 42.2 841 57.8
Eastern Iowa 2,203 12,516 830 37.7 1,373 62.3
Kirkwood 3,868 20,409 1,759 45.5 2,109 54.5
Des Moines Area 3,170 18,224 1,286 40.6 1,884 59.4
Western Iowa Tech 1,069 5,654 334 31.2 735 68.8
Iowa Western 2,612 13,546 1,177 45.1 1,435 54.9
Southwestern 161 617 63 39.1 98 60.9
Indian Hills 521 1,673 166 31.9 355 68.1
Southeastern 910 3,028 338 37.1 572 62.9
Total 21,878 109,824 9,157 41.9 12,720 58.1
Note: Totals include student with unknown gender. In 2014, IVCCD reported 1 student of unknown gender. *A student is
counted if he or she took at least one developmental course during reporting year. Male and Female total does not include
one student with unknown gender.
Note: Totals include students with unknown gender. In 2013, IVCCD reported 1 student of unknown gender. *A student is
counted if he or she took at least one developmental course during reporting year. Male and Female total does not include
one student with unknown gender.
Tables, Section 3 | 21
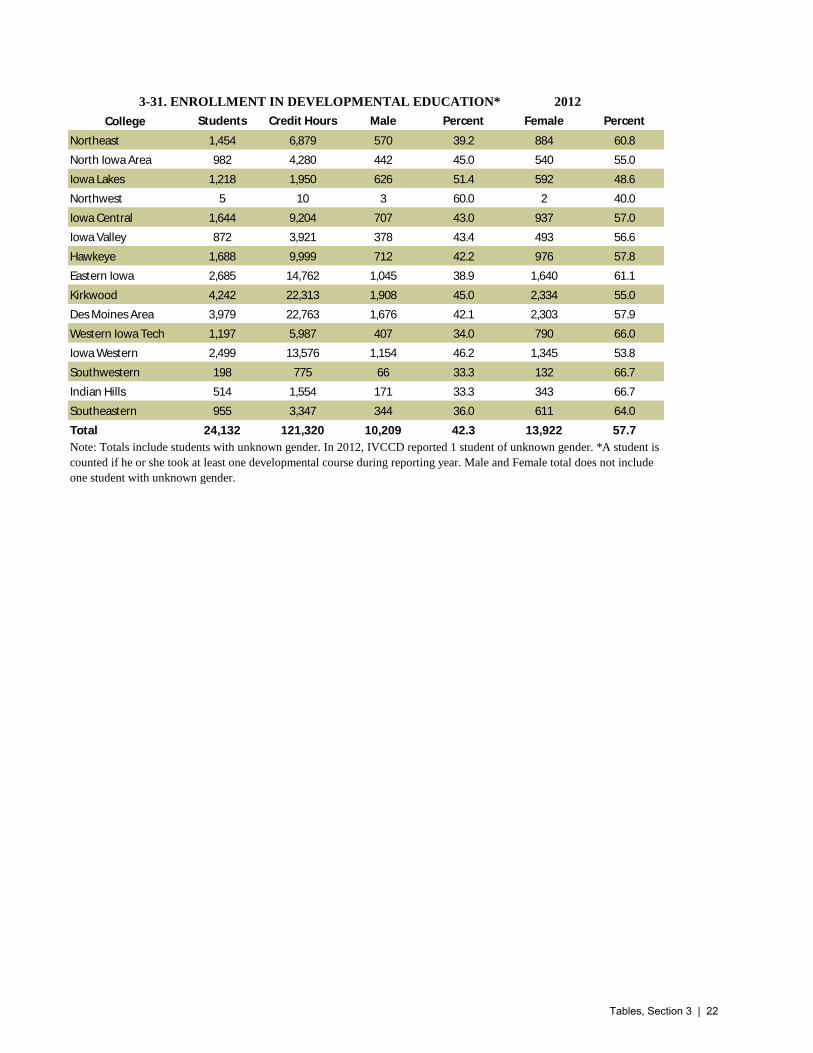
3-31. ENROLLMENT IN DEVELOPMENTAL EDUCATION* 2012
College Students Credit Hours Male Percent Female Percent
Northeast 1,454 6,879 570 39.2 884 60.8
North Iowa Area 982 4,280 442 45.0 540 55.0
Iowa Lakes 1,218 1,950 626 51.4 592 48.6
Northwest 5 10 3 60.0 2 40.0
Iowa Central 1,644 9,204 707 43.0 937 57.0
Iowa Valley 872 3,921 378 43.4 493 56.6
Hawkeye 1,688 9,999 712 42.2 976 57.8
Eastern Iowa 2,685 14,762 1,045 38.9 1,640 61.1
Kirkwood 4,242 22,313 1,908 45.0 2,334 55.0
Des Moines Area 3,979 22,763 1,676 42.1 2,303 57.9
Western Iowa Tech 1,197 5,987 407 34.0 790 66.0
Iowa Western 2,499 13,576 1,154 46.2 1,345 53.8
Southwestern 198 775 66 33.3 132 66.7
Indian Hills 514 1,554 171 33.3 343 66.7
Southeastern 955 3,347 344 36.0 611 64.0
Total 24,132 121,320 10,209 42.3 13,922 57.7
Note: Totals include students with unknown gender. In 2012, IVCCD reported 1 student of unknown gender. *A student is
counted if he or she took at least one developmental course during reporting year. Male and Female total does not include
one student with unknown gender.
Tables, Section 3 | 22
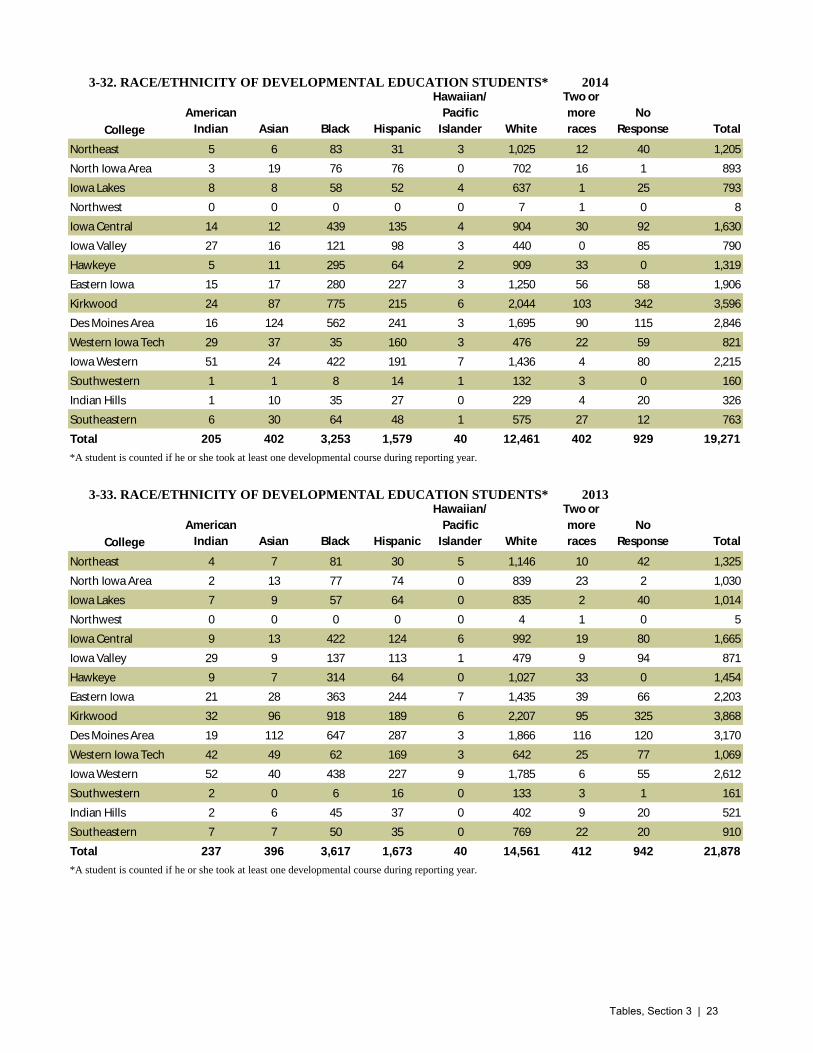
3-32. RACE/ETHNICITY OF DEVELOPMENTAL EDUCATION STUDENTS* 2014
College
American
Indian Asian Black Hispanic
Hawaiian/
Pacific
Islander White
Two or
more
races
No
Response Total
Northeast 5 6 83 31 3 1,025 12 40 1,205
North Iowa Area 3 19 76 76 0 702 16 1 893
Iowa Lakes 8 8 58 52 4 637 1 25 793
Northwest 0 0 0 0 0 7 1 0 8
Iowa Central 14 12 439 135 4 904 30 92 1,630
Iowa Valley 27 16 121 98 3 440 0 85 790
Hawkeye 5 11 295 64 2 909 33 0 1,319
Eastern Iowa 15 17 280 227 3 1,250 56 58 1,906
Kirkwood 24 87 775 215 6 2,044 103 342 3,596
Des Moines Area 16 124 562 241 3 1,695 90 115 2,846
Western Iowa Tech 29 37 35 160 3 476 22 59 821
Iowa Western 51 24 422 191 7 1,436 4 80 2,215
Southwestern 1 1 8 14 1 132 3 0 160
Indian Hills 1 10 35 27 0 229 4 20 326
Southeastern 6 30 64 48 1 575 27 12 763
Total 205 402 3,253 1,579 40 12,461 402 929 19,271
3-33. RACE/ETHNICITY OF DEVELOPMENTAL EDUCATION STUDENTS* 2013
College
American
Indian Asian Black Hispanic
Hawaiian/
Pacific
Islander White
Two or
more
races
No
Response Total
Northeast 4 7 81 30 5 1,146 10 42 1,325
North Iowa Area 2 13 77 74 0 839 23 2 1,030
Iowa Lakes 7 9 57 64 0 835 2 40 1,014
Northwest 0 0 0 0 0 4 1 0 5
Iowa Central 9 13 422 124 6 992 19 80 1,665
Iowa Valley 29 9 137 113 1 479 9 94 871
Hawkeye 9 7 314 64 0 1,027 33 0 1,454
Eastern Iowa 21 28 363 244 7 1,435 39 66 2,203
Kirkwood 32 96 918 189 6 2,207 95 325 3,868
Des Moines Area 19 112 647 287 3 1,866 116 120 3,170
Western Iowa Tech 42 49 62 169 3 642 25 77 1,069
Iowa Western 52 40 438 227 9 1,785 6 55 2,612
Southwestern 2 0 6 16 0 133 3 1 161
Indian Hills 2 6 45 37 0 402 9 20 521
Southeastern 7 7 50 35 0 769 22 20 910
Total 237 396 3,617 1,673 40 14,561 412 942 21,878
*A student is counted if he or she took at least one developmental course during reporting year.
*A student is counted if he or she took at least one developmental course during reporting year.
Tables, Section 3 | 23
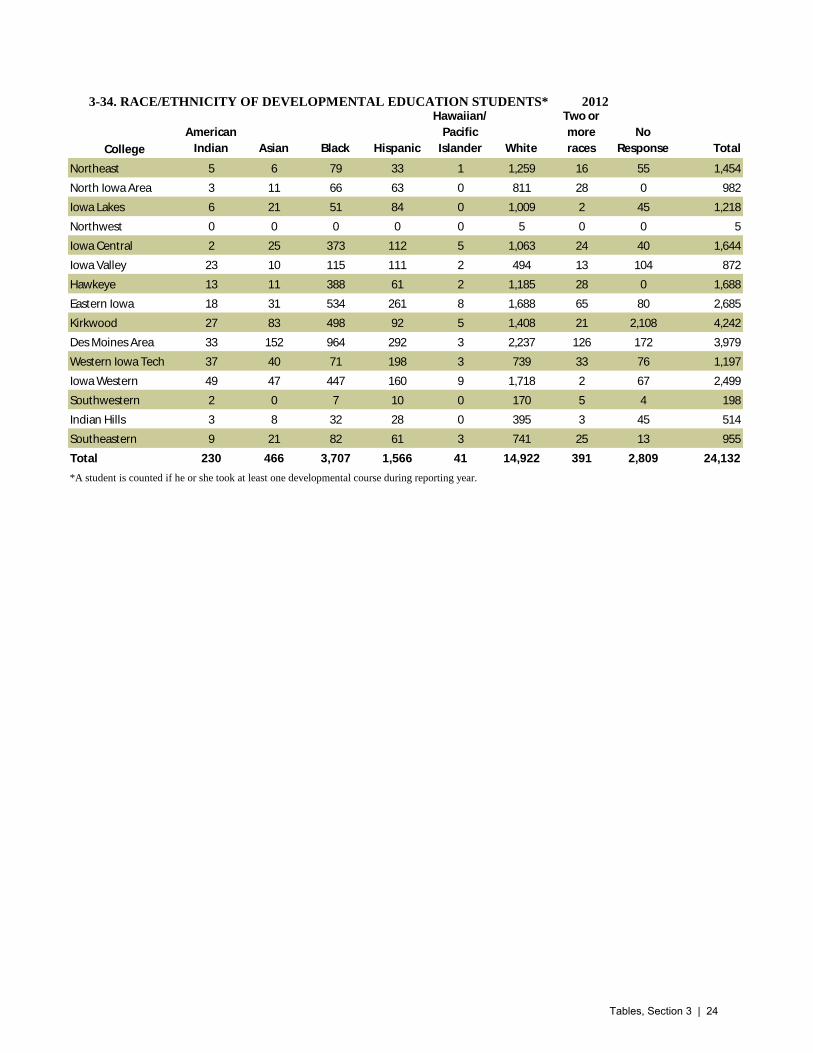
3-34. RACE/ETHNICITY OF DEVELOPMENTAL EDUCATION STUDENTS* 2012
College
American
Indian Asian Black Hispanic
Hawaiian/
Pacific
Islander White
Two or
more
races
No
Response Total
Northeast 5 6 79 33 1 1,259 16 55 1,454
North Iowa Area 3 11 66 63 0 811 28 0 982
Iowa Lakes 6 21 51 84 0 1,009 2 45 1,218
Northwest 0 0 0 0 0 5 0 0 5
Iowa Central 2 25 373 112 5 1,063 24 40 1,644
Iowa Valley 23 10 115 111 2 494 13 104 872
Hawkeye 13 11 388 61 2 1,185 28 0 1,688
Eastern Iowa 18 31 534 261 8 1,688 65 80 2,685
Kirkwood 27 83 498 92 5 1,408 21 2,108 4,242
Des Moines Area 33 152 964 292 3 2,237 126 172 3,979
Western Iowa Tech 37 40 71 198 3 739 33 76 1,197
Iowa Western 49 47 447 160 9 1,718 2 67 2,499
Southwestern 2 0 7 10 0 170 5 4 198
Indian Hills 3 8 32 28 0 395 3 45 514
Southeastern 9 21 82 61 3 741 25 13 955
Total 230 466 3,707 1,566 41 14,922 391 2,809 24,132
*A student is counted if he or she took at least one developmental course during reporting year.
Tables, Section 3 | 24
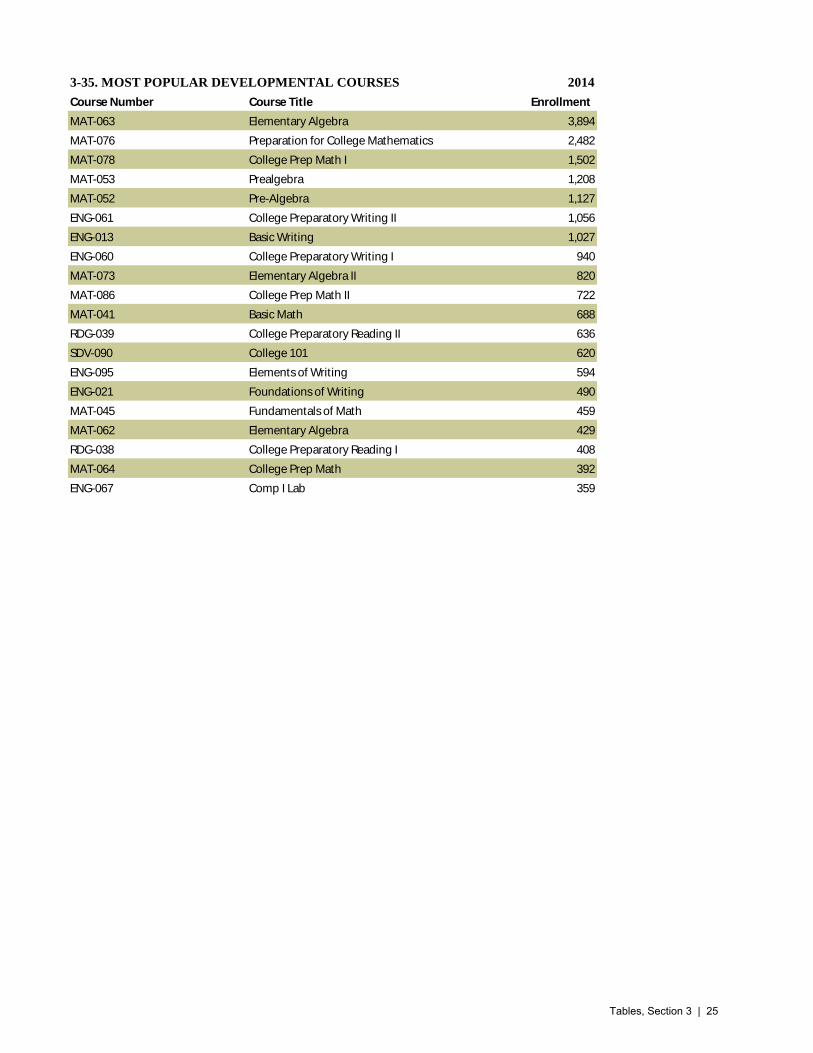
3-35. MOST POPULAR DEVELOPMENTAL COURSES 2014
Course Number Course Title Enrollment
MAT-063 Elementary Algebra 3,894
MAT-076 Preparation for College Mathematics 2,482
MAT-078 College Prep Math I 1,502
MAT-053 Prealgebra 1,208
MAT-052 Pre-Algebra 1,127
ENG-061 College Preparatory Writing II 1,056
ENG-013 Basic Writing 1,027
ENG-060 College Preparatory Writing I 940
MAT-073 Elementary Algebra II 820
MAT-086 College Prep Math II 722
MAT-041 Basic Math 688
RDG-039 College Preparatory Reading II 636
SDV-090 College 101 620
ENG-095 Elements of Writing 594
ENG-021 Foundations of Writing 490
MAT-045 Fundamentals of Math 459
MAT-062 Elementary Algebra 429
RDG-038 College Preparatory Reading I 408
MAT-064 College Prep Math 392
ENG-067 Comp I Lab 359
Tables, Section 3 | 25
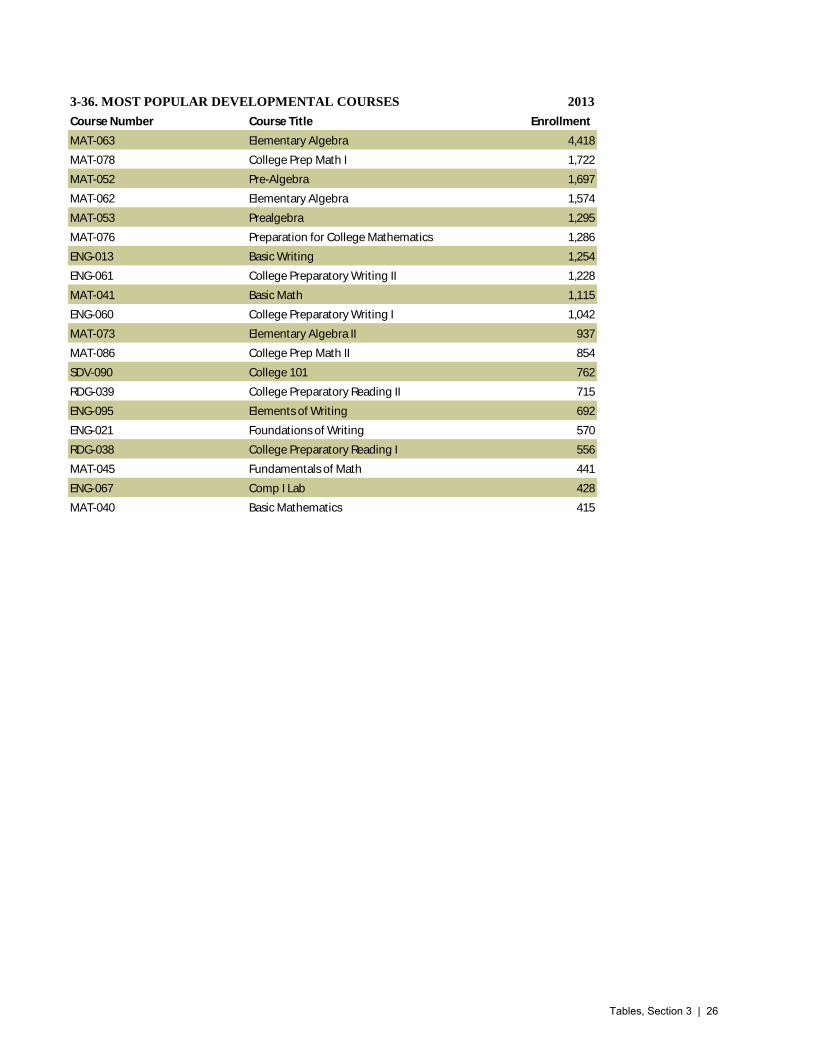
3-36. MOST POPULAR DEVELOPMENTAL COURSES 2013
Course Number Course Title Enrollment
MAT-063 Elementary Algebra 4,418
MAT-078 College Prep Math I 1,722
MAT-052 Pre-Algebra 1,697
MAT-062 Elementary Algebra 1,574
MAT-053 Prealgebra 1,295
MAT-076 Preparation for College Mathematics 1,286
ENG-013 Basic Writing 1,254
ENG-061 College Preparatory Writing II 1,228
MAT-041 Basic Math 1,115
ENG-060 College Preparatory Writing I 1,042
MAT-073 Elementary Algebra II 937
MAT-086 College Prep Math II 854
SDV-090 College 101 762
RDG-039 College Preparatory Reading II 715
ENG-095 Elements of Writing 692
ENG-021 Foundations of Writing 570
RDG-038 College Preparatory Reading I 556
MAT-045 Fundamentals of Math 441
ENG-067 Comp I Lab 428
MAT-040 Basic Mathematics 415
Tables, Section 3 | 26

3-37. MOST POPULAR DEVELOPMENTAL COURSES 2012
Course Number Course Title Enrollment
MAT-063 Elementary Algebra 5,324
MAT-062 Elementary Algebra 2,633
MAT-052 Pre-Algebra 2,122
MAT-053 Pre-Algebra 1,461
MAT-041 Basic Math 1,443
MAT-075 College Preparatory Math 1,439
ENG-061 College Preparatory Writing II 1,394
ENG-013 Basic Writing 1,382
ENG-060 College Preparatory Writing I 1,306
MAT-073 Elementary Algebra II 1,052
RDG-039 College Preparatory Reading II 939
MAT-078 College Prep Math I 888
SDV-090 College 101 887
ENG-095 Elements of Writing 671
MAT-034 Arithmetic 636
MAT-086 College Prep Math II 617
RDG-038 College Preparatory Reading I 594
MAT-076 Preparation for College Mathematics 569
ENG-021 Foundations of Writing 560
MAT-045 Fundamentals of Math 544
Tables, Section 3 | 27

3-38. AGE OF DEVELOPMENTAL EDUCATION STUDENTS 2014
College
17 &
Under 18-22 23-26 27-30 31-39 40-55 Over 55
No
Response Total
Northeast 57 684 161 102 114 75 12 0 1,205
North Iowa Area 1 642 88 52 59 48 3 0 893
Iowa Lakes 2 594 77 39 55 23 3 0 793
Northwest 0 5 1 0 2 0 0 0 8
Iowa Central 2 1,046 165 101 164 122 30 0 1,630
Iowa Valley 2 520 78 54 80 46 10 0 790
Hawkeye 2 766 197 107 136 99 12 0 1,319
Eastern Iowa 9 980 339 196 218 149 15 0 1,906
Kirkwood 18 1,845 499 323 513 347 50 1 3,596
Des Moines Area 28 1,362 397 289 396 327 46 1 2,846
Western Iowa Tech 5 427 141 73 92 74 9 0 821
Iowa Western 4 1,392 282 152 239 132 14 0 2,215
Southwestern 4 104 16 11 18 6 1 0 160
Indian Hills 2 140 48 42 47 38 9 0 326
Southeastern 34 490 79 49 70 40 1 0 763
Total 170 10,997 2,568 1,590 2,203 1,526 215 2 19,271
% of Total 0.9 57.1 13.3 8.3 11.4 7.9 1.1 0.0 100.0
3-39. AGE OF DEVELOPMENTAL EDUCATION STUDENTS 2013
College
17 &
Under 18-22 23-26 27-30 31-39 40-55 Over 55
No
Response Total
Northeast 59 760 162 109 149 78 8 0 1,325
North Iowa Area 0 698 92 69 103 61 7 0 1,030
Iowa Lakes 30 664 103 58 74 62 8 15 1,014
Northwest 0 2 2 1 0 0 0 0 5
Iowa Central 4 988 197 129 177 145 25 0 1,665
Iowa Valley 2 565 84 70 75 64 11 0 871
Hawkeye 4 865 203 121 138 108 15 0 1,454
Eastern Iowa 8 1,100 348 211 326 189 21 0 2,203
Kirkwood 9 1,836 544 399 581 438 59 2 3,868
Des Moines Area 44 1,406 461 341 451 412 55 0 3,170
Western Iowa Tech 6 546 176 97 144 87 13 0 1,069
Iowa Western 14 1,644 314 197 276 160 7 0 2,612
Southwestern 0 102 19 9 22 8 1 0 161
Indian Hills 1 232 63 65 88 64 8 0 521
Southeastern 124 396 112 69 127 68 14 0 910
Total 305 11,804 2,880 1,945 2,731 1,944 252 17 21,878
% of Total 1.4 54.0 13.2 8.9 12.5 8.9 1.2 0.1 100.0
Tables, Section 3 | 28

3-40. AGE OF DEVELOPMENTAL EDUCATION STUDENTS 2012
College
17 &
Under 18-22 23-26 27-30 31-39 40-55 Over 55
No
Response Total
Northeast 64 771 186 134 169 117 13 0 1,454
North Iowa Area 2 668 96 69 83 62 2 0 982
Iowa Lakes 88 791 108 74 76 64 9 8 1,218
Northwest 0 3 0 1 0 1 0 0 5
Iowa Central 1 899 170 121 213 205 33 2 1,644
Iowa Valley 2 540 96 59 85 77 12 1 872
Hawkeye 11 957 260 151 169 126 14 0 1,688
Eastern Iowa 11 1,252 435 321 391 252 23 0 2,685
Kirkwood 18 1,992 657 413 636 472 52 2 4,242
Des Moines Area 37 1,670 590 448 628 526 77 3 3,979
Western Iowa Tech 3 560 207 126 197 92 12 0 1,197
Iowa Western 8 1,605 283 171 262 161 9 0 2,499
Southwestern 0 101 25 16 31 22 3 0 198
Indian Hills 2 168 80 80 95 77 11 1 514
Southeastern 47 547 107 73 96 71 12 2 955
Total 294 12,524 3,300 2,257 3,131 2,325 282 19 24,132
% of Total 1.2 51.9 13.7 9.4 13.0 9.6 1.2 0.1 100.0
Tables, Section 3 | 29

Tables, Online Credit Enrollment and Demographics4
Table of Contents
4-1. Online Enrollment By College............................... ...............................................................................2
4-2. Online Credit Hours by College.............................................................................................................2
4-3. Online Enrollment by Program Type.....................................................................................................3
4-4--4-8. Number of Students by Age Range, Latest Five Years................................................................4-6
4-9--4-13. Online Enrollment by Sex, Latest Five Years...........................................................................7-9
4-14--4-18. Online Enrollment by Joint Enrollment Type, Latest Five Years........................................10-12
4-19--4-23. Students Enrolled in Online Course by Program and College, Latest Five Years..............13-15
4-24--4-28. Online Enrollment by Subpopulation, Latest Five Years....................................................16-18
4-29--4-33. Online Enrollment by Residency, Latest Five Years...........................................................19-21
Tables, Section 4 | 1

Table 4-1: Online Enrollment by College
College 2014 2013 2012 2011 2010
5-year
change (%)
Northeast 3,057 3,189 3,269 3,206 3,763 -18.76
North Iowa Area 2,197 2,462 2,577 2,540 2,637 -16.69
Iowa Lakes 1,710 1,905 1,930 2,068 1,806 -5.32
Northwest Iowa 1,624 1,625 1,381 1,256 1,068 52.06
Iowa Central 3,244 4,157 4,140 4,302 3,818 -15.03
Iowa Valley 2,502 2,455 2,331 2,275 2,000 25.10
Hawkeye 3,743 3,452 3,030 2,773 2,421 54.61
Eastern Iowa 5,620 5,752 6,357 6,411 5,268 6.68
Kirkwood 6,752 6,880 7,191 7,265 6,952 -2.88
Des Moines Area 11,010 10,793 11,183 10,535 9,919 11.00
Western Iowa Tech 4,343 4,031 4,369 4,243 3,697 17.47
Iowa Western 4,768 4,889 4,777 3,960 3,140 51.85
Southwestern 1,101 1,313 1,341 1,488 1,269 -13.24
Indian Hills 2,593 3,128 3,351 3,417 2,888 -10.21
Southeastern 1,757 2,100 2,132 2,154 2,054 -14.46
Total 56,021 58,131 59,359 57,893 52,700 6.30
Table 4-2: Online Credit Hours by College
College 2014 2013 2012 2011 2010
5-year
change (%)
Northeast 21,679 23,469 23,789 23,985 26,402 -17.89
North Iowa Area 11,480 12,644 12,951 11,248 10,369 10.71
Iowa Lakes 12,184 14,011 14,376 15,828 13,424 -9.24
Northwest Iowa 11,449 11,347 9,207 8,574 7,512 52.41
Iowa Central 27,261 34,018 31,509 33,188 28,381 -3.95
Iowa Valley 16,902 17,155 16,312 16,088 13,708 23.30
Hawkeye 20,768 19,162 16,553 15,035 12,819 62.01
Eastern Iowa 41,982 43,908 49,873 49,837 41,318 1.61
Kirkwood 46,350 49,407 53,328 51,818 45,762 1.28
Des Moines Area 74,582 73,162 78,252 74,203 69,047 8.02
Western Iowa Tech 31,826 30,190 33,543 33,530 28,569 11.40
Iowa Western 34,432 36,214 35,144 28,863 22,689 51.76
Southwestern 7,595 9,563 9,694 10,899 8,625 -11.94
Indian Hills 17,128 23,967 25,387 24,538 20,230 -15.33
Southeastern 13,068 15,928 16,059 15,830 14,838 -11.93
Total 388,685 414,145 425,977 413,464 363,693 6.87
Tables, Section 4 | 2
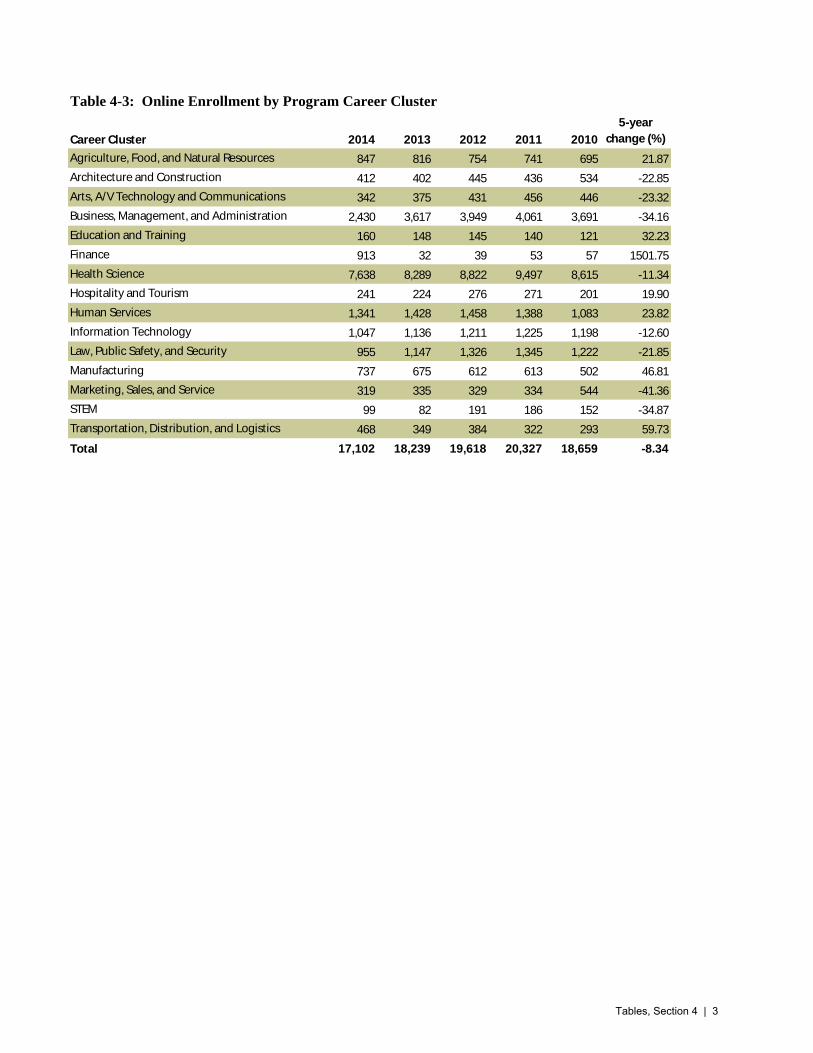
Table 4-3: Online Enrollment by Program Career Cluster
Career Cluster 2014 2013 2012 2011 2010
5-year
change (%)
Agriculture, Food, and Natural Resources 847 816 754 741 695 21.87
Architecture and Construction 412 402 445 436 534 -22.85
Arts, A/V Technology and Communications 342 375 431 456 446 -23.32
Business, Management, and Administration 2,430 3,617 3,949 4,061 3,691 -34.16
Education and Training 160 148 145 140 121 32.23
Finance 913 32 39 53 57 1501.75
Health Science 7,638 8,289 8,822 9,497 8,615 -11.34
Hospitality and Tourism 241 224 276 271 201 19.90
Human Services 1,341 1,428 1,458 1,388 1,083 23.82
Information Technology 1,047 1,136 1,211 1,225 1,198 -12.60
Law, Public Safety, and Security 955 1,147 1,326 1,345 1,222 -21.85
Manufacturing 737 675 612 613 502 46.81
Marketing, Sales, and Service 319 335 329 334 544 -41.36
STEM 99 82 191 186 152 -34.87
Transportation, Distribution, and Logistics 468 349 384 322 293 59.73
Total 17,102 18,239 19,618 20,327 18,659 -8.34
Tables, Section 4 | 3

Table 4-4: Numbers of Students by Age Range FY 2014
College 14-17 18-22 23-26 27-30 31-39 40-55 Over 55 Unknown Mean Median
Northeast Iowa 219 1,447 508 264 341 242 35 1 25.3 22
North Iowa Area 136 1,411 194 121 174 143 18 0 23.5 20
Iowa Lakes 117 895 259 116 195 113 15 0 24.5 21
Northwest 244 993 172 59 97 50 8 1 22.0 20
Iowa Central 348 1,359 411 270 446 363 47 0 26.2 22
Iowa Valley 197 1,489 286 143 220 151 16 0 23.6 21
Hawkeye 152 2,288 590 214 287 195 17 0 23.7 21
Eastern Iowa 191 2,459 994 574 768 559 74 1 26.6 23
Kirkwood 186 3,063 1,240 663 927 603 69 1 26.3 23
Des Moines Area 670 5,014 1,845 986 1,398 964 132 1 25.9 22
Western Iowa Tech 478 1,976 618 369 519 344 38 1 24.9 21
Iowa Western 132 2,468 747 468 580 338 32 3 25.3 22
Southwestern 189 564 100 75 94 72 7 0 23.3 20
Indian Hills 152 1,181 362 257 361 243 32 5 26.1 22
Southeastern 216 766 227 162 230 146 10 0 25.1 21
Total 3,627 27,373 8,553 4,741 6,637 4,526 550 14 24.8 22
Table 4-5: Numbers of Students by Age Range FY 2013
College 14-17 18-22 23-26 27-30 31-39 40-55 Over 55 Unknown Mean Median
Northeast Iowa 200 1,550 463 264 379 284 47 2 25.6 22
North Iowa Area 141 1,535 214 144 224 177 26 1 24.0 20
Iowa Lakes 124 947 281 155 213 156 28 1 25.3 21
Northwest 216 1,007 145 74 120 52 7 4 22.1 20
Iowa Central 454 1,748 516 336 592 458 53 0 26.1 22
Iowa Valley 209 1,415 260 157 215 170 27 2 24.0 20
Hawkeye 118 2,078 539 240 274 191 12 0 23.9 21
Eastern Iowa 211 2,528 887 590 865 604 67 0 26.7 23
Kirkwood 158 3,052 1,186 742 1,017 649 76 0 26.6 23
Des Moines Area 554 4,878 1,690 1,108 1,433 1,009 118 3 26.1 22
Western Iowa Tech 381 1,761 576 372 521 380 38 2 25.5 22
Iowa Western 81 2,510 754 508 614 396 25 1 25.5 22
Southwestern 195 642 145 86 145 87 13 0 24.0 20
Indian Hills 126 1,427 442 327 449 322 30 5 26.4 23
Southeastern 234 1,016 251 173 235 164 23 4 24.7 21
Total 3,402 28,094 8,349 5,276 7,296 5,099 590 25 25.1 22
Tables, Section 4 | 4
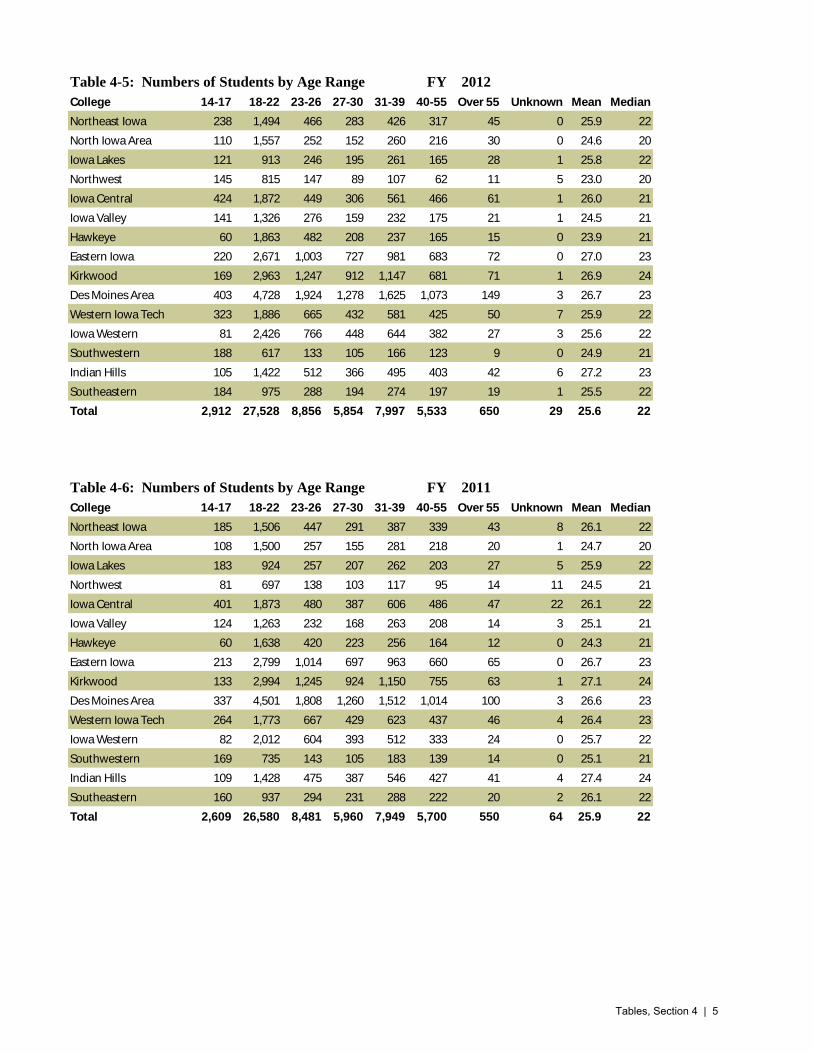
Table 4-5: Numbers of Students by Age Range FY 2012
College 14-17 18-22 23-26 27-30 31-39 40-55 Over 55 Unknown Mean Median
Northeast Iowa 238 1,494 466 283 426 317 45 0 25.9 22
North Iowa Area 110 1,557 252 152 260 216 30 0 24.6 20
Iowa Lakes 121 913 246 195 261 165 28 1 25.8 22
Northwest 145 815 147 89 107 62 11 5 23.0 20
Iowa Central 424 1,872 449 306 561 466 61 1 26.0 21
Iowa Valley 141 1,326 276 159 232 175 21 1 24.5 21
Hawkeye 60 1,863 482 208 237 165 15 0 23.9 21
Eastern Iowa 220 2,671 1,003 727 981 683 72 0 27.0 23
Kirkwood 169 2,963 1,247 912 1,147 681 71 1 26.9 24
Des Moines Area 403 4,728 1,924 1,278 1,625 1,073 149 3 26.7 23
Western Iowa Tech 323 1,886 665 432 581 425 50 7 25.9 22
Iowa Western 81 2,426 766 448 644 382 27 3 25.6 22
Southwestern 188 617 133 105 166 123 9 0 24.9 21
Indian Hills 105 1,422 512 366 495 403 42 6 27.2 23
Southeastern 184 975 288 194 274 197 19 1 25.5 22
Total 2,912 27,528 8,856 5,854 7,997 5,533 650 29 25.6 22
Table 4-6: Numbers of Students by Age Range FY 2011
College 14-17 18-22 23-26 27-30 31-39 40-55 Over 55 Unknown Mean Median
Northeast Iowa 185 1,506 447 291 387 339 43 8 26.1 22
North Iowa Area 108 1,500 257 155 281 218 20 1 24.7 20
Iowa Lakes 183 924 257 207 262 203 27 5 25.9 22
Northwest 81 697 138 103 117 95 14 11 24.5 21
Iowa Central 401 1,873 480 387 606 486 47 22 26.1 22
Iowa Valley 124 1,263 232 168 263 208 14 3 25.1 21
Hawkeye 60 1,638 420 223 256 164 12 0 24.3 21
Eastern Iowa 213 2,799 1,014 697 963 660 65 0 26.7 23
Kirkwood 133 2,994 1,245 924 1,150 755 63 1 27.1 24
Des Moines Area 337 4,501 1,808 1,260 1,512 1,014 100 3 26.6 23
Western Iowa Tech 264 1,773 667 429 623 437 46 4 26.4 23
Iowa Western 82 2,012 604 393 512 333 24 0 25.7 22
Southwestern 169 735 143 105 183 139 14 0 25.1 21
Indian Hills 109 1,428 475 387 546 427 41 4 27.4 24
Southeastern 160 937 294 231 288 222 20 2 26.1 22
Total 2,609 26,580 8,481 5,960 7,949 5,700 550 64 25.9 22
Tables, Section 4 | 5
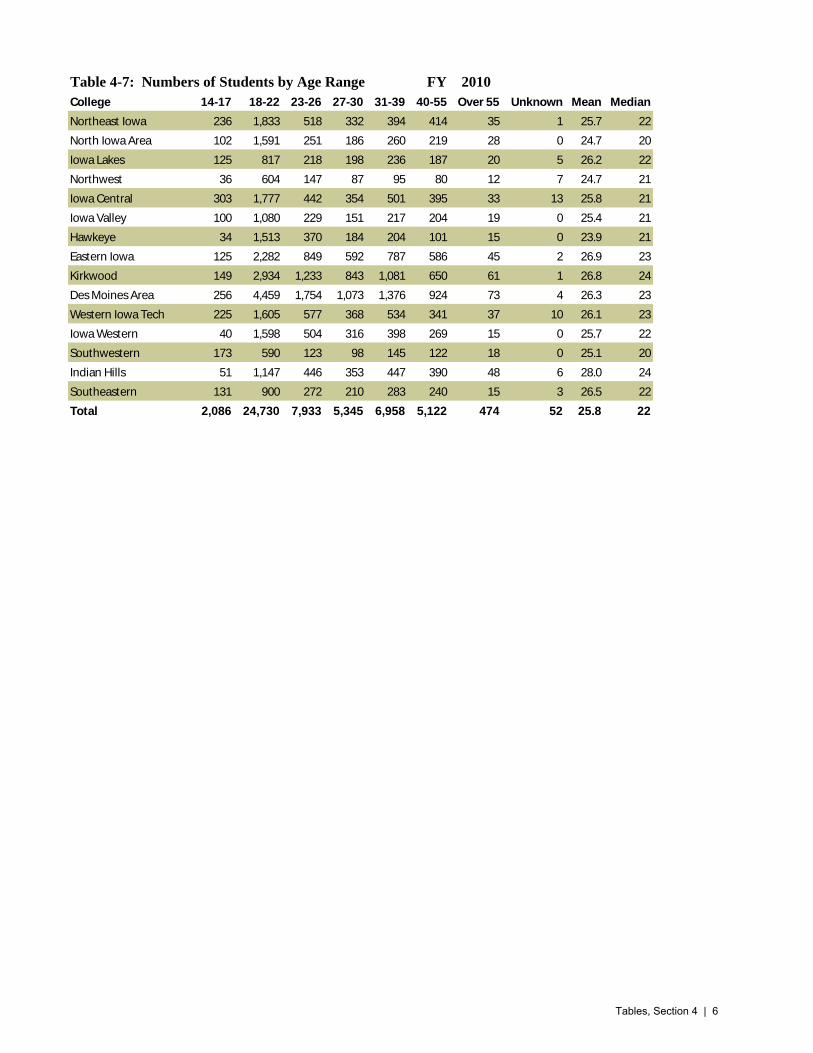
Table 4-7: Numbers of Students by Age Range FY 2010
College 14-17 18-22 23-26 27-30 31-39 40-55 Over 55 Unknown Mean Median
Northeast Iowa 236 1,833 518 332 394 414 35 1 25.7 22
North Iowa Area 102 1,591 251 186 260 219 28 0 24.7 20
Iowa Lakes 125 817 218 198 236 187 20 5 26.2 22
Northwest 36 604 147 87 95 80 12 7 24.7 21
Iowa Central 303 1,777 442 354 501 395 33 13 25.8 21
Iowa Valley 100 1,080 229 151 217 204 19 0 25.4 21
Hawkeye 34 1,513 370 184 204 101 15 0 23.9 21
Eastern Iowa 125 2,282 849 592 787 586 45 2 26.9 23
Kirkwood 149 2,934 1,233 843 1,081 650 61 1 26.8 24
Des Moines Area 256 4,459 1,754 1,073 1,376 924 73 4 26.3 23
Western Iowa Tech 225 1,605 577 368 534 341 37 10 26.1 23
Iowa Western 40 1,598 504 316 398 269 15 0 25.7 22
Southwestern 173 590 123 98 145 122 18 0 25.1 20
Indian Hills 51 1,147 446 353 447 390 48 6 28.0 24
Southeastern 131 900 272 210 283 240 15 3 26.5 22
Total 2,086 24,730 7,933 5,345 6,958 5,122 474 52 25.8 22
Tables, Section 4 | 6

Table 4-9: OL Enrollment by Sex FY 2014
College Total Male (%) Female (%) Not Reported (%)
Northeast Iowa 3,057 29.6 70.4 0.0
North Iowa Area 2,197 42.7 57.3 0.0
Iowa Lakes 1,710 32.5 67.5 0.0
Northwest 1,624 33.9 66.1 0.0
Iowa Central 3,244 35.2 64.8 0.0
Iowa Valley 2,502 37.6 62.4 0.1
Hawkeye 3,743 33.6 66.4 0.0
Eastern Iowa 5,620 32.6 67.4 0.0
Kirkwood 6,752 36.5 63.5 0.0
Des Moines Area 11,010 36.4 63.6 0.0
Western Iowa Tech 4,343 31.6 68.4 0.0
Iowa Western 4,768 38.0 62.0 0.0
Southwestern 1,101 30.9 69.1 0.0
Indian Hills 2,593 32.0 67.7 0.3
Southeastern 1,757 32.4 67.6 0.0
Total 56,021 34.9 65.1 0.0
Table 4-10: OL Enrollment by Sex FY 2013
College Total Male (%) Female (%) Not Reported (%)
Northeast Iowa 3,189 28.4 71.6 0.0
North Iowa Area 2,462 41.5 58.5 0.0
Iowa Lakes 1,905 33.5 66.5 0.0
Northwest 1,625 33.0 67.0 0.0
Iowa Central 4,157 35.0 65.0 0.0
Iowa Valley 2,455 36.3 63.6 0.1
Hawkeye 3,452 31.0 69.0 0.0
Eastern Iowa 5,752 32.4 67.6 0.0
Kirkwood 6,880 34.3 65.7 0.0
Des Moines Area 10,793 35.5 64.5 0.0
Western Iowa Tech 4,031 30.2 69.8 0.0
Iowa Western 4,889 38.2 61.8 0.0
Southwestern 1,313 30.8 69.2 0.0
Indian Hills 3,128 30.8 69.1 0.2
Southeastern 2,100 38.4 61.6 0.0
Total 58,131 34.1 65.9 0.0
Tables, Section 4 | 7

Table 4-11: OL Enrollment by Sex FY 2012
College Total Male (%) Female (%) Not Reported (%)
Northeast Iowa 3,269 28.3 71.7 0.0
North Iowa Area 2,577 43.1 56.9 0.0
Iowa Lakes 1,930 29.6 70.4 0.0
Northwest 1,381 34.2 65.8 0.0
Iowa Central 4,140 35.7 64.3 0.0
Iowa Valley 2,331 36.0 63.9 0.0
Hawkeye 3,030 30.7 69.3 0.0
Eastern Iowa 6,357 32.0 68.0 0.0
Kirkwood 7,191 32.7 67.3 0.0
Des Moines Area 11,183 34.8 65.2 0.0
Western Iowa Tech 4,369 29.7 70.3 0.0
Iowa Western 4,777 37.0 62.9 0.1
Southwestern 1,341 30.1 69.9 0.0
Indian Hills 3,351 31.1 68.6 0.3
Southeastern 2,132 31.4 68.6 0.0
Total 59,359 33.3 66.6 0.0
Table 4-12: OL Enrollment by Sex FY 2011
College Total Male (%) Female (%) Not Reported (%)
Northeast Iowa 3,206 28.1 71.9 0.0
North Iowa Area 2,540 43.5 56.5 0.0
Iowa Lakes 2,068 32.1 67.8 0.0
Northwest 1,256 32.0 68.0 0.0
Iowa Central 4,302 34.2 65.8 0.0
Iowa Valley 2,275 35.6 64.4 0.1
Hawkeye 2,773 34.1 65.9 0.0
Eastern Iowa 6,411 31.3 68.7 0.0
Kirkwood 7,265 32.9 67.1 0.0
Des Moines Area 10,535 34.7 65.3 0.0
Western Iowa Tech 4,243 29.2 70.8 0.0
Iowa Western 3,960 35.5 64.5 0.0
Southwestern 1,488 31.4 68.6 0.0
Indian Hills 3,417 29.1 70.2 0.8
Southeastern 2,154 33.3 66.7 0.0
Total 57,893 33.1 66.8 0.1
Tables, Section 4 | 8

Table 4-13: OL Enrollment by Sex FY 2010
College Total Male (%) Female (%) Not Reported (%)
Northeast Iowa 3,763 33.7 66.3 0.0
North Iowa Area 2,637 46.9 53.1 0.0
Iowa Lakes 1,806 31.9 67.6 0.5
Northwest 1,068 30.6 69.4 0.0
Iowa Central 3,818 36.5 63.5 0.0
Iowa Valley 2,000 35.8 64.3 0.0
Hawkeye 2,421 34.7 65.3 0.0
Eastern Iowa 5,268 31.7 68.3 0.0
Kirkwood 6,952 34.6 65.2 0.1
Des Moines Area 9,919 34.9 65.1 0.0
Western Iowa Tech 3,697 29.0 70.1 0.9
Iowa Western 3,140 34.9 65.1 0.0
Southwestern 1,269 28.8 71.2 0.0
Indian Hills 2,888 27.0 72.5 0.5
Southeastern 2,054 30.7 69.3 0.0
Total 52,700 33.9 66.0 0.1
Tables, Section 4 | 9

Online Enrollment by
Joint Enrollment Type
Table 4-14: OL Enrollment by Joint Enrollment FY 2014
College
Enrollment in
One or More
Online Courses
% of Total Joint
Enrollment
Credit Hours
Delivered Online
% of Total Joint
Enrollment Credit
Hours
Northeast Iowa 463 16.8 2,263 10.9
North Iowa Area 325 25.1 1,630 16.4
Iowa Lakes 352 28.3 2,080 19.0
Northwest 557 61.6 3,726 57.9
Iowa Central 807 32.7 3,736 18.3
Iowa Valley 427 33.0 2,527 23.9
Hawkeye 372 17.7 1,879 14.8
Eastern Iowa 468 10.3 2,639 9.5
Kirkwood 380 8.7 1,802 6.3
Des Moines Area 1,418 10.2 7,464 6.2
Western Iowa Tech 854 34.1 4,976 26.5
Iowa Western 333 16.2 1,630 8.9
Southwestern 375 52.5 2,102 31.7
Indian Hills 323 18.8 1,269 8.3
Southeastern 381 33.2 2,258 26.0
Total 7,835 18.2 41,980 12.5
Table 4-15: OL Enrollment by Joint Enrollment FY 2013
College
Enrollment in
One or More
Online Courses
% of Total Joint
Enrollment
Credit Hours
Delivered Online
% of Total Joint
Enrollment Credit
Hours
Northeast Iowa 471 17.9 2,257 11.0
North Iowa Area 335 29.5 1,801 18.8
Iowa Lakes 300 23.2 1,723 15.5
Northwest 478 63.2 3,169 58.0
Iowa Central 917 34.2 3,920 17.9
Iowa Valley 394 36.4 2,236 25.0
Hawkeye 230 12.3 1,072 10.0
Eastern Iowa 456 11.9 2,488 10.8
Kirkwood 331 8.2 1,557 6.3
Des Moines Area 1,210 9.1 6,232 5.6
Western Iowa Tech 594 28.1 3,365 24.8
Iowa Western 249 11.5 1,400 7.0
Southwestern 379 53.7 2,101 31.8
Indian Hills 254 15.9 1,100 7.8
Southeastern 412 39.5 2,588 32.9
Total 7,010 17.4 37,009 11.9
Tables, Section 4 | 10
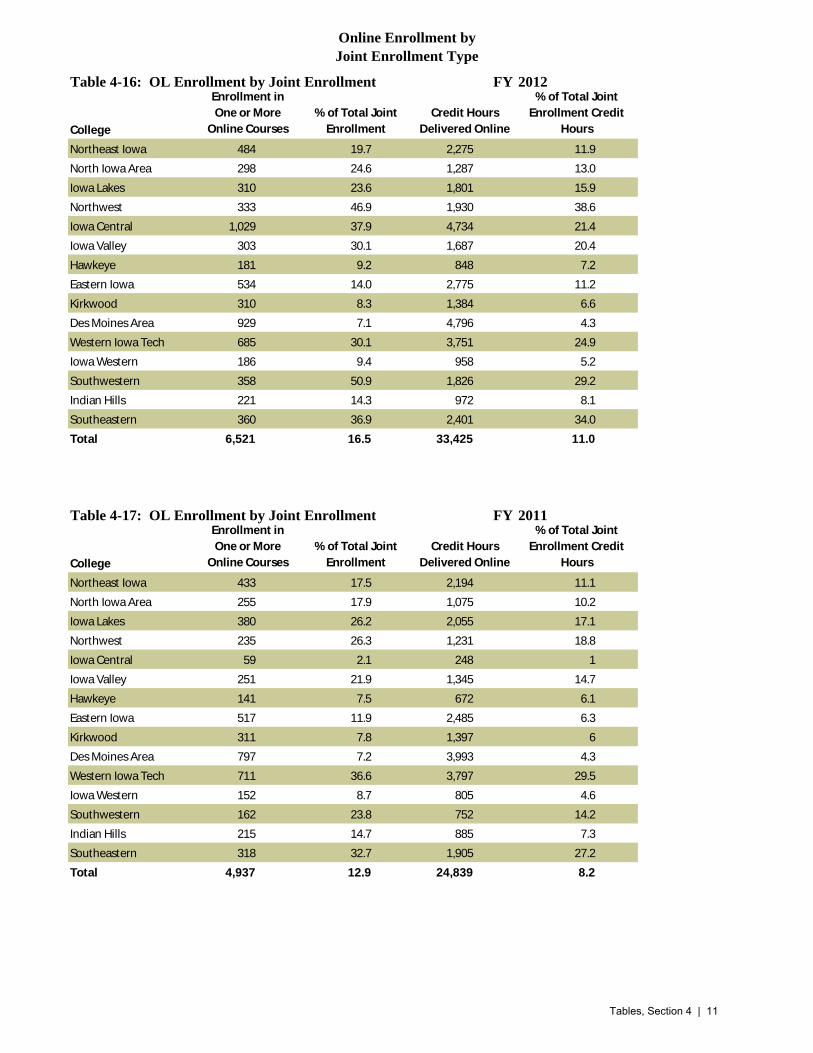
Online Enrollment by
Joint Enrollment Type
Table 4-16: OL Enrollment by Joint Enrollment FY 2012
College
Enrollment in
One or More
Online Courses
% of Total Joint
Enrollment
Credit Hours
Delivered Online
% of Total Joint
Enrollment Credit
Hours
Northeast Iowa 484 19.7 2,275 11.9
North Iowa Area 298 24.6 1,287 13.0
Iowa Lakes 310 23.6 1,801 15.9
Northwest 333 46.9 1,930 38.6
Iowa Central 1,029 37.9 4,734 21.4
Iowa Valley 303 30.1 1,687 20.4
Hawkeye 181 9.2 848 7.2
Eastern Iowa 534 14.0 2,775 11.2
Kirkwood 310 8.3 1,384 6.6
Des Moines Area 929 7.1 4,796 4.3
Western Iowa Tech 685 30.1 3,751 24.9
Iowa Western 186 9.4 958 5.2
Southwestern 358 50.9 1,826 29.2
Indian Hills 221 14.3 972 8.1
Southeastern 360 36.9 2,401 34.0
Total 6,521 16.5 33,425 11.0
Table 4-17: OL Enrollment by Joint Enrollment FY 2011
College
Enrollment in
One or More
Online Courses
% of Total Joint
Enrollment
Credit Hours
Delivered Online
% of Total Joint
Enrollment Credit
Hours
Northeast Iowa 433 17.5 2,194 11.1
North Iowa Area 255 17.9 1,075 10.2
Iowa Lakes 380 26.2 2,055 17.1
Northwest 235 26.3 1,231 18.8
Iowa Central 59 2.1 248 1
Iowa Valley 251 21.9 1,345 14.7
Hawkeye 141 7.5 672 6.1
Eastern Iowa 517 11.9 2,485 6.3
Kirkwood 311 7.8 1,397 6
Des Moines Area 797 7.2 3,993 4.3
Western Iowa Tech 711 36.6 3,797 29.5
Iowa Western 152 8.7 805 4.6
Southwestern 162 23.8 752 14.2
Indian Hills 215 14.7 885 7.3
Southeastern 318 32.7 1,905 27.2
Total 4,937 12.9 24,839 8.2
Tables, Section 4 | 11
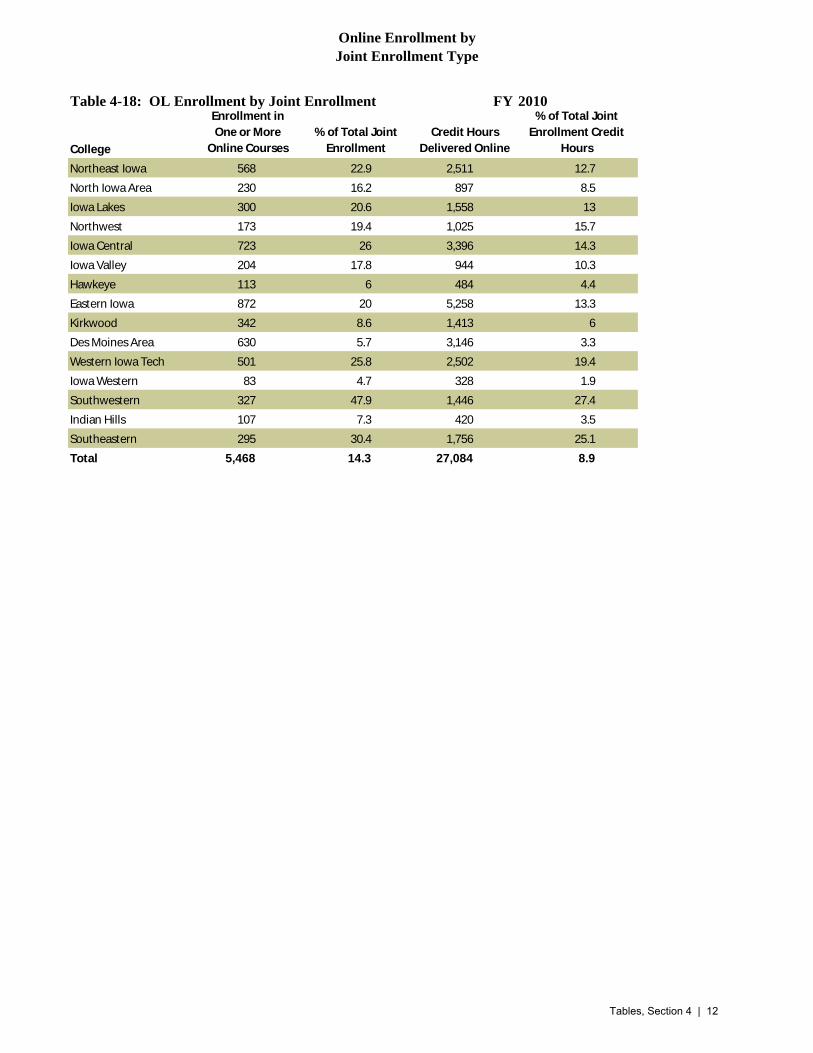
Online Enrollment by
Joint Enrollment Type
Table 4-18: OL Enrollment by Joint Enrollment FY 2010
College
Enrollment in
One or More
Online Courses
% of Total Joint
Enrollment
Credit Hours
Delivered Online
% of Total Joint
Enrollment Credit
Hours
Northeast Iowa 568 22.9 2,511 12.7
North Iowa Area 230 16.2 897 8.5
Iowa Lakes 300 20.6 1,558 13
Northwest 173 19.4 1,025 15.7
Iowa Central 723 26 3,396 14.3
Iowa Valley 204 17.8 944 10.3
Hawkeye 113 6 484 4.4
Eastern Iowa 872 20 5,258 13.3
Kirkwood 342 8.6 1,413 6
Des Moines Area 630 5.7 3,146 3.3
Western Iowa Tech 501 25.8 2,502 19.4
Iowa Western 83 4.7 328 1.9
Southwestern 327 47.9 1,446 27.4
Indian Hills 107 7.3 420 3.5
Southeastern 295 30.4 1,756 25.1
Total 5,468 14.3 27,084 8.9
Tables, Section 4 | 12

Table 4-19: Students Enrolled in Online Courses by Program and College
FY 2014
College Arts & Sciences Career Option Career & Technical Combination Total
Northeast 1,679 0 1,334 44 3,057
North Iowa Area 1,637 35 525 0 2,197
Iowa Lakes 1,081 304 288 37 1,710
Northwest Iowa 1,349 53 189 33 1,624
Iowa Central 2,135 635 425 49 3,244
Iowa Valley 2,048 85 369 0 2,502
Hawkeye 3,016 0 675 52 3,743
Eastern Iowa 3,691 0 1,825 104 5,620
Kirkwood 3,930 97 2,610 115 6,752
Des Moines Area 8,262 1,199 1,378 171 11,010
Western Iowa Tech 2,652 4 1,687 0 4,343
Iowa Western 3,319 0 1,397 52 4,768
Southwestern 908 3 171 19 1,101
Indian Hills 1,121 2 1,388 82 2,593
Southeastern 1,376 139 242 0 1,757
Total 38,204 2,556 14,503 758 56,021
Table 4-20: Students Enrolled in Online Courses by Program and College
FY 2013
College Arts & Sciences Career Option Career & Technical Combination Total
Northeast 1,733 0 1,414 42 3,189
North Iowa Area 1,885 188 296 93 2,462
Iowa Lakes 1,153 376 327 49 1,905
Northwest Iowa 1,323 59 227 16 1,625
Iowa Central 2,723 831 538 65 4,157
Iowa Valley 2,039 109 307 0 2,455
Hawkeye 2,752 0 667 33 3,452
Eastern Iowa 3,795 0 1,831 126 5,752
Kirkwood 3,862 239 2,641 138 6,880
Des Moines Area 7,987 1,359 1,354 93 10,793
Western Iowa Tech 2,411 0 1,620 0 4,031
Iowa Western 3,329 0 1,505 55 4,889
Southwestern 1,116 47 148 2 1,313
Indian Hills 1,498 3 1,458 169 3,128
Southeastern 1,592 155 353 0 2,100
Total 39,198 3,366 14,686 881 58,131
Tables, Section 4 | 13

Table 4-21: Students Enrolled in Online Courses by Program and College
FY 2012
College Arts & Sciences Career Option Career & Technical Combination Total
Northeast 1,781 0 1,455 33 3,269
North Iowa Area 1,855 312 298 112 2,577
Iowa Lakes 1,177 355 354 44 1,930
Northwest Iowa 1,089 60 216 16 1,381
Iowa Central 2,783 692 593 72 4,140
Iowa Valley 1,945 120 266 0 2,331
Hawkeye 2,440 0 555 35 3,030
Eastern Iowa 4,058 0 2,153 146 6,357
Kirkwood 3,793 349 2,888 161 7,191
Des Moines Area 8,063 1,581 1,393 146 11,183
Western Iowa Tech 2,465 0 1,904 0 4,369
Iowa Western 3,280 0 1,442 55 4,777
Southwestern 1,074 112 122 33 1,341
Indian Hills 1,688 10 1,489 164 3,351
Southeastern 1,653 151 328 0 2,132
Total 39,144 3,742 15,456 1,017 59,359
Table 4-22: Students Enrolled in Online Courses by Program and College
FY 2011
College Arts & Sciences Career Option Career & Technical Combination Total
Northeast 1,619 0 1,537 50 3,206
North Iowa Area 1,783 383 273 101 2,540
Iowa Lakes 1,188 387 430 63 2,068
Northwest Iowa 945 56 230 25 1,256
Iowa Central 2,814 778 620 90 4,302
Iowa Valley 1,816 129 330 0 2,275
Hawkeye 2,004 0 743 26 2,773
Eastern Iowa 4,117 5 2,154 135 6,411
Kirkwood 3,991 326 2,815 133 7,265
Des Moines Area 7,530 1,482 1,307 216 10,535
Western Iowa Tech 2,240 36 1,967 0 4,243
Iowa Western 2,610 1 1,294 55 3,960
Southwestern 1,184 115 161 28 1,488
Indian Hills 1,552 13 1,607 245 3,417
Southeastern 1,594 176 384 0 2,154
Total 36,987 3,887 15,852 1,167 57,893
Tables, Section 4 | 14

Table 4-23: Students Enrolled in Online Courses by Program and College
FY 2010
College Arts & Sciences Career Option Career & Technical Combination Total
Northeast 1,902 0 1,720 141 3,763
North Iowa Area 1,715 373 301 248 2,637
Iowa Lakes 951 352 385 118 1,806
Northwest Iowa 810 44 169 45 1,068
Iowa Central 2,403 608 628 179 3,818
Iowa Valley 1,543 144 313 0 2,000
Hawkeye 1,691 0 639 91 2,421
Eastern Iowa 3,358 0 1,702 208 5,268
Kirkwood 3,856 204 2,532 360 6,952
Des Moines Area 6,890 1,293 1,176 560 9,919
Western Iowa Tech 1,893 28 1,776 0 3,697
Iowa Western 2,037 4 994 105 3,140
Southwestern 1,001 98 113 57 1,269
Indian Hills 1,169 10 1,299 410 2,888
Southeastern 1,609 141 304 0 2,054
Total 32,828 3,299 14,051 2,522 52,700
Tables, Section 4 | 15

Table 4-24: Online Enrollment by Subpopulation FY 2014
College
American
Indian Asian Black Hispanic
Pac.
Island White Not Given
Two or
more Total
Northeast Iowa 7 20 85 47 2 2,782 96 18 3,057
North Iowa Area 4 36 116 110 0 1,898 5 28 2,197
Iowa Lakes 9 100 78 46 7 1,424 41 5 1,710
Northwest 6 29 16 62 1 1,419 66 25 1,624
Iowa Central 15 32 402 147 2 2,420 194 32 3,244
Iowa Valley 42 186 133 176 0 1,690 275 0 2,502
Hawkeye 17 123 298 92 3 3,166 0 44 3,743
Eastern Iowa 29 135 340 389 10 4,365 245 107 5,620
Kirkwood 32 403 414 196 2 4,958 631 116 6,752
Des Moines Area 32 313 644 422 9 8,773 622 195 11,010
Western Iowa Tech 67 90 105 367 8 3,398 242 66 4,343
Iowa Western 67 168 360 244 12 3,680 227 10 4,768
Southwestern 3 14 23 41 1 986 11 22 1,101
Indian Hills 10 24 158 90 1 2,167 109 34 2,593
Southeastern 15 17 50 65 2 1,518 37 53 1,757
Total 355 1,690 3,222 2,494 60 44,644 2,801 755 56,021
Table 4-25: Online Enrollment by Subpopulation FY 2013
College
American
Indian Asian Black Hispanic
Pac.
Island White Not Given
Two or
more Total
Northeast Iowa 11 22 101 54 5 2,880 96 20 3,189
North Iowa Area 5 32 128 116 1 2,126 23 31 2,462
Iowa Lakes 12 113 80 49 0 1,596 51 4 1,905
Northwest 7 19 9 52 0 1,453 69 16 1,625
Iowa Central 12 43 512 167 11 3,158 225 29 4,157
Iowa Valley 45 184 135 155 3 1,665 255 13 2,455
Hawkeye 10 90 257 71 2 2,983 1 38 3,452
Eastern Iowa 37 160 373 361 10 4,454 275 82 5,752
Kirkwood 40 377 444 202 3 5,134 588 92 6,880
Des Moines Area 33 276 691 409 6 8,482 718 178 10,793
Western Iowa Tech 65 67 81 252 4 3,105 390 67 4,031
Iowa Western 64 160 366 242 10 3,930 108 9 4,889
Southwestern 5 13 24 49 1 1,192 4 25 1,313
Indian Hills 18 31 138 63 3 2,688 138 49 3,128
Southeastern 14 24 104 85 0 1,770 43 60 2,100
Total 378 1,611 3,443 2,327 59 46,616 2,984 713 58,131
Tables, Section 4 | 16

Table 4-26: Online Enrollment by Subpopulation FY 2012
College
American
Indian Asian Black Hispanic
Pac.
Island White Not Given
Two or
more Total
Northeast Iowa 10 14 76 61 2 2,960 121 25 3,269
North Iowa Area 9 33 119 100 1 2,257 22 36 2,577
Iowa Lakes 6 83 86 40 0 1,638 72 5 1,930
Northwest 6 12 18 26 1 1,237 60 21 1,381
Iowa Central 8 54 402 147 6 3,297 183 43 4,140
Iowa Valley 33 167 113 137 2 1,643 213 23 2,331
Hawkeye 9 62 206 60 5 2,657 3 28 3,030
Eastern Iowa 40 212 436 381 11 4,929 284 64 6,357
Kirkwood 36 226 267 91 0 3,839 2,720 12 7,191
Des Moines Area 38 315 1,082 390 10 8,385 794 169 11,183
Western Iowa Tech 72 65 104 252 4 3,324 478 70 4,369
Iowa Western 59 148 345 167 14 3,915 124 5 4,777
Southwestern 2 8 23 33 0 1,236 20 19 1,341
Indian Hills 21 32 113 67 1 2,863 229 25 3,351
Southeastern 8 22 78 60 2 1,891 41 30 2,132
Total 357 1,453 3,468 2,012 59 46,071 5,364 575 59,359
Table 4-27: Online Enrollment by Subpopulation FY 2011
College
American
Indian Asian Black Hispanic
Pac.
Island White Not Given
Two or
more Total
Northeast Iowa 5 14 66 43 0 2,918 136 24 3,206
North Iowa Area 13 29 124 76 2 2,195 77 24 2,540
Iowa Lakes 6 67 97 37 0 1,796 64 1 2,068
Northwest 6 11 9 31 0 1,139 46 14 1,256
Iowa Central 10 60 443 132 4 3,384 228 41 4,302
Iowa Valley 30 125 114 124 4 1,567 299 12 2,275
Hawkeye 9 47 238 43 4 2,409 1 22 2,773
Eastern Iowa 48 251 371 336 11 5,077 263 54 6,411
Kirkwood 34 184 291 91 1 3,944 2,717 3 7,265
Des Moines Area 54 320 877 302 5 7,895 983 99 10,535
Western Iowa Tech 104 62 110 217 3 3,345 402 0 4,243
Iowa Western 46 67 238 103 8 3,388 92 18 3,960
Southwestern 7 11 27 27 1 1,374 19 22 1,488
Indian Hills 32 24 99 65 0 3,000 189 8 3,417
Southeastern 12 19 66 67 4 1,915 53 18 2,154
Total 416 1,291 3,170 1,694 47 45,346 5,569 360 57,893
Tables, Section 4 | 17

Table 4-28: Online Enrollment by Subpopulation FY 2010
College
American
Indian Asian Black Hispanic
Pac.
Island White Not Given
Two or
more Total
Northeast Iowa 13 8 92 56 1 3,376 184 33 3,763
North Iowa Area 6 28 97 67 1 2,258 174 6 2,637
Iowa Lakes 4 35 58 26 0 1,630 52 1 1,806
Northwest 4 3 3 15 0 994 34 15 1,068
Iowa Central 6 59 257 96 9 3,231 135 25 3,818
Iowa Valley 26 31 100 91 2 1,464 274 12 2,000
Hawkeye 8 37 181 39 1 2,145 5 5 2,421
Eastern Iowa 36 138 272 260 4 4,287 256 15 5,268
Kirkwood 31 159 400 108 0 4,370 1,884 0 6,952
Des Moines Area 52 347 538 307 2 7,815 814 44 9,919
Western Iowa Tech 57 43 58 141 0 3,023 343 32 3,697
Iowa Western 18 34 142 80 6 2,737 102 21 3,140
Southwestern 6 13 15 25 0 1,184 19 7 1,269
Indian Hills 25 22 54 58 0 2,624 105 0 2,888
Southeastern 5 12 39 37 3 918 1,040 0 2,054
Total 297 969 2,306 1,406 29 42,056 5,421 216 52,700
Tables, Section 4 | 18
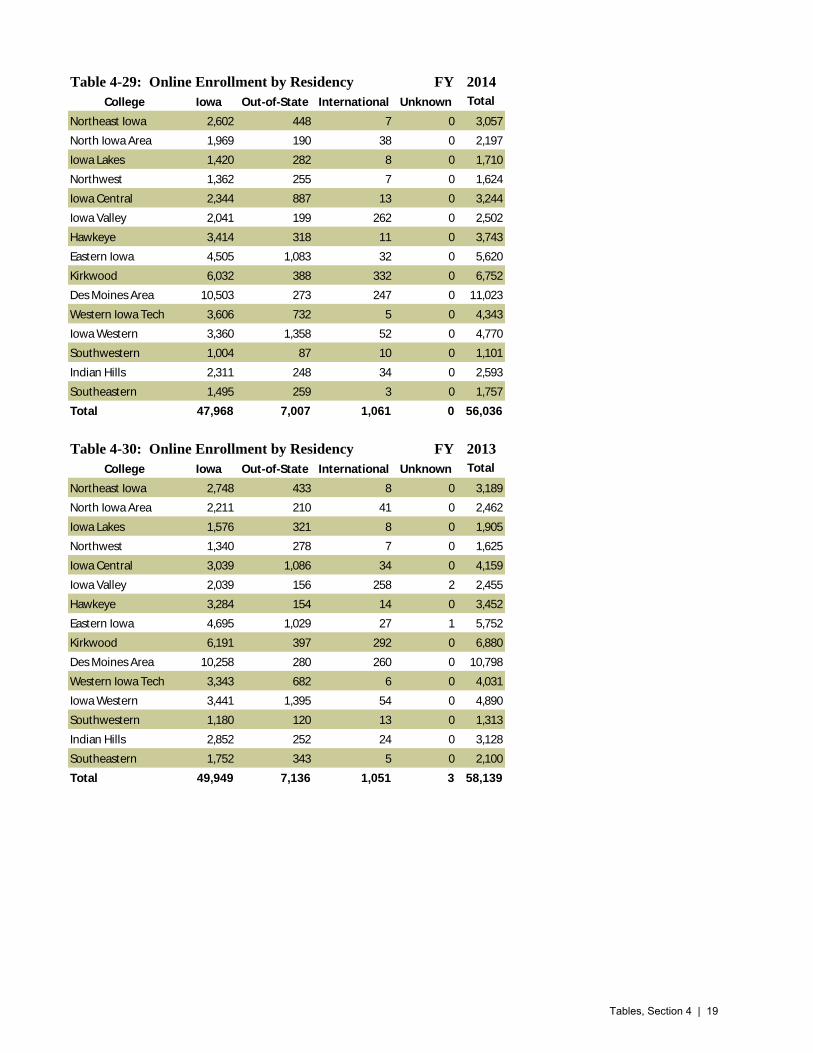
Table 4-29: Online Enrollment by Residency FY 2014
College Iowa Out-of-State International Unknown Total
Northeast Iowa 2,602 448 7 0 3,057
North Iowa Area 1,969 190 38 0 2,197
Iowa Lakes 1,420 282 8 0 1,710
Northwest 1,362 255 7 0 1,624
Iowa Central 2,344 887 13 0 3,244
Iowa Valley 2,041 199 262 0 2,502
Hawkeye 3,414 318 11 0 3,743
Eastern Iowa 4,505 1,083 32 0 5,620
Kirkwood 6,032 388 332 0 6,752
Des Moines Area 10,503 273 247 0 11,023
Western Iowa Tech 3,606 732 5 0 4,343
Iowa Western 3,360 1,358 52 0 4,770
Southwestern 1,004 87 10 0 1,101
Indian Hills 2,311 248 34 0 2,593
Southeastern 1,495 259 3 0 1,757
Total 47,968 7,007 1,061 0 56,036
Table 4-30: Online Enrollment by Residency FY 2013
College Iowa Out-of-State International Unknown Total
Northeast Iowa 2,748 433 8 0 3,189
North Iowa Area 2,211 210 41 0 2,462
Iowa Lakes 1,576 321 8 0 1,905
Northwest 1,340 278 7 0 1,625
Iowa Central 3,039 1,086 34 0 4,159
Iowa Valley 2,039 156 258 2 2,455
Hawkeye 3,284 154 14 0 3,452
Eastern Iowa 4,695 1,029 27 1 5,752
Kirkwood 6,191 397 292 0 6,880
Des Moines Area 10,258 280 260 0 10,798
Western Iowa Tech 3,343 682 6 0 4,031
Iowa Western 3,441 1,395 54 0 4,890
Southwestern 1,180 120 13 0 1,313
Indian Hills 2,852 252 24 0 3,128
Southeastern 1,752 343 5 0 2,100
Total 49,949 7,136 1,051 3 58,139
Tables, Section 4 | 19

Table 4-31: Online Enrollment by Residency FY 2012
College Iowa Out-of-State International Unknown Total
Northeast Iowa 2,840 425 4 0 3,269
North Iowa Area 2,344 207 26 0 2,577
Iowa Lakes 1,591 334 5 0 1,930
Northwest 1,149 226 6 0 1,381
Iowa Central 3,293 827 22 0 4,142
Iowa Valley 1,962 145 223 1 2,331
Hawkeye 2,923 87 20 0 3,030
Eastern Iowa 5,242 1,087 28 0 6,357
Kirkwood 6,650 366 175 0 7,191
Des Moines Area 10,426 534 230 0 11,190
Western Iowa Tech 3,607 755 7 0 4,369
Iowa Western 3,299 1,409 70 0 4,778
Southwestern 1,247 85 9 0 1,341
Indian Hills 3,096 234 21 0 3,351
Southeastern 1,754 366 12 0 2,132
Total 51,423 7,087 858 1 59,369
Table 4-32: Online Enrollment by Residency FY 2011
College Iowa Out-of-State International Unknown Total
Northeast Iowa 2,775 428 3 0 3,206
North Iowa Area 2,335 176 29 0 2,540
Iowa Lakes 1,732 323 13 0 2,068
Northwest 1,073 182 1 0 1,256
Iowa Central 3,310 955 39 0 4,304
Iowa Valley 1,949 150 176 0 2,275
Hawkeye 2,686 51 36 0 2,773
Eastern Iowa 5,350 1,027 34 0 6,411
Kirkwood 6,715 418 132 0 7,265
Des Moines Area 9,869 413 261 0 10,543
Western Iowa Tech 3,505 727 11 0 4,243
Iowa Western 2,800 1,065 95 0 3,960
Southwestern 1,392 0 3 0 1,395
Indian Hills 3,148 244 25 93 3,510
Southeastern 1,760 389 5 0 2,154
Total 50,399 6,548 863 93 57,903
Tables, Section 4 | 20

Table 4-33: Online Enrollment by Residency FY 2010
College Iowa Out-of-State International Unknown Total
Northeast Iowa 3,334 420 9 0 3,763
North Iowa Area 2,453 155 29 0 2,637
Iowa Lakes 1,531 270 5 0 1,806
Northwest 943 125 0 0 1,068
Iowa Central 3,068 711 42 0 3,821
Iowa Valley 1,783 109 108 0 2,000
Hawkeye 2,365 36 20 0 2,421
Eastern Iowa 4,552 681 35 0 5,268
Kirkwood 6,369 488 95 0 6,952
Des Moines Area 9,461 237 231 0 9,929
Western Iowa Tech 3,120 577 0 0 3,697
Iowa Western 2,343 723 75 0 3,141
Southwestern 1,190 75 4 0 1,269
Indian Hills 2,666 202 20 0 2,888
Southeastern 1,696 349 9 0 2,054
Total 46,874 5,158 682 0 52,714
Tables, Section 4 | 21

Tables, Joint Enrollment and Demographics 5
Table of Contents
5-1. Number of Students................................................................................................................2
5-2. Number of Credit Hours.........................................................................................................2
5-3. Average Credit Hours Per Student..........................................................................................3
5-4. Joint Enrollment As Percent of Total Enrollment...................................................................3
5-5--5-9. Offering Arrangement, Latest Five Years...................................................................4-6
5-10. Distribution by Type of Arrangement..................................................................................7
5-11. Distribution by Type of Arrangement and Gender...............................................................7
5-12. Gender of Jointly Enrolled Students, Latest Five Years...................................................8-9
5-13--5-17. Race and Ethnicity, Latest Five Years.................................................................10-12
5-18--5-22. Residency, Latest Five Years...............................................................................13-15
5-23--5-26. Grade Level of Jointly Enrolled Students, Latest Three Years...........................15-16
Tables, Section 5 | 1
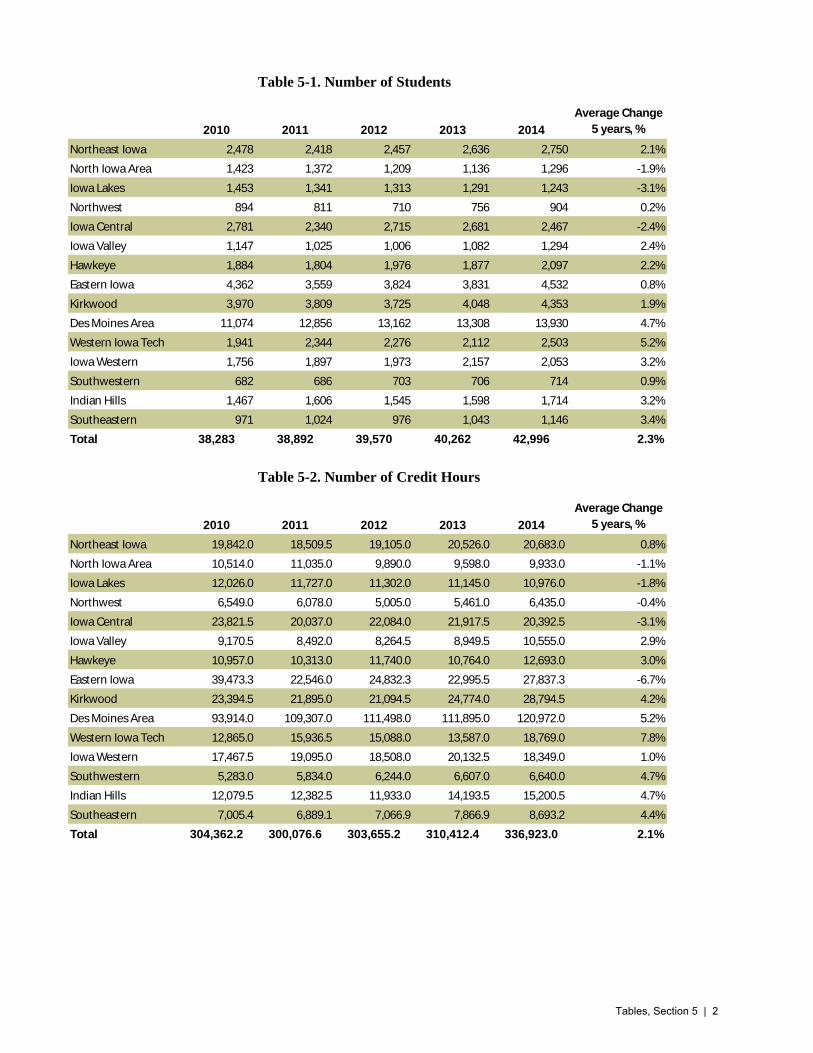
Table 5-1. Number of Students 2013
2010 2011 2012 2013 2014
Average Change
5 years, %
Northeast Iowa 2,478 2,418 2,457 2,636 2,750 2.1%
North Iowa Area 1,423 1,372 1,209 1,136 1,296 -1.9%
Iowa Lakes 1,453 1,341 1,313 1,291 1,243 -3.1%
Northwest 894 811 710 756 904 0.2%
Iowa Central 2,781 2,340 2,715 2,681 2,467 -2.4%
Iowa Valley 1,147 1,025 1,006 1,082 1,294 2.4%
Hawkeye 1,884 1,804 1,976 1,877 2,097 2.2%
Eastern Iowa 4,362 3,559 3,824 3,831 4,532 0.8%
Kirkwood 3,970 3,809 3,725 4,048 4,353 1.9%
Des Moines Area 11,074 12,856 13,162 13,308 13,930 4.7%
Western Iowa Tech 1,941 2,344 2,276 2,112 2,503 5.2%
Iowa Western 1,756 1,897 1,973 2,157 2,053 3.2%
Southwestern 682 686 703 706 714 0.9%
Indian Hills 1,467 1,606 1,545 1,598 1,714 3.2%
Southeastern 971 1,024 976 1,043 1,146 3.4%
Total 38,283 38,892 39,570 40,262 42,996 2.3%
Table 5-2. Number of Credit Hours
2010 2011 2012 2013 2014
Average Change
5 years, %
Northeast Iowa 19,842.0 18,509.5 19,105.0 20,526.0 20,683.0 0.8%
North Iowa Area 10,514.0 11,035.0 9,890.0 9,598.0 9,933.0 -1.1%
Iowa Lakes 12,026.0 11,727.0 11,302.0 11,145.0 10,976.0 -1.8%
Northwest 6,549.0 6,078.0 5,005.0 5,461.0 6,435.0 -0.4%
Iowa Central 23,821.5 20,037.0 22,084.0 21,917.5 20,392.5 -3.1%
Iowa Valley 9,170.5 8,492.0 8,264.5 8,949.5 10,555.0 2.9%
Hawkeye 10,957.0 10,313.0 11,740.0 10,764.0 12,693.0 3.0%
Eastern Iowa 39,473.3 22,546.0 24,832.3 22,995.5 27,837.3 -6.7%
Kirkwood 23,394.5 21,895.0 21,094.5 24,774.0 28,794.5 4.2%
Des Moines Area 93,914.0 109,307.0 111,498.0 111,895.0 120,972.0 5.2%
Western Iowa Tech 12,865.0 15,936.5 15,088.0 13,587.0 18,769.0 7.8%
Iowa Western 17,467.5 19,095.0 18,508.0 20,132.5 18,349.0 1.0%
Southwestern 5,283.0 5,834.0 6,244.0 6,607.0 6,640.0 4.7%
Indian Hills 12,079.5 12,382.5 11,933.0 14,193.5 15,200.5 4.7%
Southeastern 7,005.4 6,889.1 7,066.9 7,866.9 8,693.2 4.4%
Total 304,362.2 300,076.6 303,655.2 310,412.4 336,923.0 2.1%
Tables, Section 5 | 2

Table 5-3. Average Credit Hours Per Student
College 2010 2011 2012 2013 2014
Average
Change
5 years,
%
Northeast Iowa 8.0 7.7 7.8 7.8 7.5 -1.3%
North Iowa Area 7.4 8.0 8.2 8.4 7.7 0.8%
Iowa Lakes 8.3 8.7 8.6 8.6 8.8 1.2%
Northwest 7.3 7.5 7.0 7.2 7.1 -0.6%
Iowa Central 8.6 8.6 8.1 8.2 8.3 -0.6%
Iowa Valley 8.0 8.3 8.2 8.3 8.2 0.5%
Hawkeye 5.8 5.7 5.9 5.7 6.1 1.0%
Eastern Iowa 9.0 6.3 6.5 6.0 6.1 -7.6%
Kirkwood 5.9 5.7 5.7 6.1 6.6 2.3%
Des Moines Area 8.5 8.5 8.5 8.4 8.7 0.5%
Western Iowa Tech 6.6 6.8 6.6 6.4 7.5 2.5%
Iowa Western 9.9 10.1 9.4 9.3 8.9 -2.2%
Southwestern 7.7 8.5 8.9 9.4 9.3 3.7%
Indian Hills 8.2 7.7 7.7 8.9 8.9 1.6%
Southeastern 7.2 6.7 7.2 7.5 7.6 1.0%
Total 7.5 7.7 7.7 7.7 7.8 0.9%
Table 5-4. Joint Enrollment as Percent of Total Enrollment
College
Students,
%
Credit
Hours
%
Students,
%
Credit
Hours
%
Students,
%
Credit
Hours
%
Students,
%
Credit
Hours
%
Students,
%
Credit
Hours
%
Northeast Iowa 35.5 16.8 32.3 16.4 34.0 18.4 36.7 20.3 38.4 21.8
North Iowa Area 29.8 13.1 27.5 14.1 26.0 13.3 26.7 14.3 32.3 16.1
Iowa Lakes 34.5 14.3 28.0 13.7 29.3 14.9 30.8 16.1 32.8 18.0
Northwest 38.8 18.6 32.0 17.0 29.0 14.6 29.1 15.5 34.4 19.0
Iowa Central 36.3 17.6 25.5 13.8 30.8 15.4 30.7 15.6 32.2 16.6
Iowa Valley 28.2 12.4 23.5 11.4 23.5 11.9 25.6 12.8 30.0 16.0
Hawkeye 22.0 7.7 18.4 7.1 20.7 8.6 20.6 8.3 22.9 10.2
Eastern Iowa 35.7 21.6 24.7 11.7 26.4 13.2 29.0 13.9 33.3 17.4
Kirkwood 16.7 5.9 14.5 5.4 14.9 5.5 17.3 7.2 19.9 9.2
Des Moines Area 33.1 19.6 33.7 21.9 34.1 22.7 36.6 24.3 37.8 26.4
Western Iowa Tech 23.7 11.6 26.6 12.7 26.0 13.5 24.7 12.8 29.3 16.9
Iowa Western 23.1 12.5 21.0 12.4 20.3 11.5 21.6 12.6 21.4 12.2
Southwestern 37.4 14.4 29.4 14.9 30.8 16.9 32.8 19.2 36.5 21.2
Indian Hills 19.3 8.9 19.8 8.9 20.8 9.5 23.0 11.7 28.6 16.2
Southeastern 22.0 8.1 20.5 8.5 21.0 10.0 23.3 11.7 28.4 14.3
Total 27.9 13.6 25.1 13.0 26.0 13.8 27.7 15.0 30.4 17.3
2010 2011 2012 2013 2014
Tables, Section 5 | 3

Table 5-5. Offering Arrangement 2010
Students
Credit
Hours Students
Credit
Hours Students
Credit
Hours Students
Credit
Hours
Northeast Iowa 407 2,300 2,255 16,873 87 670 2,749 19,842 2,478
North Iowa Area 262 1,527 1,088 7,702 198 1,285 1,548 10,514 1,423
Iowa Lakes 341 1,862 1,211 9,562 97 602 1,649 12,026 1,453
Northwest 157 804 727 5,398 80 347 964 6,549 894
Iowa Central 716 3,476 2,424 20,346 0 0 3,140 23,822 2,781
Iowa Valley 318 1,769 938 7,402 0 0 1,256 9,171 1,147
Hawkeye 279 1,572 1,678 8,770 125 615 2,082 10,957 1,884
Eastern Iowa 584 2,864 2,775 15,758 1,446 20,852 4,805 39,473 4,362
Kirkwood 716 3,647 3,224 17,116 356 2,632 4,296 23,395 3,970
Des Moines Area 698 3,779 10,129 83,416 925 6,719 11,752 93,914 11,074
Western Iowa Tech 253 1,524 1,688 11,341 0 0 1,941 12,865 1,941
Iowa Western 166 1,038 1,679 16,315 29 115 1,874 17,468 1,756
Southwestern 342 1,786 462 3,405 22 92 826 5,283 682
Indian Hills 154 813 1,333 10,885 70 382 1,557 12,080 1,467
Southeastern 261 1,533 769 4,677 123 792 1,153 7,005 971
Total 5,654 30,293 32,380 238,965 3,558 35,101 41,592 304,362 38,283
Table 5-6. Offering Arrangement 2011
Students
Credit
Hours Students
Credit
Hours Students
Credit
Hours Students
Credit
Hours
Northeast Iowa 313 1,502 2,212 16,062 99 946 2,624 18,510 2,418
North Iowa Area 236 1,496 1,045 8,083 209 1,456 1,490 11,035 1,372
Iowa Lakes 401 2,529 1,107 8,835 55 363 1,563 11,727 1,341
Northwest 131 591 712 5,285 55 202 898 6,078 811
Iowa Central 95 484 2,294 19,553 0 0 2,389 20,037 2,340
Iowa Valley 142 806 982 7,687 0 0 1,124 8,492 1,025
Hawkeye 298 1,692 1,387 6,854 453 1,767 2,138 10,313 1,804
Eastern Iowa 678 3,335 2,996 16,700 418 2,512 4,092 22,546 3,559
Kirkwood 669 3,543 3,351 18,113 28 240 4,049 21,895 3,809
Des Moines Area 733 4,105 11,986 99,651 717 5,551 13,436 109,307 12,856
Western Iowa Tech 290 1,821 2,060 14,116 0 0 2,350 15,937 2,344
Iowa Western 142 831 1,839 18,131 25 134 2,006 19,095 1,897
Southwestern 180 985 556 4,785 16 64 752 5,834 686
Indian Hills 152 733 1,465 11,306 63 344 1,680 12,383 1,606
Southeastern 0 0 957 5,973 139 916 1,096 6,889 1,024
Total 4,460 24,451 34,949 261,132 2,277 14,494 41,687 300,077 38,892
College
Unduplicated
Joint
Enrollment*
ContractedPSEO Tuition Total HS Students
*This number may be smaller than the sum of PSEO, Contracted, and Tuition, because some students take courses under multiple
arrangements.
*This number may be smaller than the sum of PSEO, Contracted, and Tuition, because some students take courses under multiple
arrangements.
Unduplicated
Joint
Enrollment*College
PSEO Contracted Tuition Total HS Students
Tables, Section 5 | 4

Table 5-7. Offering Arrangement 2012
Students
Credit
Hours Students
Credit
Hours Students
Credit
Hours Students
Credit
Hours
Northeast Iowa 270 1,333 2,293 16,661 118 1,112 2,681 19,105 2,457
North Iowa Area 365 3,081 769 5,690 161 1,119 1,295 9,890 1,209
Iowa Lakes 254 1,654 1,116 9,291 53 357 1,423 11,302 1,313
Northwest 139 620 602 4,229 43 156 784 5,005 710
Iowa Central 49 192 2,670 21,892 0 0 2,719 22,084 2,715
Iowa Valley 127 736 982 7,529 0 0 1,109 8,265 1,006
Hawkeye 320 1,700 1,818 9,755 62 285 2,200 11,740 1,976
Eastern Iowa 737 3,932 3,309 18,781 334 2,120 4,380 24,832 3,824
Kirkwood 713 3,638 3,254 17,283 22 174 3,989 21,095 3,725
Des Moines Area 618 3,517 12,338 101,436 763 6,545 13,719 111,498 13,162
Western Iowa Tech 239 1,611 1,941 12,621 175 856 2,355 15,088 2,276
Iowa Western 155 934 1,920 17,491 19 83 2,094 18,508 1,973
Southwestern 109 590 625 5,578 20 76 754 6,244 703
Indian Hills 91 319 1,456 11,230 62 384 1,609 11,933 1,545
Southeastern 0 0 921 6,319 108 748 1,029 7,067 976
Total 4,186 23,856 36,014 265,785 1,940 14,015 42,140 303,655 39,570
Table 5-8. Offering Arrangement 2013
Students
Credit
Hours Students
Credit
Hours Students
Credit
Hours Students
Credit
Hours
Northeast Iowa 354 1,699 2,461 17,859 117 969 2,932 20,526 2,636
North Iowa Area 282 1,944 723 6,318 131 1,336 1,136 9,598 1,136
Iowa Lakes 208 1,039 1,151 9,781 44 325 1,403 11,145 1,291
Northwest 114 473 702 4,834 35 154 851 5,461 756
Iowa Central 71 276 2,610 21,642 0 0 2,681 21,918 2,681
Iowa Valley 55 222 1,077 8,728 0 0 1,132 8,950 1,082
Hawkeye 251 1,236 1,756 9,228 59 300 2,066 10,764 1,877
Eastern Iowa 406 2,070 3,518 19,243 274 1,683 4,198 22,996 3,831
Kirkwood 696 3,551 3,631 21,050 21 173 4,348 24,774 4,048
Des Moines Area 556 3,154 12,557 101,824 959 6,917 14,072 111,895 13,308
Western Iowa Tech 180 1,222 1,932 12,365 0 0 2,112 13,587 2,112
Iowa Western 154 993 2,082 19,008 34 132 2,270 20,133 2,157
Southwestern 108 668 649 5,917 5 22 762 6,607 706
Indian Hills 65 305 1,529 13,668 40 221 1,634 14,194 1,598
Southeastern 0 0 418 2,630 817 5,237 1,235 7,867 1,043
Total 3,500 18,852 36,796 274,093 2,536 17,468 42,832 310,412 40,262
Unduplicated
Joint
Enrollment*College
PSEO Contracted Tuition Total HS Students
*This number may be smaller than the sum of PSEO, Contracted, and Tuition, because some students take courses under multiple
arrangements.
*This number may be smaller than the sum of PSEO, Contracted, and Tuition, because some students take courses under multiple
arrangements.
Unduplicated
Joint
Enrollment*College
PSEO Contracted Tuition Total HS Students
Tables, Section 5 | 5

Table 5-9. Offering Arrangement 2014
Students
Credit
Hours Students
Credit
Hours Students
Credit
Hours Students
Credit
Hours
Northeast Iowa 340 1,713 2,604 17,872 123 1,099 3,067 20,683 2,750
North Iowa Area 444 3,791 727 4,804 125 1,338 1,296 9,933 1,296
Iowa Lakes 145 803 1,119 9,926 38 247 1,302 10,976 1,243
Northwest 0 0 894 6,302 30 133 924 6,435 904
Iowa Central 64 258 2,409 20,135 0 0 2,473 20,393 2,467
Iowa Valley 49 222 1,287 10,333 0 0 1,336 10,555 1,294
Hawkeye 359 1,956 1,595 9,085 482 1,652 2,436 12,693 2,097
Eastern Iowa 301 1,981 4,182 25,530 49 326 4,532 27,837 4,532
Kirkwood 626 3,134 4,006 25,138 102 523 4,734 28,795 4,353
Des Moines Area 590 3,469 13,224 111,666 957 5,837 14,771 120,972 13,930
Western Iowa Tech 111 854 2,392 17,915 0 0 2,503 18,769 2,503
Iowa Western 200 1,253 1,970 16,904 45 192 2,215 18,349 2,053
Southwestern 83 411 668 6,183 10 46 761 6,640 714
Indian Hills 23 102 1,696 14,987 22 112 1,741 15,201 1,714
Southeastern 0 0 1,111 8,316 58 378 1,169 8,693 1,146
Total 3,335 19,947 39,884 305,094 2,041 11,882 45,260 336,923 42,996
Unduplicated
Joint
Enrollment*
*This number may be smaller than the sum of PSEO, Contracted, and Tuition, because some students take courses under multiple
arrangements.
College
PSEO Contracted Tuition Total HS Students
Tables, Section 5 | 6
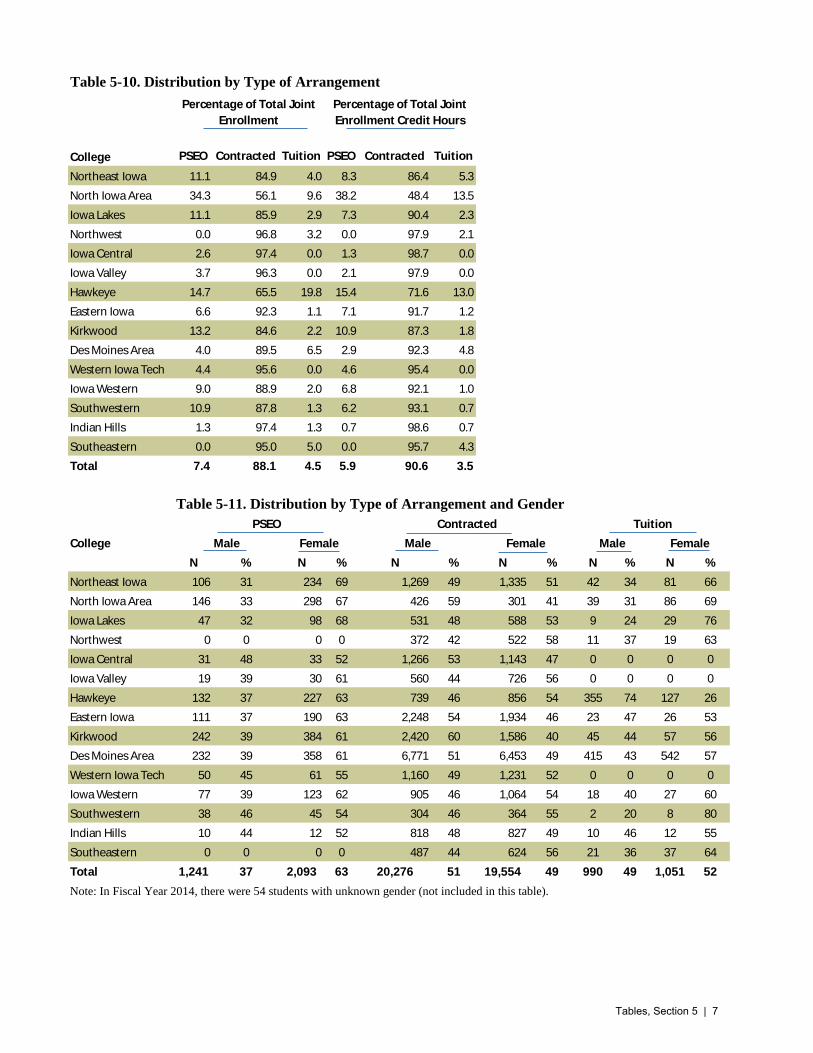
Table 5-10. Distribution by Type of Arrangement
PSEO Contracted Tuition PSEO Contracted Tuition
Northeast Iowa 11.1 84.9 4.0 8.3 86.4 5.3
North Iowa Area 34.3 56.1 9.6 38.2 48.4 13.5
Iowa Lakes 11.1 85.9 2.9 7.3 90.4 2.3
Northwest 0.0 96.8 3.2 0.0 97.9 2.1
Iowa Central 2.6 97.4 0.0 1.3 98.7 0.0
Iowa Valley 3.7 96.3 0.0 2.1 97.9 0.0
Hawkeye 14.7 65.5 19.8 15.4 71.6 13.0
Eastern Iowa 6.6 92.3 1.1 7.1 91.7 1.2
Kirkwood 13.2 84.6 2.2 10.9 87.3 1.8
Des Moines Area 4.0 89.5 6.5 2.9 92.3 4.8
Western Iowa Tech 4.4 95.6 0.0 4.6 95.4 0.0
Iowa Western 9.0 88.9 2.0 6.8 92.1 1.0
Southwestern 10.9 87.8 1.3 6.2 93.1 0.7
Indian Hills 1.3 97.4 1.3 0.7 98.6 0.7
Southeastern 0.0 95.0 5.0 0.0 95.7 4.3
Total 7.4 88.1 4.5 5.9 90.6 3.5
Table 5-11. Distribution by Type of Arrangement and Gender
N % N % N % N % N % N %
Northeast Iowa 106 31 234 69 1,269 49 1,335 51 42 34 81 66
North Iowa Area 146 33 298 67 426 59 301 41 39 31 86 69
Iowa Lakes 47 32 98 68 531 48 588 53 9 24 29 76
Northwest 0 0 0 0 372 42 522 58 11 37 19 63
Iowa Central 31 48 33 52 1,266 53 1,143 47 0 0 0 0
Iowa Valley 19 39 30 61 560 44 726 56 0 0 0 0
Hawkeye 132 37 227 63 739 46 856 54 355 74 127 26
Eastern Iowa 111 37 190 63 2,248 54 1,934 46 23 47 26 53
Kirkwood 242 39 384 61 2,420 60 1,586 40 45 44 57 56
Des Moines Area 232 39 358 61 6,771 51 6,453 49 415 43 542 57
Western Iowa Tech 50 45 61 55 1,160 49 1,231 52 0 0 0 0
Iowa Western 77 39 123 62 905 46 1,064 54 18 40 27 60
Southwestern 38 46 45 54 304 46 364 55 2 20 8 80
Indian Hills 10 44 12 52 818 48 827 49 10 46 12 55
Southeastern 0 0 0 0 487 44 624 56 21 36 37 64
Total 1,241 37 2,093 63 20,276 51 19,554 49 990 49 1,051 52
Note: In Fiscal Year 2014, there were 54 students with unknown gender (not included in this table).
Tuition
FemaleMale Female Male Female Male
Percentage of Total Joint
Enrollment
Percentage of Total Joint
Enrollment Credit Hours
College
College
PSEO Contracted
Tables, Section 5 | 7

Table 5-12. Gender of Jointly Enrolled Students*
College N % N % N % N %
Northeast Iowa 1,162 46.9 1,316 53.1 1,117 46.2 1,301 53.8
North Iowa Area 647 45.5 776 54.5 630 45.9 742 54.1
Iowa Lakes 612 43.1 808 56.9 596 44.5 742 55.5
Northwest 407 45.5 487 54.5 389 48.0 422 52.0
Iowa Central 1,469 52.8 1,312 47.2 1,325 56.6 1,015 43.4
Iowa Valley 480 41.8 667 58.2 436 42.6 587 57.4
Hawkeye 915 48.6 969 51.4 869 48.2 935 51.8
Eastern Iowa 2,194 50.3 2,168 49.7 1,838 51.6 1,721 48.4
Kirkwood 2,145 54.7 1,774 45.3 2,209 58.0 1,599 42.0
Des Moines Area 5,431 49.0 5,643 51.0 6,537 50.8 6,319 49.2
Western Iowa Tech 953 52.3 870 47.7 1,106 47.2 1,237 52.8
Iowa Western 796 45.3 960 54.7 834 44.0 1,063 56.0
Southwestern 293 43.0 389 57.0 323 47.1 363 52.9
Indian Hills 641 49.3 658 50.7 706 48.6 747 51.4
Southeastern 414 42.6 557 57.4 466 45.5 558 54.5
Total 18,559 49.0 19,354 51.0 19,381 50.0 19,351 50.0
Table 5-12. Gender of Jointly Enrolled Students, continued*
N % N % N % N %
Northeast Iowa 1,122 45.7 1,335 54.3 1,274 48.3 1,362 51.7
North Iowa Area 526 43.5 683 56.5 505 44.5 631 55.5
Iowa Lakes 573 43.8 735 56.2 603 46.7 687 53.3
Northwest 318 44.8 392 55.2 324 42.9 432 57.1
Iowa Central 1,411 52.0 1,304 48.0 1,358 50.7 1,323 49.3
Iowa Valley 439 43.7 565 56.3 446 41.3 634 58.7
Hawkeye 1,017 51.5 959 48.5 968 51.6 909 48.4
Eastern Iowa 2,035 53.2 1,789 46.8 2,089 54.5 1,742 45.5
Kirkwood 2,172 58.3 1,553 41.7 2,377 58.7 1,671 41.3
Des Moines Area 6,729 51.1 6,433 48.9 6,860 51.5 6,448 48.5
Western Iowa Tech 1,102 48.4 1,174 51.6 1,068 50.6 1,044 49.4
Iowa Western 875 44.3 1,098 55.7 1,031 47.8 1,126 52.2
Southwestern 287 40.8 416 59.2 292 41.4 414 58.6
Indian Hills 679 48.3 728 51.7 725 46.8 824 53.2
Southeastern 396 40.6 580 59.4 437 41.9 606 58.1
Total 19,681 49.9 19,744 50.1 20,357 50.6 19,853 49.4
2013
Male Female
2012
Male Female
2010
College
2011
Male Female
*Note: Students with unknown gender are not included in this table. In Fiscal Year 2010, there were 370 students with unknown gender;
in Fiscal Year 2011, there were 160 students with unknown gender; in Fiscal Year 2012, there were 145 students with unknown gender;
in Fiscal Year 2013, there were 52 students with unknown gender; in Fiscal Year 2014, there were 54 students with unknown gender.
FemaleMale
Tables, Section 5 | 8

Table 5-12. Gender of Jointly Enrolled Students, continued*
N % N %
Northeast Iowa 1,322 48.1 1,428 51.9
North Iowa Area 611 47.1 685 52.9
Iowa Lakes 570 45.9 673 54.1
Northwest 378 41.8 526 58.2
Iowa Central 1,291 52.3 1,176 47.7
Iowa Valley 562 43.4 731 56.5
Hawkeye 1,074 51.2 1,023 48.8
Eastern Iowa 2,382 52.6 2,150 47.4
Kirkwood 2,542 58.4 1,811 41.6
Des Moines Area 7,077 50.8 6,853 49.2
Western Iowa Tech 1,210 48.3 1,292 51.6
Iowa Western 938 45.7 1,114 54.3
Southwestern 326 45.7 388 54.3
Indian Hills 828 48.3 835 48.7
Southeastern 502 43.8 644 56.2
Total 21,613 50.3 21,329 49.6
*Note: Students with unknown gender are not included in this table. In Fiscal Year 2010, there were 370 students with unknown gender;
in Fiscal Year 2011, there were 160 students with unknown gender; in Fiscal Year 2012, there were 145 students with unknown gender;
in Fiscal Year 2013, there were 52 students with unknown gender; in Fiscal Year 2014, there were 54 students with unknown gender.
Male Female
2014
College
Tables, Section 5 | 9

Table 5-13. Race and Ethnicity 2010
College
American
IndianAsian Black
Hawaiian/
Pacific
Islander
Hispanic White
Two or
More
Races
Unknown Total
Northeast Iowa 4 5 22 0 26 2,288 11 122 2,478
North Iowa Area 0 18 7 2 35 1,351 7 3 1,423
Iowa Lakes 5 11 3 0 28 1,364 2 40 1,453
Northwest 2 4 0 0 15 848 3 22 894
Iowa Central 8 50 22 1 187 2,387 31 95 2,781
Iowa Valley 8 9 7 0 81 699 5 338 1,147
Hawkeye 2 15 73 1 21 1,770 1 1 1,884
Eastern Iowa 21 48 127 4 269 3,564 41 288 4,362
Kirkwood 12 58 84 2 70 2,859 0 885 3,970
Des Moines Area 47 365 420 4 577 9,152 252 257 11,074
Western Iowa Tech 16 30 23 1 120 1,414 4 333 1,941
Iowa Western 8 8 4 0 25 1,468 3 240 1,756
Southwestern 3 7 0 0 10 645 1 16 682
Indian Hills 16 14 3 2 26 1,169 0 237 1,467
Southeastern 7 15 17 3 24 618 0 287 971
Total 159 657 812 20 1,514 31,596 361 3,164 38,283
% of Total 0.4 1.7 2.1 0.1 4.0 82.5 0.9 8.3 100.0
Table 5-14. Race and Ethnicity 2011
College
American
IndianAsian Black
Hawaiian/
Pacific
Islander
Hispanic White
Two or
More
Races
Unknown Total
Northeast Iowa 4 6 7 0 18 2,335 4 44 2,418
North Iowa Area 0 11 6 1 38 1,300 11 5 1,372
Iowa Lakes 6 10 7 0 26 1,242 9 41 1,341
Northwest 1 4 2 1 12 758 2 31 811
Iowa Central 5 37 25 4 159 1,985 16 109 2,340
Iowa Valley 7 4 16 1 59 752 7 179 1,025
Hawkeye 3 24 79 1 30 1,664 3 0 1,804
Eastern Iowa 23 55 133 5 293 2,784 70 196 3,559
Kirkwood 5 22 14 2 29 1,291 6 2,440 3,809
Des Moines Area 51 423 426 3 720 10,287 378 568 12,856
Western Iowa Tech 18 27 22 3 127 1,443 0 704 2,344
Iowa Western 13 7 13 2 40 1,693 3 126 1,897
Southwestern 1 6 3 0 17 647 6 6 686
Indian Hills 12 15 7 4 31 1,278 1 258 1,606
Southeastern 7 18 16 3 42 884 17 37 1,024
Total 156 669 776 30 1,641 30,343 533 4,744 38,892
% of Total 0.4 1.7 2.0 0.1 4.2 78.0 1.4 12.2 100.0
Tables, Section 5 | 10

Table 5-15. Race and Ethnicity 2012
College
American
IndianAsian Black
Hawaiian/
Pacific
Islander
Hispanic White
Two or
More
Races
Unknown Total
Northeast Iowa 4 8 2 0 20 2,379 3 41 2,457
North Iowa Area 0 7 9 2 38 1,145 5 3 1,209
Iowa Lakes 2 14 7 0 32 1,219 6 33 1,313
Northwest 5 10 3 2 3 656 4 27 710
Iowa Central 7 40 31 4 188 2,331 14 100 2,715
Iowa Valley 11 7 10 0 51 848 5 74 1,006
Hawkeye 1 34 40 3 38 1,826 34 0 1,976
Eastern Iowa 27 67 134 12 370 2,888 75 251 3,824
Kirkwood 4 20 25 0 30 1,479 22 2,145 3,725
Des Moines Area 51 477 452 8 774 10,604 333 463 13,162
Western Iowa Tech 12 33 18 3 164 1,367 17 662 2,276
Iowa Western 15 17 11 1 93 1,777 4 55 1,973
Southwestern 1 3 1 1 14 659 13 11 703
Indian Hills 4 11 10 1 29 1,224 9 257 1,545
Southeastern 3 22 19 1 36 850 22 23 976
Total 147 770 772 38 1,880 31,252 566 4,145 39,570
% of Total 0.4 1.9 2.0 0.1 4.8 79.0 1.4 10.5 100.0
Table 5-16. Race and Ethnicity 2013
College
American
IndianAsian Black
Hawaiian/
Pacific
Islander
Hispanic White
Two or
More
Races
Unknown Total
Northeast Iowa 4 7 13 0 24 2,549 0 39 2,636
North Iowa Area 1 6 13 0 37 1,073 3 3 1,136
Iowa Lakes 2 15 4 0 42 1,200 8 20 1,291
Northwest 4 7 0 0 16 713 3 13 756
Iowa Central 6 44 36 3 198 2,252 10 132 2,681
Iowa Valley 13 5 5 1 75 780 6 197 1,082
Hawkeye 1 41 60 6 49 1,683 37 0 1,877
Eastern Iowa 27 61 162 6 342 2,898 92 243 3,831
Kirkwood 11 71 71 4 91 3,373 106 321 4,048
Des Moines Area 37 500 429 7 872 10,639 377 447 13,308
Western Iowa Tech 5 20 17 2 178 1,266 4 620 2,112
Iowa Western 19 27 30 1 105 1,927 4 44 2,157
Southwestern 1 6 - 0 19 668 12 - 706
Indian Hills 10 9 8 0 31 1,370 10 160 1,598
Southeastern 9 19 18 2 34 882 41 38 1,043
Total 150 838 866 32 2,113 33,273 713 2,277 40,262
% of Total 0.4 2.1 2.2 0.1 5.2 82.6 1.8 5.7 100.0
Tables, Section 5 | 11

Table 5-17. Race and Ethnicity 2014
College
American
IndianAsian Black
Hawaiian/
Pacific
Islander
Hispanic White
Two or
More
Races
Unknown Total
Northeast Iowa 3 4 12 0 20 2,697 2 12 2,750
North Iowa Area 3 17 12 1 46 1,212 5 0 1,296
Iowa Lakes 3 12 7 1 38 1,167 7 8 1,243
Northwest 9 13 3 1 32 818 7 21 904
Iowa Central 10 51 43 3 161 1,974 9 216 2,467
Iowa Valley 8 14 12 0 155 919 0 186 1,294
Hawkeye 3 46 60 1 70 1,880 37 0 2,097
Eastern Iowa 17 72 160 7 394 3,333 163 386 4,532
Kirkwood 15 86 71 1 118 3,500 114 448 4,353
Des Moines Area 48 535 494 13 974 11,152 385 329 13,930
Western Iowa Tech 21 72 50 4 327 1,884 5 140 2,503
Iowa Western 25 31 24 3 118 1,788 9 55 2,053
Southwestern 1 8 0 0 27 662 13 3 714
Indian Hills 13 18 10 2 47 1,436 9 179 1,714
Southeastern 8 23 15 2 47 963 34 54 1,146
Total 187 1,002 973 39 2,574 35,385 799 2,037 42,996
% of Total 0.4 2.3 2.3 0.1 6.0 82.3 1.9 4.7 100.0
Tables, Section 5 | 12

Table 5-18. Residency* 2010
College Iowa Out-of-State Foreign Unknown Total
Northeast Iowa 2,465 10 0 0 2,475
North Iowa Area 1,416 6 1 0 1,423
Iowa Lakes 1,446 7 0 0 1,453
Northwest 891 3 0 0 894
Iowa Central 2,780 1 0 0 2,781
Iowa Valley 1,144 2 1 0 1,147
Hawkeye 1,884 0 0 0 1,884
Eastern Iowa 4,321 39 2 0 4,362
Kirkwood 3,951 11 7 1 3,970
Des Moines Area 11,062 14 0 0 11,076
Western Iowa Tech 1,921 20 0 0 1,941
Iowa Western 1,755 1 0 0 1,756
Southwestern 682 0 0 0 682
Indian Hills 1,467 0 0 0 1,467
Southeastern 939 25 7 0 971
Total 38,124 139 18 1 38,282
*Note: Students may change residency status during fiscal year; each instance of different residency is counted separately.
Table 5-19. Residency* 2011
College Iowa Out-of-State Foreign Unknown Total
Northeast Iowa 2,411 7 0 0 2,418
North Iowa Area 1,370 2 0 0 1,372
Iowa Lakes 1,335 6 0 0 1,341
Northwest 808 3 0 0 811
Iowa Central 2,339 0 1 0 2,340
Iowa Valley 1,024 1 0 0 1,025
Hawkeye 1,804 0 0 0 1,804
Eastern Iowa 3,520 37 2 0 3,559
Kirkwood 3,783 25 1 0 3,809
Des Moines Area 12,837 14 5 0 12,856
Western Iowa Tech 2,299 45 0 0 2,344
Iowa Western 1,888 9 0 0 1,897
Southwestern 189 0 0 0 189
Indian Hills 1,606 0 0 0 1,606
Southeastern 988 30 6 0 1,024
Total 38,201 179 15 0 38,395
*Note: Students may change residency status during fiscal year; each instance of different residency is counted separately.
Tables, Section 5 | 13

Table 5-20. Residency* 2012
College Iowa Out-of-State Foreign Unknown Total
Northeast Iowa 2,440 17 0 0 2,457
North Iowa Area 1,202 7 0 0 1,209
Iowa Lakes 1,308 5 0 0 1,313
Northwest 710 0 0 0 710
Iowa Central 2,714 1 0 0 2,715
Iowa Valley 1,006 0 0 0 1,006
Hawkeye 1,975 1 0 0 1,976
Eastern Iowa 3,793 25 0 6 3,824
Kirkwood 3,717 6 2 0 3,725
Des Moines Area 13,151 9 4 0 13,164
Western Iowa Tech 2,216 60 0 0 2,276
Iowa Western 1,971 2 0 0 1,973
Southwestern 703 0 0 0 703
Indian Hills 1,545 0 0 0 1,545
Southeastern 947 25 4 0 976
Total 39,398 158 10 6 39,572
*Note: Students may change residency status during fiscal year; each instance of different residency is counted separately.
Table 5-21. Residency* 2013
College Iowa Out-of-State Foreign Unknown Total
Northeast Iowa 2,616 19 1 0 2,636
North Iowa Area 1,133 3 0 0 1,136
Iowa Lakes 1,289 2 0 0 1,291
Northwest 753 3 0 0 756
Iowa Central 2,680 1 0 0 2,681
Iowa Valley 1,082 0 0 0 1,082
Hawkeye 1,874 3 0 0 1,877
Eastern Iowa 3,792 35 1 3 3,831
Kirkwood 4,028 13 7 0 4,048
Des Moines Area 13,288 10 10 0 13,308
Western Iowa Tech 2,081 31 0 0 2,112
Iowa Western 2,157 0 0 0 2,157
Southwestern 706 0 0 0 706
Indian Hills 1,598 0 0 0 1,598
Southeastern 1,017 26 0 0 1,043
Total 40,094 146 19 3 40,262
*Note: Students may change residency status during fiscal year; each instance of different residency is counted separately.
Tables, Section 5 | 14

Table 5-22. Residency* 2014
College Iowa Out-of-State Foreign Unknown Total
Northeast Iowa 2,737 13 0 0 2,750
North Iowa Area 1,291 5 0 0 1,296
Iowa Lakes 1,242 1 0 0 1,243
Northwest 904 0 0 0 904
Iowa Central 2,466 1 0 0 2,467
Iowa Valley 1,294 0 0 0 1,294
Hawkeye 2,093 4 0 0 2,097
Eastern Iowa 4,446 86 0 0 4,532
Kirkwood 4,348 3 2 0 4,353
Des Moines Area 13,923 2 5 0 13,930
Western Iowa Tech 2,431 72 0 0 2,503
Iowa Western 2,049 4 0 0 2,053
Southwestern 712 0 2 0 714
Indian Hills 1,714 0 0 0 1,714
Southeastern 1,127 15 4 0 1,146
Total 42,777 206 13 0 42,996
*Note: Students may change residency status during fiscal year; each instance of different residency is counted separately.
Tables, Section 5 | 15

Table 5-23. Grade Level of Jointly Enrolled Students* 2011
College 9 10 11 12 Total
Northeast Iowa 58 145 763 1,167 2,133
North Iowa Area 12 51 426 758 1,247
Iowa Lakes 49 142 429 559 1,179
Northwest 27 50 219 416 712
Iowa Central 43 83 549 903 1,578
Iowa Valley 5 31 336 576 948
Hawkeye 89 172 610 786 1,657
Eastern Iowa 190 326 958 1,693 3,167
Kirkwood 364 505 897 1,491 3,257
Des Moines Area 443 1,577 3,916 5,175 11,111
Western Iowa Tech 130 229 588 1,094 2,041
Iowa Western 8 52 613 1,060 1,733
Southwestern 2 3 55 129 189
Indian Hills 51 87 494 789 1,421
Southeastern 18 48 268 465 799
Total 1,489 3,501 11,121 17,061 33,172
Table 5-24. Grade Level of Jointly Enrolled Students* 2012
College 9 10 11 12 Total
Northeast Iowa 95 133 822 1,406 2,456
North Iowa Area 20 53 375 731 1,179
Iowa Lakes 43 111 463 593 1,210
Northwest 39 35 238 382 694
Iowa Central 48 109 696 1,338 2,191
Iowa Valley 3 32 356 609 1,000
Hawkeye 130 194 661 985 1,970
Eastern Iowa 271 464 1,097 1,910 3,742
Kirkwood 490 581 996 1,588 3,655
Des Moines Area 659 1,870 3,989 5,441 11,959
Western Iowa Tech 151 247 761 996 2,155
Iowa Western 5 102 713 1,075 1,895
Southwestern 16 29 268 380 693
Indian Hills 78 98 539 791 1,506
Southeastern 34 29 370 504 937
Total 2,082 4,087 12,344 18,729 37,242
*Note: Total includes only students with identical valid Iowa State Student ID numbers and
thus is smaller than the total head count for all jointly enrolled students.
Tables, Section 5 | 16

Table 5-25. Grade Level of Jointly Enrolled Students* 2013
College 9 10 11 12 Total
Northeast Iowa 128 220 794 1,462 2,604
North Iowa Area 11 52 358 735 1,156
Iowa Lakes 38 108 473 615 1,234
Northwest 27 46 301 379 753
Iowa Central 84 158 1,084 1,428 2,754
Iowa Valley 11 36 392 610 1,049
Hawkeye 172 218 636 886 1,912
Eastern Iowa 336 540 1,095 1,796 3,767
Kirkwood 569 661 1,043 1,775 4,048
Des Moines Area 795 2,090 4,471 5,768 13,124
Western Iowa Tech 154 321 827 782 2,084
Iowa Western 87 131 709 1,235 2,162
Southwestern 6 37 283 436 762
Indian Hills 98 147 548 801 1,594
Southeastern 40 42 360 588 1,030
Total 2,556 4,807 13,374 19,296 40,033
Table 5-26. Grade Level of Jointly Enrolled Students* 2014
College 9 10 11 12 Total
Northeast Iowa 196 274 899 1,301 2,670
North Iowa Area 10 57 387 771 1,225
Iowa Lakes 42 101 323 488 954
Northwest 23 55 296 438 812
Iowa Central 57 107 841 1,159 2,164
Iowa Valley 56 95 337 591 1,079
Hawkeye 171 199 656 971 1,997
Eastern Iowa 348 565 1,160 1,934 4,007
Kirkwood 510 604 1,038 1,774 3,926
Des Moines Area 667 1,850 3,933 5,505 11,955
Western Iowa Tech 67 183 636 789 1,675
Iowa Western 54 119 604 922 1,699
Southwestern 10 51 251 352 664
Indian Hills 70 134 484 794 1,482
Southeastern 74 70 408 547 1,099
Total 2,355 4,464 12,253 18,336 37,408
*Note: Total includes only students with identical valid Iowa State Student ID numbers and
thus is smaller than the total head count for all jointly enrolled students.
*Note: Total includes only students with identical valid Iowa State Student ID numbers and
thus is smaller than the total head count for all jointly enrolled students.
Tables, Section 5 | 17

Tables, Credit Student Awards 6
Table of Contents
6-1. Awards by Type, Latest Five Years........................................................................................2
6-2. Awards by Career Cluster, Latest Five Years.........................................................................2
6-3. Awards by Career Cluster and Gender, Latest Five Years......................................................3
6-4. Award Types by Race/Ethnicity, Latest Five Years................................................................4
6-5. Awards by Career Cluster and Race/Ethnicity, Latest Five Years..........................................5
6-6--6-10. Awards by Career Cluster and College, Latest Five Years... ..................................6-10
6-11--6-15. Awards by Career Cluster and Award Type, Latest Five Years...........................11-15
6-16--6-20. Awards by College and Award Type, Latest Five Years......................................16-20
6-21--6-37. Awards by Gender and Specific Career Cluster, Latest Five Years.....................21-29
6-38--6-42. Awards by Career Cluster and Ethnicity/Race, Latest Five Years......................30-34
6-43--6-47. Awards by Ethnicity/Race and Award Type, Latest Five Years..........................35-37
Tables, Section 6 | 1
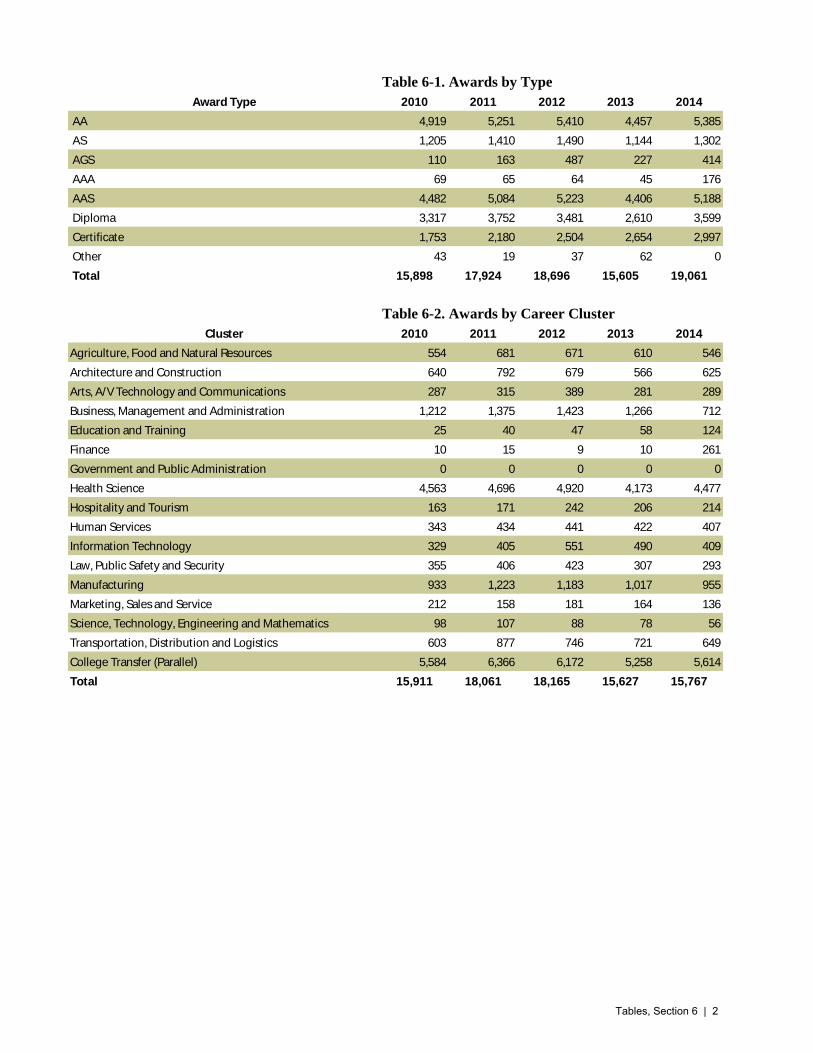
Table 6-1. Awards by Type 2014
Award Type 2010 2011 2012 2013 2014
AA 4,919 5,251 5,410 4,457 5,385
AS 1,205 1,410 1,490 1,144 1,302
AGS 110 163 487 227 414
AAA 69 65 64 45 176
AAS 4,482 5,084 5,223 4,406 5,188
Diploma 3,317 3,752 3,481 2,610 3,599
Certificate 1,753 2,180 2,504 2,654 2,997
Other 43 19 37 62 0
Total 15,898 17,924 18,696 15,605 19,061
Table 6-2. Awards by Career Cluster
Cluster 2010 2011 2012 2013 2014
Agriculture, Food and Natural Resources 554 681 671 610 546
Architecture and Construction 640 792 679 566 625
Arts, A/V Technology and Communications 287 315 389 281 289
Business, Management and Administration 1,212 1,375 1,423 1,266 712
Education and Training 25 40 47 58 124
Finance 10 15 9 10 261
Government and Public Administration 0 0 0 0 0
Health Science 4,563 4,696 4,920 4,173 4,477
Hospitality and Tourism 163 171 242 206 214
Human Services 343 434 441 422 407
Information Technology 329 405 551 490 409
Law, Public Safety and Security 355 406 423 307 293
Manufacturing 933 1,223 1,183 1,017 955
Marketing, Sales and Service 212 158 181 164 136
Science, Technology, Engineering and Mathematics 98 107 88 78 56
Transportation, Distribution and Logistics 603 877 746 721 649
College Transfer (Parallel) 5,584 6,366 6,172 5,258 5,614
Total 15,911 18,061 18,165 15,627 15,767
Tables, Section 6 | 2
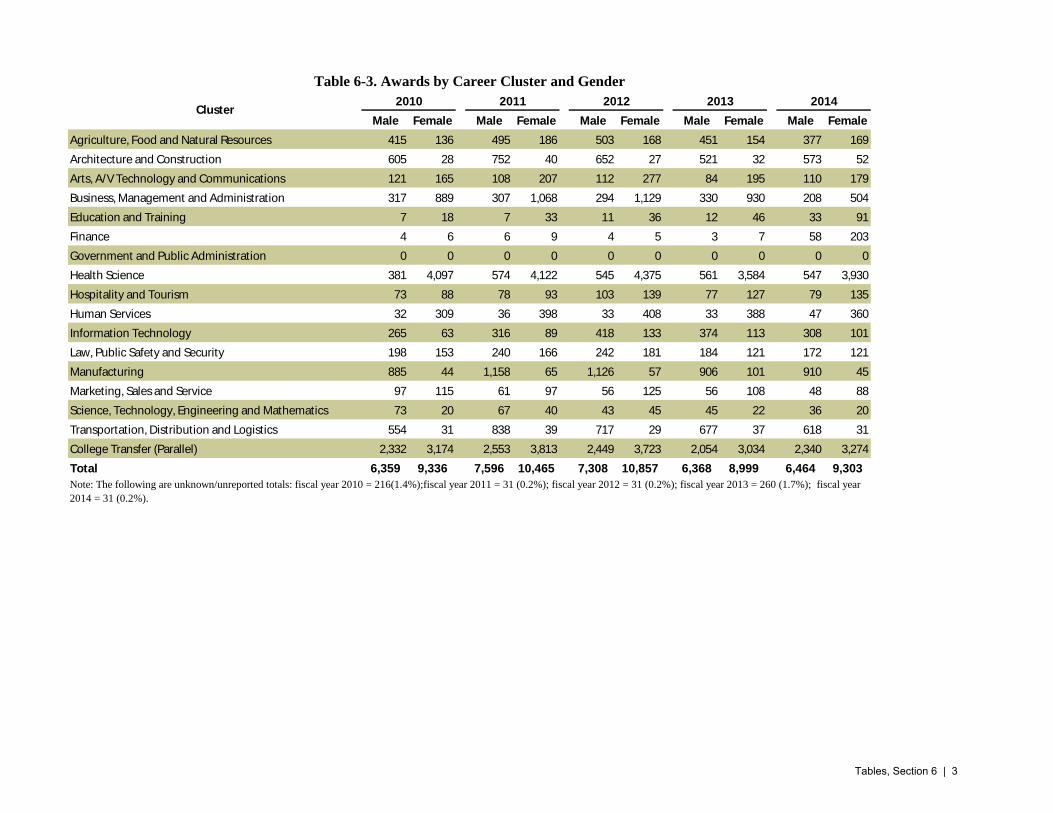
Male Female Male Female Male Female Male Female Male Female
Agriculture, Food and Natural Resources 415 136 495 186 503 168 451 154 377 169
Architecture and Construction 605 28 752 40 652 27 521 32 573 52
Arts, A/V Technology and Communications 121 165 108 207 112 277 84 195 110 179
Business, Management and Administration 317 889 307 1,068 294 1,129 330 930 208 504
Education and Training 7 18 7 33 11 36 12 46 33 91
Finance 4 6 6 9 4 5 3 7 58 203
Government and Public Administration 0 0 0 0 0 0 0 0 0 0
Health Science 381 4,097 574 4,122 545 4,375 561 3,584 547 3,930
Hospitality and Tourism 73 88 78 93 103 139 77 127 79 135
Human Services 32 309 36 398 33 408 33 388 47 360
Information Technology 265 63 316 89 418 133 374 113 308 101
Law, Public Safety and Security 198 153 240 166 242 181 184 121 172 121
Manufacturing 885 44 1,158 65 1,126 57 906 101 910 45
Marketing, Sales and Service 97 115 61 97 56 125 56 108 48 88
Science, Technology, Engineering and Mathematics 73 20 67 40 43 45 45 22 36 20
Transportation, Distribution and Logistics 554 31 838 39 717 29 677 37 618 31
College Transfer (Parallel) 2,332 3,174 2,553 3,813 2,449 3,723 2,054 3,034 2,340 3,274
Total 6,359 9,336 7,596 10,465 7,308 10,857 6,368 8,999 6,464 9,303
Note: The following are unknown/unreported totals: fiscal year 2010 = 216(1.4%);fiscal year 2011 = 31 (0.2%); fiscal year 2012 = 31 (0.2%); fiscal year 2013 = 260 (1.7%); fiscal year
2014 = 31 (0.2%).
Table 6-3. Awards by Career Cluster and Gender
2010 2011 2012 2013 2014Cluster
Tables, Section 6 | 3

6-4. Award Types by Race/Ethnicity
White Minority White Minority White Minority White Minority White Minority
AA 3,815 391 4,226 440 4,096 553 3,540 469 4,009 670
AS 945 105 1,118 152 1,145 156 915 120 975 158
AGS 87 7 132 16 136 31 84 23 98 37
AAA 66 1 62 4 61 2 38 6 156 12
AAS 3,605 275 4,274 299 4,198 363 3,630 354 4,059 422
Diploma 2,630 241 3,003 325 2,821 293 2,098 245 2,867 381
Certificate 1,049 131 1,215 211 1,452 258 1,618 291 1,802 427
Other 33 8 17 1 37 0 61 1 0 0
Total 12,230 1,159 14,047 1,448 13,946 1,656 11,984 1,509 13,966 2,107
% of Total 91.3 8.7 90.7 9.3 89.4 10.6 88.8 11.2 86.9 13.1
2011 2012 2013 2014
Note: Does not include students with unknown or unreported race. The following are unknown/unreported totals: fiscal year 2010 = 1,333 (9.3%); fiscal year 2011 = 1,799 (10.6%); fiscal year 2012 =
1,481(8.9%); fiscal year 2013 = 735 (5.2%); fiscal year 2014 = 747 (4.4%). Students may have received more than one award, but are counted only once under each type of award.
Award Type2010
Tables, Section 6 | 4

Table 6-5. Awards by Career Cluster and Race/Ethnicity
White Minority White Minority White Minority White Minority White Minority
Agriculture, Food and Natural
Resources 508 12 473 25 442 12 442 64 499 19
Architecture and Construction 509 43 534 48 479 42 326 79 528 71
Arts, A/V Technology and
Communications 245 13 255 19 255 14 190 38 241 39
Business, Management and
Administration 916 140 864 96 841 118 748 161 565 97
Education and Training 14 8 26 6 36 5 48 9 107 12
Finance 5 1 10 3 7 1 7 2 224 24
Government and Public
Administration 0 0 0 0 0 0 0 0 0 0
Health Science 3,731 275 3,806 324 3,932 379 3,336 706 3,798 484
Hospitality and Tourism 129 13 119 18 158 27 144 43 168 39
Human Services 276 28 310 35 307 41 239 51 342 48
Information Technology 265 28 316 26 367 34 330 61 331 51
Law, Public Safety and Security 278 27 308 31 314 35 226 34 239 39
Manufacturing 746 93 779 79 721 86 623 117 809 118
Marketing, Sales and Service 177 9 109 21 107 19 98 24 117 10
Science, Technology, Engineering
and Mathematics 58 18 74 9 49 21 53 8 39 9
Transportation, Distribution and
Logistics 473 54 605 82 552 68 435 110 529 100
College Transfer (Parallel) 4,370 457 4,855 518 4,571 641 3,953 813 4,552 789
Total 12,700 1,219 13,443 1,340 13,138 1,543 11,198 2,320 13,088 1,949
% of Total 91.2 8.8 90.9 9.1 89.5 10.5 82.8 17.2 87.0 13.0
2014
Note: Does not include students with unknown or unreported race. The following are unknown/unreported totals: fiscal year 2010 = 1,376 (8.6%); fiscal year 2011 = 1,284 (8.7%); fiscal year 2012 = 1,482
(10.1%); fiscal year 2013 = 698 (5.2%); fiscal year 2014 = 721 (4.8%). Students may have received more than one award, but are counted only once under each cluster.
Cluster2010 2011 2012 2013
Tables, Section 6 | 5

Table 6-6. Awards By Career Cluster and College
Cluster
No
rthe
ast
No
rth Io
wa A
rea
Iow
a Lakes
No
rthw
est
Iow
a Ce
ntral
Iow
a Valle
y
Haw
keye
Eastern
Iow
a
Kirkw
oo
d
De
s Mo
ine
s Are
a
We
stern
Iow
a Tech
Iow
a We
stern
Sou
thw
este
rn
Ind
ian H
ills
Sou
the
astern
To
tal
Agriculture, Food and Natural Resources 60 13 58 9 22 100 26 138 91 2 17 5 4 9 554
Architecture and Construction 59 25 34 114 11 23 28 23 76 88 81 31 27 12 8 640
Arts, A/V Technology and Communications 5 6 14 4 21 2 66 8 47 77 15 13 3 6 287
Business, Management and Administration 103 85 21 29 71 18 49 202 172 238 65 24 26 60 49 1,212
Education and Training 0 2 0 0 0 0 0 4 1 15 1 2 0 0 0 25
Finance 0 0 0 0 0 0 0 0 7 0 3 0 0 0 0 10
Government and Public Administration 0 0 0 0 0 0 0 0 0 0 0 0 0 0 0 0
Health Science 301 414 227 84 357 117 245 200 523 523 302 271 120 636 243 4,563
Hospitality and Tourism 0 4 9 0 9 0 0 6 48 62 0 16 0 9 0 163
Human Services 31 4 20 0 33 9 17 23 24 126 14 18 0 17 7 343
Information Technology 4 16 13 3 9 3 34 24 90 55 13 10 9 38 8 329
Law, Public Safety and Security 1 28 16 0 43 2 33 29 107 48 24 24 355
Manufacturing 21 55 22 30 78 30 116 99 65 146 43 15 149 64 933
Marketing, Sales and Service 21 5 7 0 0 1 23 0 29 111 0 8 0 0 0 212
Science, Technology, Engineering and Mathematics 0 5 7 0 15 0 2 32 9 0 15 8 0 5 0 98
Transportation, Distribution and Logistics 26 8 41 27 35 77 46 36 64 41 33 21 114 34 603
College Transfer (Parallel) 206 341 165 33 375 293 391 522 972 970 126 384 98 381 327 5,584
Total 838 1,011 654 324 1,066 520 1,181 1,215 2,266 2,673 769 850 309 1,449 779 15,911
2010
Note: Students may have received awards in more than one cluster. Non-graduate program completers were not included in the credit student awards by career cluster.
Tables, Section 6 | 6

Table 6-7. Awards By Career Cluster and College
Cluster
No
rthe
ast
No
rth Io
wa A
rea
Iow
a Lakes
No
rthw
est
Iow
a Ce
ntral
Iow
a Valle
y
Haw
keye
Eastern
Iow
a
Kirkw
oo
d
De
s Mo
ine
s Are
a
We
stern
Iow
a Tech
Iow
a We
stern
Sou
thw
este
rn
Ind
ian H
ills
Sou
the
astern
To
tal
Agriculture, Food and Natural Resources 61 24 56 1 17 26 105 16 146 53 1 18 13 2 9 548
Architecture and Construction 57 19 52 92 26 16 27 29 91 81 67 29 25 24 7 642
Arts, A/V Technology and Communications 8 7 11 9 13 3 61 14 38 71 21 25 4 10 295
Business, Management and Administration 85 57 49 34 56 32 30 113 146 213 60 15 32 51 50 1,023
Education and Training 0 5 0 0 0 0 0 1 0 12 9 9 0 0 0 36
Finance 0 4 0 0 0 0 0 0 7 0 4 0 0 0 0 15
Government and Public Administration 0 0 0 0 0 0 0 0 0 0 0 0 0 0 0 0
Health Science 295 387 140 87 227 140 269 209 547 510 348 288 119 581 227 4,374
Hospitality and Tourism 0 1 13 0 14 0 0 4 60 46 0 7 0 7 0 152
Human Services 24 1 24 38 6 24 21 7 155 27 16 0 23 8 374
Information Technology 23 15 9 6 16 11 36 24 79 58 15 8 11 45 10 366
Law, Public Safety and Security 0 14 20 0 33 7 51 0 35 99 57 0 0 19 29 364
Manufacturing 26 39 17 38 92 41 161 39 62 129 46 12 7 147 56 912
Marketing, Sales and Service 20 4 5 0 0 0 18 0 29 51 8 6 0 0 0 141
Science, Technology, Engineering and Mathematics 0 9 5 0 13 0 2 3 1 0 36 7 0 10 1 87
Transportation, Distribution and Logistics 19 20 66 34 47 84 109 29 77 35 42 25 93 30 710
College Transfer (Parallel) 178 287 190 38 328 282 394 482 1,479 1,061 119 378 102 439 278 6,035
Total 796 893 657 339 920 564 1,262 1,064 2,756 2,616 853 860 338 1,441 715 16,074
2011
Note: Students may have received awards in more than one cluster.
Tables, Section 6 | 7

Table 6-8. Awards By Career Cluster and College
Cluster
No
rthe
ast
No
rth Io
wa A
rea
Iow
a Lakes
No
rthw
est
Iow
a Ce
ntral
Iow
a Valle
y
Haw
keye
Eastern
Iow
a
Kirkw
oo
d
De
s Mo
ine
s Are
a
We
stern
Iow
a Tech
Iow
a We
stern
Sou
thw
este
rn
Ind
ian H
ills
Sou
the
astern
To
tal
Agriculture, Food and Natural Resources 55 16 71 12 13 106 28 158 40 1 26 12 7 7 552
Architecture and Construction 54 22 48 98 27 9 21 28 85 53 59 33 17 24 7 585
Arts, A/V Technology and Communications 2 13 7 19 5 58 9 37 83 36 10 5 9 293
Business, Management and Administration 79 51 46 39 53 34 45 131 155 199 73 24 32 36 54 1,051
Education and Training 0 7 0 0 0 0 0 5 1 9 5 17 0 0 0 44
Finance 0 1 0 0 0 0 0 0 2 0 6 0 0 0 0 9
Government and Public Administration 0 0 0 0 0 0 0 0 0 0 0 0 0 0 0 0
Health Science 262 353 133 108 242 121 228 259 531 515 599 318 104 648 223 4,644
Hospitality and Tourism 0 5 12 0 11 0 0 20 73 77 0 8 0 10 0 216
Human Services 31 11 15 27 11 23 27 14 158 30 11 0 24 1 383
Information Technology 27 22 12 9 19 9 35 27 91 73 16 13 14 55 13 435
Law, Public Safety and Security 0 28 7 0 38 8 30 0 31 138 65 0 0 22 17 384
Manufacturing 30 40 21 39 91 20 195 59 48 114 48 7 4 98 45 859
Marketing, Sales and Service 10 7 2 0 0 5 17 0 26 61 7 6 0 0 0 141
Science, Technology, Engineering and Mathematics 0 2 0 0 13 0 0 21 2 0 36 3 0 3 0 80
Transportation, Distribution and Logistics 22 7 43 43 56 65 57 46 88 27 41 30 122 25 672
College Transfer (Parallel) 211 287 173 44 436 298 334 476 1,061 1,137 154 375 124 441 267 5,818
Total 783 859 596 387 1,044 533 1,157 1,147 2,361 2,745 1,162 892 342 1,490 668 16,166
Note: Students may have received awards in more than one cluster.
2012
Tables, Section 6 | 8
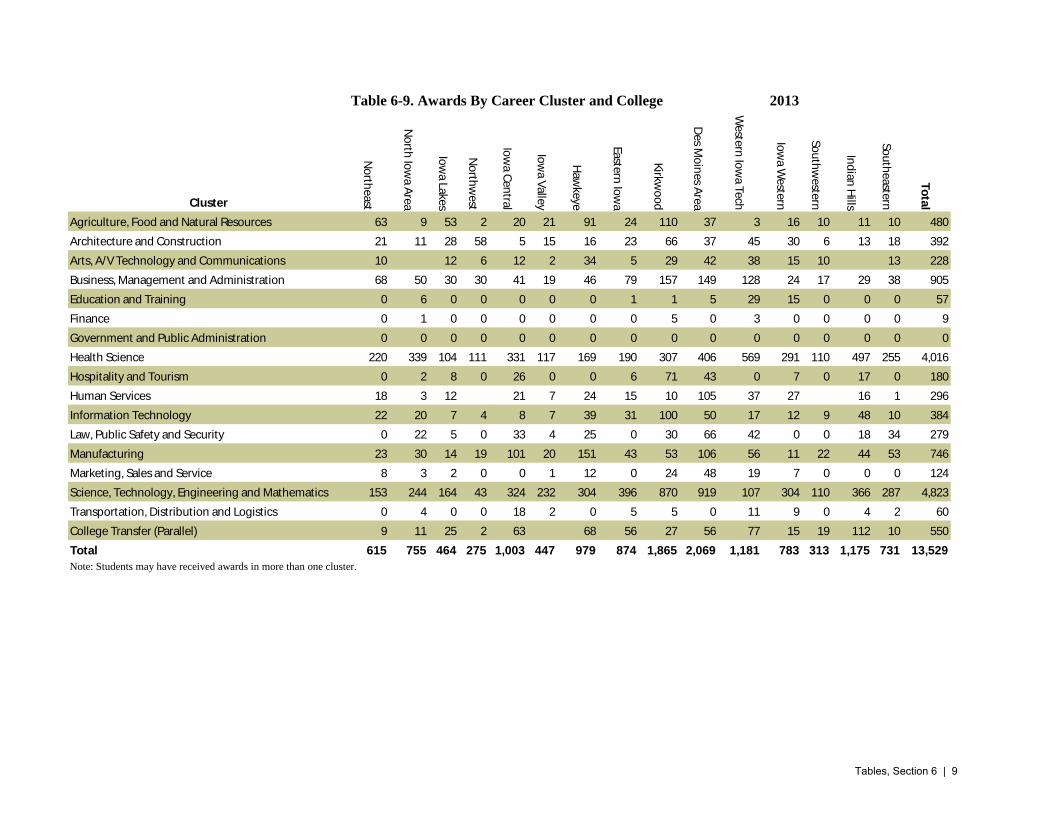
Table 6-9. Awards By Career Cluster and College
Cluster
No
rthe
ast
No
rth Io
wa A
rea
Iow
a Lakes
No
rthw
est
Iow
a Ce
ntral
Iow
a Valle
y
Haw
keye
Eastern
Iow
a
Kirkw
oo
d
De
s Mo
ine
s Are
a
We
stern
Iow
a Tech
Iow
a We
stern
Sou
thw
este
rn
Ind
ian H
ills
Sou
the
astern
To
tal
Agriculture, Food and Natural Resources 63 9 53 2 20 21 91 24 110 37 3 16 10 11 10 480
Architecture and Construction 21 11 28 58 5 15 16 23 66 37 45 30 6 13 18 392
Arts, A/V Technology and Communications 10 12 6 12 2 34 5 29 42 38 15 10 13 228
Business, Management and Administration 68 50 30 30 41 19 46 79 157 149 128 24 17 29 38 905
Education and Training 0 6 0 0 0 0 0 1 1 5 29 15 0 0 0 57
Finance 0 1 0 0 0 0 0 0 5 0 3 0 0 0 0 9
Government and Public Administration 0 0 0 0 0 0 0 0 0 0 0 0 0 0 0 0
Health Science 220 339 104 111 331 117 169 190 307 406 569 291 110 497 255 4,016
Hospitality and Tourism 0 2 8 0 26 0 0 6 71 43 0 7 0 17 0 180
Human Services 18 3 12 21 7 24 15 10 105 37 27 16 1 296
Information Technology 22 20 7 4 8 7 39 31 100 50 17 12 9 48 10 384
Law, Public Safety and Security 0 22 5 0 33 4 25 0 30 66 42 0 0 18 34 279
Manufacturing 23 30 14 19 101 20 151 43 53 106 56 11 22 44 53 746
Marketing, Sales and Service 8 3 2 0 0 1 12 0 24 48 19 7 0 0 0 124
Science, Technology, Engineering and Mathematics 153 244 164 43 324 232 304 396 870 919 107 304 110 366 287 4,823
Transportation, Distribution and Logistics 0 4 0 0 18 2 0 5 5 0 11 9 0 4 2 60
College Transfer (Parallel) 9 11 25 2 63 68 56 27 56 77 15 19 112 10 550
Total 615 755 464 275 1,003 447 979 874 1,865 2,069 1,181 783 313 1,175 731 13,529
Note: Students may have received awards in more than one cluster.
2013
Tables, Section 6 | 9

Table 6-10. Awards By Career Cluster and College
Cluster
No
rthe
ast
No
rth Io
wa A
rea
Iow
a Lakes
No
rthw
est
Iow
a Ce
ntral
Iow
a Valle
y
Haw
keye
Eastern
Iow
a
Kirkw
oo
d
De
s Mo
ine
s Are
a
We
stern
Iow
a Tech
Iow
a We
stern
Sou
thw
este
rn
Ind
ian H
ills
Sou
the
astern
To
tal
Agriculture, Food and Natural Resources 60 9 37 13 19 104 24 183 56 2 17 7 12 3 546
Architecture and Construction 35 10 34 101 9 19 43 27 101 63 96 41 18 17 11 625
Arts, A/V Technology and Communications 2 10 5 19 6 52 3 21 66 71 21 3 4 6 289
Business, Management and Administration 39 25 16 18 27 8 27 89 139 81 163 12 17 21 30 712
Education and Training 6 3 10 91 14 124
Finance 31 10 14 16 23 4 13 12 27 53 21 10 5 15 8 262
Government and Public Administration 0 0 0 0 0 0 0 0 0 0 0 0 0 0 0 0
Health Science 286 386 151 120 329 130 253 197 497 506 593 380 102 398 149 4,477
Hospitality and Tourism 3 14 21 18 56 58 31 13 214
Human Services 33 1 10 27 5 28 21 8 196 44 19 9 6 407
Information Technology 18 16 2 2 7 6 39 35 104 87 15 21 6 47 4 409
Law, Public Safety and Security 1 12 7 37 4 21 1 28 91 55 7 29 293
Manufacturing 33 54 15 36 103 19 181 78 40 165 60 32 10 87 42 955
Marketing, Sales and Service 8 8 5 1 18 20 58 12 6 136
Science, Technology, Engineering and Mathematics 1 1 9 11 5 22 6 1 56
Transportation, Distribution and Logistics 27 23 38 40 57 12 63 51 46 72 78 63 16 39 24 649
College Transfer (Parallel) 180 270 157 46 347 299 364 513 951 1,249 158 448 84 309 239 5,614
Total 753 834 511 384 1,028 543 1,206 1,077 2,221 2,811 1,481 1,121 268 978 552 15,768
Note: Students may have received awards in more than one cluster.
2014
Tables, Section 6 | 10
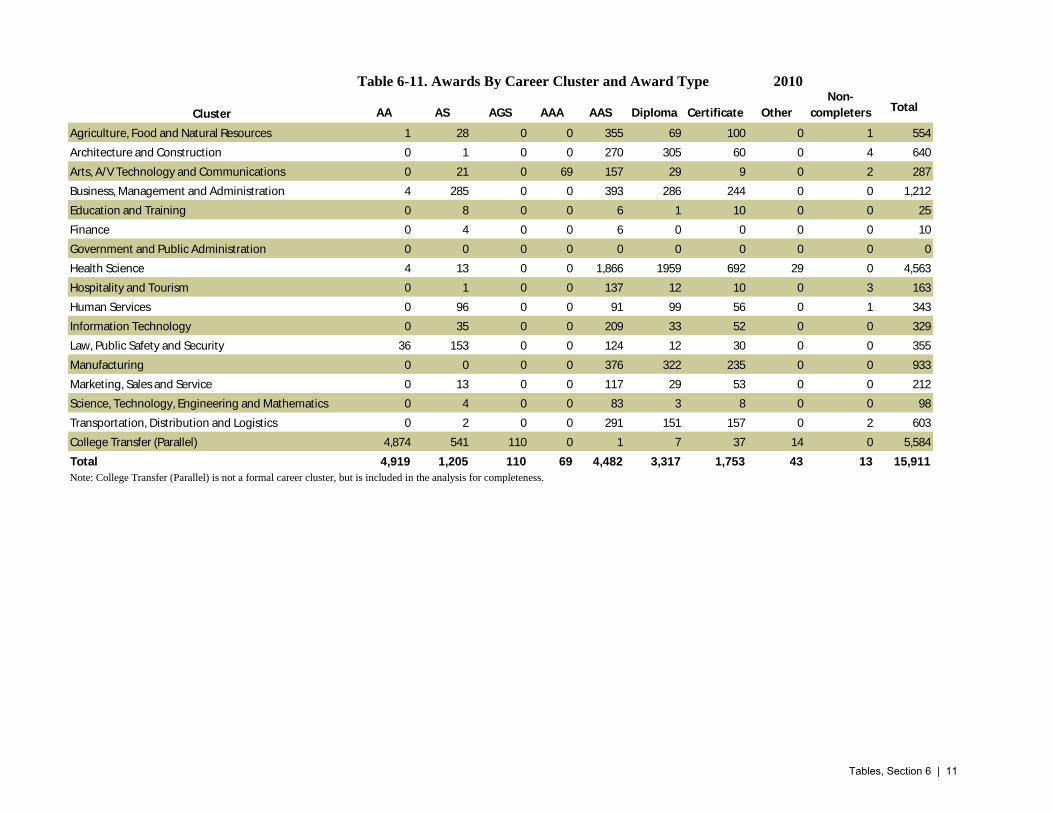
Table 6-11. Awards By Career Cluster and Award Type 2010
Cluster AA AS AGS AAA AAS Diploma Certificate Other
Non-
completers Total
Agriculture, Food and Natural Resources 1 28 0 0 355 69 100 0 1 554
Architecture and Construction 0 1 0 0 270 305 60 0 4 640
Arts, A/V Technology and Communications 0 21 0 69 157 29 9 0 2 287
Business, Management and Administration 4 285 0 0 393 286 244 0 0 1,212
Education and Training 0 8 0 0 6 1 10 0 0 25
Finance 0 4 0 0 6 0 0 0 0 10
Government and Public Administration 0 0 0 0 0 0 0 0 0 0
Health Science 4 13 0 0 1,866 1959 692 29 0 4,563
Hospitality and Tourism 0 1 0 0 137 12 10 0 3 163
Human Services 0 96 0 0 91 99 56 0 1 343
Information Technology 0 35 0 0 209 33 52 0 0 329
Law, Public Safety and Security 36 153 0 0 124 12 30 0 0 355
Manufacturing 0 0 0 0 376 322 235 0 0 933
Marketing, Sales and Service 0 13 0 0 117 29 53 0 0 212
Science, Technology, Engineering and Mathematics 0 4 0 0 83 3 8 0 0 98
Transportation, Distribution and Logistics 0 2 0 0 291 151 157 0 2 603
College Transfer (Parallel) 4,874 541 110 0 1 7 37 14 0 5,584
Total 4,919 1,205 110 69 4,482 3,317 1,753 43 13 15,911
Note: College Transfer (Parallel) is not a formal career cluster, but is included in the analysis for completeness.
Tables, Section 6 | 11

Table 6-12. Awards By Career Cluster and Award Type 2011
Cluster AA AS AGS AAA AAS Diploma Certificate Other
Non-
completers Total
Agriculture, Food and Natural Resources 0 28 0 0 414 98 125 0 0 665
Architecture and Construction 0 0 0 0 312 357 124 0 0 793
Arts, A/V Technology and Communications 0 24 0 65 178 38 12 0 0 317
Business, Management and Administration 3 327 0 0 417 317 313 0 1 1,378
Education and Training 0 9 0 0 10 5 17 0 0 41
Finance 0 5 0 0 10 0 0 0 0 15
Government and Public Administration 0 0 0 0 0 0 0 0 0 0
Health Science 5 36 0 0 2,007 1997 693 19 1 4,758
Hospitality and Tourism 0 0 0 0 142 26 4 0 0 172
Human Services 0 100 0 0 100 139 96 0 0 435
Information Technology 1 36 0 0 270 41 59 0 0 407
Law, Public Safety and Security 33 164 0 0 156 7 49 0 0 409
Manufacturing 0 0 0 0 438 466 324 0 0 1,228
Marketing, Sales and Service 0 12 0 0 93 21 34 0 0 160
Science, Technology, Engineering and Mathematics 0 6 0 0 107 53 0 0 2 168
Transportation, Distribution and Logistics 0 4 0 0 411 180 324 0 8 927
College Transfer (Parallel) 5,209 659 163 0 4 7 6 0 397 6,445
Total 5,251 1,410 163 65 5,069 3,752 2,180 19 409 18,318
Note: College Transfer (Parallel) is not a formal career cluster, but is included in the analysis for completeness.
Tables, Section 6 | 12
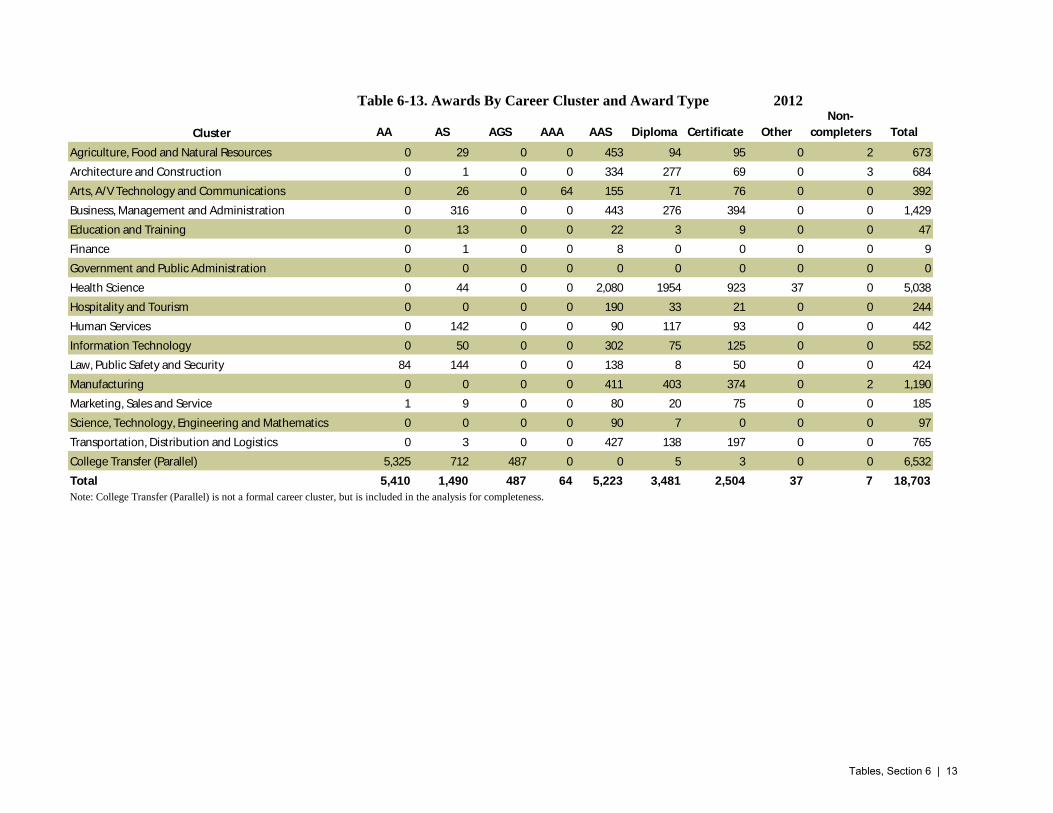
Table 6-13. Awards By Career Cluster and Award Type 2012
Cluster AA AS AGS AAA AAS Diploma Certificate Other
Non-
completers Total
Agriculture, Food and Natural Resources 0 29 0 0 453 94 95 0 2 673
Architecture and Construction 0 1 0 0 334 277 69 0 3 684
Arts, A/V Technology and Communications 0 26 0 64 155 71 76 0 0 392
Business, Management and Administration 0 316 0 0 443 276 394 0 0 1,429
Education and Training 0 13 0 0 22 3 9 0 0 47
Finance 0 1 0 0 8 0 0 0 0 9
Government and Public Administration 0 0 0 0 0 0 0 0 0 0
Health Science 0 44 0 0 2,080 1954 923 37 0 5,038
Hospitality and Tourism 0 0 0 0 190 33 21 0 0 244
Human Services 0 142 0 0 90 117 93 0 0 442
Information Technology 0 50 0 0 302 75 125 0 0 552
Law, Public Safety and Security 84 144 0 0 138 8 50 0 0 424
Manufacturing 0 0 0 0 411 403 374 0 2 1,190
Marketing, Sales and Service 1 9 0 0 80 20 75 0 0 185
Science, Technology, Engineering and Mathematics 0 0 0 0 90 7 0 0 0 97
Transportation, Distribution and Logistics 0 3 0 0 427 138 197 0 0 765
College Transfer (Parallel) 5,325 712 487 0 0 5 3 0 0 6,532
Total 5,410 1,490 487 64 5,223 3,481 2,504 37 7 18,703
Note: College Transfer (Parallel) is not a formal career cluster, but is included in the analysis for completeness.
Tables, Section 6 | 13

Table 6-14. Awards By Career Cluster and Award Type 2013
Cluster AA AS AGS AAA AAS Diploma Certificate Other
Non-
completers Total
Agriculture, Food and Natural Resources 0 23 0 0 409 75 101 0 2 610
Architecture and Construction 0 1 0 0 247 163 152 0 3 566
Arts, A/V Technology and Communications 0 15 0 45 127 52 42 0 0 281
Business, Management and Administration 2 207 0 0 415 256 386 0 0 1,266
Education and Training 0 7 0 0 16 5 30 0 0 58
Finance 0 1 0 0 9 0 0 0 0 10
Government and Public Administration 0 0 0 0 0 0 0 0 0 0
Health Science 0 39 0 0 1,756 1415 898 62 3 4,173
Hospitality and Tourism 0 0 0 0 155 42 9 0 0 206
Human Services 0 99 0 0 85 127 111 0 0 422
Information Technology 0 40 0 0 275 51 124 0 0 490
Law, Public Safety and Security 17 119 0 0 106 12 53 0 0 307
Manufacturing 0 0 0 0 334 283 398 0 2 1,017
Marketing, Sales and Service 0 7 0 0 71 18 67 0 1 164
Science, Technology, Engineering and Mathematics 4,438 580 227 0 0 6 7 0 0 5,258
Transportation, Distribution and Logistics 0 2 0 0 71 3 0 0 2 78
College Transfer (Parallel) 0 4 0 0 330 102 276 0 9 721
Total 4,457 1,144 227 45 4,406 2,610 2,654 62 22 15,627
Note: College Transfer (Parallel) is not a formal career cluster, but is included in the analysis for completeness.
Tables, Section 6 | 14

Table 6-15. Awards By Career Cluster and Award Type 2014
Cluster AA AS AGS AAA AAS Diploma Certificate Other
Non-
completers Total
Agriculture, Food and Natural Resources 0 11 0 8 462 109 87 0 2 679
Architecture and Construction 0 1 0 20 329 354 169 0 4 877
Arts, A/V Technology and Communications 0 12 0 55 160 81 29 0 0 337
Business, Management and Administration 0 137 0 15 313 129 388 0 0 982
Education and Training 0 8 0 0 19 12 101 0 0 140
Finance 0 65 0 5 111 116 40 0 0 337
Government and Public Administration 0 0 0 0 0 0 0 0 0 0
Health Science 0 26 0 54 2,012 1861 975 0 6 4,934
Hospitality and Tourism 0 0 0 0 190 47 47 0 1 285
Human Services 0 120 0 0 97 166 164 0 0 547
Information Technology 0 23 0 8 305 44 144 0 0 524
Law, Public Safety and Security 8 132 0 0 123 10 43 0 0 316
Manufacturing 0 0 0 2 449 404 515 0 2 1,372
Marketing, Sales and Service 0 10 0 0 76 19 53 0 0 158
Science, Technology, Engineering and Mathematics 5,346 736 147 0 0 19 10 0 0 6,258
Transportation, Distribution and Logistics 0 1 0 0 66 1 1 0 0 69
College Transfer (Parallel) 0 5 0 9 437 215 198 0 1 865
Total 5,354 1,287 147 176 5,149 3,587 2,964 0 16 18,680
Note: College Transfer (Parallel) is not a formal career cluster, but is included in the analysis for completeness.
Tables, Section 6 | 15
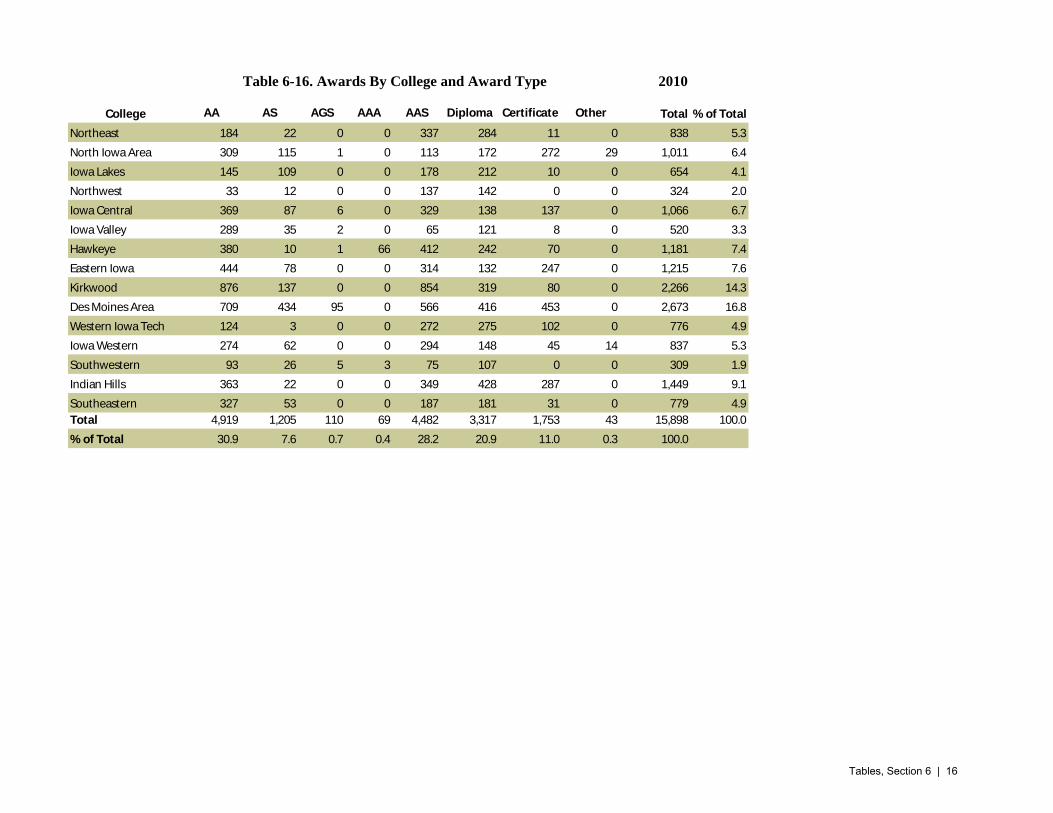
Table 6-16. Awards By College and Award Type 2010
College AA AS AGS AAA AAS Diploma Certificate Other Total % of Total
Northeast 184 22 0 0 337 284 11 0 838 5.3
North Iowa Area 309 115 1 0 113 172 272 29 1,011 6.4
Iowa Lakes 145 109 0 0 178 212 10 0 654 4.1
Northwest 33 12 0 0 137 142 0 0 324 2.0
Iowa Central 369 87 6 0 329 138 137 0 1,066 6.7
Iowa Valley 289 35 2 0 65 121 8 0 520 3.3
Hawkeye 380 10 1 66 412 242 70 0 1,181 7.4
Eastern Iowa 444 78 0 0 314 132 247 0 1,215 7.6
Kirkwood 876 137 0 0 854 319 80 0 2,266 14.3
Des Moines Area 709 434 95 0 566 416 453 0 2,673 16.8
Western Iowa Tech 124 3 0 0 272 275 102 0 776 4.9
Iowa Western 274 62 0 0 294 148 45 14 837 5.3
Southwestern 93 26 5 3 75 107 0 0 309 1.9
Indian Hills 363 22 0 0 349 428 287 0 1,449 9.1
Southeastern 327 53 0 0 187 181 31 0 779 4.9
Total 4,919 1,205 110 69 4,482 3,317 1,753 43 15,898 100.0
% of Total 30.9 7.6 0.7 0.4 28.2 20.9 11.0 0.3 100.0
Tables, Section 6 | 16
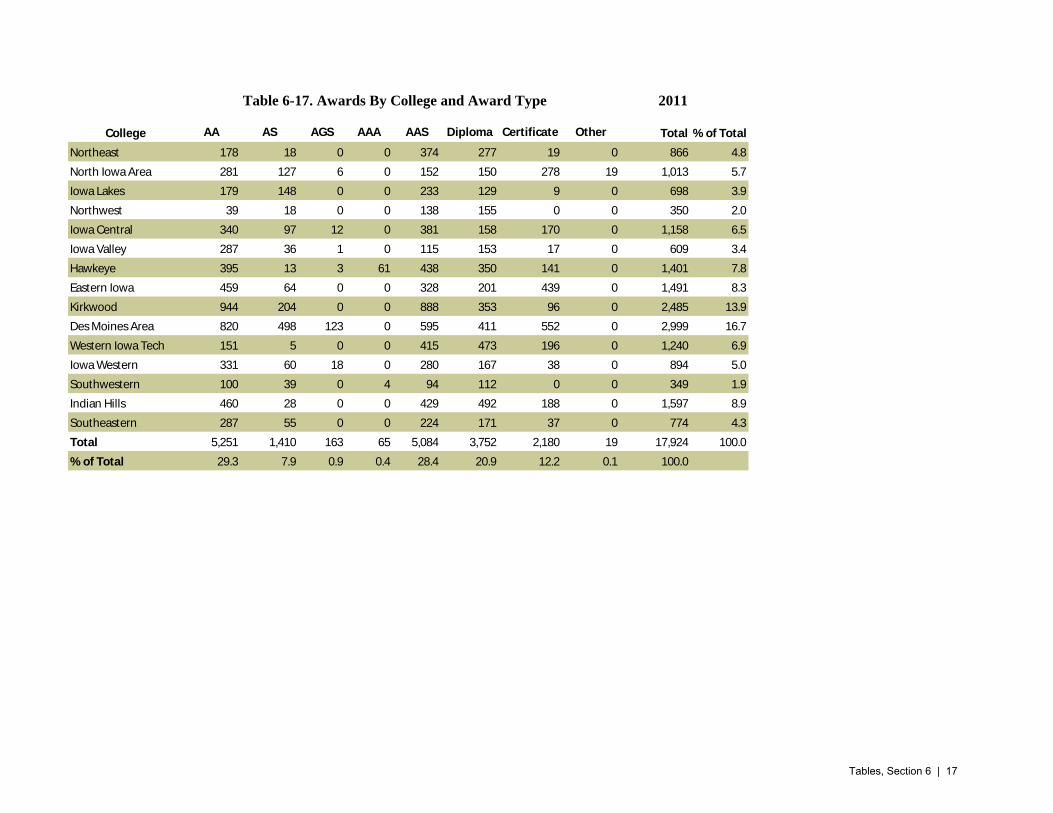
Table 6-17. Awards By College and Award Type 2011
College AA AS AGS AAA AAS Diploma Certificate Other Total % of Total
Northeast 178 18 0 0 374 277 19 0 866 4.8
North Iowa Area 281 127 6 0 152 150 278 19 1,013 5.7
Iowa Lakes 179 148 0 0 233 129 9 0 698 3.9
Northwest 39 18 0 0 138 155 0 0 350 2.0
Iowa Central 340 97 12 0 381 158 170 0 1,158 6.5
Iowa Valley 287 36 1 0 115 153 17 0 609 3.4
Hawkeye 395 13 3 61 438 350 141 0 1,401 7.8
Eastern Iowa 459 64 0 0 328 201 439 0 1,491 8.3
Kirkwood 944 204 0 0 888 353 96 0 2,485 13.9
Des Moines Area 820 498 123 0 595 411 552 0 2,999 16.7
Western Iowa Tech 151 5 0 0 415 473 196 0 1,240 6.9
Iowa Western 331 60 18 0 280 167 38 0 894 5.0
Southwestern 100 39 0 4 94 112 0 0 349 1.9
Indian Hills 460 28 0 0 429 492 188 0 1,597 8.9
Southeastern 287 55 0 0 224 171 37 0 774 4.3
Total 5,251 1,410 163 65 5,084 3,752 2,180 19 17,924 100.0
% of Total 29.3 7.9 0.9 0.4 28.4 20.9 12.2 0.1 100.0
Tables, Section 6 | 17

Table 6-19. Awards By College and Award Type 2012
College AA AS AGS AAA AAS Diploma Certificate Other Total % of Total
Northeast 197 34 0 0 339 256 26 0 852 4.6
North Iowa Area 306 146 8 0 120 137 266 37 1,020 5.5
Iowa Lakes 161 137 0 0 229 95 11 0 633 3.4
Northwest 44 23 0 0 153 187 0 0 407 2.2
Iowa Central 449 104 22 0 403 169 176 0 1,323 7.1
Iowa Valley 292 40 2 0 67 134 5 0 540 2.9
Hawkeye 340 11 2 59 421 334 208 0 1,375 7.4
Eastern Iowa 442 66 0 0 412 194 375 0 1,489 8.0
Kirkwood 958 189 0 0 985 267 85 0 2,484 13.3
Des Moines Area 923 495 429 0 617 469 558 0 3,491 18.7
Western Iowa Tech 153 15 0 0 389 371 525 0 1,453 7.8
Iowa Western 292 79 21 0 294 191 48 0 925 4.9
Southwestern 125 52 2 5 91 97 0 0 372 2.0
Indian Hills 459 32 1 0 515 420 202 0 1,629 8.7
Southeastern 269 67 0 0 188 160 19 0 703 3.8
Total 5,410 1,490 487 64 5,223 3,481 2,504 37 18,696 100.0
% of Total 28.9 8.0 2.6 0.3 27.9 18.6 13.4 0.2 100.0
Tables, Section 6 | 18

Table 6-19. Awards By College and Award Type 2013
College AA AS AGS AAA AAS Diploma Certificate Other Total % of Total
Northeast 152 22 0 0 296 181 31 0 682 4.4
North Iowa Area 245 112 6 0 147 87 214 62 873 5.6
Iowa Lakes 156 125 0 0 214 38 3 0 536 3.4
Northwest 44 14 0 0 125 114 0 0 297 1.9
Iowa Central 334 84 9 0 360 119 170 0 1,076 6.9
Iowa Valley 230 21 0 0 93 119 1 0 464 3.0
Hawkeye 330 18 0 35 358 281 199 0 1,221 7.8
Eastern Iowa 369 61 0 0 332 106 261 0 1,129 7.2
Kirkwood 788 168 0 0 743 187 107 0 1,993 12.8
Des Moines Area 740 351 183 0 447 338 501 0 2,560 16.4
Western Iowa Tech 112 16 0 0 328 404 892 0 1,752 11.2
Iowa Western 259 43 27 0 299 162 39 0 829 5.3
Southwestern 106 34 2 10 75 95 15 0 337 2.2
Indian Hills 385 19 0 0 417 270 207 0 1,298 8.3
Southeastern 207 56 0 0 172 109 14 0 558 3.6
Total 4,457 1,144 227 45 4,406 2,610 2,654 62 15,605 100.0
% of Total 28.6 7.3 1.5 0.3 28.2 16.7 17.0 0.4 100.0
Tables, Section 6 | 19

Table 6-20. Awards By College and Award Type 2014
College AA AS AGS AAA AAS Diploma Certificate Other Total % of Total
Northeast 183 27 0 0 313 308 34 0 865 4.5
North Iowa Area 293 76 8 0 164 138 327 0 1,006 5.3
Iowa Lakes 155 100 0 0 214 119 10 0 598 3.1
Northwest 48 12 0 0 161 188 0 0 409 2.1
Iowa Central 410 136 18 0 414 123 198 0 1,299 6.8
Iowa Valley 305 19 4 0 105 132 0 0 565 3.0
Hawkeye 373 22 1 62 449 354 187 0 1,448 7.6
Eastern Iowa 460 94 0 0 360 173 341 0 1,428 7.5
Kirkwood 862 190 0 0 932 332 117 0 2,433 12.8
Des Moines Area 1,003 415 348 0 645 469 580 0 3,460 18.2
Western Iowa Tech 162 15 5 0 372 439 997 0 1,990 10.4
Iowa Western 368 81 26 0 399 269 143 0 1,286 6.7
Southwestern 90 16 4 114 0 83 0 0 307 1.6
Indian Hills 388 25 0 0 489 323 45 0 1,270 6.7
Southeastern 285 74 0 0 171 149 18 0 697 3.7
Total 5,385 1,302 414 176 5,188 3,599 2,997 0 19,061 100.0
% of Total 28.3 6.8 2.2 0.9 27.2 18.9 15.7 0.0 100.0
Tables, Section 6 | 20

Table 6-21. Awards in Agriculture, Food, and Natural Resources
Male Female Male Female Male Female Male Female Male Female
Northeast 48 12 56 5 48 7 53 10 47 13
North Iowa Area 12 1 18 6 10 6 7 2 8 1
Iowa Lakes 53 5 50 6 64 7 47 6 35 2
Northwest 0 0 1 0 0 0 2 0
Iowa Central 9 0 15 2 8 4 15 5 13 0
Iowa Valley 15 7 16 10 2 11 8 13 6 13
Hawkeye 65 33 74 31 80 26 63 28 74 30
Eastern Iowa 22 4 10 6 21 7 15 9 19 5
Kirkwood 84 53 104 42 107 51 84 26 100 83
Des Moines Area 81 10 31 22 29 11 31 6 42 14
Western Iowa Tech 2 0 1 0 1 0 3 0 1 1
Iowa Western 13 4 18 0 23 3 13 3 14 3
Southwestern 1 4 11 2 7 5 8 2 6 1
Indian Hills 2 2 2 0 5 2 9 2 9 3
Southeastern 8 1 6 3 6 1 6 4 3 0
Total by Gender 415 136 413 135 411 141 364 116 377 169
Total
Table 6-22. Awards in Architecture and Construction
Male Female Male Female Male Female Male Female Male Female
Northeast 57 1 51 6 53 1 20 1 35 0
North Iowa Area 23 1 16 3 21 1 11 0 9 1
Iowa Lakes 33 1 50 2 48 0 27 1 34 0
Northwest 111 3 90 2 96 2 57 1 100 1
Iowa Central 10 1 25 1 25 2 4 1 9 0
Iowa Valley 22 1 15 1 9 0 15 0 18 1
Hawkeye 26 1 26 1 20 1 15 1 34 9
Eastern Iowa 22 1 28 1 26 2 21 2 17 10
Kirkwood 67 6 89 2 80 5 62 4 89 12
Des Moines Area 82 6 73 8 48 5 37 0 56 7
Western Iowa Tech 78 2 65 2 57 2 44 1 88 8
Iowa Western 30 1 29 0 33 0 30 0 39 2
Southwestern 25 2 23 2 16 1 6 0 17 1
Indian Hills 11 1 22 2 24 0 11 2 17 0
Southeastern 8 0 6 1 7 0 11 7 11 0
Total by Gender 605 28 608 34 563 22 371 21 573 52
Total
College2010 2011 2012 2013 2014
551 548 552 480 546
2014
633 642 585 392 625
College2010 2011 2012 2013
Tables, Section 6 | 21

Table 6-23. Awards in Arts, A/V Technology, and Communications
Male Female Male Female Male Female Male Female Male Female
Northeast 0 5 3 5 0 2 3 7 1 1
North Iowa Area 1 5 1 6 0 0 0 0
Iowa Lakes 8 6 2 9 5 8 5 7 3 7
Northwest 0 4 1 8 2 5 1 5 0 5
Iowa Central 16 5 8 5 5 14 5 7 3 16
Iowa Valley 2 0 0 3 4 1 2 0 3 3
Hawkeye 14 51 12 49 11 47 7 27 11 41
Eastern Iowa 3 5 3 11 2 7 2 3 0 3
Kirkwood 16 31 10 28 10 27 4 25 7 14
Des Moines Area 45 32 32 39 31 52 12 30 23 43
Western Iowa Tech 7 8 8 13 15 21 8 30 37 34
Iowa Western 7 6 14 11 4 6 9 6 15 6
Southwestern 1 2 3 1 0 5 5 5 2 1
Indian Hills 0 0 8 2 0 0 0 0 2 2
Southeastern 1 5 105 5 2 7 7 6 3 3
Total by Gender 121 165 210 195 91 202 70 158 110 179
Total
Table 6-24. Awards in Business Management and Administration
Male Female Male Female Male Female Male Female Male Female
Northeast 17 86 19 66 15 64 19 49
North Iowa Area 18 67 11 46 9 42 12 38 4 2
Iowa Lakes 3 18 13 36 14 32 6 24
Northwest 8 21 8 26 13 26 12 18
Iowa Central 28 41 18 38 15 38 12 29
Iowa Valley 3 15 4 28 1 33 1 18
Hawkeye 2 47 0 30 0 45 1 45
Eastern Iowa 68 132 22 91 38 93 12 67 0 3
Kirkwood 65 106 35 111 36 119 41 116
Des Moines Area 67 171 68 145 49 150 25 124 4 6
Western Iowa Tech 17 47 18 42 20 53 59 69 24 67
Iowa Western 3 21 4 11 3 21 6 18 1 13
Southwestern 2 24 9 23 3 29 4 13
Indian Hills 9 51 2 49 1 34 1 28
Southeastern 7 42 10 40 12 42 14 24
Total by Gender 317 889 241 782 229 821 225 680 33 91
Total
2014
286 405 293 228 289
College2010 2011 2012 2013
2014
1,206 1,023 1,050 905 124
College2010 2011 2012 2013
Tables, Section 6 | 22

Table 6-25. Awards in Education and Training
Male Female Male Female Male Female Male Female Male Female
Northeast 0 0 0 0 0 0 0 0 5 26
North Iowa Area 1 1 0 5 4 3 1 5 1 9
Iowa Lakes 0 0 0 0 0 0 0 0 3 11
Northwest 0 0 0 0 0 0 0 0 3 13
Iowa Central 0 0 0 0 0 0 0 0 4 19
Iowa Valley 0 0 0 0 0 0 0 0 0 4
Hawkeye 0 0 0 0 0 0 0 0 2 11
Eastern Iowa 0 4 0 1 0 5 0 1 2 10
Kirkwood 0 1 0 0 0 1 0 1 6 21
Des Moines Area 6 9 6 6 5 4 5 0 18 35
Western Iowa Tech 0 1 0 9 0 5 2 27 9 12
Iowa Western 0 2 1 8 0 17 3 12 2 8
Southwestern 0 0 0 0 0 0 0 0 1 4
Indian Hills 0 0 0 0 0 0 0 0 2 12
Southeastern 0 0 0 0 0 0 0 0 0 8
Total by Gender 7 18 7 29 9 35 11 46 58 203
Total
Table 6-26. Awards in Finance
Male Female Male Female Male Female Male Female Male Female
Northeast 0 0 0 0 0 0 0 0 5 26
North Iowa Area 0 0 2 2 0 1 0 1 1 9
Iowa Lakes 0 0 0 0 0 0 0 0 3 11
Northwest 0 0 0 0 0 0 0 0 3 13
Iowa Central 0 0 0 0 0 0 0 0 4 19
Iowa Valley 0 0 0 0 0 0 0 0 0 4
Hawkeye 0 0 0 0 0 0 0 0 2 11
Eastern Iowa 0 0 0 0 0 0 0 0 2 10
Kirkwood 3 4 4 3 2 0 1 4 6 21
Des Moines Area 0 0 0 0 0 0 0 0 18 35
Western Iowa Tech 1 2 0 4 2 4 1 2 9 12
Iowa Western 0 0 0 0 0 0 0 0 2 8
Southwestern 0 0 0 0 0 0 0 0 1 4
Indian Hills 0 0 0 0 0 0 0 0 2 12
Southeastern 0 0 0 0 0 0 0 0 0 8
Total by Gender 4 6 6 9 4 5 2 7 58 203
Total
2014
25 36 44 57 261
College2010 2011 2012 2013
2014
10 15 9 9 261
College2010 2011 2012 2013
Tables, Section 6 | 23

Table 6-27. Awards in Government and Public Administration
Male Female Male Female Male Female Male Female Male Female
Northeast 0 0 0 0 0 0 0 0 0 0
North Iowa Area 0 0 0 0 0 0 0 0 0 0
Iowa Lakes 0 0 0 0 0 0 0 0 0 0
Northwest 0 0 0 0 0 0 0 0 0 0
Iowa Central 0 0 0 0 0 0 0 0 0 0
Iowa Valley 0 0 0 0 0 0 0 0 0 0
Hawkeye 0 0 0 0 0 0 0 0 0 0
Eastern Iowa 0 0 0 0 0 0 0 0 0 0
Kirkwood 0 0 0 0 0 0 0 0 0 0
Des Moines Area 0 0 0 0 0 0 0 0 0 0
Western Iowa Tech 0 0 0 0 0 0 0 0 0 0
Iowa Western 0 0 0 0 0 0 0 0 0 0
Southwestern 0 0 0 0 0 0 0 0 0 0
Indian Hills 0 0 0 0 0 0 0 0 0 0
Southeastern 0 0 0 0 0 0 0 0 0 0
Total by Gender 0 0 0 0 0 0 0 0 0 0
Total
Table 6-28. Awards in Health Science
Male Female Male Female Male Female Male Female Male Female
Northeast 22 278 23 272 27 235 17 203 19 267
North Iowa Area 50 364 42 345 41 312 53 286 82 304
Iowa Lakes 27 198 19 121 10 123 10 94 22 129
Northwest 7 77 8 79 11 97 5 106 10 110
Iowa Central 19 338 19 208 22 220 28 303 35 294
Iowa Valley 11 106 10 130 6 115 9 108 6 124
Hawkeye 22 223 20 249 16 212 7 162 20 233
Eastern Iowa 12 188 15 194 25 234 16 174 16 181
Kirkwood 39 483 63 484 49 482 40 267 59 438
Des Moines Area 45 478 40 470 47 468 44 362 49 457
Western Iowa Tech 23 277 30 318 138 461 137 432 121 472
Iowa Western 26 245 24 264 30 288 22 269 41 339
Southwestern 10 110 15 104 13 91 11 99 8 94
Indian Hills 51 506 48 502 77 549 56 434 48 350
Southeastern 17 225 20 207 27 196 86 169 11 138
Total by Gender 381 4,096 396 3,947 539 4,083 541 3,468 547 3,930
Total
2014
0 0 0 0 0
College2010 2011 2012 2013
2014
4,477 4,343 4,622 4,009 4,477
College2010 2011 2012 2013
Tables, Section 6 | 24

Table 6-29. Awards in Hospitality and Tourism
Male Female Male Female Male Female Male Female Male Female
Northeast 0 0 0 0 0 0 0 0
North Iowa Area 2 2 0 1 0 5 0 2 1 2
Iowa Lakes 2 7 5 8 3 9 2 6 7 7
Northwest 0 0 0 0 0 0 0 0
Iowa Central 2 7 8 6 8 3 9 17 7 14
Iowa Valley 0 0 0 0 0 0 0 0
Hawkeye 0 0 0 0 0 0 0 0
Eastern Iowa 2 4 0 4 8 12 4 2 7 11
Kirkwood 22 24 29 31 29 44 25 46 17 39
Des Moines Area 30 32 21 25 39 38 21 22 28 30
Western Iowa Tech 0 0 0 0 0 0 0 0
Iowa Western 6 10 3 4 2 6 2 5 8 23
Southwestern 0 0 0 0 0 0 0 0
Indian Hills 7 2 3 4 4 6 4 13 4 9
Southeastern 0 0 0 0 0 0 0 0
Total by Gender 73 88 69 83 93 123 67 113 79 135
Total
Table 6-30. Awards in Human Services
Male Female Male Female Male Female Male Female Male Female
Northeast 2 28 4 20 1 30 2 16 1 32
North Iowa Area 0 4 1 0 1 10 1 2 0 1
Iowa Lakes 0 20 0 24 1 14 0 12 0 10
Northwest 0 0 0 0 0 0 0 0
Iowa Central 1 31 2 36 2 25 3 18 0 27
Iowa Valley 0 9 0 6 1 10 0 7 0 5
Hawkeye 0 17 0 24 0 23 1 23 0 28
Eastern Iowa 0 23 0 21 0 27 0 15 0 21
Kirkwood 2 22 0 7 1 13 2 8 0 8
Des Moines Area 23 103 24 131 19 139 19 86 44 152
Western Iowa Tech 0 14 0 27 0 30 1 36 2 42
Iowa Western 1 17 0 16 1 10 0 27 0 19
Southwestern 0 0 0 0 0 0 0 0
Indian Hills 0 17 1 22 1 23 1 15 0 9
Southeastern 3 4 1 7 0 1 0 1 0 6
Total by Gender 32 309 33 341 28 355 30 266 47 360
Total
2014
161 152 216 180 214
College2010 2011 2012 2013
2014
341 374 383 296 407
College2010 2011 2012 2013
Tables, Section 6 | 25
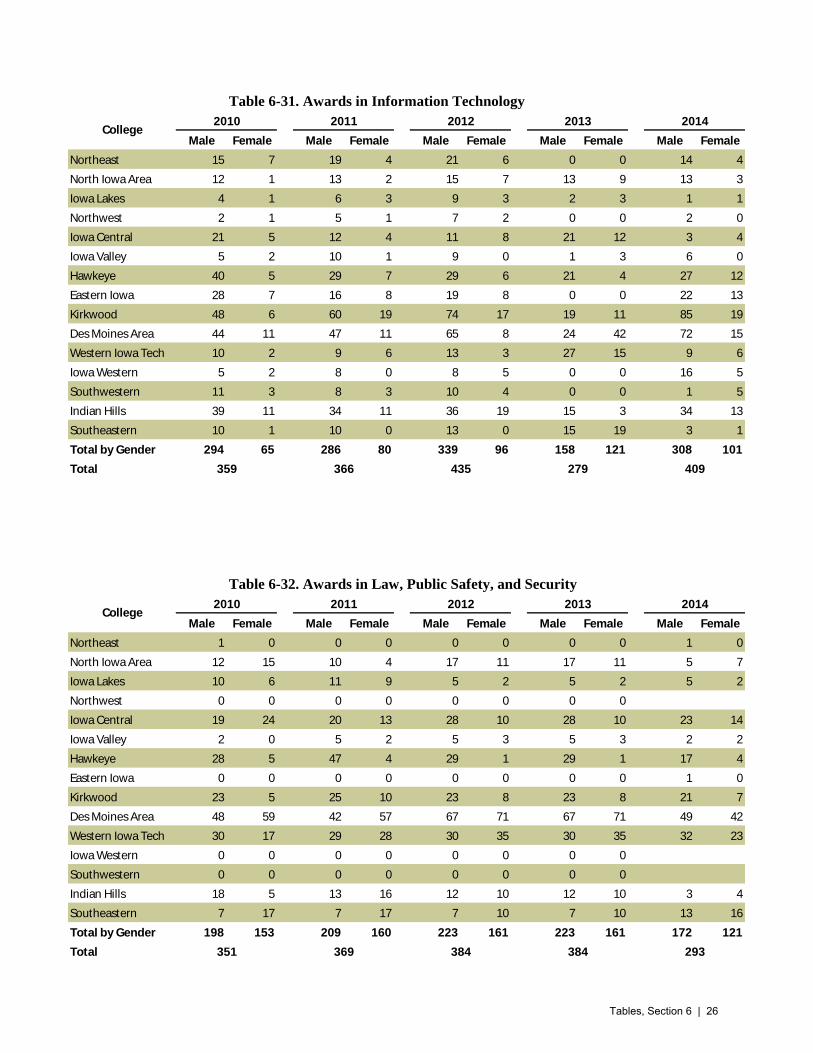
Table 6-31. Awards in Information Technology
Male Female Male Female Male Female Male Female Male Female
Northeast 15 7 19 4 21 6 0 0 14 4
North Iowa Area 12 1 13 2 15 7 13 9 13 3
Iowa Lakes 4 1 6 3 9 3 2 3 1 1
Northwest 2 1 5 1 7 2 0 0 2 0
Iowa Central 21 5 12 4 11 8 21 12 3 4
Iowa Valley 5 2 10 1 9 0 1 3 6 0
Hawkeye 40 5 29 7 29 6 21 4 27 12
Eastern Iowa 28 7 16 8 19 8 0 0 22 13
Kirkwood 48 6 60 19 74 17 19 11 85 19
Des Moines Area 44 11 47 11 65 8 24 42 72 15
Western Iowa Tech 10 2 9 6 13 3 27 15 9 6
Iowa Western 5 2 8 0 8 5 0 0 16 5
Southwestern 11 3 8 3 10 4 0 0 1 5
Indian Hills 39 11 34 11 36 19 15 3 34 13
Southeastern 10 1 10 0 13 0 15 19 3 1
Total by Gender 294 65 286 80 339 96 158 121 308 101
Total
Table 6-32. Awards in Law, Public Safety, and Security
Male Female Male Female Male Female Male Female Male Female
Northeast 1 0 0 0 0 0 0 0 1 0
North Iowa Area 12 15 10 4 17 11 17 11 5 7
Iowa Lakes 10 6 11 9 5 2 5 2 5 2
Northwest 0 0 0 0 0 0 0 0
Iowa Central 19 24 20 13 28 10 28 10 23 14
Iowa Valley 2 0 5 2 5 3 5 3 2 2
Hawkeye 28 5 47 4 29 1 29 1 17 4
Eastern Iowa 0 0 0 0 0 0 0 0 1 0
Kirkwood 23 5 25 10 23 8 23 8 21 7
Des Moines Area 48 59 42 57 67 71 67 71 49 42
Western Iowa Tech 30 17 29 28 30 35 30 35 32 23
Iowa Western 0 0 0 0 0 0 0 0
Southwestern 0 0 0 0 0 0 0 0
Indian Hills 18 5 13 16 12 10 12 10 3 4
Southeastern 7 17 7 17 7 10 7 10 13 16
Total by Gender 198 153 209 160 223 161 223 161 172 121
Total
2014
359 366 435 279 409
College2010 2011 2012 2013
2014
351 369 384 384 293
College2010 2011 2012 2013
Tables, Section 6 | 26

Table 6-33. Awards in Manufacturing
Male Female Male Female Male Female Male Female Male Female
Northeast 20 1 26 0 29 1 23 0 33 0
North Iowa Area 55 0 39 0 39 1 30 0 53 1
Iowa Lakes 21 1 17 0 20 1 13 1 14 1
Northwest 30 0 36 2 36 3 19 0 36 0
Iowa Central 70 6 88 4 88 3 90 11 96 7
Iowa Valley 30 0 39 2 18 2 18 2 19 0
Hawkeye 108 8 152 9 182 13 142 9 164 17
Eastern Iowa 93 5 39 0 58 1 36 7 76 2
Kirkwood 62 3 60 2 48 0 50 3 35 5
Des Moines Area 142 3 113 16 110 4 100 6 158 7
Western Iowa Tech 39 3 43 3 44 4 51 5 57 3
Iowa Western 15 0 12 0 7 0 11 0 31 1
Southwestern 0 0 7 0 4 0 22 0 10 0
Indian Hills 140 9 140 7 94 3 40 4 87 0
Southeastern 59 5 53 3 44 1 28 25 41 1
Total by Gender 884 44 864 48 821 37 673 73 910 45
Total
Table 6-34. Awards in Marketing, Sales and Services
Male Female Male Female Male Female Male Female Male Female
Northeast 7 14 8 12 1 9 2 6 4 4
North Iowa Area 4 1 1 3 3 4 2 1 6 2
Iowa Lakes 3 4 2 3 2 0 1 1 0 5
Northwest 0 0 0 0 0 0 0 0
Iowa Central 0 0 0 0 0 0 0 0
Iowa Valley 0 1 0 0 1 4 0 1 0 1
Hawkeye 5 18 8 10 10 7 7 5 10 8
Eastern Iowa 0 0 0 0 0 0 0 0
Kirkwood 19 10 15 14 8 18 9 15 8 12
Des Moines Area 55 56 20 31 17 44 10 38 14 44
Western Iowa Tech 3 4 1 7 3 4 8 11 5 7
Iowa Western 1 7 0 6 0 6 2 5 1 5
Southwestern 0 0 0 0 0 0 0 0
Indian Hills 0 0 0 0 0 0 0 0
Southeastern 0 0 0 0 0 0 0 0
Total by Gender 97 115 55 86 45 96 41 83 48 88
Total
2014
928 912 858 746 955
College2010 2011 2012 2013
2014
212 141 141 124 136
College2010 2011 2012 2013
Tables, Section 6 | 27

Table 6-35. Awards in Science, Technology, Engineering and Math (STEM)
Male Female Male Female Male Female Male Female Male Female
Northeast 0 0 0 0 0 0 0 0
North Iowa Area 5 0 9 0 2 0 4 0 0 1
Iowa Lakes 7 0 5 0 0 0 0 0 1 0
Northwest 0 0 0 0 0 0 0 0
Iowa Central 14 1 10 3 12 1 18 0 7 2
Iowa Valley 0 0 0 0 0 0 2 0 8 3
Hawkeye 2 0 2 0 0 0 0 0
Eastern Iowa 23 9 3 0 9 12 5 0 4 1
Kirkwood 3 3 0 1 0 2 1 4
Des Moines Area 0 0 0 0 0 0 0 0
Western Iowa Tech 11 2 17 19 12 24 7 4 13 9
Iowa Western 4 4 2 5 1 2 1 8 2 4
Southwestern 0 0 0 0
Indian Hills 4 1 5 5 2 1 3 1
Southeastern 0 0 1 0 0 0 1 1 1 0
Total by Gender 73 20 54 33 38 42 42 18 36 20
Total
Table 6-36. Awards in Transportation, Distribution, and Logistics
Male Female Male Female Male Female Male Female Male Female
Northeast 24 2 16 3 22 0 8 1 27 0
North Iowa Area 8 0 19 1 6 1 9 2 21 2
Iowa Lakes 38 3 64 2 43 0 24 1 37 1
Northwest 27 0 32 2 42 1 2 0 40 0
Iowa Central 34 0 46 1 56 0 62 1 52 5
Iowa Valley 0 0 0 0 0 0 0 0 11 1
Hawkeye 70 7 77 7 60 5 63 5 57 6
Eastern Iowa 45 1 101 8 54 3 50 6 48 3
Kirkwood 36 0 27 2 45 1 26 1 45 1
Des Moines Area 59 4 76 1 84 4 54 2 70 2
Western Iowa Tech 37 2 34 1 26 1 73 4 76 2
Iowa Western 33 0 42 0 40 1 15 0 59 4
Southwestern 21 0 24 1 28 2 18 1 15 1
Indian Hills 91 7 92 1 110 5 102 5 37 2
Southeastern 29 5 28 2 24 1 8 2 23 1
Total by Gender 552 31 678 32 640 25 514 31 618 31
Total
2014
93 87 80 60 56
College2010 2011 2012 2013
2014
583 710 665 545 649
College2010 2011 2012 2013
Tables, Section 6 | 28

Table 6-37. Awards in College Transfer (Parallel)
Male Female Male Female Male Female Male Female Male Female
Northeast 76 126 59 119 66 145 52 101 78 102
North Iowa Area 157 179 110 177 118 169 90 154 119 151
Iowa Lakes 61 103 68 122 67 106 72 92 51 106
Northwest 13 19 14 24 14 30 19 24 16 30
Iowa Central 167 198 144 184 185 251 140 184 149 198
Iowa Valley 136 157 124 158 149 149 107 125 146 153
Hawkeye 159 225 173 221 129 205 112 192 151 213
Eastern Iowa 205 314 169 313 163 313 146 250 210 303
Kirkwood 420 540 625 854 451 610 385 485 453 498
Des Moines Area 409 550 423 638 436 701 386 533 499 750
Western Iowa Tech 33 85 42 77 58 96 27 80 58 100
Iowa Western 200 177 163 215 180 195 138 166 211 237
Southwestern 26 71 35 67 35 89 28 82 21 63
Indian Hills 148 224 146 293 151 290 127 239 97 212
Southeastern 121 206 104 174 98 169 117 170 81 158
Total by Gender 2,331 3,174 2,399 3,636 2,300 3,518 1,946 2,877 2,340 3,274
Total
2014
5,505 6,035 5,818 4,823 5,614
College2010 2011 2012 2013
Tables, Section 6 | 29

Table 6-38. Awards by Career Cluster and Ethnicity/Race 2010
Cluster
American
Indian Asian Black
Hawaiian/Pacific
Islander Hispanic
Two or
More Races White
Not
Reported Total
Agriculture, Food and Natural Resources 2 1 4 0 2 3 508 19 536
Architecture and Construction 7 5 10 0 18 0 509 43 580
Arts, A/V Technology and Communications 3 4 2 0 4 0 245 15 266
Business, Management and Administration 17 31 52 0 26 1 916 127 1,122
Education and Training 0 1 0 0 6 0 14 1 21
Finance 0 1 0 0 0 0 5 2 7
Government and Public Administration 0 47 0 0 0 0 0 47 47
Health Science 22 47 116 1 72 17 3,731 434 4,371
Hospitality and Tourism 0 4 6 0 3 0 129 11 149
Human Services 2 3 18 0 5 0 276 23 322
Information Technology 4 11 4 0 9 0 265 29 307
Law, Public Safety and Security 1 4 10 0 12 0 278 22 322
Manufacturing 7 15 30 0 30 0 746 68 874
Marketing, Sales and Service 2 2 5 0 0 0 177 21 203
Science, Technology, Engineering and Mathematics 0 0 2 0 16 0 58 11 87
Transportation, Distribution and Logistics 4 5 21 1 16 2 473 45 558
College Transfer (Parallel) 28 73 183 3 377 10 4,370 498 5,441
Total 99 254 463 5 596 33 12,700 1,416 15,213Note: "Not Reported" includes students without no responses and students reported with unknown race/ethnicity.
Tables, Section 6 | 30
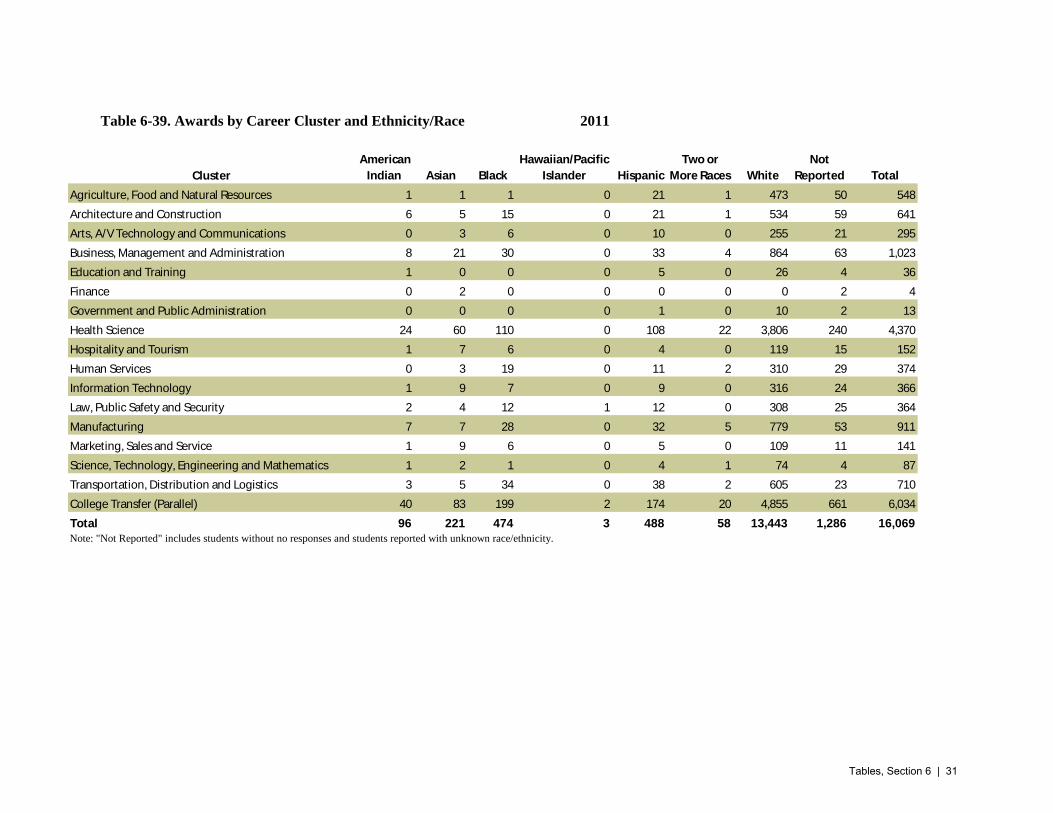
Table 6-39. Awards by Career Cluster and Ethnicity/Race 2011
Cluster
American
Indian Asian Black
Hawaiian/Pacific
Islander Hispanic
Two or
More Races White
Not
Reported Total
Agriculture, Food and Natural Resources 1 1 1 0 21 1 473 50 548
Architecture and Construction 6 5 15 0 21 1 534 59 641
Arts, A/V Technology and Communications 0 3 6 0 10 0 255 21 295
Business, Management and Administration 8 21 30 0 33 4 864 63 1,023
Education and Training 1 0 0 0 5 0 26 4 36
Finance 0 2 0 0 0 0 0 2 4
Government and Public Administration 0 0 0 0 1 0 10 2 13
Health Science 24 60 110 0 108 22 3,806 240 4,370
Hospitality and Tourism 1 7 6 0 4 0 119 15 152
Human Services 0 3 19 0 11 2 310 29 374
Information Technology 1 9 7 0 9 0 316 24 366
Law, Public Safety and Security 2 4 12 1 12 0 308 25 364
Manufacturing 7 7 28 0 32 5 779 53 911
Marketing, Sales and Service 1 9 6 0 5 0 109 11 141
Science, Technology, Engineering and Mathematics 1 2 1 0 4 1 74 4 87
Transportation, Distribution and Logistics 3 5 34 0 38 2 605 23 710
College Transfer (Parallel) 40 83 199 2 174 20 4,855 661 6,034
Total 96 221 474 3 488 58 13,443 1,286 16,069Note: "Not Reported" includes students without no responses and students reported with unknown race/ethnicity.
Tables, Section 6 | 31

Table 6-40. Awards by Career Cluster and Ethnicity/Race 2012
Cluster
American
Indian Asian Black
Hawaiian/Pacific
Islander Hispanic
Two or
More Races White
Not
Reported Total
Agriculture, Food and Natural Resources 3 1 2 0 5 1 442 98 552
Architecture and Construction 4 5 12 0 19 2 479 64 585
Arts, A/V Technology and Communications 1 8 1 0 4 0 255 24 293
Business, Management and Administration 8 23 40 0 33 14 841 92 1,051
Education and Training 0 0 2 0 3 0 36 3 44
Finance 0 1 0 0 0 0 7 1 9
Government and Public Administration 0 0 0 0 0 0 0 0 0
Health Science 22 53 132 3 145 24 3,932 332 4,643
Hospitality and Tourism 0 9 11 0 6 1 158 31 216
Human Services 1 2 28 0 7 3 307 35 383
Information Technology 3 13 10 0 7 1 367 34 435
Law, Public Safety and Security 1 3 11 0 18 2 314 35 384
Manufacturing 5 5 32 0 38 6 721 52 859
Marketing, Sales and Service 2 10 5 0 1 1 107 15 141
Science, Technology, Engineering and Mathematics 0 0 0 0 20 1 49 10 80
Transportation, Distribution and Logistics 5 3 22 0 30 8 552 52 672
College Transfer (Parallel) 33 118 227 6 219 38 4,571 604 5,816
Total 88 254 535 9 555 102 13,138 1,482 16,163Note: "Not Reported" includes students without no responses and students reported with unknown race/ethnicity.
Tables, Section 6 | 32

Table 6-41. Awards by Career Cluster and Ethnicity/Race 2013
Cluster
American
Indian Asian Black
Hawaiian/Pacific
Islander Hispanic
Two or
More Races White
Not
Reported Total
Agriculture, Food and Natural Resources 2 1 4 0 55 2 442 22 528
Architecture and Construction 4 5 14 0 54 2 326 17 422
Arts, A/V Technology and Communications 1 4 4 0 25 4 190 8 236
Business, Management and Administration 9 14 26 1 105 6 748 54 963
Education and Training 1 2 1 0 5 0 48 3 60
Finance 1 0 0 0 1 0 7 1 10
Government and Public Administration 0 0 0 0 0 0 0 0 0
Health Science 21 45 123 5 475 37 3,336 214 4,256
Hospitality and Tourism 1 3 8 0 27 4 144 16 203
Human Services 3 6 19 0 21 2 239 17 307
Information Technology 2 6 5 0 43 5 330 26 417
Law, Public Safety and Security 2 5 8 0 18 1 226 12 272
Manufacturing 10 8 33 0 64 2 623 24 764
Marketing, Sales and Service 2 0 8 0 13 1 98 11 133
Science, Technology, Engineering and Mathematics 1 1 0 0 5 1 53 3 64
Transportation, Distribution and Logistics 6 6 30 0 61 7 435 34 579
College Transfer (Parallel) 28 73 209 7 455 41 3,953 236 5,002
Total 94 179 492 13 1,427 115 11,198 698 14,216Note: "Not Reported" includes students without no responses and students reported with unknown race/ethnicity.
Tables, Section 6 | 33

Table 6-42. Awards by Career Cluster and Ethnicity/Race 2014
Cluster
American
Indian Asian Black
Hawaiian/Pacific
Islander Hispanic
Two or
More Races White
Not
Reported Total
Agriculture, Food and Natural Resources 0 4 3 0 10 2 499 28 546
Architecture and Construction 6 7 14 0 38 6 528 26 625
Arts, A/V Technology and Communications 4 8 6 1 14 6 241 9 289
Business, Management and Administration 4 16 26 0 42 9 565 49 711
Education and Training 1 0 0 0 10 1 107 5 124
Finance 2 8 8 0 6 0 224 14 262
Government and Public Administration 0 0 0 0 0 0 0 0 0
Health Science 24 53 157 4 209 37 3,798 188 4,470
Hospitality and Tourism 0 13 7 1 15 3 168 7 214
Human Services 5 1 23 0 13 6 342 17 407
Information Technology 2 19 12 2 15 1 331 27 409
Law, Public Safety and Security 4 5 11 0 15 4 239 15 293
Manufacturing 12 12 45 0 40 9 809 28 955
Marketing, Sales and Service 0 1 6 0 2 1 117 8 135
Science, Technology, Engineering and Mathematics 1 0 2 0 5 1 39 8 56
Transportation, Distribution and Logistics 7 6 34 2 45 6 529 20 649
College Transfer (Parallel) 26 88 290 8 296 81 4,552 272 5,613
Total 98 241 644 18 775 173 13,088 721 15,758Note: "Not Reported" includes students without no responses and students reported with unknown race/ethnicity.
Tables, Section 6 | 34

Table 6-43. Awards by Ethnicity/Race and Award Type 2010
N % N % N % N % N % N % N % N % N %
American Indian 25 0.5 5 0.4 1 1.0 1 1.5 27 0.6 26 0.8 11 0.8 0 0.0 96 0.7
Asian 60 1.3 25 2.2 1 1.0 0 0.0 52 1.2 40 1.3 17 1.3 0 0.0 195 1.3
Black 146 3.1 48 4.2 5 5.1 0 0.0 87 2.1 92 2.9 51 3.9 7 16.7 436 3.0
Hawaiian/Pacific
Islander 2 0.0 1 0.1 0 0.0 0 0.0 0 0.0 0 0.0 2 0.2 0 0.0 5 0.0
Hispanic 149 3.2 24 2.1 0 0.0 0 0.0 102 2.4 74 2.3 44 3.3 1 0.0 394 2.7
Two or more races 9 0.2 2 0.2 0 0.0 0 0.0 7 0.2 9 0.3 6 0.5 0 0.0 33 0.2
White 3,815 81.7 945 82.5 87 87.9 66 98.5 3,605 85.3 2,630 83.4 1,049 79.5 33 78.6 12,230 83.1
Not Reported 463 9.9 96 8.4 5 5.1 0 0.0 347 8.2 282 8.9 139 10.5 1 0.0 1,333 9.1
Total 4,669 1,146 99 67 4,227 3,153 1,319 42 14,722
Table 6-44. Awards by Ethnicity/Race and Award Type 2011
N % N % N % N % N % N % N % N % N %
American Indian 36 0.7 5 0.4 1 0.6 0 0.0 25 0.5 24 0.7 14 0.9 0 0.0 105 0.6
Asian 65 1.3 34 2.4 1 0.6 1 1.5 64 1.3 43 1.2 24 1.5 0 0.0 232 1.4
Black 160 3.1 64 4.6 8 4.9 1 1.5 103 2.1 89 2.4 76 4.7 0 0.0 501 2.9 Hawaiian/Pacific
Islander 2 0.0 1 0.1 0 0.0 0 0.0 0 0.0 2 0.1 1 0.1 0 0.0 6 0.0
Hispanic 159 3.1 44 3.2 5 3.1 2 3.0 94 1.9 153 4.2 84 5.2 1 5.3 542 3.2
Two or more races 18 0.3 4 0.3 1 0.6 0 0.0 13 0.3 14 0.4 12 0.7 0 0.0 62 0.4
White 4,226 81.6 1,118 80.1 132 81.5 62 92.5 4,274 86.3 3,003 81.8 1,215 75.7 17 89.5 14,047 82.4
Not Reported 516 10.0 125 9.0 14 8.6 1 1.5 378 7.6 344 9.4 179 11.2 1 5.3 1,558 9.1
Total 5,182 1,395 162 67 4,951 3,672 1,605 19 17,053
Other TotalAA AS AGS AAA AAS Diploma Certificate
Note: Percentages are the proportion of awards for each column. "Not Reported" includes students without no responses and students reported with unknown race/ethnicity.
Diploma Certificate Other TotalAA AS AGS AAA AAS
Note: Percentages are the proportion of awards for each column. "Not Reported" includes students without no responses and students reported with unknown race/ethnicity.
Tables, Section 6 | 35

Table 6-45. Awards by Ethnicity/Race and Award Type 2012
N % N % N % N % N % N % N % N % N %
American Indian 29 0.6 4 0.3 1 0.6 0 0.0 28 0.6 18 0.5 16 0.9 0 0.0 96 0.6
Asian 106 2.0 30 2.1 3 1.7 1 1.6 57 1.1 45 1.4 33 1.8 0 0.0 275 1.6
Black 178 3.4 67 4.7 21 12.2 0 0.0 122 2.4 97 2.9 85 4.5 0 0.0 570 3.3 Hawaiian/Pacific
Islander 5 0.1 1 0.1 0 0.0 0 0.0 1 0.0 2 0.1 1 0.1 0 0.0 10 0.1
Hispanic 201 3.9 42 3.0 5 2.9 1 1.6 135 2.7 106 3.2 106 5.7 0 0.0 596 3.5
Two or more races 34 0.7 12 0.8 1 0.6 0 0.0 20 0.4 25 0.8 17 0.9 0 0.0 109 0.6
White 4,096 79.1 1,145 81.0 136 79.1 61 96.8 4,198 83.7 2,821 84.7 1,452 77.5 37 100.0 13,946 81.6
Not Reported 529 10.2 113 8.0 5 2.9 0 0.0 452 9.0 218 6.5 163 8.7 0 0.0 1,480 8.7
Total 5,178 1,414 172 63 5,013 3,332 1,873 37 17,082
Table 6-46. Awards by Ethnicity/Race and Award Type 2013
N % N % N % N % N % N % N % N % N %
American Indian 23 0.5 7 0.6 2 1.9 0 0.0 30 0.7 20 0.8 16 0.9 0 0.0 98 0.7
Asian 50 1.2 32 3.0 1 0.9 1 2.3 50 1.2 30 1.2 31 1.7 0 0.0 195 1.4
Black 174 4.1 41 3.8 17 15.9 1 2.3 118 2.8 85 3.5 85 4.5 0 0.0 521 3.7 Hawaiian/Pacific
Islander 7 0.2 1 0.1 0 0.0 0 0.0 1 0.0 2 0.1 3 0.2 0 0.0 14 0.1
Hispanic 177 4.2 32 3.0 2 1.9 3 6.8 119 2.8 92 3.7 106 5.7 1 1.6 532 3.8
Two or more races 38 0.9 7 0.6 1 0.9 1 2.3 36 0.9 16 0.7 17 0.9 0 0.0 116 0.8
White 3,540 83.8 915 84.6 84 78.5 38 86.4 3,630 86.8 2,098 85.4 1,452 77.5 61 98.4 11,818 84.2
Not Reported 214 5.1 47 4.3 0 0.0 0 0.0 197 4.7 114 4.6 163 8.7 0 0.0 735 5.2
Total 4,223 1,082 107 44 4,181 2,457 1,873 62 14,029
Diploma Certificate Other Total
Note: Percentages are the proportion of awards for each column. "Not Reported" includes students without no responses and students reported with unknown race/ethnicity.
AA AS AGS AAA AAS
Certificate OtherAA AS AGS
Note: Percentages are the proportion of awards for each column. "Not Reported" includes students without no responses and students reported with unknown race/ethnicity.
TotalAAA AAS Diploma
Tables, Section 6 | 36
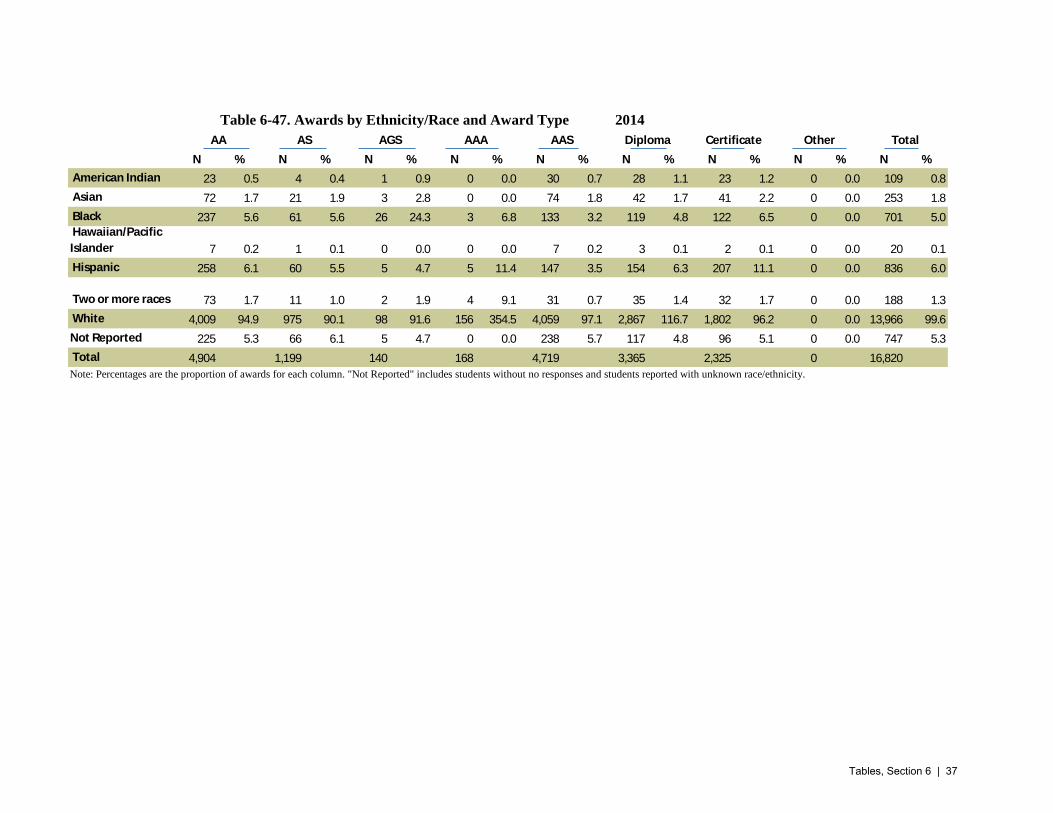
Table 6-47. Awards by Ethnicity/Race and Award Type 2014
N % N % N % N % N % N % N % N % N %
American Indian 23 0.5 4 0.4 1 0.9 0 0.0 30 0.7 28 1.1 23 1.2 0 0.0 109 0.8
Asian 72 1.7 21 1.9 3 2.8 0 0.0 74 1.8 42 1.7 41 2.2 0 0.0 253 1.8
Black 237 5.6 61 5.6 26 24.3 3 6.8 133 3.2 119 4.8 122 6.5 0 0.0 701 5.0 Hawaiian/Pacific
Islander 7 0.2 1 0.1 0 0.0 0 0.0 7 0.2 3 0.1 2 0.1 0 0.0 20 0.1
Hispanic 258 6.1 60 5.5 5 4.7 5 11.4 147 3.5 154 6.3 207 11.1 0 0.0 836 6.0
Two or more races 73 1.7 11 1.0 2 1.9 4 9.1 31 0.7 35 1.4 32 1.7 0 0.0 188 1.3
White 4,009 94.9 975 90.1 98 91.6 156 354.5 4,059 97.1 2,867 116.7 1,802 96.2 0 0.0 13,966 99.6
Not Reported 225 5.3 66 6.1 5 4.7 0 0.0 238 5.7 117 4.8 96 5.1 0 0.0 747 5.3
Total 4,904 1,199 140 168 4,719 3,365 2,325 0 16,820
Note: Percentages are the proportion of awards for each column. "Not Reported" includes students without no responses and students reported with unknown race/ethnicity.
Diploma Certificate Other TotalAA AS AGS AAA AAS
Tables, Section 6 | 37

Tables, Credit Programs 7
Table of Contents
7-1--7-5. Number of Offered Career and Technical Programs, Latest 5 years...........................................2-4
Tables, Section 7 | 1

Table 7-1. Number of Offered Career and Technical Education Programs 2014
2010
College AAA AAS ASCO Certificate Diploma Total
Northeast 32 23 26 81
North Iowa Area 18 18 6 21 63
Iowa Lakes 19 23 9 25 76
Northwest 19 4 14 37
Iowa Central 30 6 5 15 56
Iowa Valley 19 14 6 20 59
Hawkeye 3 25 8 14 50
Eastern Iowa 51 1 51 28 131
Kirkwood 61 14 27 43 145
Des Moines Area 50 19 63 40 172
Western Iowa Tech 49 3 67 45 164
Iowa Western 37 1 11 15 64
Southwestern 1 12 4 1 10 28
Indian Hills 30 1 3 31 65
Southeastern 37 7 3 17 64
TOTAL 4 489 115 283 364 1255
Table 7-2. Number of Offered Career and Technical Education Programs
2011
College AAA AAS ASCO Certificate Diploma Total
Northeast 35 0 22 27 84
North Iowa Area 19 13 12 24 68
Iowa Lakes 20 20 8 25 73
Northwest 19 4 4 15 42
Iowa Central 31 6 6 16 59
Iowa Valley 21 13 6 22 62
Hawkeye 3 40 0 13 23 79
Eastern Iowa 52 1 52 19 124
Kirkwood 62 14 27 48 151
Des Moines Area 52 24 76 42 194
Western Iowa Tech 47 3 64 42 156
Iowa Western 35 1 11 12 59
Southwestern 1 14 4 2 11 32
Indian Hills 36 1 9 31 77
Southeastern 39 4 3 16 62
TOTAL 4 522 108 315 373 1322
Note: Numbers include both standalone programs and program options. AAA = Associate of Applied Arts; AAS = Associate of
Applied Sciences; ASCO = Associate of Sciences, Career Option. Source: Iowa Department of Education, Division of
Community Colleges, Community College MIS.
Note: Numbers include both standalone programs and program options. AAA = Associate of Applied Arts; AAS = Associate of
Applied Sciences; ASCO = Associate of Sciences, Career Option. Source: Iowa Department of Education, Division of
Community Colleges, Community College MIS.
Tables, Section 7 | 2

Table 7-3. Number of Offered Career and Technical Education Programs
2012
College AAA AAS ASCO Certificate Diploma Total
Northeast 39 22 33 94
North Iowa Area 23 10 14 24 71
Iowa Lakes 27 21 8 28 84
Northwest 20 4 4 16 44
Iowa Central 35 6 6 16 63
Iowa Valley 23 13 7 24 67
Hawkeye 5 40 16 24 85
Eastern Iowa 56 1 60 21 138
Kirkwood 67 14 32 52 165
Des Moines Area 57 26 80 42 205
Western Iowa Tech 50 3 66 42 161
Iowa Western 41 1 14 14 70
Southwestern 1 22 4 2 12 41
Indian Hills 33 1 11 33 78
Southeastern 38 4 3 16 61
TOTAL 6 571 108 345 397 1427
Table 7-1. Number of Offered Career and Technical Education Programs
2013
College AAA AAS ASCO Certificate Diploma Total
Northeast 39 22 33 94
North Iowa Area 23 10 14 24 71
Iowa Lakes 21 20 8 26 75
Northwest 20 4 4 16 44
Iowa Central 34 6 6 16 62
Iowa Valley 23 13 7 24 67
Hawkeye 5 40 15 24 84
Eastern Iowa 54 1 60 21 136
Kirkwood 67 14 31 52 164
Des Moines Area 57 25 80 42 204
Western Iowa Tech 48 3 64 41 156
Iowa Western 41 1 14 14 70
Southwestern 1 22 4 2 12 41
Indian Hills 36 1 12 34 83
Southeastern 38 4 3 16 61
TOTAL 6 563 106 342 395 1412
Note: Numbers include both standalone programs and program options. AAA = Associate of Applied Arts; AAS = Associate of
Applied Sciences; ASCO = Associate of Sciences, Career Option. Source: Iowa Department of Education, Division of
Community Colleges, Community College MIS.
Note: Numbers include both standalone programs and program options. AAA = Associate of Applied Arts; AAS = Associate of
Applied Sciences; ASCO = Associate of Sciences, Career Option. Source: Iowa Department of Education, Division of
Community Colleges, Community College MIS.
Tables, Section 7 | 3
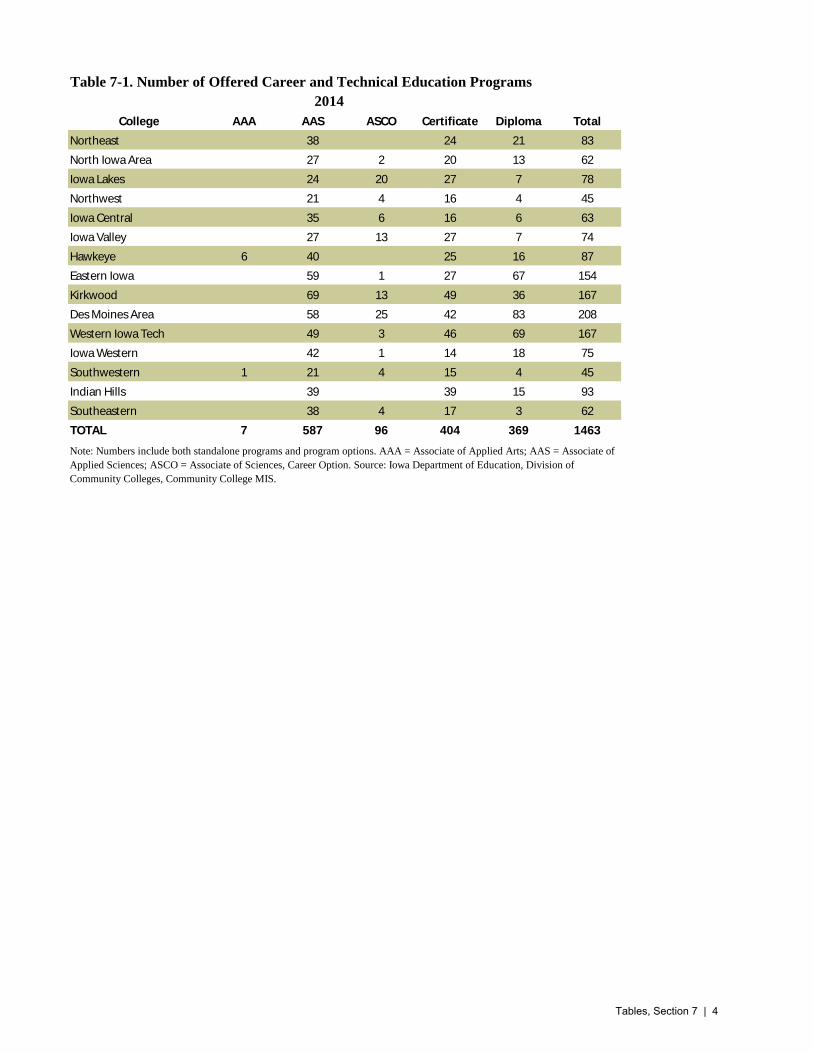
Table 7-1. Number of Offered Career and Technical Education Programs
2014
College AAA AAS ASCO Certificate Diploma Total
Northeast 38 24 21 83
North Iowa Area 27 2 20 13 62
Iowa Lakes 24 20 27 7 78
Northwest 21 4 16 4 45
Iowa Central 35 6 16 6 63
Iowa Valley 27 13 27 7 74
Hawkeye 6 40 25 16 87
Eastern Iowa 59 1 27 67 154
Kirkwood 69 13 49 36 167
Des Moines Area 58 25 42 83 208
Western Iowa Tech 49 3 46 69 167
Iowa Western 42 1 14 18 75
Southwestern 1 21 4 15 4 45
Indian Hills 39 39 15 93
Southeastern 38 4 17 3 62
TOTAL 7 587 96 404 369 1463
Note: Numbers include both standalone programs and program options. AAA = Associate of Applied Arts; AAS = Associate of
Applied Sciences; ASCO = Associate of Sciences, Career Option. Source: Iowa Department of Education, Division of
Community Colleges, Community College MIS.
Tables, Section 7 | 4

Tables, Non-Credit Enrollment and Programs 8
Table of Contents
8-1--8-2. Non-credit Enrollment and Contact Hours by College, Latest Five Years.....................2
8-3--8-4. Non-Credit Courses and Program Types by College, Latest Five Years........................3
8-5--8-9. Non-Credit Enrollment by Programs, Detailed, Latest Five Years.............................4-8
8-10--8-11. Iowa Course for Drinking Driver and Driver Improvement, Latest Five Years.........9
8-12--8-13. Community Rehabilitation Program and MSHA, Latest Five Years........................10
8-14--8-15. Used Motor Vehicle Dealer and Corrections Enrollment, Latest Five Years............11
8-16--8-17. Online and Community/Public Policy Enrollment, Latest Five Years ....................12
8-18--8-19 State and Federal Mandated, Recognized, Court Ordered, Latest Five Years.....13-14
8-20--8-21. Enrollment by Gender and College, Latest Five Years............................................15
8-22--8-23. Enrollment by Race/Ethnicity and College, Latest Five Years................................16
8-24. Skill Enhancement Enrollment by Career Cluster..............................................................17
8-25. Recertification and Licensing Enrollment by Career Cluster.............................................18
8-26--8-27. Skill Enhancement Contact Hours by Career Cluster, Latest Five Years...........19-20
8-28. State/Federal Mandated, Recognized, Court Ordered Enrollment and Contact Hours......21
Tables, Section 8 | 1

Table 8-1: Non-Credit Enrollment by College 2013
College 2010 2011 2012 2013 2014
% Average 5
Year Change
Northeast Iowa 21,587 21,614 20,847 21,927 21,617 0.0
North Iowa Area 17,605 11,670 11,996 12,189 11,333 -10.4
Iowa Lakes 4,120 3,266 2,992 3,255 3,150 -6.5
Northwest 12,664 11,064 10,584 11,044 10,486 -4.6
Iowa Central 22,155 20,297 18,760 17,125 18,319 -4.6
Iowa Valley 11,732 10,411 10,160 8,302 7,705 -10.0
Hawkeye 10,329 10,591 9,750 8,573 9,214 -2.8
Eastern Iowa 30,609 29,922 29,816 30,771 30,986 0.3
Kirkwood 37,057 37,846 39,014 41,876 43,229 3.9
Des Moines Area 29,087 30,970 29,608 26,047 24,586 -4.1
Western Iowa Tech 16,634 17,050 16,047 17,778 16,452 -0.3
Iowa Western 22,824 22,512 21,156 19,886 18,848 -4.7
Southwestern 10,053 7,521 6,552 6,581 5,811 -12.8
Indian Hills 16,128 14,722 15,968 16,150 15,270 -1.4
Southeastern 6,349 5,099 5,190 5,051 4,494 -8.3
Total 268,933 254,555 248,440 246,555 241,500 -2.7
Table 8-2: Non-Credit Contact Hours by College
College 2010 2011 2012 2013 2014
% Average 5
Year Change
Northeast Iowa 470,757 425,111 412,108 441,231 415,873 -4.0
North Iowa Area 340,609 191,163 201,503 200,362 196,922 -12.9
Iowa Lakes 82,542 75,110 75,893 74,710 73,581 -3.4
Northwest 230,467 233,903 170,665 144,261 139,823 -11.9
Iowa Central 617,309 613,776 546,712 535,593 513,298 -4.5
Iowa Valley 314,280 279,949 367,687 343,295 267,184 -4.0
Hawkeye 254,657 260,855 248,964 314,047 405,153 12.3
Eastern Iowa 1,097,394 1,047,299 939,435 832,751 777,411 -8.4
Kirkwood 1,366,666 1,257,190 1,241,234 1,408,249 1,375,901 0.2
Des Moines Area 1,503,359 1,463,666 1,729,034 1,343,220 1,364,539 -2.4
Western Iowa Tech 491,091 562,488 482,561 533,766 469,026 -1.3
Iowa Western 538,254 503,103 477,512 460,319 421,776 -6.2
Southwestern 209,744 196,271 167,679 179,908 137,482 -10.5
Indian Hills 292,450 251,113 261,493 241,495 228,350 -6.0
Southeastern 343,929 253,070 259,237 266,758 217,486 -10.8
Total 8,153,506 7,614,067 7,581,717 7,319,965 7,003,805 -3.9
Tables, Section 8 | 2
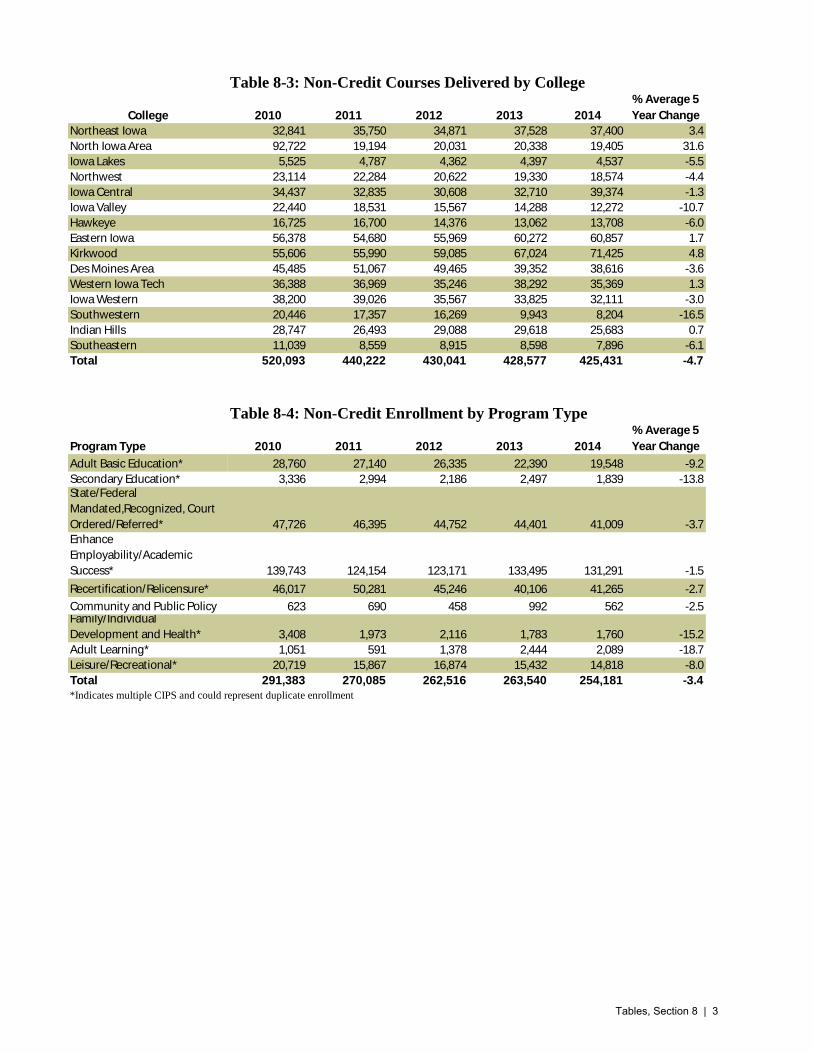
Table 8-3: Non-Credit Courses Delivered by College
College 2010 2011 2012 2013 2014
% Average 5
Year Change
Northeast Iowa 32,841 35,750 34,871 37,528 37,400 3.4
North Iowa Area 92,722 19,194 20,031 20,338 19,405 31.6
Iowa Lakes 5,525 4,787 4,362 4,397 4,537 -5.5
Northwest 23,114 22,284 20,622 19,330 18,574 -4.4
Iowa Central 34,437 32,835 30,608 32,710 39,374 -1.3
Iowa Valley 22,440 18,531 15,567 14,288 12,272 -10.7
Hawkeye 16,725 16,700 14,376 13,062 13,708 -6.0
Eastern Iowa 56,378 54,680 55,969 60,272 60,857 1.7
Kirkwood 55,606 55,990 59,085 67,024 71,425 4.8
Des Moines Area 45,485 51,067 49,465 39,352 38,616 -3.6
Western Iowa Tech 36,388 36,969 35,246 38,292 35,369 1.3
Iowa Western 38,200 39,026 35,567 33,825 32,111 -3.0
Southwestern 20,446 17,357 16,269 9,943 8,204 -16.5
Indian Hills 28,747 26,493 29,088 29,618 25,683 0.7
Southeastern 11,039 8,559 8,915 8,598 7,896 -6.1
Total 520,093 440,222 430,041 428,577 425,431 -4.7
Table 8-4: Non-Credit Enrollment by Program Type
Program Type 2010 2011 2012 2013 2014
% Average 5
Year Change
Adult Basic Education* 28,760 27,140 26,335 22,390 19,548 -9.2
Secondary Education* 3,336 2,994 2,186 2,497 1,839 -13.8State/Federal
Mandated,Recognized, Court
Ordered/Referred* 47,726 46,395 44,752 44,401 41,009 -3.7Enhance
Employability/Academic
Success* 139,743 124,154 123,171 133,495 131,291 -1.5
Recertification/Relicensure* 46,017 50,281 45,246 40,106 41,265 -2.7
Community and Public Policy 623 690 458 992 562 -2.5Family/Individual
Development and Health* 3,408 1,973 2,116 1,783 1,760 -15.2
Adult Learning* 1,051 591 1,378 2,444 2,089 -18.7
Leisure/Recreational* 20,719 15,867 16,874 15,432 14,818 -8.0
Total 291,383 270,085 262,516 263,540 254,181 -3.4*Indicates multiple CIPS and could represent duplicate enrollment
Tables, Section 8 | 3

Table 8-5: Non-Credit Enrollment by Progran Type 2010
College
*Adult
Basic
Education
Secondary
Education*
State/Federal
Mandated,
Recognized, Court
Ordered/Referred
Enhance
Employability /
Academic Success
Recertification /
Relicensure
Community
and Public
Policy
Family/Individual
Development and
Health
Adult
Learning
Leisure /
Recreational Total
Northeast Iowa 927 200 3,911 11,241 5,690 90 23 50 640 22,772
North Iowa Area 1,109 18 2,338 15,924 4,417 0 838 0 2,101 26,745
Iowa Lakes 308 56 1,168 1,420 1,225 0 2 5 123 4,307
Northwest 1,062 0 1,566 8,369 1,851 0 71 0 1,251 14,170
Iowa Central 1,859 27 2,488 16,162 0 0 45 0 3,022 23,603
Iowa Valley 1,118 37 1,438 4,909 2,386 374 1,111 285 796 12,454
Hawkeye 992 86 3,837 4,190 90 0 0 170 174 9,539
Eastern Iowa 3,334 236 4,902 16,582 1,617 41 286 247 2,698 29,943
Kirkwood 4,107 1,633 6,018 21,713 1,116 0 7 136 5,532 40,262
Des Moines Area 6,790 1,014 9,828 7,873 2,412 0 498 8 182 28,605
Western Iowa Tech 1,454 0 2,206 9,103 4,412 0 187 0 1,608 18,970
Iowa Western 1,742 0 3,534 5,771 11,030 88 16 144 1,788 24,113
Southwestern 491 0 1,221 3,734 4,737 0 30 0 7 10,220
Indian Hills 1,424 29 2,128 10,522 4,285 30 294 6 411 19,129
Southeastern 2,043 0 1,143 2,230 749 0 0 0 386 6,551
Total 28,760 3,336 47,726 139,743 46,017 623 3,408 1,051 20,719 291,383
% of Total 9.9 1.1 16.4 48.0 15.8 0.2 1.2 0.4 7.1 100.0*Excludes Community Rehabilitation-Sheltered Workshops
Tables, Section 8 | 4

Table 8-6: Non-Credit Enrollment by Progran Type 2011
College
*Adult
Basic
Education
Secondary
Education*
State/Federal
Mandated,
Recognized, Court
Ordered/Referred
Enhance
Employability /
Academic Success
Recertification /
Relicensure
Community
and Public
Policy
Family/Individual
Development and
Health
Adult
Learning
Leisure /
Recreational Total
Northeast Iowa 859 171 4,979 10,306 6,586 132 109 153 689 23,984
North Iowa Area 840 7 1,475 4,389 2,818 0 0 0 2,281 11,810
Iowa Lakes 329 0 785 1,575 818 0 0 0 20 3,527
Northwest 924 0 1,299 8,110 1,907 0 55 0 623 12,918
Iowa Central 1,689 0 2,970 14,640 0 0 0 0 982 20,281
Iowa Valley 1,055 47 1,493 4,761 2,111 291 516 9 816 11,099
Hawkeye 1,607 31 3,039 4,447 288 0 0 176 233 9,821
Eastern Iowa 2,946 283 4,848 16,876 1,648 92 351 57 2,434 29,535
Kirkwood 4,009 1,488 6,416 19,468 5,962 0 0 49 3,723 41,115
Des Moines Area 6,270 949 9,051 9,490 4,174 0 375 4 240 30,553
Western Iowa Tech 1,909 0 2,313 8,870 4,360 0 169 0 1,894 19,515
Iowa Western 1,571 0 3,196 6,345 12,170 46 50 123 1,316 24,817
Southwestern 488 0 1,370 3,418 2,779 3 0 6 0 8,064
Indian Hills 1,103 18 2,197 9,511 4,146 126 333 14 285 17,733
Southeastern 1,541 0 964 1,948 514 0 15 0 331 5,313
Total 27,140 2,994 46,395 124,154 50,281 690 1,973 591 15,867 270,085
% of Total 10.0 1.1 17.2 46.0 18.6 0.3 0.7 0.2 5.9 100.0*Excludes Community Rehabilitation-Sheltered Workshops
Tables, Section 8 | 5

Table 8-7: Non-Credit Enrollment by Progran Type 2012
College
*Adult
Basic
Education
Secondary
Education*
State/Federal
Mandated,
Recognized, Court
Ordered/Referred
Enhance
Employability /
Academic Success
Recertification /
Relicensure
Community
and Public
Policy
Family/Individual
Development and
Health
Adult
Learning
Leisure /
Recreational Total
Northeast Iowa 577 157 4,644 9,735 6,330 237 63 31 546 22,320
North Iowa Area 819 10 1,298 4,620 3,445 0 0 0 2,047 12,239
Iowa Lakes 307 0 723 1,436 721 0 34 5 11 3,237
Northwest 470 0 1,391 7,783 1,719 0 37 0 868 12,268
Iowa Central 1,553 0 3,074 14,248 0 0 0 0 1,248 20,123
Iowa Valley 1,582 23 1,219 3,669 1,842 78 992 14 1,041 10,460
Hawkeye 1,147 11 2,970 3,461 233 0 0 307 387 8,516
Eastern Iowa 2,181 174 4,599 17,318 2,048 21 178 53 2,292 28,864
Kirkwood 3,016 973 6,127 20,275 5,569 0 0 574 3,951 40,485
Des Moines Area 7,313 801 9,140 9,301 3,501 17 195 6 313 30,587
Western Iowa Tech 2,191 0 2,347 7,354 4,582 13 45 0 1,919 18,451
Iowa Western 1,613 0 2,729 7,961 9,359 92 11 363 1,183 23,311
Southwestern 572 0 1,187 3,462 2,218 0 0 0 0 7,439
Indian Hills 1,480 37 2,337 10,265 4,296 0 561 25 658 19,659
Southeastern 1,514 0 967 2,283 424 0 0 0 410 5,598
Total 26,335 2,186 44,752 123,171 46,287 458 2,116 1,378 16,874 263,557
% of Total 10.0 0.8 17.0 46.7 17.6 0.2 0.8 0.5 6.4 100.0*Excludes Community Rehabilitation-Sheltered Workshops
Tables, Section 8 | 6
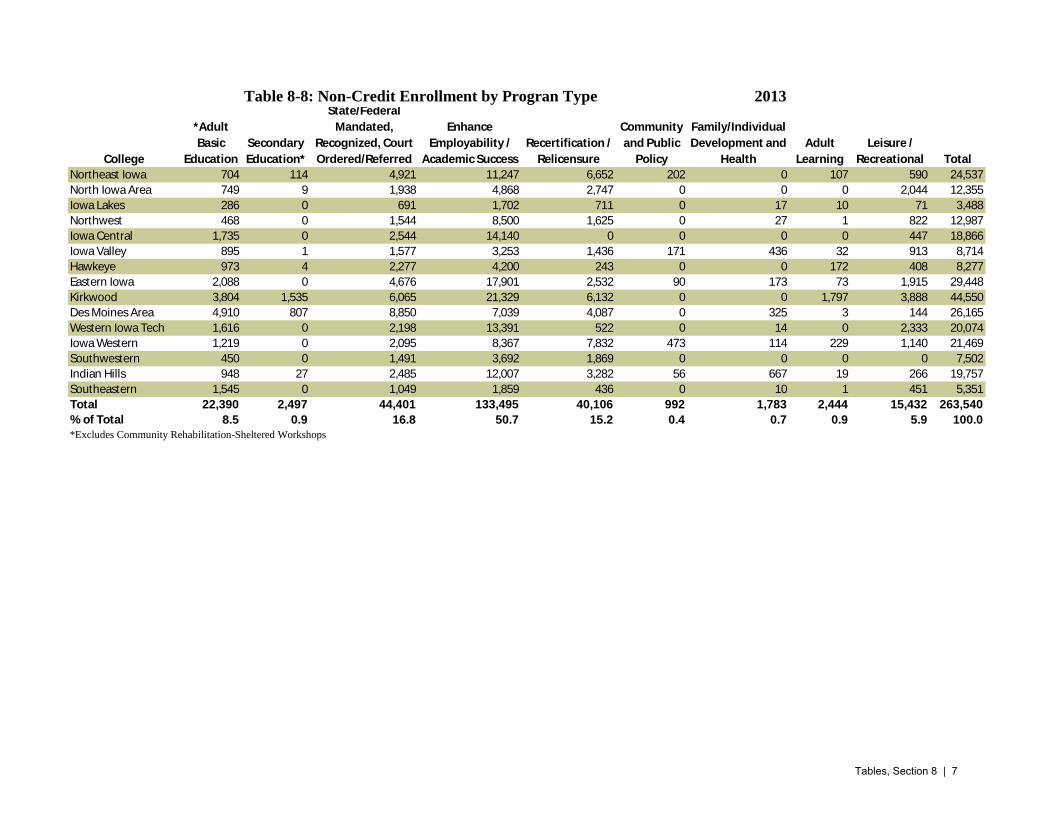
Table 8-8: Non-Credit Enrollment by Progran Type 2013
College
*Adult
Basic
Education
Secondary
Education*
State/Federal
Mandated,
Recognized, Court
Ordered/Referred
Enhance
Employability /
Academic Success
Recertification /
Relicensure
Community
and Public
Policy
Family/Individual
Development and
Health
Adult
Learning
Leisure /
Recreational Total
Northeast Iowa 704 114 4,921 11,247 6,652 202 0 107 590 24,537
North Iowa Area 749 9 1,938 4,868 2,747 0 0 0 2,044 12,355
Iowa Lakes 286 0 691 1,702 711 0 17 10 71 3,488
Northwest 468 0 1,544 8,500 1,625 0 27 1 822 12,987
Iowa Central 1,735 0 2,544 14,140 0 0 0 0 447 18,866
Iowa Valley 895 1 1,577 3,253 1,436 171 436 32 913 8,714
Hawkeye 973 4 2,277 4,200 243 0 0 172 408 8,277
Eastern Iowa 2,088 0 4,676 17,901 2,532 90 173 73 1,915 29,448
Kirkwood 3,804 1,535 6,065 21,329 6,132 0 0 1,797 3,888 44,550
Des Moines Area 4,910 807 8,850 7,039 4,087 0 325 3 144 26,165
Western Iowa Tech 1,616 0 2,198 13,391 522 0 14 0 2,333 20,074
Iowa Western 1,219 0 2,095 8,367 7,832 473 114 229 1,140 21,469
Southwestern 450 0 1,491 3,692 1,869 0 0 0 0 7,502
Indian Hills 948 27 2,485 12,007 3,282 56 667 19 266 19,757
Southeastern 1,545 0 1,049 1,859 436 0 10 1 451 5,351
Total 22,390 2,497 44,401 133,495 40,106 992 1,783 2,444 15,432 263,540
% of Total 8.5 0.9 16.8 50.7 15.2 0.4 0.7 0.9 5.9 100.0*Excludes Community Rehabilitation-Sheltered Workshops
Tables, Section 8 | 7

Table 8-9: Non-Credit Enrollment by Progran Type 2014
College
*Adult
Basic
Education
Secondary
Education*
State/Federal
Mandated,
Recognized, Court
Ordered/Referred
Enhance
Employability /
Academic Success
Recertification /
Relicensure
Community
and Public
Policy
Family/Individual
Development and
Health
Adult
Learning
Leisure /
Recreational Total
Northeast Iowa 638 93 4,270 11,780 6,147 362 0 104* 640 23,930
North Iowa Area 531 7 1,669 4,473 2,923 0 27* 0 2,040 11,643
Iowa Lakes 241 0 875 1,331 891 0 4 59* 94 3,436
Northwest 393 0 1,108 8,005 1,245 0 11 0 876 11,638
Iowa Central 1,429 0 2,223 13,618 0 0 1 0 557 17,828
Iowa Valley 824 2 1,306 2,692 1,331 34 937* 71* 912* 6,189
Hawkeye 962 6 2,387 5,308 298 0 0 29* 260 9,221
Eastern Iowa 1,951 0 4,796 18,355 2,741 52 463* 57* 1,633 29,528
Kirkwood 3,386 1175* 5,879 26,460 5,522 0 0 1350* 3,647 44,894
Des Moines Area 3,844 513* 8,445 8,514 3,327 0 59 7 79 24,275
Western Iowa Tech 1,624 0 2,057 7,704 4,799 0 13 0 2,267 18,464
Iowa Western 1,460 0 1,990 6,943 8,310 86 93 364* 1,121 20,003
Southwestern 377 0 1,279 3,395 1,518 0 0 0 7 6,576
Indian Hills 699 9 1,935 10,499 3,631 28 152* 48* 332 17,133
Southeastern 1,189 34* 790 2,214 451 0 0 0 353* 4,644
Total 19,548 1,839 41,009 131,291 43,134 562 1,760 2,089 14,818 256,050
% of Total 7.6 0.7 16.0 51.3 16.8 0.2 0.7 0.8 5.8 100.0*indicates multiple CIPS and could represent duplicate enrollment
Tables, Section 8 | 8

Table 8-10: Iowa Course for Drinking Driving
College Students
Contact
Hours Students
Contact
Hours Students
Contact
Hours Students
Contact
Hours Students
Contact
Hours Students
Contact
Hours
Northeast Iowa 221 3,254 241 3,542 162 2,362 208 3,010 160 2,333 -7.8 -8.0
North Iowa Area 0 0 0 0 0 0 0 0 0 0 N/A N/A
Iowa Lakes 280 4,046 0 0 0 0 0 0 0 0 N/A N/A
Northwest 100 1,380 88 1,211 70 980 70 966 58 814 -12.7 -12.4
Iowa Central 412 5,933 333 4,824 351 5,054 330 4,766 302 4,349 -7.5 -7.5
Iowa Valley 155 2,232 133 1,930 150 2,174 140 2,016 131 1,915 -4.1 -3.8
Hawkeye 487 9,401 475 8,897 567 10,407 680 11,618 629 10,709 6.6 3.3
Eastern Iowa 787 10,441 797 10,547 723 9,583 736 9,768 604 7,986 -6.4 -6.5
Kirkwood 2,268 44,996 2,172 43,342 2,327 45,661 2,279 45,402 2,326 53,597 0.6 4.5
Des Moines Area 3,147 102,931 2,687 90,835 2,700 89,112 2,466 80,141 2,163 65,554 -8.9 -10.7
Western Iowa Tech 260 3,744 268 3,874 206 2,966 185 2,722 215 3,110 -4.6 -4.5
Iowa Western 447 6,437 431 6,221 425 6,120 512 7,373 515 7,215 3.6 2.9
Southwestern 189 2,736 219 3,154 174 2,506 152 2,189 145 2,074 -6.4 -6.7
Indian Hills 371 5,230 269 3,888 248 3,432 236 3,130 237 3,316 -10.6 -10.8
Southeastern 79 1,043 70 924 61 805 59 779 33 436 -19.6 -19.6
Total 9,203 203,804 8,183 183,188 8,164 181,163 8,053 173,879 7,518 163,408 -4.9 -5.4
Table 8-11: Iowa Course for Driver Improvement
College Students
Contact
Hours Students
Contact
Hours Students
Contact
Hours Students
Contact
Hours Students
Contact
Hours Students
Contact
Hours
Northeast Iowa 211 2,045 170 1,661 121 1,162 185 1,776 139 1,334 -9.9 -10.1
North Iowa Area 108 1,037 101 970 71 682 74 710 80 768 -7.2 -7.2
Iowa Lakes 53 509 39 374 37 355 17 163 27 259 -15.5 -15.5
Northwest 84 739 69 607 69 607 38 334 46 405 -14.0 -14.0
Iowa Central 99 950 64 614 75 720 47 451 69 662 -8.6 -8.6
Iowa Valley 127 1,219 79 768 98 941 76 730 71 682 -13.5 -13.5
Hawkeye 235 1,974 181 1,520 154 1,294 0 0 0 0 N/A N/A
Eastern Iowa 428 3,775 341 3,001 274 2,411 324 2,851 327 2,878 -6.5 -6.6
Kirkwood 494 4,298 401 3,489 307 2,688 308 2,714 367 3,542 -7.2 -4.7
Des Moines Area 1,107 12,010 1,001 10,800 971 10,118 834 8,592 757 7,814 -9.1 -10.2
Western Iowa Tech 210 2,016 164 1,596 118 1,142 97 931 121 1,171 -12.9 -12.7
Iowa Western 132 1,267 123 1,181 88 845 71 682 117 1,080 -3.0 -3.9
Southwestern 65 624 60 576 42 403 53 509 54 518 -4.5 -4.5
Indian Hills 175 1,654 112 1,075 85 410 66 634 70 672 -20.5 -20.2
Southeastern 140 1,232 100 880 92 810 72 634 62 546 -18.4 -18.4
Total 3,668 35,349 3,005 29,112 2,602 24,588 2,262 21,711 2,307 22,331 -10.9 -10.8
% Average 5 Year
Change2010 2011 2012 2013 2014
% Average 5 Year
Change2010 2011 20132012 2014
Tables, Section 8 | 9

Table 8-12: Community Rehabilitation Program (Sheltered Workshop)
College Students
Contact
Hours Students
Contact
Hours Students
Contact
Hours Students
Contact
Hours Students
Contact
Hours Students
Contact
Hours
Northeast Iowa 0 0 0 0 0 0 0 0 0 0 N/A N/A
North Iowa Area 19 4,200 20 4,080 18 2,700 24 4,980 0 0 N/A N/A
Iowa Lakes 0 0 0 0 0 0 N/A N/A
Northwest 0 0 116 28,980 111 34,620 124 9,420 0 0 N/A N/A
Iowa Central 31 8,352 0 0 0 0 0 0 0 0 N/A N/A
Iowa Valley 62 13,980 60 13,980 58 13,320 45 10,320 0 0 -100.0% -100.0%
Hawkeye 36 1,924 38 3,931 33 4,551 0 0 0 0 N/A N/A
Eastern Iowa 113 22,260 92 20,400 98 19,260 80 18,000 0 0 -100.0% -100.0%
Kirkwood 0 0 0 0 0 0 0 0 0 0 N/A N/A
Des Moines Area 0 0 0 0 0 0 0 0 0 0 N/A N/A
Western Iowa Tech 0 0 0 0 0 0 0 0 0 0 N/A N/A
Iowa Western 92 16,980 73 13,980 60 12,240 54 10,620 48 9,660 -15.0% -13.2%
Southwestern 71 13,800 97 18,780 91 18,360 90 18,720 75 16,800 1.4% 5.0%
Indian Hills 44 5,760 24 5,160 24 5,520 21 4,380 27 6,060 -11.5% 1.3%
Southeastern 0 0 0 0 0 0 0 0 0 0 N/A N/A
Total 468 87,256 520 109,291 493 110,571 438 76,440 150 32,520 -24.8% -21.9%
Table 8-13: Mine Safety and Health Administration (MSHA)
College Students
Contact
Hours Students
Contact
Hours Students
Contact
Hours Students
Contact
Hours Students
Contact
Hours Students
Contact
Hours
Northeast Iowa* 126 1,210 129 1,238 416 7,190 250 4,358 193 4,195 11.2% 36.5%
North Iowa Area 14 134 31 298 71 871 36 346 55 528 40.8% 40.8%
Iowa Lakes 15 144 33 470 24 230 19 182 0 0 N/A N/A
Northwest 58 570 36 331 33 304 71 653 79 727 8.0% 6.3%
Iowa Central 19 182 75 720 208 2,169 158 1,684 31 112 13.0% -11.5%
Iowa Valley 41 344 6 58 18 173 72 556 29 278 -8.3% -5.2%
Hawkeye 197 1,500 0 0 0 0 0 0 N/A N/A
Eastern Iowa 159 1,927 201 2,182 172 1,954 150 1,549 192 2,024 4.8% 1.2%
Kirkwood 0 0 68 766 36 315 18 157 21 470 N/A N/A
Des Moines Area 22 230 16 154 15 144 7 67 0 0 -100.0% -100.0%
Western Iowa Tech 0 0 3 29 0 0 0 0 0 0 N/A N/A
Iowa Western 4 38 10 246 0 0 13 437 0 0 N/A N/A
Southwestern 0 0 2 58 0 0 0 0 0 0 N/A N/A
Indian Hills 8 173 8 154 0 0 0 0 0 0 N/A N/A
Southeastern 24 211 40 449 119 1,302 20 194 61 537 26.3% 26.3%
Total 687 6,665 658 7,152 1,112 14,652 814 10,182 661 8,871 -1.0% 7.4%
N/A is used when at least one year has zero enrollment, thus making five-year average changes misleading.
*Includes enrollment in Economic Development, individual headcount might be duplicated.
% Average 5 Year
Change*2010 2011 2012 2013 2014
"N/A" is used when at least one year has zero enrollment, thus making five-year average changes misleading.
2010
% Average 5 Year
Change*2011 20132012 2014
Tables, Section 8 | 10

Table 8-14: Used Motor Vehicle Dealer Education*
College Students
Contact
Hours Students
Contact
Hours Students
Contact
Hours Students
Contact
Hours Students
Contact
Hours Students
Contact
Hours
Northeast Iowa 0 0 146 876 0 0 147 888 0 0 N/A N/A
North Iowa Area 14 84 92 552 17 102 74 444 0 0 N/A N/A
Iowa Lakes 0 0 21 126 0 0 36 216 0 0 N/A N/A
Northwest 48 278 29 168 22 128 44 255 0 0 N/A N/A
Iowa Central 0 0 86 516 0 0 40 240 0 0 N/A N/A
Iowa Valley 4 24 71 426 0 0 43 258 0 0 N/A N/A
Hawkeye 13 78 96 576 24 134 112 654 0 0 N/A N/A
Eastern Iowa 0 0 104 572 0 0 112 633 0 0 N/A N/A
Kirkwood 19 142 231 1,393 78 524 156 927 0 0 N/A N/A
Des Moines Area 326 2,693 394 3,001 236 1,949 469 3,563 226 2,072 -8.8 -6.3
Western Iowa Tech 7 42 70 420 0 0 74 444 0 0 N/A N/A
Iowa Western 31 186 45 270 0 0 92 497 6 34 -33.7 -34.6
Southwestern 0 0 53 318 0 0 81 486 0 0 N/A N/A
Indian Hills 22 132 104 639 18 90 55 330 0 0 N/A N/A
Southeastern 38 503 27 149 15 83 87 479 0 0 N/A N/A
Total 522 4,162 1,569 10,002 410 3,009 1,622 10,313 232 2,106 -18.4 -15.7
Table 8-15: Corrections Non-Credit Enrollment and Contact Hours
Students
Contact
Hours Students
Contact
Hours Students
Contact
Hours Students
Contact
Hours Students
Contact
Hours Students
Contact
Hours
Northeast Iowa 0 0 0 0 0 0 0 0 0 0 N/A N/A
North Iowa Area 20 2,040 18 1,620 16 1,620 18 1,860 12 1,560 -6.5 -6.5
Iowa Lakes 0 0 0 0 0 0 0 0 0 0 N/A N/A
Northwest 86 7,920 67 5,880 0 0 0 0 0 0 N/A N/A
Iowa Central 465 58,303 681 112,534 784 125,623 636 100,976 801 125,466 21.1 17.4
Iowa Valley 41 2,640 70 4,740 68 10,573 65 15,960 24 1,440 N/A N/A
Hawkeye 103 1,501 45 1,502 56 1,075 4 156 5 361 -30.0 -57.3
Eastern Iowa 102 77,401 121 9,120 88 7,440 115 8,460 37 2,760 -56.5 -22.7
Kirkwood 721 80,700 656 68,760 533 56,280 631 79,200 617 76,140 -1.4 -1.4
Des Moines Area 402 17,544 482 23,629 578 33,424 618 34,067 486 51,968 31.2 19.9
Western Iowa Tech 0 0 0 0 0 0 0 0 0 0 N/A N/A
Iowa Western 313 42,360 349 44,580 319 44,460 312 41,340 291 37,800 -2.8 -2.8
Southwestern 0 0 0 0 0 0 0 0 0 0 N/A N/A
Indian Hills 0 0 0 0 0 0 0 0 0 0 N/A N/A
Southeastern 873 110,940 597 81,720 679 84,540 715 81,420 533 63,900 -12.9 -12.9
Total 3,126 401,349 3,086 354,084 3,121 365,036 3,114 363,438 2,806 361,395 -2.6 -1.3
* indicates multiple CIPS and could represent duplicate enrollment
% Average 5 Year
Change2010 2011 2012 2013 2014
Note: Subset of MIS total enrollment. "N/A" is used when at least one year has zero enrollment, thus making five-year average changes misleading.
College
2010 2011 2012 2013 2014
% Average 5 Year
Change
Tables, Section 8 | 11

Table 8-16: Online Non-Credit Enrollment and Contact Hours
College Students
Contact
Hours Students
Contact
Hours Students
Contact
Hours Students
Contact
Hours Students
Contact
Hours Students
Contact
Hours
Northeast Iowa 149 8,909 416 7,364 247 7,460 217 9,251 274 15,253 16.5 14.4
North Iowa Area 9,627 49,577 81 2,305 70 2,386 106 2,810 85 2,801 -69.3 -51.2
Iowa Lakes 49 1,378 59 1,637 69 1,992 79 2,061 50 1,464 0.5 1.5
Northwest 0 0 25 2,220 69 3,907 113 4,713 26 525 N/A N/A
Iowa Central 527 3,890 712 5,632 526 4,940 0 0 0 0 N/A N/A
Iowa Valley 155 6,202 179 5,998 128 5,429 160 4,569 153 5,554 -0.6 -5.4
Hawkeye 49 1,779 118 2,810 126 3,677 181 5,006 176 8,380 37.7 47.3
Eastern Iowa 853 35,899 1,211 29,496 701 32,588 688 28,980 2,597 36,733 32.1 0.6
Kirkwood 627 37,167 893 58,808 1,232 66,607 1,372 74,762 1,722 88,424 28.7 24.2
Des Moines Area 588 19,530 1,553 31,234 97 23,266 1,234 26,360 891 29,482 10.9 10.8
Western Iowa Tech 320 1,515 467 1,840 340 1,148 450 1,541 366 1,358 3.4 -2.7
Iowa Western 752 17,567 761 14,432 885 1,523 1,066 22,616 1,274 24,378 19.2 11.5
Southwestern 15 1,800 48 6,023 72 1,747 9 576 85 7,441 78.3 60.5
Indian Hills 79 2,451 58 2,826 89 3,220 112 3,184 122 2,020 45.0 -9.2
Southeastern 160 7,171 167 7,585 131 5,864 151 4,897 135 3,858 -4.2 -14.4
Total 13,950 194,834 6,748 180,210 4,782 165,754 5,938 191,326 7,956 227,671 -13.1 4.0
Table 8-17: Community and Public Safety Policy
College Students
Contact
Hours Students
Contact
Hours Students
Contact
Hours Students
Contact
Hours Students
Contact
Hours Students
Contact
Hours
Northeast Iowa 90 504 132 1,146 237 2,133 202 1,732 362 3,267 41.6 59.6
North Iowa Area 0 0 0 0 0 0 0 0 0 0 N/A N/A
Iowa Lakes 0 0 0 0 0 0 0 0 0 0 N/A N/A
Northwest 0 0 0 0 0 0 0 0 0 0 N/A N/A
Iowa Central 0 0 0 0 0 0 0 0 0 0 N/A N/A
Iowa Valley 374 8,297 291 5,833 78 4,946 171 5,962 34 2,328 -45.1 -27.2
Hawkeye 0 0 0 0 0 0 0 0 N/A N/A
Eastern Iowa 41 1,232 92 2,167 21 1,260 90 2,744 52 1,975 6.1 12.5
Kirkwood 0 0 0 0 0 0 0 0 0 0 N/A N/A
Des Moines Area 0 0 0 0 17 1,224 0 0 0 0 N/A N/A
Western Iowa Tech 0 0 0 0 13 31 0 0 0 0 N/A N/A
Iowa Western 88 708 46 583 92 392 473 1,956 86 704 -0.6 -0.1
Southwestern 0 0 3 11 0 0 0 0 0 0 N/A N/A
Indian Hills 30 130 126 605 0 0 56 178 28 202 -1.7 11.7
Southeastern 0 0 0 0 0 0 0 0 0 0 N/A N/A
Total 623 10,871 690 10,344 458 9,987 992 12,573 562 8,476 -2.5 -6.0*"N/A" is used when at least one year has zero enrollment, thus making five-year average changes misleading.
% Average 5 Year
Change*2010 2011 2012 2013 2014
% Average 5 Year
Change2012 20142010 2011 2013
Tables, Section 8 | 12

Table 8-18: Non-Credit Total Enrollment by Federal Career Cluster by College 2013
No
rthe
ast
No
rth Io
wa A
rea
Iow
a Lakes
No
rthw
est
Iow
a Ce
ntral
Iow
a Valle
y
Haw
keye
Eastern
Iow
a
Kirkw
oo
d
De
s Mo
ine
s Are
a
We
stern
Iow
a Tech
Iow
a We
stern
Sou
thw
este
rn
Ind
ian H
ills
Sou
the
astern
To
tal
Agriculture, Food and Natural Resources 84 381 2 922 223 492 0 1,071 1,896 533 37 180 245 200 17 6,283
Architecture and Construction 442 16 233 559 165 308 489 972 1,189 2,510 71 281 16 272 73 7,596
Arts, A/V Technology and Communications 128 4 4 5 67 102 12 49 315 147 0 2 2 8 0 845
Business, Management and Administration 2,483 1,490 426 849 1,653 860 1,318 2,291 3,063 1,460 3,463 1,036 467 2,423 730 24,012
Education and Training 27 1 35 86 1,083 488 0 119 249 233 14 1,267 28 2 21 3,653
Finance 145 38 1 141 106 87 87 163 274 451 3 168 13 251 74 2,002
Government and Public Administration 202 0 0 0 0 171 0 90 0 0 0 473 0 56 0 992
Health Science 11,894 5,247 1,372 5,966 7,567 1,746 1,712 10,755 11,906 4,017 7,783 11,584 3,430 6,795 1,001 92,775
Hospitality and Tourism 0 0 0 0 33 21 0 0 1,017 10 0 39 0 0 0 1,120
Human Services 600 357 182 644 59 649 611 948 776 1,043 31 960 516 1,302 102 8,780
Information Technology 54 0 0 5 1 9 0 8 108 14 0 5 8 23 7 242
Law, Public Safety and Security 592 33 202 115 1,434 61 166 474 2,096 59 953 461 194 280 1 7,121
Manufacturing 934 398 39 473 1,889 518 1,020 4,681 5,340 373 961 192 88 1,702 202 18,810
Marketing, Sales and Service 142 84 25 42 119 76 26 104 25 242 0 260 91 127 13 1,376Science, Technology, Engineering and
Mathematics 10 0 0 0 0 0 0 24 0 19 0 0 0 0 7 60
Transportation, Distribution and Logistics 91 164 111 204 308 107 846 132 2,273 955 71 67 8 122 57 5,516
Not a Clustered CIP 6,850 4,674 1,074 2,883 4,474 3,345 3,557 11,964 13,933 14,360 6,047 4,774 1,886 5,160 2,956 87,937
Total 24,678 12,887 3,706 12,894 19,181 9,040 9,844 33,845 44,460 26,426 19,434 21,749 6,992 18,723 5,261 269,120
Note: Totals may be greater than enrollment since students may be in one or more clusters. Definitions of Career Clusters can be obtained from http://www.careerclusters.org/.
Tables, Section 8 | 13
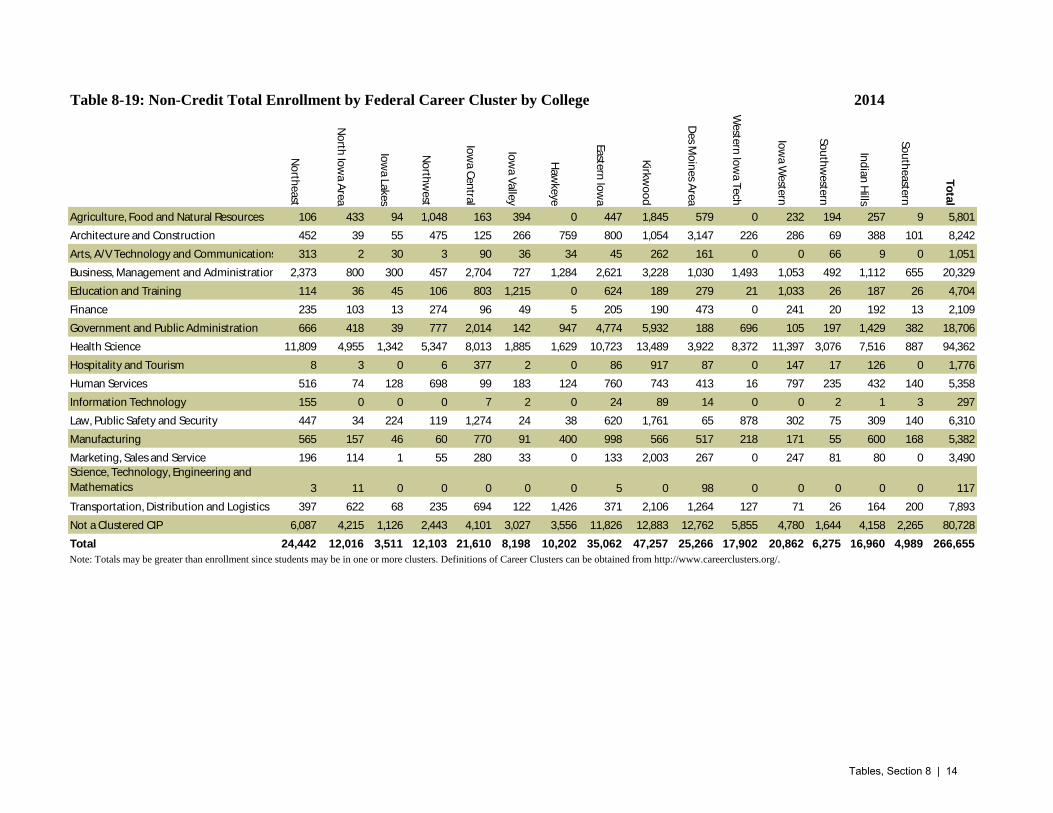
Table 8-19: Non-Credit Total Enrollment by Federal Career Cluster by College 2014
No
rthe
ast
No
rth Io
wa A
rea
Iow
a Lakes
No
rthw
est
Iow
a Ce
ntral
Iow
a Valle
y
Haw
keye
Eastern
Iow
a
Kirkw
oo
d
De
s Mo
ine
s Are
a
We
stern
Iow
a Tech
Iow
a We
stern
Sou
thw
este
rn
Ind
ian H
ills
Sou
the
astern
To
tal
Agriculture, Food and Natural Resources 106 433 94 1,048 163 394 0 447 1,845 579 0 232 194 257 9 5,801
Architecture and Construction 452 39 55 475 125 266 759 800 1,054 3,147 226 286 69 388 101 8,242
Arts, A/V Technology and Communications 313 2 30 3 90 36 34 45 262 161 0 0 66 9 0 1,051
Business, Management and Administration 2,373 800 300 457 2,704 727 1,284 2,621 3,228 1,030 1,493 1,053 492 1,112 655 20,329
Education and Training 114 36 45 106 803 1,215 0 624 189 279 21 1,033 26 187 26 4,704
Finance 235 103 13 274 96 49 5 205 190 473 0 241 20 192 13 2,109
Government and Public Administration 666 418 39 777 2,014 142 947 4,774 5,932 188 696 105 197 1,429 382 18,706
Health Science 11,809 4,955 1,342 5,347 8,013 1,885 1,629 10,723 13,489 3,922 8,372 11,397 3,076 7,516 887 94,362
Hospitality and Tourism 8 3 0 6 377 2 0 86 917 87 0 147 17 126 0 1,776
Human Services 516 74 128 698 99 183 124 760 743 413 16 797 235 432 140 5,358
Information Technology 155 0 0 0 7 2 0 24 89 14 0 0 2 1 3 297
Law, Public Safety and Security 447 34 224 119 1,274 24 38 620 1,761 65 878 302 75 309 140 6,310
Manufacturing 565 157 46 60 770 91 400 998 566 517 218 171 55 600 168 5,382
Marketing, Sales and Service 196 114 1 55 280 33 0 133 2,003 267 0 247 81 80 0 3,490
Science, Technology, Engineering and
Mathematics 3 11 0 0 0 0 0 5 0 98 0 0 0 0 0 117
Transportation, Distribution and Logistics 397 622 68 235 694 122 1,426 371 2,106 1,264 127 71 26 164 200 7,893
Not a Clustered CIP 6,087 4,215 1,126 2,443 4,101 3,027 3,556 11,826 12,883 12,762 5,855 4,780 1,644 4,158 2,265 80,728
Total 24,442 12,016 3,511 12,103 21,610 8,198 10,202 35,062 47,257 25,266 17,902 20,862 6,275 16,960 4,989 266,655
Note: Totals may be greater than enrollment since students may be in one or more clusters. Definitions of Career Clusters can be obtained from http://www.careerclusters.org/.
Tables, Section 8 | 14

Table 8-20: Non-Credit Total Enrollment by Gender by College 2013College Male, N Male, % Female, N Female, % Unknown, N Unknown, % Total
Northeast 8,742 39 10,756 48 3,051 14 22,549
North Iowa Area 5,404 44 6,783 56 2 0 12,189
Iowa Lakes 1,628 46 1,865 53 47 1 3,540
Northwest 3,256 29 4,062 36 4,056 36 11,374
Iowa Central 6,368 37 5,902 35 4,855 28 17,125
Iowa Valley 2,992 36 3,816 46 1,494 18 8,302
Hawkeye 4,599 54 3,975 46 0 0 8,574
Eastern Iowa 6,252 20 6,959 22 18,539 58 31,750
Kirkwood 19,569 47 14,829 35 7,478 18 41,876
Des Moines Area 14,691 56 11,356 44 0 0 26,047
Western Iowa Tech 7,860 44 8,746 49 1,351 8 17,957
Iowa Western 6,451 32 12,213 60 1,733 9 20,397
Southwestern 2,671 41 3,838 58 72 1 6,581
Indian Hills 6,111 38 7,589 47 2,450 15 16,150
Southeastern 2,620 52 2,410 48 22 0 5,052
Total 99,214 40 105,099 42 45,150 18 249,463
Table 8-21: Non-Credit Total Enrollment by Gender by College 2014College Male, N Male, % Female, N Female, % Unknown, N Unknown, % Total
Northeast 9,301 42 11,652 53 1,173 5 22,126
North Iowa Area 4,970 44 6,363 56 0 0 11,333
Iowa Lakes 1,524 46 1,769 53 37 1 3,330
Northwest 2,874 27 3,713 35 4,175 39 10,762
Iowa Central 6,958 38 5,907 32 5,454 30 18,319
Iowa Valley 2,736 33 3,760 45 1,814 22 8,310
Hawkeye 5,628 61 3,587 39 0 0 9,215
Eastern Iowa 6,590 21 7,347 23 17,962 56 31,899
Kirkwood 23,845 55 17,622 41 1,900 4 43,367
Des Moines Area 14,981 61 9,605 39 0 0 24,586
Western Iowa Tech 7,035 42 8,702 52 885 5 16,622
Iowa Western 5,982 31 11,774 60 1,733 9 19,489
Southwestern 2,400 41 3,346 58 65 1 5,811
Indian Hills 6,190 41 6,951 46 2,129 14 15,270
Southeastern 2,496 56 1,949 43 49 1 4,494
Total 103,510 42 104,047 43 37,376 15 244,933
Tables, Section 8 | 15

Table 8-22: Non-Credit Total Enrollment by Race/Ethnicity by College 2013
College
American
Indian Asian Black
Hawaiian/Pacific
Islander Hispanic White
Two or
more races
No
Response Total
Northeast 5 11 30 0 58 1,077 11 21,357 22,549
North Iowa Area 11 32 87 3 200 5,870 0 5,986 12,189
Iowa Lakes 7 19 54 0 108 2,536 5 811 3,540
Northwest 16 14 7 1 246 3,862 14 7,214 11,374
Iowa Central 42 178 819 5 686 6,657 0 8,738 17,125
Iowa Valley 60 120 74 2 497 2,438 26 5,085 8,302
Hawkeye 27 200 686 10 331 7,048 97 175 8,574
Eastern Iowa 102 139 906 11 749 9,141 127 20,575 31,750
Kirkwood 24 180 746 5 537 2,261 108 38,015 41,876
Des Moines Area 76 760 1,712 6 1,611 16,285 220 5,377 26,047
Western Iowa Tech 189 163 286 10 1,254 6,353 64 9,638 17,957
Iowa Western 65 77 386 19 482 10,142 52 9,174 20,397
Southwestern 10 18 184 6 153 4,960 12 1,238 6,581
Indian Hills 65 76 261 0 319 9,141 45 6,243 16,150
Southeastern 19 29 349 1 117 0 2,442 2,095 5,052
Total 718 2,016 6,587 79 7,348 87,771 3,223 141,721 249,463
Table 8-23: Non-Credit Total Enrollment by Race/Ethnicity by College 2014
College
American
Indian Asian Black
Hawaiian/Pacific
Islander Hispanic White
Two or
more races
No
Response Total
Northeast 26 30 39 4 63 2,917 59 18,988 22,126
North Iowa Area 7 30 96 3 121 5,462 0 5,614 11,333
Iowa Lakes 3 10 53 2 121 2,373 8 760 3,330
Northwest 17 17 10 2 219 3,594 12 6,891 10,762
Iowa Central 41 289 826 10 836 6,628 0 9,689 18,319
Iowa Valley 40 180 66 5 515 1,899 11 5,594 8,310
Hawkeye 19 202 1,113 16 399 7,027 85 354 9,215
Eastern Iowa 74 138 944 13 862 9,263 202 20,403 31,899
Kirkwood 24 149 676 8 554 1,627 102 40,227 43,367
Des Moines Area 86 611 1,406 6 1,222 16,056 166 5,033 24,586
Western Iowa Tech 199 231 330 13 1,298 6,157 58 8,336 16,622
Iowa Western 66 59 378 22 434 9,463 47 9,020 19,489
Southwestern 6 15 161 3 122 4,596 7 901 5,811
Indian Hills 49 67 291 2 322 8,257 37 6,245 15,270
Southeastern 24 18 247 0 96 2,184 42 1,883 4,494
Total 681 2,046 6,636 109 7,184 87,503 836 139,938 244,933
Tables, Section 8 | 16

Table 8-24: Non-Credit Skill Enhancement Enrollment by Federal Career Cluster by College 2014
No
rthe
ast
No
rth Io
wa A
rea
Iow
a Lakes
No
rthw
est
Iow
a Ce
ntral
Iow
a Valle
y
Haw
keye
Eastern
Iow
a
Kirkw
oo
d
De
s Mo
ine
s Are
a
We
stern
Iow
a Tech
Iow
a We
stern
Sou
thw
este
rn
Ind
ian H
ills
Sou
the
astern
To
tal
Agriculture, Food and Natural Resources 95 196 94 913 159 347 0 123 771 367 0 212 194 257 9 3,737
Architecture and Construction 66 21 55 267 44 58 548 102 165 1,276 186 65 0 213 7 3,073
Arts, A/V Technology and Communications 313 2 4 1 36 36 4 45 195 155 0 0 66 8 0 865
Business, Management and Administration 1,736 616 300 349 805 504 931 1,224 2,736 976 1,404 839 477 1,031 630 14,558
Education and Training 94 9 8 74 802 303 0 134 188 220 3 454 18 35 26 2,368
Finance 48 0 13 213 94 42 5 49 18 80 0 23 1 149 13 748
Government and Public Administration 148 68 7 310 439 40 600 2,782 5,815 188 696 19 183 534 317 12,146
Health Science 7,553 3,083 468 4,535 7,844 938 1,419 8,753 9,915 2,658 4,024 3,999 1,990 5,491 530 63,200
Hospitality and Tourism 8 3 0 6 340 2 0 86 43 87 0 122 17 97 0 811
Human Services 170 0 24 508 99 98 0 281 107 106 16 545 232 162 59 2,407
Information Technology 155 0 0 0 1 2 0 13 89 14 0 0 2 1 3 280
Law, Public Safety and Security 439 34 224 119 1,274 24 18 620 1,453 65 878 151 57 309 111 5,776
Manufacturing 190 26 46 26 199 36 178 364 370 374 200 119 40 477 165 2,810
Marketing, Sales and Service 67 0 1 0 102 5 0 86 2,003 69 0 43 0 54 0 2,430
Science, Technology, Engineering and
Mathematics 0 0 0 0 0 0 0 0 0 98 0 0 0 0 0 98
Transportation, Distribution and Logistics 78 362 68 224 568 106 1,271 162 1,884 1,075 127 67 26 164 200 6,382
Not a Clustered CIP 204 1 0 2 0 70 0 3044 105 129 0 33 0 1326 2 4,916
Total 11,364 4,421 1,312 7,547 12,806 2,611 4,974 17,868 25,857 7,937 7,534 6,691 3,303 10,308 2,072 126,605
Note: Totals may be greater than enrollment since students may be in one or more clusters. Definitions of Career Clusters can be obtained from http://www.careerclusters.org/.
Tables, Section 8 | 17

Table 8-25: Non-Credit Recertification and Licensure Enrollment by Federal Career Cluster by College 2014
No
rthe
ast
No
rth Io
wa A
rea
Iow
a Lakes
No
rthw
est
Iow
a Ce
ntral
Iow
a Valle
y
Haw
keye
Eastern
Iow
a
Kirkw
oo
d
De
s Mo
ine
s Are
a
We
stern
Iow
a Tech
Iow
a We
stern
Sou
thw
este
rn
Ind
ian H
ills
Sou
the
astern
To
tal
Agriculture, Food and Natural Resources 0 266 0 12 0 0 0 0 223 232 0 20 0 0 0 753
Architecture and Construction 306 0 0 180 0 193 0 0 228 441 0 164 69 175 0 1,756
Arts, A/V Technology and Communications 0 0 0 0 0 0 0 0 0 0 0 0 0 0 0 0
Business, Management and Administration 0 0 0 0 0 0 0 0 0 0 0 0 0 0 0 0
Education and Training 0 0 3 0 0 1 0 0 0 0 5 0 8 0 0 17
Finance 187 92 0 62 0 0 0 157 167 417 0 76 19 56 0 1,233
Government and Public Administration 0 87 32 46 0 10 0 0 32 0 0 0 16 13 0 236
Health Science 4,659 2,056 723 704 0 1,006 174 2,083 4,037 1,386 4,549 7,370 1,215 2,663 324 32,949
Hospitality and Tourism 0 0 0 0 0 0 0 0 0 0 0 0 0 0 0 0
Human Services 350 74 100 167 0 85 124 460 636 308 0 252 3 271 87 2,917
Information Technology 0 0 0 0 0 0 0 0 0 0 0 0 0 0 0 0
Law, Public Safety and Security 20 0 0 0 0 0 0 0 0 0 0 0 24 0 29 73
Manufacturing 0 0 0 0 0 0 0 0 0 0 0 0 9 142 0 151
Marketing, Sales and Service 126 114 0 49 0 28 0 41 0 195 0 210 81 38 0 882
Science, Technology, Engineering and
Mathematics 0 0 0 0 0 0 0 0 0 0 0 0 0 0 0 0
Transportation, Distribution and Logistics 0 0 0 0 0 0 0 0 0 298 0 0 0 0 0 298
Not a Clustered CIP 0 0 0 0 0 0 0 0 0 0 0 0 0 0 0 0
Total 5,648 2,689 858 1,220 0 1,323 298 2,741 5,323 3,277 4,554 8,092 1,444 3,358 440 41,265
Note: Totals may be greater than enrollment since students may be in one or more clusters. Definitions of Career Clusters can be obtained from http://www.careerclusters.org/.
Tables, Section 8 | 18
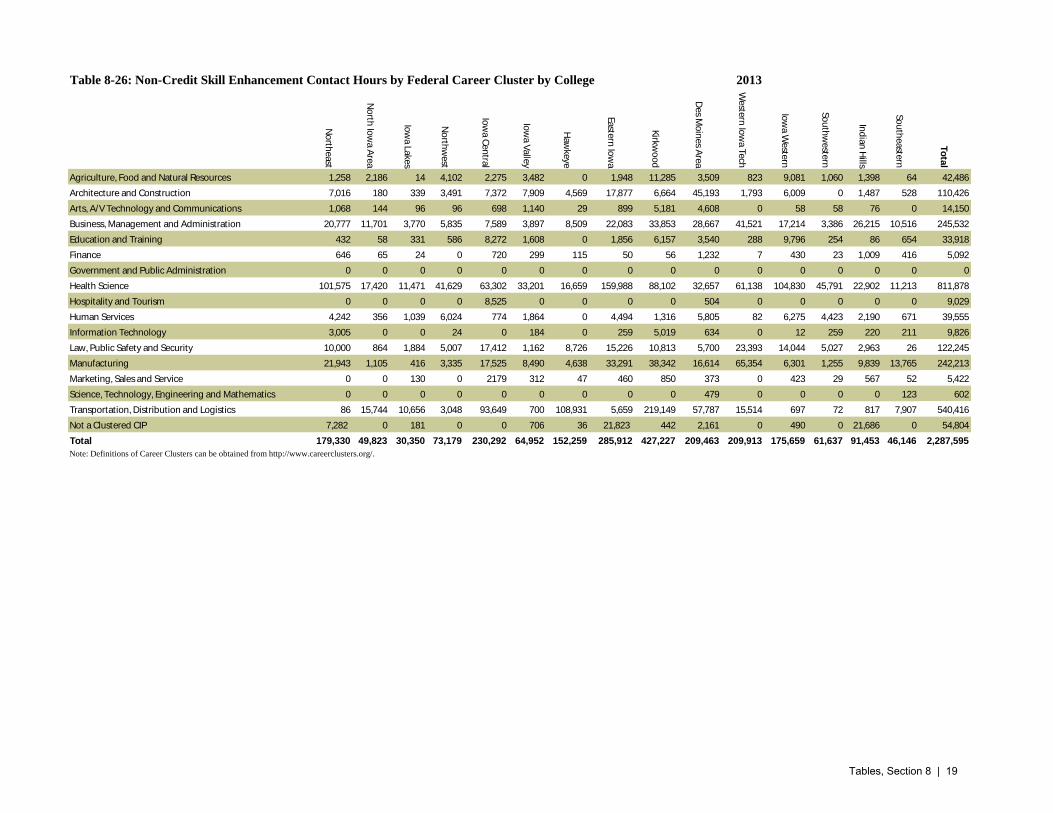
Table 8-26: Non-Credit Skill Enhancement Contact Hours by Federal Career Cluster by College 2013
No
rtheast
No
rth Io
wa A
rea
Iow
a Lakes
No
rthw
est
Iow
a Ce
ntral
Iow
a Valle
y
Haw
keye
Eastern
Iow
a
Kirkw
oo
d
De
s Mo
ine
s Are
a
We
stern
Iow
a Tech
Iow
a We
stern
Sou
thw
este
rn
Ind
ian H
ills
Sou
theaste
rn
To
tal
Agriculture, Food and Natural Resources 1,258 2,186 14 4,102 2,275 3,482 0 1,948 11,285 3,509 823 9,081 1,060 1,398 64 42,486
Architecture and Construction 7,016 180 339 3,491 7,372 7,909 4,569 17,877 6,664 45,193 1,793 6,009 0 1,487 528 110,426
Arts, A/V Technology and Communications 1,068 144 96 96 698 1,140 29 899 5,181 4,608 0 58 58 76 0 14,150
Business, Management and Administration 20,777 11,701 3,770 5,835 7,589 3,897 8,509 22,083 33,853 28,667 41,521 17,214 3,386 26,215 10,516 245,532
Education and Training 432 58 331 586 8,272 1,608 0 1,856 6,157 3,540 288 9,796 254 86 654 33,918
Finance 646 65 24 0 720 299 115 50 56 1,232 7 430 23 1,009 416 5,092
Government and Public Administration 0 0 0 0 0 0 0 0 0 0 0 0 0 0 0 0
Health Science 101,575 17,420 11,471 41,629 63,302 33,201 16,659 159,988 88,102 32,657 61,138 104,830 45,791 22,902 11,213 811,878
Hospitality and Tourism 0 0 0 0 8,525 0 0 0 0 504 0 0 0 0 0 9,029
Human Services 4,242 356 1,039 6,024 774 1,864 0 4,494 1,316 5,805 82 6,275 4,423 2,190 671 39,555
Information Technology 3,005 0 0 24 0 184 0 259 5,019 634 0 12 259 220 211 9,826
Law, Public Safety and Security 10,000 864 1,884 5,007 17,412 1,162 8,726 15,226 10,813 5,700 23,393 14,044 5,027 2,963 26 122,245
Manufacturing 21,943 1,105 416 3,335 17,525 8,490 4,638 33,291 38,342 16,614 65,354 6,301 1,255 9,839 13,765 242,213
Marketing, Sales and Service 0 0 130 0 2179 312 47 460 850 373 0 423 29 567 52 5,422
Science, Technology, Engineering and Mathematics 0 0 0 0 0 0 0 0 0 479 0 0 0 0 123 602
Transportation, Distribution and Logistics 86 15,744 10,656 3,048 93,649 700 108,931 5,659 219,149 57,787 15,514 697 72 817 7,907 540,416
Not a Clustered CIP 7,282 0 181 0 0 706 36 21,823 442 2,161 0 490 0 21,686 0 54,804
Total 179,330 49,823 30,350 73,179 230,292 64,952 152,259 285,912 427,227 209,463 209,913 175,659 61,637 91,453 46,146 2,287,595
Note: Definitions of Career Clusters can be obtained from http://www.careerclusters.org/.
Tables, Section 8 | 19
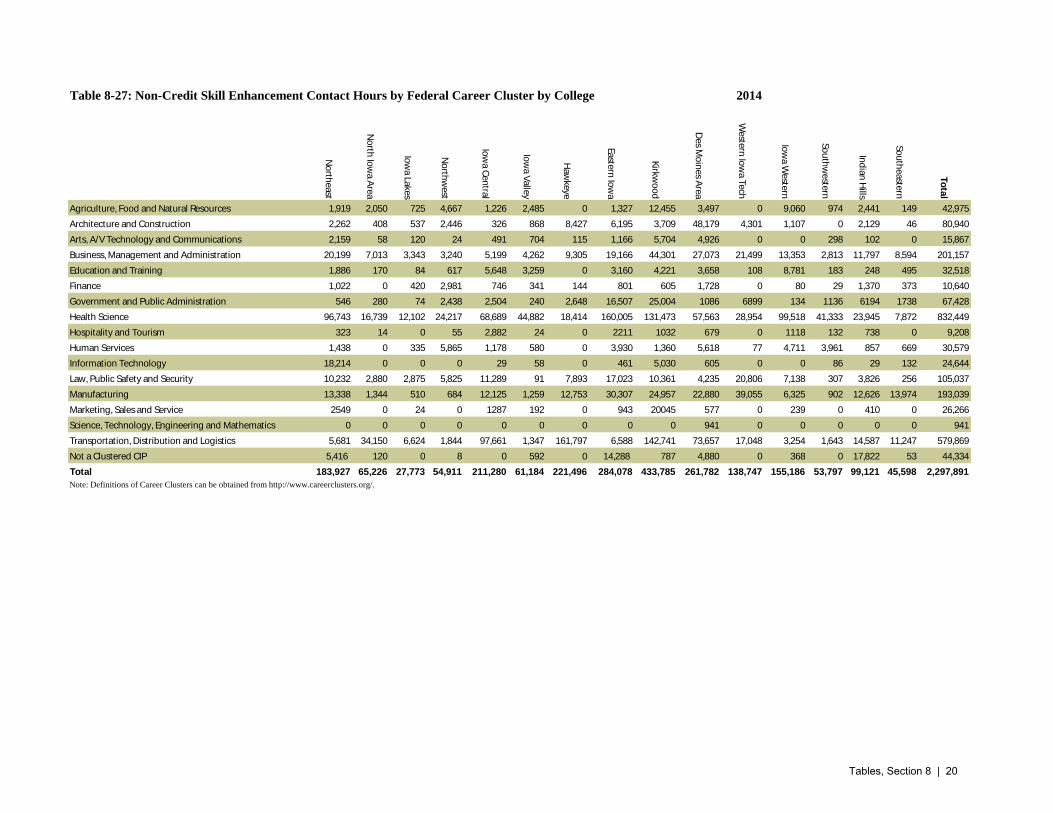
Table 8-27: Non-Credit Skill Enhancement Contact Hours by Federal Career Cluster by College 2014
No
rtheast
No
rth Io
wa A
rea
Iow
a Lakes
No
rthw
est
Iow
a Ce
ntral
Iow
a Valle
y
Haw
keye
Eastern
Iow
a
Kirkw
oo
d
De
s Mo
ine
s Are
a
We
stern
Iow
a Tech
Iow
a We
stern
Sou
thw
este
rn
Ind
ian H
ills
Sou
theaste
rn
To
tal
Agriculture, Food and Natural Resources 1,919 2,050 725 4,667 1,226 2,485 0 1,327 12,455 3,497 0 9,060 974 2,441 149 42,975
Architecture and Construction 2,262 408 537 2,446 326 868 8,427 6,195 3,709 48,179 4,301 1,107 0 2,129 46 80,940
Arts, A/V Technology and Communications 2,159 58 120 24 491 704 115 1,166 5,704 4,926 0 0 298 102 0 15,867
Business, Management and Administration 20,199 7,013 3,343 3,240 5,199 4,262 9,305 19,166 44,301 27,073 21,499 13,353 2,813 11,797 8,594 201,157
Education and Training 1,886 170 84 617 5,648 3,259 0 3,160 4,221 3,658 108 8,781 183 248 495 32,518
Finance 1,022 0 420 2,981 746 341 144 801 605 1,728 0 80 29 1,370 373 10,640
Government and Public Administration 546 280 74 2,438 2,504 240 2,648 16,507 25,004 1086 6899 134 1136 6194 1738 67,428
Health Science 96,743 16,739 12,102 24,217 68,689 44,882 18,414 160,005 131,473 57,563 28,954 99,518 41,333 23,945 7,872 832,449
Hospitality and Tourism 323 14 0 55 2,882 24 0 2211 1032 679 0 1118 132 738 0 9,208
Human Services 1,438 0 335 5,865 1,178 580 0 3,930 1,360 5,618 77 4,711 3,961 857 669 30,579
Information Technology 18,214 0 0 0 29 58 0 461 5,030 605 0 0 86 29 132 24,644
Law, Public Safety and Security 10,232 2,880 2,875 5,825 11,289 91 7,893 17,023 10,361 4,235 20,806 7,138 307 3,826 256 105,037
Manufacturing 13,338 1,344 510 684 12,125 1,259 12,753 30,307 24,957 22,880 39,055 6,325 902 12,626 13,974 193,039
Marketing, Sales and Service 2549 0 24 0 1287 192 0 943 20045 577 0 239 0 410 0 26,266
Science, Technology, Engineering and Mathematics 0 0 0 0 0 0 0 0 0 941 0 0 0 0 0 941
Transportation, Distribution and Logistics 5,681 34,150 6,624 1,844 97,661 1,347 161,797 6,588 142,741 73,657 17,048 3,254 1,643 14,587 11,247 579,869
Not a Clustered CIP 5,416 120 0 8 0 592 0 14,288 787 4,880 0 368 0 17,822 53 44,334
Total 183,927 65,226 27,773 54,911 211,280 61,184 221,496 284,078 433,785 261,782 138,747 155,186 53,797 99,121 45,598 2,297,891
Note: Definitions of Career Clusters can be obtained from http://www.careerclusters.org/.
Tables, Section 8 | 20
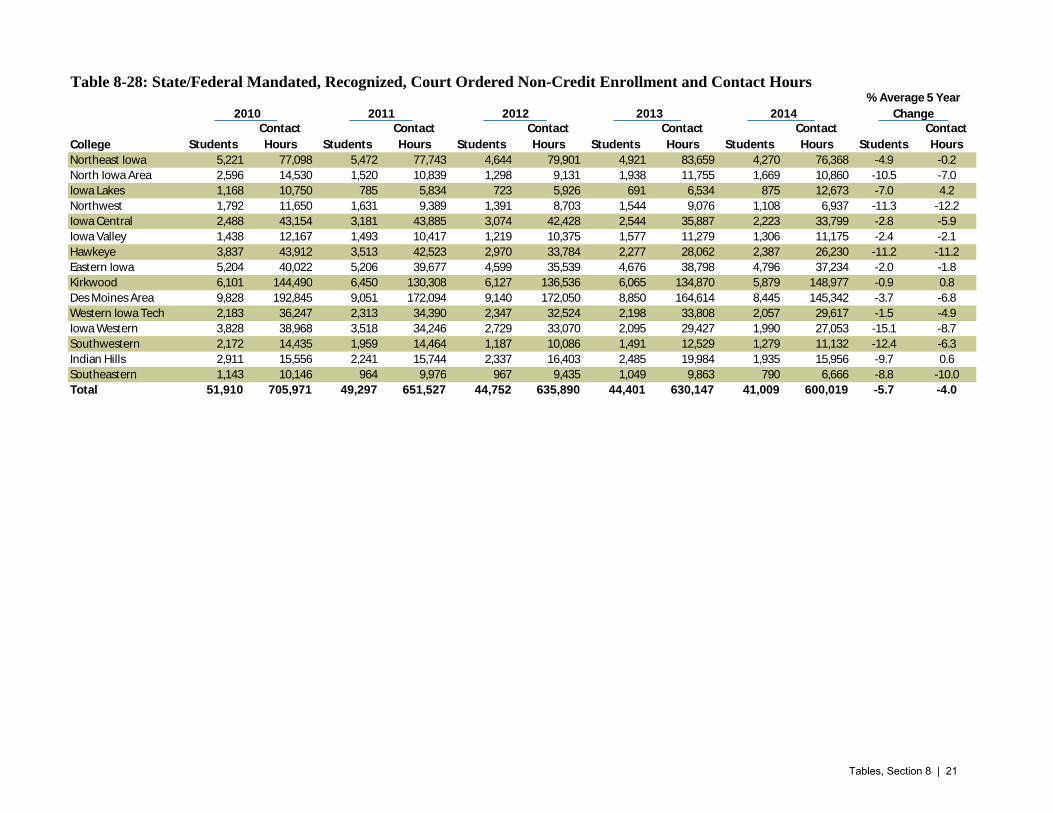
Table 8-28: State/Federal Mandated, Recognized, Court Ordered Non-Credit Enrollment and Contact Hours
College Students
Contact
Hours Students
Contact
Hours Students
Contact
Hours Students
Contact
Hours Students
Contact
Hours Students
Contact
Hours
Northeast Iowa 5,221 77,098 5,472 77,743 4,644 79,901 4,921 83,659 4,270 76,368 -4.9 -0.2
North Iowa Area 2,596 14,530 1,520 10,839 1,298 9,131 1,938 11,755 1,669 10,860 -10.5 -7.0
Iowa Lakes 1,168 10,750 785 5,834 723 5,926 691 6,534 875 12,673 -7.0 4.2
Northwest 1,792 11,650 1,631 9,389 1,391 8,703 1,544 9,076 1,108 6,937 -11.3 -12.2
Iowa Central 2,488 43,154 3,181 43,885 3,074 42,428 2,544 35,887 2,223 33,799 -2.8 -5.9
Iowa Valley 1,438 12,167 1,493 10,417 1,219 10,375 1,577 11,279 1,306 11,175 -2.4 -2.1
Hawkeye 3,837 43,912 3,513 42,523 2,970 33,784 2,277 28,062 2,387 26,230 -11.2 -11.2
Eastern Iowa 5,204 40,022 5,206 39,677 4,599 35,539 4,676 38,798 4,796 37,234 -2.0 -1.8
Kirkwood 6,101 144,490 6,450 130,308 6,127 136,536 6,065 134,870 5,879 148,977 -0.9 0.8
Des Moines Area 9,828 192,845 9,051 172,094 9,140 172,050 8,850 164,614 8,445 145,342 -3.7 -6.8
Western Iowa Tech 2,183 36,247 2,313 34,390 2,347 32,524 2,198 33,808 2,057 29,617 -1.5 -4.9
Iowa Western 3,828 38,968 3,518 34,246 2,729 33,070 2,095 29,427 1,990 27,053 -15.1 -8.7
Southwestern 2,172 14,435 1,959 14,464 1,187 10,086 1,491 12,529 1,279 11,132 -12.4 -6.3
Indian Hills 2,911 15,556 2,241 15,744 2,337 16,403 2,485 19,984 1,935 15,956 -9.7 0.6
Southeastern 1,143 10,146 964 9,976 967 9,435 1,049 9,863 790 6,666 -8.8 -10.0
Total 51,910 705,971 49,297 651,527 44,752 635,890 44,401 630,147 41,009 600,019 -5.7 -4.0
2010 2011 2012 2013 2014
% Average 5 Year
Change
Tables, Section 8 | 21
Tables, Adult LiteracyEnrollment and Programs 9
Table of Contents
9-1, 9-1a MIS Adult Literacy Programs Enrollment, MIS Adult Literacy Student Headcount.....................2
9-2, 9-3. Basic Skills/Developmental, HS Equivalency Certificate Enrollment............................................3
9-4, 9-5. Second Language Learning and ABE by Type of Program.............................................................4
9-6, 9-7. Adult Education and Literacy and English as a Second Language Enrollment, NRS....................5
9-8, 9-9. ABE by Type of Program and ABE Enrollment by College, Latest 5 years, NRS........................6
9-10. Adult Secondary Education Enrollment, Latest 5 years, NRS.............................................................7
9-11, 9-12. Adult Education Programs Enrollment by College, Latest 5 years..........................................8-9
9-13, 9-14. NRS Enrollment by Functioning Level, Ethnicity and Gender, Latest 5 years...................10-11
9-15, 9-16. Participants by College, Ethnicity and Race, NRS, Latest 5 years...........................................12
9-17, 9-18. Participants by College, Age and Gender, NRS, Latest 5 years................................................13
9-19, 9-20. Basic Literacy Skills Certificates, NRS and HS Equivalency Awards, Latest 5 years.............14
9-21. Community College Adult High School Diplomas, Latest 5 years....................................................15
9-22, 9-23. Enrollment by College, Core Measures, Latest 5 years.......................................................16-17
9-24, 9-25. Enrollment by Program Type, Distance Education, Latest 5 years...........................................18
9-26, 9-27. Enrollment by Program Type, Corrections, Latest 5 years..................................................18-19
9-28, 9-29. Participants Status on Entry by Program, Latest 5 years..........................................................20
Tables, Section 9 | 1

Table 9-1. Adult Literacy Enrollment - MIS* 2013
College 2010 2011 2012 2013 2014
% Average 5
Year Change
Northeast Iowa 927 859 577 704 638 -8.9
North Iowa Area 1,109 840 819 749 531 -16.8
Iowa Lakes 308 329 307 286 241 -5.9
Northwest 1,062 924 470 468 393 -22
Iowa Central 1,859 1,689 1,553 1,735 1,429 -6.4
Iowa Valley 1,118 1,055 1,582 895 824 -7.3
Hawkeye 992 1,607 1,447 973 962 -0.8
Eastern Iowa 3,334 2,946 2,181 2,088 1,951 -12.5
Kirkwood 4,107 4,009 3,016 3,804 3,386 -4.7
Des Moines Area 6,790 6,270 7,313 4,910 3,844 -13.3
Western Iowa Tech 1,454 1,909 2,191 1,616 1,624 2.8
Iowa Western 1,742 1,571 1,613 1,219 1,460 -4.3
Southwestern 491 488 572 450 377 -6.4
Indian Hills 1,424 1,103 1,480 948 699 -16.3
Southeastern 2,043 1,541 1,514 1,545 1,189 -12.7
Total 28,760 27,140 26,635 22,390 19,548 -9.2
Table 9-1a. Unduplicated Adult Literacy Enrollment - MIS*
College 2010 2011 2012 2013 2014
% Average 5
Year Change
Northeast Iowa 900 847 574 669 607 -9.4
North Iowa Area 1098 842 807 731 526 -16.8
Iowa Lakes 305 328 302 282 236 -6.2
Northwest 1041 1017 456 450 381 -22.2
Iowa Central 1866 1647 1516 1510 1359 -7.6
Iowa Valley 1102 1048 1489 832 767 -8.7
Hawkeye 1006 1345 1387 882 929 -2
Eastern Iowa 3343 2930 2134 2033 1840 -13.9
Kirkwood 3038 2981 2227 2765 2550 -4.3
Des Moines Area 6440 5930 6943 4679 3685 -13
Western Iowa Tech 1439 1859 1809 1561 1573 2.3
Iowa Western 1799 1628 1592 1190 1444 -5.3
Southwestern 548 570 556 430 376 -9
Indian Hills 1421 1074 1434 875 656 -17.6
Southeastern 1935 1494 1440 1476 1146 -12.3
Total 27,281 25,540 24,666 20,365 18,075 -9.8
*Students are counted only once, regardless of the participation in more than one Adult Literacy program.
*Includes CIPs 32010100, 32010900, 32010910, 32010500, 53020100. Students are counted once per CIP number, and
the resulting totals exceed headcounts.
Tables, Section 9 | 2

Table 9-2. Basic Skills and Developmental/Remedial Education - MIS*
College 2010 2011 2012 2013 2014
% Average 5
Year Change
Northeast Iowa 556 529 352 213 251 -18
North Iowa Area 714 479 421 371 307 -19
Iowa Lakes 0 0 0 0 0 N/A
Northwest 735 649 130 124 97 -39.7
Iowa Central 326 222 505 445 525 12.7
Iowa Valley 40 38 200 162 76 17.4
Hawkeye 161 697 372 228 173 1.8
Eastern Iowa 2,410 2,210 1,628 1,613 1,471 -11.6
Kirkwood 1,989 2,055 1,530 1,867 1,686 -4
Des Moines Area 3,440 3,178 3,595 1,984 2,086 -11.8
Western Iowa Tech 0 0 503 0 0 N/A
Iowa Western 716 445 535 415 695 -0.7
Southwestern 380 93 169 148 106 -27.3
Indian Hills 657 546 280 331 155 -30.3
Southeastern 760 255 313 360 849 2.8
Total 12,884 11,396 10,533 8,261 8,477 -9.9
*CIP codes 32010100 and 32019900
College 2010 2011 2012 2013 2014
% Average 5
Year Change
Northeast Iowa 201 184 157 395 271 7.8
North Iowa Area 351 296 346 301 197 -13.4
Iowa Lakes 259 313 253 242 181 -8.6
Northwest 191 137 152 219 163 -3.9
Iowa Central 963 969 606 859 478 -16.1
Iowa Valley 589 539 401 428 353 -12
Hawkeye 617 763 828 446 453 -7.4
Eastern Iowa 448 327 307 196 109 -29.8
Kirkwood 1,903 1,832 1,321 1,400 1,135 -12.1
Des Moines Area 1,976 1,043 2,265 1,014 177 -45.3
Western Iowa Tech 823 1,976 932 892 782 -1.3
Iowa Western 863 995 942 655 636 -7.3
Southwestern 8 327 306 262 228 131.1
Indian Hills 501 342 541 465 376 -6.9
Southeastern 1,226 1,242 1,161 1,141 303 -29.5
Total 10,919 11,285 10,518 8,915 5,842 -14.5
*CIP code 53020100
Table 9-3. High School Equivalency Certificate Program - MIS*
Tables, Section 9 | 3
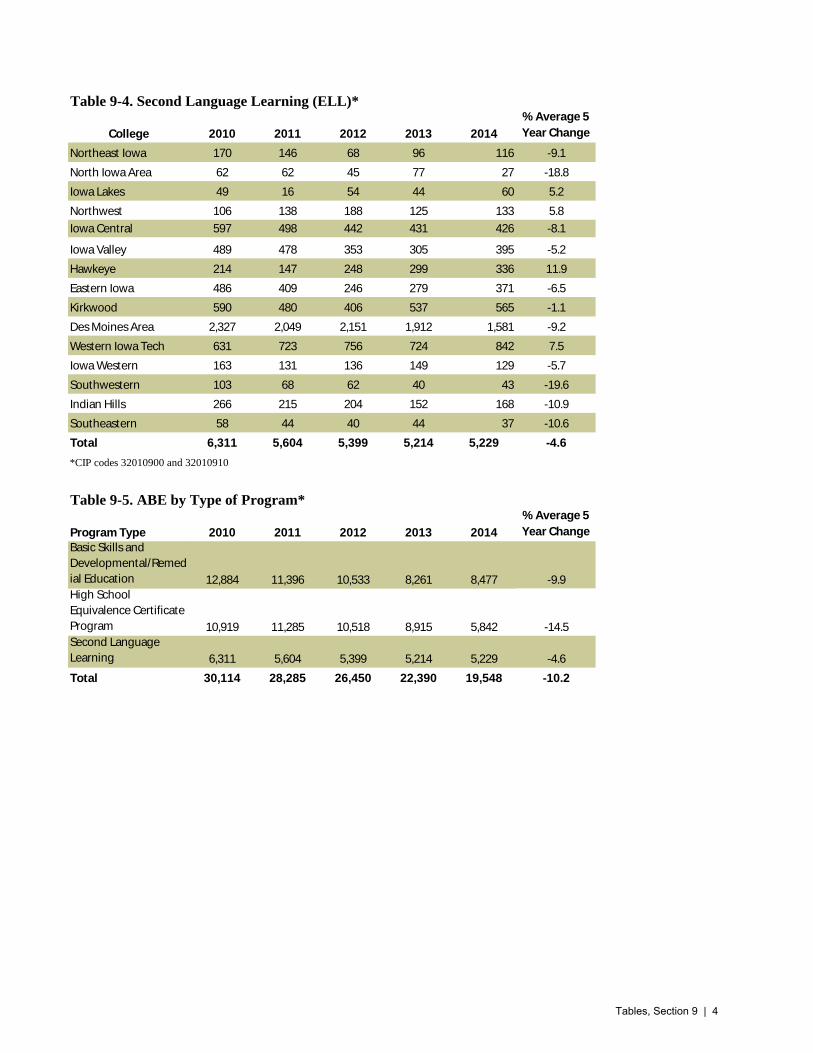
College 2010 2011 2012 2013 2014
% Average 5
Year Change
Northeast Iowa 170 146 68 96 116 -9.1
North Iowa Area 62 62 45 77 27 -18.8
Iowa Lakes 49 16 54 44 60 5.2
Northwest 106 138 188 125 133 5.8
Iowa Central 597 498 442 431 426 -8.1
Iowa Valley 489 478 353 305 395 -5.2
Hawkeye 214 147 248 299 336 11.9
Eastern Iowa 486 409 246 279 371 -6.5
Kirkwood 590 480 406 537 565 -1.1
Des Moines Area 2,327 2,049 2,151 1,912 1,581 -9.2
Western Iowa Tech 631 723 756 724 842 7.5
Iowa Western 163 131 136 149 129 -5.7
Southwestern 103 68 62 40 43 -19.6
Indian Hills 266 215 204 152 168 -10.9
Southeastern 58 44 40 44 37 -10.6
Total 6,311 5,604 5,399 5,214 5,229 -4.6
*CIP codes 32010900 and 32010910
Program Type 2010 2011 2012 2013 2014
% Average 5
Year Change
Basic Skills and
Developmental/Remed
ial Education 12,884 11,396 10,533 8,261 8,477 -9.9High School
Equivalence Certificate
Program 10,919 11,285 10,518 8,915 5,842 -14.5
Second Language
Learning 6,311 5,604 5,399 5,214 5,229 -4.6
Total 30,114 28,285 26,450 22,390 19,548 -10.2
Table 9-4. Second Language Learning (ELL)*
Table 9-5. ABE by Type of Program*
Tables, Section 9 | 4
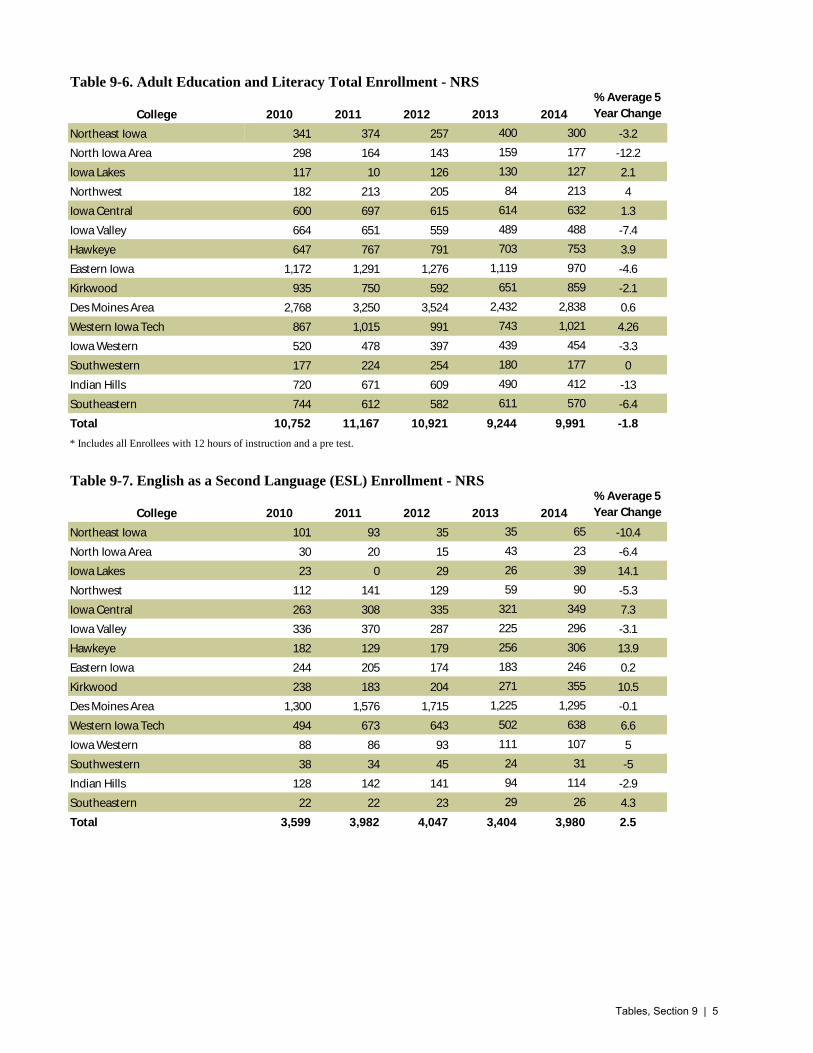
College 2010 2011 2012 2013 2014
% Average 5
Year Change
Northeast Iowa 341 374 257 400 300 -3.2
North Iowa Area 298 164 143 159 177 -12.2
Iowa Lakes 117 10 126 130 127 2.1
Northwest 182 213 205 84 213 4
Iowa Central 600 697 615 614 632 1.3
Iowa Valley 664 651 559 489 488 -7.4
Hawkeye 647 767 791 703 753 3.9
Eastern Iowa 1,172 1,291 1,276 1,119 970 -4.6
Kirkwood 935 750 592 651 859 -2.1
Des Moines Area 2,768 3,250 3,524 2,432 2,838 0.6
Western Iowa Tech 867 1,015 991 743 1,021 4.26
Iowa Western 520 478 397 439 454 -3.3
Southwestern 177 224 254 180 177 0
Indian Hills 720 671 609 490 412 -13
Southeastern 744 612 582 611 570 -6.4
Total 10,752 11,167 10,921 9,244 9,991 -1.8
* Includes all Enrollees with 12 hours of instruction and a pre test.
College 2010 2011 2012 2013 2014
% Average 5
Year Change
Northeast Iowa 101 93 35 35 65 -10.4
North Iowa Area 30 20 15 43 23 -6.4
Iowa Lakes 23 0 29 26 39 14.1
Northwest 112 141 129 59 90 -5.3
Iowa Central 263 308 335 321 349 7.3
Iowa Valley 336 370 287 225 296 -3.1
Hawkeye 182 129 179 256 306 13.9
Eastern Iowa 244 205 174 183 246 0.2
Kirkwood 238 183 204 271 355 10.5
Des Moines Area 1,300 1,576 1,715 1,225 1,295 -0.1
Western Iowa Tech 494 673 643 502 638 6.6
Iowa Western 88 86 93 111 107 5
Southwestern 38 34 45 24 31 -5
Indian Hills 128 142 141 94 114 -2.9
Southeastern 22 22 23 29 26 4.3
Total 3,599 3,982 4,047 3,404 3,980 2.5
Table 9-6. Adult Education and Literacy Total Enrollment - NRS
Table 9-7. English as a Second Language (ESL) Enrollment - NRS
Tables, Section 9 | 5

Program Type 2010 2011 2012 2013 2014
% Average 5
Year Change
Adult Basic Education 5,095 5,254 4,948 4,137 4,739 -1.8
Adult Secondary Education 2,061 1,931 1,926 1,703 1,272 -11.4
English as a Second Language 3,599 3,982 4,047 3,404 3,980 2.5
Total 10,755 11,167 10,921 9,244 9,991 -1.8
College 2010 2011 2012 2013 2014
% Average 5
Year Change
Northeast Iowa 193 226 179 223 178 -2
North Iowa Area 206 111 100 90 123 -12.1
Iowa Lakes 63 5 65 66 56 -2.9
Northwest 54 31 56 18 102 17.2
Iowa Central 237 284 196 184 200 -4.2
Iowa Valley 252 222 195 155 160 -10.7
Hawkeye 345 475 484 316 323 -1.6
Eastern Iowa 683 919 836 770 622 -2.3
Kirkwood 358 343 307 276 371 0.9
Des Moines Area 1,021 1,195 1,257 779 1,287 6
Western Iowa Tech 245 263 245 186 307 5.8
Iowa Western 341 283 204 224 252 -7.3
Southwestern 84 66 92 73 85 0.3
Indian Hills 422 350 263 281 244 -12.8
Southeastern 591 481 469 496 429 -7.7
Total 5,095 5,254 4,948 4,137 4,739 -1.8
Table 9-9. Adult Basic Education Enrollment - NRS
Table 9-8. ABE by Type of Program - NRS
Tables, Section 9 | 6

College 2010 2011 2012 2013 2014
% Average 5
year Change
Northeast Iowa 47 55 43 142 57 4.9
North Iowa Area 62 33 28 26 31 -15.9
Iowa Lakes 31 5 32 38 32 0.8
Northwest 16 41 20 7 21 7
Iowa Central 100 105 84 109 83 -4.6
Iowa Valley 76 59 77 109 32 -19.4
Hawkeye 120 163 128 131 124 8
Eastern Iowa 245 167 266 166 102 -19.7
Kirkwood 339 224 81 104 133 -20.9
Des Moines Area 447 479 552 428 256 -13
Western Iowa Tech 128 79 103 55 76 -12.2
Iowa Western 91 109 100 104 95 1.1
Southwestern 55 124 117 83 61 2.6
Indian Hills 173 179 205 115 54 -25.3
Southeastern 131 109 90 86 115 -3.2
Total 2,061 1,931 1,926 1,703 1,272 -11.4
Table 9-10. Adult Secondary Education Enrollment - NRS
Tables, Section 9 | 7

College
Basic Skills and
Developmental
/ Remedial
Education
High School
Equivalency
Certificate
Program
Second
Language
Learning Total
Adult Basic
Education
Adult
Secondary
Education
English as
a Second
Language Unknown Total
Adult Basic
Education
Adult
Secondary
Education
English as
a Second
Language Total
Northeast Iowa 251 271 116 638 454 138 91 64 747 178 57 65 300
North Iowa Area 307 197 27 531 174 37 24 3 238 123 31 23 177
Iowa Lakes 0 181 60 241 103 52 61 12 228 56 32 39 127
Northwest 97 163 133 393 151 40 141 12 344 102 21 90 213
Iowa Central 525 478 426 1,429 281 97 445 15 838 200 83 349 632
Iowa Valley 76 353 395 824 258 69 340 26 693 160 32 296 488
Hawkeye 173 453 336 962 513 143 362 22 1,040 323 124 306 753
Eastern Iowa 1,471 109 371 1,951 1,175 185 326 21 1,707 622 102 246 970
Kirkwood 1,686 1,135 565 3,386 1,034 306 474 255 2,069 371 133 355 859
Des Moines Area 2,086 177 1,581 3,844 2,590 656 1,933 349 5,528 1,287 256 1,295 2,838
Western Iowa Tech 0 782 842 1,624 596 119 797 65 1,577 307 76 638 1,021
Iowa Western 695 636 129 1,460 452 137 123 7 719 252 95 107 454
Southwestern 106 228 43 377 150 83 40 102 375 85 61 31 177
Indian Hills 155 376 168 699 395 87 153 22 657 244 54 114 412
Southeastern 849 303 37 1,189 669 189 33 218 1,109 429 115 26 570
Total 8,477 5,842 5,229 19,548 8,995 2,338 5,343 1,193 17,869 4,739 1,272 3,980 9,991
% of Total 43.4 29.9 26.7 100.0 50.3 13.1 29.9 6.7 100.0 47.4 12.7 39.8 100.0
Table 9-11. Adult Education Programs Enrollment by College, 2014MIS NRS ReportedTOPS Enterprise
Tables, Section 9 | 8
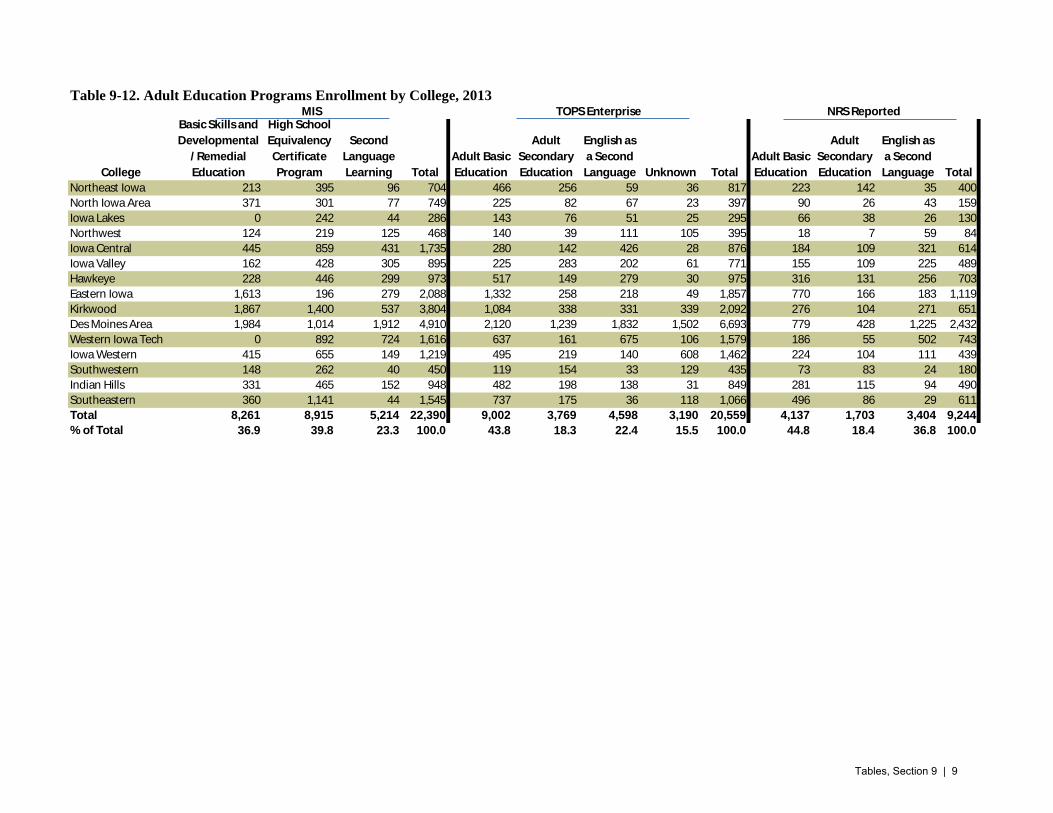
College
Basic Skills and
Developmental
/ Remedial
Education
High School
Equivalency
Certificate
Program
Second
Language
Learning Total
Adult Basic
Education
Adult
Secondary
Education
English as
a Second
Language Unknown Total
Adult Basic
Education
Adult
Secondary
Education
English as
a Second
Language Total
Northeast Iowa 213 395 96 704 466 256 59 36 817 223 142 35 400
North Iowa Area 371 301 77 749 225 82 67 23 397 90 26 43 159
Iowa Lakes 0 242 44 286 143 76 51 25 295 66 38 26 130
Northwest 124 219 125 468 140 39 111 105 395 18 7 59 84
Iowa Central 445 859 431 1,735 280 142 426 28 876 184 109 321 614
Iowa Valley 162 428 305 895 225 283 202 61 771 155 109 225 489
Hawkeye 228 446 299 973 517 149 279 30 975 316 131 256 703
Eastern Iowa 1,613 196 279 2,088 1,332 258 218 49 1,857 770 166 183 1,119
Kirkwood 1,867 1,400 537 3,804 1,084 338 331 339 2,092 276 104 271 651
Des Moines Area 1,984 1,014 1,912 4,910 2,120 1,239 1,832 1,502 6,693 779 428 1,225 2,432
Western Iowa Tech 0 892 724 1,616 637 161 675 106 1,579 186 55 502 743
Iowa Western 415 655 149 1,219 495 219 140 608 1,462 224 104 111 439
Southwestern 148 262 40 450 119 154 33 129 435 73 83 24 180
Indian Hills 331 465 152 948 482 198 138 31 849 281 115 94 490
Southeastern 360 1,141 44 1,545 737 175 36 118 1,066 496 86 29 611
Total 8,261 8,915 5,214 22,390 9,002 3,769 4,598 3,190 20,559 4,137 1,703 3,404 9,244
% of Total 36.9 39.8 23.3 100.0 43.8 18.3 22.4 15.5 100.0 44.8 18.4 36.8 100.0
Table 9-12. Adult Education Programs Enrollment by College, 2013MIS TOPS Enterprise NRS Reported
Tables, Section 9 | 9

Table 9-13. NRS Enrollment by Entering Educational Functioning Level, Ethnicity and Gender, 2014
Total
M F M F M F M F M F M F M F
ABE Beginning Literacy 0 1 2 1 25 31 23 19 55 55 0 0 0 1 213
ABE Beginning Basic Education 1 7 3 10 89 84 53 93 131 152 2 1 5 12 643
ABE Intermediate Low 9 9 7 8 177 133 107 139 241 316 1 4 13 13 1,177
ABE Intermediate High 12 16 30 22 230 209 203 269 772 864 5 4 25 45 2,706
ABE Subtotal 22 33 42 41 521 457 386 520 1,199 1,387 8 9 43 71 4,739
ASE Low 5 4 7 10 60 46 56 46 316 265 2 1 7 8 833
ASE High 1 2 2 6 14 16 27 21 195 143 1 2 4 5 439
ASE Subtotal 6 6 9 16 74 62 83 67 511 408 3 3 11 13 1,272
ESL Beginning Literacy 0 0 33 63 24 65 24 38 1 2 0 0 1 3 254
ESL Beginning Low 0 0 45 49 28 60 46 81 5 6 0 0 1 5 326
ESL Beginning High 0 0 98 106 64 74 156 244 9 39 0 0 3 8 801
ESL Intermediate Low 1 1 139 150 86 95 208 321 28 39 1 2 3 6 1,080
ESL Intermediate High 0 0 112 140 55 45 167 261 26 34 0 1 2 4 847
ESL Advanced 0 0 55 97 38 26 151 257 14 30 1 0 1 2 672
ESL Subtotal 1 1 482 605 295 365 752 1,202 83 150 2 3 11 28 3,980
Total 29 40 533 662 890 884 1,221 1,789 1,793 1,945 13 15 65 112 9,991
Entering Educational Functioning
Level
White
Native
Hawaiian or
Other Pacific
Islander
Two or More
Races
American
Indian or
Alaskan
Native
AsianBlack or
African
American
Hispanic or
Latino
Tables, Section 9 | 10

Table 9-14. NRS Enrollment by Entering Educational Functioning Level, Ethnicity and Gender, 2013
Total
M F M F M F M F M F M F M F
ABE Beginning Literacy 0 0 0 3 25 20 14 10 43 43 0 0 1 1 160
ABE Beginning Basic Education 0 5 4 5 76 70 39 54 118 114 0 0 2 1 488
ABE Intermediate Low 3 6 14 6 140 112 87 95 203 244 1 0 9 10 930
ABE Intermediate High 15 17 19 32 241 254 221 235 715 746 3 3 24 34 2,559
ABE Subtotal 18 28 37 46 482 456 361 394 1079 1147 4 3 36 46 4,137
ASE Low 2 1 5 9 57 65 66 72 294 323 0 3 12 15 924
ASE High 6 6 3 2 19 31 37 39 301 313 0 2 14 6 779
ASE Subtotal 8 7 8 11 76 96 103 111 595 636 0 5 26 21 1,703
ESL Beginning Literacy 0 0 27 38 15 41 20 29 0 5 0 0 4 6 185
ESL Beginning Low 0 0 34 49 22 45 27 56 6 7 1 0 3 8 258
ESL Beginning High 0 0 100 123 69 74 108 179 20 17 0 0 4 11 705
ESL Intermediate Low 0 0 134 125 72 87 177 296 26 52 2 3 1 7 982
ESL Intermediate High 0 0 105 123 42 33 141 223 16 39 1 0 4 3 730
ESL Advanced 0 0 60 91 13 18 116 193 10 40 0 0 1 2 544
ESL Subtotal 0 0 460 549 233 298 589 976 78 160 4 3 17 37 3,404
Total 26 35 505 606 791 850 1,053 1,481 1,752 1,943 8 11 79 104 9,244
White
Native
Hawaiian or
Other Pacific
Islander
Two or More
RacesEntering Educational Functioning
Level
American
Indian or
Alaskan
Native
Asian Black or
African
American
Hispanic or
Latino
Tables, Section 9 | 11

Table 9-15. NRS Participant by College, Ethnicity and Race, 2014
College
American
Indian Asian Black
Hispanic or
Latino White
Hawaiian/
Pacific
Islander
Two or
more races TotalNortheast 2 9 48 71 166 1 3 300
North Iowa Area 0 9 18 26 117 1 6 177
Iowa Lakes 1 4 2 45 71 2 2 127
Northwest 1 3 1 120 84 4 0 213
Iowa Central 1 94 49 291 189 2 6 632
Iowa Valley 4 115 37 214 116 0 2 488
Hawkeye 0 130 185 157 272 1 8 753
Eastern Iowa 0 74 135 294 434 1 32 970
Kirkwood 4 90 221 223 293 2 26 859
Des Moines Area 22 521 707 687 836 3 62 2,838
Western Iowa Tech 26 117 140 548 175 7 8 1,021
Iowa Western 3 15 42 136 256 0 2 454
Southwestern 1 0 1 41 131 1 2 177
Indian Hills 2 5 49 97 250 3 6 412
Southeastern 2 9 139 60 348 0 12 570
Total 69 1,195 1,774 3,010 3,738 28 177 9,991
Table 9-16. NRS Participant by College, Ethnicity and Race, 2013
College
American
Indian Asian Black
Hispanic or
Latino White
Hawaiian/
Pacific
Islander
Two or
more races TotalNortheast 2 16 62 34 276 1 9 400
North Iowa Area 1 8 10 46 92 0 2 159
Iowa Lakes 0 3 7 34 84 0 2 130
Northwest 0 6 0 59 19 0 0 84
Iowa Central 2 107 44 259 191 1 10 614
Iowa Valley 5 86 36 245 114 0 3 489
Hawkeye 1 121 155 110 304 5 7 703
Eastern Iowa 2 87 200 283 520 2 25 1,119
Kirkwood 3 76 144 154 260 0 14 651
Des Moines Area 18 461 659 546 673 3 72 2,432
Western Iowa Tech 20 95 94 432 95 4 3 743
Iowa Western 1 19 38 130 247 0 4 439
Southwestern 1 1 5 39 133 0 1 180
Indian Hills 1 11 53 93 323 2 7 490
Southeastern 4 14 134 70 364 1 24 611
Total 61 1,111 1,641 2,534 3,695 19 183 9,244
Tables, Section 9 | 12

College M F M F M F M F M F Total
Northeast 24 28 37 55 46 77 9 20 2 2 300
North Iowa Area 21 7 20 32 30 54 3 9 0 1 177
Iowa Lakes 6 20 20 13 29 26 7 6 127
Northwest 7 2 14 26 39 80 12 21 7 5 213
Iowa Central 40 35 80 61 122 187 33 65 5 4 632
Iowa Valley 54 38 55 50 101 137 19 26 4 4 488
Hawkeye 27 22 102 102 200 199 29 60 7 5 753
Eastern Iowa 82 67 145 161 173 222 34 69 7 10 970
Kirkwood 55 53 85 98 162 268 40 58 14 26 859
Des Moines Area 109 101 322 354 563 918 163 242 30 36 2,838
Western Iowa Tech 48 41 146 133 209 276 61 88 10 9 1,021
Iowa Western 27 21 40 77 68 156 25 30 6 4 454
Southwestern 17 16 33 35 19 38 3 10 2 4 177
Indian Hills 36 28 58 53 70 89 27 36 10 5 412
Southeastern 43 15 163 49 166 46 53 19 9 7 570
Total 596 494 1,320 1,299 1,997 2,773 518 759 113 122 9,991
Table 9-18. NRS Participant by College, Age and Gender, 2013
College M F M F M F M F M F Total
Northeast 28 33 43 92 48 103 10 34 2 7 400
North Iowa Area 9 7 21 26 26 37 10 20 1 2 159
Iowa Lakes 13 19 21 19 19 29 6 2 0 2 130
Northwest 6 2 4 5 11 41 2 12 1 0 84
Iowa Central 38 33 90 77 107 166 37 56 6 4 614
Iowa Valley 65 26 53 64 78 148 20 27 5 3 489
Hawkeye 31 19 116 99 166 196 30 42 3 1 703
Eastern Iowa 110 94 171 163 204 252 49 62 5 9 1,119
Kirkwood 67 36 62 100 97 197 30 39 11 12 651
Des Moines Area 86 52 264 312 498 796 145 202 35 42 2,432
Western Iowa Tech 27 15 120 101 162 204 37 62 10 5 743
Iowa Western 26 25 47 72 85 128 20 26 5 5 439
Southwestern 33 18 34 27 20 38 1 7 0 2 180
Indian Hills 37 32 74 66 101 100 31 35 11 3 490
Southeastern 43 34 120 78 142 89 55 32 13 5 611
Total 619 445 1,240 1,301 1,764 2,524 483 658 108 102 9,244
Table 9-17. NRS Participant by College, Age and Gender, 201416-18 19-24 25-44 45-59 60+
16-18 19-24 25-44 45-59 60+
Tables, Section 9 | 13

Table 9-19. *Basic Literacy Skill Certificates
College 2010 2011 2012 2013 2014
% Average
5 year
Change
Northeast Iowa 103 69 42 68 64 -11%
North Iowa Area 59 28 21 30 111 17%
Iowa Lakes 56 4 35 40 36 -10%
Northwest 56 29 34 10 71 6%
Iowa Central 330 320 235 292 267 -5%
Iowa Valley 181 180 167 102 191 1%
Hawkeye 245 237 296 364 384 12%
Eastern Iowa 253 231 302 463 518 20%
Kirkwood 425 227 97 128 229 -14%
Des Moines Area 1,329 1,187 1,064 585 1,206 -2%
Western Iowa Tech 293 426 318 160 286 -1%
Iowa Western 154 130 116 148 205 7%
Southwestern 75 103 97 63 79 1%
Indian Hills 362 321 268 217 168 -17%
Southeastern 247 146 121 125 133 -14%
Total 4,168 3,638 3,213 2,795 3,948 -1%
Table 9-20. High School Equivalency Awards
College 2010 2011 2012 2013 2014
% Average
5 year
Change
Northeast Iowa 164 136 116 159 133 -5%
North Iowa Area 79 78 69 69 55 -9%
Iowa Lakes 79 40 41 63 37 -17%
Northwest 52 31 34 26 35 -9%
Iowa Central 316 286 281 270 284 -3%
Iowa Valley 154 113 113 139 98 -11%
Hawkeye 145 171 171 173 159 2%
Eastern Iowa 568 548 457 474 480 -4%
Kirkwood 460 430 443 450 365 -6%
Des Moines Area 966 869 787 571 827 -4%
Western Iowa Tech 245 196 218 197 180 -7%
Iowa Western 232 222 199 191 317 8%
Southwestern 45 41 50 45 56 6%
Indian Hills 153 140 148 119 105 -9%
Southeastern 209 260 277 231 231 3%
Total 3,867 3,561 3,404 3,177 3,362 -3%Source: NRSpro.
*Includes NRS Enrollees including corrections and online programs. Counts include at
least one level gain (multiple gains are only counted once).
Tables, Section 9 | 14

Table 9-21. Community College Adult High School Diplomas***
College 2009 2010 2011 2012 2013 2014
Northeast Iowa 0 0 0 0 0 0
North Iowa Area 0 0 0 0 0 0
Iowa Lakes 1 0 NR 0 67 41
Northwest 0 0 0 0 7 3
Iowa Central 2 0 0 0 0 0
Iowa Valley 2 2 NR 0 0 0
Hawkeye 3 1 1 1 0 0
Eastern Iowa 0 0 0 0 0 0
Kirkwood 82 53 72 51 72 75
Des Moines Area 66 117 129 93 63 126
Western Iowa Tech 0 0 NR 0 0 0
Iowa Western 0 0 13 0 0 0
Southwestern 0 0 0 0 0 0
Indian Hills 0 0 0 0 0 0
Southeastern 0 0 0 0 0 0
Total 156 156 173 215 209 245***Community college-based adult high school diploma programs.
Tables, Section 9 | 15

Table 9-22. Enrollment by College - Core Measures 2014
College
Secondary
Cohort
Number of
Participants
with
Unavailable
Data for
Matching
Secondary
Achieved
Post-
Secondary
Cohort
Number of
Participants
with
Unavailable
Data for
Matching
Post-
Secondary
Achieved
Entered
Employment
Cohort
Number of
Participants
with
Unavailable
Data for
Matching
Entered
Employment
Achieved
Retained
Employment
Cohort
Number of
Participants
with
Unavailable
Data for
Matching
Retained
Employment
Achieved
Northeast Iowa 56 2 54 67 6 42 94 6 48 82 9 50
North Iowa Area 52 3 49 73 2 21 33 2 9 70 2 25
Iowa Lakes 23 2 21 24 5 6 52 4 26 42 9 11
Northwest 19 5 14 19 12 8 24 18 6 62 22 9
Iowa Central 129 24 105 160 25 71 175 48 50 213 56 107
Iowa Valley 59 8 51 57 7 11 87 13 30 26 8 29
Hawkeye 131 9 122 147 1 58 105 0 47 85 0 87
Eastern Iowa 300 45 251 316 18 314 198 4 77 258 27 65
Kirkwood 107 18 89 198 35 63 154 31 51 234 46 96
Des Moines Area 344 197 146 332 216 99 500 160 132 550 259 219
Western Iowa Tech 128 20 107 139 38 49 159 34 39 257 64 57
Iowa Western 138 4 133 156 8 51 158 23 34 202 14 101
Southwestern 55 3 52 74 1 26 85 4 36 45 1 49
Indian Hills 79 24 55 86 42 27 234 71 68 156 35 116
Southeastern 139 5 134 175 4 20 123 2 59 100 9 50
Total 1,759 369 1,383 2,023 420 866 2,181 420 712 2,382 561 1,071
Tables, Section 9 | 16

Table 9-23. Enrollment by College - Core Measures 2013
College
Secondary
Cohort
Number of
Participants
with
Unavailable
Data for
Matching
Secondary
Achieved
PostSecond
ary Cohort
Number of
Participants
with
Unavailable
Data for
Matching
PostSecond
ary
Achieved
Entered
Employment
Cohort
Number of
Participants
with
Unavailable
Data for
Matching
Entered
Employment
Achieved
Retained
Employment
Cohort
Number of
Participants
with
Unavailable
Data for
Matching
Retained
Employment
Achieved
Northeast Iowa 74 1 40 152 4 123 58 3 33 111 0 79
North Iowa Area 10 0 9 9 0 4 24 0 14 47 0 38
Iowa Lakes 50 2 47 58 5 27 64 0 33 33 0 25
Northwest 5 2 3 9 6 0 13 7 4 73 0 26
Iowa Central 103 13 79 113 19 47 189 31 96 381 0 258
Iowa Valley 83 10 59 87 10 32 108 4 49 153 0 97
Hawkeye 81 0 80 165 0 55 195 4 108 328 0 254
Eastern Iowa 83 0 78 291 4 154 336 16 145 451 0 264
Kirkwood 143 7 132 184 14 56 124 34 59 215 0 171
Des Moines Area 177 44 97 249 74 55 626 24 296 936 0 640
Western Iowa Tech 85 5 77 142 42 47 432 100 175 617 0 349
Iowa Western 89 1 82 121 6 45 205 11 89 362 0 226
Southwestern 49 0 40 68 1 42 68 23 24 139 0 66
Indian Hills 106 31 65 154 40 39 330 31 155 536 0 361
Southeastern 132 1 127 136 2 21 104 13 39 134 0 90
Total 1,270 117 1,015 1,938 227 747 2,876 301 1,319 4,516 0 2,944
Tables, Section 9 | 17

Table 9-24.Enrollment by Program Type - Distance Education* 2014
Core Measures
Enrollment by Program TypeM F
Attendance
Hours
Basic
Literacy
Skills
Certificates
Secondary
Cohort
Secondary
Achieved
Post-
Secondary
Cohort
Post-
Secondary
Achieved
Entered
Employment
Cohort
Entered
Employment
Achieved
Retained
Employment
Cohort
Retained
Employment
Achieved
Adult Basic Skills 32 47 5,286 47 17 17 34 5 20 5 26 9
Adult Secondary Skills 22 17 2,145 26 21 19 23 15 12 5 18 10
English as a Second Language 2 0 230 1 0 0 1 0 0 0
Total 56 64 7,661 74 38 36 58 20 32 10 44 19
*Subset of NRS enrollment 51% or higher instruction received through distance education
**Weighted based on rate of return
Table 9-25.Enrollment by Program Type - Distance Education* 2013
Enrollment by Program TypeM F
Secondary
Cohort
Secondary
Achieved
Post-
Secondary
Cohort
Post-
Secondary
Achieved
Entered
Employment
Cohort
Entered
Employment
Achieved
Retained
Employment
Cohort
Retained
Employment
Achieved
Adult Basic Skills 24 48 3,233 23 10 8 15 8 13 8 18 9
Adult Secondary Skills 33 26 2,664 25 25 23 27 16 18 12 20 11
English as a Second Language 0 0 0 0 0 0 0 0 0 0 0 0
Total 57 74 5,897 48 35 31 42 24** 31 20** 38 20**
**Weighted based on rate of return
Table 9-26. Enrollment by Program Type - Correction* 2014
Enrollment by Program TypeM F
Secondary
Cohort
Secondary
Achieved
Adult Basic Skills 380 173 60,433 197 58 47
Adult Secondary Skills 82 17 8,966 42 39 33
English as a Second Language 0 1 68 0 0 0
Total 462 191 69,467 239 97 80
Students
Core Measures
*Subset of NRS enrollment
Students
Basic
Literacy
Skills
Certificates
Attendance
Hours
Students
Attendance
Hours
Basic
Literacy
Skills
Certificates
Core Measures
*Subset of NRS enrollment 51% or higher instruction received through distance education
Tables, Section 9 | 18

Table 9-27. Enrollment by Program Type - Correction* 2013
Enrollment by Program TypeM F
Secondary
Cohort
Secondary
Achieved
Adult Basic Skills 386 150 50,487 137 71 66
Adult Secondary Skills 78 119 20,265 52 41 27
English as a Second Language 1 80 0 0 0
Total 464 270 70,832 189 112 93
Students
Attendance
Hours
Basic
Literacy
Skills
Certificates
Core Measures
*Subset of NRS enrollment
Tables, Section 9 | 19

Table 9-28.Participant Status on Entry by Program* 2014
Enrollment by Program Type Unemployed
Not
Seeking
Not
Reported
Grades 0-
5
Grades
6-8
Grades 9-
12
Grade
12+
Not
Reported
Single
Parent
TANF, WIA, or
Other Public
Assistance
Dislocated
Worker
Adult Basic Skills 1,711 289 3 57 436 4,184 61 1 645 744 33
Adult Secondary Skills 2,765 324 11 3 68 1,157 44 0 120 137 17
English as a Second Language 639 98 0 832 872 1,747 525 4 53 67 8
Total 5,115 711 14 892 1,376 7,088 630 5 818 948 58
14% 71%
*Top three self reported includes multiple responses
Table 9-29.Participant Status on Entry by Program* 2013
Enrollment by Program Type Unemployed
Not
Seeking
Not
Reported
Grades 0-
5
Grades
6-8
Grades 9-
12
Grade
12+
Not
Reported
Single
Parent
TANF, WIA, or
Other Public
Assistance
Dislocated
Worker
Adult Basic Skills 2,602 337 17 74 416 3,561 69 8 473 588 51
Adult Secondary Skills 995 61 57 17 126 1,490 73 6 143 167 13
English as a Second Language 1,397 371 14 617 716 1,612 447 12 55 42 25
Total 4,994 769 88 708 1,258 6,663 589 26 671 797 89
*Top three self reported includes multiple responses
Highest Level of School Completed
Secondary Status Measures*
(optional)
Employed
1,141
Highest Level of School CompletedEmployment Status
Employed
Secondary Status Measures*
(optional)
Subset of NRS enrollment
1,977
1,639
535
4,151
602
1,650
3,393
Subset of NRS enrollment
Employment Status
Tables, Section 9 | 20

Skilled Worker and Job Creation Fund, Tables10
Table of Contents
10-1. FY2014 PACE Budget Summary..........................................................................................................2
10-2. FY2014 PACE Participant Summary....................................................................................................3
10-3. FY2014 Gap Budget Summary.............................................................................................................4
10-4. FY2014 Gap Participant Summary.......................................................................................................5
Tables, Section 10 | 1

Total ($)
FY 2014 Allocation 5,000,000
Expenses:
Financial & Education Support 649,815
Personal Support 126,746
Career Support 3,607
Salary & Personnel 1,553,259
Travel 53,971
Supplies & Equipment 57,295
Other 254,024
Total Expenses 2,700,181
FY 2015 Carryforward 2,299,819
Table 10-1: FY2014 PACE Budget Summary
Tables, Section 10 | 2

Total
Number of Completed Applications 3,355
Number of Approved Participants 2,311
Actively Participating in Program/Training
HSED and Basic Skills Training 540
Certificate Programs 737
Degree Programs 640
Diploma Programs 72
Total 1,989
Completed Program/Training
HSED and Basic Skills Training 129
Certificate Programs 569
Degree Programs 20
Diploma Programs 11
Total 729
Receiving Support Services*
Personal Support 460
Career Support 676
Receiving Both Supports 917
Not Receiving Supports 576
* Totals include active participants and program completers.
Table 10-2: FY 2014 PACE Participant Summary
Tables, Section 10 | 3

Total ($)
FY 2013 Carry Forward 1,021,256
FY 2014 Allocation 2,000,000
FY 2014 Total Funds 3,021,256
Expenses:
Tuition & Books 1,890,835
Equipment 35,075
Fees, Assessment, Testing 73,856
Staff Support & Services 160,065
Total Expenses 2,159,831
FY 2015 Carryforward 861,425
Table 10-3: FY2014 Gap Budget Summary
Tables, Section 10 | 4
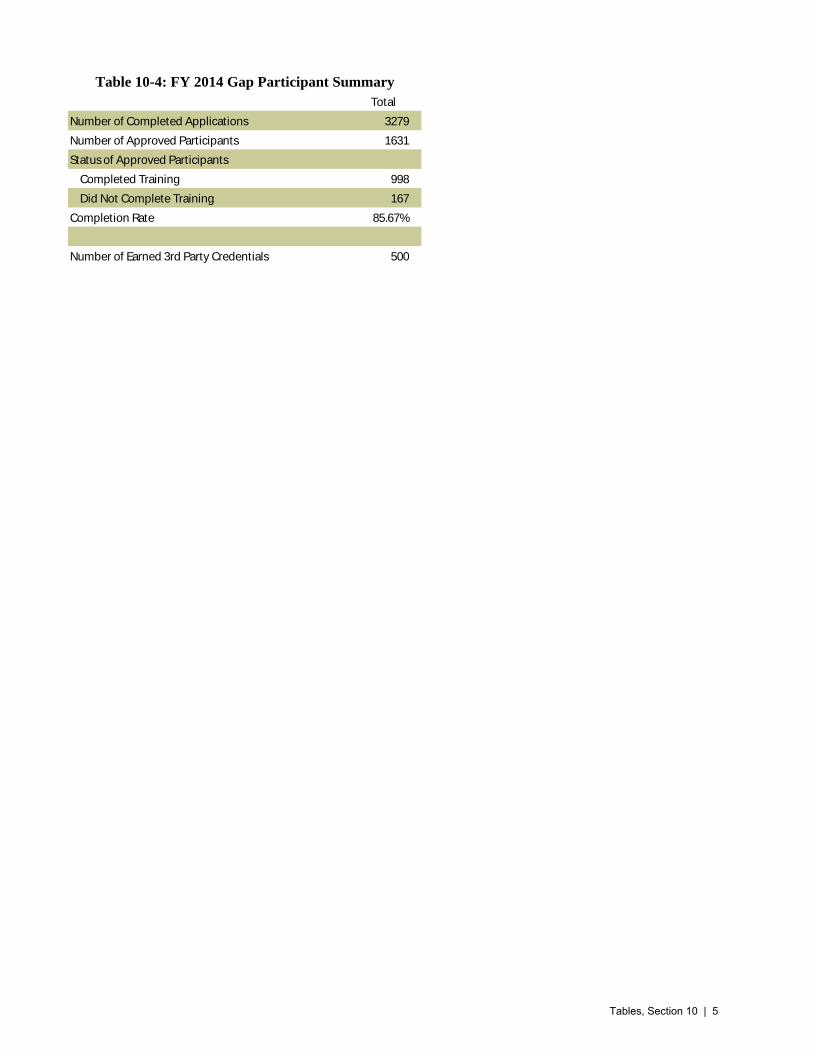
Total
Number of Completed Applications 3279
Number of Approved Participants 1631
Status of Approved Participants
Completed Training 998
Did Not Complete Training 167
Completion Rate 85.67%
Number of Earned 3rd Party Credentials 500
Table 10-4: FY 2014 Gap Participant Summary
Tables, Section 10 | 5
Tables, Apprenticeship 11
Table of Contents
11-1--11-2. Apprenticeship Enrollment, IEDA and Non-IEDA.....................................................................2
11-3. 260E and 260F Enrollment...................................................................................................................3
11-4--11-5. 260E and 260F Apprenticeship Enrollment by College, Latest 5 years.....................................4
Tables, Section 11 | 1
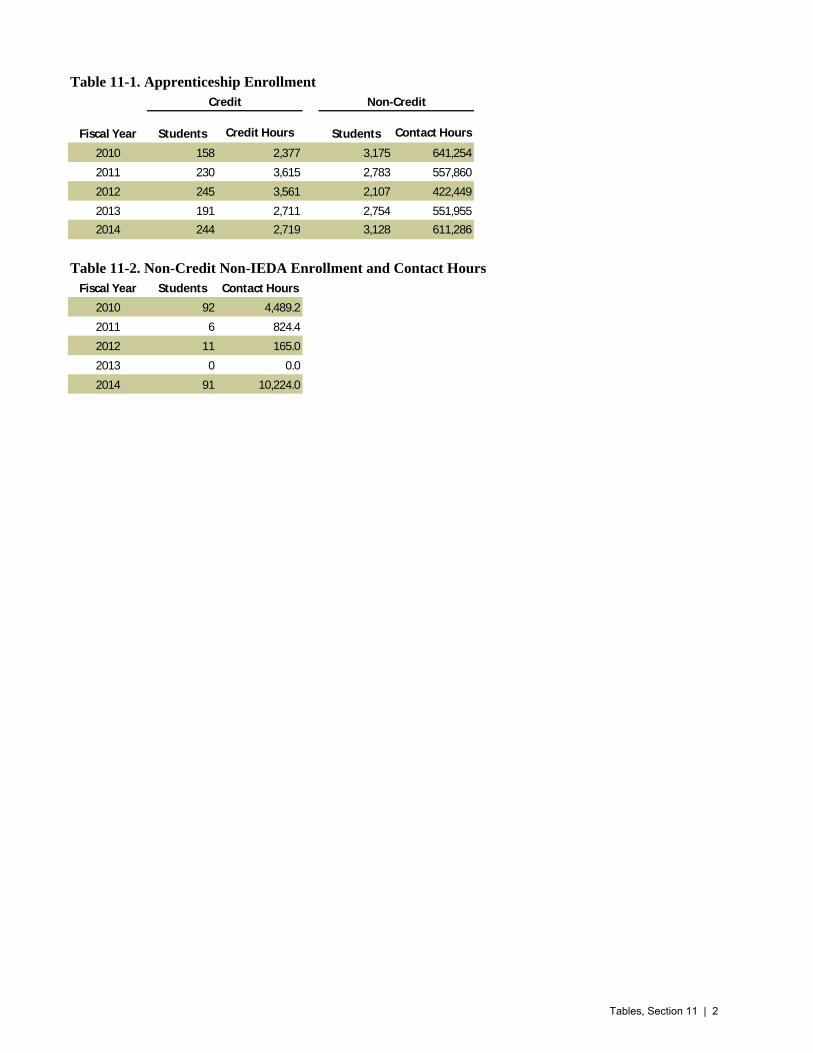
Table 11-1. Apprenticeship Enrollment
Students Credit Hours Students Contact Hours
2010 158 2,377 3,175 641,254
2011 230 3,615 2,783 557,860
2012 245 3,561 2,107 422,449
2013 191 2,711 2,754 551,955
2014 244 2,719 3,128 611,286
Table 11-2. Non-Credit Non-IEDA Enrollment and Contact Hours
Fiscal Year Students Contact Hours
2010 92 4,489.2
2011 6 824.4
2012 11 165.0
2013 0 0.0 Factor GeoMean
2014 91 10,224.0 Verify
1
1
1
1 1
1461.5
1
1
1
1 1
2874
1
1
1
1 1
580646.5
Fiscal Year
Credit Non-Credit
Tables, Section 11 | 2

Table 11-3. 260E and 260F Enrollment
Fiscal Year Students Contact Hours Students Contact Hours
2010 3 540 2,446 517,512
2011 0 0 2,178 442,220
2012 0 0 2,096 422,284
2013 0 0 2,147 420,915
2014 5 18 2,111 403,659
260E 260F
Tables, Section 11 | 3

Table 11-4. 260E Apprenticeship Enrollment by College, Latest 5 years*
Students
Contact
Hours Students
Contact
Hours Students
Contact
Hours Students
Contact
Hours Students
Contact
Hours
Northeast Iowa 0 0 0 0 0 0 0 0 0 0
North Iowa Area 0 0 0 0 0 0 0 0 0 0
Iowa Lakes 0 0 0 0 0 0 0 0 0 0
Northwest 0 0 0 0 0 0 0 0 0 0
Iowa Central 0 0 0 0 0 0 0 0 0 0
Iowa Valley 0 0 0 0 0 0 0 0 0 0
Hawkeye 3 540 0 0 0 0 0 0 0 0
Eastern Iowa 0 0 0 0 0 0 0 0 0 0
Kirkwood 0 0 0 0 0 0 0 0 0 0
Des Moines Area 0 0 0 0 0 0 0 0 0 0
Western Iowa Tech 0 0 0 0 0 0 0 0 0 0
Iowa Western 0 0 0 0 0 0 0 0 0 0
Southwestern 0 0 0 0 0 0 0 0 0 0
Indian Hills 0 0 0 0 0 0 0 0 0 0
Southeastern 0 0 0 0 0 0 0 0 0 0
Total 3 540.0 0 0.0 0 0.0 0 0.0 0 0.0
Table 11-5. 260F Apprenticeship Enrollment by College, Latest 5 years
Students
Contact
Hours Students
Contact
Hours Students
Contact
Hours Students
Contact
Hours Students
Contact
Hours
Northeast Iowa 0 0 0 0 0 0 0 0 0 0
North Iowa Area 0 0 0 0 0 0 0 0 0 0
Iowa Lakes 0 0 0 0 0 0 0 0 0 0
Northwest 0 0 0 0 0 0 0 0 0 0
Iowa Central 0 0 0 0 0 0 0 0 0 0
Iowa Valley 0 0 0 0 0 0 0 0 0 0
Hawkeye 0 0 49 5,688 31 4,678 2 324 0 0
Eastern Iowa 769 167,253 732 156,838 730 154,068 688 147,354 645 137,741
Kirkwood 731 153,582 647 126,469 630 120,072 662 127,984 755 137,224
Des Moines Area 882 186,710 650 142,920 622 133,505 735 135,370 640 115,476
Western Iowa Tech 12 2,064 38 2,093 41 2,774 19 1,766 28 4,704
Iowa Western 3 461 13 1,229 0 0 0 0 0 0
Southwestern 0 0 0 0 0 0 0 0 0 0
Indian Hills 0 0 0 0 0 0 0 0 0 0
Southeastern 49 7,442 49 6,983 42 7,187 41 8,118 43 8,514
Total 2,446 517,512 2,178 442,220 2,096 422,284 2,147 420,915 2,111 403,659
College
2013 2014
2014
College
2011 2012 20132010
2010 2011 2012
Tables, Section 11 | 4

Tables, Student Success12
Table of Contents
12-1. Annual Graduation Rates, Latest Five Cohorts....................................................................................2
12-2. Graduation Rates by College, Latest Five Years..................................................................................2
12-3. Transfer Rates by Year..........................................................................................................................3
12-4. Graduation Rates by Gender, Latest Five Years...................................................................................3
12-5--12-9. Graduation by Subpopulation, Latest Five Years....................................................................4-6
12-10--12-14. Graduation Rates by Sex, Latest Five Years........................................................................7-9
12-15. Success Rate 2012............................................................................................................................10
12-16. Success Rate 2011............................................................................................................................10
Tables, Section 12 | 1

Table 12-1: Annual Graduation Rates, Latest Five Cohorts
Cohort Students Awards %
2008 8,792 2,653 30.2
2009 8,974 2,617 29.2
2010 11,427 3,094 27.1
2011 11,167 3,055 27.4
2012 8,959 2,435 27.2
Table 12-2: Graduation Rates by College, Latest Five Years
2008 2009 2010 2011 2012
College N % N % N % N % N %
Northeast Iowa 387 29.5 442 28.5 589 26.3 942 26.3 386 27.2
North Iowa Area 214 30.4 452 35.8 454 35.0 732 30.8 392 29.8
Iowa Lakes 346 40.2 412 36.4 560 37.7 873 38.9 460 38.7
Northwest 84 39.3 135 39.3 235 37.9 651 43.1 195 33.3
Iowa Central 398 25.1 313 24.9 456 31.6 501 23.8 447 32.2
Iowa Valley 385 28.6 428 34.6 466 27.5 501 28.1 439 27.8
Hawkeye 873 39.4 779 36.7 922 31.9 477 34.1 739 31.5
Eastern Iowa 661 24.5 638 29.5 805 22.1 924 22.7 632 20.6
Kirkwood 2,380 28.6 2,272 25.6 2,728 23.9 2,430 25.3 2,187 25.4
Des Moines Area 863 20.6 853 20.2 1,142 19.3 412 15.0 920 15.4
Western Iowa Tech 192 14.6 160 24.4 217 23.0 471 16.4 234 28.2
Iowa Western 600 32.0 689 27.9 823 23.8 225 23.4 959 22.3
Southwestern 183 40.4 170 45.9 214 40.2 359 39.8 185 40.5
Indian Hills 885 36.5 857 27.8 1,161 31.4 241 37.6 527 40.6
Southeastern 341 32.3 374 33.7 395 32.7 511 31.2 257 29.2
TOTAL 8,792 30.2 8,974 29.2 11,167 27.4 10,250 27.0 8,959 27.2
Note: N represents the number of students within a cohort attending a specific community college. Each percentage represents the
percentage of students from the cohort who graduated within three years.
Tables, Section 12 | 2

Table 12-3: Transfer Rates by Year
2010 2011 2012
College N % N % N %
Northeast Iowa 589 18.3 942 27.3 386 19.4
North Iowa Area 454 26.4 732 19.8 392 28.1
Iowa Lakes 560 20.2 873 22.9 460 20.2
Northwest 235 6.8 651 22.4 195 10.3
Iowa Central 456 28.3 501 29.5 447 33.6
Iowa Valley 466 31.8 501 20.0 439 30.3
Hawkeye 922 25.1 477 36.7 739 26.8
Eastern Iowa 805 21.7 924 25.4 632 20.6
Kirkwood 2,728 25.1 2,430 26.7 2,187 25.5
Des Moines Area 1,142 21.6 412 28.9 920 26.3
Western Iowa Tech 217 18.9 471 15.9 234 16.7
Iowa Western 823 29.2 225 12.0 959 30.0
Southwestern 214 24.3 359 24.8 185 33.0
Indian Hills 1,161 20.8 241 27.8 527 21.4
Southeastern 395 18.5 511 10.8 257 22.6
TOTAL 11,167 23.5 10,250 24.3 8,959 25.3
Table 12-4: Graduation Rates by Gender, Latest Five Years
2008 2009 2010
College Male Female Male Female Male Female Male Female Male Female
Northeast Iowa 19.1 10.3 15.8 12.7 15.4 10.5 13.6 12.7 18.1 9.1
North Iowa Area 17.3 13.1 21.2 14.6 18.4 15.7 16.0 14.8 15.8 14.0
Iowa Lakes 23.7 16.5 22.8 13.6 23.1 13.1 24.8 14.2 24.3 14.3
North Central 29.8 9.5 28.1 11.1 25.6 11.8 30.2 12.9 22.6 10.8
Iowa Central 17.1 8.0 15.3 9.6 18.4 11.0 13.2 10.6 20.4 11.9
Iowa Valley 17.7 10.9 20.8 13.8 13.9 11.5 15.1 13.0 13.0 14.8
Hawkeye 21.8 17.6 20.2 16.6 15.6 15.7 18.0 16.2 14.7 16.8
Eastern Iowa 12.4 12.1 13.6 15.8 9.0 11.6 10.5 12.2 7.9 12.7
Kirkwood 14.9 13.7 13.7 11.9 11.7 11.3 12.7 12.6 13.1 12.3
Des Moines Area 11.7 8.9 11.1 9.0 9.3 8.5 8.8 6.2 7.9 7.5
Western Iowa Tech 5.7 8.9 11.3 13.1 11.6 9.1 7.6 8.8 14.5 13.7
Iowa Western 16.7 15.3 14.8 13.1 12.5 10.8 12.4 10.9 12.0 10.3
Southwestern 18.6 21.9 17.1 28.8 18.6 20.4 18.7 21.2 17.3 23.2
Indian Hills 20.7 15.5 14.8 13.0 15.3 15.2 19.4 18.3 19.4 21.3
Southeastern 14.1 18.2 17.4 16.3 16.1 15.4 17.3 13.9 10.5 18.7
TOTAL 16.6 13.6 15.9 13.3 14.4 12.6 14.4 12.6 14.1 13.1
Note: Each percentage represents the percentage of students from the cohort who graduated within three years.
2011 2012
Tables, Section 12 | 3

Table 12-5: Graduation by Subpopulation (%) FY 2012
College American Indian Asian Black Hispanic White Not Reported Overall
Northeast Iowa 0.0 0.3 0.3 0.0 24.1 2.6 27.2
North Iowa Area 0.3 0.5 2.0 1.3 25.5 0.0 29.8
Iowa Lakes 0.0 0.7 1.5 2.0 32.2 2.4 38.7
Northwest 0.0 0.0 0.5 1.0 28.7 2.6 33.3
Iowa Central 0.2 0.0 6.0 1.6 23.3 0.9 32.2
Iowa Valley 0.0 0.5 0.9 2.3 19.6 3.9 27.8
Hawkeye 0.0 0.5 0.4 0.5 29.6 0.0 31.5
Eastern Iowa 0.2 0.3 0.8 1.1 17.1 0.5 20.6
Kirkwood 0.0 0.3 0.2 0.3 5.2 19.3 25.4
Des Moines Area 0.0 0.4 1.2 0.5 10.4 2.1 15.4
Western Iowa Tech 1.7 0.4 0.4 2.1 20.9 1.7 28.2
Iowa Western 0.5 0.3 2.0 1.8 17.5 0.2 22.3
Southwestern 0.0 0.0 1.1 0.0 37.8 0.0 40.5
Indian Hills 0.4 0.6 1.3 0.9 30.2 7.0 40.6
Southeastern 0.4 1.2 1.2 0.4 29.2 0.4 58.4
TOTAL 0.2 0.4 1.2 0.9 18.4 6.0 28.0
Table 12-6: Graduation by Subpopulation (%) FY 2011
College American Indian Asian Black Hispanic White Not Reported Overall
Northeast Iowa 0.0 0.0 0.0 0.6 1.8 0.2 1.2
North Iowa Area 1.5 1.9 0.8 0.4 1.8 0.2 1.2
Iowa Lakes 2.9 1.9 1.5 1.2 2.5 0.6 1.9
Northwest 1.5 0.0 0.1 0.2 1.4 0.3 0.9
Iowa Central 1.5 1.9 2.0 0.6 1.5 0.2 1.2
Iowa Valley 0.0 0.6 1.7 1.6 1.4 1.0 1.3
Hawkeye 1.5 0.6 0.6 1.2 4.6 0.0 2.9
Eastern Iowa 1.5 0.0 0.4 4.3 2.2 0.2 1.6
Kirkwood 0.0 2.6 0.6 0.2 1.2 21.4 6.0
Des Moines Area 2.9 1.3 1.0 1.2 1.5 1.1 1.4
Western Iowa Tech 2.9 3.2 0.0 1.0 1.1 0.2 0.8
Iowa Western 2.9 3.8 1.3 2.2 3.0 0.1 2.1
Southwestern 1.5 0.0 0.3 0.6 1.3 0.1 0.9
Indian Hills 1.5 1.9 0.9 1.4 3.4 0.6 2.4
Southeastern 1.5 0.6 0.5 1.0 1.6 0.1 1.1
TOTAL 23.5 20.5 11.7 17.4 30.3 26.3 27.0
Tables, Section 12 | 4

Table 12-7: Graduation by Subpopulation (%) FY 2010
College American Indian Asian Black Hispanic White Not Reported Overall
Northeast Iowa 0.0 0.0 0.5 0.5 1.8 0.3 26.2
North Iowa Area 2.8 0.0 0.2 1.5 1.5 1.9 35.4
Iowa Lakes 0.0 0.6 1.0 1.8 2.3 0.5 37.3
Northwest 0.0 0.0 0.0 0.3 1.1 0.1 37.8
Iowa Central 1.4 1.2 2.0 1.3 1.5 0.0 30.4
Iowa Valley 0.0 0.6 1.0 2.0 1.2 0.9 27.0
Hawkeye 1.4 1.2 0.6 1.5 3.5 0.0 31.9
Eastern Iowa 5.6 3.7 1.0 2.3 1.7 1.0 21.6
Kirkwood 0.0 5.5 0.4 2.0 5.0 12.2 23.3
Des Moines Area 1.4 3.1 1.2 1.3 1.9 2.4 18.2
Western Iowa Tech 0.0 0.0 0.0 1.3 0.5 0.4 22.8
Iowa Western 1.4 1.2 2.4 2.6 2.2 0.2 24.4
Southwestern 0.0 0.0 0.5 0.8 1.0 0.1 40.3
Indian Hills 7.0 0.6 1.2 2.0 4.0 1.1 31.1
Southeastern 1.4 1.2 0.6 2.0 1.0 2.0 33.4
TOTAL 22.5 19.0 12.5 23.2 30.0 22.9 27.1
Table 12-8: Graduation by Subpopulation (%) FY 2009
College American Indian Asian Black Hispanic White Not Reported Overall
Northeast Iowa 0.0 0.0 0.7 0.3 1.6 1.2 28.5
North Iowa Area 1.7 1.2 1.0 1.9 1.9 1.2 35.8
Iowa Lakes 0.0 0.6 0.3 0.6 2.0 0.4 36.4
North Central 0.0 0.0 0.0 0.0 0.7 0.6 39.3
Iowa Central 0.0 1.8 1.3 0.3 0.9 0.0 24.9
Iowa Valley 1.7 0.6 3.3 2.6 1.5 2.2 34.6
Hawkeye 1.7 1.2 0.3 0.6 3.8 0.0 36.7
Eastern Iowa 0.0 2.4 0.5 8.0 1.8 4.2 29.5
Kirkwood 6.9 4.7 1.3 0.6 7.1 8.0 25.6
Des Moines Area 0.0 1.8 0.7 2.2 2.0 2.8 20.2
Western Iowa Tech 1.7 0.0 0.0 0.3 0.5 0.4 24.4
Iowa Western 0.0 0.6 2.0 2.9 2.2 1.2 27.9
Southwestern 1.7 0.6 1.2 0.0 0.9 0.0 45.9
Indian Hills 1.7 1.2 1.0 4.2 2.9 1.2 27.8
Southeastern 0.0 2.4 1.5 0.6 1.4 1.2 33.7
TOTAL 17.2 18.9 15.1 25.2 31.1 24.5 29.2
Tables, Section 12 | 5

Table 12-9: Graduation by Subpopulation (%) FY 2008
College American Indian Asian Black Hispanic White Not Reported Overall
Northeast Iowa 0.0 0.7 0.0 0.0 1.5 1.4 29.5
North Iowa Area 0.0 0.0 1.6 1.4 0.7 0.6 30.4
Iowa Lakes 0.0 0.0 0.4 0.3 1.8 1.2 40.2
North Central 0.0 0.0 0.0 0.0 0.4 0.2 39.3
Iowa Central 0.0 1.3 2.1 1.7 1.1 0.4 25.1
Iowa Valley 0.0 0.7 1.0 2.8 1.2 1.6 28.6
Hawkeye 3.7 2.7 0.8 1.0 4.5 0.2 39.4
Eastern Iowa 3.7 2.0 0.6 1.7 2.0 1.2 24.5
Kirkwood 5.6 8.0 2.5 4.9 8.0 11.6 28.6
Des Moines Area 0.0 3.3 1.9 1.7 1.9 3.5 20.6
Western Iowa Tech 1.9 0.0 0.0 0.3 0.3 0.4 14.6
Iowa Western 0.0 4.0 1.6 2.1 2.2 2.0 32.0
Southwestern 0.0 0.0 1.0 1.4 0.9 0.0 40.4
Indian Hills 0.0 2.7 1.2 3.1 4.1 1.0 36.5
Southeastern 0.0 0.7 0.8 1.0 1.2 2.8 32.3
TOTAL 14.8 26.0 15.3 23.6 31.8 27.9 30.2
Tables, Section 12 | 6

Table 12-10: Graduation Rates by Sex FY 2012
College N Male Female Not Reported Overall
Northeast Iowa 386 18.1 9.1 0.0 27.2
North Iowa Area 392 15.8 14.0 0.0 29.8
Iowa Lakes 460 24.3 14.3 0.0 38.7
Northwest 195 22.6 10.8 0.0 33.3
Iowa Central 447 20.4 11.9 0.0 32.2
Iowa Valley 439 13.0 14.8 0.0 27.8
Hawkeye 739 14.7 16.8 0.0 31.5
Eastern Iowa 632 7.9 12.7 0.0 20.6
Kirkwood 2,187 13.1 12.3 0.0 25.4
Des Moines Area 920 7.9 7.5 0.0 15.4
Western Iowa Tech 234 14.5 13.7 0.0 28.2
Iowa Western 959 12.0 10.3 0.0 22.3
Southwestern 185 17.3 23.2 0.0 40.5
Indian Hills 527 19.4 21.3 0.0 40.6
Southeastern 257 10.5 18.7 0.0 29.2
TOTAL 8,959 14.1 13.1 0.0 27.2
Table 12-11: Graduation Rates by Sex FY 2011
College N Male Female Not Reported Overall
Northeast Iowa 471 13.6 12.7 0.0 26.3
North Iowa Area 412 16.0 14.8 0.0 30.8
Iowa Lakes 501 24.8 14.2 0.0 38.9
Northwest 225 30.2 12.9 0.0 43.1
Iowa Central 501 13.2 10.6 0.0 23.8
Iowa Valley 477 15.1 13.0 0.0 28.1
Hawkeye 873 18.0 16.2 0.0 34.1
Eastern Iowa 732 10.5 12.2 0.0 22.7
Kirkwood 2,430 12.7 12.6 0.0 25.3
Des Moines Area 942 8.8 6.2 0.0 15.0
Western Iowa Tech 511 7.6 8.8 0.0 16.4
Iowa Western 924 12.4 10.9 0.0 23.4
Southwestern 241 18.7 21.2 0.0 39.8
Indian Hills 651 19.4 18.3 0.0 37.6
Southeastern 359 17.3 13.9 0.0 31.2
TOTAL 10,250 14.4 12.6 0.0 27.0
Tables, Section 12 | 7

Table 12-12: Graduation Rates by Sex FY 2010
College N Male Female Not Reported Overall
Northeast Iowa 602 15.4 10.5 0.0 25.9
North Iowa Area 478 18.4 15.7 0.0 34.1
Iowa Lakes 581 23.1 13.1 0.2 36.3
Northwest 238 25.6 11.8 0.0 37.4
Iowa Central 490 18.4 11.0 0.0 29.4
Iowa Valley 511 13.9 11.5 0.0 25.4
Hawkeye 943 15.6 15.7 0.0 31.3
Eastern Iowa 873 9.0 11.6 0.0 20.6
Kirkwood 2,836 11.7 11.3 0.1 23.1
Des Moines Area 1,242 9.3 8.5 0.0 17.8
Western Iowa Tech 241 11.6 9.1 0.0 20.7
Iowa Western 919 12.5 10.8 0.0 23.3
Southwestern 226 18.6 20.4 0.0 38.9
Indian Hills 1,205 15.3 15.2 0.0 30.5
Southeastern 416 16.1 15.4 0.0 31.5
TOTAL 11,427 14.4 12.6 0.0 27.1
Table 12-13: Graduation Rates by Sex FY 2009
College N Male Female Not Reported Overall
Northeast Iowa 442 15.8 12.7 0.0 28.5
North Iowa Area 452 21.2 14.6 0.0 35.8
Iowa Lakes 412 22.8 13.6 0.0 36.4
Northwest 135 28.1 11.1 0.0 39.3
Iowa Central 313 15.3 9.6 0.0 24.9
Iowa Valley 428 20.8 13.8 0.0 34.6
Hawkeye 779 20.2 16.6 0.0 36.7
Eastern Iowa 638 13.6 15.8 0.0 29.5
Kirkwood 2,272 13.7 11.9 0.0 25.6
Des Moines Area 853 11.1 9.0 0.0 20.2
Western Iowa Tech 160 11.3 13.1 0.0 24.4
Iowa Western 689 14.8 13.1 0.0 27.9
Southwestern 170 17.1 28.8 0.0 45.9
Indian Hills 857 14.8 13.0 0.0 27.8
Southeastern 374 17.4 16.3 0.0 33.7
TOTAL 8,974 15.9 13.3 0.0 29.2
Tables, Section 12 | 8

Table 12-14: Graduation Rates by Sex FY 2008
College N Male Female Not Reported Overall
Northeast Iowa 387 19.1% 10.3% 0.0% 29.5%
North Iowa Area 214 17.3% 13.1% 0.0% 30.4%
Iowa Lakes 346 23.7% 16.5% 0.0% 40.2%
Northwest 84 29.8% 9.5% 0.0% 39.3%
Iowa Central 398 17.1% 8.0% 0.0% 25.1%
Iowa Valley 385 17.7% 10.9% 0.0% 28.6%
Hawkeye 873 21.8% 17.6% 0.0% 39.4%
Eastern Iowa 661 12.4% 12.1% 0.0% 24.5%
Kirkwood 2,380 14.9% 13.7% 0.0% 28.6%
Des Moines Area 863 11.7% 8.9% 0.0% 20.6%
Western Iowa Tech 192 5.7% 8.9% 0.0% 14.6%
Iowa Western 600 16.7% 15.3% 0.0% 32.0%
Southwestern 183 18.6% 21.9% 0.0% 40.4%
Indian Hills 885 20.7% 15.5% 0.3% 36.5%
Southeastern 341 14.1% 18.2% 0.0% 32.3%
TOTAL 8,792 16.6% 13.6% 0.0% 30.2%
Tables, Section 12 | 9

Table 12-15: Success Rates FY 2012
College N Graduated Transferred Both Neither Success rate (%)
Northeast Iowa 386 79 49 26 232 39.9
North Iowa Area 392 60 53 57 222 43.4
Iowa Lakes 460 127 42 51 240 47.8
Northwest 195 53 8 12 122 37.4
Iowa Central 447 67 73 77 230 48.5
Iowa Valley 439 55 66 67 251 42.8
Hawkeye 739 145 110 88 396 46.4
Eastern Iowa 632 75 75 55 427 32.4
Kirkwood 2,187 312 315 243 1317 39.8
Des Moines Area 920 80 180 62 598 35
Western Iowa Tech 234 55 28 11 140 40.2
Iowa Western 959 106 180 108 565 41.1
Southwestern 185 37 23 38 87 53
Indian Hills 527 142 41 72 272 48.4
Southeastern 257 45 28 30 154 40.1
Total 8,959 1,438 1,271 997 5,253 41.4
Table 12-16: Success Rates FY 2011
College N Graduated Transferred Both Neither Success rate (%)
Northeast Iowa 471 105 56 19 291 38.2
North Iowa Area 412 60 52 67 233 43.4
Iowa Lakes 501 142 47 53 259 48.3
Northwest 225 79 9 18 119 47.1
Iowa Central 501 59 88 60 294 41.3
Iowa Valley 477 46 87 88 256 46.3
Hawkeye 873 184 86 114 489 44.0
Eastern Iowa 732 89 68 77 498 32.0
Kirkwood 2,430 314 349 301 1,466 39.7
Des Moines Area 942 84 200 57 601 36.2
Western Iowa Tech 511 65 36 19 391 23.5
Iowa Western 924 107 126 109 582 37.0
Southwestern 241 57 28 39 117 51.5
Indian Hills 651 162 63 83 343 47.3
Southeastern 359 61 38 51 209 41.8
Total 10,250 1,614 1,333 1,155 6,148 40.0
Tables, Section 12 | 10

Tables, Tuition and Fees 13
Table of Contents
13-1. Resident Tuition and Fees Based on 12 Credit Hours per Term: 2013-2015.......................................2
13-2. Resident Tuition and Fees Based on 15 Credit Hours Per Term: 2013-2015.......................................3
13-3--13-4. Resident and Non-Resident Tuition and Fees Per Credit Hour: 2013-2015 FYs.......................4
13-5. Recurring Fees for Full-Time Students: 2014-2015 Academic Year....................................................5
Tables, Section 13 | 1

Table 13-1. Resident Tuition and Fees Based on 12 Credit Hours per Term: 2013-2015
Tuition, $ Fees, $ Total, $ Tuition, $ Fees, $ Total, $ Tuition, $ Fees, $ Total, $
Northeast Iowa 3,600.00 312.00 3,912.00 3,600.00 312.00 3,912.00 0.00 0.00 0.00 0.00
North Iowa Area 3,066.00 624.00 3,690.00 3,138.00 624.00 3,762.00 72.00 0.00 72.00 1.95
Iowa Lakes 3,576.00 422.00 3,998.00 3,720.00 402.00 4,122.00 144.00 -20.00 124.00 3.10
Northwest Iowa 3,456.00 672.00 4,128.00 3,528.00 672.00 4,200.00 72.00 0.00 72.00 1.74
Iowa Central 3,288.00 336.00 3,624.00 3,432.00 336.00 3,768.00 144.00 0.00 144.00 3.97
Iowa Valley 3,552.00 624.00 4,176.00 3,672.00 624.00 4,296.00 120.00 0.00 120.00 2.87
Hawkeye 3,384.00 144.00 3,528.00 3,480.00 144.00 3,624.00 96.00 0.00 96.00 2.72
Eastern Iowa 3,216.00 0.00 3,216.00 3,288.00 0.00 3,288.00 72.00 0.00 72.00 2.24
Kirkwood 3,360.00 0.00 3,360.00 3,480.00 0.00 3,480.00 120.00 0.00 120.00 3.57
Des Moines Area 3,264.00 0.00 3,264.00 3,336.00 0.00 3,336.00 72.00 0.00 72.00 2.21
Western Iowa Tech 3,120.00 408.00 3,528.00 3,216.00 408.00 3,624.00 96.00 0.00 96.00 2.72
Iowa Western 3,168.00 336.00 3,504.00 3,312.00 336.00 3,648.00 144.00 0.00 144.00 4.11
Southwestern 3,408.00 288.00 3,696.00 3,552.00 288.00 3,840.00 144.00 0.00 144.00 3.90
Indian Hills 3,576.00 0.00 3,576.00 3,720.00 0.00 3,720.00 144.00 0.00 144.00 4.03
Southeastern 3,480.00 0.00 3,480.00 3,672.00 0.00 3,672.00 192.00 0.00 192.00 5.52
State Average 3,367.60 277.73 3,645.33 3,476.40 276.40 3,752.80 108.80 -1.33 107.47 2.98
Std. Dev. (C.C.) 169.20 237.30 283.54 179.89 236.54 280.54 45.42 4.99 44.66 1.26Iowa Public
Universities 6,658.00 1,166.00 7,824.00 6,658.00 1,378.47 8,036.47 0.00 18.13 18.13 3.13Source: 2013-2014 Academic Year, Iowa Community Colleges, Tuition and Fees Report, Issued September 2013; Electronic 2014-2015 tuition survey data submitted by Iowa Community
Colleges and compiled by the Iowa Department of Education. Iowa Board of Regents, Tuition Rates. Note: Indians Hills shown for three 12 week terms. Eight credits per term equals 12 per
semester. Only fees charged for all students are included. Other fees for lab or specific programs are not included.
Community College
2013-2014 2014-2015 Increases Percent
Increase
Tables, Section 13 | 2
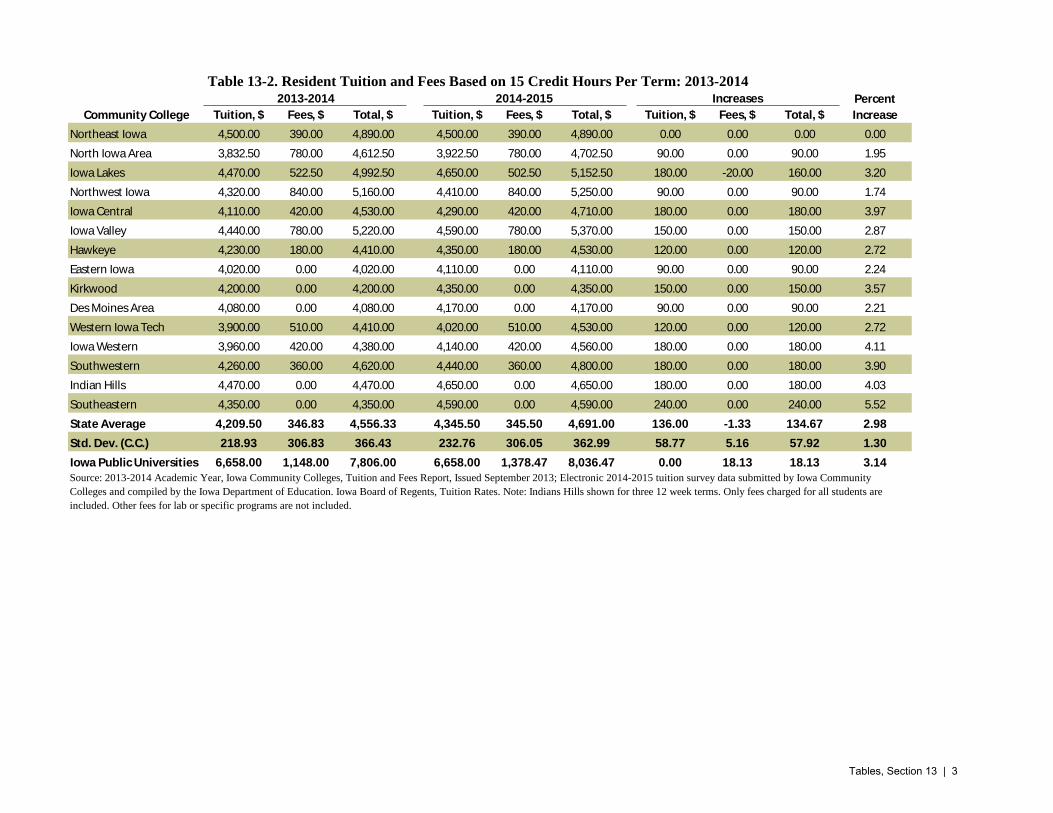
Table 13-2. Resident Tuition and Fees Based on 15 Credit Hours Per Term: 2013-2014
Tuition, $ Fees, $ Total, $ Tuition, $ Fees, $ Total, $ Tuition, $ Fees, $ Total, $
Northeast Iowa 4,500.00 390.00 4,890.00 4,500.00 390.00 4,890.00 0.00 0.00 0.00 0.00
North Iowa Area 3,832.50 780.00 4,612.50 3,922.50 780.00 4,702.50 90.00 0.00 90.00 1.95
Iowa Lakes 4,470.00 522.50 4,992.50 4,650.00 502.50 5,152.50 180.00 -20.00 160.00 3.20
Northwest Iowa 4,320.00 840.00 5,160.00 4,410.00 840.00 5,250.00 90.00 0.00 90.00 1.74
Iowa Central 4,110.00 420.00 4,530.00 4,290.00 420.00 4,710.00 180.00 0.00 180.00 3.97
Iowa Valley 4,440.00 780.00 5,220.00 4,590.00 780.00 5,370.00 150.00 0.00 150.00 2.87
Hawkeye 4,230.00 180.00 4,410.00 4,350.00 180.00 4,530.00 120.00 0.00 120.00 2.72
Eastern Iowa 4,020.00 0.00 4,020.00 4,110.00 0.00 4,110.00 90.00 0.00 90.00 2.24
Kirkwood 4,200.00 0.00 4,200.00 4,350.00 0.00 4,350.00 150.00 0.00 150.00 3.57
Des Moines Area 4,080.00 0.00 4,080.00 4,170.00 0.00 4,170.00 90.00 0.00 90.00 2.21
Western Iowa Tech 3,900.00 510.00 4,410.00 4,020.00 510.00 4,530.00 120.00 0.00 120.00 2.72
Iowa Western 3,960.00 420.00 4,380.00 4,140.00 420.00 4,560.00 180.00 0.00 180.00 4.11
Southwestern 4,260.00 360.00 4,620.00 4,440.00 360.00 4,800.00 180.00 0.00 180.00 3.90
Indian Hills 4,470.00 0.00 4,470.00 4,650.00 0.00 4,650.00 180.00 0.00 180.00 4.03
Southeastern 4,350.00 0.00 4,350.00 4,590.00 0.00 4,590.00 240.00 0.00 240.00 5.52
State Average 4,209.50 346.83 4,556.33 4,345.50 345.50 4,691.00 136.00 -1.33 134.67 2.98
Std. Dev. (C.C.) 218.93 306.83 366.43 232.76 306.05 362.99 58.77 5.16 57.92 1.30
Iowa Public Universities 6,658.00 1,148.00 7,806.00 6,658.00 1,378.47 8,036.47 0.00 18.13 18.13 3.14Source: 2013-2014 Academic Year, Iowa Community Colleges, Tuition and Fees Report, Issued September 2013; Electronic 2014-2015 tuition survey data submitted by Iowa Community
Colleges and compiled by the Iowa Department of Education. Iowa Board of Regents, Tuition Rates. Note: Indians Hills shown for three 12 week terms. Only fees charged for all students are
included. Other fees for lab or specific programs are not included.
Community College
2013-2014 2014-2015 Increases Percent
Increase
Tables, Section 13 | 3

Table 13-3. Resident Tuition and Fees Per Credit Hour: 2013-2015 Academic Years
2013-2014 2014-2015 Increase 2013-2014 2014-2015 Increase
Northeast Iowa 150.00 150.00 0.00 163.00 163.00 0.00
North Iowa Area 127.75 130.75 2.50 153.75 156.75 1.95
Iowa Lakes 149.00 155.00 3.00 166.58 171.75 3.10
Northwest Iowa 144.00 147.00 6.00 172.00 175.00 1.74
Iowa Central 137.00 143.00 5.00 151.00 157.00 3.97
Iowa Valley 148.00 153.00 4.00 174.00 179.00 2.87
Hawkeye 141.00 145.00 4.00 147.00 151.00 2.72
Eastern Iowa 134.00 137.00 2.80 134.00 137.00 2.24
Kirkwood 140.00 145.00 7.00 140.00 145.00 3.57
Des Moines Area 136.00 139.00 3.00 136.00 139.00 2.21
Western Iowa Tech 130.00 134.00 2.00 147.00 151.00 2.72
Iowa Western 132.00 138.00 3.00 146.00 152.00 4.11
Southwestern 142.00 148.00 6.00 154.00 160.00 3.90
Indian Hills 149.00 155.00 5.00 149.00 155.00 4.03
Southeastern 145.00 153.00 3.00 145.00 153.00 5.52
State Average 140.32 144.85 3.75 151.89 156.37 2.98
Standard Deviation 7.30 7.76 1.81 12.23 12.10 1.30
Table 13-4. Non-Resident Tuition Per Credit Hour: 2013-2015 Academic Years
2013-2014 2014-2015 Increase
Northeast Iowa 150.00 150.00 0.00 3,600.00 4,500.00 0.00
North Iowa Area 191.63 196.13 4.50 4,707.12 5,883.90 2.35
Iowa Lakes 160.00 166.00 6.00 3,984.00 4,980.00 3.75
Northwest Iowa 160.00 160.00 0.00 3,840.00 4,800.00 0.00
Iowa Central 205.50 214.50 9.00 5,148.00 6,435.00 4.38
Iowa Valley * 169.00 174.00 5.00 4,176.00 5,220.00 2.96
Hawkeye 166.00 170.00 4.00 4,080.00 5,100.00 2.41
Eastern Iowa 201.00 204.00 3.00 4,896.00 6,120.00 1.49
Kirkwood 170.00 175.00 5.00 4,200.00 5,250.00 2.94
Des Moines Area 272.00 278.00 6.00 6,672.00 8,340.00 2.21
Western Iowa Tech 133.00 135.00 2.00 3,240.00 4,050.00 1.50
Iowa Western 137.00 143.00 6.00 3,432.00 4,290.00 4.38
Southwestern 149.00 155.00 6.00 3,720.00 4,650.00 4.03
Indian Hills 224.00 232.50 8.50 5,580.00 6,975.00 3.79
Southeastern 150.00 158.00 8.00 3,792.00 4,740.00 5.33
State Average 175.88 180.74 4.87 4,337.81 5,422.26 2.77
Standard Deviation 37.23 38.30 2.74 919.24 1,149.05 1.57Source: 2013-2014 Academic Year, Iowa Community Colleges, Tuition and Fees Report, Issued September 2013; Electronic 201-2015
tuition survey data submitted by Iowa Community Colleges and compiled by the Iowa Department of Education. Note: Indian Hills shown
for three 12 week terms. * Iowa Valley number represents the average of the Ellsworth CC and the Marshalltown CC rates.
Community College
Tuition per Semester Hour, $ Tuition and Fees per Hour, $
Source: 2013-2014 Academic Year, Iowa Community Colleges, Tuition and Fees Report, Issued September 2013; Electronic 2014-2015
tuition survey data submitted by Iowa Community Colleges and compiled by the Iowa Department of Education. Note: Indian Hills shown
for three 12 week terms. Fee per credit hour calculated on two 12 credit terms.
Community College
Tuition per Semester Hour, $ Annual with
24 Hours, $
Annual with
30 Hours, $
Percent
Increase
Tables, Section 13 | 4

Table 13-5. Recurring Fees for Full-Time Students: 2014-2015 Academic Year
Community
College Amount, $ Term Purpose
Annual - 12
credits per Term,
$
Annual - 15
credits per Term,
$
Northeast Iowa 13.00 Sem Hr. General 312.00 390.00
North Iowa Area 4.00 Sem Hr. Student Activity 48.00 120.00
12.00 Sem Hr. Materials/Lab/Supply 144.00 360.00
10.00 Sem Hr. Technology 120.00 300.00
Total 312.00 780.00
Iowa Lakes 0.75 Sem Hr. Processing 18.00 22.50
0.25 Sem Hr. Noel Levitz LSA Fee 6.00 7.50
2.25 Sem Hr. Activity 54.00 67.50
5.50 Sem Hr. General 132.00 165.00
8.00 Sem Hr. Technology 192.00 240.00
10.00 Semester
Activity (students
registered for 12 or
more hours) 20.00 20.00
422.00 522.50
Northwest Iowa 10.00 Sem Hr. Student Fee 240.00 300.00
10.00 Sem Hr. Course Fee 240.00 300.00
8.00 Sem Hr. Technology Fee 192.00 240.00
Total 672.00 840.00
Iowa Central 14.00 Sem Hr. Student Fee 336.00 420.00
Iowa Valley 17.00 Sem Hr.
Materials &
Technology Fee 408.00 510.00
2.00 Sem Hr. Facility Fee 48.00 60.00
7.00 Sem Hr.
Student/Distance
Learning/Facility Fee 168.00 210.00
Total 624.00 780.00
Hawkeye 4.00 Sem Hr. Computer user 96.00 120.00
2.00 Sem Hr. Activity 48.00 60.00
Total 144.00 180.00
Eastern Iowa None
Kirkwood None
Des Moines Area None
Western Iowa Tech 9.00 Credit Hr. Technology 216.00 270.00
8.00 Credit Hr. Matriculation 192.00 240.00
Total 408.00 510.00
Iowa Western 14.00 Sem Hr. Student Activity Fee 336.00 420.00
Southwestern 12.00 Sem Hr. Service/Technology 288.00 360.00
Indian Hills None
Southeastern NoneSource: 2014-2015 Academic Year, Iowa Community Colleges, Tuition and Fees Report, Issued September 2014; Electronic 2014-
2015 tuition survey data submitted by Iowa Community Colleges and compiled by the Iowa Department of Education. Note: This is
not an all inclusive listing of fees charged by the individual community colleges. The fees listed above include all fees charged to
each student. Other fees such as lab fees or special class fees may be charged by the individual community college.
Tables, Section 13 | 5

Tables, Financial Aid14
Table of Contents
14-1. 2011-2013 Distribution of Community College Student Aid...............................................2
14-2. Iowa Grants by College FY2014.......................................................................................3-4
14-3. 2013-2014 Award Year Grant Volume by School.................................................................5
14-4. Federal Direct Loan Volume by College FY2014. ..............................................................6
14-5. Default Rate by College: FY2011 Cohort............................................................................7
Tables, Section 14 | 1

Source Amount ($) % Amount ($) % Amount ($) %
Federal 489,012,519 94% 458,778,089 92% 431,346,206 92%
Institutional 14,472,564 3% 21,577,612 4% 18,287,695 4%
Other 9,842,949 2% 9,593,702 2% 10,084,527 2%
State 6,272,339 1% 6,878,524 1% 10,015,102 2%
Total 519,600,371 496,827,927 469,733,530
Source: Iowa College Student Aid Commission
Table 14-1: 2011-2013 Distribution of Community College Student Aid
2011 2012 2013
Tables, Section 14 | 2

District School # Recipients$ Award
Amount# Recipients
$ Award
Amount# Recipients
$ Award
Amount# Recipients
$ Award
Amount
1 Northeast Iowa Community College 156 137,894 256 253,605 21 8,884 3 10,665
2 North Iowa Area Community College 97 88,438 163 174,166 14 5,723 6 25,255
3 Iowa Lakes Community College 85 78,412 120 136,812 12 5,633 8 34,128
4 Northwest Iowa Community College 78 73,764 133 178,971 3 1,982 0 0
5 Iowa Central Community College 137 128,510 260 294,516 15 12,613 16 50,895
6 Iowa Valley Community College District 57 44,075 129 113,143 21 7,817 5 21,330
7 Hawkeye Community College 247 212,289 414 441,131 24 10,140 16 54,898
9 Eastern Iowa Community Colleges 181 143,477 384 345,955 43 17,512 1 4,266
10 Kirkwood Community College 435 369,510 687 687,981 81 31,724 15 61,857
11 Des Moines Area Community College 523 412,397 841 836,876 101 44,441 34 128,512
12 Western Iowa Tech Community College 182 156,130 284 255,486 15 12,391 30 112,162
13 Iowa Western Community College 133 115,386 341 348,023 17 11,714 18 70,923
14 Southwestern Iowa Community College 51 38,731 74 86,355 10 3,262 11 44,793
15 Indian Hills Community College 189 167,908 443 479,910 16 15,634 12 39,278
16 Southeasterm Iowa Community College 105 89,797 217 192,800 19 6,823 0 0
Total 2,656 2,256,718 4,746 4,825,730 412 196,293 175 658,962
Kibbie Grant
Table 14-2: Iowa Grants by College FY2014
Iowa Voc-Tech Tuition
GrantIowa Grant
All Iowa Opportunity
Scholarship
Tables, Section 14 | 3

District School # Recipients$ Award
Amount# Recipients
$ Award
Amount# Recipients
$ Award
Amount# Recipients
$ Award
Amount
1 Northeast Iowa Community College 9 20,400 10 23,750 11 11,823 0 0
2 North Iowa Area Community College 9 27,212 5 13,750 5 6,502 0 0
3 Iowa Lakes Community College 10 33,998 4 13,750 5 8,866 0 0
4 Northwest Iowa Community College 11 48,008 3 11,203 3 4,728 0 0
5 Iowa Central Community College 24 60,552 19 61,859 16 25,513 1 975
6 Iowa Valley Community College District 8 22,142 4 13,750 4 6,501 9 8,884
7 Hawkeye Community College 35 98,418 9 31,018 10 18,894 1 758
9 Eastern Iowa Community Colleges 17 44,924 2 3,750 1 1,182 8 9,965
10 Kirkwood Community College 96 256,641 18 54,167 20 28,961 4 5,525
11 Des Moines Area Community College 143 324,632 44 144,567 36 53,786 14 25,458
12 Western Iowa Tech Community College 49 124,410 11 30,705 6 7,329 4 4,550
13 Iowa Western Community College 19 67,257 13 53,750 14 26,004 5 8,450
14 Southwestern Iowa Community College 3 9,656 4 15,000 4 5,910 0 0
15 Indian Hills Community College 28 76,960 15 46,109 14 21,079 3 1,950
16 Southeasterm Iowa Community College 16 43,129 1 5,000 1 2,364 1 975
Total 477 1,258,339 162 522,128 150 229,442 50 67,490
Source: Iowa College Student Aid Commission
Gear Up Iowa Scholarship
Table 14-2 (continued): Iowa Grants by College FY2014
Iowa National Guard
Education AssistanceEducation Training Voucher
All Iowa Opportunity
Foster Grant
Tables, Section 14 | 4

District Community College Award Year RecipientsAward Year
Disbursements ($)
1 Northeast Iowa Community College 3,281 6,256,188
2 North Iowa Area Community College 1,911 3,746,954
3 Iowa Lakes Community College 1,633 3,502,881
4 Northwest Iowa Community College 734 1,374,274
5 Iowa Central Community College 5,247 11,184,393
6 Ellsworth Community College (Iowa Valley Community College District) 852 1,995,604
6 Marshalltown Community College (Iowa Valley Community College District) 1,314 2,710,491
7 Hawkeye Community College 3,998 7,979,340
9 Eastern Iowa Community Colleges 6,085 11,126,472
10 Kirkwood Community College 10,071 19,918,222
11 Des Moines Area Community College 14,166 26,076,626
12 Western Iowa Tech Community College 4,512 9,341,380
13 Iowa Western Community College 5,680 11,689,598
14 Southwestern Community College 1,056 2,291,781
15 Indian Hills Community College 4,928 7,712,964
16 Southeastern Community College 2,626 5,304,759
Total 68,094 132,211,927
Table 14-3: 2013-2014 Award Year Grant Volume by School*
Federal Pell Grant
Source: Federal Student Aid
*Data is sum of quarterly statistics reported to the U.S. Department of Education between July 1, 2013 and June 30, 2014.
Tables, Section 14 | 5

District School # RecipientsDisbursements
($)# Recipients
Disbursements
($)# Recipients
Disbursements
($)
1 Northeast Iowa Community College 2,023 5,578,283 1,709 5,782,648 10 60,874
2 North Iowa Area Community College 1,101 3,351,666 719 2,516,412 29 124,626
3 Iowa Lakes Community College 1,015 2,990,720 991 3,467,164 36 224,109
4 Northwest Iowa Community College 437 1,280,981 394 1,268,524 4 24,477
5 Iowa Central Community College 3,172 8,258,545 3,168 10,191,075 135 583,938
6 Ellsworth Community College 572 1,580,186 566 1,495,756 72 314,680
6 Marshalltown Community College 777 1,941,320 569 1,680,192 30 132,528
7 Hawkeye Community College 2,973 8,570,616 2,784 9,511,015 69 335,633
9 Eastern Iowa Community Colleges 2,879 7,653,927 2,470 7,747,419 15 71,511
10 Kirkwood Community College 6,462 19,141,844 5,503 20,456,061 139 878,627
11 Des Moines Area Community College 8,345 23,521,033 7,716 21,637,589 102 513,686
12 Western Iowa Tech Community College 2,123 5,279,447 1,908 5,010,606 34 151,440
13 Iowa Western Community College 3,474 8,738,647 3,201 10,270,866 190 955,787
14 Southwestern Iowa Community College 615 1,805,600 575 1,890,826 32 144,260
15 Indian Hills Community College 2,325 6,520,387 2,162 6,995,396 76 433,786
16 Southeasterm Iowa Community College 1,188 3,088,524 875 2,570,109 6 23,779
Total 39,481 109,301,726 35,310 112,491,658 979 4,973,741
*Data is sum of quarterly statistics reported to the U.S. Department of Education between July 1, 2013 and June 30, 2014.
Table 14-4: Federal Direct Loan Volume by College FY2014*
Direct Loan, Subsidized Direct Loan - Unsubsidized Direct Loan - Parent Plus
Source: Federal Student Aid
Tables, Section 14 | 6

Region Community College # in Repayment # in Default Default Rate
1 Northeast Iowa Community College 1,401 322 22.9
2 North Iowa Area Community College 965 195 20.2
3 Iowa Lakes Community College 969 209 21.5
4 Northwest Iowa Community College 365 43 11.7
5 Iowa Central Community College 1,876 421 22.4
6 Ellsworth Community College (Iowa Valley Community College District) 387 90 23.2
6 Marshalltown Community College (Iowa Valley Community College District) 540 155 28.7
7 Hawkeye Community College 2,396 487 20.3
9 Eastern Iowa Community Colleges 1,975 415 21.0
10 Kirkwood Community College 5,877 1,448 24.6
11 Des Moines Area Community College 5,557 1,598 28.7
12 Western Iowa Tech Community College 1,402 342 24.3
13 Iowa Western Community College 1,699 342 20.1
14 Southwestern Iowa Community College 476 102 21.4
15 Indian Hills Community College 1,833 545 29.7
16 Southeastern Iowa Community College 912 215 23.5
Total 28,630 6,929 22.8
Table 14-5: Default Rate by College: FY2011 Cohort
Source: Federal Student Aid
Tables, Section 14 | 7

Tables, Financial15
Table of Contents
15-1. Nominal Revenue by Source and College............................................................................................2
15-2. Adjusted Totals by Source in 2014 dollars...........................................................................................2.15-3. 2014 Nominal Expense by Category....................................................................................................3
15-4. Adjusted Totals by Source in 2014 Dollars..........................................................................................3
15-5. Nominal Expense by Function.............................................................................................................4
15-6. Adjusted Totals by Source in 2014 Dollars..........................................................................................4
15-7. Unrestricted General Fund Revenues & Expenditures in 2014 Dollars...............................................5
15-8. FTEE Totals..........................................................................................................................................6
15-9. SGA Totals............................................................................................................................................7
15-10. Adjusted Revenue and Expenditures / FTEE (2014 Dollars).............................................................7
15-11. State General Aid................................................................................................................................7
Tables, Section 15 | 1

Table 15-1. 2014 Nominal Revenue by Source and College
College Tuition & Fees, $ Local, $ State General Aid, $ Federal, $ Other Income, $ Total Revenue, $
Northeast 15,877,034 1,936,785 9,572,491 488,073 2,795,869 30,670,252
North Iowa 11,255,459 1,295,010 9,772,970 182,408 1,397,035 23,902,882
Iowa Lakes 8,678,987 1,104,760 9,035,001 4,970 1,854,985 20,678,703
Northwest 5,708,745 699,513 4,443,196 94,570 740,715 11,686,739
Iowa Central 22,561,542 1,448,933 10,865,853 689,677 782,241 36,348,246
Iowa Valley 12,068,460 865,136 8,657,389 217,494 1,321,237 23,129,716
Hawkeye 19,168,703 1,765,610 13,121,235 724,844 986,169 35,766,561
Eastern Iowa 22,196,287 2,590,746 16,582,059 437,218 1,358,962 43,165,272
Kirkwood 51,147,187 4,119,286 30,143,212 392,233 5,326,171 91,128,089
Des Moines Area 56,661,293 7,136,685 31,835,539 2,062,433 9,740,702 107,436,652
Western Iowa Tech 15,804,118 1,465,387 10,781,694 303,866 2,357,333 30,712,398
Iowa Western 21,948,712 1,735,834 11,522,371 525,700 1,094,397 36,827,014
Southwestern 5,201,481 563,647 4,527,072 212,700 1,005,010 11,509,910
Indian Hills 17,579,936 1,055,170 14,202,552 0 2,108,594 34,946,252
Southeastern 9,177,615 723,017 8,212,013 85,019 1,357,079 19,554,743
Total 295,035,559 28,505,519 193,274,647 6,421,205 34,226,499 557,463,429
Table 15-2. Adjusted Totals by Source in 2014 dollars
Year Tuition & Fees, $ Local, $ State General Aid, $ Federal, $ Other Income, $ Total Revenue, $
2010 302,885,379.16 26,218,303.87 160,581,830.78 37,680,268.83 33,742,554.91 561,108,337.55
2011 327,823,210.40 26,986,136.36 168,625,234.12 15,378,691.50 33,466,925.49 572,280,197.85
2012 324,723,688.62 27,317,947.11 169,013,788.31 10,467,407.93 30,333,102.84 561,855,934.80
2013 311,902,329.74 27,861,614.08 180,073,728.50 9,863,575.83 32,027,274.28 561,728,522.44
2014 295,035,559.43 28,505,518.84 193,274,647.00 6,421,204.68 34,226,499.30 557,463,429.00
Tables, Section 15 | 2
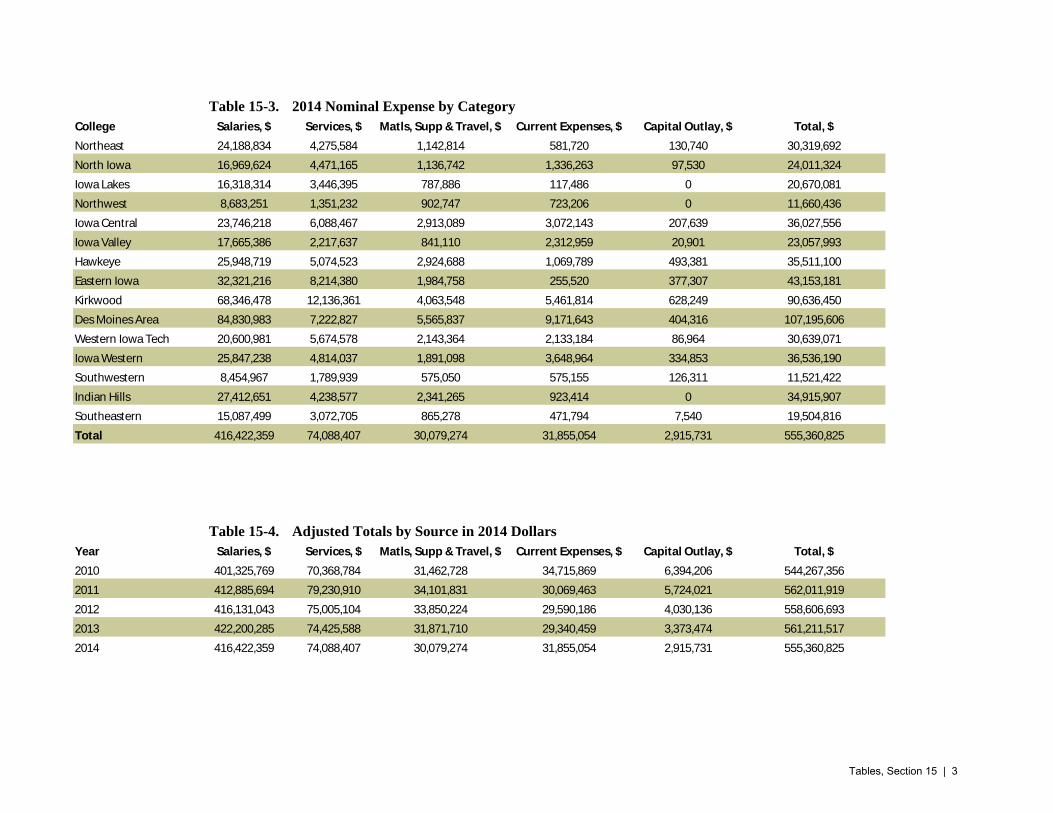
Table 15-3. 2014 Nominal Expense by Category
College Salaries, $ Services, $ Matls, Supp & Travel, $ Current Expenses, $ Capital Outlay, $ Total, $
Northeast 24,188,834 4,275,584 1,142,814 581,720 130,740 30,319,692
North Iowa 16,969,624 4,471,165 1,136,742 1,336,263 97,530 24,011,324
Iowa Lakes 16,318,314 3,446,395 787,886 117,486 0 20,670,081
Northwest 8,683,251 1,351,232 902,747 723,206 0 11,660,436
Iowa Central 23,746,218 6,088,467 2,913,089 3,072,143 207,639 36,027,556
Iowa Valley 17,665,386 2,217,637 841,110 2,312,959 20,901 23,057,993
Hawkeye 25,948,719 5,074,523 2,924,688 1,069,789 493,381 35,511,100
Eastern Iowa 32,321,216 8,214,380 1,984,758 255,520 377,307 43,153,181
Kirkwood 68,346,478 12,136,361 4,063,548 5,461,814 628,249 90,636,450
Des Moines Area 84,830,983 7,222,827 5,565,837 9,171,643 404,316 107,195,606
Western Iowa Tech 20,600,981 5,674,578 2,143,364 2,133,184 86,964 30,639,071
Iowa Western 25,847,238 4,814,037 1,891,098 3,648,964 334,853 36,536,190
Southwestern 8,454,967 1,789,939 575,050 575,155 126,311 11,521,422
Indian Hills 27,412,651 4,238,577 2,341,265 923,414 0 34,915,907
Southeastern 15,087,499 3,072,705 865,278 471,794 7,540 19,504,816
Total 416,422,359 74,088,407 30,079,274 31,855,054 2,915,731 555,360,825
Table 15-4. Adjusted Totals by Source in 2014 Dollars
Year Salaries, $ Services, $ Matls, Supp & Travel, $ Current Expenses, $ Capital Outlay, $ Total, $
2010 401,325,769 70,368,784 31,462,728 34,715,869 6,394,206 544,267,356
2011 412,885,694 79,230,910 34,101,831 30,069,463 5,724,021 562,011,919
2012 416,131,043 75,005,104 33,850,224 29,590,186 4,030,136 558,606,693
2013 422,200,285 74,425,588 31,871,710 29,340,459 3,373,474 561,211,517
2014 416,422,359 74,088,407 30,079,274 31,855,054 2,915,731 555,360,825
Tables, Section 15 | 3

Table 15-5. 2014 Nominal Expense by Function
College
Arts &
Science, $
Vocational
Technical, $
Adult
Education, $
Cooperative
Pgms/Svcs., $ Administration, $
Student
Services, $
Learning
Resources, $
Physical
Plant, $
General
Institution, $ Total, $
Northeast 5,375,777 7,900,665 3,237,926 2,788,717 1,416,318 2,139,305 685,736 2,780,688 3,994,560 30,319,692
North Iowa 6,214,167 3,720,281 2,610,013 48,591 1,857,169 3,785,949 479,865 2,274,619 3,020,670 24,011,324
Iowa Lakes 6,247,182 4,431,170 730,644 706,569 1,148,735 1,873,219 1,394,797 2,431,292 1,706,473 20,670,081
Northwest 1,559,062 3,988,096 844,675 80 808,285 1,082,087 195,176 859,831 2,323,144 11,660,436
Iowa Central 9,218,484 6,827,504 1,956,349 640,030 1,853,227 4,736,446 240,966 4,386,471 6,168,079 36,027,556
Iowa Valley 8,900,732 2,871,091 2,362,362 0 1,022,321 1,794,407 350,486 2,879,763 2,876,831 23,057,993
Hawkeye 6,737,836 9,897,667 4,761,971 0 1,887,150 3,403,454 878,856 3,533,644 4,410,522 35,511,100
Eastern Iowa 10,806,870 8,753,790 4,592,400 317,626 2,370,412 4,774,194 716,658 3,909,669 6,911,560 43,153,181
Kirkwood 23,551,263 19,864,883 10,046,261 1,633,917 8,059,047 6,099,817 1,822,170 8,377,629 11,181,463 90,636,450
Des Moines Area 29,253,489 30,463,109 5,749,367 0 3,895,909 9,753,009 3,001,012 15,110,564 9,969,147 107,195,606
Western Iowa Tech 4,482,511 8,787,991 1,820,768 375,607 1,985,640 2,309,386 283,675 4,350,611 6,242,882 30,639,071
Iowa Western 8,967,250 7,313,006 1,977,325 31,101 4,245,259 4,015,794 254,558 4,826,307 4,905,590 36,536,190
Southwestern 2,762,842 2,533,264 621,279 0 920,964 1,140,147 221,389 1,758,401 1,563,136 11,521,422
Indian Hills 5,551,432 12,280,692 1,329,400 97,202 1,771,653 4,554,598 609,387 3,977,998 4,743,545 34,915,907
Southeastern 4,298,181 3,970,226 717,854 1,691,446 1,782,655 2,285,597 405,372 1,929,010 2,424,475 19,504,816
Total 133,927,078 133,603,435 43,358,594 8,330,886 35,024,744 53,747,409 11,540,103 63,386,497 72,442,077 555,360,825
Table 15-6. Adjusted Totals by Source in 2014 Dollars
Arts &
Science, $
Vocational
Technical, $
Adult
Education, $
Cooperative
Pgms/Svcs., $ Administration, $
Student
Services, $
Learning
Resources, $
Physical
Plant, $
General
Institution, $ Total, $
2010 129,884,009 130,444,051 41,848,683 9,553,304 36,573,031 45,811,932 13,732,642 62,667,706 73,752,003 544,267,359
2011 138,359,061 136,640,426 44,258,629 7,943,653 34,888,561 47,111,654 13,171,000 65,711,122 73,927,819 562,011,926
2012 139,324,677 134,553,808 46,189,460 9,005,642 36,255,119 49,746,291 11,904,958 59,929,208 71,697,528 558,606,691
2013 139,047,017 137,077,515 47,235,586 7,721,488 34,226,172 52,028,910 11,689,174 59,425,131 72,760,526 561,211,517
2014 133,927,078 133,603,435 43,358,594 8,330,886 35,024,744 53,747,409 11,540,103 63,386,497 72,442,077 555,360,825
Tables, Section 15 | 4
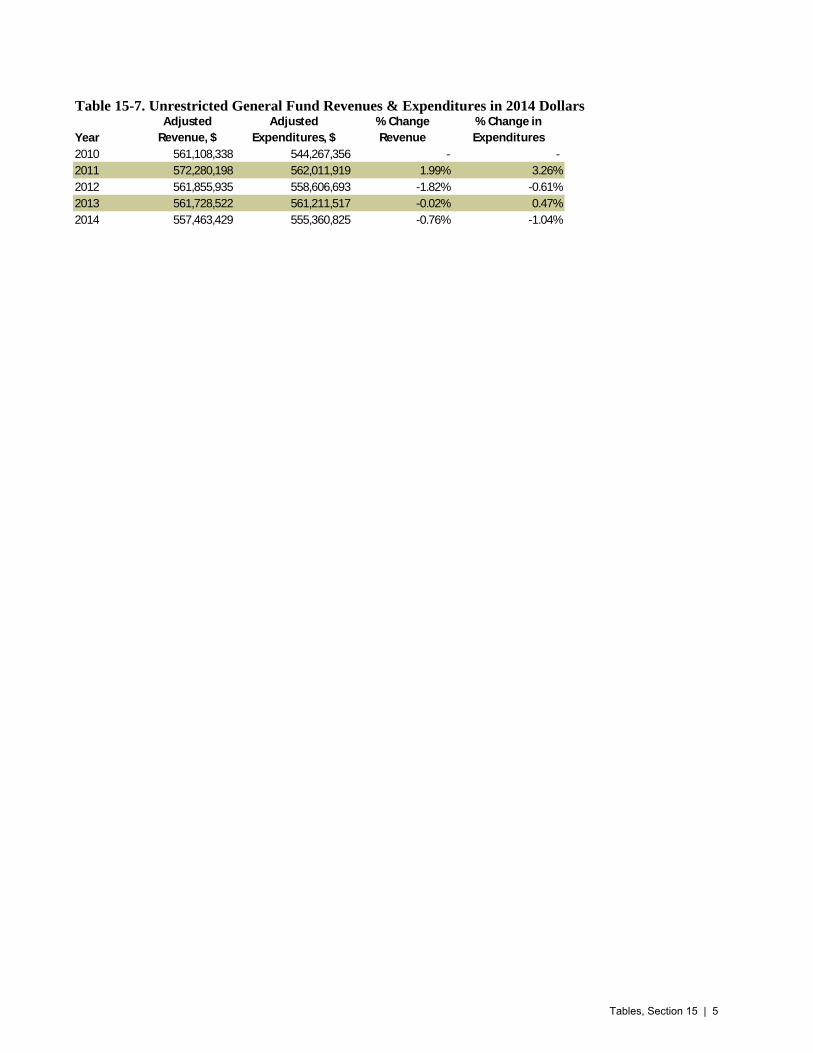
Table 15-7. Unrestricted General Fund Revenues & Expenditures in 2014 Dollars
Year
Adjusted
Revenue, $
Adjusted
Expenditures, $
% Change
Revenue
% Change in
Expenditures
2010 561,108,338 544,267,356 - -
2011 572,280,198 562,011,919 1.99% 3.26%
2012 561,855,935 558,606,693 -1.82% -0.61%
2013 561,728,522 561,211,517 -0.02% 0.47%
2014 557,463,429 555,360,825 -0.76% -1.04%
Tables, Section 15 | 5

Table 15-8. FTEE Totals
2010 2011 2012 2013 2014
Northeast 5,529.45 5,278.03 4,837.57 4,770.06 4,573.11
North Iowa 3,840.83 3,526.39 3,360.18 3,063.76 2,816.05
Iowa Lakes 3,630.52 3,698.84 3,293.27 3,010.70 2,667.75
Northwest 1,811.79 1,858.33 1,680.97 1,681.00 1,612.58
Iowa Central 6,460.67 6,733.43 6,578.78 6,479.84 5,704.95
Iowa Valley 3,552.99 3,524.28 3,392.73 3,351.29 3,121.76
Hawkeye 6,280.28 6,451.82 6,103.60 5,919.41 5,836.07
Eastern Iowa 9,146.55 9,429.42 9,157.39 8,172.87 7,887.10
Kirkwood 18,231.23 18,559.59 17,529.66 16,165.84 14,818.35
Des Moines Area 22,332.38 23,061.85 22,982.49 21,144.20 21,129.11
Western Iowa Tech 5,453.52 6,151.44 5,481.36 5,329.27 5,413.59
Iowa Western 6,591.13 7,158.23 7,406.15 7,335.36 6,905.49
Southwestern 1,871.62 1,951.05 1,816.61 1,732.24 1,532.87
Indian Hills 6,113.32 6,224.50 5,660.41 5,437.66 4,287.44
Southeastern 3,964.40 3,643.83 3,223.19 3,102.42 2,769.21
Total 104,810.67 107,251.03 102,504.34 96,695.92 91,075.43
Tables, Section 15 | 6
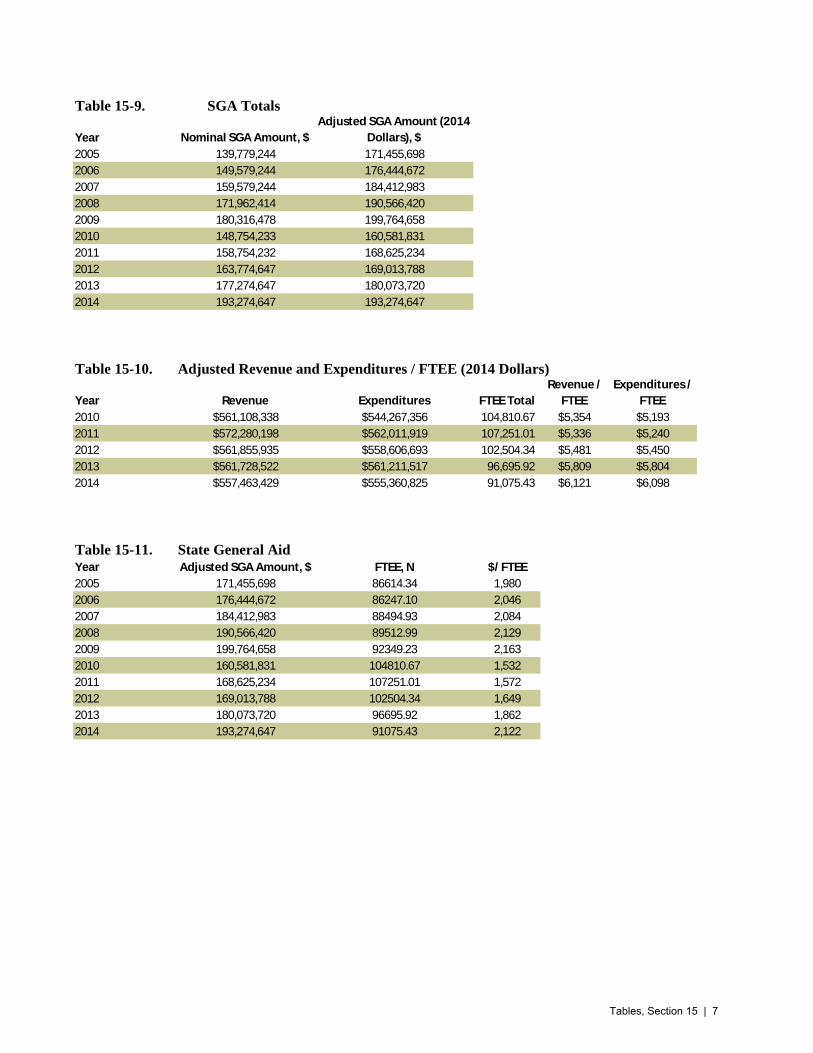
Table 15-9. SGA Totals
Year Nominal SGA Amount, $
Adjusted SGA Amount (2014
Dollars), $
2005 139,779,244 171,455,698
2006 149,579,244 176,444,672
2007 159,579,244 184,412,983
2008 171,962,414 190,566,420
2009 180,316,478 199,764,658
2010 148,754,233 160,581,831
2011 158,754,232 168,625,234
2012 163,774,647 169,013,788
2013 177,274,647 180,073,720
2014 193,274,647 193,274,647
Table 15-10. Adjusted Revenue and Expenditures / FTEE (2014 Dollars)
Year Revenue Expenditures FTEE Total
Revenue /
FTEE
Expenditures /
FTEE
2010 $561,108,338 $544,267,356 104,810.67 $5,354 $5,193
2011 $572,280,198 $562,011,919 107,251.01 $5,336 $5,240
2012 $561,855,935 $558,606,693 102,504.34 $5,481 $5,450
2013 $561,728,522 $561,211,517 96,695.92 $5,809 $5,804
2014 $557,463,429 $555,360,825 91,075.43 $6,121 $6,098
Table 15-11. State General Aid
Year Adjusted SGA Amount, $ FTEE, N $/ FTEE
2005 171,455,698 86614.34 1,980
2006 176,444,672 86247.10 2,046
2007 184,412,983 88494.93 2,084
2008 190,566,420 89512.99 2,129
2009 199,764,658 92349.23 2,163
2010 160,581,831 104810.67 1,532
2011 168,625,234 107251.01 1,572
2012 169,013,788 102504.34 1,649
2013 180,073,720 96695.92 1,862
2014 193,274,647 91075.43 2,122
Tables, Section 15 | 7

Tables, Human Resources 16
Table of Contents
16-1. Employees by Position.........................................................................................................2
16-2--16-3. Degrees of Instructors and Administrators, Latest Five Years...................................3
16-4--16.6. Employees by Age, Race/Ethnicity and Gender, Latest Five Years...........................4
16-7--16-8. Base Salary for Instructors (Latest Five Years) and Iowa/National Data..................5
16-9--16--13. Degrees for Administrators, Latest Five Years..................................................6-10
16-14--16-18. Degrees for Instructors, Latest Five Years......................................................11-15
16-19--16-23. Employees by Age and College, Latest Five Years........................................16-18
16-24--16-28. Employees by Race/Ethnicity and College, Latest Five Years.......................19-21
16-29. Employees by Gender and College, Latest Five Years....................................................22
16-30--16-34. Employees by Gender and College, Latest Five Years........................................23
Tables, Section 16 | 1

Table 16-1. Employees by Position. 2014
Fiscal
Year Employment Type Administrative Instructional Professional
Secretarial &
Clerical Service Total
2010 Full-Time 137 1,920 1,993 932 442 5,424
Part-Time 7 164 630 609 670 2,080
Temp./Seasonal 1 99 782 1,101 456 2,439
Adjunct 0 5,079 8 1 0 5,088
Total 145 7,262 3,413 2,643 1,568 15,031
2011 Full-Time 132 2,020 1,994 884 534 5,564
Part-Time 4 299 630 662 704 2,299
Temp./Seasonal 3 127 798 762 695 2,385
Adjunct 0 5,218 11 0 0 5,229
Total 139 7,664 3,433 2,308 1,933 15,477
2012 Full-Time 135 1,938 2,036 825 485 5,419
Part-Time 6 346 750 635 623 2,360
Temp./Seasonal 0 111 810 831 649 2,401
Adjunct 0 5,443 8 0 0 5,451
Total 141 7,838 3,604 2,291 1,757 15,631
2013 Full-Time 130 2,021 2,091 882 553 5,677
Part-Time 6 138 764 856 870 2,634
Temp./Seasonal 1 98 788 1,119 737 2,743
Adjunct 0 5,481 7 0 1 5,489
Total 137 7,738 3,650 2,857 2,161 16,543
2014 Full-Time 128 2,045 2,194 863 538 5,768
Part-Time 5 112 716 892 809 2,534
Temp./Seasonal 4 76 605 1,056 754 2,495
Adjunct - 5,236 30 6 4 5,276
Total 137 7,469 3,545 2,817 2,105 16,073
Note: Individuals may be employed in a number of positions at a community college. Full-time Instructional includes credit
and non-credit full-time employees.
Tables, Section 16 | 2

Table 16-2. Degrees for full-time Instructors.
Degree 2010 2011 2012 2013 2014
Doctorate 188 196 185 156 202
Ed. Special 14 12 17 12 10
Masters 1,034 1,083 1,026 1,027 1,097
Bachelors 379 400 385 488 384
Associate 219 232 214 245 243
Diploma 51 55 52 56 60
Certificate 22 21 25 28 23
High School 25 20 15 27 33
Non-Graduate 2 5 0 3 2
Not Provided 38 41 41 34 39
Total 1,972 2,065 1,960 2,076 2,093
Table 16-3. Degrees for full-time Administrators.
Degree 2010 2011 2012 2013 2014
Doctorate 47 48 49 48 47
Ed. Special 5 6 4 3 3
Masters 54 46 53 50 52
Bachelors 28 27 26 27 27
Associate 1 2 3 2 1
Diploma 0 0 0 1 0
Certificate 0 0 0 0 0
High School 1 1 1 1 1
Non-Graduate 0 0 0 0 0
Not Provided 2 3 2 2 1
Total 138 133 138 134 132
Note: Total full-time instructional employees does not equal total instructional positions because
some employees are employed by more than one institution within the same year.
Note: Total full-time administrators employees does not equal total full-time administrators positions
because some employees are employed by more than one institution within the same year.
Tables, Section 16 | 3

Table 16-4. Employees by Age.Fiscal
Year 17 & Under 18-22 23-26 27-30 31-39 40-55 Over 55 Unknown Total
2010 77 978 704 878 2,177 5,016 3,683 57 13,570
2011 53 1,082 745 921 2,228 4,949 3,753 39 13,770
2012 71 1,059 735 912 2,372 4,956 3,909 4 14,018
2013 70 1,378 773 972 2,530 4,903 4,037 8 14,671
2014 70 1,378 773 972 2,530 4,903 4,037 8 14,671
Table 16-5. Employees by Race/Ethnicity.
Fiscal
Year
American
Indian Asian Black
Hawaiian/P
acific
Islander
Hispanic White
More than
one race
No
Response Total
2010 37 136 367 7 250 11,424 25 1,324 13,570
2011 43 167 391 11 245 11,797 35 1,081 13,770
2012 37 170 387 9 274 12,147 81 913 14,009
2013 46 195 482 14 331 12,890 68 645 14,657
2014 38 202 492 11 355 12,399 71 584 14,141
Table 16-6. Employees by Gender.Fiscal
Year Male, N Male, % Female, N Female, % Total
2010 5,601 41.4 7,929 58.6 13,615
2011 5,666 41.2 8,099 58.8 13,805
2012 5,733 40.9 8,281 59.1 14,019
2013 6,028 41.1 8,638 58.9 14,671
2014 5,914 41.8 8,234 58.2 14,152
Note: No Response includes individuals who did not respond or colleges who did not report a ethnicity/race. "More
than one" race reporting started in 2010.
Note: Unknown employees are included in the total, but not shown in ratios
above. The following are unknown counts: fiscal year 2010, 40 (0.3%);
fiscal year 2011, 5 (0.04%); fiscal year 2012, 4 (0.03%); fiscal year 2013, 5
(0.03%); fiscal year 2014, 4 (0.03%).
Tables, Section 16 | 4

Table 16-7. Base Salary for Instructors.
Fiscal Year Full-Time Instructional Positions Average Base Salary, $
2010 1,822 53,147
2011 1,912 52,350
2012 1,833 55,601
2013 1,849 56,692
2014 1,966 57,996
Table 16-8. Iowa and National Wages for Instructors.
Fiscal Year Almanac Issue, Fiscal Year
Iowa 2-Year Public
Institutions
National 2-Year Public
Institutions
1996 1998 & 1999 35,726 43,295
1998 2000 & 2001 37,460 45,919
1999 2002 38,334 47,285
2000 2003 & 2004 38,950 48,240
2002 2005 40,431 50,837
2004 2006 42,624 53,080
2005 2007 43,675 53,932
2006 2008 44,943 54,895
2007 2009 46,661 57,466
2008 2010 48,911 58,175
2009 2011 51,400 55,809
2010 2012 53,095 57,530*
2011 2013 53,442 57,677
2012 2014 51,581 55,373
2013 2015 53,339 56,075
Note: Data in The Chronicle of Higher Education Almanac issue was repeated in fiscal year 1999, 2001, and
2004.*The Chronicle publshed this number quoting FY 2011 data of American Association of University Professors.
Source: The Chronicle of Higher Education Almanac, 2013-2014.
Tables, Section 16 | 5

Table 16-9. Degrees for Full-time Administrators. 2010
College Doctorate Ed Special Masters Bachelors Associate Diploma Certificate High School Non-Grad
Not
Provided Total % of State
Northeast 5 0 5 0 0 0 0 1 0 0 11 8.0
North Iowa Area 3 0 1 2 0 0 0 0 0 0 6 4.3
Iowa Lakes 2 0 9 1 0 0 0 0 0 1 13 9.4
Northwest 4 0 1 4 0 0 0 0 0 0 9 6.5
Iowa Central 0 0 2 3 0 0 0 0 0 1 6 4.3
Iowa Valley 3 0 4 1 0 0 0 0 0 0 8 5.8
Hawkeye 2 1 2 1 0 0 0 0 0 0 6 4.3
Eastern Iowa 4 0 5 0 0 0 0 0 0 0 9 6.5
Kirkwood 3 0 5 2 0 0 0 0 0 0 10 7.2
Des Moines Area 5 1 6 2 0 0 0 0 0 0 14 10.1
Western Iowa Tech 5 0 5 1 0 0 0 0 0 0 11 8.0
Iowa Western 2 0 1 3 0 0 0 0 0 0 6 4.3
Southwestern 1 0 1 2 0 0 0 0 0 0 4 2.9
Indian Hills 5 3 4 4 1 0 0 0 0 0 17 12.3
Southeastern 3 0 3 2 0 0 0 0 0 0 8 5.8
Total 47 5 54 28 1 0 0 1 0 2 138 100.0
% of all degrees 34.1 3.6 39.1 20.3 0.7 0.0 0.0 0.7 0.0 1.4 100.0
Note: Total full-time administrators employees does not equal total full-time administrators positions because some employees are employed by more than one institution within the same year.
Tables, Section 16 | 6
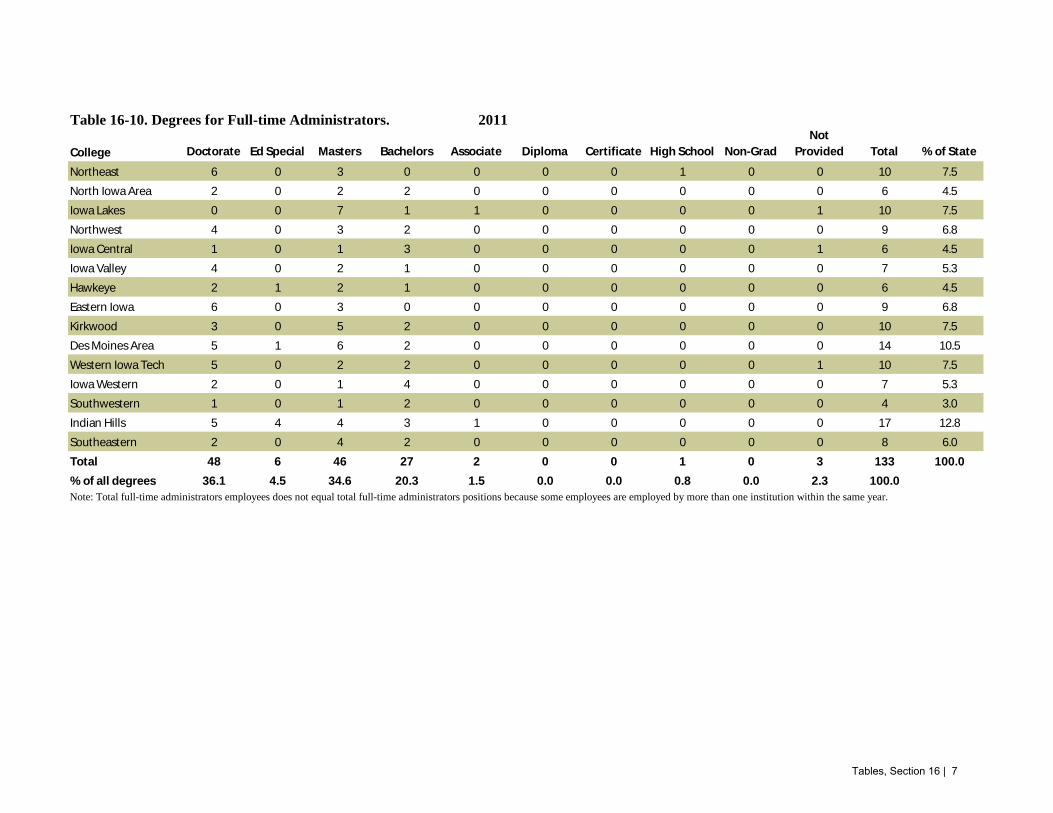
Table 16-10. Degrees for Full-time Administrators. 2011
College Doctorate Ed Special Masters Bachelors Associate Diploma Certificate High School Non-Grad
Not
Provided Total % of State
Northeast 6 0 3 0 0 0 0 1 0 0 10 7.5
North Iowa Area 2 0 2 2 0 0 0 0 0 0 6 4.5
Iowa Lakes 0 0 7 1 1 0 0 0 0 1 10 7.5
Northwest 4 0 3 2 0 0 0 0 0 0 9 6.8
Iowa Central 1 0 1 3 0 0 0 0 0 1 6 4.5
Iowa Valley 4 0 2 1 0 0 0 0 0 0 7 5.3
Hawkeye 2 1 2 1 0 0 0 0 0 0 6 4.5
Eastern Iowa 6 0 3 0 0 0 0 0 0 0 9 6.8
Kirkwood 3 0 5 2 0 0 0 0 0 0 10 7.5
Des Moines Area 5 1 6 2 0 0 0 0 0 0 14 10.5
Western Iowa Tech 5 0 2 2 0 0 0 0 0 1 10 7.5
Iowa Western 2 0 1 4 0 0 0 0 0 0 7 5.3
Southwestern 1 0 1 2 0 0 0 0 0 0 4 3.0
Indian Hills 5 4 4 3 1 0 0 0 0 0 17 12.8
Southeastern 2 0 4 2 0 0 0 0 0 0 8 6.0
Total 48 6 46 27 2 0 0 1 0 3 133 100.0
% of all degrees 36.1 4.5 34.6 20.3 1.5 0.0 0.0 0.8 0.0 2.3 100.0
Note: Total full-time administrators employees does not equal total full-time administrators positions because some employees are employed by more than one institution within the same year.
Tables, Section 16 | 7

Table 16-11. Degrees for Full-time Administrators. 2012
College Doctorate Ed Special Masters Bachelors Associate Diploma Certificate High School Non-Grad
Not
Provided Total % of State
Northeast 6 0 4 0 0 0 0 1 0 0 11 8.0
North Iowa Area 1 0 1 2 0 0 0 0 0 0 4 2.9
Iowa Lakes 0 0 7 1 2 0 0 0 0 1 11 8.0
Northwest 6 0 4 1 0 0 0 0 0 0 11 8.0
Iowa Central 1 0 2 3 0 0 0 0 0 1 7 5.1
Iowa Valley 5 0 4 0 0 0 0 0 0 0 9 6.5
Hawkeye 2 0 2 2 0 0 0 0 0 0 6 4.3
Eastern Iowa 7 0 4 0 0 0 0 0 0 0 11 8.0
Kirkwood 2 0 5 2 0 0 0 0 0 0 9 6.5
Des Moines Area 5 1 6 2 0 0 0 0 0 0 14 10.1
Western Iowa Tech 5 0 5 1 0 0 0 0 0 0 11 8.0
Iowa Western 2 0 1 4 0 0 0 0 0 0 7 5.1
Southwestern 1 0 1 2 0 0 0 0 0 0 4 2.9
Indian Hills 5 3 3 4 1 0 0 0 0 0 16 11.6
Southeastern 1 0 4 2 0 0 0 0 0 0 7 5.1
Total 49 4 53 26 3 0 0 1 0 2 138 100.0
% of all degrees 35.5 2.9 38.4 18.8 2.2 0.0 0.0 0.7 0.0 1.4 100.0
Note: Total full-time administrators employees does not equal total full-time administrators positions because some employees are employed by more than one institution within the same year.
Tables, Section 16 | 8

Table 16-12. Degrees for Full-time Administrators. 2013
College Doctorate Ed Special Masters Bachelors Associate Diploma Certificate High School Non-Grad
Not
Provided Total % of State
Northeast 7 0 3 1 0 0 0 1 0 0 12 9.0
North Iowa Area 3 0 0 2 0 0 0 0 0 0 5 3.7
Iowa Lakes 0 0 8 1 0 1 0 0 0 0 10 7.5
Northwest 6 0 4 1 0 0 0 0 0 0 11 8.2
Iowa Central 1 0 2 3 0 0 0 0 0 0 6 4.5
Iowa Valley 3 0 3 0 0 0 0 0 0 0 6 4.5
Hawkeye 3 0 2 2 0 0 0 0 0 1 8 6.0
Eastern Iowa 6 0 4 0 0 0 0 0 0 0 10 7.5
Kirkwood 3 0 1 4 1 0 0 0 0 1 10 7.5
Des Moines Area 4 0 6 2 0 0 0 0 0 0 12 9.0
Western Iowa Tech 3 0 6 1 0 0 0 0 0 0 10 7.5
Iowa Western 2 0 2 3 0 0 0 0 0 0 7 5.2
Southwestern 1 0 2 1 0 0 0 0 0 0 4 3.0
Indian Hills 4 3 3 4 1 0 0 0 0 0 15 11.2
Southeastern 2 0 4 2 0 0 0 0 0 0 8 6.0
Total 48 3 50 27 2 1 0 1 0 2 134 100.0
% of all degrees 35.8 2.2 37.3 20.1 1.5 0.7 0.0 0.7 0.0 1.5 100.0
Note: Total full-time administrators employees does not equal total full-time administrators positions because some employees are employed by more than one institution within the same year.
Tables, Section 16 | 9
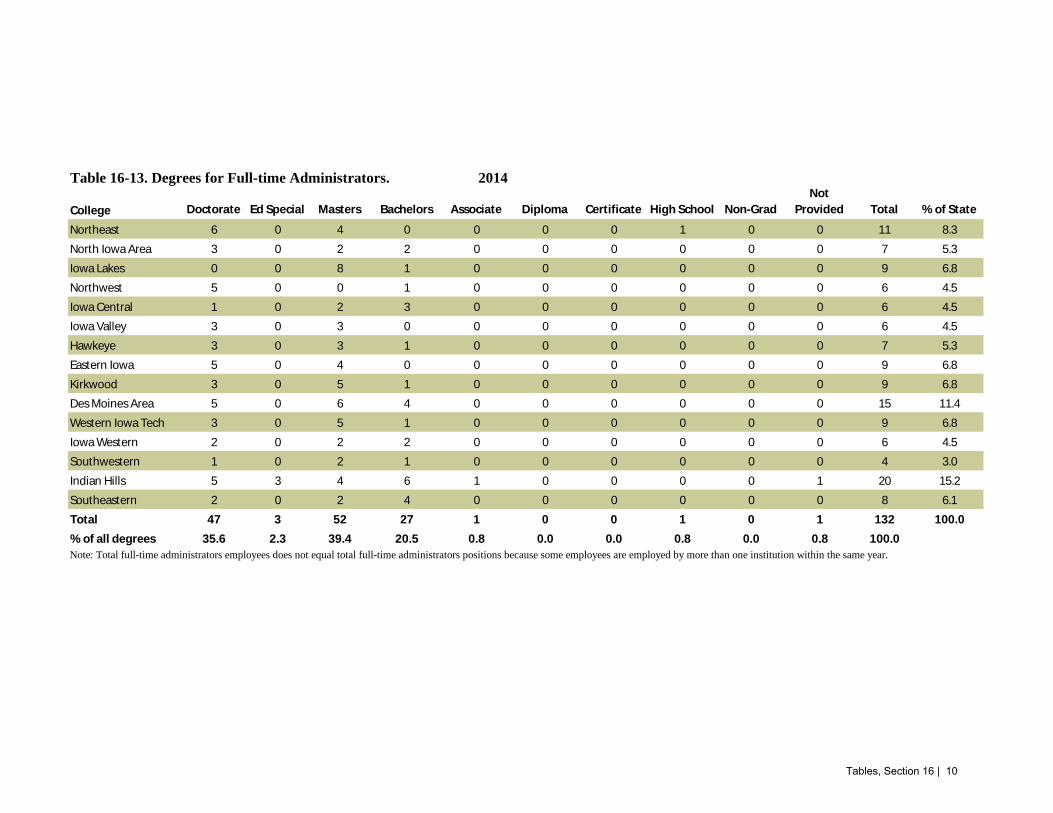
Table 16-13. Degrees for Full-time Administrators. 2014
College Doctorate Ed Special Masters Bachelors Associate Diploma Certificate High School Non-Grad
Not
Provided Total % of State
Northeast 6 0 4 0 0 0 0 1 0 0 11 8.3
North Iowa Area 3 0 2 2 0 0 0 0 0 0 7 5.3
Iowa Lakes 0 0 8 1 0 0 0 0 0 0 9 6.8
Northwest 5 0 0 1 0 0 0 0 0 0 6 4.5
Iowa Central 1 0 2 3 0 0 0 0 0 0 6 4.5
Iowa Valley 3 0 3 0 0 0 0 0 0 0 6 4.5
Hawkeye 3 0 3 1 0 0 0 0 0 0 7 5.3
Eastern Iowa 5 0 4 0 0 0 0 0 0 0 9 6.8
Kirkwood 3 0 5 1 0 0 0 0 0 0 9 6.8
Des Moines Area 5 0 6 4 0 0 0 0 0 0 15 11.4
Western Iowa Tech 3 0 5 1 0 0 0 0 0 0 9 6.8
Iowa Western 2 0 2 2 0 0 0 0 0 0 6 4.5
Southwestern 1 0 2 1 0 0 0 0 0 0 4 3.0
Indian Hills 5 3 4 6 1 0 0 0 0 1 20 15.2
Southeastern 2 0 2 4 0 0 0 0 0 0 8 6.1
Total 47 3 52 27 1 0 0 1 0 1 132 100.0
% of all degrees 35.6 2.3 39.4 20.5 0.8 0.0 0.0 0.8 0.0 0.8 100.0
Note: Total full-time administrators employees does not equal total full-time administrators positions because some employees are employed by more than one institution within the same year.
Tables, Section 16 | 10

Table 16-14. Degrees for Full-time Instructors. 2010
College Doctorate Ed Special Masters Bachelors Associate Diploma Certificate High School Non-Grad
Not
Provided Total % of State
Northeast 8 0 60 22 19 0 0 3 0 11 123 6.2
North Iowa Area 7 0 55 12 5 1 3 2 0 0 85 4.3
Iowa Lakes 3 2 49 22 10 4 0 0 0 9 99 5.0
Northwest 0 0 16 8 13 5 0 1 0 0 43 2.2
Iowa Central 4 0 55 14 9 1 2 5 0 0 90 4.6
Iowa Valley 9 0 57 12 7 0 1 2 0 0 88 4.5
Hawkeye 13 0 66 25 15 7 0 0 0 4 130 6.6
Eastern Iowa 19 1 83 27 13 1 1 5 0 1 151 7.7
Kirkwood 48 4 148 55 28 7 0 1 0 4 295 15.0
Des Moines Area 38 2 172 73 42 8 6 3 0 0 344 17.4
Western Iowa Tech 8 3 46 19 14 2 0 1 0 1 94 4.8
Iowa Western 11 1 81 37 17 4 3 0 1 3 158 8.0
Southwestern 3 0 35 5 1 3 1 1 1 4 54 2.7
Indian Hills 10 1 66 31 17 4 2 1 0 0 132 6.7
Southeastern 7 0 45 17 9 4 3 0 0 1 86 4.4
Total 188 14 1,034 379 219 51 22 25 2 38 1,972 100.0
% of all degrees 9.5 0.7 52.4 19.2 11.1 2.6 1.1 1.3 0.1 1.9 100.0
Note: Total full-time instructional employees does not equal total instructional positions because some employees are employed by more than one institution within the same year.
Tables, Section 16 | 11

Table 16-15. Degrees for Full-time Instructors. 2011
College Doctorate Ed Special Masters Bachelors Associate Diploma Certificate High School Non-Grad
Not
Provided Total Percent
Northeast 8 0 67 21 20 0 0 3 0 11 123 6.0
North Iowa Area 7 0 59 15 5 0 3 0 0 0 85 4.1
Iowa Lakes 3 1 46 21 11 4 0 0 0 12 99 4.8
Northwest 0 0 19 8 11 5 0 1 0 1 43 2.1
Iowa Central 4 0 51 16 10 3 2 5 0 1 90 4.4
Iowa Valley 8 0 57 12 6 1 1 0 0 0 88 4.3
Hawkeye 14 0 62 22 12 7 0 0 0 4 130 6.3
Eastern Iowa 20 1 89 25 14 1 1 5 0 0 151 7.3
Kirkwood 54 2 184 78 37 6 0 1 0 5 295 14.3
Des Moines Area 40 2 175 76 43 9 6 3 0 0 344 16.7
Western Iowa Tech 10 3 43 18 14 2 0 1 1 1 94 4.6
Iowa Western 10 1 85 28 16 4 2 0 0 3 158 7.7
Southwestern 4 0 32 3 1 4 1 1 1 2 54 2.6
Indian Hills 7 1 66 37 23 3 2 0 3 0 132 6.4
Southeastern 7 1 48 20 9 6 3 0 0 1 86 4.2
Total 196 12 1,083 400 232 55 21 20 5 41 2,065 100.0
Percent 9.5 0.6 52.4 19.4 11.2 2.7 1.0 1.0 0.2 2.0 100.0
Note: Total full-time instructional employees does not equal total instructional positions because some employees are employed by more than one institution within the same year.
Tables, Section 16 | 12

Table 16-16. Degrees for Full-time Instructors. 2012
College Doctorate Ed Special Masters Bachelors Associate Diploma Certificate High School Non-Grad
Not
Provided Total Percent
Northeast 8 0 60 18 16 1 1 1 0 12 123 6.3
North Iowa Area 7 0 53 12 4 0 3 1 0 0 85 4.3
Iowa Lakes 4 1 50 21 12 4 0 0 0 11 99 5.1
Northwest 0 0 18 8 13 5 0 1 0 0 43 2.2
Iowa Central 7 0 51 19 10 3 2 5 0 0 90 4.6
Iowa Valley 6 0 57 10 5 1 1 0 0 0 88 4.5
Hawkeye 14 0 65 23 15 7 0 0 0 5 130 6.6
Eastern Iowa 55 5 154 45 24 6 0 1 0 4 151 7.7
Kirkwood 7 3 53 39 10 0 0 1 0 4 295 15.1
Des Moines Area 42 2 175 76 44 8 6 2 0 0 344 17.6
Western Iowa Tech 9 3 45 19 14 0 2 2 0 2 94 4.8
Iowa Western 11 1 89 29 17 4 2 0 0 1 158 8.1
Southwestern 2 0 36 5 2 4 1 1 0 2 54 2.8
Indian Hills 7 2 73 37 22 4 5 0 0 0 132 6.7
Southeastern 6 0 47 24 6 5 2 0 0 0 86 4.4
Total 185 17 1,026 385 214 52 25 15 0 41 1,960 100.0
Percent 9.4 0.9 52.3 19.6 10.9 2.7 1.3 0.8 0.0 2.1 100.0
Note: Total full-time instructional employees does not equal total instructional positions because some employees are employed by more than one institution within the same year.
Tables, Section 16 | 13

Table 16-17. Degrees for Full-time Instructors. 2013
College Doctorate Ed Special Masters Bachelors Associate Diploma Certificate High School Non-Grad
Not
Provided Total Percent
Northeast 8 0 67 29 17 2 1 0 1 0 123 5.9
North Iowa Area 6 0 55 10 4 0 3 1 0 0 85 4.1
Iowa Lakes 4 2 54 20 13 6 0 0 0 0 99 4.8
Northwest 0 0 17 6 13 5 0 2 0 0 43 2.1
Iowa Central 5 0 52 18 9 3 2 6 0 0 90 4.3
Iowa Valley 5 0 54 13 4 1 1 0 0 0 88 4.2
Hawkeye 13 0 66 22 17 6 2 4 0 0 130 6.3
Eastern Iowa 18 0 84 24 15 1 1 6 0 0 151 7.3
Kirkwood 20 1 112 149 50 8 2 2 0 30 295 14.2
Des Moines Area 42 3 177 75 45 8 6 2 0 0 344 16.6
Western Iowa Tech 9 3 44 20 14 0 2 2 0 1 94 4.5
Iowa Western 10 1 100 26 11 3 2 0 0 1 158 7.6
Southwestern 2 0 33 6 1 4 1 1 1 0 54 2.6
Indian Hills 7 2 68 41 26 4 3 1 1 1 132 6.4
Southeastern 7 0 44 29 6 5 2 0 0 1 86 4.1
Total 156 12 1,027 488 245 56 28 27 3 34 2,076 100.0
Percent 7.5 0.6 49.5 23.5 11.8 2.7 1.3 1.3 0.1 1.6 100.0
Note: Total full-time instructional employees does not equal total instructional positions because some employees are employed by more than one institution within the same year.
Tables, Section 16 | 14

Table 16-18. Degrees for Full-time Instructors. 2014
College Doctorate Ed Special Masters Bachelors Associate Diploma Certificate High School Non-Grad
Not
Provided Total Percent
Northeast 9 0 61 24 18 3 1 0 1 0 117 5.6
North Iowa Area 7 0 55 11 5 1 2 1 0 0 82 3.9
Iowa Lakes 7 1 57 11 12 5 0 0 0 5 98 4.7
Northwest 0 0 20 6 14 5 0 2 0 0 47 2.2
Iowa Central 5 0 49 18 10 3 2 6 0 0 93 4.4
Iowa Valley 6 0 50 12 4 1 1 1 0 0 75 3.6
Hawkeye 14 0 67 24 15 7 2 1 0 0 130 6.2
Eastern Iowa 19 0 85 27 14 2 1 7 0 0 155 7.4
Kirkwood 58 2 171 58 39 7 2 3 0 33 373 17.8
Des Moines Area 42 3 187 76 53 7 7 3 0 0 378 18.1
Western Iowa Tech 10 0 40 20 16 3 0 2 0 0 91 4.3
Iowa Western 10 1 112 24 10 3 2 0 0 1 163 7.8
Southwestern 2 0 31 5 0 4 1 2 1 0 46 2.2
Indian Hills 7 3 70 36 25 4 0 4 0 0 149 7.1
Southeastern 6 0 42 32 8 5 2 1 0 0 96 4.6
Total 202 10 1,097 384 243 60 23 33 2 39 2,093 100.0
Percent 9.7 0.5 52.4 18.3 11.6 2.9 1.1 1.6 0.1 1.9 100.0
Note: Total full-time instructional employees does not equal total instructional positions because some employees are employed by more than one institution within the same year.
Tables, Section 16 | 15

Table 16-19. Employees by Age and College. 2010
College 17 & Under 18-22 23-26 27-30 31-39 40-55 Over 55
No
Response Total
% of
Total
Northeast 0 49 54 41 105 309 248 0 806 5.9
North Iowa Area 2 27 17 28 73 208 168 0 523 3.9
Iowa Lakes 4 38 35 39 87 243 205 29 680 5.0
Northwest 0 3 7 20 51 105 85 0 271 2.0
Iowa Central 2 130 92 90 177 278 170 3 942 6.9
Iowa Valley 4 28 42 64 106 268 197 0 709 5.2
Hawkeye 0 5 20 45 127 239 210 0 646 4.8
Eastern Iowa 0 9 31 59 155 423 328 0 1,005 7.4
Kirkwood 55 144 120 119 389 891 570 25 2,313 17.0
Des Moines Area 5 64 93 149 383 847 709 0 2,250 16.6
Western Iowa Tech 0 3 17 38 120 269 174 0 621 4.6
Iowa Western 5 325 98 85 164 300 212 0 1,189 8.8
Southwestern 0 8 13 26 45 127 65 0 284 2.1
Indian Hills 0 142 51 40 102 279 186 0 800 5.9
Southeastern 0 3 14 35 93 230 156 0 531 3.9
Total 77 978 704 878 2,177 5,016 3,683 57 13,570 100.0
% of Total 0.6 7.2 5.2 6.5 16.0 37.0 27.1 0.4 100.0
Table 16-20. Employees by Age and College. 2011
College 17 & Under 18-22 23-26 27-30 31-39 40-55 Over 55
No
Reponse Total
% of
Total
Northeast 0 14 27 27 99 269 228 2 666 4.8
North Iowa Area 2 15 22 28 65 215 166 0 513 3.7
Iowa Lakes 5 45 39 49 89 222 198 32 679 4.9
Northwest 6 18 5 21 48 114 91 1 304 2.2
Iowa Central 5 144 91 83 141 245 115 2 826 6.0
Iowa Valley 4 49 42 46 116 242 215 1 715 5.2
Hawkeye 0 14 39 53 133 243 190 0 672 4.9
Eastern Iowa 0 6 29 62 172 424 357 0 1,050 7.6
Kirkwood 17 174 118 150 424 837 601 1 2,322 16.9
Des Moines Area 5 64 110 160 394 891 752 0 2,376 17.3
Western Iowa Tech 0 2 19 46 130 285 186 0 668 4.9
Iowa Western 3 331 105 94 178 298 230 0 1,239 9.0
Southwestern 0 13 14 21 45 130 75 0 298 2.2
Indian Hills 6 192 68 55 108 294 190 0 913 6.6
Southeastern 0 1 17 26 86 240 159 0 529 3.8
Total 53 1,082 745 921 2,228 4,949 3,753 39 13,770 100.0
% of Total 0.4 7.9 5.4 6.7 16.2 35.9 27.3 0.3 100.0
Note: "No response" includes individuals who chose not to be identified and colleges who did not respond.
Note: "No response" includes individuals who chose not to be identified and colleges who did not respond.
Tables, Section 16 | 16

Table 16-21. Employees by Age and College. 2012
College 17 & Under 18-22 23-26 27-30 31-39 40-55 Over 55
No
Response Total
% of
Total
Northeast 1 25 39 34 110 276 239 0 724 5.2
North Iowa Area 3 12 21 24 64 194 174 0 492 3.5
Iowa Lakes 6 39 42 42 105 227 221 2 684 4.9
Northwest 2 34 7 18 54 106 90 0 311 2.2
Iowa Central 5 129 99 97 191 339 221 1 1,082 7.7
Iowa Valley 5 46 52 44 126 246 222 0 741 5.3
Hawkeye 0 20 37 51 134 247 207 0 696 5.0
Eastern Iowa 0 5 20 62 172 413 364 0 1,036 7.4
Kirkwood 0 104 85 149 403 750 527 0 2,018 14.4
Des Moines Area 4 68 100 151 424 879 784 0 2,410 17.2
Western Iowa Tech 0 2 23 44 127 290 205 0 691 4.9
Iowa Western 6 361 100 95 194 307 217 1 1,281 9.1
Southwestern 4 12 18 22 41 130 71 0 298 2.1
Indian Hills 35 192 72 55 127 314 196 0 991 7.1
Southeastern 0 10 20 24 100 238 171 0 563 4.0
Total 71 1,059 735 912 2,372 4,956 3,909 4 14,018 100.0
% of Total 0.5 7.6 5.2 6.5 16.9 35.4 27.9 0.0 100.0
Table 16-22. Employees by Age and College. 2013
College 17 & Under 18-22 23-26 27-30 31-39 40-55 Over 55
No
Response Total
% of
Total
Northeast 0 6 19 35 93 253 249 0 655 4.5
North Iowa Area 3 23 23 34 74 174 175 0 506 3.4
Iowa Lakes 6 42 34 33 102 201 216 5 639 4.4
Northwest 3 35 11 18 58 109 84 0 318 2.2
Iowa Central 3 128 88 86 208 330 220 2 1,065 7.3
Iowa Valley 11 56 56 43 122 236 235 0 759 5.2
Hawkeye 1 20 41 60 152 243 215 0 732 5.0
Eastern Iowa 0 5 12 51 159 415 370 0 1,012 6.9
Kirkwood 12 402 198 205 497 833 603 1 2,751 18.8
Des Moines Area 1 58 87 143 415 881 798 0 2,383 16.2
Western Iowa Tech 0 2 21 37 131 288 206 0 685 4.7
Iowa Western 8 373 88 121 221 309 202 0 1,322 9.0
Southwestern 2 7 16 24 56 122 77 0 304 2.1
Indian Hills 20 211 65 58 145 293 206 0 998 6.8
Southeastern 0 10 14 24 97 216 181 0 542 3.7
Total 70 1,378 773 972 2,530 4,903 4,037 8 14,671 100.0
% of Total 0.5 9.4 5.3 6.6 17.2 33.4 27.5 0.1 100.0
Note: "No response" includes individuals who chose not to be identified and colleges who did not respond.
Note: "No response" includes individuals who chose not to be identified and colleges who did not respond.
Tables, Section 16 | 17
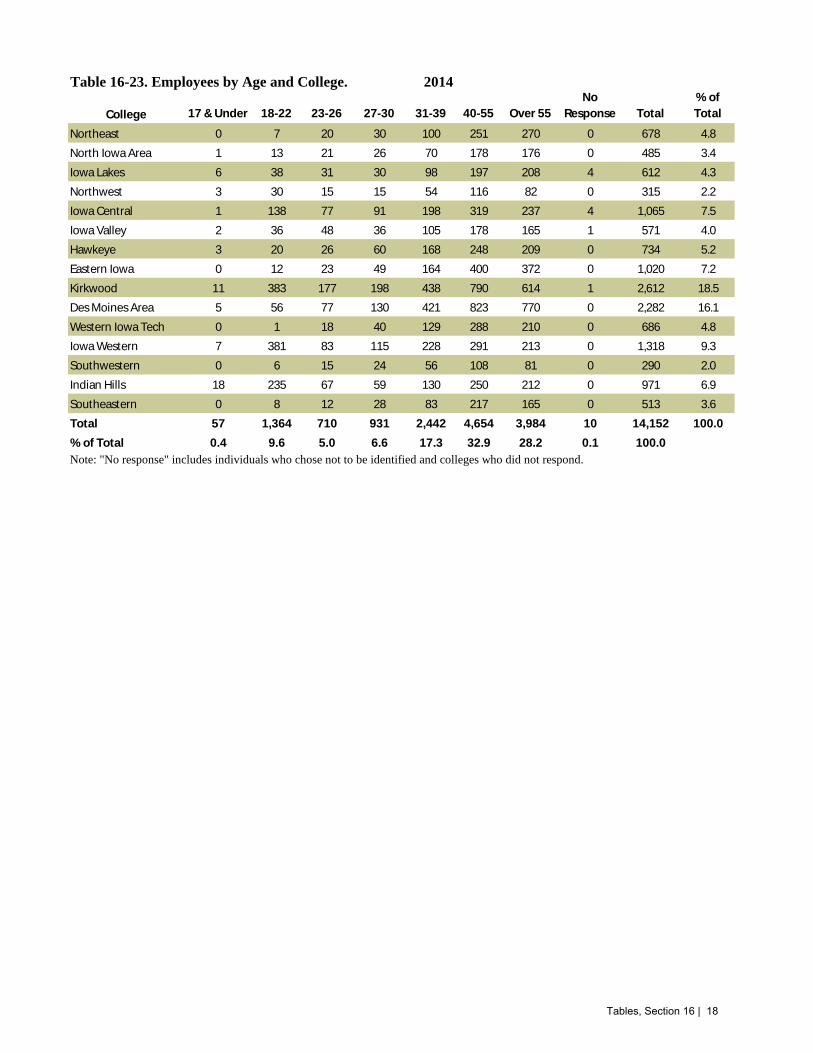
Table 16-23. Employees by Age and College. 2014
College 17 & Under 18-22 23-26 27-30 31-39 40-55 Over 55
No
Response Total
% of
Total
Northeast 0 7 20 30 100 251 270 0 678 4.8
North Iowa Area 1 13 21 26 70 178 176 0 485 3.4
Iowa Lakes 6 38 31 30 98 197 208 4 612 4.3
Northwest 3 30 15 15 54 116 82 0 315 2.2
Iowa Central 1 138 77 91 198 319 237 4 1,065 7.5
Iowa Valley 2 36 48 36 105 178 165 1 571 4.0
Hawkeye 3 20 26 60 168 248 209 0 734 5.2
Eastern Iowa 0 12 23 49 164 400 372 0 1,020 7.2
Kirkwood 11 383 177 198 438 790 614 1 2,612 18.5
Des Moines Area 5 56 77 130 421 823 770 0 2,282 16.1
Western Iowa Tech 0 1 18 40 129 288 210 0 686 4.8
Iowa Western 7 381 83 115 228 291 213 0 1,318 9.3
Southwestern 0 6 15 24 56 108 81 0 290 2.0
Indian Hills 18 235 67 59 130 250 212 0 971 6.9
Southeastern 0 8 12 28 83 217 165 0 513 3.6
Total 57 1,364 710 931 2,442 4,654 3,984 10 14,152 100.0
% of Total 0.4 9.6 5.0 6.6 17.3 32.9 28.2 0.1 100.0
Note: "No response" includes individuals who chose not to be identified and colleges who did not respond.
Tables, Section 16 | 18
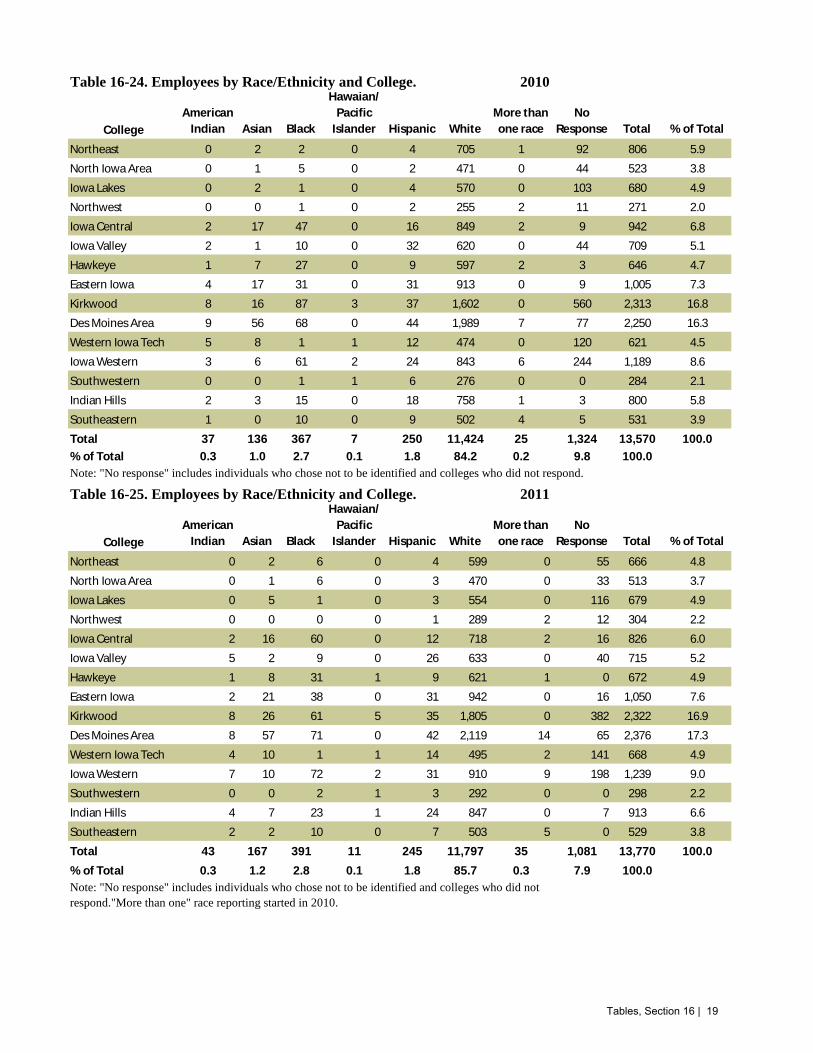
Table 16-24. Employees by Race/Ethnicity and College. 2010
College
American
Indian Asian Black
Hawaian/
Pacific
Islander Hispanic White
More than
one race
No
Response Total % of Total
Northeast 0 2 2 0 4 705 1 92 806 5.9
North Iowa Area 0 1 5 0 2 471 0 44 523 3.8
Iowa Lakes 0 2 1 0 4 570 0 103 680 4.9
Northwest 0 0 1 0 2 255 2 11 271 2.0
Iowa Central 2 17 47 0 16 849 2 9 942 6.8
Iowa Valley 2 1 10 0 32 620 0 44 709 5.1
Hawkeye 1 7 27 0 9 597 2 3 646 4.7
Eastern Iowa 4 17 31 0 31 913 0 9 1,005 7.3
Kirkwood 8 16 87 3 37 1,602 0 560 2,313 16.8
Des Moines Area 9 56 68 0 44 1,989 7 77 2,250 16.3
Western Iowa Tech 5 8 1 1 12 474 0 120 621 4.5
Iowa Western 3 6 61 2 24 843 6 244 1,189 8.6
Southwestern 0 0 1 1 6 276 0 0 284 2.1
Indian Hills 2 3 15 0 18 758 1 3 800 5.8
Southeastern 1 0 10 0 9 502 4 5 531 3.9
Total 37 136 367 7 250 11,424 25 1,324 13,570 100.0
% of Total 0.3 1.0 2.7 0.1 1.8 84.2 0.2 9.8 100.0
Table 16-25. Employees by Race/Ethnicity and College. 2011
College
American
Indian Asian Black
Hawaian/
Pacific
Islander Hispanic White
More than
one race
No
Response Total % of Total
Northeast 0 2 6 0 4 599 0 55 666 4.8
North Iowa Area 0 1 6 0 3 470 0 33 513 3.7
Iowa Lakes 0 5 1 0 3 554 0 116 679 4.9
Northwest 0 0 0 0 1 289 2 12 304 2.2
Iowa Central 2 16 60 0 12 718 2 16 826 6.0
Iowa Valley 5 2 9 0 26 633 0 40 715 5.2
Hawkeye 1 8 31 1 9 621 1 0 672 4.9
Eastern Iowa 2 21 38 0 31 942 0 16 1,050 7.6
Kirkwood 8 26 61 5 35 1,805 0 382 2,322 16.9
Des Moines Area 8 57 71 0 42 2,119 14 65 2,376 17.3
Western Iowa Tech 4 10 1 1 14 495 2 141 668 4.9
Iowa Western 7 10 72 2 31 910 9 198 1,239 9.0
Southwestern 0 0 2 1 3 292 0 0 298 2.2
Indian Hills 4 7 23 1 24 847 0 7 913 6.6
Southeastern 2 2 10 0 7 503 5 0 529 3.8
Total 43 167 391 11 245 11,797 35 1,081 13,770 100.0
% of Total 0.3 1.2 2.8 0.1 1.8 85.7 0.3 7.9 100.0
Note: "No response" includes individuals who chose not to be identified and colleges who did not respond.
Note: "No response" includes individuals who chose not to be identified and colleges who did not
respond."More than one" race reporting started in 2010.
Tables, Section 16 | 19

Table 16-26. Employees by Race/Ethinicity and College. 2012
College
American
Indian Asian Black
Hawaian/
Pacific
Islander Hispanic White
More than
one race
No
Response Total % of Total
Northeast 0 2 4 0 5 647 31 35 724 5.2
North Iowa Area 0 0 6 1 3 442 0 40 492 3.5
Iowa Lakes 0 3 2 1 2 541 2 133 684 4.9
Northwest 1 0 0 0 1 296 1 12 311 2.2
Iowa Central 1 18 91 1 18 922 3 28 1,082 7.7
Iowa Valley 2 4 6 0 27 658 4 40 741 5.3
Hawkeye 1 10 31 1 7 645 1 0 696 5.0
Eastern Iowa 3 21 30 0 30 935 0 17 1,036 7.4
Kirkwood 5 21 36 2 36 1,619 0 299 2,018 14.4
Des Moines Area 5 58 73 0 47 2,148 21 58 2,410 17.2
Western Iowa Tech 5 10 2 1 14 578 2 79 691 4.9
Iowa Western 7 11 72 1 40 973 6 171 1,281 9.1
Southwestern 0 1 0 1 3 293 0 0 298 2.1
Indian Hills 6 9 22 0 33 919 1 1 991 7.1
Southeastern 1 2 12 0 8 531 9 0 563 4.0
Total 37 170 387 9 274 12,147 81 913 14,018 100.0
% of Total 0.3 1.2 2.8 0.1 2.0 86.7 0.6 6.5 100.0
Table 16-27. Employees by Race/Ethinicity and College. 2013
College
American
Indian Asian Black
Hawaian/
Pacific
Islander Hispanic White
More than
one race
No
Response Total % of Total
Northeast 0 2 3 0 4 642 0 4 655 4.5
North Iowa Area 0 1 5 2 1 455 0 42 506 3.4
Iowa Lakes 0 1 5 0 2 577 0 54 639 4.4
Northwest 1 1 0 0 2 301 1 12 318 2.2
Iowa Central 3 12 91 6 19 910 2 22 1,065 7.3
Iowa Valley 5 3 9 1 28 658 4 51 759 5.2
Hawkeye 1 10 37 2 8 672 1 1 732 5.0
Eastern Iowa 4 21 36 0 27 908 0 16 1,012 6.9
Kirkwood 7 49 76 0 64 2,248 12 295 2,751 18.8
Des Moines Area 5 56 77 0 50 2,124 22 49 2,383 16.2
Western Iowa Tech 6 12 4 1 17 621 3 21 685 4.7
Iowa Western 8 13 101 1 58 1,053 10 78 1,322 9.0
Southwestern 0 2 1 1 3 297 0 0 304 2.1
Indian Hills 5 9 28 0 37 916 3 0 998 6.8
Southeastern 1 3 9 0 11 508 10 0 542 3.7
Total 46 195 482 14 331 12,890 68 645 14,671 100.0
% of Total 0.3 1.3 3.3 0.1 2.3 87.9 0.5 4.4 100.0
Note: "No response" includes individuals who chose not to be identified and colleges who did not
respond."More than one" race reporting started in 2010.
Note: "No response" includes individuals who chose not to be identified and colleges who did not
respond."More than one" race reporting started in 2010.
Tables, Section 16 | 20

Table 16-28. Employees by Race/Ethinicity and College. 2014
College
American
Indian Asian Black
Hawaian/
Pacific
Islander Hispanic White
More than
one race
No
Response Total % of Total
Northeast 0 3 4 0 4 659 0 8 678 4.8
North Iowa Area 0 1 7 1 1 432 0 43 485 3.4
Iowa Lakes 0 0 4 0 4 556 1 47 612 4.3
Northwest 1 1 0 1 4 299 1 8 315 2.2
Iowa Central 2 14 81 5 27 913 4 19 1,065 7.5
Iowa Valley 2 4 14 1 27 508 3 12 571 4.0
Hawkeye 1 8 48 0 7 666 4 0 734 5.2
Eastern Iowa 5 27 36 0 32 898 3 19 1,020 7.2
Kirkwood 5 48 80 0 66 2,079 16 318 2,612 18.5
Des Moines Area 5 56 70 0 46 2,062 13 30 2,282 16.1
Western Iowa Tech 8 11 6 0 18 638 2 3 686 4.8
Iowa Western 7 16 95 2 66 1,051 12 69 1,318 9.3
Southwestern 0 4 2 1 1 281 1 0 290 2.0
Indian Hills 2 6 33 0 42 877 3 8 971 6.9
Southeastern 0 3 12 0 10 480 8 0 513 3.6
Total 38 202 492 11 355 12,399 71 584 14,152 100.0
% of Total 0.3 1.4 3.5 0.1 2.5 87.6 0.5 4.1 100.0
Note: "No response" includes individuals who chose not to be identified and colleges who did not respond."More than
one" race reporting started in 2010.
Tables, Section 16 | 21

Table 16-29. Employees by Gender and College.
Male Female Male Female Male Female Male Female Male Female
Northeast 237 569 201 464 218 506 204 451 216 462
North Iowa Area 239 283 221 288 204 285 222 281 204 281
Iowa Lakes 219 432 238 441 228 456 220 419 210 398
Northwest 107 164 130 174 129 182 132 186 135 180
Iowa Central 492 450 471 355 550 532 524 541 519 546
Iowa Valley 271 438 287 428 299 441 317 442 258 313
Hawkeye 250 392 246 426 259 437 271 461 277 457
Eastern Iowa 382 623 397 653 388 648 384 628 375 645
Kirkwood 1,025 1,282 967 1,355 864 1,154 1,164 1,585 1,170 1,442
Des Moines Area 1,003 1,247 1,041 1,335 1,043 1,367 1,028 1,355 1,001 1,281
Western Iowa Tech 258 363 275 393 287 404 290 395 283 403
Iowa Western 521 668 546 693 570 711 578 744 566 752
Southwestern 107 177 111 187 105 193 111 193 109 181
Indian Hills 303 497 339 574 378 613 395 603 416 555
Southeastern 187 344 196 333 211 352 188 354 175 338
Total 5,601 7,929 5,666 8,099 5,733 8,281 6,028 8,638 5,914 8,234
Note: Unknowns were not included in the table. Unknowns: fiscal year 2010, 40 (0.3%); fiscal year 2011, 5 (0.04%); fiscal year 2012, 4 (0.03%); fiscal year 2013, 5 (0.03%); fiscal year
2014, 4 (0.03%).
College
2010 2011 2012 2013 2014
Tables, Section 16 | 22

Table 16-30. Employees by Type of Employment. 2010
Full Time % of All Part Time % of All Temporary % of All Adjunct % of All Total
Northeast 316 36 219 25 118 13 225 26 878
North Iowa Area 253 43 5 1 204 35 120 21 582
Iowa Lakes 242 32 298 40 3 0 209 28 752
Northwest 114 41 68 24 0 0 99 35 281
Iowa Central 322 29 446 40 0 0 356 32 1,124
Iowa Valley 226 27 38 5 401 49 158 19 823
Hawkeye 346 50 65 9 4 1 272 40 687
Eastern Iowa 423 35 107 9 76 6 600 50 1,206
Kirkwood 851 35 303 13 498 21 746 31 2,398
Des Moines Area 820 32 51 2 605 24 1,067 42 2,543
Western Iowa Tech 256 41 55 9 0 0 310 50 621
Iowa Western 444 32 241 17 292 21 424 30 1,401
Southwestern 138 48 31 11 18 6 101 35 288
Indian Hills 415 47 117 13 184 21 160 18 876
Southeastern 258 45 36 6 36 6 241 42 571
Total/% of Total 5,424 36 2,080 14 2,439 16 5,088 34 15,031
Table 16-31. Employees by Type of Employment. 2011
Full Time % of All Part Time % of All Temporary % of All Adjunct % of All Total
Northeast 320 45 178 25 0 0 212 30 710
North Iowa Area 258 44 19 3 199 34 106 18 582
Iowa Lakes 243 32 308 41 0 0 207 27 758
Northwest 128 40 83 26 0 0 113 35 324
Iowa Central 338 31 606 55 0 0 152 14 1,096
Iowa Valley 223 27 39 5 425 51 148 18 835
Hawkeye 314 44 39 6 45 6 309 44 707
Eastern Iowa 422 34 118 10 66 5 636 51 1,242
Kirkwood 968 38 364 14 335 13 864 34 2,531
Des Moines Area 840 31 44 2 663 25 1,137 42 2,684
Western Iowa Tech 249 37 70 10 0 0 349 52 668
Iowa Western 450 31 244 17 316 22 429 30 1,439
Southwestern 139 45 33 11 21 7 113 37 306
Indian Hills 414 43 96 10 293 31 155 16 958
Southeastern 258 40 58 9 24 4 299 47 639
Total/% of Total 5,564 36 2,299 15 2,387 15 5,229 34 15,479
Tables, Section 16 | 23

Table 16-32. Employees by Type of Employment. 2012
Full Time % of All Part Time % of All Temporary % of All Adjunct % of All Total
Northeast 327 43 178 23 67 9 192 25 764
North Iowa Area 235 42 13 2 187 33 124 22 559
Iowa Lakes 246 32 299 39 0 0 228 29 773
Northwest 114 34 98 29 0 0 124 37 336
Iowa Central 339 26 514 40 0 0 428 33 1,281
Iowa Valley 258 29 41 5 441 49 158 18 898
Hawkeye 322 43 34 5 65 9 324 43 745
Eastern Iowa 406 33 103 8 56 5 648 53 1,213
Kirkwood 804 38 503 24 101 5 718 34 2,126
Des Moines Area 855 31 42 2 699 25 1,156 42 2,752
Western Iowa Tech 261 38 77 11 0 0 353 51 691
Iowa Western 458 31 219 15 352 24 452 31 1,481
Southwestern 139 45 34 11 28 9 108 35 309
Indian Hills 411 40 137 13 329 32 154 15 1,031
Southeastern 244 36 68 10 76 11 284 42 672
Total/% of Total 5,419 35 2,360 15 2,401 15 5,451 35 15,631
Table 16-33. Employees by Type of Employment. 2013
Full Time % of All Part Time % of All Temporary % of All Adjunct % of All Total
Northeast 342 49.64 166 24.09 3 0.44 178 25.83 689
North Iowa Area 241 42.88 18 3.20 188 33.45 115 20.46 562
Iowa Lakes 239 35.46 288 42.73 0 0.00 147 21.81 674
Northwest 116 33.72 102 29.65 0 0.00 126 36.63 344
Iowa Central 339 25.76 518 39.36 0 0.00 459 34.88 1,316
Iowa Valley 261 29.23 40 4.48 431 48.26 161 18.03 893
Hawkeye 337 42.71 38 4.82 80 10.14 334 42.33 789
Eastern Iowa 394 33.16 95 8.00 49 4.12 650 54.71 1,188
Kirkwood 1,048 32.37 777 24.00 481 14.85 932 28.78 3,238
Des Moines Area 864 32.74 36 1.36 699 26.49 1,040 39.41 2,639
Western Iowa Tech 255 37.23 72 10.51 0 0.00 358 52.26 685
Iowa Western 429 28.22 235 15.46 389 25.59 467 30.72 1,520
Southwestern 139 43.85 27 8.52 34 10.73 117 36.91 317
Indian Hills 420 40.50 137 13.21 323 31.15 157 15.14 1,037
Southeastern 253 38.80 85 13.04 66 10.12 248 38.04 652
Total/% of Total 5,677 34.32 2,634 15.92 2,743 16.58 5,489 33.18 16,543
Tables, Section 16 | 24

Table 16-34. Employees by Type of Employment. 2014
Full Time % of All Part Time % of All Temporary % of All Adjunct % of All Total
Northeast 345 48.94 168 23.83 3 0.43 189 26.81 705
North Iowa Area 241 45.82 10 1.90 177 33.65 98 18.63 526
Iowa Lakes 231 32.91 276 39.32 0 0.00 195 27.78 702
Northwest 118 35.01 98 29.08 0 0.00 121 35.91 337
Iowa Central 351 27.53 463 36.31 0 0.00 461 36.16 1,275
Iowa Valley 255 39.05 26 3.98 205 31.39 167 25.57 653
Hawkeye 348 44.56 40 5.12 61 7.81 332 42.51 781
Eastern Iowa 415 33.74 114 9.27 45 3.66 656 53.33 1,230
Kirkwood 1,056 33.71 786 25.09 443 14.14 848 27.07 3,133
Des Moines Area 879 34.26 33 1.29 715 27.86 939 36.59 2,566
Western Iowa Tech 258 37.61 65 9.48 0 0.00 363 52.92 686
Iowa Western 456 29.75 238 15.53 408 26.61 431 28.11 1,533
Southwestern 145 46.03 29 9.21 28 8.89 113 35.87 315
Indian Hills 415 41.01 113 11.17 348 34.39 136 13.44 1,012
Southeastern 255 41.20 75 12.12 62 10.02 227 36.67 619
Total/% of Total 5,768 35.89 2,534 15.77 2,495 15.52 5,276 32.83 16,073
Tables, Section 16 | 25

C Cwww.educateiowa.gov/ccpublications/
Top Related