


Languages
Pages
Legal

Chapter 3: Identification of Airport Assets 2018 | Page 3-1
3. CHAPTER THREE: IDENTIFICATION OF AIRPORT ASSETS
INTRODUCTION
A critical function of the State Aviation System Plan (SASP) is establishing baseline data for each planning
variable (for example, airport runway length) that will be analyzed and used to evaluate the overall airport
system. The Identification of Airport Assets Chapter presents the results of an extensive data collection process
utilizing existing Federal Aviation Administration (FAA) and Arizona Department of Transportation (ADOT)
resources as well as new data that was developed through individual airport surveys and follow-up airport staff
interviews.
This chapter details the inventory data collection process and results, and is presented as follows:
1. Inventory Process
2. SASP Airports
3. Existing Airside Facilities
4. Existing Landside Facilities
5. Existing Services
6. Airport Activity
7. Airspace
8. Navigational Aids (NAVAIDs) and Approach Types
9. Airport Planning Documentation
10. Airport Development Constraints
INVENTORY PROCESS
The inventory process started with identification of the airports considered for participation in the plan’s
analysis. Eighty-six airports were initially contacted for participation, including 16 privately-owned, public-use
airports. The 86 airports considered in the 2018 SASP Update are made up of publicly owned and privately
owned airports, including many Tribal airports.
To initiate the data collection efforts, an Airport Inventory and Data Survey Form was prepared identifying all
the essential data points required to evaluate the system. These data points included those necessary to
measure the system’s performance as documented in a previous chapter. The inventory forms were pre-
populated with data available in ADOT Aeronautics’ Airport System Manager (ASM) to aid in the completion of
the forms. The ASM is a database maintained by ADOT Aeronautics that details airport facilities within the state.
Letters were distributed to airport representatives to both identify the purpose of the study and provide a hard
copy of the pre-populated form. Follow-up phone calls and emails were conducted to further explain the
purpose of the study and to schedule site visits with each airport’s representative (in most cases, the airport
manager served as its representative). During April and May 2017, airport site visits were conducted throughout
Arizona. During the on-site visit, the inventory forms were thoroughly reviewed with the airport representatives
for accuracy and additional input.
Chapter 3: Identification of Airport Assets 2018 | Page 3-2
As supplements to the inventory form and on-site visits, the following sources were gathered directly from the
airport or FAA and examined for a more in-depth analysis of the airports and the system:
1. FAA Terminal Area Forecasts (TAFs)
2. FAA 5010 forms for individual airports
3. Airport master plans (MPs)
4. Airport layout plans (ALPs)
5. FAA’s Air Traffic Activity Data System (ATADS)
The following data were collected (as applicable) from the airport via the Inventory and Data Survey Form, on-
site visits, additional correspondence with airport representatives, and other available sources:
1. General airport information (e.g., sponsor name, contact information, airport website, three-letter
identifier code)
2. Airside facilities (e.g., runways, taxiways)
3. Aviation services (e.g., fuel, transient hangars, maintenance)
4. Landing aids (e.g., instrument approach procedures [IAP], approach light systems [ALS])
5. Weather/communication facilities
6. Approach minima and protection standards
7. Scheduled airline activity
8. Landside facilities (e.g., terminal building, aircraft storage, utilities, parking)
9. Airport activity (e.g., airport operations, operational mix, passenger enplanements, based aircraft, fleet
mix, critical aircraft)
10. Type of operations (e.g., recreational, corporate/business, air cargo, law enforcement/U.S. Border Patrol
[USBP], military, flight training, forest firefighting, air shows, air ambulance)
11. Unique users dependent on the airport
12. Existing airport plans and studies (e.g., airport MPs, ALPs, noise contours, emergency plans, economic
impacts)
13. Future needs and development plans, including proposed capital improvements
14. Development constraints
15. Security measures (e.g., fencing, lighting, self-inspections)
16. Land use/zoning surrounding or affecting the airport
17. Airport-specific ordinances
18. Community/municipality relations
All collected data is used in the subsequent evaluation of the Arizona airport system. Key data elements are
summarized in this chapter.
Chapter 3: Identification of Airport Assets 2018 | Page 3-3
SASP AIRPORTS
As previously identified, 86 airports were considered for participation in the SASP Update and comprising the
system of airports or SASP airports. While contact was made at 86 airports, airport site visits were only
conducted at 80 facilities including publicly owned, public-use and privately owned, public-use. These include all
12 public-use Tribal airports. These included all airports included in the FAA’s latest National Plan of Integrated
Airport Systems (NPIAS) and others that have historically been considered part of ADOT’s system of airports.1
The 80 airports which received site visits are categorized in Table 1.
Table 1. Airports Surveyed
Airport Classifications Number of Airports
Surveyed
Commercial Service 11
NPIAS – General Aviation (GA) 48
Non-NPIAS – GA 21
Total 80
Sources: 2017-2021 NPIAS
While FAA terminology is used for the most part throughout the SASP Update, the use of “commercial service”
in the context of the SASP Update refers to those airports that had scheduled commercial airline service as of
2017. The FAA’s latest NPIAS identifies 10 commercial service airports. Of these 10, nine are primary commercial
service and Ernest A. Love Field (Prescott) is identified as a non-primary commercial service airport. Show Low
Regional is identified by the NPIAS as a non-primary GA airport, but has scheduled commercial airline service
and is therefore identified as commercial service in the SASP Update. For all subsequent tables, 11 airports are
included in the commercial service category, with the remaining airports categorized as GA with no delineation
between those that are included in the NPIAS and those that are not.
Private airports are currently ineligible to receive state funding and many of these airports expressed that they
were not interested in being part of the state airport system. Through discussion with ADOT and the Project
Advisory Committee (PAC), it was determined that only airports eligible for state funding should be included in
the state airport system and referred to as SASP airports. Eligible airports were defined as all public-use airports
owned by a political subdivision of the state or Tribal government. It should be noted that there are two airports
owned by the National Park Service (NPS) which is not a political subdivision. Using this definition, the system
would comprise 68 airports. Double Circle Ranch Airport (Z66) was the only publicly owned airport that declined
participation due to low usage.2 Therefore, the final number of airports included in the 2018 SASP Update was
determined to be 67.
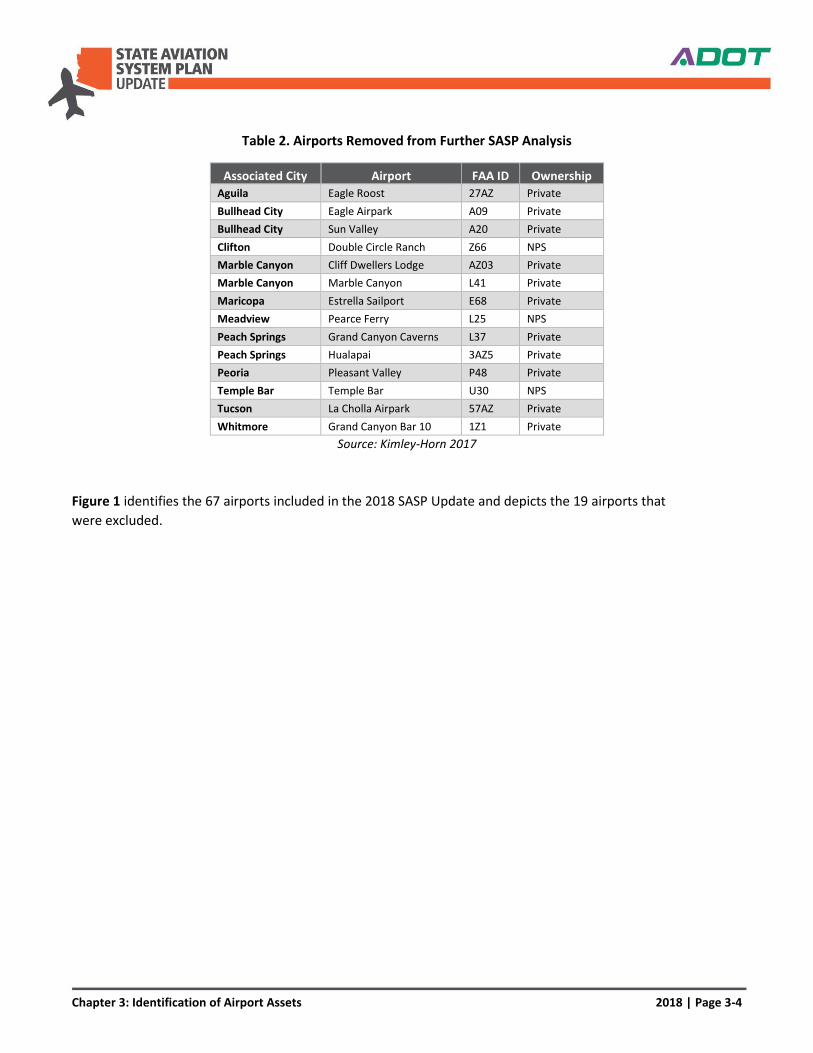
The 12 privately owned airports and two NPS airports removed from further analysis are presented in Table 2.
While these airports were removed from the study, they will continue to serve a role in the system by
accommodating various aviation users. A reference table containing the airport codes, airport name, and
associated city name can be found in Appendix B.
1 FAA, Report to Congress, National Plan of Integrated Airport Systems 2017-2021. 2 Owned by the U.S. Forest Service, Double Circle Ranch is a dirt airstrip used approximately twice per year by the agency.
Chapter 3: Identification of Airport Assets 2018 | Page 3-4
Table 2. Airports Removed from Further SASP Analysis
Associated City Airport FAA ID Ownership
Aguila Eagle Roost 27AZ Private
Bullhead City Eagle Airpark A09 Private
Bullhead City Sun Valley A20 Private
Clifton Double Circle Ranch Z66 NPS
Marble Canyon Cliff Dwellers Lodge AZ03 Private
Marble Canyon Marble Canyon L41 Private
Maricopa Estrella Sailport E68 Private
Meadview Pearce Ferry L25 NPS
Peach Springs Grand Canyon Caverns L37 Private
Peach Springs Hualapai 3AZ5 Private
Peoria Pleasant Valley P48 Private
Temple Bar Temple Bar U30 NPS
Tucson La Cholla Airpark 57AZ Private
Whitmore Grand Canyon Bar 10 1Z1 Private
Source: Kimley-Horn 2017
Figure 1 identifies the 67 airports included in the 2018 SASP Update and depicts the 19 airports that
were excluded.
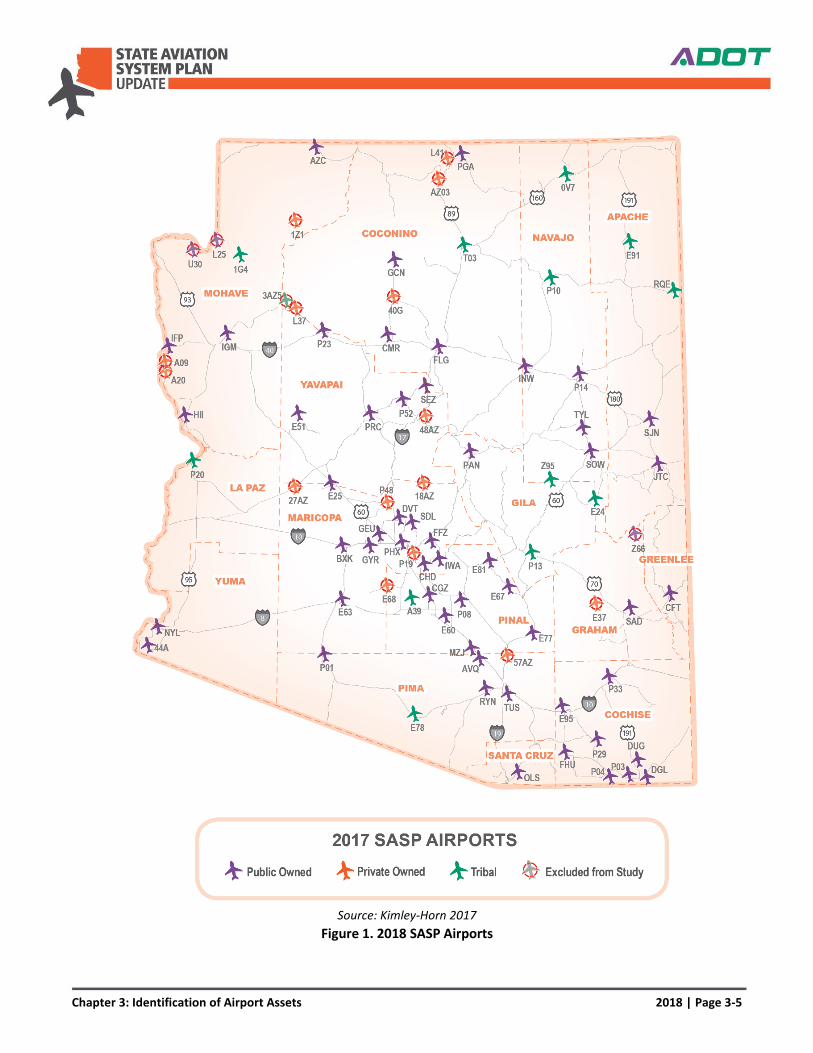
Chapter 3: Identification of Airport Assets 2018 | Page 3-5
Source: Kimley-Horn 2017
Figure 1. 2018 SASP Airports
Chapter 3: Identification of Airport Assets 2018 | Page 3-6
EXISTING AIRPORT FACILITIES
The SASP Update inventory effort included the identification of airport facilities at system airports. Airport
facilities are categorized by airside facilities primarily comprising runways and taxiways (standards based on the
airport reference code [ARC]) and landside facilities including aircraft parking and storage, fuel, and terminal
buildings.
Existing Airside Facilities
The following sections detail the most significant airside facilities available at airports in the Arizona system.
Runway Summary
Of the 109 runways in the Arizona airport system, there are six runways over 10,000 feet. These are located at
Yuma International (longest runway measuring 13,000 feet), Sierra Vista Municipal, Tucson International,
Phoenix Mesa-Gateway, and two at Phoenix Sky Harbor International. The shortest runways in the system are
located at Bisbee Municipal, Rolle Airfield, and Page Municipal (shortest measuring 2,201 feet as a secondary
runway). Sixty-three runways measure over 5,000 feet in length, which is significant because most 5,000-foot-
long runways are considered to be of sufficient length to accommodate many corporate aircraft. Twenty-six
airports in the system have multiple runways.
The FAA recognizes three types of runway lighting: High, Medium, and Low Intensity Runway Lights, respectively
referred to as HIRL, MIRL, and LIRL. Runway lighting is necessary for night-time operations and is present at 91
percent (64) of Arizona’s system airports. Of the 109 runways in the Arizona airport system, 12 runways have
HIRLs, 71 runways have MIRLs, 4 runways have LIRLs, and 24 runways do not have lights. Polacca Airport has
non-standard lighting (NSTD) which has been identified as solar powered runway edge lighting.
Airport Reference Code Summary
The FAA classifies airports by an ARC which subsequently drives the overall planning and design criteria for
airports. Establishing an ARC starts with selecting a “critical aircraft” or “design aircraft” that uses, or is expected
to use, the runway. That design aircraft determines the Runway Design Code (RDC) that reflects the design
standard for the runway. The ARC signifies the airport’s highest RDC, minus the third (visibility) component of
the RDC.3 An airport’s critical aircraft can reflect either a specific aircraft model or a grouping of aircraft with
similar characteristics considered collectively.
The ARC classification system is based on groupings of aircraft types relative to their operating performance and
geometric characteristics. It is comprised of an alpha-numeric identifier representing the Aircraft Approach
Category (AAC) and Airplane Design Group (ADG). The AAC reflects the approach speed of the aircraft, and the
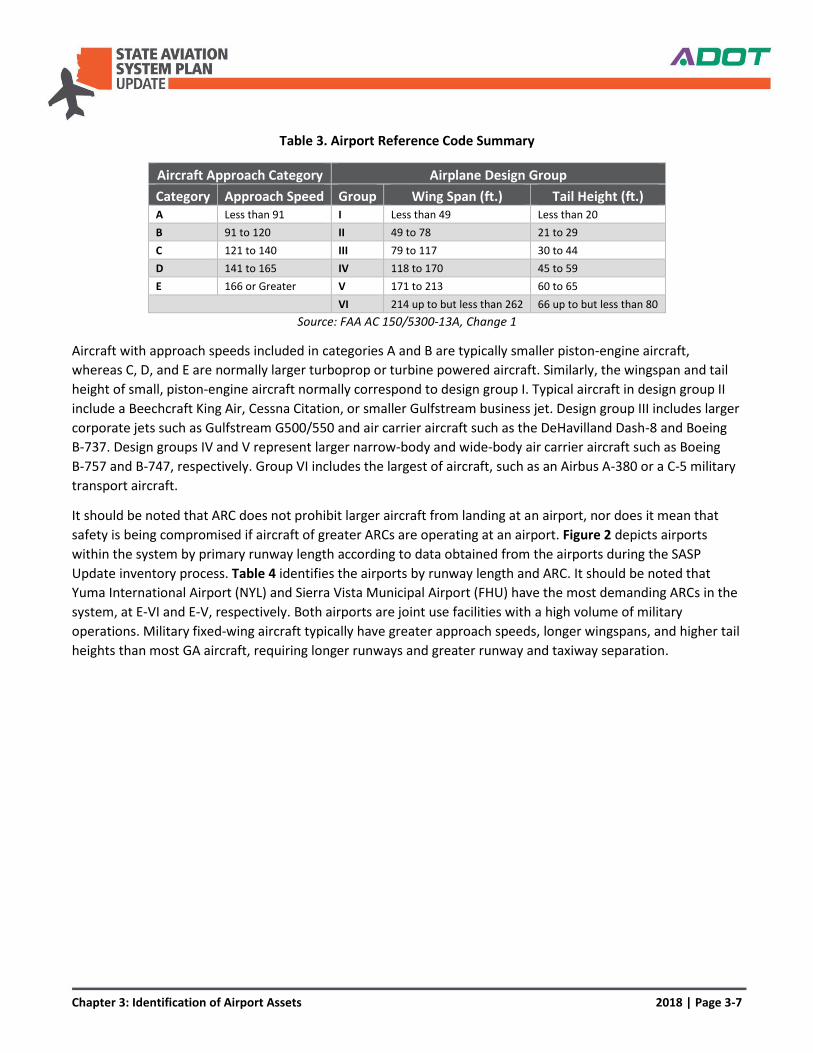
ADG reflects the aircraft’s wingspan and tail height. The classifications are summarized in Table 3. It should be
noted that both airports and aircraft can be referred to by these characteristics.
3 FAA AC 150/5300-13A, Change 1, Airport Design
Chapter 3: Identification of Airport Assets 2018 | Page 3-7
Table 3. Airport Reference Code Summary
Aircraft Approach Category Airplane Design Group
Category Approach Speed Group Wing Span (ft.) Tail Height (ft.) A Less than 91 I Less than 49 Less than 20
B 91 to 120 II 49 to 78 21 to 29
C 121 to 140 III 79 to 117 30 to 44
D 141 to 165 IV 118 to 170 45 to 59
E 166 or Greater V 171 to 213 60 to 65
VI 214 up to but less than 262 66 up to but less than 80
Source: FAA AC 150/5300-13A, Change 1
Aircraft with approach speeds included in categories A and B are typically smaller piston-engine aircraft,
whereas C, D, and E are normally larger turboprop or turbine powered aircraft. Similarly, the wingspan and tail
height of small, piston-engine aircraft normally correspond to design group I. Typical aircraft in design group II
include a Beechcraft King Air, Cessna Citation, or smaller Gulfstream business jet. Design group III includes larger
corporate jets such as Gulfstream G500/550 and air carrier aircraft such as the DeHavilland Dash-8 and Boeing
B-737. Design groups IV and V represent larger narrow-body and wide-body air carrier aircraft such as Boeing
B-757 and B-747, respectively. Group VI includes the largest of aircraft, such as an Airbus A-380 or a C-5 military
transport aircraft.
It should be noted that ARC does not prohibit larger aircraft from landing at an airport, nor does it mean that
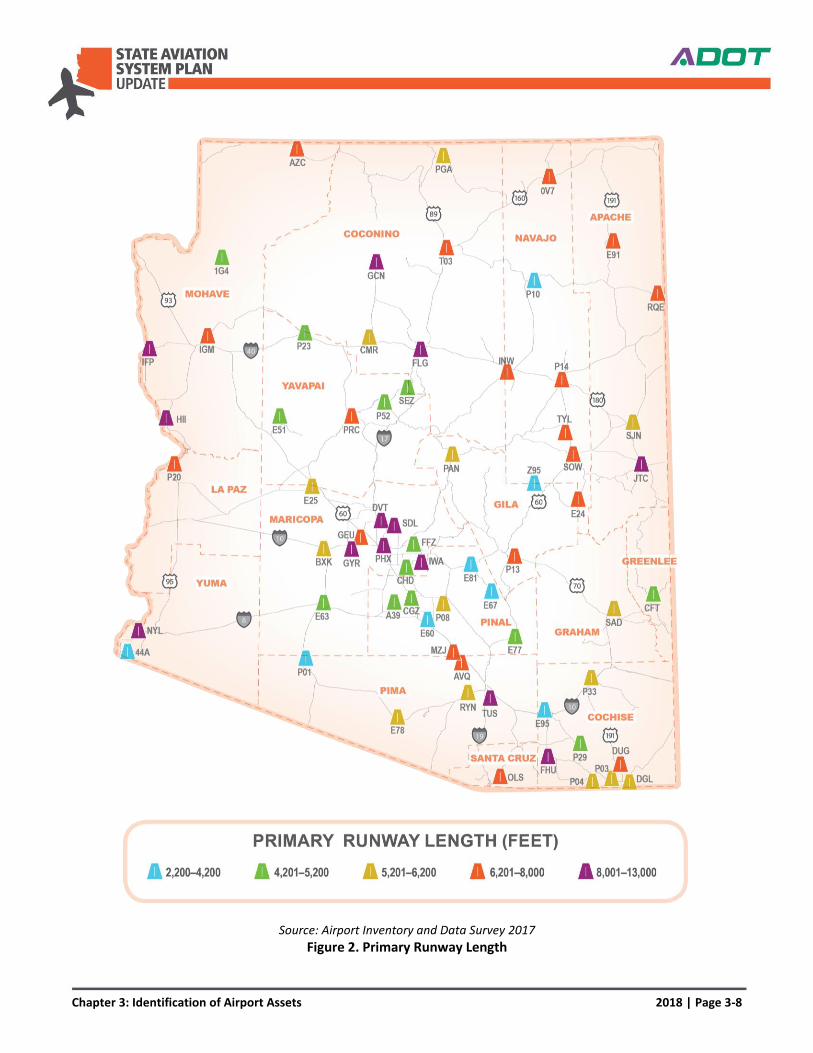
safety is being compromised if aircraft of greater ARCs are operating at an airport. Figure 2 depicts airports
within the system by primary runway length according to data obtained from the airports during the SASP
Update inventory process. Table 4 identifies the airports by runway length and ARC. It should be noted that
Yuma International Airport (NYL) and Sierra Vista Municipal Airport (FHU) have the most demanding ARCs in the
system, at E-VI and E-V, respectively. Both airports are joint use facilities with a high volume of military
operations. Military fixed-wing aircraft typically have greater approach speeds, longer wingspans, and higher tail
heights than most GA aircraft, requiring longer runways and greater runway and taxiway separation.
Chapter 3: Identification of Airport Assets 2018 | Page 3-8
Source: Airport Inventory and Data Survey 2017
Figure 2. Primary Runway Length
Chapter 3: Identification of Airport Assets 2018 | Page 3-9
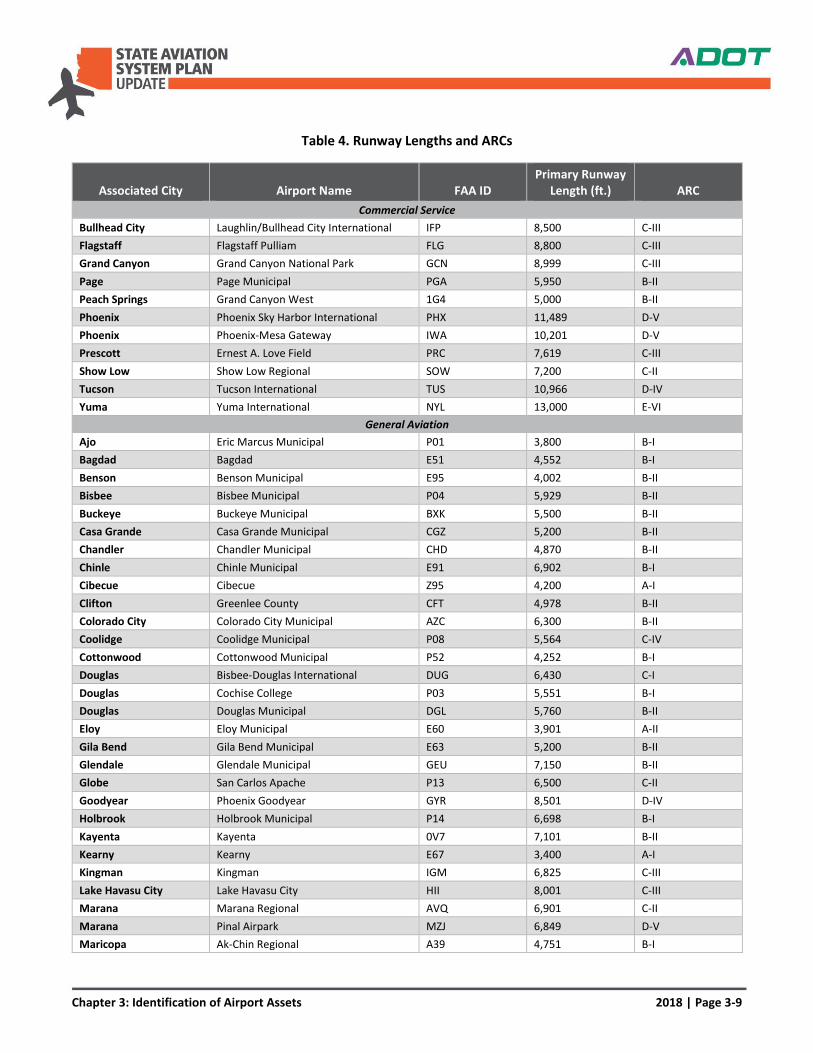
Table 4. Runway Lengths and ARCs
Associated City Airport Name FAA ID Primary Runway
Length (ft.) ARC
Commercial Service Bullhead City Laughlin/Bullhead City International IFP 8,500 C-III
Flagstaff Flagstaff Pulliam FLG 8,800 C-III
Grand Canyon Grand Canyon National Park GCN 8,999 C-III
Page Page Municipal PGA 5,950 B-II
Peach Springs Grand Canyon West 1G4 5,000 B-II
Phoenix Phoenix Sky Harbor International PHX 11,489 D-V
Phoenix Phoenix-Mesa Gateway IWA 10,201 D-V
Prescott Ernest A. Love Field PRC 7,619 C-III
Show Low Show Low Regional SOW 7,200 C-II
Tucson Tucson International TUS 10,966 D-IV
Yuma Yuma International NYL 13,000 E-VI
General Aviation
Ajo Eric Marcus Municipal P01 3,800 B-I
Bagdad Bagdad E51 4,552 B-I
Benson Benson Municipal E95 4,002 B-II
Bisbee Bisbee Municipal P04 5,929 B-II
Buckeye Buckeye Municipal BXK 5,500 B-II
Casa Grande Casa Grande Municipal CGZ 5,200 B-II
Chandler Chandler Municipal CHD 4,870 B-II
Chinle Chinle Municipal E91 6,902 B-I
Cibecue Cibecue Z95 4,200 A-I
Clifton Greenlee County CFT 4,978 B-II
Colorado City Colorado City Municipal AZC 6,300 B-II
Coolidge Coolidge Municipal P08 5,564 C-IV
Cottonwood Cottonwood Municipal P52 4,252 B-I
Douglas Bisbee-Douglas International DUG 6,430 C-I
Douglas Cochise College P03 5,551 B-I
Douglas Douglas Municipal DGL 5,760 B-II
Eloy Eloy Municipal E60 3,901 A-II
Gila Bend Gila Bend Municipal E63 5,200 B-II
Glendale Glendale Municipal GEU 7,150 B-II
Globe San Carlos Apache P13 6,500 C-II
Goodyear Phoenix Goodyear GYR 8,501 D-IV
Holbrook Holbrook Municipal P14 6,698 B-I
Kayenta Kayenta 0V7 7,101 B-II
Kearny Kearny E67 3,400 A-I
Kingman Kingman IGM 6,825 C-III
Lake Havasu City Lake Havasu City HII 8,001 C-III
Marana Marana Regional AVQ 6,901 C-II
Marana Pinal Airpark MZJ 6,849 D-V
Maricopa Ak-Chin Regional A39 4,751 B-I
Chapter 3: Identification of Airport Assets 2018 | Page 3-10
Associated City Airport Name FAA ID Primary Runway
Length (ft.) ARC
Mesa Falcon Field FFZ 5,101 B-II
Nogales Nogales OLS 7,199 C-II
Parker Avi Suquilla P20 6,250 C-II
Payson Payson PAN 5,504 B-I
Phoenix Phoenix Deer Valley DVT 8,196 C-II
Polacca Polacca P10 4,200 A-I
Safford Safford Regional SAD 6,006 B-II
San Luis Rolle Airfield 44A 2,800 B-I
San Manuel San Manuel E77 4,207 B-I
Scottsdale Scottsdale SDL 8,249 B-II
Sedona Sedona SEZ 5,132 B-II
Seligman Seligman P23 4,800 B-I
Sells Sells E78 5,830 A-I
Sierra Vista Sierra Vista Municipal-Libby Army Airfield
FHU 12,001 E-V
Springerville Springerville Municipal JTC 8,422 B-II
St. Johns St. Johns Industrial Air Park SJN 5,322 B-II
Superior Superior E81 3,250 B-II
Taylor Taylor TYL 7,001 B-II
Tombstone Tombstone Municipal P29 4,430 A-I
Tuba City Tuba City T03 6,230 B-II
Tucson Ryan Field RYN 5,500 B-II
Whiteriver Whiteriver E24 6,350 B-II
Wickenburg Wickenburg Municipal E25 6,101 B-II
Willcox Cochise County P33 6,095 B-II
Williams H.A. Clark Memorial Field CMR 6,000 B-II
Window Rock Window Rock RQE 7,000 B-II
Winslow Winslow-Lindbergh Regional INW 7,100 C-II
Source: Airport Inventory and Data Survey 2017
Chapter 3: Identification of Airport Assets 2018 | Page 3-11
Taxiway Summary
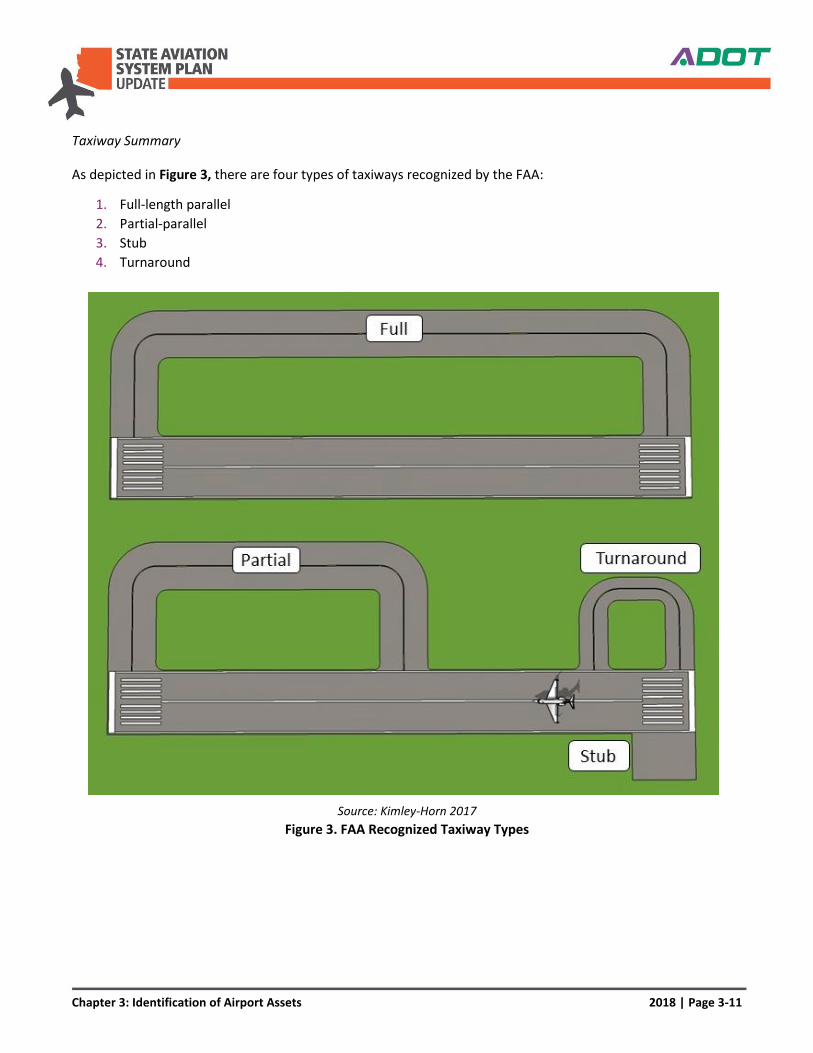
As depicted in Figure 3, there are four types of taxiways recognized by the FAA:
1. Full-length parallel
2. Partial-parallel
3. Stub
4. Turnaround
Source: Kimley-Horn 2017
Figure 3. FAA Recognized Taxiway Types
Chapter 3: Identification of Airport Assets 2018 | Page 3-12
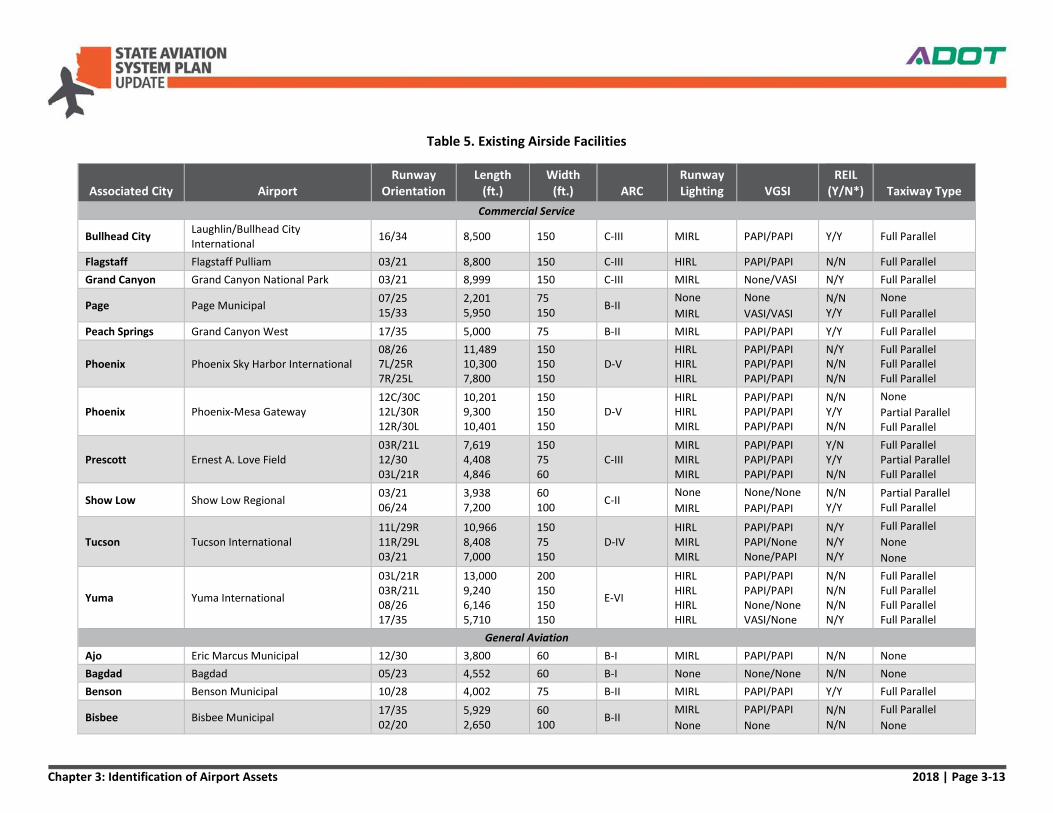
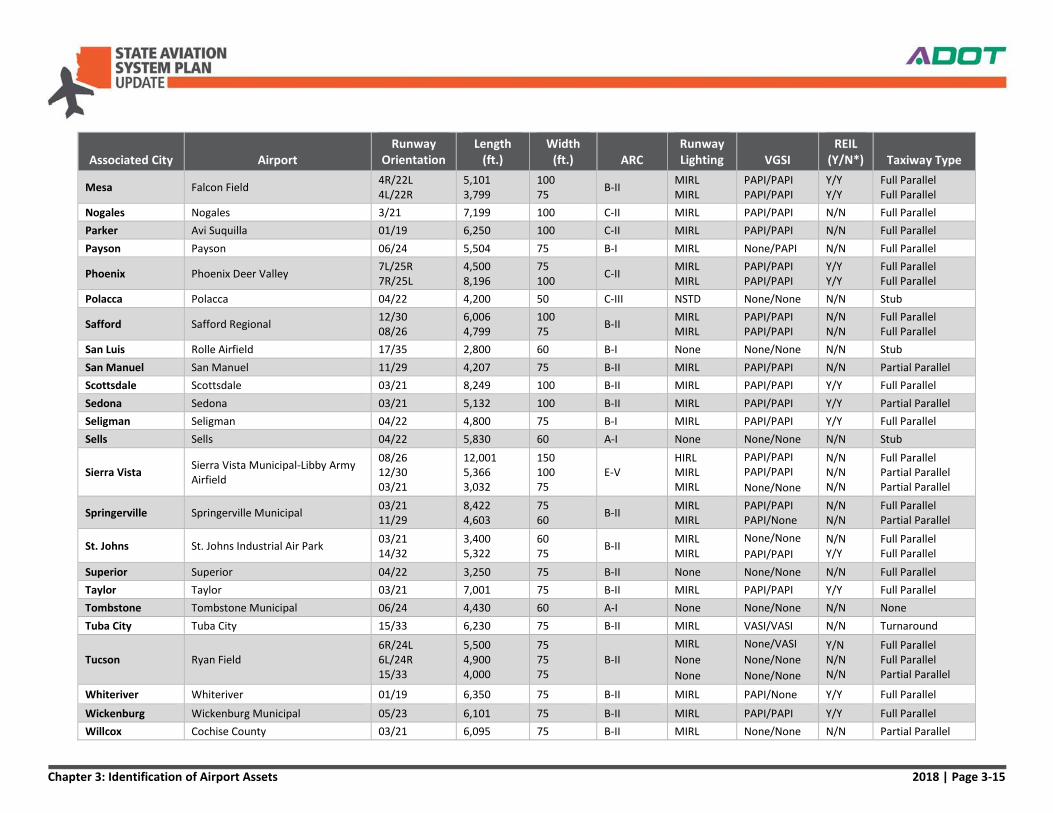
The Arizona airport system comprises 65 full-length parallel, 20 partial-parallel, seven stub, and 17 turnaround
taxiways which accounts for airports with multiple taxiways. The taxiway breakdown by airport is depicted in
Table 5.
Visual Aids Summary
A Visual Glide Slope Indicator (VGSI) is a system of lights on the runway end that provides vertical guidance to
the pilot on final approach to help determine if the aircraft is approaching too high, too low, or on course.
VGSIs, such as Precision Approach Path Indicators (PAPIs), Visual Approach Slope Indicators (VASIs), and Runway
End Identifier Lights (REILs), provide the basic means to transition from instrument flight to visual flight for
landing. Operational requirements dictate the sophistication and configuration of the approach light system for
a particular runway.
1. PAPI. Provide vertical-approach slope guidance to aircraft during approach to landing. PAPIs consist of a
single row of either two or four lights normally installed on the left side of the runway. PAPIs have an
effective visual range of approximately five miles during the day and up to 20 miles at night. PAPIs
radiate a directional pattern of high-intensity red and white focused light beams that indicate whether
the pilot is “on-path” if the pilot sees an equal number of white lights and red lights, “above path” if the
pilot sees more white than red lights, or “below path” if the pilot sees more red than white lights. The
four types of PAPIs include:
P2L. Two-light PAPI on left side of runway
P2R. Two-light PAPI on right side of runway
P4L. Four-light PAPI on left side of runway
P4R. Four-light PAPI on right side of runway
2. VASI. Provide visual vertical approach slope guidance to aircraft during approach to landing by radiating
a directional pattern of high-intensity red and white focused light beams. These beams indicate if the
pilot is “on path” (pilot sees red/white), “above path” (pilot sees white/white), and “below path” (pilot
sees red/red). Some airports serving large aircraft have three-bar VASIs that provide two visual glide
paths to the same runway. The two types of VASIs include:
V2L. Two-box VASI on left side of runway
V4L. Four-box VASI on left side of runway
3. REIL. Provide rapid and positive identification of the end of the runway. The system consists of two
synchronized, unidirectional flashing lights. The lights are positioned on each corner of the runway
landing threshold facing the approach area and aimed at a 10 to 15-degree angle. The REIL provides
three intensity settings with an approximate range of three miles in the daylight and twenty miles at
night.
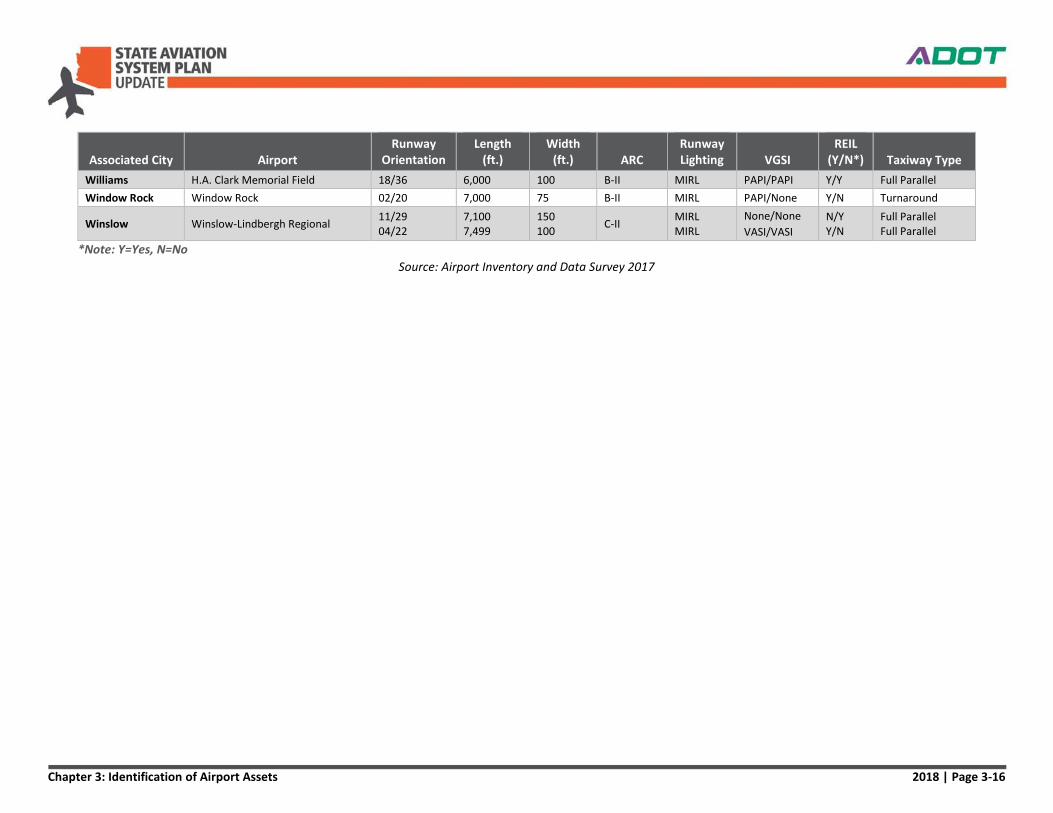
Table 5 summarizes the runway orientation, runway dimensions, ARC, type of runway lighting, availability of
VGSIs and REILs, and taxiway type in the Arizona airport system by FAA NPIAS category.
Chapter 3: Identification of Airport Assets 2018 | Page 3-13
Table 5. Existing Airside Facilities
Associated City Airport Runway
Orientation Length
(ft.) Width
(ft.) ARC Runway Lighting VGSI
REIL (Y/N*) Taxiway Type
Commercial Service
Bullhead City Laughlin/Bullhead City International
16/34 8,500 150 C-III MIRL PAPI/PAPI Y/Y Full Parallel
Flagstaff Flagstaff Pulliam 03/21 8,800 150 C-III HIRL PAPI/PAPI N/N Full Parallel
Grand Canyon Grand Canyon National Park 03/21 8,999 150 C-III MIRL None/VASI N/Y Full Parallel
Page Page Municipal 07/25 15/33
2,201 5,950
75 150
B-II None
MIRL
None
VASI/VASI
N/N Y/Y
None
Full Parallel
Peach Springs Grand Canyon West 17/35 5,000 75 B-II MIRL PAPI/PAPI Y/Y Full Parallel
Phoenix Phoenix Sky Harbor International 08/26 7L/25R 7R/25L
11,489 10,300 7,800
150 150 150
D-V HIRL HIRL HIRL
PAPI/PAPI PAPI/PAPI PAPI/PAPI
N/Y N/N N/N
Full Parallel Full Parallel Full Parallel
Phoenix Phoenix-Mesa Gateway 12C/30C 12L/30R 12R/30L
10,201 9,300 10,401
150 150 150
D-V HIRL HIRL MIRL
PAPI/PAPI PAPI/PAPI PAPI/PAPI
N/N Y/Y N/N
None
Partial Parallel Full Parallel
Prescott Ernest A. Love Field 03R/21L 12/30 03L/21R
7,619 4,408 4,846
150 75 60
C-III MIRL MIRL MIRL
PAPI/PAPI PAPI/PAPI PAPI/PAPI
Y/N Y/Y N/N
Full Parallel Partial Parallel Full Parallel
Show Low Show Low Regional 03/21 06/24
3,938 7,200
60 100
C-II None
MIRL
None/None
PAPI/PAPI
N/N Y/Y
Partial Parallel Full Parallel
Tucson Tucson International 11L/29R 11R/29L 03/21
10,966 8,408 7,000
150 75 150
D-IV HIRL MIRL MIRL
PAPI/PAPI PAPI/None None/PAPI
N/Y N/Y N/Y
Full Parallel
None
None
Yuma Yuma International
03L/21R 03R/21L 08/26 17/35
13,000 9,240 6,146 5,710
200 150 150 150
E-VI
HIRL HIRL HIRL HIRL
PAPI/PAPI PAPI/PAPI None/None VASI/None
N/N N/N N/N N/Y
Full Parallel Full Parallel Full Parallel Full Parallel
General Aviation
Ajo Eric Marcus Municipal 12/30 3,800 60 B-I MIRL PAPI/PAPI N/N None
Bagdad Bagdad 05/23 4,552 60 B-I None None/None N/N None
Benson Benson Municipal 10/28 4,002 75 B-II MIRL PAPI/PAPI Y/Y Full Parallel
Bisbee Bisbee Municipal 17/35 02/20
5,929 2,650
60 100
B-II MIRL
None
PAPI/PAPI
None
N/N N/N
Full Parallel
None
Chapter 3: Identification of Airport Assets 2018 | Page 3-14
Associated City Airport Runway
Orientation Length
(ft.) Width
(ft.) ARC Runway Lighting VGSI
REIL (Y/N*) Taxiway Type
Buckeye Buckeye Municipal 17/35 5,500 75 B-II MIRL PAPI/PAPI N/N Full Parallel
Casa Grande Casa Grande Municipal 05/23 5,200 100 B-II MIRL PAPI/PAPI N/N Full Parallel
Chandler Chandler Municipal 04L/22R 04R/22L
4,401 4,870
75 75
B-II MIRL MIRL
PAPI/PAPI PAPI/PAPI
N/N Y/Y
Full Parallel Full Parallel
Chinle Chinle Municipal 18/36 6,902 60 B-I MIRL PAPI/PAPI N/N Turnaround
Cibecue Cibecue 07/25 4,200 100 A-I None None/None N/N None
Clifton Greenlee County 07/25 4,978 75 B-II MIRL PAPI/PAPI N/N Full Parallel
Colorado City Colorado City Municipal 11/29 02/20
6,300 5,100
75 60
B-II MIRL MIRL
PAPI/PAPI PAPI/None
Y/Y N/N
Stub Partial Parallel
Coolidge Coolidge Municipal 05/23 17/35
5,564 3,873
150 75
C-IV MIRL MIRL
PAPI/PAPI
None/None
N/N N/N
Partial Parallel Partial Parallel
Cottonwood Cottonwood Municipal 14/32 4,252 75 B-I MIRL PAPI/PAPI Y/Y Partial Parallel
Douglas Bisbee-Douglas International 08/26 17/35
4,966 6,430
60 100
C-I MIRL
None
None/None
VASI/None
N/N N/N
None
None
Douglas Douglas Municipal 03/21 5,760 75 B-II MIRL PAPI/PAPI N/N Partial Parallel
Douglas Cochise College 05/23 5,551 60 B-I MIRL PAPI/PAPI N/N Full Parallel
Eloy Eloy Municipal 02/20 3,901 75 A-II MIRL PAPI/PAPI Y/Y Full Parallel
Gila Bend Gila Bend Municipal 04/22 5,200 75 B-II MIRL PAPI/PAPI N/N Full Parallel
Glendale Glendale Municipal 01/19 7,150 100 B-II MIRL PAPI/PAPI Y/Y Full Parallel
Globe San Carlos Apache 09/27 6,500 100 C-II MIRL PAPI/PAPI Y/Y Full Parallel
Goodyear Phoenix Goodyear 03/21 8,501 150 D-IV MIRL PAPI/PAPI Y/Y Full Parallel
Holbrook Holbrook Municipal 03/21 11/29
6,698 3,202
75 120
B-I MIRL MIRL
PAPI/PAPI
None/None
Y/Y N/N
Partial Parallel
None
Kayenta Kayenta 05/23 7,101 75 B-II MIRL PAPI/PAPI N/N Turnaround
Kearny Kearny 08/26 3,400 60 A-I None None/None N/N Turnaround
Kingman Kingman 03/21 17/35
6,825 6,725
150 75
C-III MIRL MIRL
PAPI/PAPI PAPI/PAPI
Y/Y N/N
Full Parallel Partial Parallel
Lake Havasu City Lake Havasu City 14/32 8,001 100 C-III MIRL PAPI/PAPI Y/Y Full Parallel
Marana Marana Regional 03/21 12/30
3,892 6,901
75 100
C-II MIRL MIRL
PAPI/PAPI PAPI/PAPI
N/N Y/Y
Full Parallel Full Parallel
Marana Pinal Airpark 12/30 6,849 150 D-V MIRL None/None N/N Full Parallel
Maricopa Ak-Chin Regional 04/22 4,751 50 B-I MIRL None/None N/N Full Parallel
Chapter 3: Identification of Airport Assets 2018 | Page 3-15
Associated City Airport Runway
Orientation Length
(ft.) Width
(ft.) ARC Runway Lighting VGSI
REIL (Y/N*) Taxiway Type
Mesa Falcon Field 4R/22L 4L/22R
5,101 3,799
100 75
B-II MIRL MIRL
PAPI/PAPI PAPI/PAPI
Y/Y Y/Y
Full Parallel Full Parallel
Nogales Nogales 3/21 7,199 100 C-II MIRL PAPI/PAPI N/N Full Parallel
Parker Avi Suquilla 01/19 6,250 100 C-II MIRL PAPI/PAPI N/N Full Parallel
Payson Payson 06/24 5,504 75 B-I MIRL None/PAPI N/N Full Parallel
Phoenix Phoenix Deer Valley 7L/25R 7R/25L
4,500 8,196
75 100
C-II MIRL MIRL
PAPI/PAPI PAPI/PAPI
Y/Y Y/Y
Full Parallel Full Parallel
Polacca Polacca 04/22 4,200 50 C-III NSTD None/None N/N Stub
Safford Safford Regional 12/30 08/26
6,006 4,799
100 75
B-II MIRL MIRL
PAPI/PAPI PAPI/PAPI
N/N N/N
Full Parallel Full Parallel
San Luis Rolle Airfield 17/35 2,800 60 B-I None None/None N/N Stub
San Manuel San Manuel 11/29 4,207 75 B-II MIRL PAPI/PAPI N/N Partial Parallel
Scottsdale Scottsdale 03/21 8,249 100 B-II MIRL PAPI/PAPI Y/Y Full Parallel
Sedona Sedona 03/21 5,132 100 B-II MIRL PAPI/PAPI Y/Y Partial Parallel
Seligman Seligman 04/22 4,800 75 B-I MIRL PAPI/PAPI Y/Y Full Parallel
Sells Sells 04/22 5,830 60 A-I None None/None N/N Stub
Sierra Vista Sierra Vista Municipal-Libby Army Airfield
08/26 12/30 03/21
12,001 5,366 3,032
150 100 75
E-V HIRL MIRL MIRL
PAPI/PAPI PAPI/PAPI
None/None
N/N N/N N/N
Full Parallel Partial Parallel Partial Parallel
Springerville Springerville Municipal 03/21 11/29
8,422 4,603
75 60
B-II MIRL MIRL
PAPI/PAPI PAPI/None
N/N N/N
Full Parallel Partial Parallel
St. Johns St. Johns Industrial Air Park 03/21 14/32
3,400 5,322
60 75
B-II MIRL MIRL
None/None
PAPI/PAPI
N/N Y/Y
Full Parallel Full Parallel
Superior Superior 04/22 3,250 75 B-II None None/None N/N Full Parallel
Taylor Taylor 03/21 7,001 75 B-II MIRL PAPI/PAPI Y/Y Full Parallel
Tombstone Tombstone Municipal 06/24 4,430 60 A-I None None/None N/N None
Tuba City Tuba City 15/33 6,230 75 B-II MIRL VASI/VASI N/N Turnaround
Tucson Ryan Field 6R/24L 6L/24R 15/33
5,500 4,900 4,000
75 75 75
B-II
MIRL
None
None
None/VASI
None/None
None/None
Y/N N/N N/N
Full Parallel Full Parallel Partial Parallel
Whiteriver Whiteriver 01/19 6,350 75 B-II MIRL PAPI/None Y/Y Full Parallel
Wickenburg Wickenburg Municipal 05/23 6,101 75 B-II MIRL PAPI/PAPI Y/Y Full Parallel
Willcox Cochise County 03/21 6,095 75 B-II MIRL None/None N/N Partial Parallel
Chapter 3: Identification of Airport Assets 2018 | Page 3-16
Associated City Airport Runway
Orientation Length
(ft.) Width
(ft.) ARC Runway Lighting VGSI
REIL (Y/N*) Taxiway Type
Williams H.A. Clark Memorial Field 18/36 6,000 100 B-II MIRL PAPI/PAPI Y/Y Full Parallel
Window Rock Window Rock 02/20 7,000 75 B-II MIRL PAPI/None Y/N Turnaround
Winslow Winslow-Lindbergh Regional 11/29 04/22
7,100 7,499
150 100
C-II MIRL MIRL
None/None
VASI/VASI
N/Y Y/N
Full Parallel Full Parallel
*Note: Y=Yes, N=No
Source: Airport Inventory and Data Survey 2017
Chapter 3: Identification of Airport Assets 2018 | Page 3-17
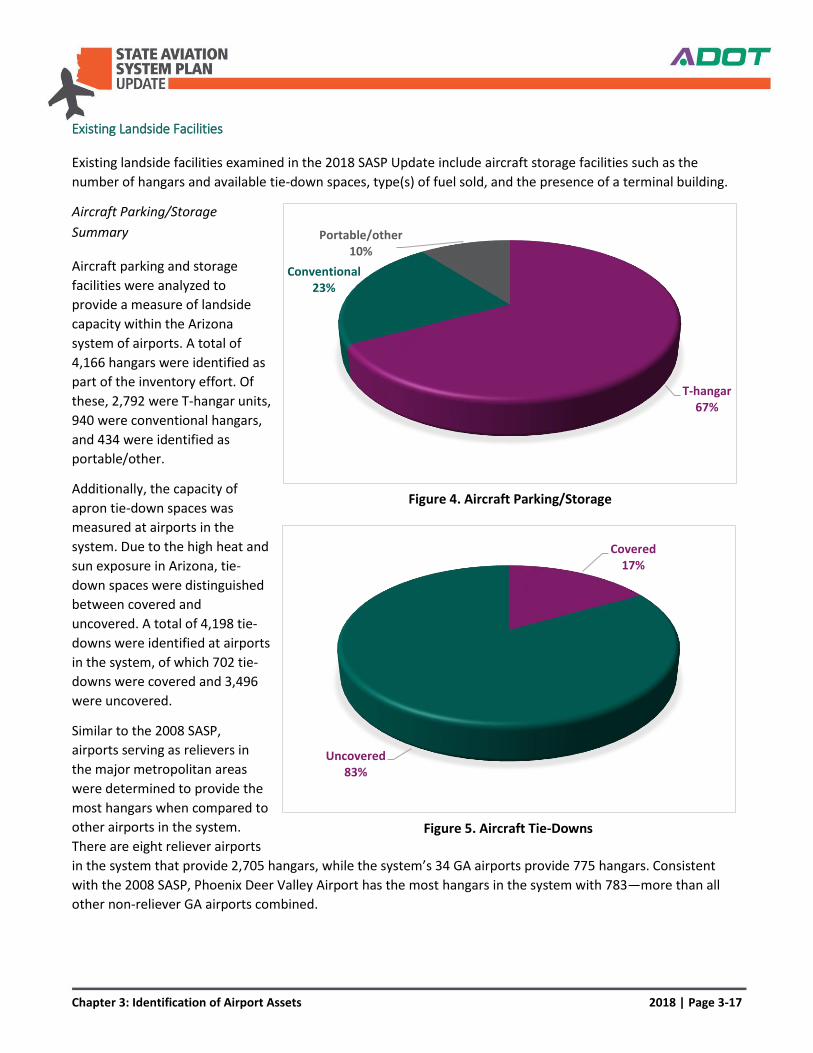
Existing Landside Facilities
Existing landside facilities examined in the 2018 SASP Update include aircraft storage facilities such as the
number of hangars and available tie-down spaces, type(s) of fuel sold, and the presence of a terminal building.
Aircraft Parking/Storage
Summary
Aircraft parking and storage
facilities were analyzed to
provide a measure of landside
capacity within the Arizona
system of airports. A total of
4,166 hangars were identified as
part of the inventory effort. Of
these, 2,792 were T-hangar units,
940 were conventional hangars,
and 434 were identified as
portable/other.
Additionally, the capacity of
apron tie-down spaces was
measured at airports in the
system. Due to the high heat and
sun exposure in Arizona, tie-
down spaces were distinguished
between covered and
uncovered. A total of 4,198 tie-
downs were identified at airports
in the system, of which 702 tie-
downs were covered and 3,496
were uncovered.
Similar to the 2008 SASP,
airports serving as relievers in
the major metropolitan areas
were determined to provide the
most hangars when compared to
other airports in the system.
There are eight reliever airports
in the system that provide 2,705 hangars, while the system’s 34 GA airports provide 775 hangars. Consistent
with the 2008 SASP, Phoenix Deer Valley Airport has the most hangars in the system with 783—more than all
other non-reliever GA airports combined.
T-hangar67%
Conventional23%
Portable/other10%
Covered17%
Uncovered83%
Figure 4. Aircraft Parking/Storage
Figure 5. Aircraft Tie-Downs

Chapter 3: Identification of Airport Assets 2018 | Page 3-18
Fuel Summary
The availability of fuel at airports, and most specifically GA airports, can be one of the most influential factors
driving activity at airports. Fuel sales at GA airports are a substantial component of airport revenues. A total of
54 Arizona airports offer some type of fuel, AvGas, Jet A, or both fuels. Forty-nine airports offer AvGas, 44
airports offer Jet A, and 39 airports offered both AvGas and Jet A. Of the 54 total airports with fuel, 44 are GA
airports. Additionally, Phoenix-Mesa Gateway is the only airport that offers automobile gas (Mogas), which can
be used in some piston aircraft.
Terminal Summary
For this study, a terminal was accounted for if the airport offered any sort of terminal building for GA users or
commercial passengers. Some terminal buildings included minimal services while larger GA, reliever, and
commercial service airports offered pilot’s lounges, phone services, and other amenities. Approximately 62
airports in the system have terminal buildings.
Table 6 details existing landside facilities including total hangars, tie-down apron capacity, fuel availability, and
the presence of a terminal building at airports in the Arizona system.
Chapter 3: Identification of Airport Assets 2018 | Page 3-19
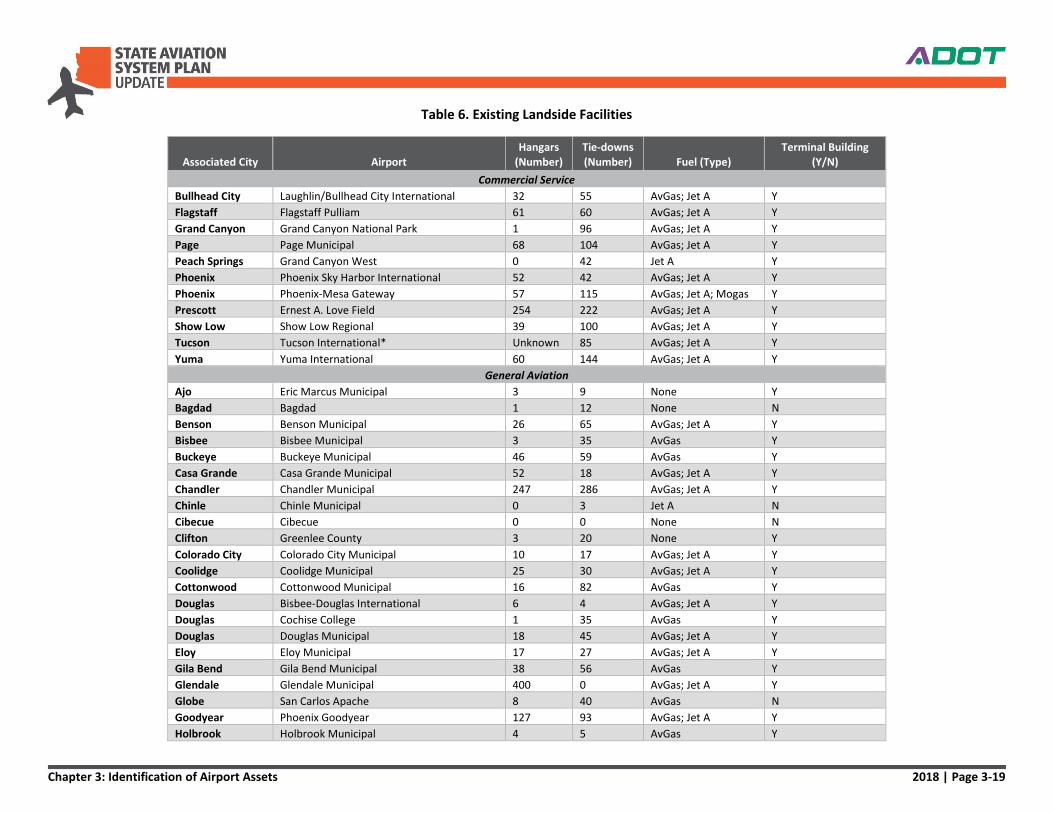
Table 6. Existing Landside Facilities
Associated City Airport Hangars
(Number) Tie-downs (Number) Fuel (Type)
Terminal Building (Y/N)
Commercial Service
Bullhead City Laughlin/Bullhead City International 32 55 AvGas; Jet A Y
Flagstaff Flagstaff Pulliam 61 60 AvGas; Jet A Y
Grand Canyon Grand Canyon National Park 1 96 AvGas; Jet A Y
Page Page Municipal 68 104 AvGas; Jet A Y
Peach Springs Grand Canyon West 0 42 Jet A Y
Phoenix Phoenix Sky Harbor International 52 42 AvGas; Jet A Y
Phoenix Phoenix-Mesa Gateway 57 115 AvGas; Jet A; Mogas Y
Prescott Ernest A. Love Field 254 222 AvGas; Jet A Y
Show Low Show Low Regional 39 100 AvGas; Jet A Y
Tucson Tucson International* Unknown 85 AvGas; Jet A Y
Yuma Yuma International 60 144 AvGas; Jet A Y
General Aviation
Ajo Eric Marcus Municipal 3 9 None Y
Bagdad Bagdad 1 12 None N
Benson Benson Municipal 26 65 AvGas; Jet A Y
Bisbee Bisbee Municipal 3 35 AvGas Y
Buckeye Buckeye Municipal 46 59 AvGas Y
Casa Grande Casa Grande Municipal 52 18 AvGas; Jet A Y
Chandler Chandler Municipal 247 286 AvGas; Jet A Y
Chinle Chinle Municipal 0 3 Jet A N
Cibecue Cibecue 0 0 None N
Clifton Greenlee County 3 20 None Y
Colorado City Colorado City Municipal 10 17 AvGas; Jet A Y
Coolidge Coolidge Municipal 25 30 AvGas; Jet A Y
Cottonwood Cottonwood Municipal 16 82 AvGas Y
Douglas Bisbee-Douglas International 6 4 AvGas; Jet A Y
Douglas Cochise College 1 35 AvGas Y
Douglas Douglas Municipal 18 45 AvGas; Jet A Y
Eloy Eloy Municipal 17 27 AvGas; Jet A Y
Gila Bend Gila Bend Municipal 38 56 AvGas Y
Glendale
Glendale Municipal 400 0 AvGas; Jet A Y
Globe San Carlos Apache 8 40 AvGas N
Goodyear Phoenix Goodyear 127 93 AvGas; Jet A Y
Holbrook Holbrook Municipal 4 5 AvGas Y
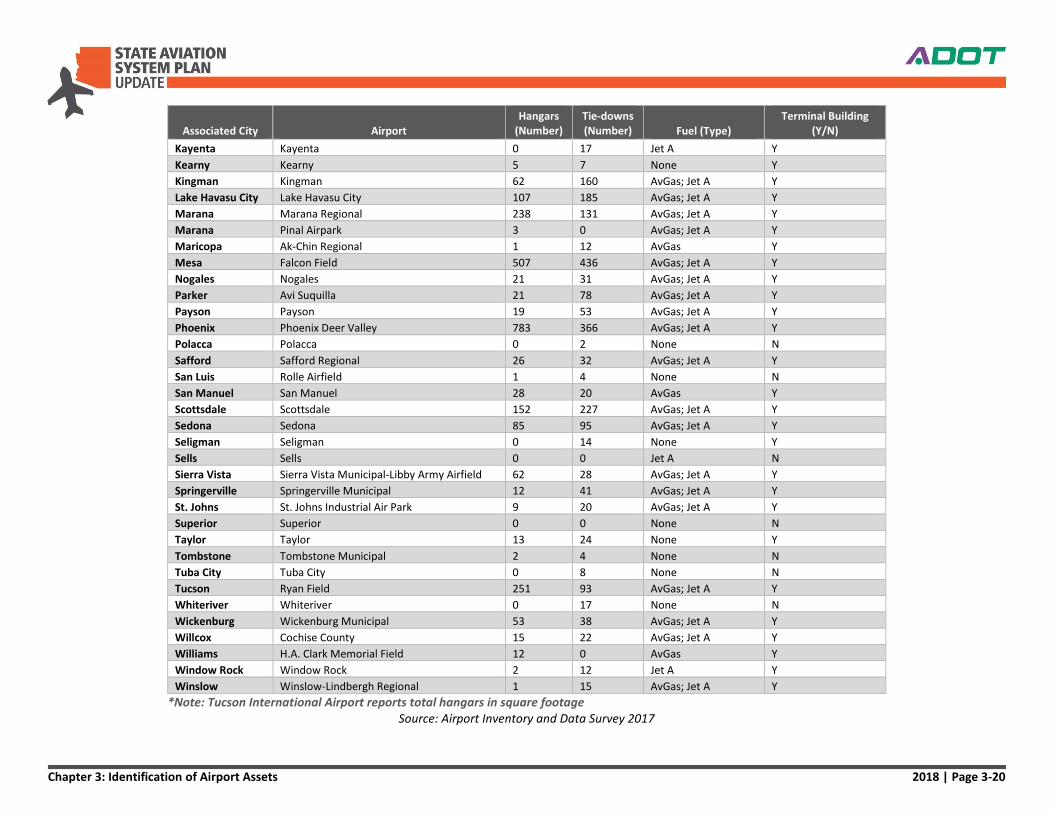
Chapter 3: Identification of Airport Assets 2018 | Page 3-20
Associated City Airport Hangars
(Number) Tie-downs (Number) Fuel (Type)
Terminal Building (Y/N)
Kayenta Kayenta 0 17 Jet A Y
Kearny Kearny 5 7 None Y
Kingman Kingman 62 160 AvGas; Jet A Y
Lake Havasu City Lake Havasu City 107 185 AvGas; Jet A Y
Marana Marana Regional 238 131 AvGas; Jet A Y
Marana Pinal Airpark 3 0 AvGas; Jet A Y
Maricopa Ak-Chin Regional 1 12 AvGas Y
Mesa Falcon Field 507 436 AvGas; Jet A Y
Nogales Nogales 21 31 AvGas; Jet A Y
Parker Avi Suquilla 21 78 AvGas; Jet A Y
Payson Payson 19 53 AvGas; Jet A Y
Phoenix Phoenix Deer Valley 783 366 AvGas; Jet A Y
Polacca Polacca 0 2 None N
Safford Safford Regional 26 32 AvGas; Jet A Y
San Luis Rolle Airfield 1 4 None N
San Manuel San Manuel 28 20 AvGas Y
Scottsdale Scottsdale 152 227 AvGas; Jet A Y
Sedona Sedona 85 95 AvGas; Jet A Y
Seligman Seligman 0 14 None Y
Sells Sells 0 0 Jet A N
Sierra Vista Sierra Vista Municipal-Libby Army Airfield 62 28 AvGas; Jet A Y
Springerville Springerville Municipal 12 41 AvGas; Jet A Y
St. Johns St. Johns Industrial Air Park 9 20 AvGas; Jet A Y
Superior Superior 0 0 None N
Taylor Taylor 13 24 None Y
Tombstone Tombstone Municipal 2 4 None N
Tuba City Tuba City 0 8 None N
Tucson Ryan Field 251 93 AvGas; Jet A Y
Whiteriver Whiteriver 0 17 None N
Wickenburg Wickenburg Municipal 53 38 AvGas; Jet A Y
Willcox Cochise County 15 22 AvGas; Jet A Y
Williams H.A. Clark Memorial Field 12 0 AvGas Y
Window Rock Window Rock 2 12 Jet A Y
Winslow Winslow-Lindbergh Regional 1 15 AvGas; Jet A Y
*Note: Tucson International Airport reports total hangars in square footage Source: Airport Inventory and Data Survey 2017
Chapter 3: Identification of Airport Assets 2018 | Page 3-21
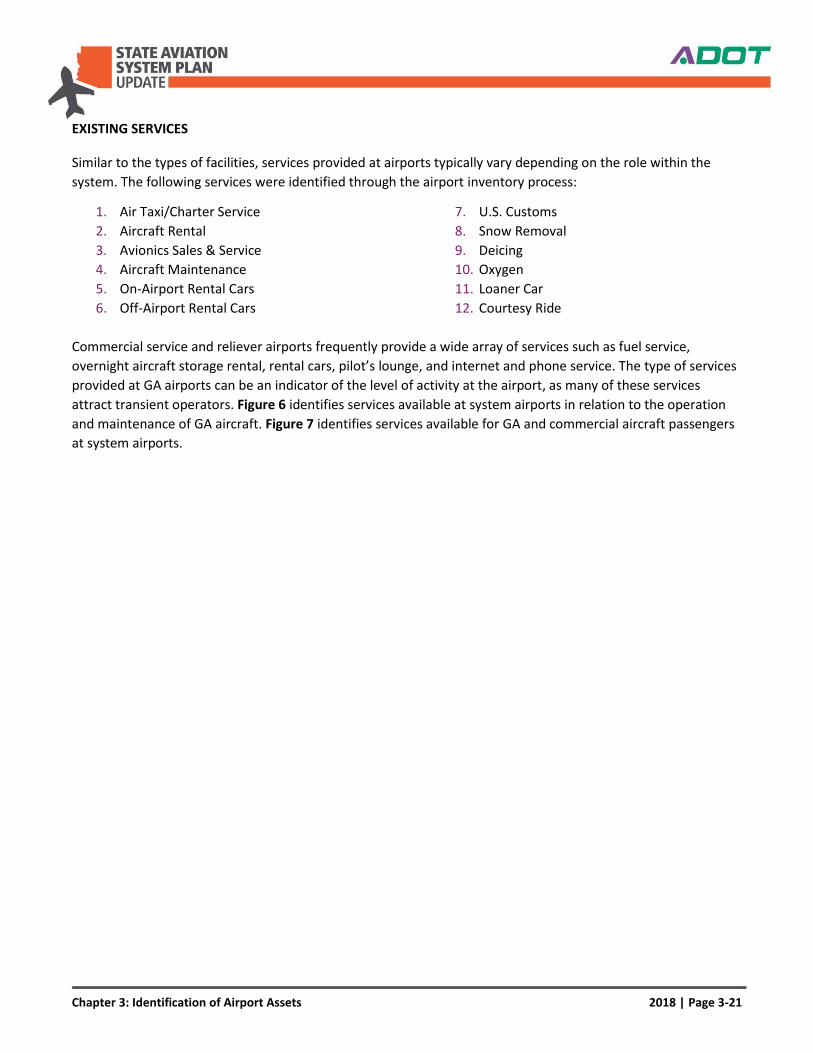
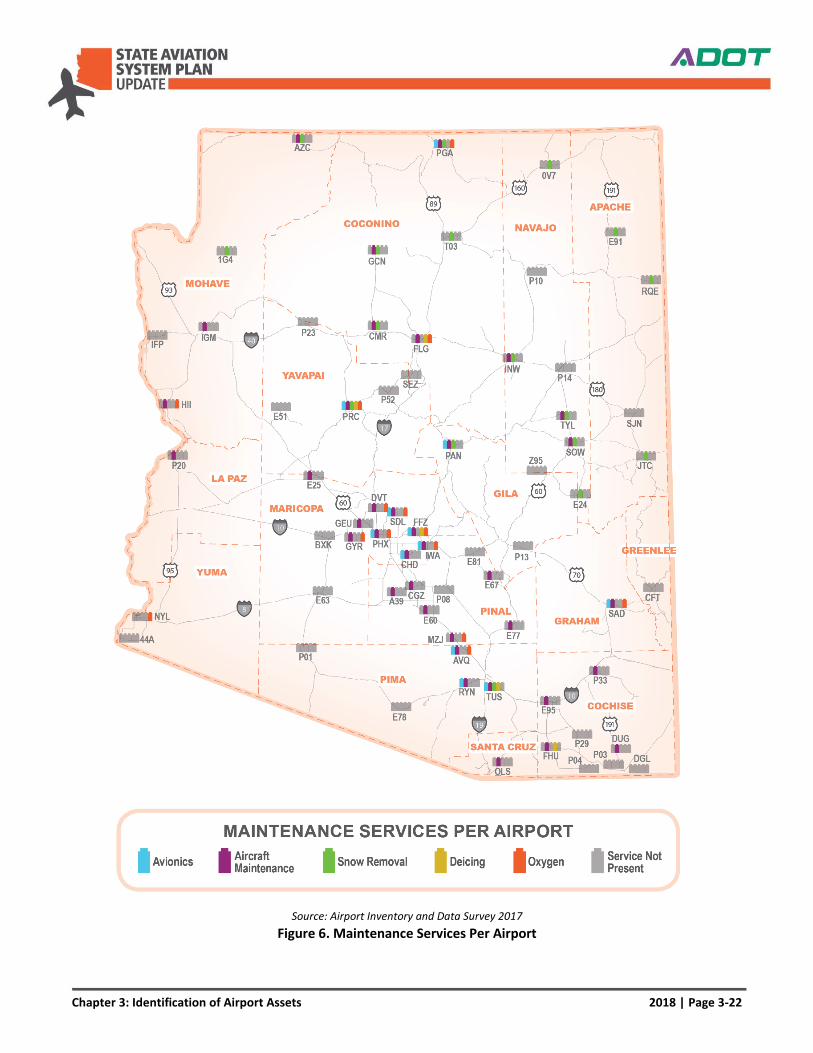
EXISTING SERVICES
Similar to the types of facilities, services provided at airports typically vary depending on the role within the
system. The following services were identified through the airport inventory process:
1. Air Taxi/Charter Service
2. Aircraft Rental
3. Avionics Sales & Service
4. Aircraft Maintenance
5. On-Airport Rental Cars
6. Off-Airport Rental Cars
7. U.S. Customs
8. Snow Removal
9. Deicing
10. Oxygen
11. Loaner Car
12. Courtesy Ride
Commercial service and reliever airports frequently provide a wide array of services such as fuel service,
overnight aircraft storage rental, rental cars, pilot’s lounge, and internet and phone service. The type of services
provided at GA airports can be an indicator of the level of activity at the airport, as many of these services
attract transient operators. Figure 6 identifies services available at system airports in relation to the operation
and maintenance of GA aircraft. Figure 7 identifies services available for GA and commercial aircraft passengers
at system airports.
Chapter 3: Identification of Airport Assets 2018 | Page 3-22
Source: Airport Inventory and Data Survey 2017
Figure 6. Maintenance Services Per Airport
Chapter 3: Identification of Airport Assets 2018 | Page 3-23
Source: Airport Inventory and Data Survey 2017
Figure 7. Passenger/User Services Per Airport
Chapter 3: Identification of Airport Assets 2018 | Page 3-24
AIRPORT ACTIVITY
One of the best ways to determine the level of activity at an airport is evaluate the number of based aircraft and
annual operations at the facility. A based aircraft is generally defined as an aircraft that is stored at an airport for
the majority of the year. An aircraft operation represents either a take-off or landing conducted by an aircraft.
For example, a touch-and-go, which includes a take-off and landing, counts as two operations.
An accurate based aircraft recording can provide insight to the adequacy of aircraft storage and facility capacity
at the airport. Similar to based aircraft, accurate annual aircraft operations data provide a detailed view of the
airport’s capacity and assists airport planners in determining future facility needs. It is important to note that
accurate annual aircraft operations data are only available from airports that have an air traffic control tower.
Untowered airports typically estimate the number of operations using different methods that do not always
reflect the actual total number of annual operations.
A standard practice for airport management is to conduct quarterly to annual based aircraft inventory counts.
ADOT requires airports to provide quarterly based aircraft reports for purposes of aircraft registration and
taxation; revenues from registration are used to fund the State Aviation Fund.
Updated based aircraft data were obtained from airport management during the inventory process. If updated
based aircraft data were unavailable, data were obtained from the most recent ADOT ASM update. At towered
airports, annual operations were derived from FAA Air Traffic Activity Data System (ATADS). At non-towered
airports, annual aircraft operations data was derived from updated airport data reported as estimates by the
airport manager. If the airport manager did not have the means to accurately report annual operations, recently
updated ASM data were used. Generally, ASM data corresponded with FAA 5010 Master Record data.
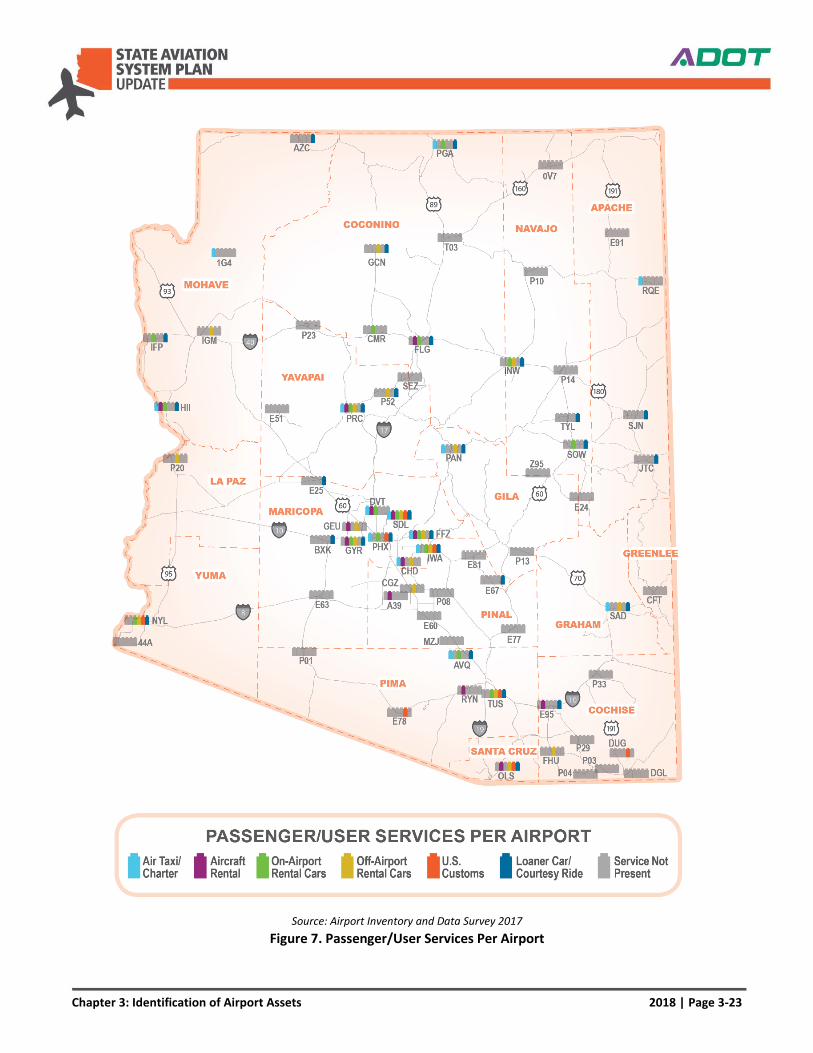
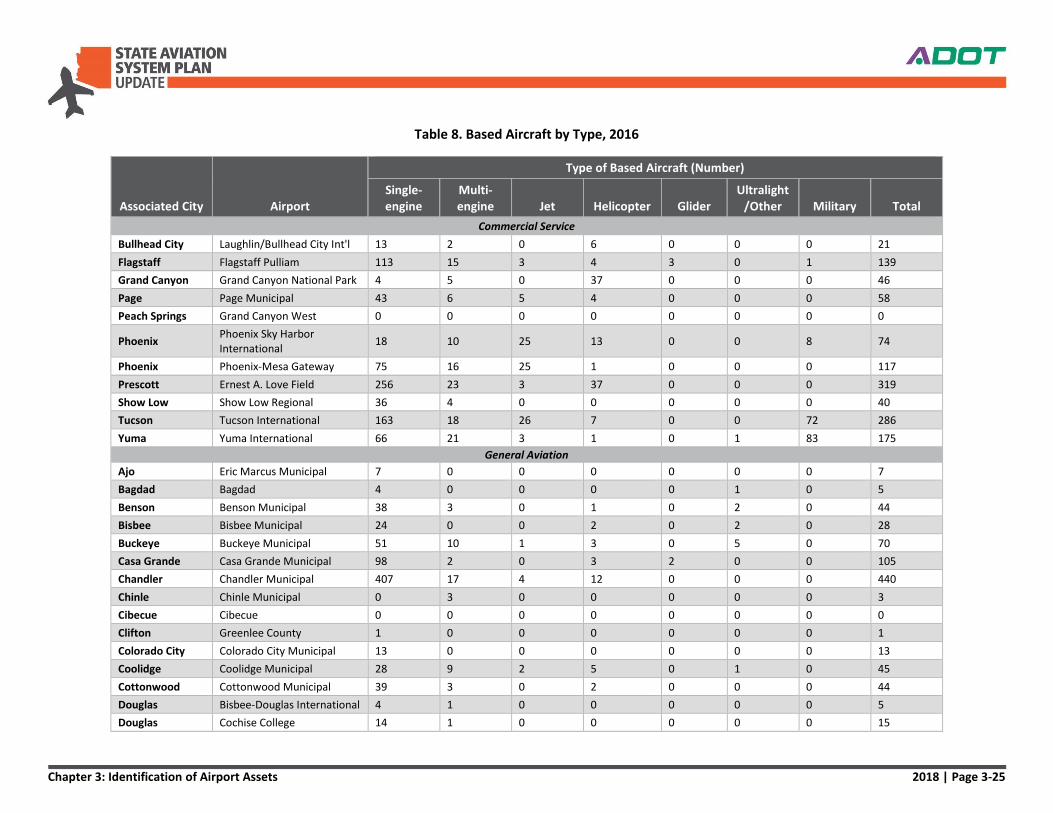
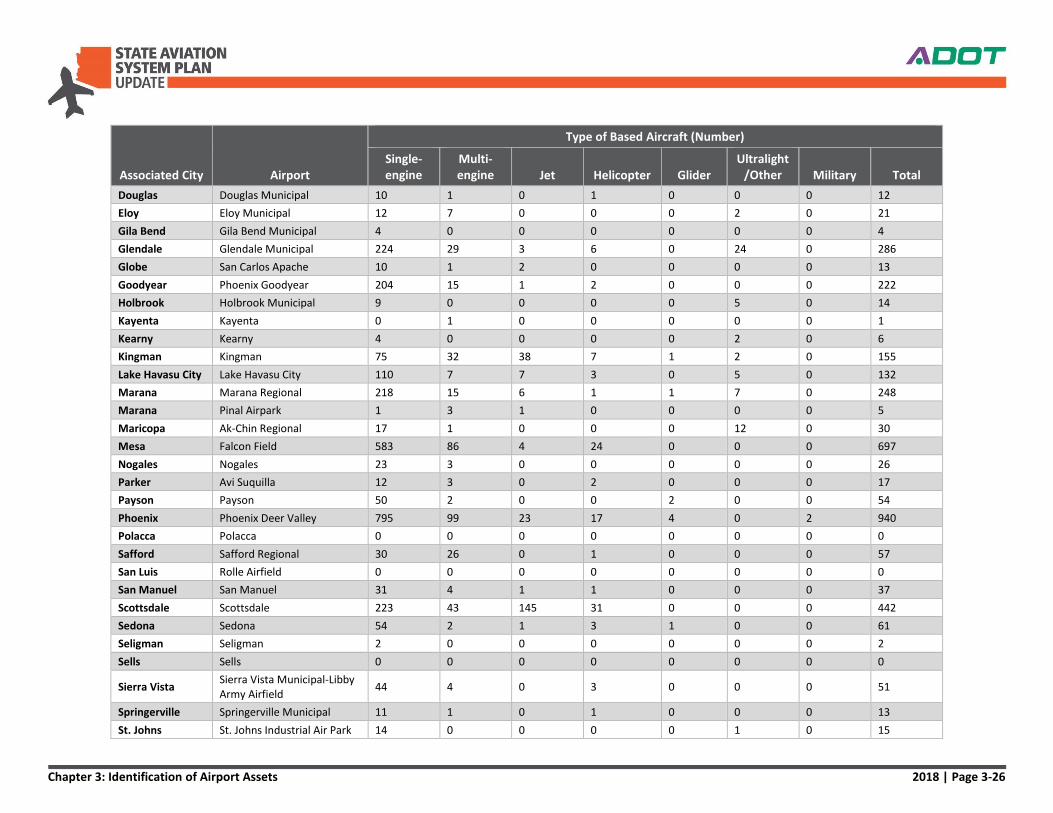
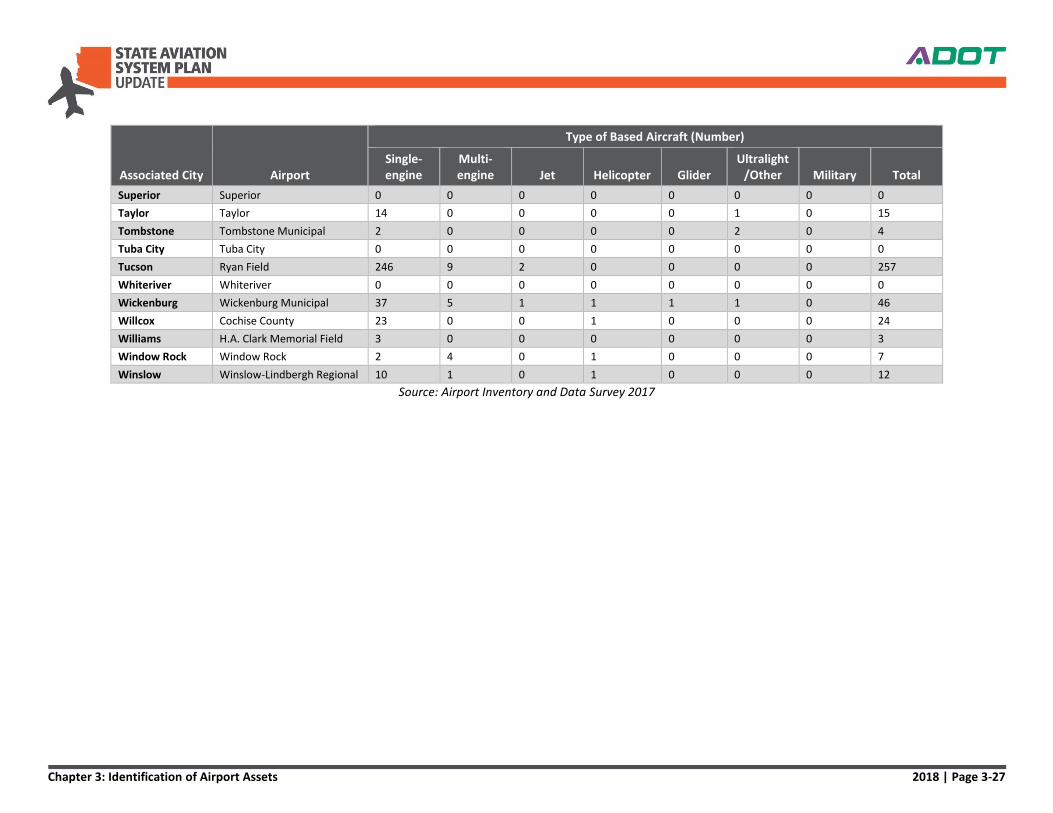
Based Aircraft
For each system airport, the total number of based aircraft reported in 2016, by type, were identified. Table 7
summarizes the based aircraft in the Arizona system by type. Since the 2008 SASP, the percentage of single-
engine aircraft has decreased, while the percentages of jet and helicopter aircraft have increased. This trend is
consistent with national averages per the FAA Aerospace Forecast 2017-2037.
Table 7. Statewide Based Aircraft by Type, 2016
Aircraft Type Number of
Aircraft Percent of Total (%)
Single-engine 4,622 76.7%
Multi-engine 573 9.5%
Jet 332 5.5%
Helicopter 245 4.1%
Glider 15 0.2%
Ultralights/Other 76 1.3%
Military 166 2.8%
Total 6,029 100.0%
Source: Airport Inventory and Data Survey 2017
Figure 8. 2016 Based Aircraft
Single-engine
Multi-engine
JetHelicopter
Glider Ultralights/Other Military
Chapter 3: Identification of Airport Assets 2018 | Page 3-25
Table 8. Based Aircraft by Type, 2016
Associated City Airport
Type of Based Aircraft (Number)
Single-engine
Multi-engine Jet Helicopter Glider
Ultralight/Other Military Total
Commercial Service
Bullhead City Laughlin/Bullhead City Int'l 13 2 0 6 0 0 0 21
Flagstaff Flagstaff Pulliam 113 15 3 4 3 0 1 139
Grand Canyon Grand Canyon National Park 4 5 0 37 0 0 0 46
Page Page Municipal 43 6 5 4 0 0 0 58
Peach Springs Grand Canyon West 0 0 0 0 0 0 0 0
Phoenix Phoenix Sky Harbor International
18 10 25 13 0 0 8 74
Phoenix Phoenix-Mesa Gateway 75 16 25 1 0 0 0 117
Prescott Ernest A. Love Field 256 23 3 37 0 0 0 319
Show Low Show Low Regional 36 4 0 0 0 0 0 40
Tucson Tucson International 163 18 26 7 0 0 72 286
Yuma Yuma International 66 21 3 1 0 1 83 175
General Aviation
Ajo Eric Marcus Municipal 7 0 0 0 0 0 0 7
Bagdad Bagdad 4 0 0 0 0 1 0 5
Benson Benson Municipal 38 3 0 1 0 2 0 44
Bisbee Bisbee Municipal 24 0 0 2 0 2 0 28
Buckeye Buckeye Municipal 51 10 1 3 0 5 0 70
Casa Grande Casa Grande Municipal 98 2 0 3 2 0 0 105
Chandler Chandler Municipal 407 17 4 12 0 0 0 440
Chinle Chinle Municipal 0 3 0 0 0 0 0 3
Cibecue Cibecue 0 0 0 0 0 0 0 0
Clifton Greenlee County 1 0 0 0 0 0 0 1
Colorado City Colorado City Municipal 13 0 0 0 0 0 0 13
Coolidge Coolidge Municipal 28 9 2 5 0 1 0 45
Cottonwood Cottonwood Municipal 39 3 0 2 0 0 0 44
Douglas Bisbee-Douglas International 4 1 0 0 0 0 0 5
Douglas Cochise College 14 1 0 0 0 0 0 15
Chapter 3: Identification of Airport Assets 2018 | Page 3-26
Associated City Airport
Type of Based Aircraft (Number)
Single-engine
Multi-engine Jet Helicopter Glider
Ultralight/Other Military Total
Douglas Douglas Municipal 10 1 0 1 0 0 0 12
Eloy Eloy Municipal 12 7 0 0 0 2 0 21
Gila Bend Gila Bend Municipal 4 0 0 0 0 0 0 4
Glendale Glendale Municipal 224 29 3 6 0 24 0 286
Globe San Carlos Apache 10 1 2 0 0 0 0 13
Goodyear Phoenix Goodyear 204 15 1 2 0 0 0 222
Holbrook Holbrook Municipal 9 0 0 0 0 5 0 14
Kayenta Kayenta 0 1 0 0 0 0 0 1
Kearny Kearny 4 0 0 0 0 2 0 6
Kingman Kingman 75 32 38 7 1 2 0 155
Lake Havasu City Lake Havasu City 110 7 7 3 0 5 0 132
Marana Marana Regional 218 15 6 1 1 7 0 248
Marana Pinal Airpark 1 3 1 0 0 0 0 5
Maricopa Ak-Chin Regional 17 1 0 0 0 12 0 30
Mesa Falcon Field 583 86 4 24 0 0 0 697
Nogales Nogales 23 3 0 0 0 0 0 26
Parker Avi Suquilla 12 3 0 2 0 0 0 17
Payson Payson 50 2 0 0 2 0 0 54
Phoenix Phoenix Deer Valley 795 99 23 17 4 0 2 940
Polacca Polacca 0 0 0 0 0 0 0 0
Safford Safford Regional 30 26 0 1 0 0 0 57
San Luis Rolle Airfield 0 0 0 0 0 0 0 0
San Manuel San Manuel 31 4 1 1 0 0 0 37
Scottsdale Scottsdale 223 43 145 31 0 0 0 442
Sedona Sedona 54 2 1 3 1 0 0 61
Seligman Seligman 2 0 0 0 0 0 0 2
Sells Sells 0 0 0 0 0 0 0 0
Sierra Vista Sierra Vista Municipal-Libby Army Airfield
44 4 0 3 0 0 0 51
Springerville Springerville Municipal 11 1 0 1 0 0 0 13
St. Johns St. Johns Industrial Air Park 14 0 0 0 0 1 0 15
Chapter 3: Identification of Airport Assets 2018 | Page 3-27
Associated City Airport
Type of Based Aircraft (Number)
Single-engine
Multi-engine Jet Helicopter Glider
Ultralight/Other Military Total
Superior Superior 0 0 0 0 0 0 0 0
Taylor Taylor 14 0 0 0 0 1 0 15
Tombstone Tombstone Municipal 2 0 0 0 0 2 0 4
Tuba City Tuba City 0 0 0 0 0 0 0 0
Tucson Ryan Field 246 9 2 0 0 0 0 257
Whiteriver Whiteriver 0 0 0 0 0 0 0 0
Wickenburg Wickenburg Municipal 37 5 1 1 1 1 0 46
Willcox Cochise County 23 0 0 1 0 0 0 24
Williams H.A. Clark Memorial Field 3 0 0 0 0 0 0 3
Window Rock Window Rock 2 4 0 1 0 0 0 7
Winslow Winslow-Lindbergh Regional 10 1 0 1 0 0 0 12
Source: Airport Inventory and Data Survey 2017
Chapter 3: Identification of Airport Assets 2018 | Page 3-28
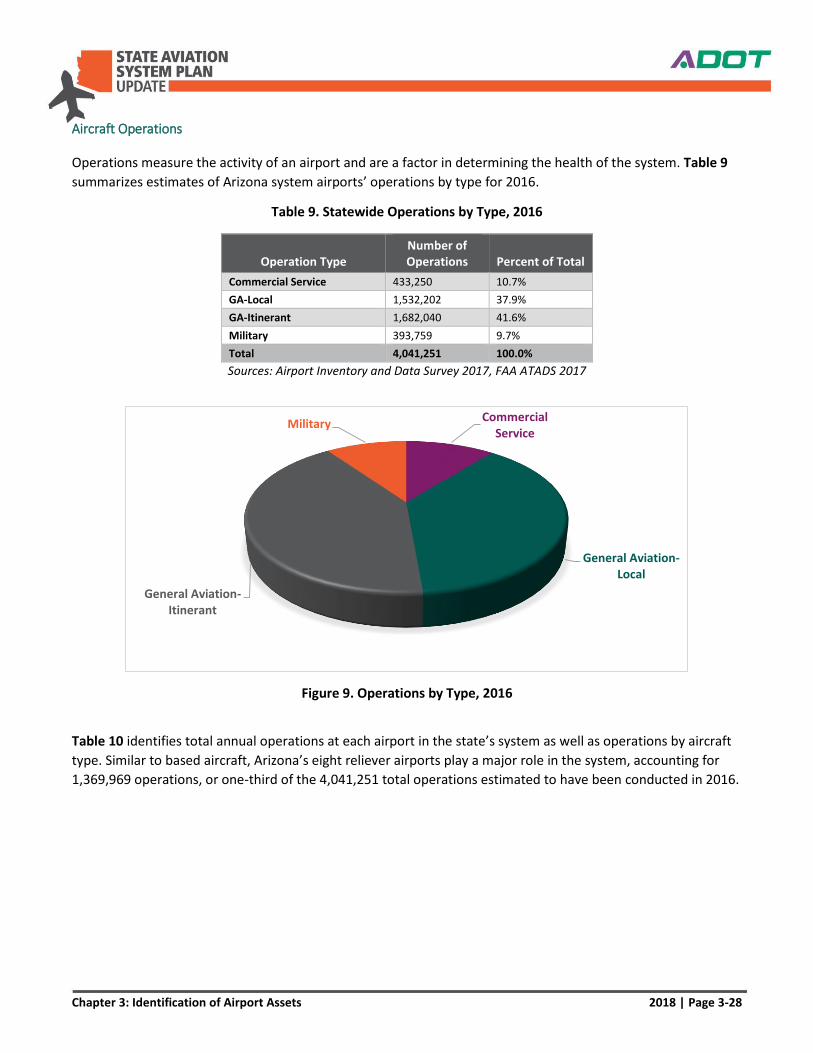
Aircraft Operations
Operations measure the activity of an airport and are a factor in determining the health of the system. Table 9
summarizes estimates of Arizona system airports’ operations by type for 2016.
Table 9. Statewide Operations by Type, 2016
Operation Type Number of Operations Percent of Total
Commercial Service 433,250 10.7%
GA-Local 1,532,202 37.9%
GA-Itinerant 1,682,040 41.6%
Military 393,759 9.7%
Total 4,041,251 100.0%
Sources: Airport Inventory and Data Survey 2017, FAA ATADS 2017
Figure 9. Operations by Type, 2016
Table 10 identifies total annual operations at each airport in the state’s system as well as operations by aircraft
type. Similar to based aircraft, Arizona’s eight reliever airports play a major role in the system, accounting for
1,369,969 operations, or one-third of the 4,041,251 total operations estimated to have been conducted in 2016.
Commercial Service
General Aviation-Local
General Aviation-Itinerant
Military
Chapter 3: Identification of Airport Assets 2018 | Page 3-29
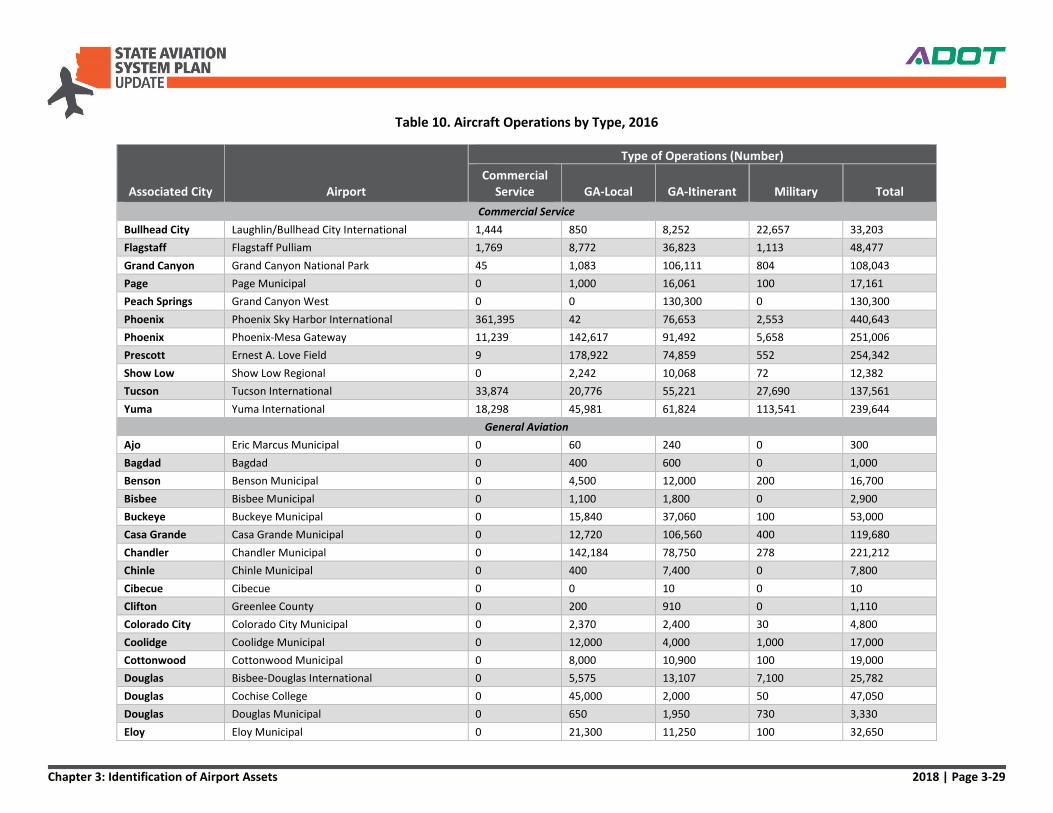
Table 10. Aircraft Operations by Type, 2016
Associated City Airport
Type of Operations (Number)
Commercial Service GA-Local GA-Itinerant Military Total
Commercial Service
Bullhead City Laughlin/Bullhead City International 1,444 850 8,252 22,657 33,203
Flagstaff Flagstaff Pulliam 1,769 8,772 36,823 1,113 48,477
Grand Canyon Grand Canyon National Park 45 1,083 106,111 804 108,043
Page Page Municipal 0 1,000 16,061 100 17,161
Peach Springs Grand Canyon West 0 0 130,300 0 130,300
Phoenix Phoenix Sky Harbor International 361,395 42 76,653 2,553 440,643
Phoenix Phoenix-Mesa Gateway 11,239 142,617 91,492 5,658 251,006
Prescott Ernest A. Love Field 9 178,922 74,859 552 254,342
Show Low Show Low Regional 0 2,242 10,068 72 12,382
Tucson Tucson International 33,874 20,776 55,221 27,690 137,561
Yuma Yuma International 18,298 45,981 61,824 113,541 239,644
General Aviation
Ajo Eric Marcus Municipal 0 60 240 0 300
Bagdad Bagdad 0 400 600 0 1,000
Benson Benson Municipal 0 4,500 12,000 200 16,700
Bisbee Bisbee Municipal 0 1,100 1,800 0 2,900
Buckeye Buckeye Municipal 0 15,840 37,060 100 53,000
Casa Grande Casa Grande Municipal 0 12,720 106,560 400 119,680
Chandler Chandler Municipal 0 142,184 78,750 278 221,212
Chinle Chinle Municipal 0 400 7,400 0 7,800
Cibecue Cibecue 0 0 10 0 10
Clifton Greenlee County 0 200 910 0 1,110
Colorado City Colorado City Municipal 0 2,370 2,400 30 4,800
Coolidge Coolidge Municipal 0 12,000 4,000 1,000 17,000
Cottonwood Cottonwood Municipal 0 8,000 10,900 100 19,000
Douglas Bisbee-Douglas International 0 5,575 13,107 7,100 25,782
Douglas Cochise College 0 45,000 2,000 50 47,050
Douglas Douglas Municipal 0 650 1,950 730 3,330
Eloy Eloy Municipal 0 21,300 11,250 100 32,650
Chapter 3: Identification of Airport Assets 2018 | Page 3-30
Associated City Airport
Type of Operations (Number)
Commercial Service GA-Local GA-Itinerant Military Total
Gila Bend Gila Bend Municipal 0 30,340 5,900 50 36,290
Glendale Glendale Municipal 0 45,788 24,617 118 70,523
Globe San Carlos Apache 0 400 1,500 6 1,906
Goodyear Phoenix Goodyear 120 73,079 45,890 1,185 120,274
Holbrook Holbrook Municipal 0 700 3,000 0 3,700
Kayenta Kayenta 0 0 1,500 0 1,500
Kearny Kearny 0 50 1,100 50 1,200
Kingman Kingman 0 14,000 13,100 20 27,120
Lake Havasu City Lake Havasu City 0 20,270 23,650 350 44,270
Marana Marana Regional 0 30,000 40,000 20,252 90,252
Marana Pinal Airpark 0 7,500 557 48,800 56,857
Maricopa Ak-Chin Regional 0 2,886 15,434 2 18,322
Mesa Falcon Field 27 152,579 106,968 3,544 263,118
Nogales Nogales 0 32,400 12,750 2,600 47,750
Parker Avi Suquilla 0 1,500 11,000 150 12,650
Payson Payson 0 11,000 21,750 500 33,250
Phoenix Phoenix Deer Valley 17 241,742 128,201 74 370,034
Polacca Polacca 0 0 200 0 200
Safford Safford Regional 0 6,000 6,750 1,000 13,750
San Luis Rolle Airfield 0 3,000 0 100 3,100
San Manuel San Manuel 0 12,000 2,000 10 14,010
Scottsdale Scottsdale 0 58,270 99,354 671 158,295
Sedona Sedona 0 4,600 28,900 1,800 35,300
Seligman Seligman 0 500 600 0 1,100
Sells Sells 0 0 250 10 260
Sierra Vista Sierra Vista Municipal-Libby Army Airfield 5,013 25,803 10,905 110,066 151,787
Springerville Springerville Municipal 0 286 2,237 48 2,571
St. Johns St. Johns Industrial Air Park 0 3,500 13,000 300 16,800
Superior Superior 0 0 200 0 200
Taylor Taylor 0 2,000 830 0 2,830
Tombstone Tombstone Municipal 0 40 300 0 340
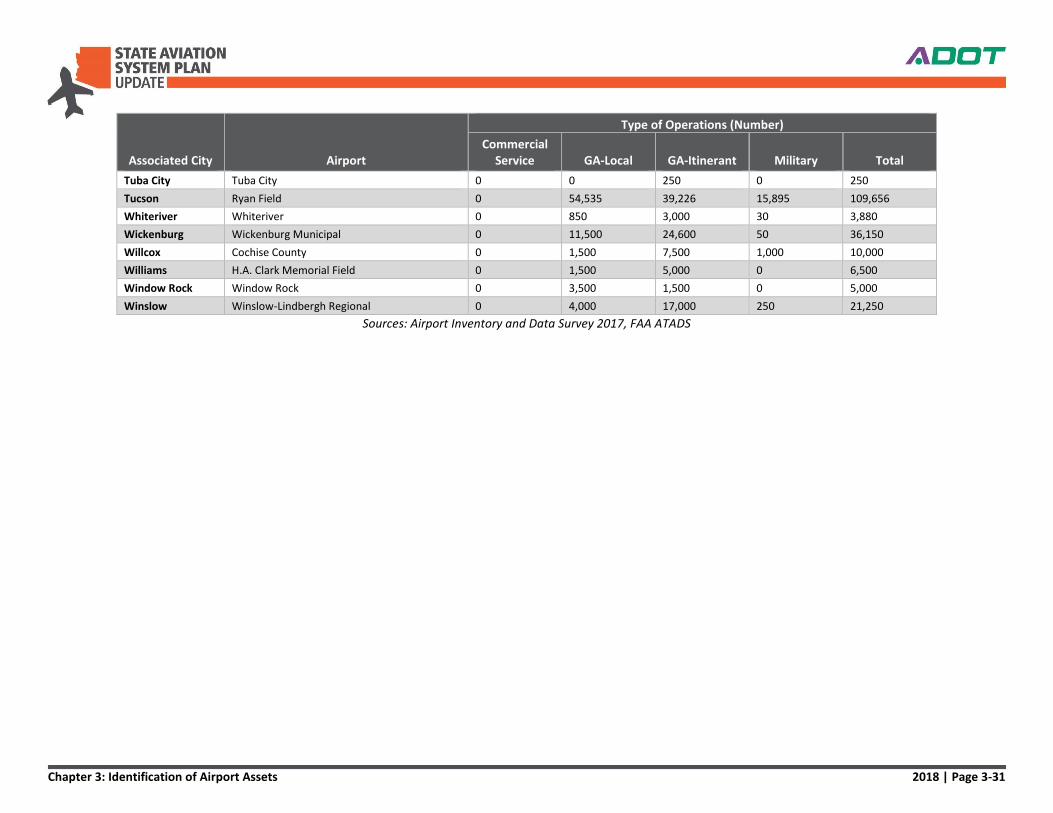
Chapter 3: Identification of Airport Assets 2018 | Page 3-31
Associated City Airport
Type of Operations (Number)
Commercial Service GA-Local GA-Itinerant Military Total
Tuba City Tuba City 0 0 250 0 250
Tucson Ryan Field 0 54,535 39,226 15,895 109,656
Whiteriver Whiteriver 0 850 3,000 30 3,880
Wickenburg Wickenburg Municipal 0 11,500 24,600 50 36,150
Willcox Cochise County 0 1,500 7,500 1,000 10,000
Williams H.A. Clark Memorial Field 0 1,500 5,000 0 6,500
Window Rock Window Rock 0 3,500 1,500 0 5,000
Winslow Winslow-Lindbergh Regional 0 4,000 17,000 250 21,250
Sources: Airport Inventory and Data Survey 2017, FAA ATADS
Chapter 3: Identification of Airport Assets 2018 | Page 3-32
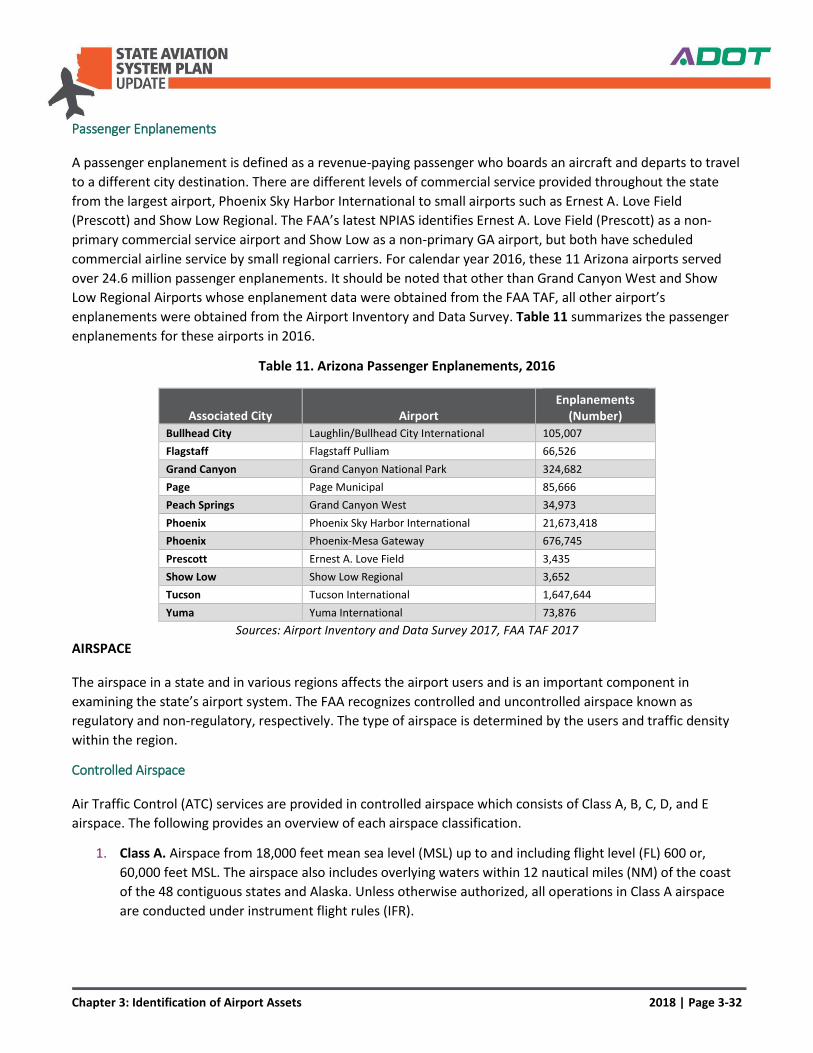
Passenger Enplanements
A passenger enplanement is defined as a revenue-paying passenger who boards an aircraft and departs to travel
to a different city destination. There are different levels of commercial service provided throughout the state
from the largest airport, Phoenix Sky Harbor International to small airports such as Ernest A. Love Field
(Prescott) and Show Low Regional. The FAA’s latest NPIAS identifies Ernest A. Love Field (Prescott) as a non-
primary commercial service airport and Show Low as a non-primary GA airport, but both have scheduled
commercial airline service by small regional carriers. For calendar year 2016, these 11 Arizona airports served
over 24.6 million passenger enplanements. It should be noted that other than Grand Canyon West and Show
Low Regional Airports whose enplanement data were obtained from the FAA TAF, all other airport’s
enplanements were obtained from the Airport Inventory and Data Survey. Table 11 summarizes the passenger
enplanements for these airports in 2016.
Table 11. Arizona Passenger Enplanements, 2016
Associated City Airport Enplanements
(Number)
Bullhead City Laughlin/Bullhead City International 105,007
Flagstaff Flagstaff Pulliam 66,526
Grand Canyon Grand Canyon National Park 324,682
Page Page Municipal 85,666
Peach Springs Grand Canyon West 34,973
Phoenix Phoenix Sky Harbor International 21,673,418
Phoenix Phoenix-Mesa Gateway 676,745
Prescott Ernest A. Love Field 3,435
Show Low Show Low Regional 3,652
Tucson Tucson International 1,647,644
Yuma Yuma International 73,876
Sources: Airport Inventory and Data Survey 2017, FAA TAF 2017
AIRSPACE
The airspace in a state and in various regions affects the airport users and is an important component in
examining the state’s airport system. The FAA recognizes controlled and uncontrolled airspace known as
regulatory and non-regulatory, respectively. The type of airspace is determined by the users and traffic density
within the region.
Controlled Airspace
Air Traffic Control (ATC) services are provided in controlled airspace which consists of Class A, B, C, D, and E
airspace. The following provides an overview of each airspace classification.
1. Class A. Airspace from 18,000 feet mean sea level (MSL) up to and including flight level (FL) 600 or,
60,000 feet MSL. The airspace also includes overlying waters within 12 nautical miles (NM) of the coast
of the 48 contiguous states and Alaska. Unless otherwise authorized, all operations in Class A airspace
are conducted under instrument flight rules (IFR).
Chapter 3: Identification of Airport Assets 2018 | Page 3-33
2. Class B. Airspace from the surface to 10,000 feet MSL surrounding the nation’s busiest airports in terms
of airport operations or passenger enplanements. The configuration of each Class B airspace area is
individually tailored, consisting of a surface area and two or more layers resembling an upside-down
wedding cake. Class B is designed to contain all published instrument procedures once an aircraft enters
the airspace. ATC clearance is required for all aircraft to operate in the area, and all aircraft that are
cleared receive separation services within the airspace.
3. Class C. Airspace from the surface to 4,000 feet above the airport elevation (charted in MSL)
surrounding those airports that have a control tower, are serviced by a radar approach control, and have
a certain number of IFR operations or passenger enplanements. Although the configuration of each
Class C area is individually tailored, the airspace usually consists of a surface area with a five- NM radius,
and an outer circle with a ten-NM radius that extends from 1,200 feet to 4,000 feet above the airport
elevation. Each aircraft must establish two-way radio communication with the ATC facility providing air
traffic services prior to entering the airspace and thereafter must maintain those communications while
within the Class C airspace.
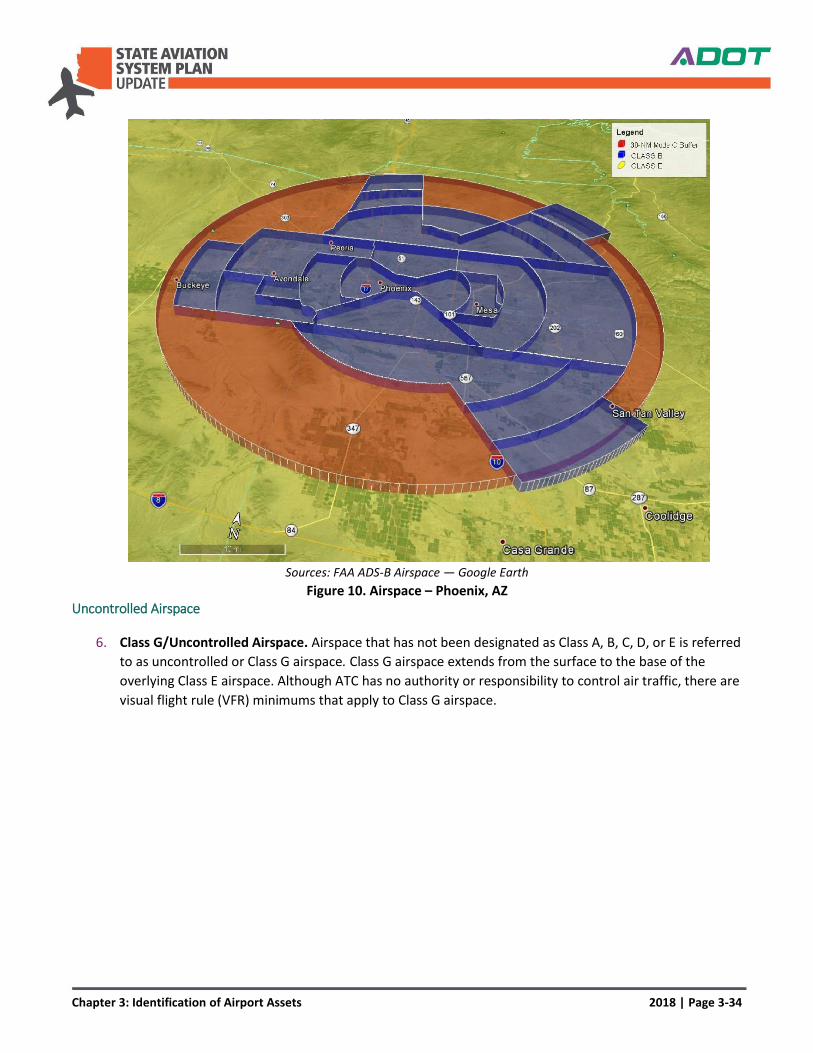
Figure 10 displays Class B and Class C airspace surrounding Phoenix, Arizona.
4. Class D. Airspace from the surface to 2,500 feet above the airport elevation (charted in MSL)
surrounding those airports that have a control tower. The configuration of each Class D airspace area is
individually tailored and, when instrument procedures are published, the airspace is normally designed
to contain the procedures. Arrival extensions for IAPs may be Class D or Class E Airspace. Unless
otherwise authorized, each aircraft must establish two-way radio communication with the ATC facility
providing air traffic services prior to entering the airspace and thereafter maintain those
communications while in the airspace. Class D airspace is present at Arizona airports including Flagstaff
Pulliam Airport and Ernest A. Love Field Airport.
5. Class E. Controlled airspace not classified as Class A, B, C, or D airspace. A large amount of airspace over
the United States is designated as Class E airspace. This provides sufficient airspace for the safe control
and separation of aircraft during IFR operations. Sectional and other charts depict all locations of Class E
airspace with bases below 14,500 feet MSL. In areas where charts do not depict a Class E base, Class E
begins at 14,500 feet MSL. In Arizona, Class E airspace is all remaining airspace (not A, B, C, or D) up to
14,500 MSL.
Chapter 3: Identification of Airport Assets 2018 | Page 3-34
Sources: FAA ADS-B Airspace — Google Earth
Figure 10. Airspace – Phoenix, AZ Uncontrolled Airspace
6. Class G/Uncontrolled Airspace. Airspace that has not been designated as Class A, B, C, D, or E is referred
to as uncontrolled or Class G airspace. Class G airspace extends from the surface to the base of the
overlying Class E airspace. Although ATC has no authority or responsibility to control air traffic, there are
visual flight rule (VFR) minimums that apply to Class G airspace.
Chapter 3: Identification of Airport Assets 2018 | Page 3-35
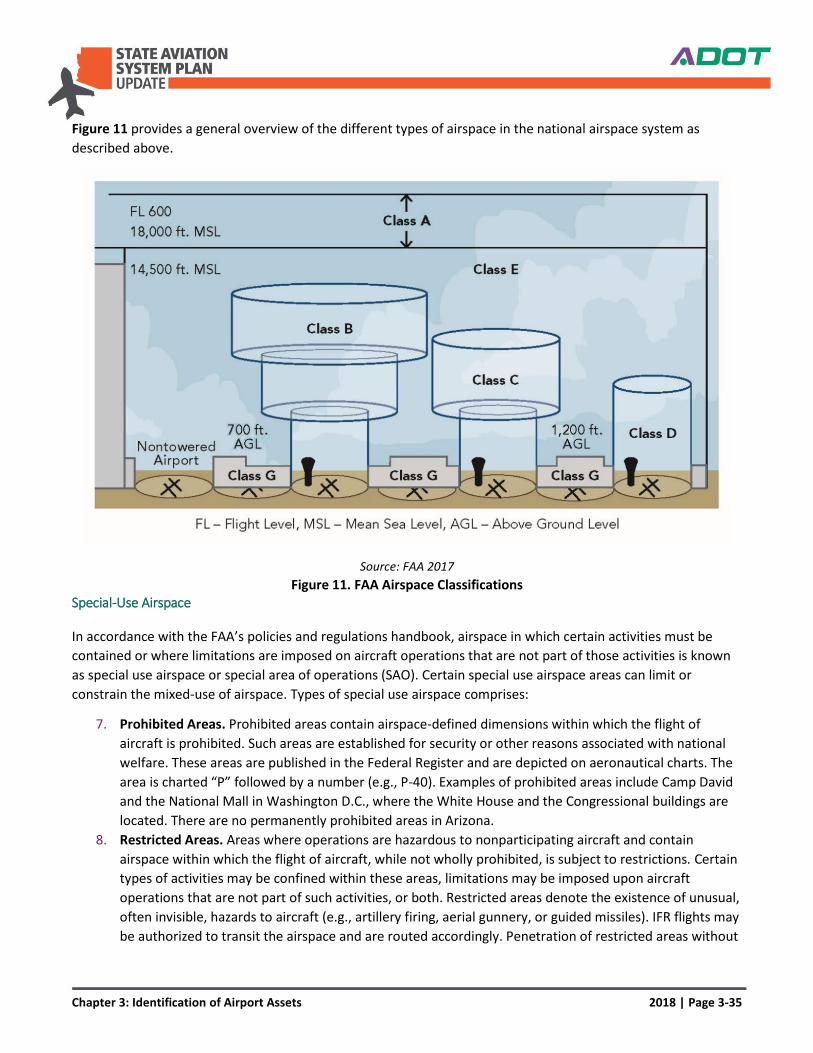
Figure 11 provides a general overview of the different types of airspace in the national airspace system as
described above.
Source: FAA 2017
Figure 11. FAA Airspace Classifications Special-Use Airspace
In accordance with the FAA’s policies and regulations handbook, airspace in which certain activities must be
contained or where limitations are imposed on aircraft operations that are not part of those activities is known
as special use airspace or special area of operations (SAO). Certain special use airspace areas can limit or
constrain the mixed-use of airspace. Types of special use airspace comprises:
7. Prohibited Areas. Prohibited areas contain airspace-defined dimensions within which the flight of
aircraft is prohibited. Such areas are established for security or other reasons associated with national
welfare. These areas are published in the Federal Register and are depicted on aeronautical charts. The
area is charted “P” followed by a number (e.g., P-40). Examples of prohibited areas include Camp David
and the National Mall in Washington D.C., where the White House and the Congressional buildings are
located. There are no permanently prohibited areas in Arizona.
8. Restricted Areas. Areas where operations are hazardous to nonparticipating aircraft and contain
airspace within which the flight of aircraft, while not wholly prohibited, is subject to restrictions. Certain
types of activities may be confined within these areas, limitations may be imposed upon aircraft
operations that are not part of such activities, or both. Restricted areas denote the existence of unusual,
often invisible, hazards to aircraft (e.g., artillery firing, aerial gunnery, or guided missiles). IFR flights may
be authorized to transit the airspace and are routed accordingly. Penetration of restricted areas without
Chapter 3: Identification of Airport Assets 2018 | Page 3-36
authorization from the using or controlling agency may be extremely hazardous to the aircraft and its
occupants. There are several restricted (R) areas in Arizona, some of which are located southwest of
Phoenix and include R-2301, R-2304, R-2307.
9. Military Operational Areas (MOAs). Airspace with defined vertical and lateral limits established for the
purpose of separating certain military training activities from IFR traffic. Whenever an MOA is used,
nonparticipating IFR traffic may be cleared through an MOA if IFR separation can be provided by ATC.
Otherwise, ATC reroutes or restricts nonparticipating IFR traffic. There are many MOAs in Arizona with a
high concentration located around Tucson such as Sells 1 MOA, Jackal MOA, Ruby 1 MOA, and Fuzzy
MOA.
10. Alert Areas. Airspace that contains a high volume of pilot training or unusual type of aerial activity that
may present a hazard to an aircraft. These areas are depicted on an aeronautical chart with an “A”
followed by a number (e.g., A-211) to direct nonparticipating pilots to exercise caution in alert areas. All
activity within an alert area shall be conducted in accordance with all applicable regulations, without
waiver. Pilots of participating aircraft, as well as pilots transitioning through area, shall be equally
responsible for collision avoidance. There is an alert area located to the west and northwest of Phoenix,
Alert Area A-231 for concentrated student jet transition training.
Other Arizona Airspace
In addition to special use airspace, there are other specialized airspace areas within Arizona. The following
describe “other” airspace within the state:
11. Military Training Routes (MTRs). The MTR Program is a joint venture by the FAA and the Department of
Defense (DOD) developed for use by military aircraft to gain and maintain proficiency in tactical low-
level flying. MTRs are generally established below 10,000 feet MSL for speeds in excess of 250 knots to
accommodate both VFR and IFR. Pilots utilizing MTRs are held to strict standards while utilizing these
routes. Non-participating aircraft are not prohibited from flying within an MTR; however, extreme
vigilance should be exercised when conducting flight through or near such airspace. There are numerous
MTRs in Arizona that support the flying missions of the military.
12. National Parks, National Forests, and Wildlife Areas. Arizona has numerous National Parks, National
Forests, and Wildlife Areas. Many of these areas are noise sensitive and are marked on FAA aeronautical
charts. Airspace over the Grand Canyon National Park is subject to special air traffic rules. VFR flight
through the Grand Canyon Special Flight Rules Area (GCN SFRA) is not authorized except through
designated corridors. There are many aerial tours originating from Las Vegas or the Grand Canyon which
are protected with these special flight rules.
NextGen
The Next Generation Air Transportation System (NextGen) is an FAA initiative to transform the National Airspace
System (NAS). The primary transformation phases out the existing radar-based ATC system to a satellite-based
ATC system using Automatic Dependent Surveillance – Broadcast (ADS-B) technology. This technology reduces
in-flight aircraft separation, shortens routes, increases airspace capacity, reduces fuel consumption, and
increases safety. The FAA’s goal is to have NextGen fully implemented by 2025, however, full implementation is
unlikely by that timeframe according to current progress.
Chapter 3: Identification of Airport Assets 2018 | Page 3-37
NAVAIDS
Navigational aids (NAVAIDs) were initially developed to provide directional information suitable for navigation
from place-to-place. With the proliferation of NAVAIDs and improvements in technology over time, it became
possible to use NAVAIDs to obtain information about a fixed physical location known as a fix. A fix is a radio-
generated landmark. As a result, pilots can use a series of fixes to follow a specific course to align aircraft with
the runway without the need to first circle and obtain visual confirmation of its physical location. A series of
fixes can also be used to regulate an aircraft’s rate of descent, with pilots descending to a lower altitude when
reaching a certain point. The following are different types of NAVAIDs that can be used in Arizona:
1. Very High Frequency (VHF) Omni-directional Range (VOR). This system radiates a VHF radio signals to
compatible airborne receivers. This type of approach provides pilots with a direct indication of bearing
relative to the facility. The VOR is one of the most widely used non-precision approach types in the NAS.
VOR approaches use facilities both on and off the and incorporate the use of a wide variety of
equipment such as Distance Measuring Equipment (DME) and Tactical Area Navigation (TACAN). As a
result of technology advances, including NextGen, the FAA has begun to decommission lesser-used
VORs. The plan is to create a minimum operational network (MON) that will serve as a backup to ensure
aircraft can land safely in the event of a widespread satellite navigation outage.4
2. VOR + DME (VOR/DME). A VOR radial with a DME distance allows a one-station position fix. The use of
DME in confluence with VOR provides an accurate determination of position without timing to greatly
increase situational awareness throughout the approach.
3. Non-Directional Beacon (NDB). An NDB is a radio beacon that aids the pilot of an aircraft with direction-
finding equipment. It can be part of an instrument landing system (ILS). NDBs are most commonly used
as compass locators for the outer marker of an ILS. NDBs may designate the starting area for an ILS
approach or a path to follow for a standard terminal arrival procedure (STAR). Similar to the VOR
approach, an NDB approach can be designed using facilities both on and off the airport, with or without
a Final Approach Fix (FAF), and with or without DME availability. While it was once common for an
instrument student to learn to fly an NDB approach, NDB approaches are becoming obsolete with the
increasing use of Global Positioning Systems (GPS). The FAA plans to gradually phase-out NDB facilities.
4. TACAN. TACAN is the military equivalent of the VOR/DME system and provides both distance and
direction guidance. The system includes a DME distance feature and a separate TACAN azimuth feature
that provides data similar to a VOR. A co-located VOR and TACAN beacon is called a VORTAC
APPROACH TYPES
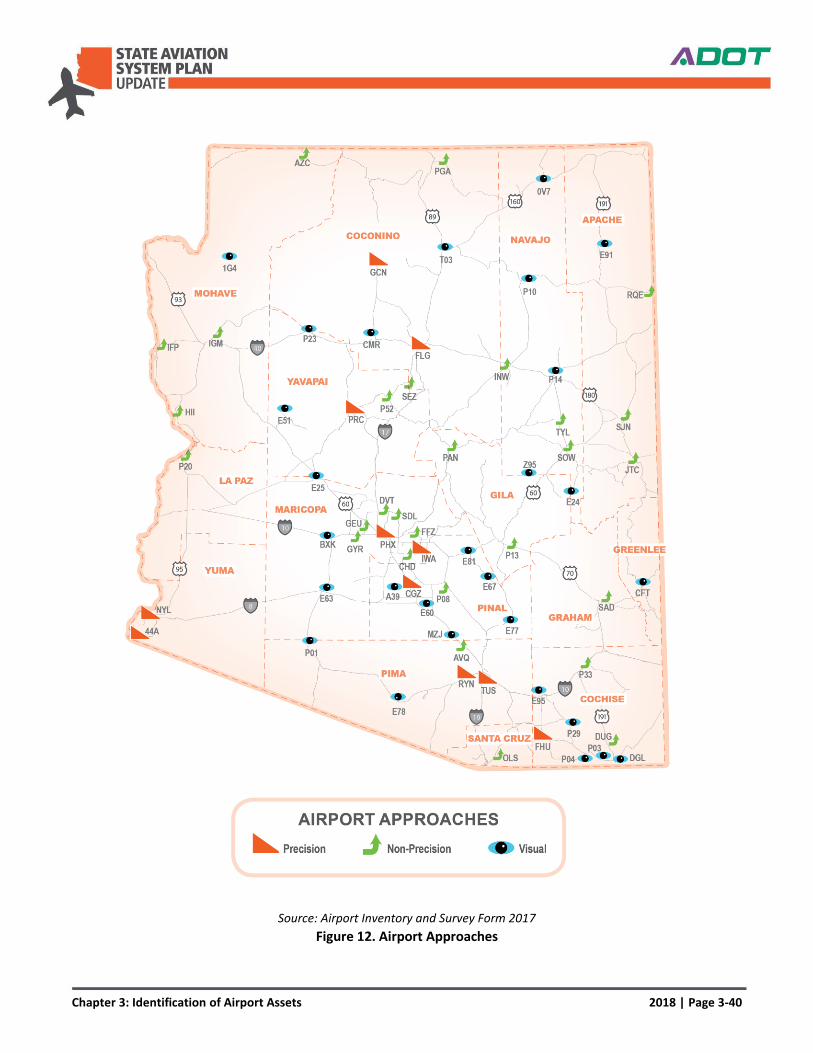
The series of procedures dictating route, direction, and rate of descent is known as an approach. The precision
of the course guidance provided by NAVAIDS has improved to such a degree that it is possible to execute an
approach within a few hundred feet of the ground. There are four types of approaches including visual, non-
precisions, near-precision, and precision.
4 Aircraft Owners and Pilots Association
Chapter 3: Identification of Airport Assets 2018 | Page 3-38
Visual Approach Procedures
A visual approach procedure is conducted under Visual Meteorological Conditions (VMC), which are defined as a
cloud ceiling greater than 1,000 feet above ground level (AGL) and visibility conditions equal to or greater than
three statute miles. Under VMC conditions, pilots approach an airport using only visual standards or cues. There
are 29 airports in the Arizona system that have only visual approach procedures to land.
Instrument Approach Procedures
IAPs are a series of predetermined maneuvers for the orderly transfer of an aircraft under instrument flight
conditions from the beginning of the initial approach to landing or to a point from which a landing may be made
visually. It is prescribed and approved for a specific airport by competent authority. The three types of IAPs are
described in the following sections.
Non-Precision Instrument Approaches
Non-precision Instrument (NPI) approaches provide only lateral guidance from either ground based or satellite
based GPS NAVAIDs. There are 28 airports in the Arizona system that use NPI approaches as their primary
approach procedure.
Near-Precision Approaches
Near-precision approaches, also known as Approach Procedures with Vertical Guidance (APV) are a relatively
recent outcome of the FAA’s NextGen program. These approach procedures use GPS technology to provide ILS-
like approach capability without the need for traditional ground-based ILS NAVAID equipment.
1. Lateral Navigation (LNAV). LNAV is a function of area navigation (RNAV) equipment that calculates,
displays, and provides lateral guidance to a profile or path.
2. Vertical Navigation (VNAV). VNAV is a function of RNAV equipment that calculates, displays, and
provides vertical guidance to a profile or path.
3. Localizer Performance with Vertical Guidance (LPV). LPV is a type of approach with APV based on Wide
Area Augmentation System (WAAS) published on RNAV (GPS) approach charts. This procedure takes
advantage of the precise lateral guidance available from WAAS.5 The minima are published as a decision
altitude (DA).
4. Required Navigation Performance (RNP). RNP is similar to RNAV, however, RNP requires on-board
navigation performance monitoring and alerting capability to ensure that the aircraft stays within a
specific containment area.
While some Arizona system airports have APV capabilities, there are no airports that use APV approaches as
their primary approach procedure.
5 The WAAS is a satellite navigation system consisting of the equipment and software which augments the GPS Standard Positioning Service (SPS). The WAAS provides enhanced integrity, accuracy, availability, and continuity over and above GPS SPS. The differential correction function provides improved accuracy required for precision approach.
Chapter 3: Identification of Airport Assets 2018 | Page 3-39
Precision Approaches
Precision instrument approaches provide both lateral and vertical guidance and have traditionally been
supported by multiple ground based NAVAIDs collectively called an ILS. An ILS includes a Localizer (providing
lateral guidance), a Glideslope (providing vertical guidance), and an ALS (providing close-in visual guidance).
There are 10 Arizona system airports that use precision approaches as their primary approach procedure.
Figure 12 depicts the primary airport approach at the 67 SASP airports.
Chapter 3: Identification of Airport Assets 2018 | Page 3-40
Source: Airport Inventory and Survey Form 2017
Figure 12. Airport Approaches
Chapter 3: Identification of Airport Assets 2018 | Page 3-41
Approach Visibility Minimums
Before a pilot is allowed to make an approach and attempt to land, he or she must have visual confirmation of
the runway. The approach visibility minima define how close a pilot can get to the runway before visual contact
with the runway environment must be achieved.
Approach visibility minimums vary among airports and by approach types. Approach minimums are determined
by individual airport and runway facilities, as well as topography and terrain characteristics of the approach and
characteristics of the area surrounding the airport. The following are general visibility minimums and their
related markings and lighting:
1. Visibility minimums of one mile can be supported with visual runway markings and LIRLs for nighttime
operations.
2. MIRL and precision or non-precision runway markings are required to reduce visibility minima to ¾ mile.
3. To establish below ½ mile visibility minimums, additional equipment requirements comprise precision
runway markings, MIRLs for nighttime operations, and an approved approach lighting system.
Approach Lighting Systems
An ALS provides a means to transition from IFR to VFR for landing. An ALS is a series of marker lights off the
runway end to signal the aircraft toward the touchdown zone. Some systems include high-intensity sequenced
flashing lights that appear to the pilot as a ball of light traveling toward the runway. Medium Approach Light
Systems with Runway Alignment Indicator Lights (MALSRs) are the only ALSs in Arizona’s system of airports.
Surface Weather Observation Stations
Surface weather observation stations are increasingly common at airports. These systems consist of various
sensors, a processor, computer-generated voice subsystem, and transmitter to broadcast local, minute-by-
minute weather data directly to the pilot. Prior to the initiation of an instrument approach, specific weather
data including the altimeter setting must be obtained. Pilots obtain weather data from the Air Traffic Control
Tower (ATCT) at towered airports; information is primarily disseminated via automated weather reporting
systems at airports without ATCTs. The following describes surface weather observation systems at airports in
Arizona:
1. Automated Weather Observing System (AWOS). An AWOS is a weather-data sensing, processing, and
disseminating system designed to support weather forecast activities and aviation operations. The
AWOS observes, archives, and transmits observations through an automatic terminal information
service (ATIS) on a VHF (132.125 MHz) to pilots operating at or near the airport. An AWOS can include
multiple types of systems based on the types of weather data needed.
2. Automated Surface Observing System (ASOS). Similar to an AWOS, the ASOS is a weather data sensing,
processing, and disseminating system; however, unlike the AWOS, the ASOS converts surface winds to
magnetic direction.
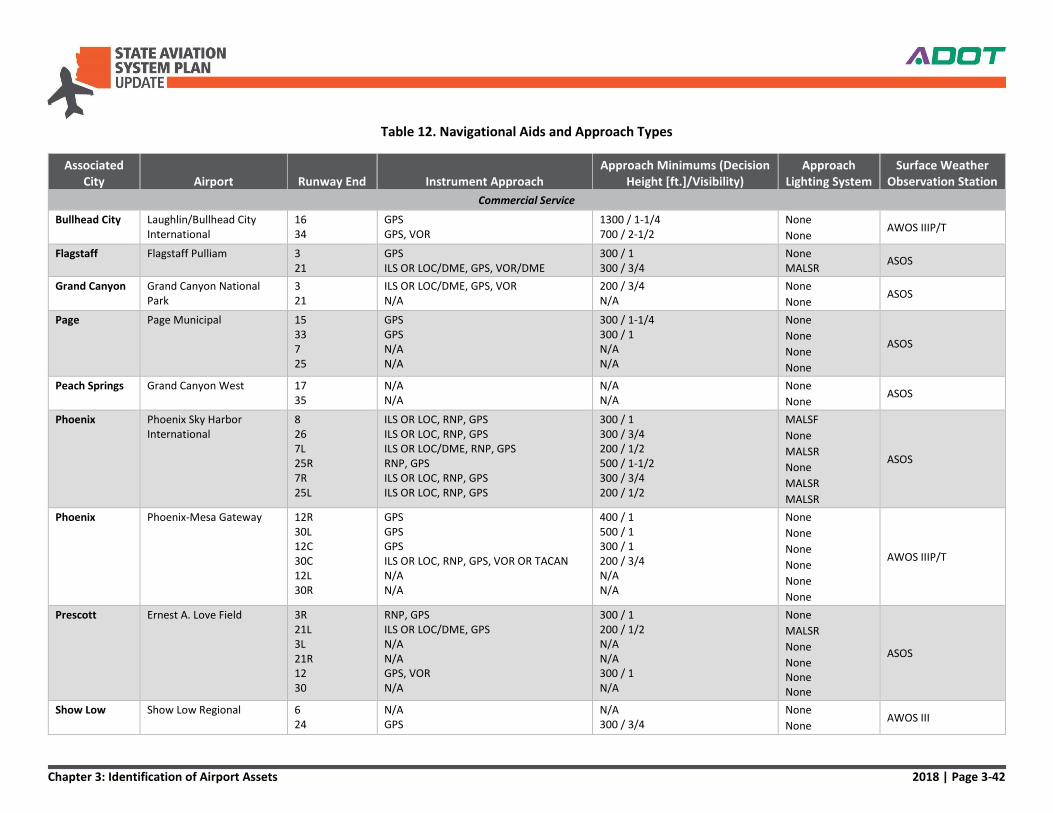
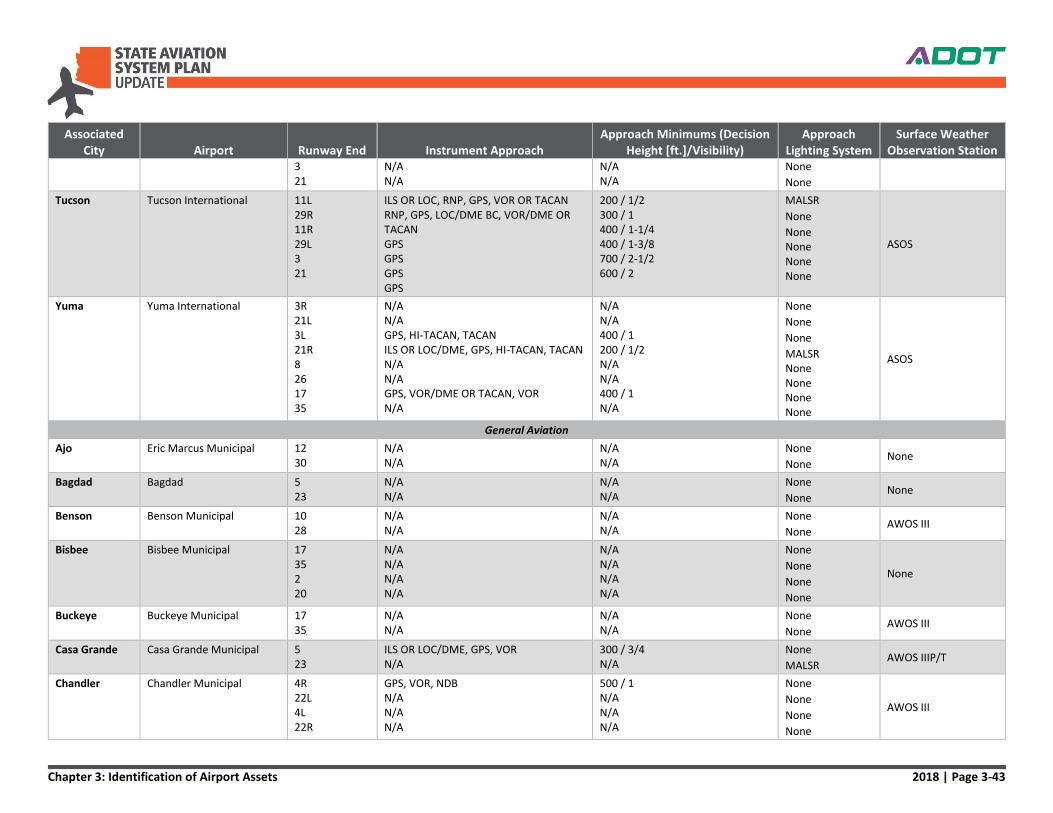
Table 12 presents the instrument approach type and approach minimums for each runway and the presence of
an approach lighting system and automated weather reporting system at each airport in the Arizona airport
system.
Chapter 3: Identification of Airport Assets 2018 | Page 3-42
Table 12. Navigational Aids and Approach Types
Associated City Airport Runway End Instrument Approach
Approach Minimums (Decision Height [ft.]/Visibility)
Approach Lighting System
Surface Weather Observation Station
Commercial Service
Bullhead City Laughlin/Bullhead City International
16 34
GPS GPS, VOR
1300 / 1-1/4 700 / 2-1/2
None
None AWOS IIIP/T
Flagstaff Flagstaff Pulliam 3 21
GPS ILS OR LOC/DME, GPS, VOR/DME
300 / 1 300 / 3/4
None MALSR
ASOS
Grand Canyon Grand Canyon National Park
3 21
ILS OR LOC/DME, GPS, VOR N/A
200 / 3/4 N/A
None
None ASOS
Page Page Municipal 15 33 7 25
GPS GPS N/A N/A
300 / 1-1/4 300 / 1 N/A N/A
None
None
None
None
ASOS
Peach Springs Grand Canyon West 17 35
N/A N/A
N/A N/A
None
None ASOS
Phoenix Phoenix Sky Harbor International
8 26 7L 25R 7R 25L
ILS OR LOC, RNP, GPS ILS OR LOC, RNP, GPS ILS OR LOC/DME, RNP, GPS RNP, GPS ILS OR LOC, RNP, GPS ILS OR LOC, RNP, GPS
300 / 1 300 / 3/4 200 / 1/2 500 / 1-1/2 300 / 3/4 200 / 1/2
MALSF
None
MALSR
None
MALSR
MALSR
ASOS
Phoenix Phoenix-Mesa Gateway 12R 30L 12C 30C 12L 30R
GPS GPS GPS ILS OR LOC, RNP, GPS, VOR OR TACAN N/A N/A
400 / 1 500 / 1 300 / 1 200 / 3/4 N/A N/A
None
None
None
None
None
None
AWOS IIIP/T
Prescott Ernest A. Love Field 3R 21L 3L 21R 12 30
RNP, GPS ILS OR LOC/DME, GPS N/A N/A GPS, VOR N/A
300 / 1 200 / 1/2 N/A N/A 300 / 1 N/A
None
MALSR
None
None None None
ASOS
Show Low Show Low Regional 6 24
N/A GPS
N/A 300 / 3/4
None
None AWOS III
Chapter 3: Identification of Airport Assets 2018 | Page 3-43
Associated City Airport Runway End Instrument Approach
Approach Minimums (Decision Height [ft.]/Visibility)
Approach Lighting System
Surface Weather Observation Station
3 21
N/A N/A
N/A N/A
None
None
Tucson Tucson International 11L 29R 11R 29L 3 21
ILS OR LOC, RNP, GPS, VOR OR TACAN RNP, GPS, LOC/DME BC, VOR/DME OR TACAN GPS GPS GPS GPS
200 / 1/2 300 / 1 400 / 1-1/4 400 / 1-3/8 700 / 2-1/2 600 / 2
MALSR
None
None None None None
ASOS
Yuma Yuma International 3R 21L 3L 21R 8 26 17 35
N/A N/A GPS, HI-TACAN, TACAN ILS OR LOC/DME, GPS, HI-TACAN, TACAN N/A N/A GPS, VOR/DME OR TACAN, VOR N/A
N/A N/A 400 / 1 200 / 1/2 N/A N/A 400 / 1 N/A
None
None
None
MALSR None None None None
ASOS
General Aviation
Ajo Eric Marcus Municipal 12 30
N/A N/A
N/A N/A
None
None None
Bagdad Bagdad 5 23
N/A N/A
N/A N/A
None
None None
Benson Benson Municipal 10 28
N/A N/A
N/A N/A
None
None AWOS III
Bisbee Bisbee Municipal 17 35 2 20
N/A N/A N/A N/A
N/A N/A N/A N/A
None
None
None
None
None
Buckeye Buckeye Municipal 17 35
N/A N/A
N/A N/A
None
None AWOS III
Casa Grande Casa Grande Municipal 5 23
ILS OR LOC/DME, GPS, VOR N/A
300 / 3/4 N/A
None
MALSR AWOS IIIP/T
Chandler Chandler Municipal 4R 22L 4L 22R
GPS, VOR, NDB N/A N/A N/A
500 / 1 N/A N/A N/A
None
None
None
None
AWOS III
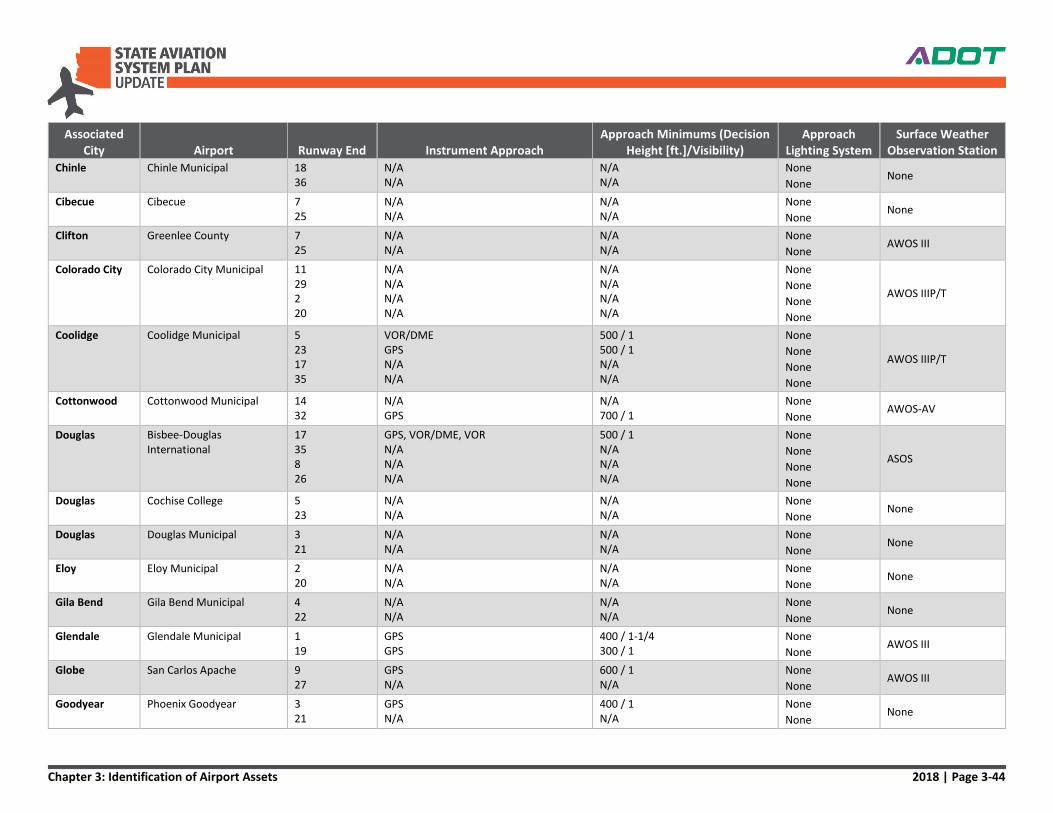
Chapter 3: Identification of Airport Assets 2018 | Page 3-44
Associated City Airport Runway End Instrument Approach
Approach Minimums (Decision Height [ft.]/Visibility)
Approach Lighting System
Surface Weather Observation Station
Chinle Chinle Municipal 18 36
N/A N/A
N/A N/A
None
None None
Cibecue Cibecue 7 25
N/A N/A
N/A N/A
None
None None
Clifton Greenlee County 7 25
N/A N/A
N/A N/A
None
None AWOS III
Colorado City Colorado City Municipal 11 29 2 20
N/A N/A N/A N/A
N/A N/A N/A N/A
None
None
None
None
AWOS IIIP/T
Coolidge Coolidge Municipal 5 23 17 35
VOR/DME GPS N/A N/A
500 / 1 500 / 1 N/A N/A
None
None
None
None
AWOS IIIP/T
Cottonwood Cottonwood Municipal 14 32
N/A GPS
N/A 700 / 1
None
None AWOS-AV
Douglas Bisbee-Douglas International
17 35 8 26
GPS, VOR/DME, VOR N/A N/A N/A
500 / 1 N/A N/A N/A
None
None
None
None
ASOS
Douglas Cochise College 5 23
N/A N/A
N/A N/A
None
None None
Douglas Douglas Municipal 3 21
N/A N/A
N/A N/A
None
None None
Eloy Eloy Municipal 2 20
N/A N/A
N/A N/A
None
None None
Gila Bend Gila Bend Municipal 4 22
N/A N/A
N/A N/A
None
None None
Glendale Glendale Municipal 1 19
GPS GPS
400 / 1-1/4 300 / 1
None
None AWOS III
Globe San Carlos Apache 9 27
GPS N/A
600 / 1 N/A
None
None AWOS III
Goodyear Phoenix Goodyear 3 21
GPS N/A
400 / 1 N/A
None
None None
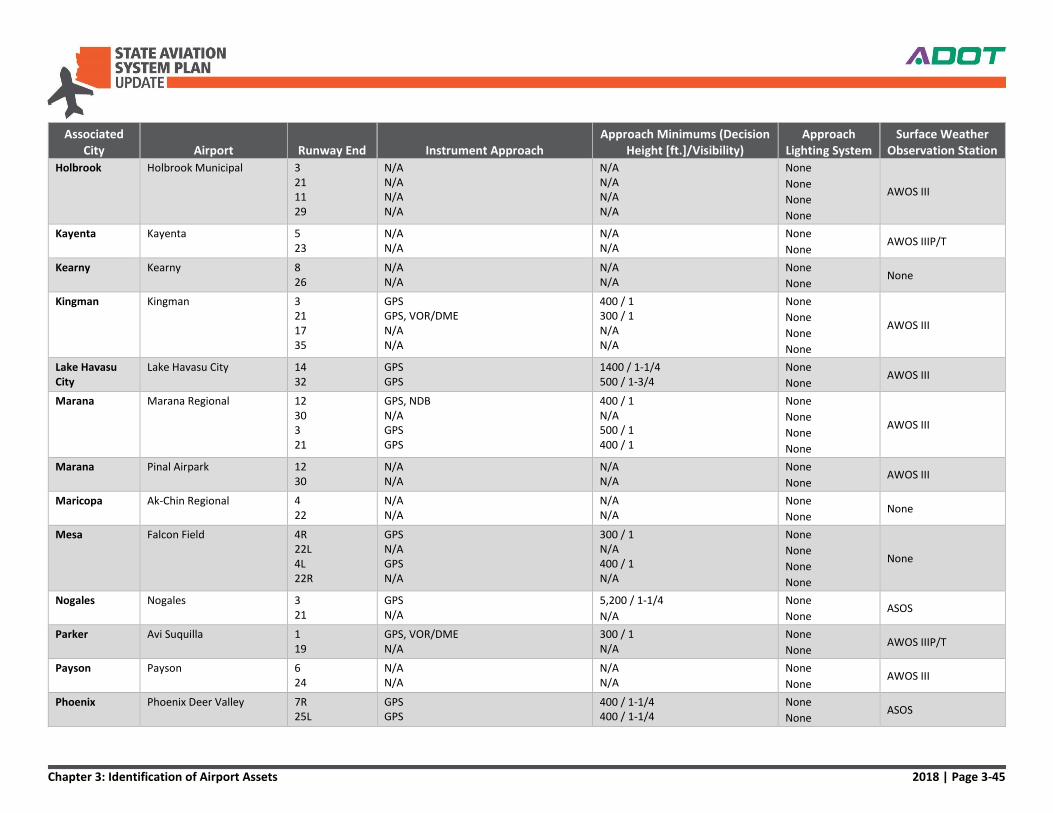
Chapter 3: Identification of Airport Assets 2018 | Page 3-45
Associated City Airport Runway End Instrument Approach
Approach Minimums (Decision Height [ft.]/Visibility)
Approach Lighting System
Surface Weather Observation Station
Holbrook Holbrook Municipal 3 21 11 29
N/A N/A N/A N/A
N/A N/A N/A N/A
None
None
None
None
AWOS III
Kayenta Kayenta 5 23
N/A N/A
N/A N/A
None
None AWOS IIIP/T
Kearny Kearny 8 26
N/A N/A
N/A N/A
None
None None
Kingman Kingman 3 21 17 35
GPS GPS, VOR/DME N/A N/A
400 / 1 300 / 1 N/A N/A
None
None
None
None
AWOS III
Lake Havasu City
Lake Havasu City 14 32
GPS GPS
1400 / 1-1/4 500 / 1-3/4
None
None AWOS III
Marana Marana Regional 12 30 3 21
GPS, NDB N/A GPS GPS
400 / 1 N/A 500 / 1 400 / 1
None
None
None
None
AWOS III
Marana Pinal Airpark 12 30
N/A N/A
N/A N/A
None
None AWOS III
Maricopa Ak-Chin Regional 4 22
N/A N/A
N/A N/A
None
None None
Mesa Falcon Field 4R 22L 4L 22R
GPS N/A GPS N/A
300 / 1 N/A 400 / 1 N/A
None
None
None
None
None
Nogales Nogales 3 21
GPS N/A
5,200 / 1-1/4
N/A
None
None ASOS
Parker Avi Suquilla 1 19
GPS, VOR/DME N/A
300 / 1 N/A
None
None AWOS IIIP/T
Payson Payson 6 24
N/A N/A
N/A N/A
None
None AWOS III
Phoenix Phoenix Deer Valley 7R 25L
GPS GPS
400 / 1-1/4 400 / 1-1/4
None
None ASOS
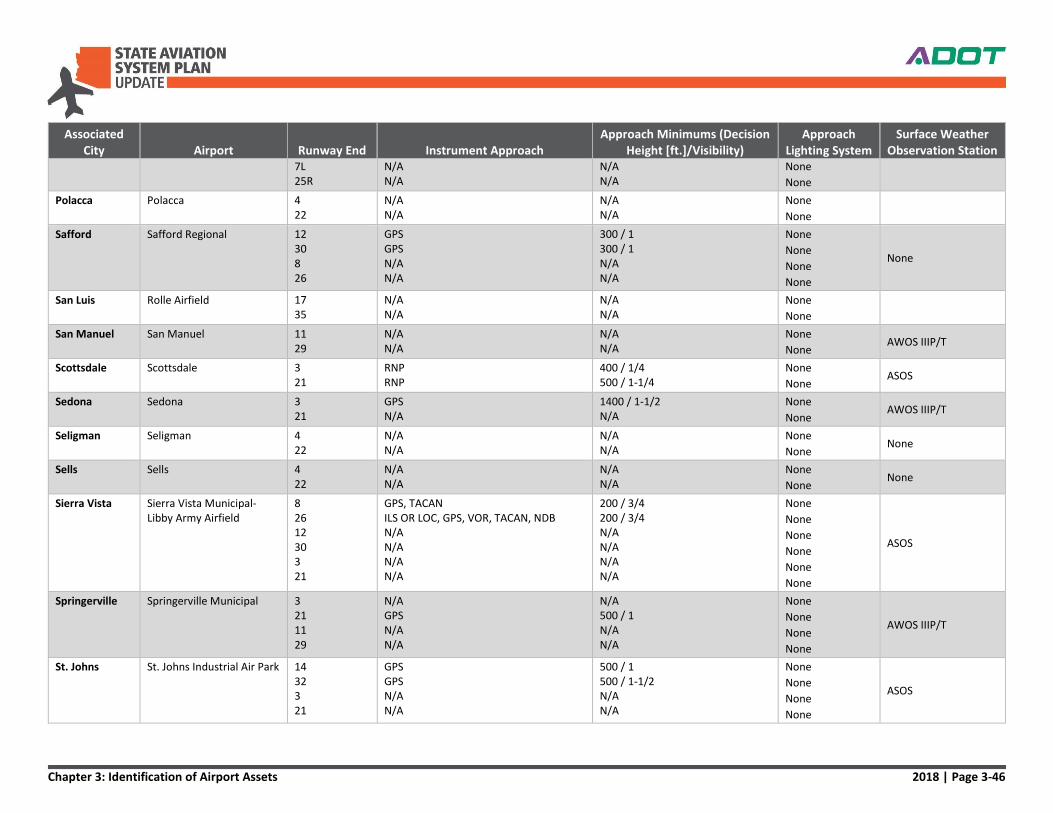
Chapter 3: Identification of Airport Assets 2018 | Page 3-46
Associated City Airport Runway End Instrument Approach
Approach Minimums (Decision Height [ft.]/Visibility)
Approach Lighting System
Surface Weather Observation Station
7L 25R
N/A N/A
N/A N/A
None
None
Polacca Polacca 4 22
N/A N/A
N/A N/A
None
None
Safford Safford Regional 12 30 8 26
GPS GPS N/A N/A
300 / 1 300 / 1 N/A N/A
None
None
None
None
None
San Luis Rolle Airfield 17 35
N/A N/A
N/A N/A
None
None
San Manuel San Manuel 11 29
N/A N/A
N/A N/A
None
None AWOS IIIP/T
Scottsdale Scottsdale 3 21
RNP RNP
400 / 1/4 500 / 1-1/4
None
None ASOS
Sedona Sedona 3 21
GPS N/A
1400 / 1-1/2 N/A
None
None AWOS IIIP/T
Seligman Seligman 4 22
N/A N/A
N/A N/A
None
None None
Sells Sells 4 22
N/A N/A
N/A N/A
None
None None
Sierra Vista Sierra Vista Municipal-Libby Army Airfield
8 26 12 30 3 21
GPS, TACAN ILS OR LOC, GPS, VOR, TACAN, NDB N/A N/A N/A N/A
200 / 3/4 200 / 3/4 N/A N/A N/A N/A
None
None
None
None
None
None
ASOS
Springerville Springerville Municipal 3 21 11 29
N/A GPS N/A N/A
N/A 500 / 1 N/A N/A
None
None
None
None
AWOS IIIP/T
St. Johns St. Johns Industrial Air Park 14 32 3 21
GPS GPS N/A N/A
500 / 1 500 / 1-1/2 N/A N/A
None
None
None
None
ASOS
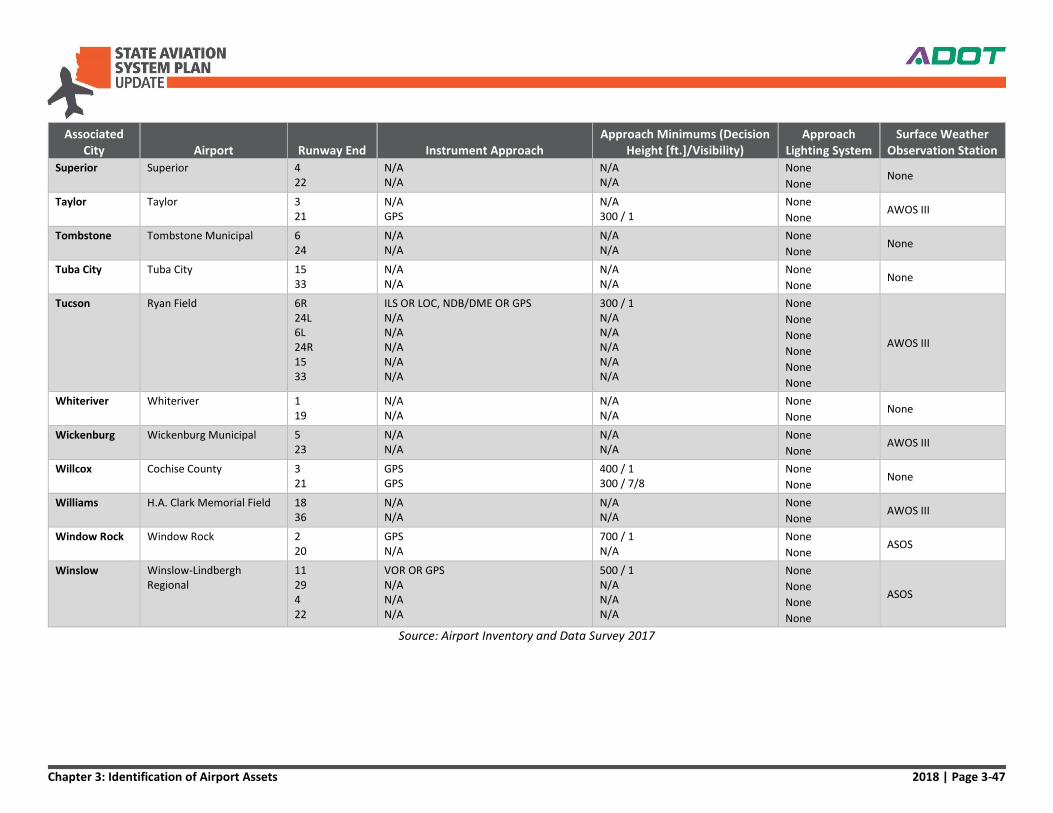
Chapter 3: Identification of Airport Assets 2018 | Page 3-47
Associated City Airport Runway End Instrument Approach
Approach Minimums (Decision Height [ft.]/Visibility)
Approach Lighting System
Surface Weather Observation Station
Superior Superior 4 22
N/A N/A
N/A N/A
None
None None
Taylor Taylor 3 21
N/A GPS
N/A 300 / 1
None
None AWOS III
Tombstone Tombstone Municipal 6 24
N/A N/A
N/A N/A
None
None None
Tuba City Tuba City 15 33
N/A N/A
N/A N/A
None
None None
Tucson Ryan Field 6R 24L 6L 24R 15 33
ILS OR LOC, NDB/DME OR GPS N/A N/A N/A N/A N/A
300 / 1 N/A N/A N/A N/A N/A
None
None
None
None
None
None
AWOS III
Whiteriver Whiteriver 1 19
N/A N/A
N/A N/A
None
None None
Wickenburg Wickenburg Municipal 5 23
N/A N/A
N/A N/A
None
None AWOS III
Willcox Cochise County 3 21
GPS GPS
400 / 1 300 / 7/8
None
None None
Williams H.A. Clark Memorial Field 18 36
N/A N/A
N/A N/A
None
None AWOS III
Window Rock Window Rock 2 20
GPS N/A
700 / 1 N/A
None
None ASOS
Winslow Winslow-Lindbergh Regional
11 29 4 22
VOR OR GPS N/A N/A N/A
500 / 1 N/A N/A N/A
None
None
None
None
ASOS
Source: Airport Inventory and Data Survey 2017
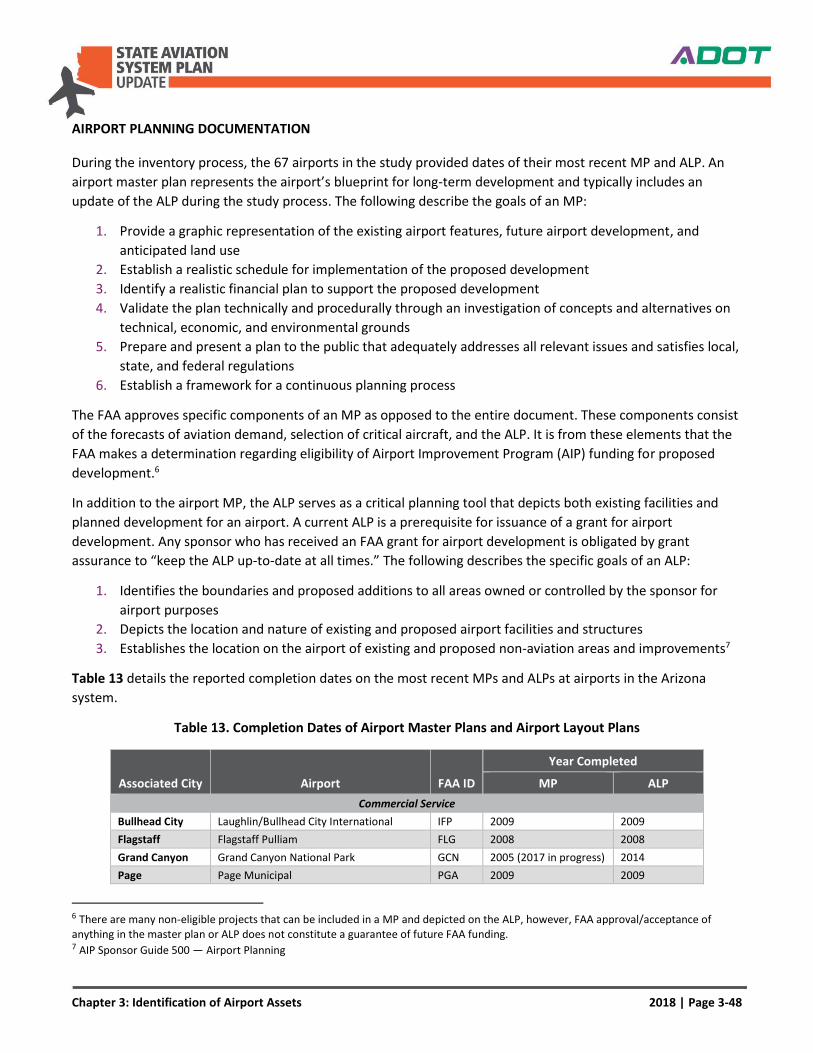
Chapter 3: Identification of Airport Assets 2018 | Page 3-48
AIRPORT PLANNING DOCUMENTATION
During the inventory process, the 67 airports in the study provided dates of their most recent MP and ALP. An
airport master plan represents the airport’s blueprint for long-term development and typically includes an
update of the ALP during the study process. The following describe the goals of an MP:
1. Provide a graphic representation of the existing airport features, future airport development, and
anticipated land use
2. Establish a realistic schedule for implementation of the proposed development
3. Identify a realistic financial plan to support the proposed development
4. Validate the plan technically and procedurally through an investigation of concepts and alternatives on
technical, economic, and environmental grounds
5. Prepare and present a plan to the public that adequately addresses all relevant issues and satisfies local,
state, and federal regulations
6. Establish a framework for a continuous planning process
The FAA approves specific components of an MP as opposed to the entire document. These components consist
of the forecasts of aviation demand, selection of critical aircraft, and the ALP. It is from these elements that the
FAA makes a determination regarding eligibility of Airport Improvement Program (AIP) funding for proposed
development.6
In addition to the airport MP, the ALP serves as a critical planning tool that depicts both existing facilities and
planned development for an airport. A current ALP is a prerequisite for issuance of a grant for airport
development. Any sponsor who has received an FAA grant for airport development is obligated by grant
assurance to “keep the ALP up-to-date at all times.” The following describes the specific goals of an ALP:
1. Identifies the boundaries and proposed additions to all areas owned or controlled by the sponsor for
airport purposes
2. Depicts the location and nature of existing and proposed airport facilities and structures
3. Establishes the location on the airport of existing and proposed non-aviation areas and improvements7
Table 13 details the reported completion dates on the most recent MPs and ALPs at airports in the Arizona
system.
Table 13. Completion Dates of Airport Master Plans and Airport Layout Plans
Associated City Airport FAA ID
Year Completed
MP ALP
Commercial Service
Bullhead City Laughlin/Bullhead City International IFP 2009 2009
Flagstaff Flagstaff Pulliam FLG 2008 2008
Grand Canyon Grand Canyon National Park GCN 2005 (2017 in progress) 2014
Page Page Municipal PGA 2009 2009
6 There are many non-eligible projects that can be included in a MP and depicted on the ALP, however, FAA approval/acceptance of anything in the master plan or ALP does not constitute a guarantee of future FAA funding. 7 AIP Sponsor Guide 500 — Airport Planning
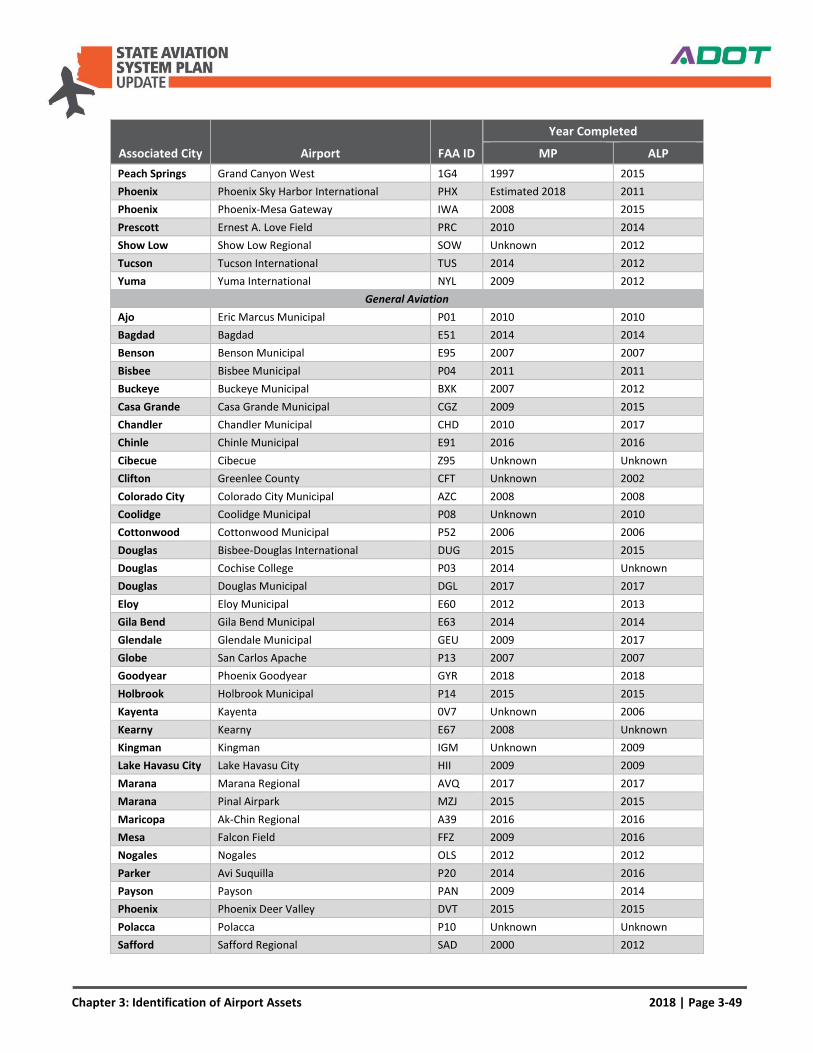
Chapter 3: Identification of Airport Assets 2018 | Page 3-49
Associated City Airport FAA ID
Year Completed
MP ALP
Peach Springs Grand Canyon West 1G4 1997 2015
Phoenix Phoenix Sky Harbor International PHX Estimated 2018 2011
Phoenix Phoenix-Mesa Gateway IWA 2008 2015
Prescott Ernest A. Love Field PRC 2010 2014
Show Low Show Low Regional SOW Unknown 2012
Tucson Tucson International TUS 2014 2012
Yuma Yuma International NYL 2009 2012
General Aviation
Ajo Eric Marcus Municipal P01 2010 2010
Bagdad Bagdad E51 2014 2014
Benson Benson Municipal E95 2007 2007
Bisbee Bisbee Municipal P04 2011 2011
Buckeye Buckeye Municipal BXK 2007 2012
Casa Grande Casa Grande Municipal CGZ 2009 2015
Chandler Chandler Municipal CHD 2010 2017
Chinle Chinle Municipal E91 2016 2016
Cibecue Cibecue Z95 Unknown Unknown
Clifton Greenlee County CFT Unknown 2002
Colorado City Colorado City Municipal AZC 2008 2008
Coolidge Coolidge Municipal P08 Unknown 2010
Cottonwood Cottonwood Municipal P52 2006 2006
Douglas Bisbee-Douglas International DUG 2015 2015
Douglas Cochise College P03 2014 Unknown
Douglas Douglas Municipal DGL 2017 2017
Eloy Eloy Municipal E60 2012 2013
Gila Bend Gila Bend Municipal E63 2014 2014
Glendale Glendale Municipal GEU 2009 2017
Globe San Carlos Apache P13 2007 2007
Goodyear Phoenix Goodyear GYR 2018 2018
Holbrook Holbrook Municipal P14 2015 2015
Kayenta Kayenta 0V7 Unknown 2006
Kearny Kearny E67 2008 Unknown
Kingman Kingman IGM Unknown 2009
Lake Havasu City Lake Havasu City HII 2009 2009
Marana Marana Regional AVQ 2017 2017
Marana Pinal Airpark MZJ 2015 2015
Maricopa Ak-Chin Regional A39 2016 2016
Mesa Falcon Field FFZ 2009 2016
Nogales Nogales OLS 2012 2012
Parker Avi Suquilla P20 2014 2016
Payson Payson PAN 2009 2014
Phoenix Phoenix Deer Valley DVT 2015 2015
Polacca Polacca P10 Unknown Unknown
Safford Safford Regional SAD 2000 2012
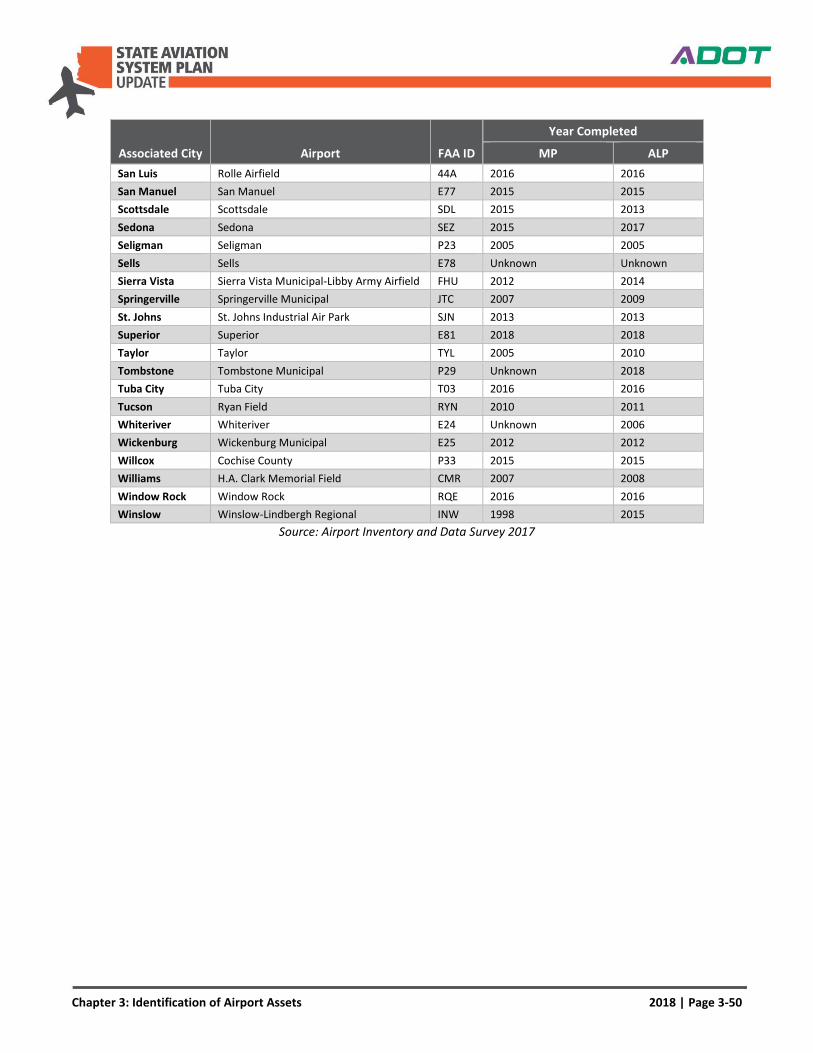
Chapter 3: Identification of Airport Assets 2018 | Page 3-50
Associated City Airport FAA ID
Year Completed
MP ALP
San Luis Rolle Airfield 44A 2016 2016
San Manuel San Manuel E77 2015 2015
Scottsdale Scottsdale SDL 2015 2013
Sedona Sedona SEZ 2015 2017
Seligman Seligman P23 2005 2005
Sells Sells E78 Unknown Unknown
Sierra Vista Sierra Vista Municipal-Libby Army Airfield FHU 2012 2014
Springerville Springerville Municipal JTC 2007 2009
St. Johns St. Johns Industrial Air Park SJN 2013 2013
Superior Superior E81 2018 2018
Taylor Taylor TYL 2005 2010
Tombstone Tombstone Municipal P29 Unknown 2018
Tuba City Tuba City T03 2016 2016
Tucson Ryan Field RYN 2010 2011
Whiteriver Whiteriver E24 Unknown 2006
Wickenburg Wickenburg Municipal E25 2012 2012
Willcox Cochise County P33 2015 2015
Williams H.A. Clark Memorial Field CMR 2007 2008
Window Rock Window Rock RQE 2016 2016
Winslow Winslow-Lindbergh Regional INW 1998 2015
Source: Airport Inventory and Data Survey 2017
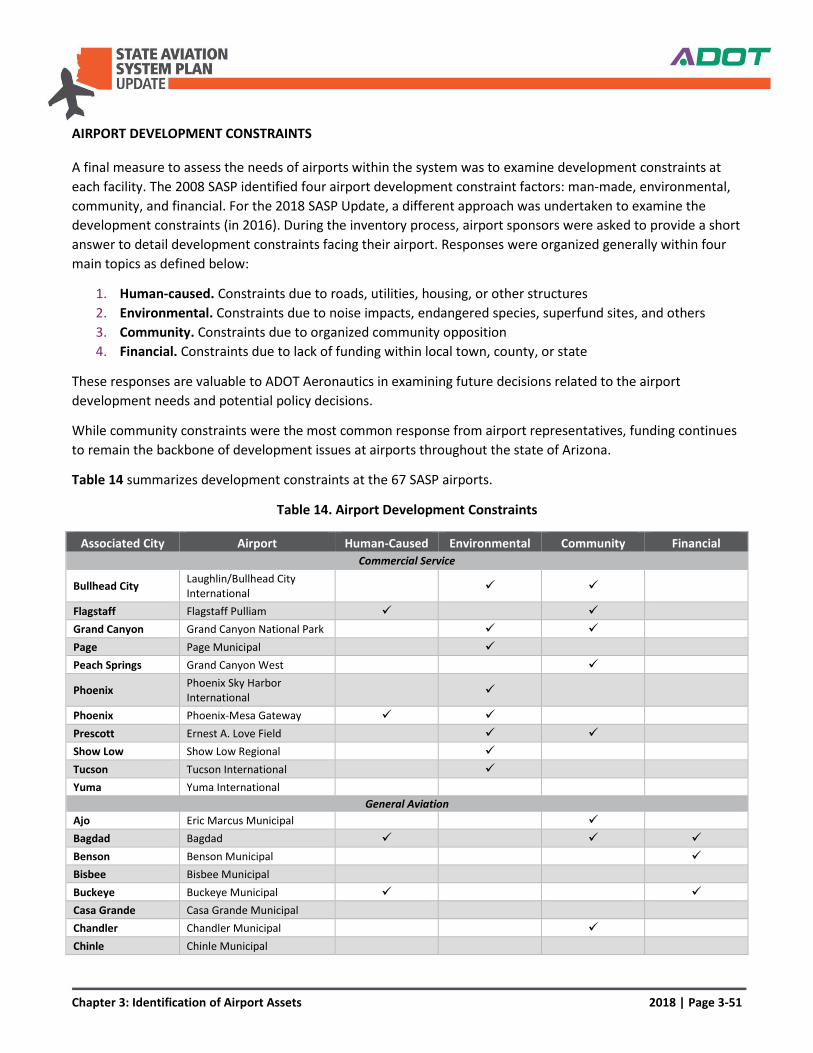
Chapter 3: Identification of Airport Assets 2018 | Page 3-51
AIRPORT DEVELOPMENT CONSTRAINTS
A final measure to assess the needs of airports within the system was to examine development constraints at
each facility. The 2008 SASP identified four airport development constraint factors: man-made, environmental,
community, and financial. For the 2018 SASP Update, a different approach was undertaken to examine the
development constraints (in 2016). During the inventory process, airport sponsors were asked to provide a short
answer to detail development constraints facing their airport. Responses were organized generally within four
main topics as defined below:
1. Human-caused. Constraints due to roads, utilities, housing, or other structures
2. Environmental. Constraints due to noise impacts, endangered species, superfund sites, and others
3. Community. Constraints due to organized community opposition
4. Financial. Constraints due to lack of funding within local town, county, or state
These responses are valuable to ADOT Aeronautics in examining future decisions related to the airport
development needs and potential policy decisions.
While community constraints were the most common response from airport representatives, funding continues
to remain the backbone of development issues at airports throughout the state of Arizona.
Table 14 summarizes development constraints at the 67 SASP airports.
Table 14. Airport Development Constraints
Associated City Airport Human-Caused Environmental Community Financial
Commercial Service
Bullhead City Laughlin/Bullhead City International
✓ ✓
Flagstaff Flagstaff Pulliam ✓ ✓
Grand Canyon Grand Canyon National Park ✓ ✓
Page Page Municipal ✓
Peach Springs Grand Canyon West ✓
Phoenix Phoenix Sky Harbor International
✓
Phoenix Phoenix-Mesa Gateway ✓ ✓
Prescott Ernest A. Love Field ✓ ✓
Show Low Show Low Regional ✓
Tucson Tucson International ✓
Yuma Yuma International General Aviation
Ajo Eric Marcus Municipal ✓
Bagdad Bagdad ✓ ✓ ✓
Benson Benson Municipal ✓
Bisbee Bisbee Municipal
Buckeye Buckeye Municipal ✓ ✓
Casa Grande Casa Grande Municipal
Chandler Chandler Municipal ✓
Chinle Chinle Municipal
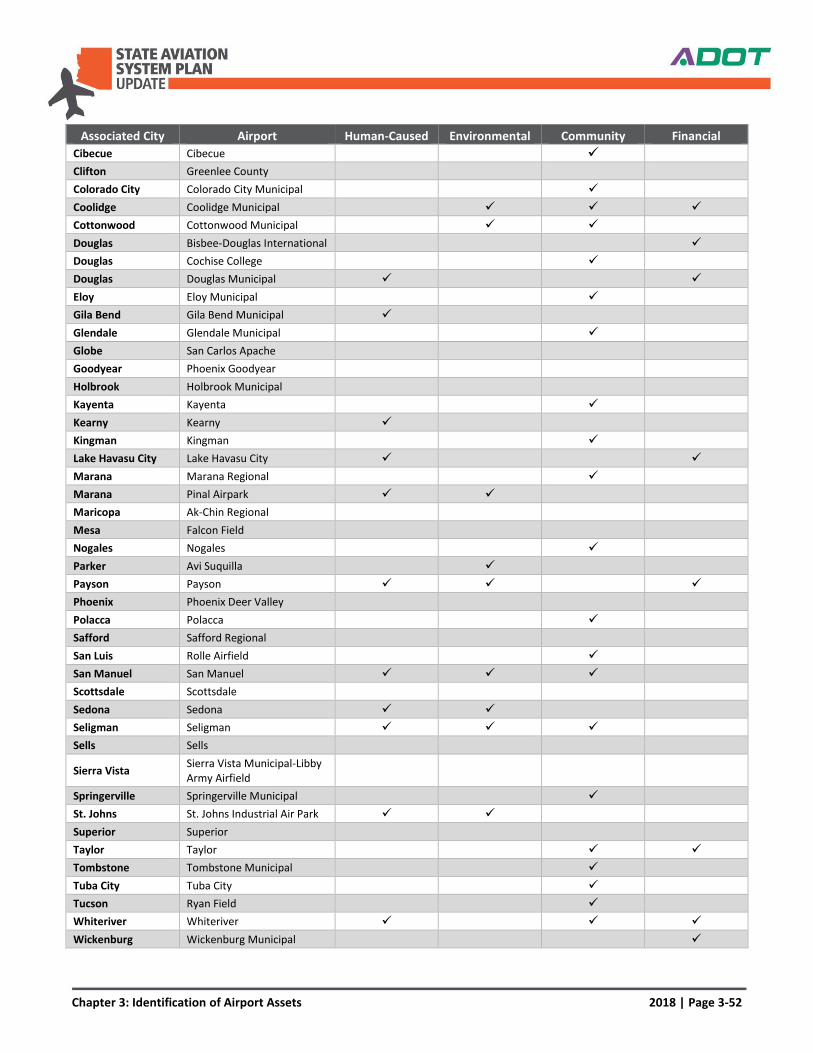
Chapter 3: Identification of Airport Assets 2018 | Page 3-52
Associated City Airport Human-Caused Environmental Community Financial
Cibecue Cibecue ✓
Clifton Greenlee County
Colorado City Colorado City Municipal ✓
Coolidge Coolidge Municipal ✓ ✓ ✓
Cottonwood Cottonwood Municipal ✓ ✓
Douglas Bisbee-Douglas International ✓
Douglas Cochise College ✓
Douglas Douglas Municipal ✓ ✓
Eloy Eloy Municipal ✓
Gila Bend Gila Bend Municipal ✓
Glendale Glendale Municipal ✓
Globe San Carlos Apache
Goodyear Phoenix Goodyear
Holbrook Holbrook Municipal
Kayenta Kayenta ✓
Kearny Kearny ✓
Kingman Kingman ✓
Lake Havasu City Lake Havasu City ✓ ✓
Marana Marana Regional ✓
Marana Pinal Airpark ✓ ✓
Maricopa Ak-Chin Regional
Mesa Falcon Field
Nogales Nogales ✓
Parker Avi Suquilla ✓
Payson Payson ✓ ✓ ✓
Phoenix Phoenix Deer Valley
Polacca Polacca ✓
Safford Safford Regional
San Luis Rolle Airfield ✓
San Manuel San Manuel ✓ ✓ ✓
Scottsdale Scottsdale
Sedona Sedona ✓ ✓
Seligman Seligman ✓ ✓ ✓
Sells Sells
Sierra Vista Sierra Vista Municipal-Libby Army Airfield
Springerville Springerville Municipal ✓
St. Johns St. Johns Industrial Air Park ✓ ✓
Superior Superior
Taylor Taylor ✓ ✓
Tombstone Tombstone Municipal ✓
Tuba City Tuba City ✓
Tucson Ryan Field ✓
Whiteriver Whiteriver ✓ ✓ ✓
Wickenburg Wickenburg Municipal ✓
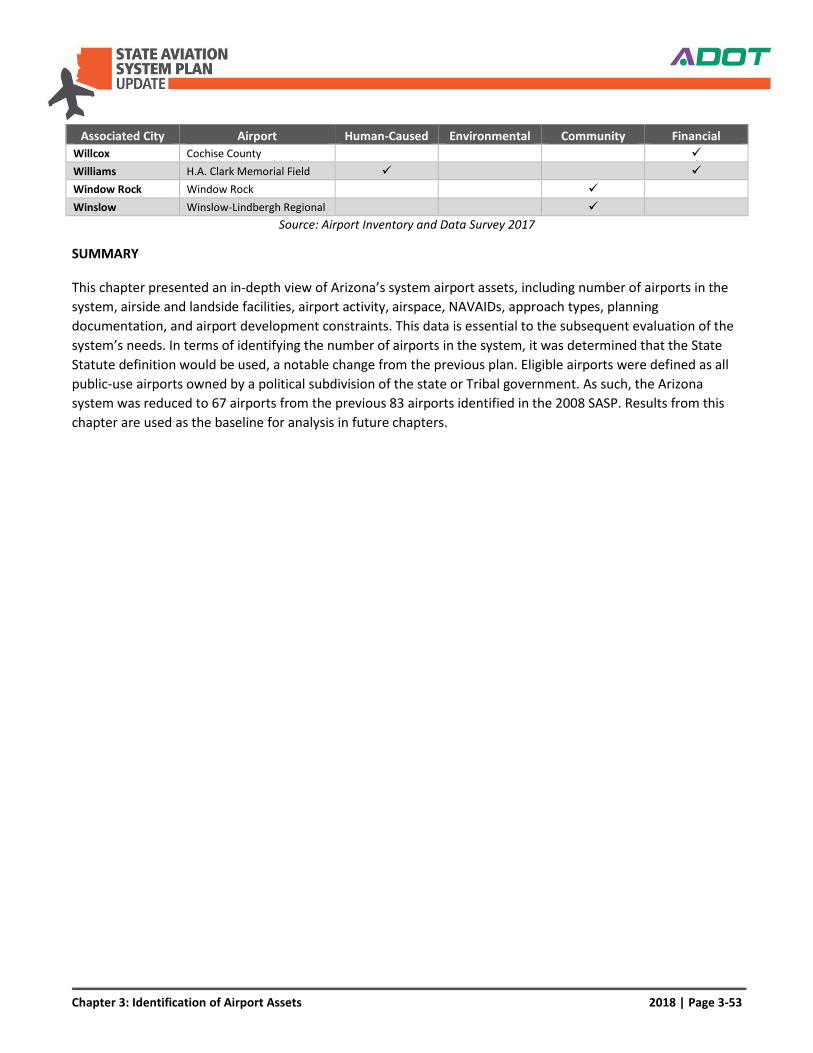
Chapter 3: Identification of Airport Assets 2018 | Page 3-53
Associated City Airport Human-Caused Environmental Community Financial
Willcox Cochise County ✓
Williams H.A. Clark Memorial Field ✓ ✓
Window Rock Window Rock ✓
Winslow Winslow-Lindbergh Regional ✓
Source: Airport Inventory and Data Survey 2017
SUMMARY
This chapter presented an in-depth view of Arizona’s system airport assets, including number of airports in the
system, airside and landside facilities, airport activity, airspace, NAVAIDs, approach types, planning
documentation, and airport development constraints. This data is essential to the subsequent evaluation of the
system’s needs. In terms of identifying the number of airports in the system, it was determined that the State
Statute definition would be used, a notable change from the previous plan. Eligible airports were defined as all
public-use airports owned by a political subdivision of the state or Tribal government. As such, the Arizona
system was reduced to 67 airports from the previous 83 airports identified in the 2008 SASP. Results from this
chapter are used as the baseline for analysis in future chapters.
Top Related