


Languages
Pages
Legal


2035 Model Review
Tri-County Regional Planning Commission

Model Development Phase I (1991-2)
• Initial model converted from MDOT Mainframe to TRANPLAN with TRANSCAD network editor and data interface which converted and exported network from TRANSCAD format to TRANPLAN, then converted output back to TRANSCAD
• SE data & demographic forecasts
• “Quick calibration” to 1990 base year for 2015 Plan—went from about 260 zones point loaded to 460 zones;
• Updated capacities based on 1985 HCM plus FDOT work
• Done by Barton Aschman Associates, later the Parsons Transportation Group

SE Data Model Development
• Full SE Data Model –GIS Based:
• Control totals, two staged local review process(modified Delphi)
• Zoning, Future Land Use Plans, vacant lands, environmental constraints ( soils, slopes, wetlands, parks, cemeteries etc.), accessibility from travel model(feedback loop but not closed)
• Multiple sources of employment data and control totals

Model Development Phase II(1995-6)
• Updated Model—converted to Framework• Went from 460 zones to 834 zones• MSU a Separate Purpose, Balance A’s to P’s based on
classroom seat data • Cross Class Trip Gen• Added Nested Logit Transit Model• Updated Capacity Calculator to 1997 HCS• Added Park/Walk • Converted to Peak Period• Recalibrated to 2000 base year• Regional 2025 Plan—October 2003


“Regional Growth: Choices for Our Future”—core of our planning process
Land Use Alternatives Analysis=Trends or “Business as Usual” Vs. “Wise Growth”Build Out Vs. “Wise Growth” Build Out
Eight network alternatives—high transit, medium transit, demand reduction/improve operations, combos, projects (Wise Growth), projects (trends), highways only
Network alternatives analysis also core of Congestion Management process)
Consultants beg to be let go, but finished scope/lost money

New Contract: Corradino GroupPhase III (2004)
Meet conformity deadline & requirements;
Regional 2030 Plan -- update adopted plan, extend it five years
(Phase IV) (2006)
Update model and calibrate to 2005, update capacities to new manual
Full update to SE data model to 2045
Fully convert both to TRANSCAD
Add other enhancements
Complete modeling for 2035 Plan

Staff Vs. Consultants
• FAMPO Survey/David Lee (2009, Fredericksburg MPO)
• 146/201 TMAs, with some smaller areas, but focus > 200K (76.4% response)
• 60 %- consultants• 20 %- in house with supports• 15-20% - depend on DOT

Consultant Vs. Staff, or Both?• Global marketplace for modelers• Balancing cost and staffing availability• Continuity, extension of staff, teaming• Travel modelers are not demographers-
demographers are not necessarily travel modelers, neither are necessarily traffic engineers or GIS experts
• Local knowledge and experience• Higher level model enhancements may require
consultants

Socioeconomic Forecasts
REMI
Global Insights Zoning
Woods & Poole Future Land Use
2030 Plan Accessibility
County, MCD & TAZ levels
Trend & Wise Growth
Population Data
US Census, ACS, Sub-County estimates MESA, Claritas, Dun & Bradstreet
Employment Data
Socioeconomic Forecasting Model
Population & Employment Forecasts

Socioeconomic Data Summary
Regional Data 2005
2010 Adopted
Trend Forecast
2035 Adopted
Trend Forecast
2035 Wise Growth Build Out
Wise Growth
Build Out
Population 454,667 451,260 491,808 491,808 1,163,800 1,076,300 Retail Employment 49,431 49,319 50,764 50,765 112,600 112,600 Non-Retail Employment 231,355 232,599 248,880 248,882 377,400 377,400 Households 181,836 181,082 212,914 212,914 446,200 446,200 Vehicles 331,219 315,111 352,938 352,938 925,500 812,100


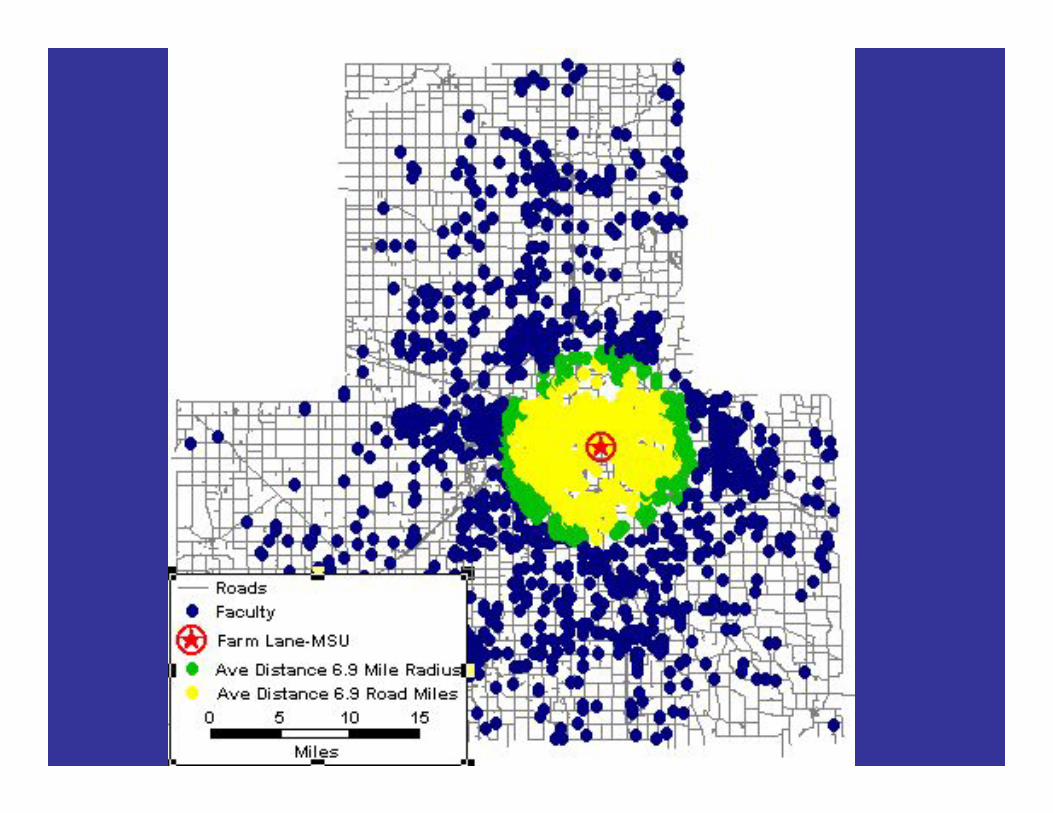
•Reduce congested lane miles on regional roads by approximately 50 percent and save taxpayers between 1.6 and 4.8 billion dollarsin road improvement costs which would otherwise be required if current trends are unchecked.•Save the equivalent of three townships of agricultural land and open space.•Reduce air pollutants by tens of thousands of kilograms per day, leading to public health benefits and lower long term public healthcosts.•Improve the region’s quality of life and economic competitivenessin an increasingly global economy greater than would occur under current public policies.
REGIONAL VISION IMPLEMENTATION

Model Improvements• TAZ increased from 834 to 1,082 • Better feedback loop between network skimming
and traffic assignment processes based on D. Boyce, 2007
• Freight component added (QRFM 1)• All programs in TransCAD (batch files) using the
latest version (5.0r3) – no more Fortran codes & Tranplan
• Improve MSU Commuter Lots & Transit• GUI/File Management System• Integrated calling Mobile 6.2 from TransCAD

Model Improvements• Transit improvement on routes and stop
locations• Congested cost and fuel consumption
calculation added• Better network coding, fix errors in road coding
from previous model• Using latest version TransCAD-- managing
parameter changes and sensitivity analysis are easier
• Updated capacity for LOS D using Highway Capacity Manual version 2000

MI Travel Counts Data
• Consultants reviewed the data, applied based on their professional judgment
• Limited use • Trip rates/externals• Aggregation use issues Vs. cost of
sampling?• No local transit O-D’s for FTA New Starts
in spite of extensive surveying—question and study design issues

Traffic Counts
• Traffic counts used for 2005 calibration reduced from 1,720 (LRP 2030, 2000 base year) to 607 stations—sampling method applied
• Peak hour coefficients derived from previous LRP and adjusted 1% (up and down) for HBO and HBW
• Additional peak hour coefficient is introduced in current LRP 2035 for three types of freight: four-tire, single-unit and combined.

Traffic Count Locations

Mode Choice
Choice
Drive Alone
Shared Ride 2 Persons
Shared Ride 3+ Persons
Drive to Commuter Lot
Drive Access
Walk Access
Auto Transit
The coefficient values are computed based on the following assumptions: •Average value of time per minute = $0.2•Average auto operating cost per mile = $0.12•Average auto occupancy for Share Ride 2 Persons = 2•Average auto occupancy for Shared Ride 3+ Persons = 3.2•Weight of out of vehicle is assumed 2.5 times the weight of in-vehicle travel time.

Mode Choice ResultsSurvey•CATA Survey• Total Daily Average Ridership September 2005: 42,860•MSU Survey•Total Daily Commuter Riders: 2,160
Model•Total Daily Transit Passengers: 42,922 •MSU Commuter lot riders : 2,147 vehicles

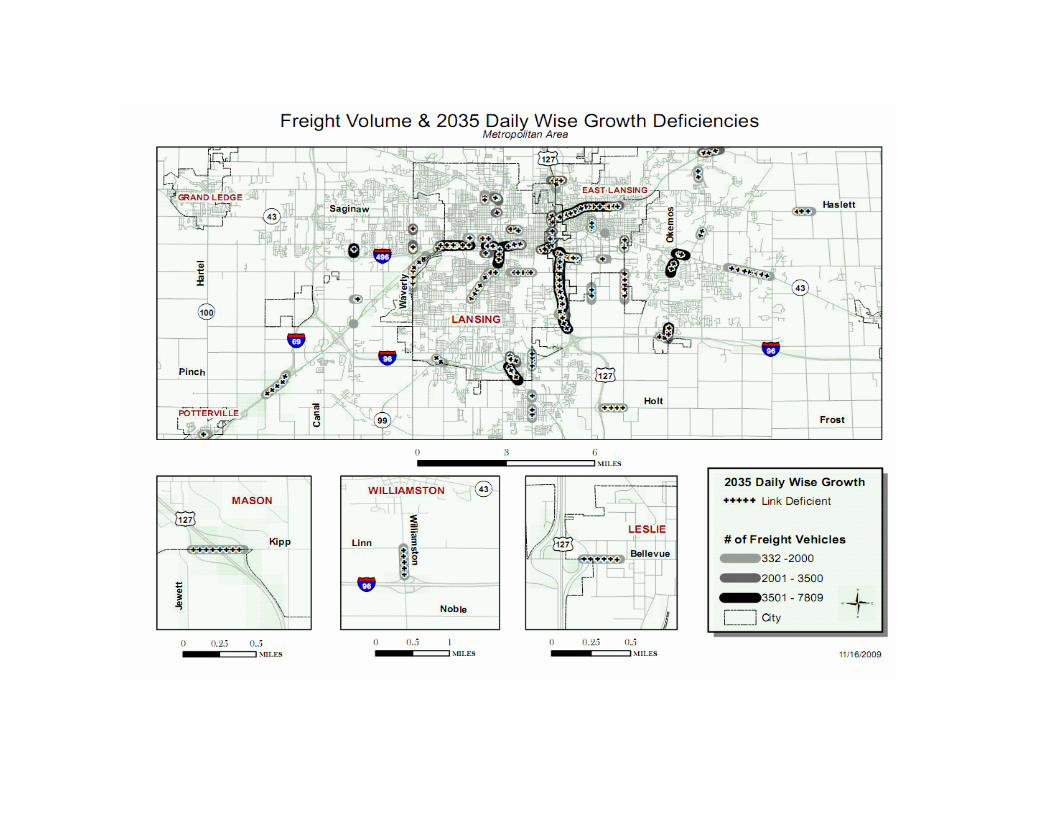
• Based on USDOT publication Quick Response Freight Manual (QRFM)
• Trip generation based on QRFM:
• Passenger Car Equivalents (PCEs) based on QRFM & HCM 2k: 1.5, 2, and 4 for 4-tire, Single, and Combined.
Freight Component
Non-RetailIndustrial Commercial Service
4-tire 0.138 0.117 0.066Single-unit 0.161 0.146 0.058Combined 0.9 0.044 0.019 0.016
RetailVehicle Type Occupied Dwelling Unit
0.0240.042
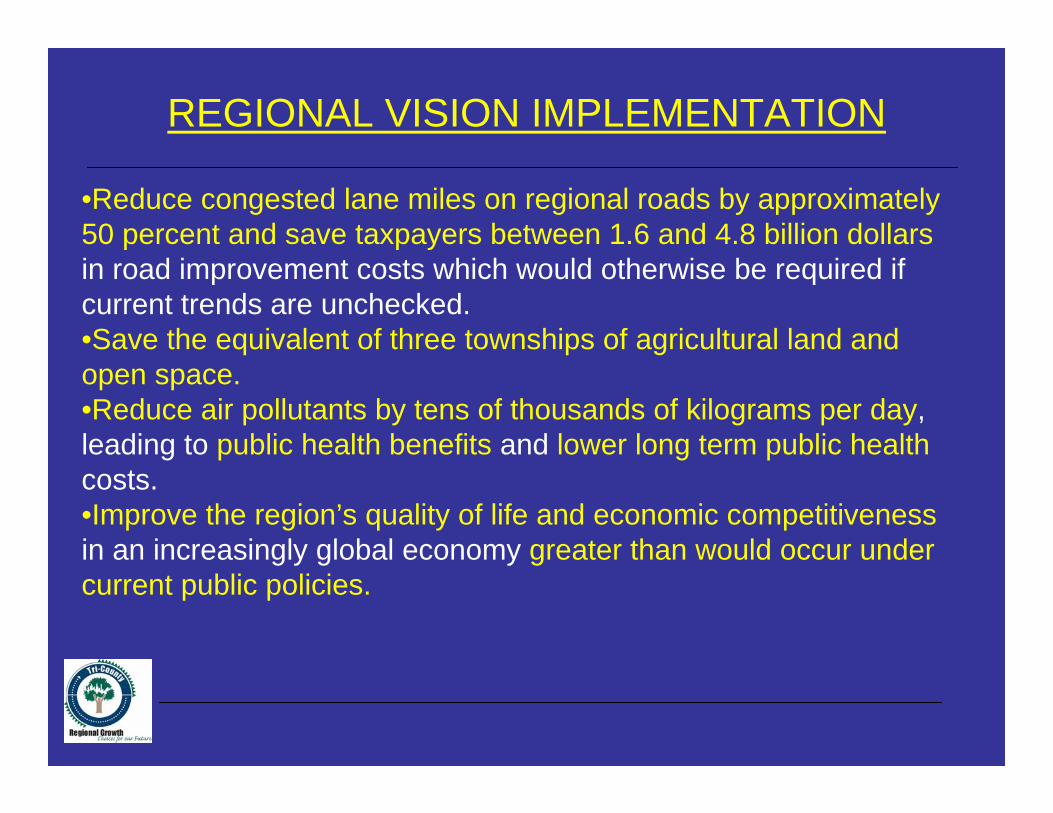
Time-of-Day Factors (%) 2035 LRP Values
HBW HBO MSU NHB Four-tire Single-unit Combines EXT9.54 9.5410.54 10.54 3.78
1.01 1.17 1.17 4.782.01 2.17 2.17
9.13 9.138.13 8.13 29.8113.8 13.8 28.8112.8 12.8
P -> A 25.44 31.33 31.3323.4422.44
35.03
23.5
63.535.03
21.51
A -> P
A -> P
A -> P
25.55
3.05
PM
27.12
66.41 60.55Off- Peak
P -> A19.4 14.4
66.1 74.5
Period DirectionTrip Purpose
AM
12.3313 14.5 11.1P -> A
Time-of-Day Factors

Calibration & Validation
Model
Period: DailyTotal of link volumes: 6,351,101Volume/Count Ratio = 1.01
VMT: 3,715,783VHT: 64,671Volume/Count VMT: 1.03
Assignment Results Summary
Traffic Counts
No of Counts: 489Total of Traffic Count: 6,282,756RMSE : 38.08%
VMT:3,595,924VHT: 63,083
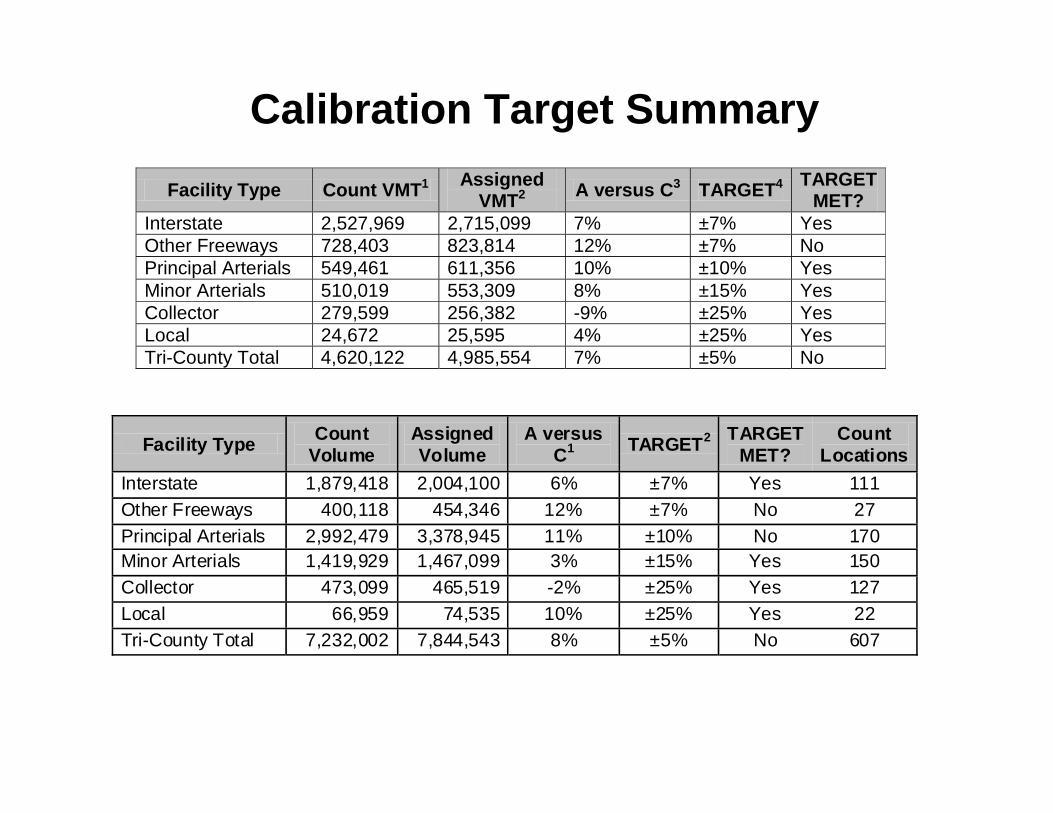
Facility Type Count VMT1 Assigned VMT2 A versus C3 TARGET4 TARGET
MET? Interstate 2,527,969 2,715,099 7% ±7% Yes Other Freeways 728,403 823,814 12% ±7% No Principal Arterials 549,461 611,356 10% ±10% Yes Minor Arterials 510,019 553,309 8% ±15% Yes Collector 279,599 256,382 -9% ±25% Yes Local 24,672 25,595 4% ±25% Yes Tri-County Total 4,620,122 4,985,554 7% ±5% No
Facility Type Count Volume
Assigned Volume
A versus C1 TARGET2 TARGET
MET? Count
LocationsInterstate 1,879,418 2,004,100 6% ±7% Yes 111 Other Freeways 400,118 454,346 12% ±7% No 27 Principal Arterials 2,992,479 3,378,945 11% ±10% No 170 Minor Arterials 1,419,929 1,467,099 3% ±15% Yes 150 Collector 473,099 465,519 -2% ±25% Yes 127 Local 66,959 74,535 10% ±25% Yes 22 Tri-County Total 7,232,002 7,844,543 8% ±5% No 607
Calibration Target Summary

--7%7,681,5087,131,826All Count Groups
Yes±15%14%2,659,7242,290,97825,001-50,000
Yes±20%8%3,660,1213,373,20110,001-25,000
Yes±25%-1%943,411956,5425,001- 10,000
Yes±50%-19%284,736338,9262,501 - 5,000
Yes±100%-29%113,868146,6491,001 - 2,500
Yes±200%-30%19,64825,5301 - 1,000
TARGET METTARGET2A versus C1Assigned
VolumeCount
VolumeVolumeGroup
Calibration Target Summary

Model Use


Chapter 11—Alternatives Analysis
• Eight options considered:• 1) High transit• 2) Medium transit• 3) Demand reductions/improve operations• 4) Combine of 2 & 3• 5) Combine 2, 3 & projects (recommended)• 6) Projects (wise growth)• 7) Projects (trends)• 8) Highways only• Adopted plan


Daily VMT of Alternatives
13,500,000
14,000,000
14,500,000
15,000,000
15,500,000
16,000,000
16,500,000
17,000,000
1-High Transit 2-MediumTransit
3-DemandReduction/
ImproveOperations
4-Combinationof 2 & 3
5-Combinationof 2,3, & 6A
6A-PotentialHighway
Options onWise Growth
6B-PotentialHighway
Options onTrend
7-Highwaysonly
8-Combinationof 2,3 &
Adopted Plan
Alternatives
VMT
(mile
s)

Daily Congested Lane Miles
0.0
10.0
20.0
30.0
40.0
50.0
60.0
1-High Transit 2-MediumTransit
3-DemandReduction/
ImproveOperations
4-Combinationof 2 & 3
5-Combinationof 2,3, & 6A
6A-PotentialHighway
Options onWise Growth
6B-PotentialHighway
Options onTrend
7-Highwaysonly
8-Combinationof 2,3 &
Adopted Plan
Alternatives
Mile
s

0
10
20
30
40
50
60
70
80
90
1-High Transit 2-MediumTransit
3-DemandReduction/
ImproveOperations
4-Combinationof 2 & 3
5-Combinationof 2,3, & 6A
6A-PotentialHighway
Options onWise Growth
6B-PotentialHighway
Options onTrend
7-Highwaysonly
8-Combinationof 2,3 & Adopted
Plan
Alternatives
Trip
s (in
thou
sand
)
Daily Unlinked Transit Trips by Transportation Alternative(System Total )

HC and NOx (Delay)
4
4.2
4.4
4.6
4.8
5
5.2
5.4
1-High Transit 2-Medium Transit 3-DemandReduction/
ImproveOperations
4-Combination of2 & 3
5-Combination of2,3, & 6A
6A-PotentialHighway Optionson Wise Growth
6B-PotentialHighway Options
on Trend
7-Highways only 8-Combination of2,3 & Adopted
Plan
Alternatives
kg/d
ay (i
n th
ousa
nd)
HCNOx
2005 Base Year
HC = 16,467 kg/day
NOx = 30,759 kg/day
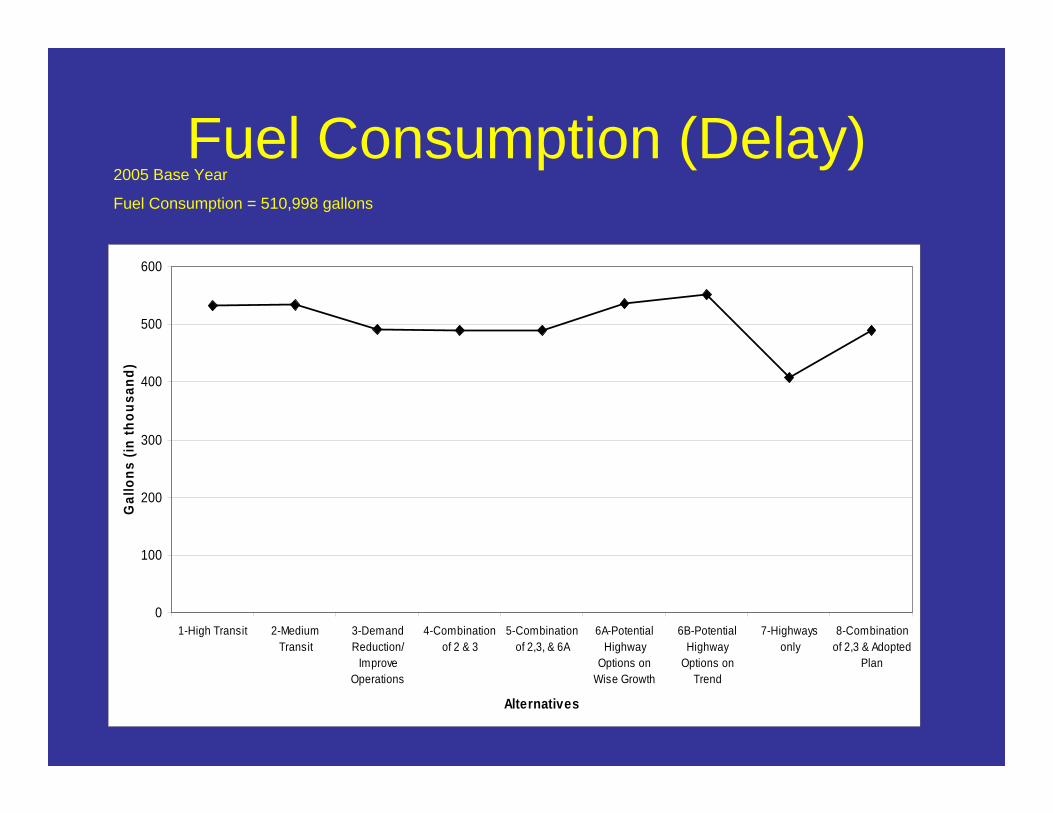
Fuel Consumption (Delay)
0
100
200
300
400
500
600
1-High Transit 2-MediumTransit
3-DemandReduction/
ImproveOperations
4-Combinationof 2 & 3
5-Combinationof 2,3, & 6A
6A-PotentialHighway
Options onWise Growth
6B-PotentialHighway
Options onTrend
7-Highwaysonly
8-Combinationof 2,3 & Adopted
Plan
Alternatives
Gal
lons
(in
thou
sand
)
2005 Base Year
Fuel Consumption = 510,998 gallons

25,183.054,510.844,674.422035 Action
24,962.794,681.524,668.012030 Action
24,743.595,394.624,766.882025 Action
24,347.517,825.936,115.142018 Action
23,990.1317,759.999,943.862010 Action
-----48,145.1025,691.908 Hour Conformity Budget
DAILY VMT**NOxVOCScenario
Emissions*
Regional Transportation Conformity Analysis , 8 Hour Ozone Standard, Regional 2035 Transportation Plan and
2008-2011 Transportation Improvement Program

Model Use for Other Projects
• Road diet analysis• Marketing analysis -- LSJ (traffic flow to
retail areas/origins)• Michigan Avenue Grand River Corridor
alternatives analysis• Lansing comp plan update• Various other corridor studies in progress
in town—IPACE/Lake Lansing, elsewhere

Future Directions
• New TIP has 400K STPU—2012-14, plus match• Update the model for LRP 2040: network, SE data,
transit, parking, count data• Integration with MOVES2010• Calibrate to 2010 base year• Climate change/GHG/Other new requirements???• Various enhancements TBD…Probably Minor….• Strategic Plan……..wait—review again?• Activity Based Trip Gen• Dynamic Assignment?

Thank You
Paul T. Hamilton, Chief Planner
Tri-County Regional Planning Commission (TCRPC)913 W. Holmes Road, Ste. 201
Lansing, MI 48910517.393.0342 (phone)
517.393.4424 (fax)
[email protected] (email)www.mitcrpc.org (web)