


Languages
Pages
Legal


2022 Draft Budget Highlights Page 2

2022 Draft Budget Highlights Page 3
Contents Message from the CAO ........................................................................................................................ 5 Sarnia City Council ............................................................................................................................. 6 Organizational Structure ...................................................................................................................... 7 Sarnia Home ...................................................................................................................................... 8 2022 Draft Budget Overview ................................................................................................................ 9 Budget ............................................................................................................................................ 10
5 Fiscal Fitness Pillars ..................................................................................................................... 10 Responsible Financial Management ..................................................................................................... 10 Budget Process ................................................................................................................................. 11 Things We Do ................................................................................................................................... 12 Property Taxation – Where Does It Go? ............................................................................................... 14 How is the City’s Budget Structured? .................................................................................................. 15
1. Operating Budget: .................................................................................................................... 15 2. Capital Budget: ......................................................................................................................... 15 3. Reserves Budget: ...................................................................................................................... 15 4. Fees for Services: ..................................................................................................................... 16
Proposed 2022 Budgets – Expenditures ............................................................................................... 16 2022 Draft Expenditures .................................................................................................................... 17 2022 Draft Staff Summary ................................................................................................................. 18 Total Amount to be Collected through Taxation and Rates ..................................................................... 19 What Does This Proposed Property Tax Increase Mean to Sarnia’s Residential Property Owners? ................ 20 Property Tax Comparison to Comparitor Municipalities .......................................................................... 21 Property Tax Comparison to Neighbouring Municipalities........................................................................ 22 Sarnia’s Response to the COVID-19 Pandemic ...................................................................................... 23 What are the Key Things Causing the Proposed Increase to Property Taxes/Rates? ................................... 24 What Does the City’s Proposed Increase Mean For My Total Tax Bill?....................................................... 26 How Do City of Sarnia Taxes Compare to our Comparitor Municipalities? ................................................. 27 How Do City of Sarnia Taxes Compare to our Neighbouring Municipalities? .............................................. 28 Asset Management - Capital Budget .................................................................................................... 29 2022 Draft Capital Budget ................................................................................................................. 30 2022 Draft Capital Budget – Where the $ Comes From .......................................................................... 31 Budget Highlights ............................................................................................................................. 32

2022 Draft Budget Highlights Page 4
Appendicies ..................................................................................................................................... 33 Appendix 1: 2022 Draft Operating Budget Summary .......................................................................... 34 Appendix 2: 2022 Proposed Capital Projects ...................................................................................... 36 Appendix 3: Reserves and Reserve Funds ......................................................................................... 38 Appendix 4: Proposed Water and Sewer Rates ................................................................................... 39

2022 Draft Budget Highlights Page 5
MESSAGE FROM THE CAO
Despite 2021’s unprecedented challenges, our strong community worked together to build our incredible City of Sarnia.
Around the world, individuals, businesses, and communities work to recover from the COVID-19 pandemic which has shifted our focus, changing the way we work and live. Over the last year employees have had to re-evaluate how best to meet the needs of our City. Prioritizing the safety of our employees and residents, we implemented safety procedures, worked remotely, and held City Council meetings virtually, to ensure we continue to provide the best possible service to our residents.
In September, Council was presented with staff’s 2022 capital project requests totalling $55,156,431. This is lower than the 2021 capital budget, which was an unprecedented level of capital investment for the City, although still a significant capital request. The current requests reflect the significant needs of aging infrastructure, new development requirements, opportunities to leverage grants, and a desire to invest in the City’s assets. To maintain the City’s reserves, the draft capital requests will need to be updated to reflect some challenging recommendations for the deletion or deferral of projects.
The financial impacts of the COVID-19 pandemic in 2021 are expected to be offset through Safe Restart Funding; the City expects that unused Safe Restart funding will be available to meet any ongoing challenges in 2022. As a result, the budget has once again been prepared assuming normal operations.
We are committed to continuous improvement in operational and financial efficiencies. By working collaboratively with each other and Council, employees continue to provide our residents, taxpayers, and visitors the excellence they deserve. City Hall was closed to the public through much of 2021, however employees have continued to provide service through email, telephone, and some in-person appointments for critical services such as marriage licenses.
Staff are committed to continuous improvement of our operations and continually seeking out ways to improve efficiencies. Our operational and capital plans will allow us to manage our financial requirements while continuing to move sustainably forward. Sarnia has many exciting projects underway that will further transform our City into a more connected, vibrant, and sustainable city.

2022 Draft Budget Highlights Page 6
Sarnia City Council

2022 Draft Budget Highlights Page 7
ORGANIZATIONAL STRUCTURE
2022 Draft Budget Highlights Page 8
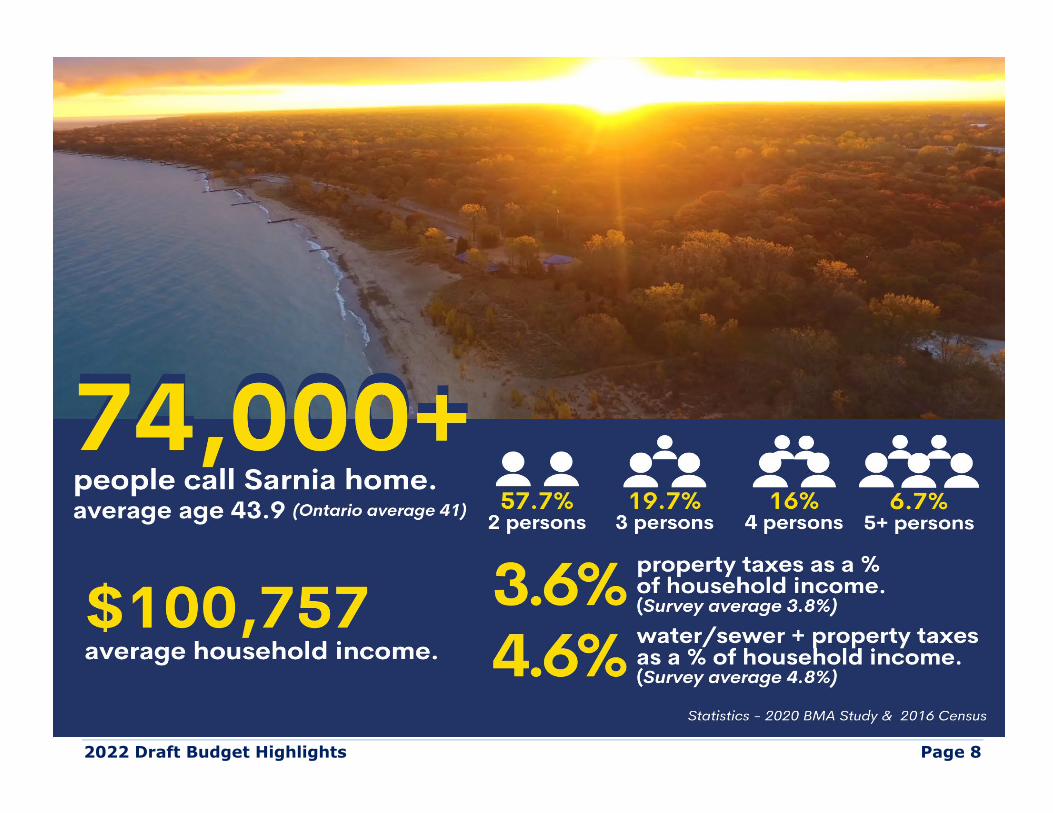
SARNIA HOME

2022 Draft Budget Highlights Page 9
2022 DRAFT BUDGET OVERVIEW The 2022 Draft Budget results in an increase of 2.99% in the general levy and 2.78% to the Transit area levy for a combined increase of 2.98%. A 1% change in the general levy is approximately $780,000. The combined increase in Water and Sewer rates is 6.85%.
The proposed general levy increase is comprised of an increase of 0.67% for direct decisions under management’s control, 2.59% for items outside of management’s control including the recently approved Sarnia Police Services Board budget (1.57%), and 4.69% for impacts from prior decisions including the reversal of prior year mitigation efforts (3.43%). To mitigate the 7.94% increase in the base budget, management is proposing additional operating support transferred from reserves (5.22%).
The operating support is coming from recent surpluses, including the anticipated 2021 operating budget surplus. This is not a sustainable mitigation tool over multiple years, it can be effective when surpluses exist and external pressures such as a pandemic-impacted economy, which could otherwise limit property owners to absorb an increase, is a consideration.
The Draft Budget has been prepared assuming no COVID-19 impacts. However, staff anticipate the City will still experience ongoing financial impacts of the pandemic in 2022, such as reduced programming and increased personal protective equipment, cleaning, and security costs. The City is expecting that these impacts will continue to be offset by the COVID-19 Safe Restart funds in reserves at the end of 2021.
The City has prepared capital requests that continue to reflect an aggressive and expansive capital program with $55,156,431 of capital projects being put forward. This is $6,603,374 million lower than the historically high 2021 Approved Capital Budget but is still beyond the capacity of the City’s projected reserves. Management is continuing to work through the capital requests to make the appropriate recommendations to Council for approval of the 2022 Draft Capital Budget.
Increases in water and sewer rates reflects increases to reserves as outlined in the recent Water Rate study as well as increases in the City’s share of the Lambton Area Water Supply System costs.

2022 Draft Budget Highlights Page 10
BUDGET The budget is our plan to manage your money and other funding we receive to deliver the services important to you, your family and our community.
5 FISCAL FITNESS PILLARS
RESPONSIBLE FINANCIAL MANAGEMENT Align City services and capital investment with citizen expectations and ability to pay.
Reduce Debt Increase Reserves and Reserve Funds
Maintain Affordable
Service Levels
Infrastructure Renewal
Maintain Reasonable Tax
Rates
Maintain Reasonable Tax Rates
Aggressively Manage Our Assets
Foster Financial Sustainability
Grow and Diversify Revenues
2022 Draft Budget Highlights Page 11
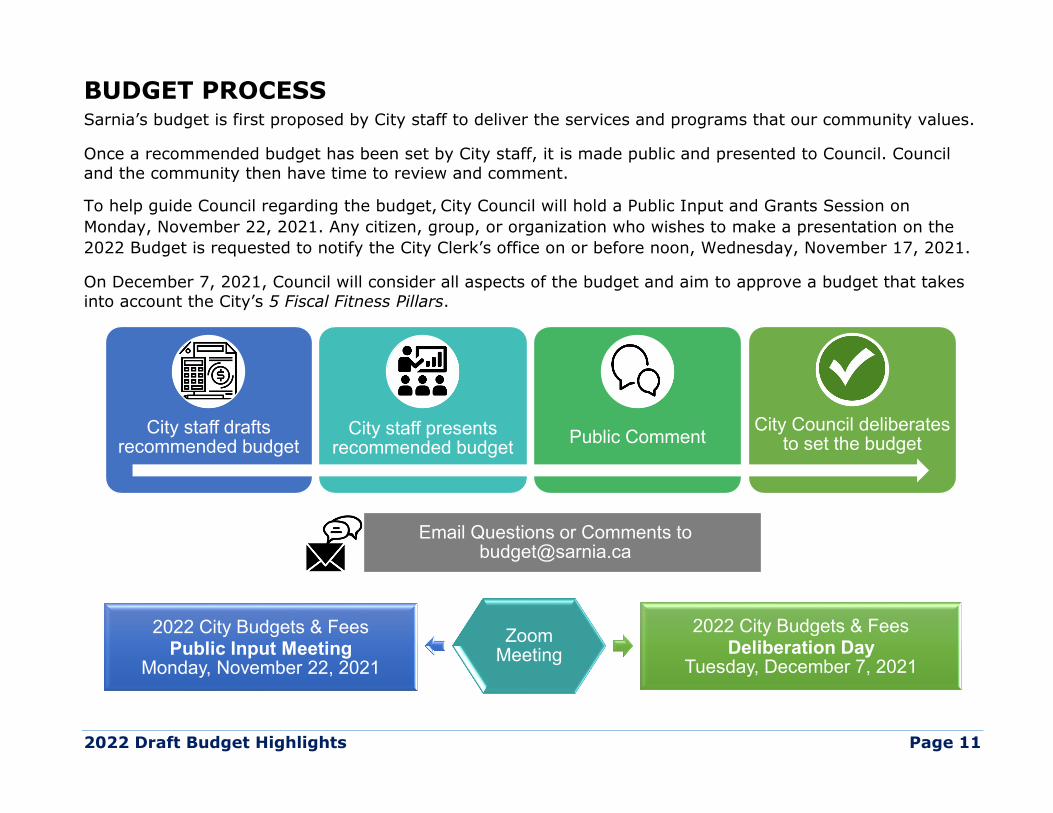
BUDGET PROCESS Sarnia’s budget is first proposed by City staff to deliver the services and programs that our community values.
Once a recommended budget has been set by City staff, it is made public and presented to Council. Council and the community then have time to review and comment.
To help guide Council regarding the budget, City Council will hold a Public Input and Grants Session on Monday, November 22, 2021. Any citizen, group, or organization who wishes to make a presentation on the 2022 Budget is requested to notify the City Clerk’s office on or before noon, Wednesday, November 17, 2021.
On December 7, 2021, Council will consider all aspects of the budget and aim to approve a budget that takes into account the City’s 5 Fiscal Fitness Pillars.
City staff drafts recommended budget
City staff presents recommended budget Public Comment City Council deliberates
to set the budget
Email Questions or Comments to [email protected]
2022 City Budgets & FeesPublic Input Meeting
Monday, November 22, 2021
ZoomMeeting
2022 City Budgets & FeesDeliberation Day
Tuesday, December 7, 2021
2022 Draft Budget Highlights Page 12
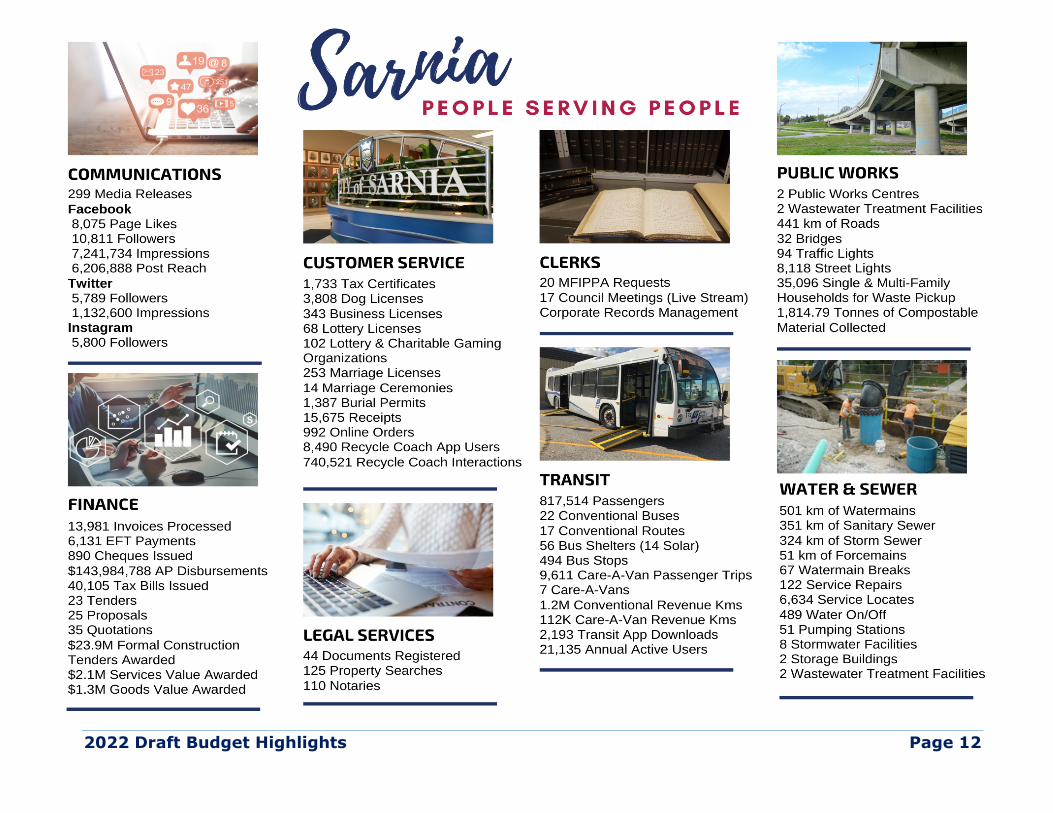
THINGS WE DO

2022 Draft Budget Highlights Page 13

2022 Draft Budget Highlights Page 14
PROPERTY TAXATION – WHERE DOES IT GO? The City of Sarnia is part of a two-tier municipality, where our residents receive one tax bill to cover the total cost of services provided by the City, County and School Boards. The County of Lambton is the “upper tier” and the City of Sarnia is the “lower tier”. Here is how your tax bill is split:
City of Sarnia58%
County of Lambton
28%
School Boards14%
School Boards
Elementary Education
Secondary Education
County of Lam
bton
Emergency Medical ServicesHousing Services
Public HealthSocial & Family Services
Maintaining County Roads/BridgesLong Term Care
Child Care & Children ServicesProvincial Offences Administration
Libraries, Museums & Cultural ServicesSeptic & Plumbing Permits
Solid Waste ManagementEconomic Development & Tourism through
SLEP/Tourism Sarnia LambtonCity of Sarnia
Parks & Trails, Arenas & Sports FieldsRecreation Centres, Programs & Events
Solid Waste Collection, Recycling & Compost
Maintaining Local Roads/BridgesBuilding Permitting, Land Use Planning
Fire & Rescue ServicesPolice & Emergency Management Services
Public TransitTax Collection
Business & Marriage LicencingWater Distribution & Wastewater
EliminationStormwater Management & Drainage
SUMMARY OF PUBLIC SERVICES AND WHO PROVIDES THEM…

2022 Draft Budget Highlights Page 15
HOW IS THE CITY’S BUDGET STRUCTURED? There are various components of the budget that Council reviews and approves.
1. OPERATING BUDGET: Includes all of the day-to-day activities of the City needed to provide services.
The operating budget is broken down into 5 main categories:
a. General Levy - Includes all City department budgets except Conventional Transit, Water and Sewer.
b. Police Budget - Included in the General Levy but follows a different approval process regulated by the Police Services Act. The Police Services Board reviews and approves the detailed budget; City Council does not have the authority to approve/disapprove specific estimates. City Council establishes the overall budget allocated to Police Services.
c. Transit Levy - The Conventional bus system has a separate budget. Only property owners within 450m of the transit routes pay these costs.
d. Water Rates - Costs associated with providing municipal water services, including the Lambton Area Water Supply System, are separated to determine how to set water rates. These are broken into a monthly fee based on water meter size and a variable fee based on the water used.
e. Sewer Rates - Costs associated with providing municipal storm and sanitary sewer services are separated to determine how to set the sewer percentage added to water bills.
2. CAPITAL BUDGET: A 10-year Capital Plan has been developed and includes costs for new assets, major rehabilitation, or replacement of the City’s infrastructure, such as road and underground service rehabilitation, storm/sanitary sewer separation, building upgrades, parks facilities, shoreline protection, vehicle replacements, etc.
3. RESERVES BUDGET: Reserves frame the financial foundation for long-term financial planning, so there is money to replace infrastructure now, and in the future. Reserves assist in minimizing tax fluctuations by smoothing demand over a longer period of time. The Reserves Budget includes expected inflows from various sources and outflows for spending from reserves.

2022 Draft Budget Highlights Page 16
4. FEES FOR SERVICES: Includes the fees to be paid by only those that use a service. Some examples are marriage or business licenses, bus fares, water meter removal, notary services, fire inspections, special event bookings, sports fields rentals, ice rentals, parking, site plan agreements, building permits, dog licenses, garbage tags, replacement blue boxes, marriage ceremonies, and recreation program fees.
PROPOSED 2022 BUDGETS – EXPENDITURES First, we will look at the City’s total expenditures; this is everything the City spends money on. Expenditures are higher than what is collected through property taxes. Other projected revenues, such as investment income and dividends, grant funding and water and sewer charges, make up the difference to determine what is required in property tax to create a balanced budget.
Budget Expenditures
2021 Approved Expenditures
2022 Draft Expenditures Change $ % Change
General Operating 82,517,093 86,687,626 4,170,533 5.05% Police Services 28,619,572 29,961,026 1,341,454 4.69% Transit Area 7,004,943 7,125,417 120,474 1.72% Water 17,927,366 18,412,377 485,011 2.71% Sewer 19,690,125 21,794,470 2,104,345 10.69% Total Expenditures $155,759,099 $163,980,916 $8,221,817 5.28%
Projected Expenditures
ProjectedOther
Revenues
Property Taxes
Required

2022 Draft Budget Highlights Page 17
2022 DRAFT EXPENDITURES Let’s break the City’s expenditure dollars out two different ways to help explain how this money is spent.
Protection Services
32%
Recreation & Culture
7%
Environmental27%
Planning & Development
1%
General Government
17%
Transportation15%
Debt1%
BY SERVICE AREA
Staffing50%
Contracted Services
5%
Contributions to Boards and Authorities
4%
Supplies2%
Insurance1%
Contribution to Reserves
20%
Facilities/Grounds1%
Equipment/Vehicles3%
Debt1%
Other10%
Utilities3%
BY TYPE OF SPENDING
2022 Draft Budget Highlights Page 18
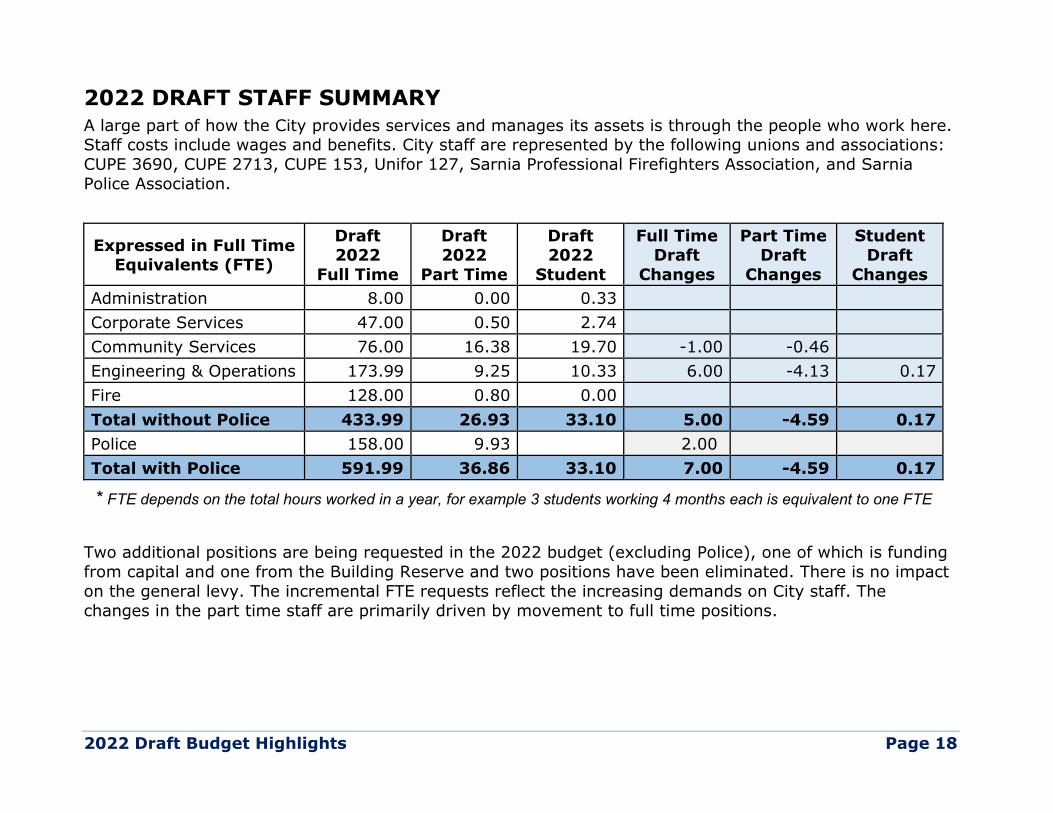
2022 DRAFT STAFF SUMMARY A large part of how the City provides services and manages its assets is through the people who work here. Staff costs include wages and benefits. City staff are represented by the following unions and associations: CUPE 3690, CUPE 2713, CUPE 153, Unifor 127, Sarnia Professional Firefighters Association, and Sarnia Police Association.
Expressed in Full Time Equivalents (FTE)
Draft 2022
Full Time
Draft 2022
Part Time
Draft 2022
Student
Full Time Draft
Changes
Part Time Draft
Changes
Student Draft
Changes Administration 8.00 0.00 0.33 Corporate Services 47.00 0.50 2.74 Community Services 76.00 16.38 19.70 -1.00 -0.46 Engineering & Operations 173.99 9.25 10.33 6.00 -4.13 0.17 Fire 128.00 0.80 0.00 Total without Police 433.99 26.93 33.10 5.00 -4.59 0.17 Police 158.00 9.93 2.00 Total with Police 591.99 36.86 33.10 7.00 -4.59 0.17
Two additional positions are being requested in the 2022 budget (excluding Police), one of which is funding from capital and one from the Building Reserve and two positions have been eliminated. There is no impact on the general levy. The incremental FTE requests reflect the increasing demands on City staff. The changes in the part time staff are primarily driven by movement to full time positions.
* FTE depends on the total hours worked in a year, for example 3 students working 4 months each is equivalent to one FTE

2022 Draft Budget Highlights Page 19
TOTAL AMOUNT TO BE COLLECTED THROUGH TAXATION AND RATES Property taxes and water/sewer rates are the City’s largest source of revenue. Property tax is the number that “balances” the budget. The City only collects sufficient taxes to provide services, maintain assets and invest in infrastructure. An increase to the City’s total property assessment value does not automatically result in the City collecting more tax.
TAXATION 2021 Approved Budget
2022 Draft Budget Difference Change %
General Operating 51,926,525 53,032,705 1,106,180 2.13% Police Services 26,033,481 27,258,305 1,224,824 4.70% General Taxation $77,960,006 $80,291,010 $2,331,004 2.99% Transit Area 4,348,130 4,469,104 120,974 2.78% Total Taxation $82,308,136 $84,760,114 $2,451,978 2.98% Taxation Growth Impact 525,000 525,000 - 0.00% Total Taxation Revenue $82,833,136 $85,285,114 $2,451,978 2.96%
RATES 2021 Approved Budget
2022 Draft Budget Difference Change %
Water 17,345,160 17,907,336 562,176 3.24% Sewer 19,442,125 21,401,470 1,959,345 10.08% Total Rates $36,787,285 $39,308,806 $2,521,521 6.85%

2022 Draft Budget Highlights Page 20
WHAT DOES THIS PROPOSED PROPERTY TAX INCREASE MEAN TO SARNIA’S RESIDENTIAL PROPERTY OWNERS? The amount of property tax revenue approved by City Council is spread between property owners based on assessment value. The assessed value is determined by the Municipal Property Assessment Corporation.
Based on these residential values, the proposed increase is broken down between the general tax, which applies to everyone, and the conventional transit tax, which is charged only to those within the conventional transit service area.
City Portion of Property Tax
Average Value
2021 City Tax
Increase (General Tax)
Increase (Transit Tax)
2022 Estimated City Tax
Residence valued at $100K $936 $26 $2 $964 Single Family Detached $219,737 $1,808 $58 $3 $1,869 Link Home $183,515 $1,574 $48 $3 $1,625 Freehold Rowhouse $167,017 $922 $44 $3 $968 Semi-Detached $137,008 $1,174 $36 $2 $1,212 Single Family (Lakefront) $986,292 $8,124 $259 $15 $8,399 Condominium $148,778 $1,146 $39 $2 $1,188
Proposed Increase - CITY Portion Only
2.98%
Based on 2021 City of Sarnia Average Values

2022 Draft Budget Highlights Page 21
PROPERTY TAX COMPARISON TO COMPARITOR MUNICIPALITIES The following chart demonstrates the affordability of property taxes in Sarnia. The average household income in the City of Sarnia and the average property taxes as a percentage of this income are compared to our comparator municipalities.
$100,757 $106,478
$74,774 $84,015 $83,246
3.6%
4.6%5.0%
4.4% 4.1%
0.0%
1.0%
2.0%
3.0%
4.0%
5.0%
6.0%
$-
$20,000
$40,000
$60,000
$80,000
$100,000
$120,000
Sarnia Orangeville Owen Sound St Catharines (RP) Niagara Falls (RP)
Property Taxes As % Of Household Income(Source: 2020 BMA Municipal Study)
Average Household Income Property Taxes as % of Household Income

2022 Draft Budget Highlights Page 22
PROPERTY TAX COMPARISON TO NEIGHBOURING MUNICIPALITIES The following chart demonstrates the affordability of property taxes in Sarnia. The average household income in the City of Sarnia and the average property taxes as a percentage of this income are compared to our neighbouring municipalities.
$100,757 $92,547 $80,595
$93,625
$148,523
$98,093 $78,964
3.6% 3.8% 3.9%
3.3%3.1% 3.2%
4.0%
0.0%
0.5%
1.0%
1.5%
2.0%
2.5%
3.0%
3.5%
4.0%
4.5%
$-
$20,000
$40,000
$60,000
$80,000
$100,000
$120,000
$140,000
$160,000
Property Taxes As % Of Household Income(Source: 2020 BMA Municipal Study)
Average Household Income Property Taxes as % of Household Income

2022 Draft Budget Highlights Page 23
SARNIA’S RESPONSE TO THE COVID-19 PANDEMIC Since the onset of the COVID-19 pandemic, City staff have implemented mitigation measures to assist citizens and local businesses while offsetting the financial pressures experienced with the continued decrease in revenue operations. At the end of 2020 the City had received $1,089,948 in Safe Restart funding to alleviate the financial impacts of the COVID-19 pandemic.
On March 4, 2021, the City was notified by the Ministry of Municipal Affairs and Housing of the City’s eligibility for $1,301,071 in 2021 COVID-19 Recovery Funding. Of this last amount, $292,075 has been incorporated into the general operating results to cover the forecasted COVID-19 impacts.
Total funding that has been included in the general operating results is $1,382,023 and fully offsets the forecasted COVID-19 impacts.
Up to June 30, 2021, the total Transit Phase 1 Safe Restart funding available to alleviate COVID-19 impacts is $579,770. To address COVID-19-related pressures and costs the City is eligible for $1,390,392 of additional funding under Phase 2 of the program for the period October 1, 2020, to June 30, 2021, and $1,066,622 under Phase 3 of the program for the period April 1, 2020, to December 31, 2021.
Operational impacts remain a highly speculative task at this point given the uncertainty with respect to the longevity and severity of COVID-19 and the resulting impacts on the global, national, and local economy and on the City's finances.
Data is limited with respect to how small businesses, housing developments, and the economy will respond after the pandemic and how this will affect the City’s tax revenue, growth, development charges, programs, and overall cash flow.
Set Up of Mass Vaccination Hub at Clearwater Arena Vaccination Pods at Clearwater Arena

2022 Draft Budget Highlights Page 24
WHAT ARE THE KEY THINGS CAUSING THE PROPOSED INCREASE TO PROPERTY TAXES/RATES? The chart below shows the key areas of increased spending or reduced revenue anticipated for 2022. A positive change represents an increase to levy/rates. A negative change represents a decrease to levy/rates. Changes under Management's control Reduction in vehicle expense support from capital reserve 295,122 0.38% Reduction in allocated admin to Water and Sewer (formula driven) 120,000 0.15% Transfer of 0.5 FTE from a capital department to a general levy department 82,896 0.11% Increase in student wage rates 77,000 0.10% Reduction in winter maintenance (55,000) -0.07% Variances outside of Management's control Sarnia Police Services budget 1,224,824 1.57% Union salary and wage increases, benefit increases 469,306 0.60% Non-union salary and wage increases, benefit increases 101,700 0.13% Reduction in recycling contract and increase in revenue (121,000) -0.16% Election cost 116,654 0.15% Increase in estimated Bluewater Power dividend (100,000) -0.13% Increased contract costs for crossing guards and snow removal 93,000 0.12% Decrease in County recovery for Planning department 84,433 0.11% Fire's share of Police 911 system including increase in contribution to reserves 80,297 0.10% Increase in St. Clair Region Conservation Authority budget 68,927 0.09% Impacts of prior decisions Reversal of one-time operating support for 2021 budget 1,129,742 1.45% Reversal of 2021 one time reduction in contribution to fleet reserve 700,000 0.90% Reversal of 2021 one time reduction in contribution to tax stabilization reserve 600,000 0.77% Increase in debt charges due to shorter amortization term of RBC debt 483,857 0.62% Software Maintenance costs 345,857 0.44% Reversal of 2021 decrease of interest transfer to reserves 244,744 0.31% HR/Payroll system processing fees 100,800 0.13% Reinstate 50% of the reduction in the contribution to the municipal drain reserve 50,000 0.06% General Taxation Subtotal Before Mitigation $6,193,159 7.94%

2022 Draft Budget Highlights Page 25
Mitigation One year deferral of contribution to operating contingency reserve (250,000) -0.32% Transfer from Operating contingency reserve to provide operational support (3,818,491) -4.90% All other items combined 206,336 0.26% Proposed Increase - General Taxation $2,331,004 2.99% Asset Management levy 80,107 1.84% Other Changes 40,867 0.94% Proposed Increase - Transit Taxation $120,974 2.78% Contribution to reserves 2,212,174 6.01% LAWSS - City's share of LAWSS Administration, Operating and Capital budgets 332,937 0.91% Equipment maintenance 210,000 0.57% Collective agreement salary and wage increases, benefit increases 151,370 0.41% Reduction in allocated admin to Water and Sewer (formula driven) (120,000) -0.33% Decrease in outside services in water distribution to reflect historical experience (98,750) -0.27% Decrease in Lead Reduction Program (95,000) -0.26% Other Changes (71,210) -0.19% Proposed Increase to Water & Sewer User Rates $2,521,521 6.85%

2022 Draft Budget Highlights Page 26
WHAT DOES THE CITY’S PROPOSED INCREASE MEAN FOR MY TOTAL TAX BILL? As a part of a two-tier municipality, property taxes are collected by the City of Sarnia for the County of Lambton and the Ministry of Education. For the residential homeowner located in the transit area, this chart shows the estimated change to your total tax bill. It is estimated using the most recent median residential assessment values. The County of Lambton and the School Boards have a separate budgeting process from the City, and their changes will not be finalized until early 2022. This chart is shown for an estimate only and will change based on the approved budgets and any real assessment growth.
Total Property Tax Estimate
2021 Total Tax Bill
Draft Increase
City
Estimated Increase Lambton County and
School Boards
2022 Estimated
Total Tax Bill
Residence valued at $100K $1,533 $28 $9 $1,570
Single Family Detached $2,963 $61 $20 $3,044 Link Home $2,580 $51 $16 $2,647
Freehold Rowhouse $1,510 $47 $15 $1,572 Semi-Detached $1,924 $38 $12 $1,975
Single Family (Lakefront) $13,313 $275 $88 $13,675
Condominium $1,878 $41 $13 $1,933
Estimated Increase on Total Property Tax Bill
2.20%
County and Education changes will not be known until Spring 2022, estimated increase only
Residential information has been shown, but property taxes are shared by all property owners; this includes all property classes, such as residential, multi-residential, farm, commercial, and industrial. Heavily regulated by the Province, the County of Lambton sets policy to determine what portion of taxes each property class throughout the County pays. As the total tax collected is based on the approved budget, any change to this policy shifts tax liability from one property class to another, but the total amount collected stays the same.

2022 Draft Budget Highlights Page 27
HOW DO CITY OF SARNIA TAXES COMPARE TO OUR COMPARITOR MUNICIPALITIES? The following chart shows how the Sarnia’s taxes compare to similar sized municipalities in Ontario. The bar graph indicates the average residential assessment value of a home, whereas the line graph indicator above shows the average property taxes paid.
$222,836 $371,011 $213,786 $255,391 $266,813
$3,592
$4,862
$3,710 $3,658 $3,437
$-
$1,000
$2,000
$3,000
$4,000
$5,000
$6,000
$-
$50,000
$100,000
$150,000
$200,000
$250,000
$300,000
$350,000
$400,000
Sarnia Orangeville Owen Sound St Catharines (RP) Niagara Falls (RP)
Assessment Value / Taxes Paid(Source: 2020 BMA Municipal Study)
Average Residential Assessment Average Taxes Paid

2022 Draft Budget Highlights Page 28
HOW DO CITY OF SARNIA TAXES COMPARE TO OUR NEIGHBOURING MUNICIPALITIES? The following chart shows how the Sarnia’s taxes compare to our neighbouring municipalities. The bar graph indicates the average residential assessment value of a home, whereas the line graph indicator above shows the average property taxes paid.
$222,836 $321,289 $169,232 $253,862 $400,394 $229,250 $206,069
$3,592 $3,512
$3,129 $3,112
$4,599
$3,150 $3,191
$-
$500
$1,000
$1,500
$2,000
$2,500
$3,000
$3,500
$4,000
$4,500
$5,000
$-
$50,000
$100,000
$150,000
$200,000
$250,000
$300,000
$350,000
$400,000
$450,000
Assessment Value / Taxes Paid(Source: 2020 BMA Municipal Study)
Average Residential Assessment Average Taxes Paid

2022 Draft Budget Highlights Page 29
ASSET MANAGEMENT - CAPITAL BUDGET Maintaining municipal infrastructure is vital to achieving our vision “Sarnia – the place you want to be!” Our Asset Management Plan (AMP) is used to optimize our assets and help prioritize infrastructure needs. The City’s revenues are not sufficient to meet the outstanding infrastructure needs or address the infrastructure backlog. The prioritization for infrastructure rehabilitation and replacement focuses on urgency, available resources, readiness to proceed, and affordability.
To address issues identified through the AMP as well as to promote a culture of pro-active lifecycle management, as part of the 2020 budget the City proposed, and Council approved, a build up of an asset management levy in the operating budget to further fund capital. The asset management levy was calculated as 2% of the 2019 levy for 2020 and grew to 4% in 2021. No further increase has been provided in the 2022 budget, however the City will propose future increases as appropriate for the pro-active maintenance of assets (i.e. rehabilitating them before they deteriorate into a poor condition).
The City is anticipating further debt reduction in the coming years, allowing for increased contributions to the capital reserves.
The City has been very successful in obtaining substantial Federal and Provincial grants for transit, roads, sewer upgrades, and water main replacements. The City must often provide financial resources in partnership with the grant programs, ranging from 33% to 60% of total project costs. To meet this demand, as well as to promote a sustainable capital program, the City has drafted a 10-year capital plan that invests in the community’s infrastructure.
The City is maintaining its “Pay As You Go” philosophy, redirecting the dollars previously used to pay principal and interest on retired debt, into other capital investments.

2022 Draft Budget Highlights Page 30
2022 DRAFT CAPITAL BUDGET The following pie chart illustrates where the 2022 capital budget dollars are allocated.
Obligatory Reserve Funds - Other
$0
Discretionary Reserves & Reserve Funds - Other
$16,589,399
Discretionary Reserves & Reserve Funds -
Water/Sewer$13,659,448
Development Charges$1,605,461
Provincial Gas Tax$909,091
Federal Gas Tax$6,186,665
Ontario Communities Infrastructure Fund
(OCIF)$2,700,000
Grants - ICIP, DMAF, NTCF, SWODF
$13,506,367
Other$0
2022 DRAFT CAPITAL BUDGET$55.2 MILLION

2022 Draft Budget Highlights Page 31
2022 DRAFT CAPITAL BUDGET – WHERE THE $ COMES FROM The following bar graph shows where the money comes from.
0
5,000,000
10,000,000
15,000,000
20,000,000
25,000,000
Senior Gov't & Donations Taxpayers Users Developers
2022 - Where the $ Comes FromWater & Wastewater Capital Projects General Capital Projects

2022 Draft Budget Highlights Page 32
BUDGET HIGHLIGHTS This highlight document provides a high-level overview of the budget process, aspects of the budget, and the proposed changes for 2022. Additional summary reports are included in the Appendices to provide citizens information for review in advance of the Public Input Session. The Public Input and Grants Session will be held on Monday, November 22, 2021. Any citizen, group or organization who wishes to make a presentation on the 2022 Budget is requested to notify the City Clerk’s office on, or before, noon on Wednesday, November 17, 2021.
You can watch video (live or recordings) of special Council meetings leading up to the Council Budget Deliberations scheduled for December 7, 2021 at 9:00 a.m. at https://sarnia.civicweb.net/portal/.
In preparation for the Budget process there are a number of presentations to Council; they are available on our website for your review. If you would like a more detailed look at all the numbers and background data that goes into the development of the proposed budgets, there are a number of detailed documents that will be available on our website after November 5, 2021 at https://www.sarnia.ca/2022-budgets/. These documents include:
•Summary of Taxation, Rates, Expenditures and Revenues •Summary by Department•Total Full Time Equivalent Staff Summary•Detailed Operating Budget (line by line) including explanations of changes•Reserve & Reserve Fund Revenues & Expenditures, & Projected Fund Balances
2022 Draft Operating & Reserves Budgets
•Capital Budget Funding Sources•10 Year Capital Plan•Detailed Project Descriptions
2022 Draft Capital Budget(Issued September 17, 2021)
•Fees by Department (including description of user fees)2022 Draft Fees for Services
•Budget Reports•Municipal Grant Policy•Municipal Grant Summary and Submitted Applications
2022 Draft Supplementary Budget Information

2022 Draft Budget Highlights Page 33
APPENDICIES 1. 2022 Draft Operating Budget Pages 34-35 2. 2022 Proposed Capital Budgets Pages 36-37 3. Reserves and Reserve Funds Page 38 4. Proposed Water and Sewer Rates Page 39

2022 Draft Budget Highlights Page 34
APPENDIX 1: 2022 DRAFT OPERATING BUDGET SUMMARY
Budget Area 2021
Approved Revenues
2021 Approved Expenses
2021 Net Expenses/ (Revenue)
2022 Draft Revenues
2022 Draft Expenses
2022 Net Expenses/ (Revenue)
2022 Draft Change
General Taxation (79,803,280) 633,981 (79,169,299) (82,161,150) 1,233,981 (80,927,169) (1,757,870) Non-Departmental Revenue (8,042,049) 914,769 (7,127,280) (8,278,620) 1,159,513 (7,119,107) 8,173
Council & Administration
Mayor & Council - 386,052 386,052 - 393,763 393,763 7,711 CAO - 400,816 400,816 - 300,293 300,293 (100,523) Economic Development - 428,458 428,458 - 490,636 490,636 62,178 City Clerk (353,845) 641,617 287,772 (696,021) 1,147,007 450,986 163,214
Corporate Services
Corporate Services Admin - 428,014 428,014 - 346,974 346,974
Human Resources (157,870) 1,007,539 849,669 (142,870) 947,787 804,917 (44,752) Finance (833,134) 2,098,767 1,265,633 (704,445) 2,174,746 1,470,301 204,668 Information Technology (487,000) 1,893,514 1,406,514 (493,000) 2,271,272 1,778,272
Customer Service - 647,498 647,498 - 705,776 705,776
Emergency Management - 266,840 266,840 - 399,140 399,140 132,300 Legal (58,200) 531,620 473,420 (58,200) 560,325 502,125 28,705 Communications - - - 108,340 108,340
Harbours (1,270,295) 1,097,095 (173,200) (1,278,292) 1,098,213 (180,079) (6,879) Fire Services
Fire (166,450) 21,039,559 20,873,109 (164,235) 21,601,000 21,436,765 563,656 Engineering & Operations
Engineering (2,821,309) 5,061,404 2,240,095 (3,309,490) 5,675,311 2,365,821 125,726 Public Works (5,640,849) 9,994,283 4,353,434 (5,215,090) 9,923,389 4,708,299 354,865 Waste Management (1,090,457) 4,381,345 3,290,888 (1,127,591) 4,373,856 3,246,265 (44,623) Specialized Transit (239,199) 1,144,158 904,959 (239,199) 1,147,401 908,202 3,243

2022 Draft Budget Highlights Page 35
Community Services Community Services Admin - - - - 124,081 124,081 124,081 Parks & Sports Fields (724,100) 5,084,537 4,360,437 (559,725) 5,150,398 4,590,673 230,236 Recreation Programs (500,304) 1,318,333 818,029 (500,304) 1,090,047 589,743 (228,286) Committees of Council (45,000) 124,505 79,505 (45,000) 124,505 79,505
Facilities - Arenas & Pools (2,534,585) 3,869,433 1,334,848 (2,492,085) 4,029,739 1,537,654 202,806 Facilities - Other & Libraries (32,500) 1,120,606 1,088,106 (32,500) 1,063,012 1,030,512 (57,594) Planning (1,224,806) 1,107,709 (117,097) (1,168,891) 1,061,641 (107,250) 9,847 Building (721,000) 721,000 - (788,682) 788,682 - - By-Law Enforcement (674,600) 1,332,072 657,472 (672,050) 1,340,395 668,345 10,873
Debt & Unclassified
Debt - 727,700 727,700 - 1,016,132 1,016,132 288,432 Boards, Commissions - 449,451 449,451 - 518,378 518,378 68,927 Other (1,129,742) 13,664,418 12,534,676 (3,818,491) 14,321,893 10,503,402 (2,031,274)
Police Services
Police Services (2,586,091) 28,619,572 26,033,481 (2,702,721) 29,961,026 27,258,305 1,224,824 Total General Operating (111,136,665) 111,136,665 - (116,648,652) 116,648,652 - - Transit
Taxation (4,373,130) 150,976 (4,222,154) (4,494,104) 231,083 (4,263,021) (40,867) Operations (2,631,813) 6,853,967 4,222,154 (2,631,313) 6,894,334 4,263,021 40,867
Total Conventional Transit (7,004,943) 7,004,943 - (7,125,417) 7,125,417 - - Water & Sewer
Water Administration (17,435,414) 6,626,052 (10,809,362) (17,997,590) 6,994,598 (11,002,992) (193,630) Water Distribution & Lead Reduction (491,952) 11,301,314 10,809,362 (414,787) 11,417,779 11,002,992 193,630 Sewer Administration (18,700,071) 2,596,542 (16,103,529) (20,510,583) 2,789,954 (17,720,629) (1,617,100) Sanitary Sewers - 9,855,644 9,855,644 - 11,205,555 11,205,555 1,349,911 Environmental Services Group - 1,955,341 1,955,341 - 1,992,306 1,992,306 36,965 Sewage Treatment (205,000) 4,497,544 4,292,544 (350,000) 4,872,768 4,522,768 230,224 Storm Sewer Maintenance (785,054) 785,054 - (933,887) 933,887 - -
Total Water & Sewer (37,617,491) 37,617,491 - (40,206,847) 40,206,847 - -

2022 Draft Budget Highlights Page 36
APPENDIX 2: 2022 PROPOSED CAPITAL PROJECTS Page number refers to the corresponding Capital Project Request sheet in the Draft 2022 Capital Budget book.
Division Department Project Name 2022 Proposed City Administration Economic Development Sarnia Chris Hadfield Airport Infrastructure Upgrades, p.6 (420,000) City Administration Total (420,000) Community Services Facilities Backflow Prevention, p.8 (100,000) City Hall Improvements, p.9 (350,000) Clearwater Arena Improvements, p.10 (300,000) Progressive Auto Sales Arena (PASA) Improvements, p.11 (1,900,000) Sarnia Library Improvements, p.12 (80,000) Parks and Recreation Canatara Park Improvements, p.13 (100,000) Germain Park Improvements, p.14 (300,000) Neighbourhood Parks, p.15 (150,000) Playground Equipment Replacement, p.16 (300,000) Tecumseh Park/Cox Youth Centre Improvements, p.17 (1,920,670) Waterfront Improvements, p.18 (150,000) Community Services Total (5,650,670) Corporate Services Customer Service Website Redevelopments, p.20 (183,000) Emergency Management Facility Access Control Systems, p.21 (60,000) Information Technology Backup Solution, p.22 (80,000) IT Hardware Asset Lifecycle, p.23 (365,000) Virtual Server Infrastructure, p.24 (90,000) Corporate Services Total (778,000) Engineering & Operations Engineering Accessibility Improvements, p.26 (192,500) Active Transportation Projects, p.27 (2,262,961) Bridges & Culverts, p.28 (850,000) City Entrance Signage, p.29 (225,000) Intersection Upgrades, p.30 (900,000) Oversized Load Corridor, p.31 (5,200,000) Parking Lot Reconstruction, p.32 (450,000) Road Rehabilitation, p.33 (2,000,000) Shoreline Protection, p.34 (3,250,000)
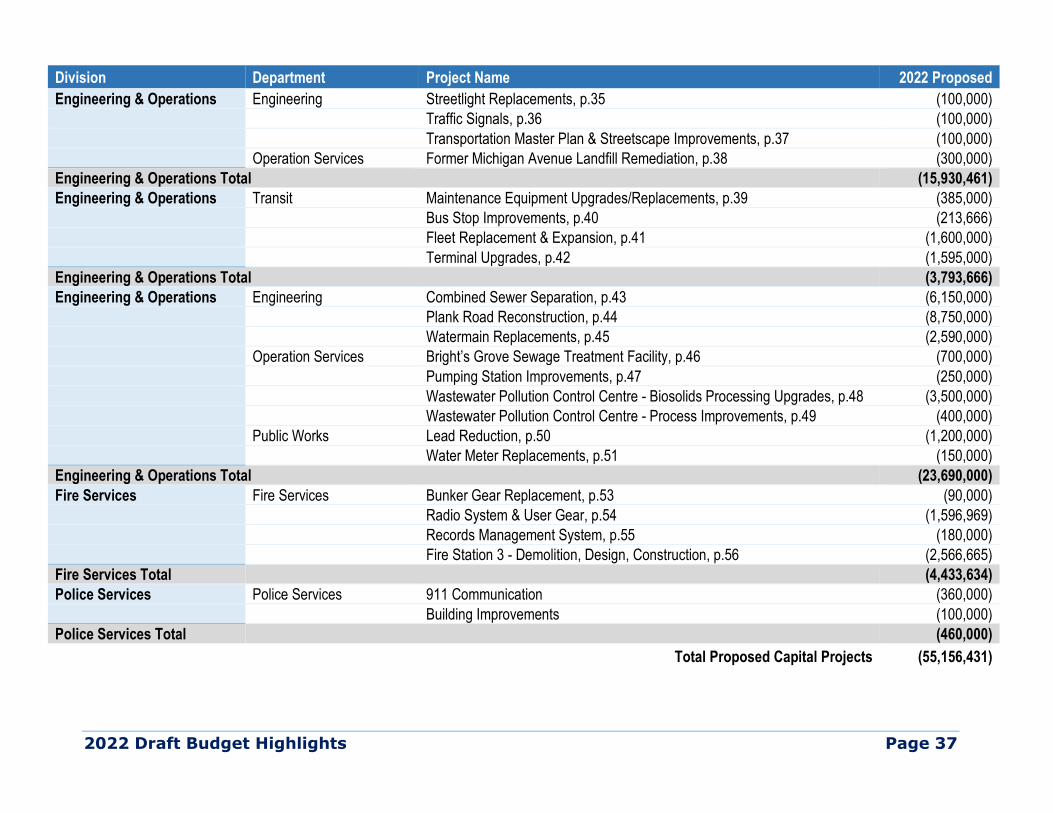
2022 Draft Budget Highlights Page 37
Division Department Project Name 2022 Proposed Engineering & Operations Engineering Streetlight Replacements, p.35 (100,000) Traffic Signals, p.36 (100,000) Transportation Master Plan & Streetscape Improvements, p.37 (100,000) Operation Services Former Michigan Avenue Landfill Remediation, p.38 (300,000) Engineering & Operations Total (15,930,461) Engineering & Operations Transit Maintenance Equipment Upgrades/Replacements, p.39 (385,000) Bus Stop Improvements, p.40 (213,666) Fleet Replacement & Expansion, p.41 (1,600,000) Terminal Upgrades, p.42 (1,595,000) Engineering & Operations Total (3,793,666) Engineering & Operations Engineering Combined Sewer Separation, p.43 (6,150,000) Plank Road Reconstruction, p.44 (8,750,000) Watermain Replacements, p.45 (2,590,000) Operation Services Bright’s Grove Sewage Treatment Facility, p.46 (700,000) Pumping Station Improvements, p.47 (250,000) Wastewater Pollution Control Centre - Biosolids Processing Upgrades, p.48 (3,500,000) Wastewater Pollution Control Centre - Process Improvements, p.49 (400,000) Public Works Lead Reduction, p.50 (1,200,000) Water Meter Replacements, p.51 (150,000) Engineering & Operations Total (23,690,000) Fire Services Fire Services Bunker Gear Replacement, p.53 (90,000) Radio System & User Gear, p.54 (1,596,969) Records Management System, p.55 (180,000) Fire Station 3 - Demolition, Design, Construction, p.56 (2,566,665) Fire Services Total (4,433,634) Police Services Police Services 911 Communication (360,000) Building Improvements (100,000) Police Services Total (460,000)
Total Proposed Capital Projects (55,156,431)

2022 Draft Budget Highlights Page 38
APPENDIX 3: RESERVES AND RESERVE FUNDS The City holds Reserves and Reserve Funds that are similar to your savings account; they ensure the City has funding for specific purposes or capital projects when needed. Some examples of different types are:
1. “Reserves” are set up by Council and cushion the impact that major expenditures have on property taxes. For example, Tax Stabilization Reserve or Operating Contingency Reserve.
2. “Reserve Funds” earn interest and have external restrictions for collection and use. a. Obligatory (Restricted) – required for legislated or legal reasons. For example, Development
Charges are collected from developers and can only be spent for very specific purposes. b. Discretionary – created by Council By-Law, often based on an agreement or donation, for
example Bluewater Gymnastics Reserve Fund, or YMCA Reserve Fund. Below is a high-level summary of the expected opening balances, revenue and spending, and forecasted ending balances for the City’s Reserves and Reserve Funds, and types of Inflows (contributions) and Outflows (commitments).
Reserves Budget Project Type 2022 Opening Balances Opening Balance 42,993,439 Opening Balances Total 42,993,439 Reserve Inflows Retired Debt 7,807,631 Senior Government Grants 17,471,985 Reserve Transfer 1,609,199 Interest 14,000 Developer Levies 1,720,000 Other Revenue 311,798 Operating Transfer 25,383,461 Operating Transfer - Fleet Contribution 3,849,227 Reserve Inflows Total 58,167,301 Reserve Outflows Equipment/Fleet Replacement (2,005,000) Capital Projects (55,965,239) Reserve Transfer (1,609,199) Direct from Reserve Expense (7,029,036) Operating Transfer (7,640,197) Reserve Outflows Total (74,248,671) Ending Balance 26,912,069

2022 Draft Budget Highlights Page 39
APPENDIX 4: PROPOSED WATER AND SEWER RATES
2022 Proposed Metered Rates
Size of Meter Water Distribution Charge ($/month)
Water Consumption
Charge ($/m3)
Sewer Surcharge (%) *
⅝” $30.42 $0.5322 125.81% ¾” $42.96 $0.5322 125.81% 1” $108.39 $0.5322 125.81%
1½” $216.78 $0.5322 125.81% 2” $400.59 $0.5322 125.81% 3” $770.95 $0.5322 125.81% 4” $1,204.66 $0.5322 125.81% 6” $2,504.13 $0.5322 125.81% 8” $4,817.81 $0.5322 125.81% 10” $7,980.84 $0.5322 125.81%
* The sewer surcharge is calculated on your total water bill (distribution plus consumption).
Average Residential Water & Sewer Cost/Year (Based on 200 m3/Year Consumption)
Water Meter Size ⅝” ¾” Distribution Charge ($/month) $30.42 $42.96
Water Consumption ($/m3) $8.87 $8.87 Distribution + Consumption $39.29 $51.83 Sewer Surcharge ($/month) $49.43 $65.21
Average Cost ($/month) $88.72 $117.04 Average Cost ($/year) $1,064.65 $1,404.45

2022 Draft Budget Highlights Page 40
The Corporation of the City of Sarnia 255 North Christina Street PO BOX 3018 Sarnia, ON N7T 7N2 519-332-0330 [email protected]
www.sarnia.ca