


Languages
Pages
Legal


EDELMAN INTELLIGENCE / PenFed Credit Union
2020 Top US CITIES FOR VETERAN ENTREPENEURS

EDELMAN INTELLIGENCE / PenFed Credit Union 2EDELMAN INTELLIGENCE / PenFed Credit Union
Methodology
Edelman Intelligence (EI) collected a robust set of quantitative data from existing PenFed Foundation partners and openly available data sources to
paint the full picture of veteran support, city characteristics and entrepreneurship ability across the US and rank US Metropolitan areas
(MSAs) by these characteristics. Using a custom scoring algorithm, EI highlighted the MSAs that are the best places for Veteran
Entrepreneurship.

EDELMAN INTELLIGENCE / PenFed Credit Union 3
*Full lists can be found in the appendix**Top 100 can be found in the appendix
3
OUR DATA
• Government Databases (ex. BLS)• Census Information• Private Foundations (ex. Kauffman)• NAVSO and VA
Main categories evaluated
Weighted factors in each category*
SCORING APPROACH
Data Sources*30+
Quantitative Data100%
*Full lists can be found in the appendix**Top 100 can be found in the appendix
Metropolitan Statistical Areas (MSAs) Analyzed**390
Data collection by scraping openscaled
4• Livability• Growing Economy• Support for Veterans• Ability to start a business
10-15
Normalizedaccount for differences in data sources
Data to
Transformedeliminate any bias within the dataset
Data to
source data on veteran support networks across the web

EDELMAN INTELLIGENCE / PenFed Credit Union 4
KEY FACTORS THAT AFFECT VETERAN ENTREPRENEURSHIP*
LIVABILITY
1. Change in Standard of Living
2. Park Score
3. Public Transit Rank
4. Food/Drinking Establishments per Capita
5. Health Establishments per Capita
6. Best Schools
7. Infant Care Cost
8. Children living in Child Care Deserts
9. Homelessness
10. COVID Cases
11. Regional Price Parities
GROWING ECONOMY
1. Unemployment Rate
2. Change in Unemployment Rate
3. Job Growth
4. Productivity Growth
5. Change in Median Earnings
6. Number of New Businesses
7. Spouse Unemployment %
8. PPP Loans given
9. Jobs created by PPP loans
10. Investment in new housing
11. Bankruptcy Filings
12. Foreclosure Rate
13. Median Home Price Increase
14. SMB COVID loan programs
15. GDP per Capita
SUPPORT FOR VETERANS
1. Places with Veteran Support Groups
2. Veteran Unemployment Rate
3. VA Expenditures per Veteran
4. VA Medical Care Expenditures
5. VA Accredited Attorneys
6. Number of Student Veterans on the GI Bill
7. Veteran Concentration in Cities
8. National Veteran Associations
9. Veteran Homelessness
10. Local Veteran Associations
ABILITY TO START A BUSINESS
1. Top Corp. Income Tax Rate
2. VC Investment
3. Veteran Entrepreneurs
4. Incubators
5. Rate of new Entrepreneurs
6. Opportunity Entrepreneurship Share
7. Survival Rate
8. Kauffman Index
9. Share of Coworking Space
10. Most Educated Labor Force
11. Veteran-focused Incubators
*Full list with descriptions and weights can be found in the appendix
EDELMAN INTELLIGENCE / PenFed Credit Union 5
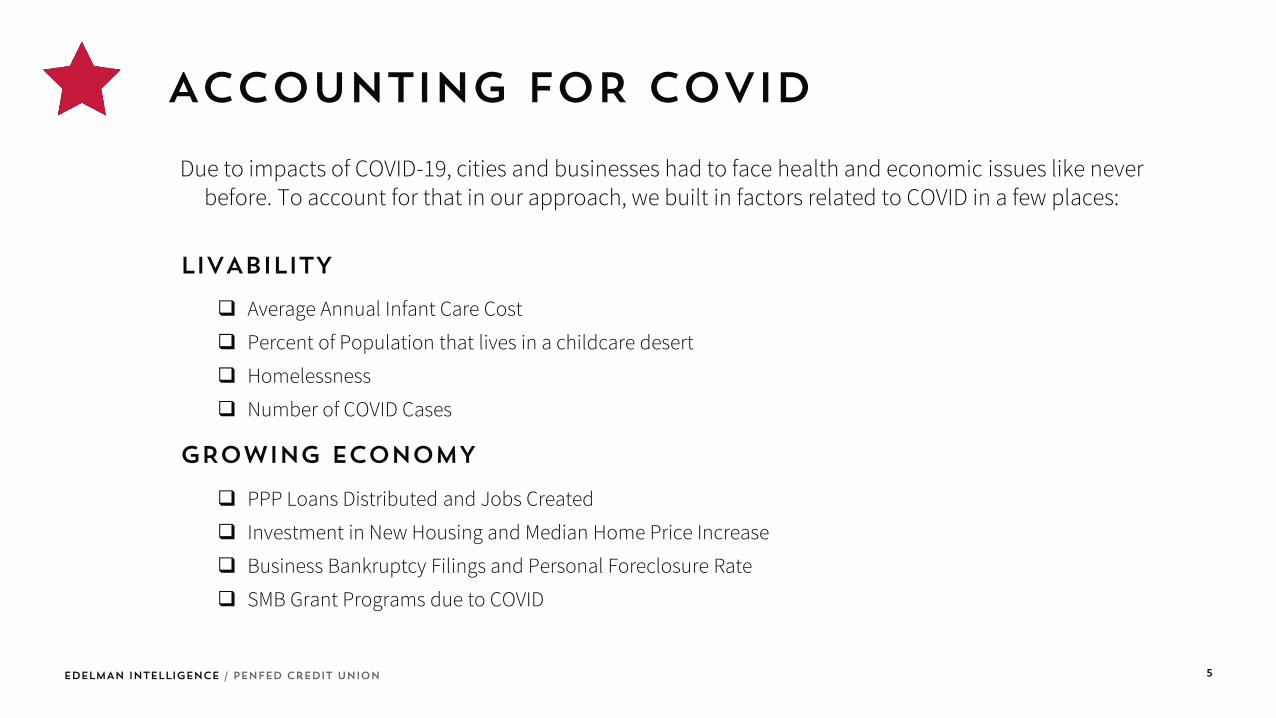
ACCOUNTING FOR COVID
Due to impacts of COVID-19, cities and businesses had to face health and economic issues like never before. To account for that in our approach, we built in factors related to COVID in a few places:
LIVABILITY
GROWING ECONOMY
❑ Average Annual Infant Care Cost
❑ Percent of Population that lives in a childcare desert
❑ Homelessness
❑ Number of COVID Cases
❑ PPP Loans Distributed and Jobs Created
❑ Investment in New Housing and Median Home Price Increase
❑ Business Bankruptcy Filings and Personal Foreclosure Rate
❑ SMB Grant Programs due to COVID

EDELMAN INTELLIGENCE / PenFed Credit Union 6
KEY FACTORS THAT AFFECT VETERAN ENTREPRENEURSHIP*
LIVABILITY
1. Change in Standard of Living
2. Park Score
3. Public Transit Rank
4. Food/Drinking Establishments per Capita
5. Health Establishments per Capita
6. Best Schools
7. Infant Care Cost
8. Children living in Child Care Deserts
9. Homelessness
10. COVID Cases
11. Regional Price Parities
GROWING ECONOMY
1. Unemployment Rate
2. Change in Unemployment Rate
3. Job Growth
4. Productivity Growth
5. Change in Median Earnings
6. Number of New Businesses
7. Spouse Unemployment %
8. PPP Loans given
9. Jobs created by PPP loans
10. Investment in new housing
11. Bankruptcy Filings
12. Foreclosure Rate
13. Median Home Price Increase
14. SMB COVID loan programs
15. GDP per Capita
SUPPORT FOR VETERANS
1. Places with Veteran Support Groups
2. Veteran Unemployment Rate
3. VA Expenditures per Veteran
4. VA Medical Care Expenditures
5. VA Accredited Attorneys
6. Number of Student Veterans on the GI Bill
7. Veteran Concentration in Cities
8. National Veteran Associations
9. Veteran Homelessness
10. Local Veteran Associations
ABILITY TO START A BUSINESS
1. Top Corp. Income Tax Rate
2. VC Investment
3. Veteran Entrepreneurs
4. Incubators
5. Rate of new Entrepreneurs
6. Opportunity Entrepreneurship Share
7. Survival Rate
8. Kauffman Index
9. Share of Coworking Space
10. Most Educated Labor Force
11. Veteran-focused Incubators
*Full list with descriptions and weights can be found in the appendix
EDELMAN INTELLIGENCE / PenFed Credit Union 7
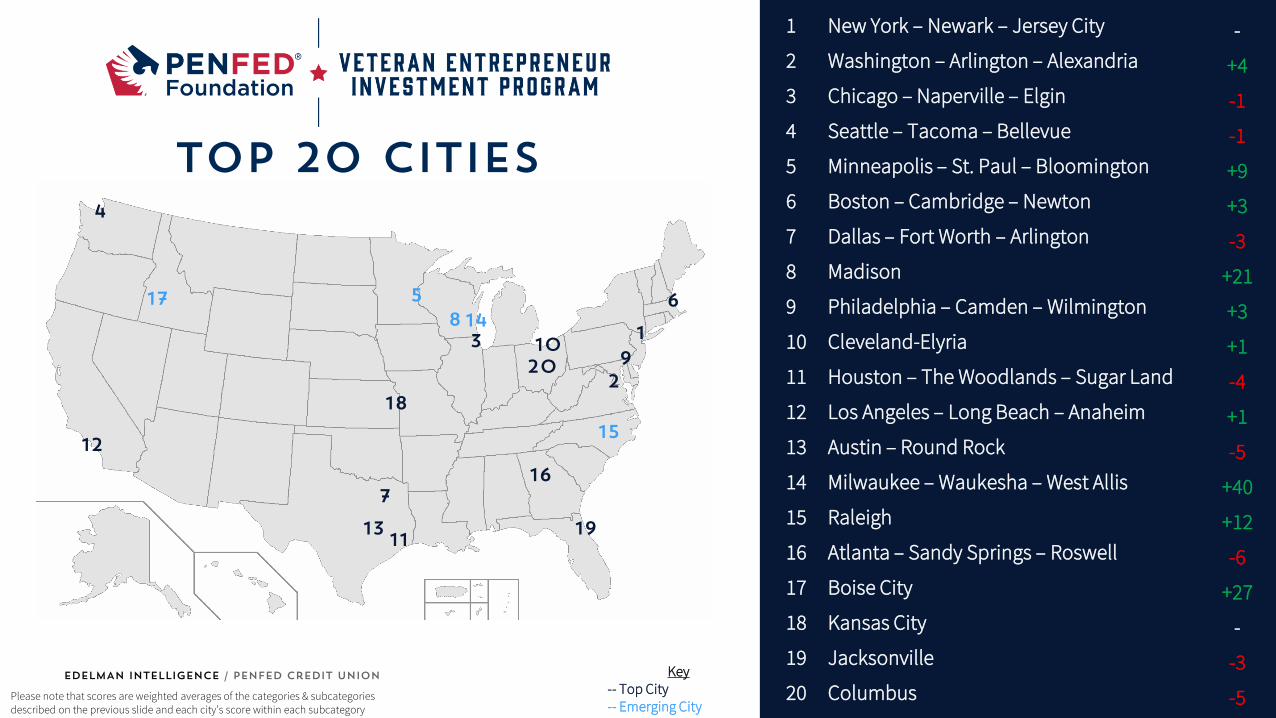
TOP 20 CITIES7/15/19 - 7/19/19
Finalizing reports
13
4
7
17
2
1113
6
16
109
12
5
20
19
18
1 New York – Newark – Jersey City -
2 Washington – Arlington – Alexandria +4
3 Chicago – Naperville – Elgin -1
4 Seattle – Tacoma – Bellevue -1
5 Minneapolis – St. Paul – Bloomington +9
6 Boston – Cambridge – Newton +3
7 Dallas – Fort Worth – Arlington -3
8 Madison +21
9 Philadelphia – Camden – Wilmington +3
10 Cleveland-Elyria +1
11 Houston – The Woodlands – Sugar Land -4
12 Los Angeles – Long Beach – Anaheim +1
13 Austin – Round Rock -5
14 Milwaukee – Waukesha – West Allis +40
15 Raleigh +12
16 Atlanta – Sandy Springs – Roswell -6
17 Boise City +27
18 Kansas City -
19 Jacksonville -3
20 Columbus -5Please note that scores are weighted averages of the categories & subcategories described on the previous slide and each city’s score within each subcategory
814
15
Key-- Top City-- Emerging City

EDELMAN INTELLIGENCE / PenFed Credit Union 8
Top 5 for each major category
Livability
Growing Economy
Support for Veterans
Ability to Start a Business
1
2
3
4
5
1
2
3
4
5
1
2
3
4
5
1
2
3
4
5
Madison, WI Metro Area
Milwaukee-Waukesha-West Allis, WI Metro Area
McAllen-Edinburg-Mission, TX Metro Area
Los Angeles-Long Beach-Anaheim, CA Metro Area
New York-Newark-Jersey City, NY-NJ-PA Metro Area
Boise City, ID Metro Area
Greeley, CO Metro Area
Fort Collins, CO Metro Area
Fayetteville-Springdale-Rogers, AR-MO Metro Area
Lincoln, NE Metro Area
New York-Newark-Jersey City, NY-NJ-PA Metro Area
Washington-Arlington-Alexandria, DC-VA-MD-WV Metro Area
Chicago-Naperville-Elgin, IL-IN-WI Metro Area
Philadelphia-Camden-Wilmington, PA-NJ-DE-MD Metro Area
Seattle-Tacoma-Bellevue, WA Metro Area
San Francisco-Oakland-Hayward, CA Metro Area
Cleveland-Elyria, OH Metro Area
Boston-Cambridge-Newton, MA-NH Metro Area
Jacksonville, FL Metro Area
Pittsburgh, PA Metro Area
EDELMAN INTELLIGENCE / PenFed Credit Union 9
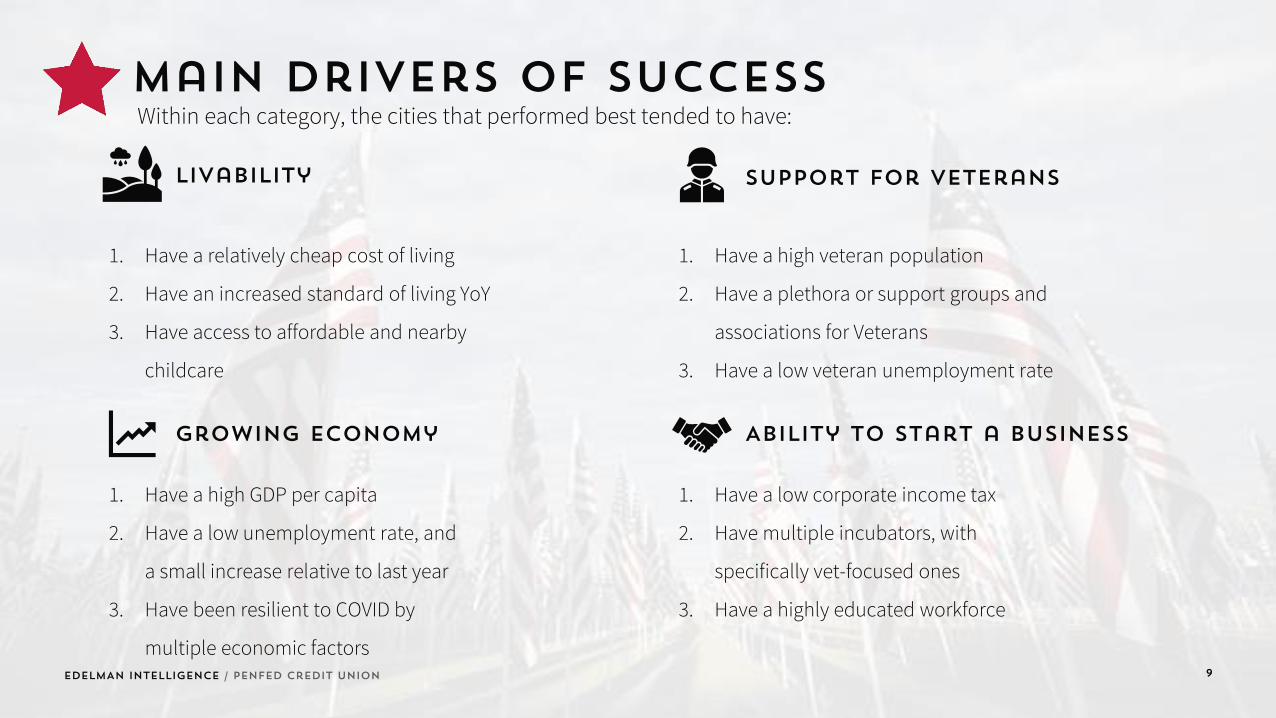
Main drivers of successWithin each category, the cities that performed best tended to have:
Livability
Growing Economy
Support for Veterans
Ability to Start a Business
1. Have a relatively cheap cost of living
2. Have an increased standard of living YoY
3. Have access to affordable and nearby
childcare
1. Have a high veteran population
2. Have a plethora or support groups and
associations for Veterans
3. Have a low veteran unemployment rate
1. Have a high GDP per capita
2. Have a low unemployment rate, and
a small increase relative to last year
3. Have been resilient to COVID by
multiple economic factors
1. Have a low corporate income tax
2. Have multiple incubators, with
specifically vet-focused ones
3. Have a highly educated workforce

EDELMAN INTELLIGENCE / PenFed Credit Union 10
Emerging cities
1 MILWAUKEE-WAUKESHA-WEST ALLIS, WI METRO AREA +40
Great Schools & Median Home Price Increase
Business Survival Rate & VA Expenditures per Vet
2 BOISE CITY, ID METRO AREA +27Low Infant Care Costs & Unemployment Rate
VC Investment & Number of Student Vets
4 RALEIGH, NC METRO AREA +12Productivity Growth & Investment in New Housing
Homeless Vets & Business Bankruptcy Filings
3 MADISON, WI METRO AREA +21Low Unemployment Rate & Educated Labor Force
Median Earnings & Number of New Businesses
5MINNEAPOLIS-ST PAUL-BLOOMINGTON, MN METRO AREA +9
Park Score & Health Establishments per Capita
YoY Change in Unemployment Rate & Business Bankruptcy Filings
City Strengths Opportunities
Cities in the top 20 that made the biggest jump in the rankings this year

EDELMAN INTELLIGENCE / PenFed Credit Union
Next 10 up
11
21 Cincinnati, OH Metro Area Higher Rate of New Entrepreneurs -1
22 Denver-Aurora-Lakewood Metro Area More Medical Expenditures per Veteran -5
23 Omaha-Council Bluffs, NE-IA Metro Area More Student Veterans -2
24 Virginia Beach-Norfolk-Newport News, VA-NC Metro Area
More New Businesses +16
25 San Antonio-New Braunfels, TX Metro Area Higher Business Survival Rate +3
26 McAllen-Edinburg-Mission, TX Metro Area Higher GDP Per Capita +48
27 San Francisco-Oakland-Hayward, CA Metro Area Cheaper cost of living (regional price parity) -22
28 Portland-Vancouver-Hillsboro, OR-WA Metro Area
Less Homelessness +3
29 St. Louis, MO-IL Metro Area More New Businesses -7
30 Phoenix-Mesa-Scottsdale, AZ Metro Area Higher Business Survival Rate +4
MSABIGGEST NEED TO BECOME AN
EMERGING MSAOVERALL
RANKYOY
CHANGE

EDELMAN INTELLIGENCE / PenFed Credit Union 12
BIGGEST MOVERSWithin the top 30, several cities made significant moves throughout the rankings. Highlighted below are the largest risers and fallers, and the categories that drove most of that change.
Largest Risers
Largest Fallers
Largest Category Rise
McAllen-Edinburg-Mission, TX
+48Milwaukee-
Waukesha-West Allis, WI
+40
San Francisco-Oakland-
Hayward, CA-22
St. Louis, MO-IL -9
Growing Economy –Investment in New Housing
Livability – Top Schools
Livability – Cost of Childcare
Support for Veterans – Low VA Expenditures per Veteran
Largest Category Fall

EDELMAN INTELLIGENCE / PenFed Credit Union
Appendix
EDELMAN INTELLIGENCE / PenFed Credit Union

EDELMAN INTELLIGENCE / PenFed Credit Union 14
categories and descriptions (Livability & support for veterans)
Category Subcategory Description Weight
Livability – 20% - The degree to which an MSA provides the amenities one
looks for when choosing where to live
Change in Standard of Living YoY change in the standard of living per capita 15.0%
Park Score Score for parks relative to other cities 5.0%
Public Transit Rank Ranking of public transit relative to other cities 10.0%
Food/Drinking Establishments per Capita Food/drink establishments per Capita 5.0%
Health Establishments per Capita Health establishments per capita 10.0%
Best Schools Best primary public schools ranking 10.0%
Infant Care Costs* Average Annual Infant Care Cost 5.0%
Children in child Care Deserts* Percent of population that lives in a child care desert 5.0%
Homelessness* Homelessness 5.0%
COVID cases* Number of COVID cases 5.0%
Regional Price Parities Price parity score for an MSA compared to average 25.0%
Support for Veterans –30% - The degree to which an MSA
provides the foundation for a veteran to have support and provided with the tools
to be successful
Places with Veteran Support Groups Number of Community Support Groups with Military Focus per Capita 10.0%
Veteran Unemployment Rate Veteran Unemployment Rate 10.0%
VA Expenditures per Veteran VA Expenditures per Veteran 5.0%
VA Medical Care Expenditures VA Medical Care Expenditures per Veteran 5.0%
VA Accredited Attorneys VA Accredited Attorneys per Capita 5.0%
Number of Student Veterans on the GI Bill Student Veterans on GI Bill & Post 9/11 Bill per Capita 10.0%
Veteran Concentration in Cities Veteran Concentration in Cities 15.0%
National Vet. Associations National Vet. Associations per Capita 15.0%
Total Veteran Homelessness* Number of Homeless Vets per capita 5.0%
Local Vet. Associations Local Vet. Associations per Capita 20.0%
*new data source in 2020

EDELMAN INTELLIGENCE / PenFed Credit Union 15
categories and descriptions (economy & starting a business)
Category Subcategory Description Weight
Growing Economy– 25% -The relative growth of an MSA across
multiple economic indicators and economic resiliency to COVID-19
Change in Employment Rate YoY change in the employment rate 5.0%
Job Growth YoY change in jobs 5.0%
Productivity Growth YoY change in GDP 5.0%
Change in Median Earnings YoY change in median earnings 5.0%
Number of new businesses New businesses started, per capita 5.0%
Spouse Unemployment % Unemployment rate for working spouses 5.0%
PPP Loans* PPP Loan Amount Distributed 5.0%
PPP Jobs Created* Jobs Created from PPP Funds 7.5%
Housing Supply* Investment in New Housing 7.5%
Bankruptcy Filings* Business Bankruptcy Filings 5.0%
Foreclosure Rate* Foreclosure Rate 5.0%
Housing Demand* Median Home Price Increase 5.0%
SMB Programs* SMB Programs 5.0%
GDP per Capita GDP per capita 10.0%
Ability to Start a Business – 25% - The ability of an MSA to foster new business development
and entrepreneurial success
Top Corporate Tax Income Rate (State Level) Top Corporate Tax Income Rate (State Level) 10.0%
VC Investment/New Business Loans Value of Venture Capital Investment/New Business Loans per Capita 15.0%
Veteran Entr. Per MSA Veteran Entrepreneur Per MSA 15.0%
Incubators Incubators per Capita 10.0%
Rate of New Ent. Rate of New Entrepreneurs based on Kauffman 10.0%
Opp. Ent. Share% of entrepreneurs who start a business based on opportunity - based on Kauffman statistics 10.0%
Survival Rate 5 year Survival Rate based on Kauffman statistics 7.5%
Kauffman Index Kauffman Index 0.0%
Share of Coworking Space Share of Coworking Space among overall retail space 0.0%
Most Educated Labor Force Most Educated Labor Force 7.5%
Vet Focused Incubators Vet Focused Incubators per capita 15.0%
*new data source in 2020

EDELMAN INTELLIGENCE / PenFed Credit Union 16
Full List of data sources
• The Brookings Institution• The Trust for Public Land• WalletHub• US Census Data• US News & World Report• Bureau of Economic Analysis• US Census/American Community Survey• U.S. Small Business Administration• Bureau of Labor Statistics• Measuring Communities• Department of Veteran Affairs• Tax Foundation• Baker Institute• Survey of Business Owners/U.S. Census• Ewing Marion Kauffman Foundation• Yelp• Statista
• U.S. Census• Google• National Association of Veteran Serving
Organizations (NAVSO)• Washington Post• Central Intelligence Agency• Guam Economic Development Authority• Guam Regional Transit Authority• Child Care Deserts• Economic Policy Institute• Realtor.com• Construction Coverage• USA Today• US Interagency Council on Homelessness• Institute for local self-reliance• NPR

EDELMAN INTELLIGENCE / PenFed Credit Union 17
Top 100 MSA’s overall (1/5)Ranking MSA Score Strongest Category
1 New York-Newark-Jersey City, NY-NJ-PA Metro Area 0.299 Support for Veterans
2 Washington-Arlington-Alexandria, DC-VA-MD-WV Metro Area 0.293 Support for Veterans
3 Chicago-Naperville-Elgin, IL-IN-WI Metro Area 0.275 Support for Veterans
4 Seattle-Tacoma-Bellevue, WA Metro Area 0.273 Support for Veterans
5 Minneapolis-St. Paul-Bloomington, MN-WI Metro Area 0.252 Livability
6 Boston-Cambridge-Newton, MA-NH Metro Area 0.251 Ability to Start a Business
7 Dallas-Fort Worth-Arlington, TX Metro Area 0.247 Support for Veterans
8 Madison, WI Metro Area 0.246 Livability
9 Philadelphia-Camden-Wilmington, PA-NJ-DE-MD Metro Area 0.246 Support for Veterans
10 Cleveland-Elyria, OH Metro Area 0.245 Ability to Start a Business
11 Houston-The Woodlands-Sugar Land, TX Metro Area 0.244 Support for Veterans
12 Los Angeles-Long Beach-Anaheim, CA Metro Area 0.244 Livability
13 Austin-Round Rock, TX Metro Area 0.242 Livability
14 Milwaukee-Waukesha-West Allis, WI Metro Area 0.240 Livability
15 Raleigh, NC Metro Area 0.240 Livability
16 Atlanta-Sandy Springs-Roswell, GA Metro Area 0.240 Support for Veterans
17 Boise City, ID Metro Area 0.234 Growing Economy
18 Kansas City, MO-KS Metro Area 0.234 Support for Veterans
19 Jacksonville, FL Metro Area 0.232 Ability to Start a Business
20 Columbus, OH Metro Area 0.231 Ability to Start a Business
EDELMAN INTELLIGENCE / PenFed Credit Union 18
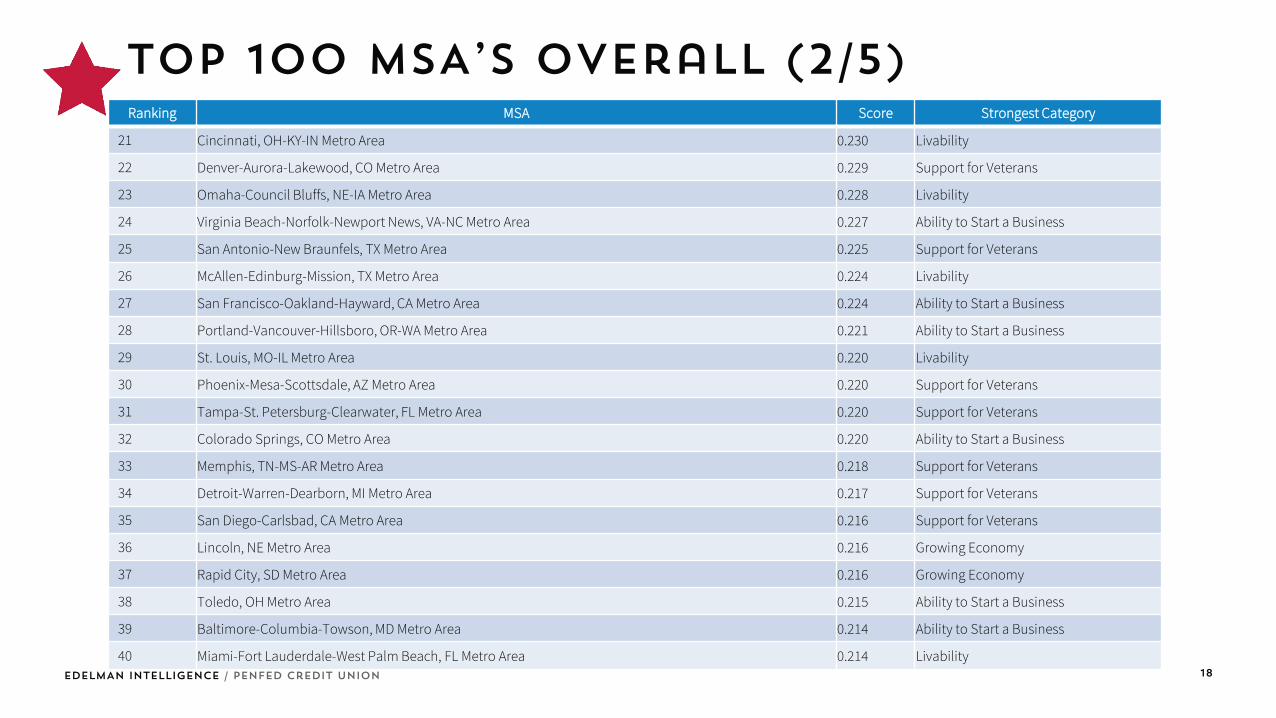
Ranking MSA Score Strongest Category
21 Cincinnati, OH-KY-IN Metro Area 0.230 Livability
22 Denver-Aurora-Lakewood, CO Metro Area 0.229 Support for Veterans
23 Omaha-Council Bluffs, NE-IA Metro Area 0.228 Livability
24 Virginia Beach-Norfolk-Newport News, VA-NC Metro Area 0.227 Ability to Start a Business
25 San Antonio-New Braunfels, TX Metro Area 0.225 Support for Veterans
26 McAllen-Edinburg-Mission, TX Metro Area 0.224 Livability
27 San Francisco-Oakland-Hayward, CA Metro Area 0.224 Ability to Start a Business
28 Portland-Vancouver-Hillsboro, OR-WA Metro Area 0.221 Ability to Start a Business
29 St. Louis, MO-IL Metro Area 0.220 Livability
30 Phoenix-Mesa-Scottsdale, AZ Metro Area 0.220 Support for Veterans
31 Tampa-St. Petersburg-Clearwater, FL Metro Area 0.220 Support for Veterans
32 Colorado Springs, CO Metro Area 0.220 Ability to Start a Business
33 Memphis, TN-MS-AR Metro Area 0.218 Support for Veterans
34 Detroit-Warren-Dearborn, MI Metro Area 0.217 Support for Veterans
35 San Diego-Carlsbad, CA Metro Area 0.216 Support for Veterans
36 Lincoln, NE Metro Area 0.216 Growing Economy
37 Rapid City, SD Metro Area 0.216 Growing Economy
38 Toledo, OH Metro Area 0.215 Ability to Start a Business
39 Baltimore-Columbia-Towson, MD Metro Area 0.214 Ability to Start a Business
40 Miami-Fort Lauderdale-West Palm Beach, FL Metro Area 0.214 Livability
Top 100 MSA’s overall (2/5)

EDELMAN INTELLIGENCE / PenFed Credit Union 19
Ranking MSA Score Strongest Category
41 Fayetteville-Springdale-Rogers, AR-MO Metro Area 0.214 Growing Economy
42 Lexington-Fayette, KY Metro Area 0.213 Ability to Start a Business
43 Sioux Falls, SD Metro Area 0.213 Growing Economy
44 Reno, NV Metro Area 0.211 Growing Economy
45 Pittsburgh, PA Metro Area 0.211 Ability to Start a Business
46 Corpus Christi, TX Metro Area 0.211 Livability
47 Augusta-Richmond County, GA-SC Metro Area 0.210 Support for Veterans
48 Dayton, OH Metro Area 0.210 Ability to Start a Business
49 Provo-Orem, UT Metro Area 0.209 Growing Economy
50 Nashville-Davidson--Murfreesboro--Franklin, TN Metro Area 0.209 Support for Veterans
51 Canton-Massillon, OH Metro Area 0.209 Ability to Start a Business
52 Sacramento--Roseville--Arden-Arcade, CA Metro Area 0.209 Support for Veterans
53 Grand Rapids-Wyoming, MI Metro Area 0.208 Livability
54 Wichita, KS Metro Area 0.208 Livability
55 Tulsa, OK Metro Area 0.208 Livability
56 Grand Island, NE Metro Area 0.207 Growing Economy
57 Huntsville, AL Metro Area 0.206 Growing Economy
58 Chattanooga, TN-GA Metro Area 0.206 Support for Veterans
59 Buffalo-Cheektowaga-Niagara Falls, NY Metro Area 0.205 Livability
60 Albuquerque, NM Metro Area 0.205 Livability
Top 100 MSA’s overall (3/5)

EDELMAN INTELLIGENCE / PenFed Credit Union 20
Ranking MSA Score Strongest Category
61 Clarksville, TN-KY Metro Area 0.205 Support for Veterans
62 Orlando-Kissimmee-Sanford, FL Metro Area 0.205 Livability
63 Amarillo, TX Metro Area 0.205 Support for Veterans
64 Jefferson City, MO Metro Area 0.205 Growing Economy
65 Beckley, WV Metro Area 0.204 Livability
66 Portland-South Portland, ME Metro Area 0.204 Growing Economy
67 Tucson, AZ Metro Area 0.204 Ability to Start a Business
68 Springfield, MO Metro Area 0.204 Ability to Start a Business
69 Birmingham-Hoover, AL Metro Area 0.203 Support for Veterans
70 Durham-Chapel Hill, NC Metro Area 0.203 Ability to Start a Business
71 Danville, IL Metro Area 0.203 Support for Veterans
72 Huntington-Ashland, WV-KY-OH Metro Area 0.203 Ability to Start a Business
73 Louisville/Jefferson County, KY-IN Metro Area 0.203 Livability
74 Fargo, ND-MN Metro Area 0.203 Growing Economy
75 Knoxville, TN Metro Area 0.203 Support for Veterans
76 Oklahoma City, OK Metro Area 0.203 Support for Veterans
77 Cape Girardeau, MO-IL Metro Area 0.202 Growing Economy
78 Akron, OH Metro Area 0.202 Ability to Start a Business
79 Ann Arbor, MI Metro Area 0.202 Ability to Start a Business
80 Little Rock-North Little Rock-Conway, AR Metro Area 0.202 Ability to Start a Business
Top 100 MSA’s overall (4/5)

EDELMAN INTELLIGENCE / PenFed Credit Union 21
Ranking MSA Score Strongest Category
81 Jackson, MS Metro Area 0.202 Ability to Start a Business
82 Jonesboro, AR Metro Area 0.201 Livability
83 Savannah, GA Metro Area 0.201 Support for Veterans
84 Albany, GA Metro Area 0.201 Support for Veterans
85 El Paso, TX Metro Area 0.200 Livability
86 St. Cloud, MN Metro Area 0.200 Growing Economy
87 Greensboro-High Point, NC Metro Area 0.200 Livability
88 Laredo, TX Metro Area 0.200 Livability
89 Richmond, VA Metro Area 0.199 Ability to Start a Business
90 Cheyenne, WY Metro Area 0.199 Growing Economy
91 Waco, TX Metro Area 0.199 Growing Economy
92 St. Joseph, MO-KS Metro Area 0.199 Growing Economy
93 Columbia, MO Metro Area 0.199 Growing Economy
94 Mansfield, OH Metro Area 0.199 Livability
95 Killeen-Temple, TX Metro Area 0.198 Ability to Start a Business
96 Topeka, KS Metro Area 0.198 Growing Economy
97 Salt Lake City, UT Metro Area 0.198 Ability to Start a Business
98 Auburn-Opelika, AL Metro Area 0.198 Growing Economy
99 Asheville, NC Metro Area 0.198 Ability to Start a Business
100 Hartford-West Hartford-East Hartford, CT Metro Area 0.198 Ability to Start a Business
Top 100 MSA’s overall (5/5)

EDELMAN INTELLIGENCE / PenFed Credit UnionEDELMAN INTELLIGENCE / PenFed Credit Union
Top Related