


Languages
Pages
Legal


Employee Benefit Research Institute
1100 13th Street NW, Suite 878
Washington, DC 20005
Phone: (202) 659-0670 Fax: (202) 775-6312
Greenwald & Associates
4201 Connecticut Ave. NW, Suite 620
Washington, DC 20008
Phone: (202) 686-0300 Fax: (202) 686-2512
2018
Retirement Confidence SurveyApril 24, 2018

28th Annual Retirement Confidence Survey (RCS)
The RCS is the longest-running survey of its kind, measuring
worker and retiree confidence about retirement, and is
conducted by the Employee Benefit Research Institute (EBRI)
and independent research firm Greenwald & Associates.
The 2018 survey of 2,042 Americans was conducted online
January 3 through January 16, 2018. All respondents were
age 25 or older. The survey includes 1,002 workers and 1,040
retirees.
Data were weighted by age, sex, and education.
Unweighted sample sizes are noted on charts to provide
information for margin of error estimates. The margin of error is
± 3.16 percentage points for all workers and ± 3.10
percentage points for all retirees
Please note percentages in the following tables and charts may not total to
100 due to rounding and/or missing categories. Any trend changes or
differences in subgroups noted in text are statistically significant.
2
2018 RCS Overview
2018 RCS Underwriters
AARP
Conduent, HR Services
FINRA
J.P. Morgan
Lincoln Financial
Mercer
MetLife
Nationwide FinancialPrincipal Financial Group
T. Rowe Price
The Segal Group
U.S. Chamber
Vanguard
Wells Fargo
©2018 EBRI/Greenwald Retirement Confidence Survey

Worker confidence creeping up?
The share of workers who feel very confident in their ability to live comfortably in retirement remains low at just 17%, but another 47% are somewhat confident (Figure 1). Combining those that are very and somewhat confident, workers appear to be more confident in retirement than they were in 2017.
Retiree confidence on shaky ground?
Retirees remain more confident than workers, with a third
(32%) very confident and another 44% somewhat confident that they will have enough money to live comfortably throughout retirement (Figure 2). Of note, however, are some of the decreases in confidence in specific aspects of retirement among retirees. Retirees are less likely than in 2017 to feel confident in their ability to handle basic expenses in retirement and less confident in their ability to handle medical expenses (Figure 3).
3
2 in 3 workersconfident in having enough for a comfortable retirement
only 17% very confident
3 in 4 retireesconfident in having enough for a comfortable retirement
only 32% very confident
Key Findings
©2018 EBRI/Greenwald Retirement Confidence Survey

Why are workers confident?
Workers appear to be very positive about their workplace defined contribution (DC) retirement plans and that may be impacting overall retirement confidence. Those with a DC plan are far more likely to be confident in their ability to live comfortably in retirement. More than 4 in 5 with a DC plan report being very or somewhat satisfied with the plan overall, and with the investment options available to them (Figure 4). Eight in ten workers expect that these plans will be a major or minor source of income for them in retirement.
Still, some workers may be guilty of false confidence and RCS data suggests they may be making some faulty assumptions:
• Workers expect to retire later than retirees actually do.
• Workers plan to work in retirement and 2 in 3 expect work for pay to be a major or minor source of income. Only 1 in 4 retirees say working is a source of income for them (Figure 5).
• Nearly 2 in 3 workers call debt a major or minor problem and more than 4 in 10 say it’s negatively impacting their ability to save for retirement. At the same time, about one quarter of retirees say debt is negatively impacting their lifestyle (Figure 6).
4
76% with a DC plan
are confident in having enough for a comfortable
retirement versus 46% without
Key Findings
©2018 EBRI/Greenwald Retirement Confidence Survey

Key Findings
Why are retirees less confident?
Retirees’ overall confidence shows signs of decline, but their confidence in being able to afford medical and long-term care expenses in retirement is down significantly. Relatedly, their confidence that Social Security and Medicare will continue to provide benefits equal to what retirees receive today has decreased (Figure 7). At the same time, more than 4 in 10 retirees report that their health care expenses in retirement are higher than they expected, and another 1 in 4 say long-term care costs have been higher (Figure 8).
There are still other factors that may be dampening retiree optimism that are not measured in this survey, such as low interest rates. As in the past, 2 out of 3 retirees in this survey report that they aim to maintain or continue to grow their asset level in retirement (Figure 9). That said, these retirees report the value of their assets is largely where they would expect them (Figure 10).
5
Fewer retirees
are confident:
In their ability to afford medical care
In their ability to afford long-term care
That Medicare will continue as is
©2018 EBRI/Greenwald Retirement Confidence Survey

Confident workers and retirees are healthy workers and retirees
This year’s RCS data emphasizes the impact health and health care expenses have on retirement confidence and financial well-being. Six in ten workers who are confident in retirement overall are in excellent or good health; among those not confident about retirement, only 28% report such good health. The same is true for retirees: 46% of confident retirees are in good health compared to just 14% who are not confident. Retirees in fair or poor health are more likely to have difficulty managing their money in retirement, including maintaining their pre-retirement lifestyle, managing day-to-day finances, and of course, managing health care costs.
Planning for healthcare in retirement may pay off
Only 19% of workers and 39% of retirees have tried to calculate how much money they would need to cover healthcare costs in retirement (Figure 11). Retirees who made this calculation are less likely to have experienced higher-than-expected health costs and are more likely to say costs are as expected (Figure 12). Given the current lack of planning, it’s not surprising that 7 in 10 employed workers and 6 in 10 employed retirees say that workplace education on health care planning for retirement would be helpful (Figure 13).
6
Key Findings
©2018 EBRI/Greenwald Retirement Confidence Survey

Mixed confidence on generating retirement income
Only half of workers are confident that they know how much income they will need each month in retirement or how to withdraw income from their savings and investments, with only 1 in 8 very confident.
Yet, 2 in 3 retirees report that converting their assets into income is a relatively easy task for them. Asked about their withdrawal strategies from DC plans or IRAs, many retirees aren’t withdrawing much from these tax-advantaged plans. Four in ten simply withdraw the legally required minimum. Among those who withdraw more than the minimum, many withdraw as needed.
Retirees receive income from predictable, guaranteed sources
Two in three retirees report Social Security is a major source of income, while only about a third of workers believe Social Security will be a major source (Figure 14). More than 4 in 10 retirees report income from a defined benefit (DB) plan is a major source of income, while only 32% of workers expect a DB plan to be a major source for them in retirement. These income sources do not require a withdrawal strategy, per se, but there is some strategy involved in Social Security claiming.
7
Many don’t think about the
impact of the age at which
they claim Social Security
on their benefit amount
Nearly half of workers say
they have thought about
how the age at which they
claim Social Security may
impact their benefit
amount; 66% of retirees say
they did this (Figure 15).
Yet, workers still plan to
claim Social Security at a
median age of 65 and
retirees claimed or plan to
claim at a median age 63
(Figure 16). Overall, only
23% of workers say they
chose their planned
claiming age with
maximizing their benefits in
mind.
Key Findings
©2018 EBRI/Greenwald Retirement Confidence Survey
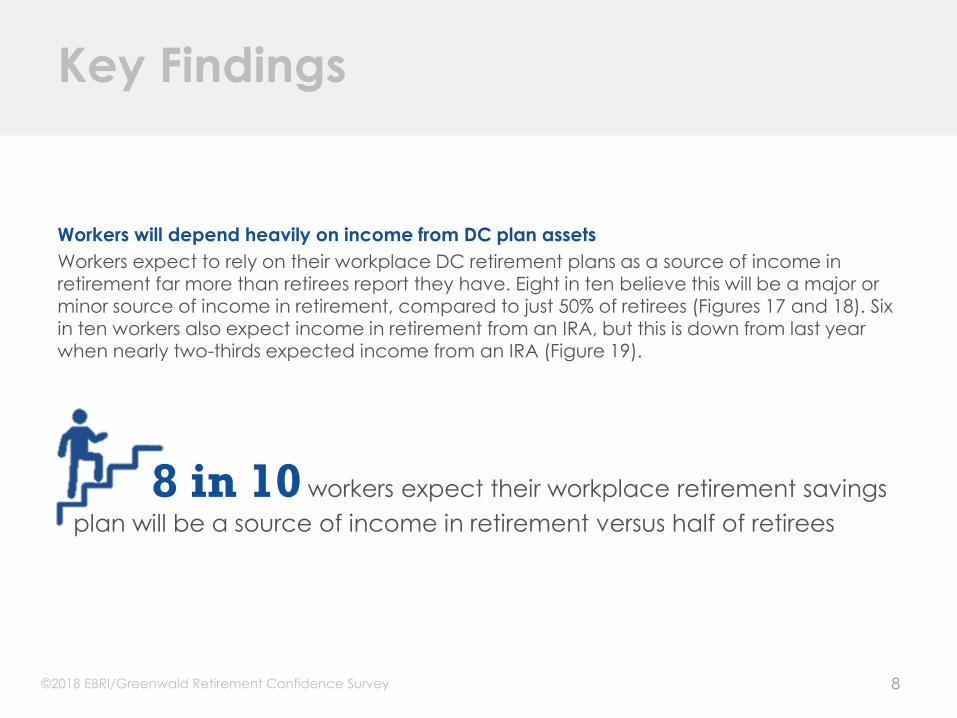
Workers will depend heavily on income from DC plan assets
Workers expect to rely on their workplace DC retirement plans as a source of income in retirement far more than retirees report they have. Eight in ten believe this will be a major or minor source of income in retirement, compared to just 50% of retirees (Figures 17 and 18). Six in ten workers also expect income in retirement from an IRA, but this is down from last year when nearly two-thirds expected income from an IRA (Figure 19).
8
8 in 10 workers expect their workplace retirement savings
plan will be a source of income in retirement versus half of retirees
Key Findings
©2018 EBRI/Greenwald Retirement Confidence Survey

Most retirees rolled assets out of DC plans
Among retirees who had assets in a DC plan at the time of retirement, over 4 in 10 rolled at least some of that money into an IRA, 3 in 10 left some money in the plan, and 2 in 10 cashed out and put the money into a different investment (Figure 20). A third of retirees who moved money out of their plan into a different investment vehicle say they did so because an advisor told them to (Figure 21).
Workers have somewhat different plans for their DC assets
While 3 in 10 workers with a DC plan “don’t know” what they will do with those assets when they retire, some have an idea (Figure 22). Three in ten plan to roll at least
some money into an IRA, fewer than the 44% of retirees who did so. This is one possible explanation for why workers are now less likely to expect IRAs to be a source of income in retirement. One in four plan to leave at least some money in the plan, comparable to retirees. And perhaps most noteworthy, 2 in 10 workers say that they will use plan assets to purchase a product that provides guaranteed lifetime income, far more than the 7% of retirees who did this.
9
Key Findings
©2018 EBRI/Greenwald Retirement Confidence Survey

Workers show strong interest in guaranteed income
Eight in ten workers with a DC plan are very orsomewhat interested in an in-plan investmentoption that that would guarantee monthly
income for life at retirement. Similarly, 8 in 10express interest in taking money out of theplan at retirement and moving it into afinancial product that would guarantee themmonthly income for life (Figure 23).
Workers also express interest in longevityinsurance—guaranteed income products thatpay out once a specified age (such as age 80or 85) is reached. Nearly half of workers (48%)report being very or somewhat interested in
these products, compared to fewer than 2 in10 retirees (Figure 24).
10
4 in 5 workers
with a DC plan are interested in
guaranteed lifetime income
options
Key Findings
©2018 EBRI/Greenwald Retirement Confidence Survey

20% 22% 24%
13%18%
22% 21% 18% 17%
64%69% 68%
54% 55%59%
64%60%
64%
0%
10%
20%
30%
40%
50%
60%
70%
80%
90%
100%
1994 1999 2004 2009 2014 2015 2016 2017 2018
Very Confident Very or Somewhat Confident
Overall, how confident are you that you (and your spouse) will have enough money to live
comfortably throughout your retirement years?
2018 Workers n=1,002
11
Figure 1
Up slightly from last year, nearly 2 in 3 workers are confident they will have
enough money for retirement, although only 17% feel very confident.
Workers who expect to retirement before age 65 are twice as likely as workers on average
to be very confident.
©2018 EBRI/Greenwald Retirement Confidence Survey

12
Figure 2
1 in 3 retirees are very confident they will have enough money for
retirement, though there are signs of decline.
27%31%
42%
20%28%
37% 39%32% 32%
64%70% 70% 67% 67%
71%75%
79%75%
0%
10%
20%
30%
40%
50%
60%
70%
80%
90%
100%
1994 1999 2004 2009 2014 2015 2016 2017 2018
Very Confident Very or Somewhat Confident
Overall, how confident are you that you (and your spouse) will have enough money to live
comfortably throughout your retirement years?
2018 Retirees n=1,040
*Down from 2017 at the 93% confidence level, which is below the standard 95% confidence level used in this study for determining statistical significance
©2018 EBRI/Greenwald Retirement Confidence Survey

Figure 3
Retirees are less confident than they were last year that they will have
enough for basic expenses, medical expenses or long-term care.
13
How confident are you (and your spouse) about the following aspects related to retirement?
Retirees n=1,040
38%
26%
16%
42%
44%
34%
80%
70%
51%
You will have enough money to take care of your
basic expenses during your retirement
You will have enough money to take care of your
medical expenses during your retirement
You will have enough money to pay for long-term
care, such as nursing home or home care, should
you need it during your retirement
Very Confident Somewhat Confident
= Up significantly from previous year = Down significantly from previous year
(vs. 85% in 2017)
(vs. 77% in 2017)
(vs. 20% in
2017)
©2018 EBRI/Greenwald Retirement Confidence Survey
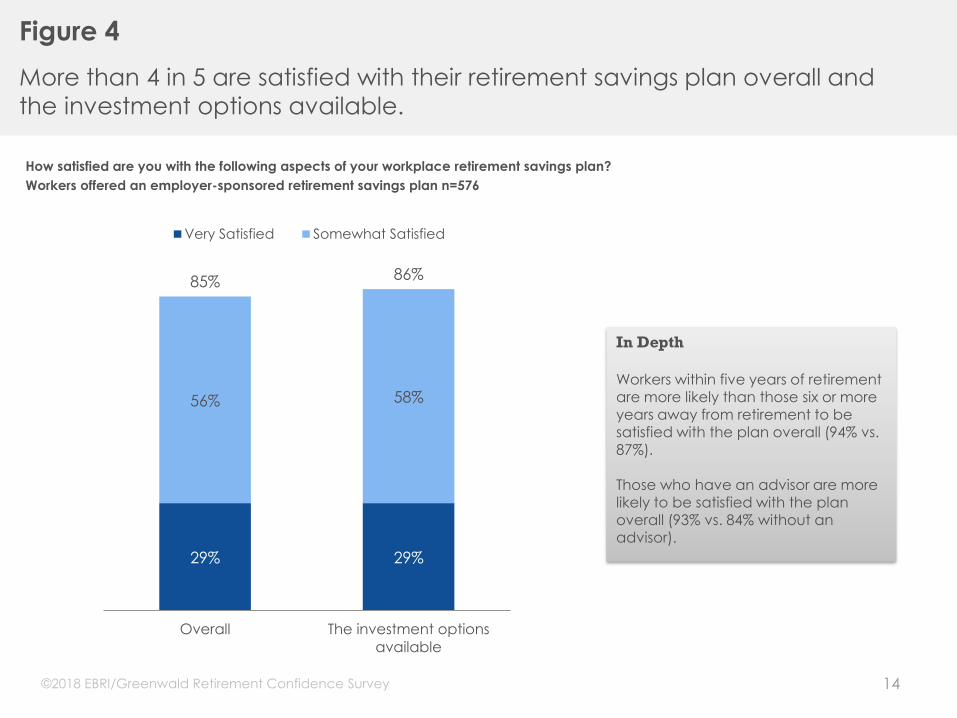
Figure 4
More than 4 in 5 are satisfied with their retirement savings plan overall and
the investment options available.
14
29% 29%
56% 58%
85% 86%
Overall The investment options
available
Very Satisfied Somewhat Satisfied
In Depth
Workers within five years of retirement are more likely than those six or more years away from retirement to be satisfied with the plan overall (94% vs.
87%).
Those who have an advisor are more likely to be satisfied with the plan overall (93% vs. 84% without an advisor).
How satisfied are you with the following aspects of your workplace retirement savings plan?
Workers offered an employer-sponsored retirement savings plan n=576
©2018 EBRI/Greenwald Retirement Confidence Survey
15
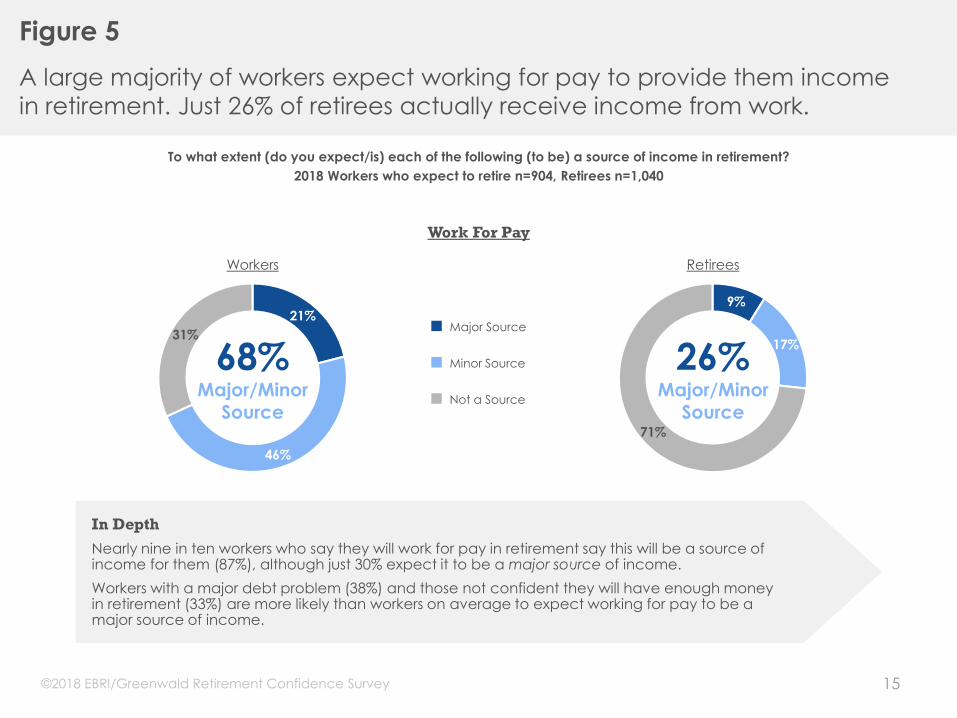
Figure 5
A large majority of workers expect working for pay to provide them income
in retirement. Just 26% of retirees actually receive income from work.
To what extent (do you expect/is) each of the following (to be) a source of income in retirement?
2018 Workers who expect to retire n=904, Retirees n=1,040
In Depth
Nearly nine in ten workers who say they will work for pay in retirement say this will be a source of income for them (87%), although just 30% expect it to be a major source of income.
Workers with a major debt problem (38%) and those not confident they will have enough money in retirement (33%) are more likely than workers on average to expect working for pay to be a major source of income.
21%
46%
31%
68%Major/Minor
Source
9%
17%
71%
■ Major Source
■ Minor Source
■ Not a Source
Workers Retirees
26%Major/Minor
Source
Work For Pay
©2018 EBRI/Greenwald Retirement Confidence Survey
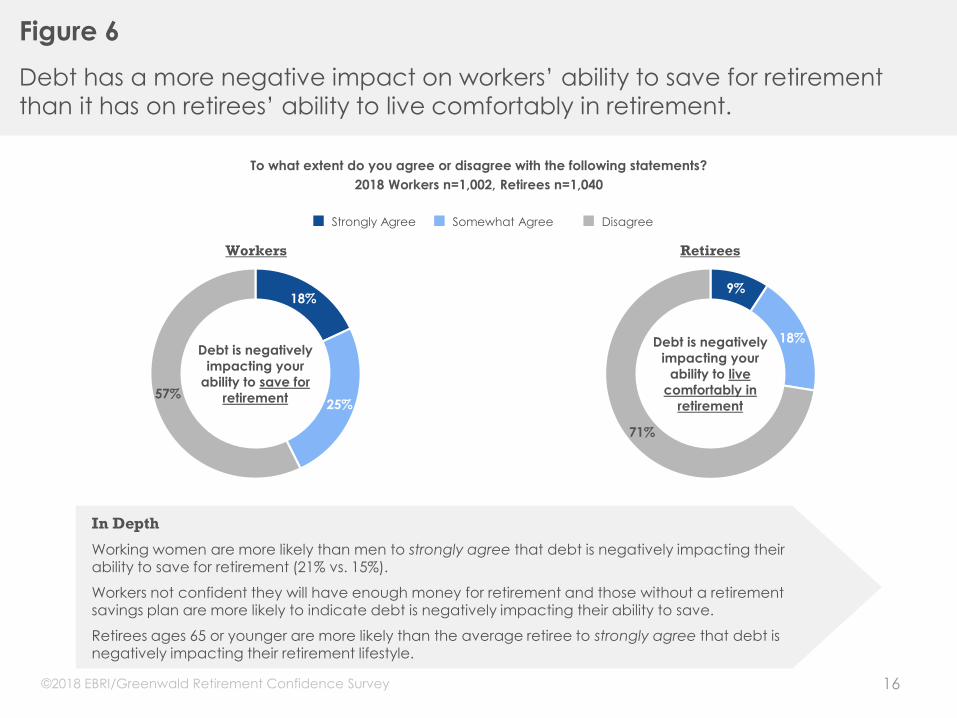
Figure 6
Debt has a more negative impact on workers’ ability to save for retirement
than it has on retirees’ ability to live comfortably in retirement.
16
In Depth
Working women are more likely than men to strongly agree that debt is negatively impacting their ability to save for retirement (21% vs. 15%).
Workers not confident they will have enough money for retirement and those without a retirement savings plan are more likely to indicate debt is negatively impacting their ability to save.
Retirees ages 65 or younger are more likely than the average retiree to strongly agree that debt is negatively impacting their retirement lifestyle.
To what extent do you agree or disagree with the following statements?
2018 Workers n=1,002, Retirees n=1,040
18%
25%57%
Debt is negatively
impacting your
ability to save for
retirement
9%
18%
71%
Debt is negatively
impacting your
ability to live
comfortably in
retirement
Workers Retirees
■ Strongly Agree ■ Somewhat Agree ■ Disagree
©2018 EBRI/Greenwald Retirement Confidence Survey

Figure 7
Retiree confidence in Medicare and Social Security has dropped compared
to previous years – fewer than half feel confident in these systems.
17
How confident are you that…
Retirees n=1,040
7%
7%
39%
38%
21%
46%
45%
23%
The Medicare system will continue to provide
benefits of at least equal value to the benefits
received by retirees today
The Social Security system will continue to provide
benefits of at least equal value to the benefits
received by retirees today
The U.S. government will do the right thing to
ensure people can achieve a secure retirement
Very Confident Somewhat Confident
= Up significantly from previous year = Down significantly from previous year
(vs. 52% in 2017)
(vs. 51% in 2017)
©2018 EBRI/Greenwald Retirement Confidence Survey

Figure 8
Retirees are most likely to say their health care costs are higher than what
they expected when they first retired.
18
11%
17%
12%
9%
7%
6%
26%
27%
14%
17%
17%
13%
52%
44%
23%
57%
49%
24%
8%
9%
9%
9%
7%
4%
48%
8%
18%
50%
Overall expenses/spending
Health care expenses
Long-term care expenses
Housing expenses
Travel, entertainment or leisure expenses
Spending to support or help a family
member
Compared with what you expected when you first retired, would you say the following are
higher or lower for you now than you expected?
2018 Retirees n=1,040
In Depth
Retirees in fair or poor health are more likely than average retirees to say expenses overall (50%), health care (55%) and long-term care expenses (36%) have been higher than they expected.
Those who have required long-term care within the past 5 years are twice as likely to say its expense was much higher than they expected (22% vs. 11% who have not needed long-term care).
■ Much Higher Than Expected ■ Somewhat Higher Than Expected ■ About the Same
■ Lower Than Expected ■ Not Applicable/Refused
©2018 EBRI/Greenwald Retirement Confidence Survey

Figure 9
As seen in prior years, retirees do not want to spend down their assets. 2 in 3
retirees aim to maintain or increase their level of assets.
19
Which one of the following best represents your behavior when it comes to your level of
assets?
2018 Retirees n=1,040
25%
41%
11%
12%
11%
You try to increase your asset level
You try to maintain your current asset
level
You spend down your assets as
needed
You have no assets/not applicable
Don’t know
In Depth
Retirees who are very confident they will have enough money for retirement are more likely than those less confident to say they try to
increase their asset level.
Those who claimed (or plan to claim) Social Security at age 66 or older are more likely than their counterparts to say they aim to increase their level of assets.
©2018 EBRI/Greenwald Retirement Confidence Survey

Figure 10
Despite higher expenses, 3 in 4 retirees say the current value of their assets is
about the same or higher than they expected.
20
Compared with what you expected when you first retired, would you say the current value
of your assets is…?
2018 Retirees n=1,040
11%
26%
39%
11%
13%
8%
21%
41%
16%
12%
Much higher than expected
Somewhat higher than expected
About the same as expected
Somewhat lower than expected
Much lower than expected
2018 2017*
*2017 asked: Compared with what you expected when you first retired, would you say your current account balances are…?
In Depth
Retirees who have a retirement savings plan and those who waited (or plan to wait) to claim Social Security until at least age 70 are more
likely to say their current asset values are higher than they expected.
Retired men are more likely than retired women to say the current value of their assets is higher than what they expected when they first retired (42% vs. 33%).
©2018 EBRI/Greenwald Retirement Confidence Survey

21
19%
24%
15%
14%
23%
9%
Total Workers (n=1,002)
Excellent/
Very good (n=501)
Good (n=375)
Fair/Poor (n=125)
Yes (n=756)
No (n=246)
Workers Retirees
Health Status
Have Retirement
Plan*
*Have Retirement Plan defined as respondent or spouse having at least one of the following: IRA, DC plan, or DB plan
39%
54%
35%
25%
46%
20%
Total Retirees (n=1,040)
Excellent/
Very good (n=417)
Good (n=369)
Fair/Poor (n=251)
Yes (n=833)
No (n=207)
Figure 11
Just 1 in 5 workers and 4 in 10 retirees say they have calculated how much
money they will need to cover health expenses in retirement.
To prepare for retirement have/did you (or your spouse) calculcate(d) how much money you (and your
spouse) would likely need to cover health expenses in retirement?
2018 Workers n=1,002, Retirees n=1,040
Percent Yes
Total Workers Total Retirees
Workers ages 55 or older are more likely to have
calculated how much they would need to cover
health expenses (28% vs. 17% of younger workers).
©2018 EBRI/Greenwald Retirement Confidence Survey

Figure 12
Retirees who calculated how much they would need for health care are
more likely to say health expenses in retirement have been as expected.
22
17%
27%
44%
6%3%
12%
27%
51%
6%
1%
21%
26%
40%
6%4%
Much higher than
expected
Somewhat higher than
expected
About the same as
expected
Somewhat lower than
expected
Much lower than
expected
Total Retirees Calculated how much is needed to cover health expenses before retirement Did not calculate
Health Care Expenses in Retirement by Planning for Health Care
2018 Retirees n=1,040
©2018 EBRI/Greenwald Retirement Confidence Survey

Figure 13
More than 7 in 10 workers say it would be helpful if their workplace offered
education on planning for health care expenses in retirement.
23
How helpful, if at all, do you think the following workplace educational or financial well-
being programs would be in helping you better prepare or save for retirement?
Workers employed full- or part-time n=763, Retirees employed full- or part-time n=64
25%
47%
17%
10%
16%
41%
18%
25%
Very helpful
Somewhat helpful
Not too helpful
Not at all helpful
Workers Retirees
In Depth
Among workers employed full- or part-time, women (76% vs. 68% of men), those who have saved for retirement (74% vs. 64% who have
not) and those who have any type of a retirement savings plan (75% vs. 58%) are more likely to say planning for health care expenses in retirement would be helpful if their workplace offered it.
Planning for Health Care Expenses in Retirement
©2018 EBRI/Greenwald Retirement Confidence Survey

Figure 14
Just 36% of workers say Social Security will be a major source of income,
while 2 in 3 retirees say it is a major source of their income in retirement.
24
In Depth
Older workers and retirees are more likely to say Social Security will be or is a source of income in retirement (93% of workers ages 45 or older vs. 80% younger; 95% of retirees ages 70 or older vs. 87% younger).
Those with lower incomes are more likely to expect Social Security to be a major source of income (45% of workers with less than $75k vs. 27% with $75k or more; 79% of retirees with less than $75k vs. 49% with $75k or more).
36%
50%
13%
86%Major/Minor
Source67%
24%
8%
■ Major Source
■ Minor Source
■ Not a Source
Workers Retirees
91%Major/Minor
Source
Social Security
To what extent (do you expect/is) each of the following (to be) a source of income in retirement?
Workers who plan to retire or have retired n=904, Retirees n=1,040
©2018 EBRI/Greenwald Retirement Confidence Survey

Figure 15
2 in 3 retirees say they thought about how the age at which they claim
Social Security can impact their benefit amount.
25
In Depth
Retirees who consider debt to be a major problem are more likely than their counterparts to say they did not review their Social Security benefit amount at their retirement age or think about impacts that the age they claim can have on the benefit amount.
To prepare for retirement, did you (or your spouse)…?
2018 Retirees n=1,040
■ Yes ■ No ■ Don’t Know
64%
28%
8%
Review the
amount of your
Social Security
benefit at your
planned
retirement age66%
26%
7%
Think about how the age at
which you claim Social Security can impact the
amount you receive
©2018 EBRI/Greenwald Retirement Confidence Survey

11%
34%
9%
22%
16%
5%
9%
10%
40%
7%
19%
13%
4%
7%
Under age 62
62
63-64
65
66-69
70 or older
I will never be
eligible
2018 2017
Median
2018 652017 65
26
Figures and n-sizes presented exclude those who answered “Don’t know” or refused to answer
Figure 16
Retirees’ median claiming age for Social Security is age 63, while workers
expect to claim at age 65.
At what age (will you or did you) begin to take Social Security retirement benefits?
2018 Workers n=508, Retirees n=932
7%
11%
4%
24%
29%
17%
8%
5%
12%
3%
27%
26%
18%
9%
Under age 62
62
63-64
65
66-69
70 or older
I will never be
eligible
2018 2017
Workers Retirees
Median
2018 632017 62
©2018 EBRI/Greenwald Retirement Confidence Survey

©2018 EBRI/Greenwald Retirement Confidence Survey
42% 43% 44% 43% 42% 42%46% 46% 47%
53%*
33% 32%29% 29% 30% 29% 28%
31% 30% 28%*
23% 23% 25% 26% 26% 26% 24% 22% 20% 19%*
2009 2010 2011 2012 2013 2014 2015 2016 2017 2018
Major Source Minor Source Not a Source
To what extent do you expect each of the following to be a source of income in retirement?
2018 Workers planning to retire n=904
*Previously asked “Employer-sponsored Retirement Savings Plan”
27
Figure 17
8 in 10 workers expect their workplace retirement savings plan to be a
source of retirement income, including half who say it will be a major source.
Workers who expect to claim Social Security at age 66 or older are more likely to expect a
workplace retirement savings plan to be a source of income (93% vs. 80% who plan to
claim younger).
Workplace Retirement Savings Plan*

21% 20%24% 21% 20% 19% 21% 19%
25% 24%*
19%24% 27%
20% 22% 23%19% 18%
25% 27%*
57%53%
45%
57%53% 53% 55%
59%
48% 48%*
0%
10%
20%
30%
40%
50%
60%
70%
80%
90%
100%
2009 2010 2011 2012 2013 2014 2015 2016 2017 2018
Major Source Minor Source Not a Source
*Previously asked “Employer-sponsored Retirement Savings Plan”
28
Figure 18
Only about half of retirees say a workplace retirement savings plan has been
a source of income in retirement.
Retirees who are zero to five years into retirement are more likely than retirees on average
to say a workplace retirement savings plan is a source of income (60%).
Workplace Retirement Savings Plan*
To what extent is each of the following a source of income in retirement?
2018 Retirees n=1,040
©2018 EBRI/Greenwald Retirement Confidence Survey

24%26%
29%
23%
27%24%
28% 29%
24% 24%
39%42%
37%40% 41% 41% 41% 40% 40%
34%
34%31% 32%
34%31% 32%
28% 28%
33%
40%
2009 2010 2011 2012 2013 2014 2015 2016 2017 2018
Major Source Minor Source Not a Source
29
Figure 19
Down significantly from last year, just under 6 in 10 workers expect their
income in retirement to come from an IRA.
Individual Retirement Account or IRA
To what extent do you expect each of the following to be a source of income in retirement?
2018 Workers planning to retire n=904
Workers with an advisor (83%) and those who expect to claim Social Security at age 70 or
older (82%) are more likely than workers on average to expect an IRA to be a source of
income in retirement.
©2018 EBRI/Greenwald Retirement Confidence Survey

Figure 20
More than 4 in 10 retirees with a DC plan rolled at least some of that money
into an IRA. In total, 7 in 10 took at least some of their money out of the plan.
30
In Depth
Retirees who claimed or plan to claim Social Security at age 70 or older are more likely than average retirees to have rolled money from their
workplace retirement savings plan into an IRA (68%).
Did you do any of the following with the money you had in your workplace retirement
savings plan? Please select all that apply.
Retirees who had DC plan at time of retirement n=659
44%
29%
20%
8%
7%
6%
Roll it into an IRA (Individual Retirement
Account)
Keep the money in your workplace
retirement savings plan
Cash it out and put it into another
investment or savings account
Cash it out and spend it
Purchase a product that guarantees
monthly income for life
Don’t know
©2018 EBRI/Greenwald Retirement Confidence Survey
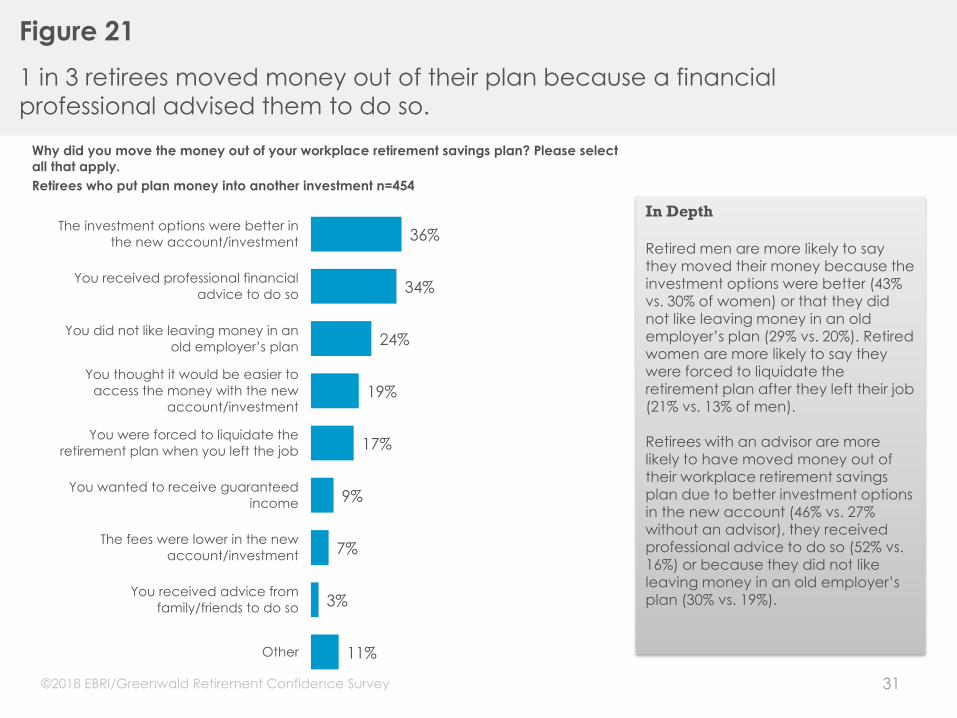
Figure 21
1 in 3 retirees moved money out of their plan because a financial
professional advised them to do so.
31
In Depth
Retired men are more likely to say they moved their money because the investment options were better (43% vs. 30% of women) or that they did
not like leaving money in an old employer’s plan (29% vs. 20%). Retired women are more likely to say they were forced to liquidate the retirement plan after they left their job (21% vs. 13% of men).
Retirees with an advisor are more likely to have moved money out of their workplace retirement savings plan due to better investment options in the new account (46% vs. 27% without an advisor), they received professional advice to do so (52% vs. 16%) or because they did not like
leaving money in an old employer’s plan (30% vs. 19%).
Why did you move the money out of your workplace retirement savings plan? Please select
all that apply.
Retirees who put plan money into another investment n=454
36%
34%
24%
19%
17%
9%
7%
3%
11%
The investment options were better in
the new account/investment
You received professional financial
advice to do so
You did not like leaving money in an
old employer’s plan
You thought it would be easier to
access the money with the new
account/investment
You were forced to liquidate the
retirement plan when you left the job
You wanted to receive guaranteed
income
The fees were lower in the new
account/investment
You received advice from
family/friends to do so
Other
©2018 EBRI/Greenwald Retirement Confidence Survey

Figure 22
3 in 10 workers “don’t know” what they will do with the money in their DC
plan at retirement. 1 in 4 plan to leave assets in the plan and 2 in 10 will
purchase guaranteed income, far more so than retirees.
32
30%
24%
23%
21%
5%
31%
44%
29%
20%
7%
8%
6%
Roll it into an IRA (Individual Retirement
Account)
Keep the money in your workplace
retirement savings plan
Cash it out and put it into another
investment or savings account
Purchase a product that guarantees
monthly income for life
Cash it out and spend it
Don't know
Workers Retirees In Depth
Workers with an advisor are more likely than those without one to say they will roll the money from their retirement savings plan into an IRA
(41% vs. 27%).
Those who expect to claim Social Security before age 65 are more likely than those who plan to wait until they are at least 70 to say they will purchase a product that guarantees monthly income for life (32% vs. 10%).
Those at least six years away from retirement are also more likely to say they will purchase a product that guarantees income for life (24% vs. 9% within 5 years of retiring).
Which of the following are you most likely to do with the money in your retirement savings
plan when you retire? Please select all that apply.
Workers participating in retirement savings plan n=502, Retirees who had DC plan at time of
retirement n=659
©2018 EBRI/Greenwald Retirement Confidence Survey
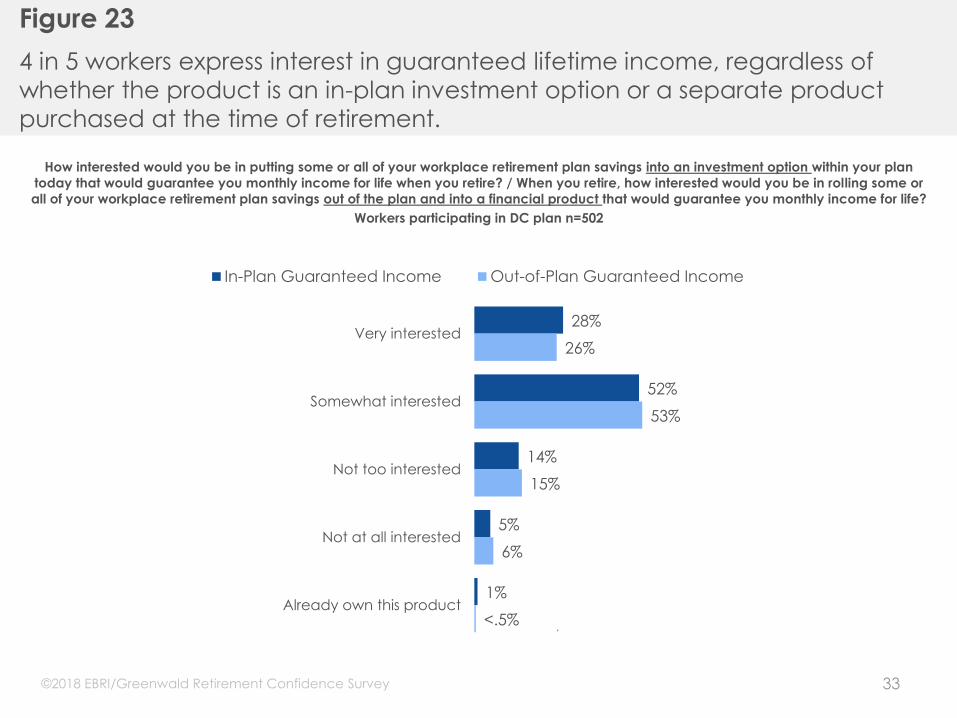
Figure 23
4 in 5 workers express interest in guaranteed lifetime income, regardless of
whether the product is an in-plan investment option or a separate product
purchased at the time of retirement.
33
How interested would you be in putting some or all of your workplace retirement plan savings into an investment option within your plan
today that would guarantee you monthly income for life when you retire? / When you retire, how interested would you be in rolling some or
all of your workplace retirement plan savings out of the plan and into a financial product that would guarantee you monthly income for life?
Workers participating in DC plan n=502
28%
52%
14%
5%
1%
26%
53%
15%
6%
<.5%
Very interested
Somewhat interested
Not too interested
Not at all interested
Already own this product
In-Plan Guaranteed Income Out-of-Plan Guaranteed Income
©2018 EBRI/Greenwald Retirement Confidence Survey

Figure 24
Workers also express interest in longevity insurance. Nearly half of workers are
at least somewhat interested.
34
7%
41%
35%
16%
1%
1%
2%
17%
27%
50%
4%
<.5%
Very interested
Somewhat interested
Not too interested
Not at all interested
Already own this
product
Refused
Workers (n=534) Retirees (n=490)
(When you retire,) How interested do you think you will be (are you) in purchasing an insurance product with (a portion/10%) of your
savings that begins providing guaranteed monthly income at some point in the future, such as age 80 or 85?
Split Sample, Ages 84 or younger
7%
40%
35%
17%
1%
<.5%
2%
13%
25%
57%
3%
0%
Very interested
Somewhat interested
Not too interested
Not at all interested
Already own this
product
Refused
Workers (n=468) Retirees (n=512)
A Portion of Savings 10 Percent of Savings
Net: InterestedWorkers – 48%Retirees – 19%
Net: InterestedWorkers – 47%Retirees – 15%
©2018 EBRI/Greenwald Retirement Confidence Survey

About EBRI
The Employee Benefit Research Institute is a private, nonpartisan, nonprofit
research institute based in Washington, DC, that focuses on health, savings,
retirement, and economic security issues. EBRI conducts objective research
and education to inform plan design and public policy, does not lobby and
does not take policy positions. The work of EBRI is made possible by funding
from its members and sponsors, which include a broad range of public,
private, for-profit and nonprofit organizations. For more information go to
www.ebri.org or www.asec.org.
About Greenwald
Greenwald & Associates is a leading full-service market research firm with
unique industry expertise in retirement, employee benefits & healthcare.
Conducting customized research for over 30 years, Greenwald & Associates
has earned a reputation for extensive research knowledge, industry expertise,
and commitment to serving the needs of our clients. For more information,
visit www.greenwaldresearch.com.
35
About Us
©2018 EBRI/Greenwald Retirement Confidence Survey
Top Related