


Languages
Pages
Legal


All About Discovery!New Mexico State University
nmsu.edu
™
Facilities and Services
2018 BRRUniversity Budget
Committee

All About Discovery!New Mexico State Universitynmsu.edu
™™ Facilities and Services
New Mexico State University Annual Capital Outlay
2
Glen Haubold, CEM, LEED APAssociate VP Facilities
Patty Hartell, Ed.D.Executive Director, Business Administration
Tim Dobson, EFPExecutive Director, Facility Operations
Dale Harrell, Ph.D.University Engineer

All About Discovery!New Mexico State Universitynmsu.edu
™™ Facilities and Services
Facilities: An Investment Portfolio?
Instructional31%
Auxiliary28%
Athletics12%
Library/Administrative29%
3

All About Discovery!New Mexico State Universitynmsu.edu
™™ Facilities and Services
Facilities: An Investment Portfolio?
4
9%
Building Systems
25%
Infrastructure28%
Space Renewal
32%
6%Safety/CodeEnvelope

13%26%
35%
25%
33% 24%
20% 25%
0%
10%
20%
30%
40%
50%
60%
70%
80%
90%
100%
NMSU Peer Average
% o
f GSF
Campus Age by Category
Under 10 10 to 25 25 to 50 Over 50
NMSU has More Older Space than Peers
High Risk
5
10-25
25-50
Focus on PM:Significant need for PM in
young systems.
Low Risk:“Honeymoon” period –little need for capital
reinvestment.
Medium Risk:Lower cost space
renewal updates needed.
Higher Risk:Life Cycles coming due in
core building components.
React as Needed:Issues in components past the end of their
lifecycles will demand reactive maintenance.
Highest Risk:Life cycles of major
components past due –end of building life cycle
approaching.
Operational Demands:
Capital Risk:
Under 10
Over 50
Balance PM and Reactive Maintenance:
Aging components require reactive maintenance
Younger components still an opportunity for PM
High Risk

$40.0
$15.7$11.8
$19.3
$8.3
$0.0
$5.0
$10.0
$15.0
$20.0
$25.0
$30.0
$35.0
$40.0
$45.0
3% Replacement Value Life Cycle Need Annual Investment Target
$ in
Mill
ions
FY16 Annual Investment Target
Envelope/Mechanical Space/Program
Defining an Annual Investment Target
6
Functional obsolescence drives investment prior to life cycles &
discounts the annual investment target
Annual Funding Target: $20.1M
Replacement Value: $1.3B

$0
$5
$10
$15
$20
$25
$30
$35
$40
2005 2006 2007 2008 2009 2010 2011 2012 2013 2014 2015 2016
$ in
Mill
ions
Total Capital Investment vs. Funding Target
Annual Stewardship Asset Reinvestment Annual Investment Target Life Cycle Need
Total Capital Investment vs. Funding Target
Increasing Backlog & Risk
7
Increasing Net Asset Value
Lowering Risk Profile
Note: Data shown does not include Infrastructure spending
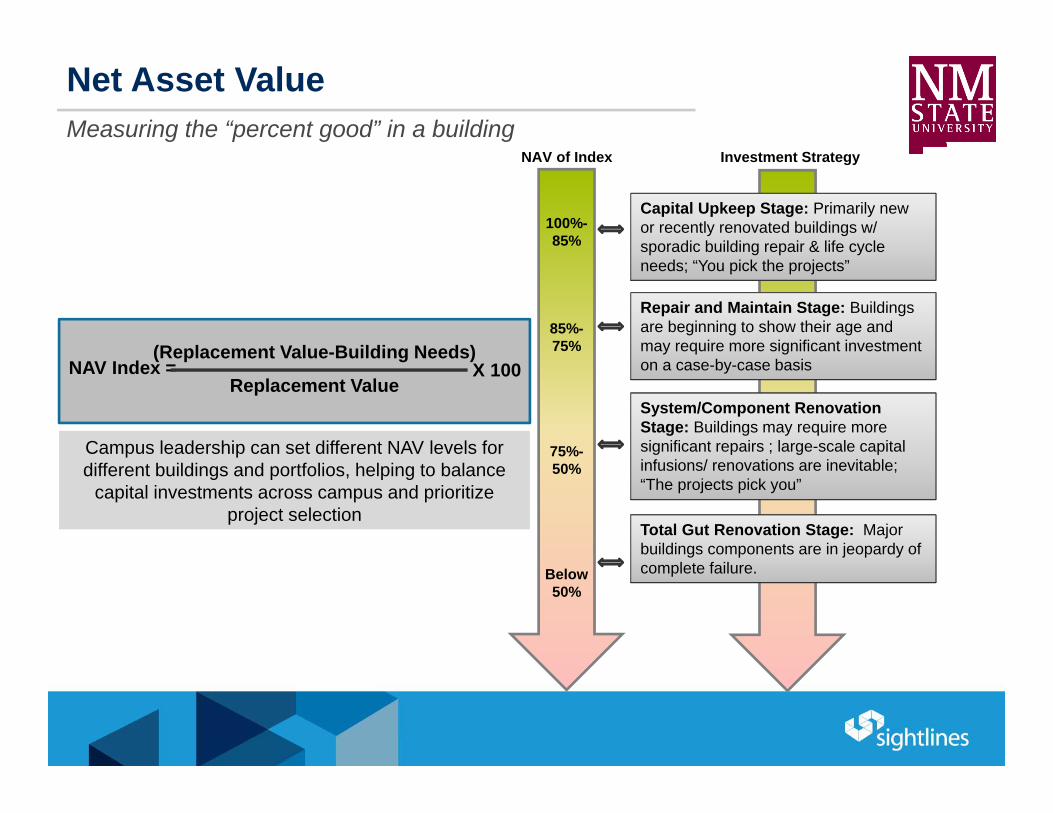
Net Asset ValueMeasuring the “percent good” in a building
NAV Index =(Replacement Value-Building Needs)
Replacement ValueX 100
Campus leadership can set different NAV levels for different buildings and portfolios, helping to balance
capital investments across campus and prioritize project selection
Investment Strategy
Capital Upkeep Stage: Primarily new or recently renovated buildings w/ sporadic building repair & life cycle needs; “You pick the projects”
Repair and Maintain Stage: Buildings are beginning to show their age and may require more significant investment on a case-by-case basis
System/Component Renovation Stage: Buildings may require more significant repairs ; large-scale capital infusions/ renovations are inevitable; “The projects pick you”
Total Gut Renovation Stage: Major buildings components are in jeopardy of complete failure.
NAV of Index
100%-85%
85%-75%
75%-50%
Below 50%
All About Discovery!New Mexico State Universitynmsu.edu
™™ Facilities and Services9
Decisions Requested Today• 2018 BRR section allocation in %• Continuation of authority to adjust sector
percentages +/- 10% with AVP and SVPAF approvals
• New authority to reduce sector minimum to 2% with AVP and SVPAF approvals

All About Discovery!New Mexico State Universitynmsu.edu
™™ Facilities and Services
BRR Sector Definitions• Major Maintenance
– Repair or replacement of failed or failing buildingcomponents as necessary to return a facility to its currently intended use, to prevent further damage, or to make compliant with changes in laws, regulations, codes or standards. Repair and replacement of building components
such as boilers, roofs, windows Facility changes necessary to meet regulatory and
code requirements other than ADA
All About Discovery!New Mexico State Universitynmsu.edu
™™ Facilities and Services
BRR Sector Definitions• Infrastructure
– The basic support facilities needed for the functioning of NMSU, such as transportation (roads) and utilities (communications systems, sewage, water, steam, and electricity. These are considered essential for supporting the physical functions of NMSU. Transformer Chilled water line Tunnel
All About Discovery!New Mexico State Universitynmsu.edu
™™ Facilities and Services
BRR Sector Definitions• Capital Improvements (CI)
– New construction, adaptive reuse of an existing building or room(s), or replacement of multiple building components. New GSF Programmatic remodels Conversion of a lab to a conference room

All About Discovery!New Mexico State Universitynmsu.edu
™™ Facilities and Services
BRR Sector Definitions• EHS (Environmental Health and Safety)
– Facilities improvements related to environmental stewardship, and maintaining a safe environment for NMSU students, faculty, and staff. Identified unsafe conditions such as stair tread, sidewalks,
etc. Remediation and disposal of hazardous materials such as
asbestos and ballasts with PCBs Overlaps with some other categories ADA

All About Discovery!New Mexico State Universitynmsu.edu
™™ Facilities and Services
BRR Goals are to Multiply $$s– Identify and replace assets with high maintenance
requirements increases dollars example: an elevator with many calls
– Make repairs / replacements that extend the life of assets defers repairs example: new roof/exterior repairs

All About Discovery!New Mexico State Universitynmsu.edu
™™ Facilities and Services
BRR Prioritization Process• Priority ranking by sector applied by Facilities
– the safety of faculty, staff, and students– critical components of the NMSU infrastructure– development of new initiatives and/or the continuation of
existing programs

All About Discovery!New Mexico State Universitynmsu.edu
™™ Facilities and Services
ADA Prioritization Process• Compliance is required up to the point the 20% cost
cap is reached. Compliance is prioritized thereafter -– accessible entrance– accessible route to the primary function area– restroom access– accessible telephone– accessible drinking fountain– access to other elements such as parking

All About Discovery!New Mexico State Universitynmsu.edu
™™ Facilities and Services
Capital Improvements• $70,000 for finishing Advisors and Trax• $250,000 for classrooms• $100,000 to the tunnel/maintenance sector • $80,000 reserve for Provost/SrVPAF
– business center relocation – startups

All About Discovery!New Mexico State Universitynmsu.edu
™™ Facilities and Services
Simulator
18

All About Discovery!New Mexico State Universitynmsu.edu
™™ Facilities and Services19
BRR
KPIs
Row Labels Sum of ITD EXPENSESum of EncumbrancesSum of Total Spent Total AwardedMM 1,914,626.36 8,731.77 1,923,358.13 1,637,826.00$ *CI 1,276,172.96 - 1,276,172.96 1,360,470.00$ INF 2,147,720.67 19,000.89 2,166,721.56 1,930,000.00$ *EHSA 316,221.18 32,952.48 349,173.66 343,000.00$ *Grand Total 5,654,741.17 60,685.14 5,715,426.31 5,271,296.00$ *Total Spent exceeds award amount due to projects funded from sector pools.
FY16 BRR Sectors Awarded/Total Spent as of 3/31/17YEAR FY16
Row Labels Sum of ITD EXPENSESum of EncumbrancesSum of Total Spent Total AwardedMM 2,756,285.61 320,693.87 3,076,979.48 3,273,285.00$ CI 746,135.44 102,115.69 848,251.13 650,000.00$ *INF 1,340,010.84 290,812.02 1,630,822.86 978,970.00$ *EHSA 215,779.94 78,348.83 294,128.77 369,041.00$ Grand Total 5,058,211.83 791,970.41 5,850,182.24 5,271,296.00$ *Total Spent exceeds award amount due to projects funded from sector pools.
FY17 BRR Sectors Awarded/Total Spent as of 3/31/17YEAR FY17
Row Labels Sum of ITD EXPENSESum of EncumbrancesSum of Total Spent Total AwardedMM 895,371.12 271,525.55 1,166,896.67 2,605,363.00$ CI 216,363.31 200,098.04 416,461.35 655,352.00$ INF 293,194.61 875,072.33 1,168,266.94 1,740,581.00$ EHSA 83,728.81 27,355.30 111,084.11 270,000.00$ Grand Total 1,488,657.85 1,374,051.22 2,862,709.07 5,271,296.00$ Note: .5% Increase in Total Spent within first year (FY16 total spent $2,848,069.46)

All About Discovery!New Mexico State Universitynmsu.edu
™™ Facilities and Services20
BRR
KPIs
FY15 BRR Sectors Awarded/Total Spent as of 3/31/15YEAR FY15
Row Labels Sum of ITD EXPENSESum of EncumbrancesSum of Total Spent Total Awarded % SpentMM 709,567.76 177,847.38 887,415.14 1,637,826.00$ CI 490,246.22 350,215.14 840,461.36 1,360,470.00$ INF 597,271.16 985,301.85 1,582,573.01 1,930,000.00$ EHSA 79,805.12 60,630.19 140,435.31 343,000.00$ Grand Total 1,876,890.26 1,573,994.56 3,450,884.82 5,271,296.00$ 65%
FY16 BRR Sectors Awarded/Total Spent as of 3/31/16YEAR FY16
Row Labels Sum of ITD EXPENSESum of EncumbrancesSum of Total Spent Total Awarded % SpentMM 892,956.50 599,113.23 1,492,069.73 3,273,285.00$ CI 127,556.43 320,824.61 448,381.04 650,000.00$ INF 202,845.17 518,935.72 721,780.89 978,970.00$ EHSA 940.66 184,897.14 185,837.80 369,041.00$ Grand Total 1,224,298.76 1,623,770.70 2,848,069.46 5,271,296.00$ 54%
FY17 BRR Sectors Awarded/Total Spent as of 3/31/17YEAR FY17
Row Labels Sum of ITD EXPENSESum of EncumbrancesSum of Total Spent Total Awarded % SpentMM 895,371.12 271,525.55 1,166,896.67 2,605,363.00$ CI 216,363.31 200,098.04 416,461.35 655,352.00$ INF 293,194.61 875,072.33 1,168,266.94 1,740,581.00$EHSA 83,728.81 27,355.30 111,084.11 270,000.00$ Grand Total 1,488,657.85 1,374,051.22 2,862,709.07 5,271,296.00$ 54%

All About Discovery!New Mexico State Universitynmsu.edu
™™ Facilities and Services21
Sector History

All About Discovery!New Mexico State Universitynmsu.edu
™™ Facilities and Services22
Sector History

All About Discovery!New Mexico State Universitynmsu.edu
™™ Facilities and Services23
Sector History /Request
All About Discovery!New Mexico State Universitynmsu.edu
™™ Facilities and Services24
Approvals Requested Today• 2018 BRR section allocation in %• Continuation of authority to adjust
sector percentages +/- 10% with AVP and SVPAF approvals
• New authority to reduce sector minimum to 2% with AVP and SVPAF approvals

All About Discovery!New Mexico State Universitynmsu.edu
™™ Facilities and Services
Thank You !
Questions?
25
Top Related