


Languages
Pages
Legal


2013 operating budget and plandivision of administration & finance – september 2012


2013 operating budget and plan
1
IntroductIon ....................................................................................... 2
ExEcutIvE Summary ............................................................................ 3
unIvErSIty Summary .......................................................................... 4
unIvErSIty rEvEnuE Summary ......................................................... 7
unIvErSIty ExpEndIturE Summary .................................................. 8
EducatIon & GEnEral StatE-aSSIStEd rESourcE allocatIon ......................................................................... 9
EducatIon & GEnEral SElf-Support rESourcE allocatIon ....................................................................... 16
auxIlIary EntErprISES rESourcE allocatIon ............................. 22
rEStrIctEd rESourcE allocatIon .................................................. 31
capItal budGEt projEctS ................................................................. 37
appEndIx................................................................................................39
GloSSary .............................................................................................. 53
acknowlEdGEmEntS ......................................................................... 56

2013 operating budget and plan
2
The FY 2013 Operating Budget and Plan for Towson University presents a detailed picture of the institution’s internal 2012-2013 budget as of September 2012. This includes information concerning resources allocated and revenues generated and expended in both FY 2012 and FY 2013.
The budget culminates from external policy decisions made by the Governor, Maryland State General Assembly, the University System of Maryland (USM) Board of Regents, and internal decisions implemented by the university’s administration executive staff with guidance from the Resource Planning and Advisory Committee. This document explicates a few of the many fiscal decisions made each year to provide a greater understanding of the overall budget.
A thorough understanding of an institution’s budgetary decisions calls for a comprehensive knowledge of that institution and its long-term goals. To meet this end, the FY 2013 Operating Budget and Plan presents a brief institutional profile, descriptions of major grants and contracts active in FY 2013 and a capital funding report containing the university’s state-assisted and system-funded capital projects as they relate to the campus master plan.
FY 2012 and FY 2013 Annual Tuition and Fees for Full-Time Undergraduate Students
ExpEnSE FY 2012 FY 2013 ChAngE
In-State Tuition $5,496 $5,660 $164
Out-of-State Tuition $17,008 $17,282 $274
Technology Fee $160 $168 $8
AUxiliArY FEES
Athletics $798 $798 $0
Auxiliary Services $424 $440 $16
Auxiliary Services – Construction $948 $986 $38
Student Services – SGA $80 $80 $0
Total Fees $2,410 $2,472 $62
Total in-State Cost, Tuition and Fees $7,906 $8,132 $226
Total Out-of-State Cost, Tuition and Fees $19,418 $19,754 $336
TUiTiOn And FEES
Increased costs in areas such as facilities operations, contractual obligations, and employee benefits impact the ability to maintain and operate the university without additional resources. The external policy makers and Towson Administration are mindful of the burden tuition places on students and strives to limit tuition and fee increases wherever possible. Tuition revenue is currently the largest portion of Towson’s revenue and is used to generate much of the university’s operating funds.
introduction
2013 operating budget and plan
3
eXecutive summarY
Actions of the general Assembly and Executive Branch
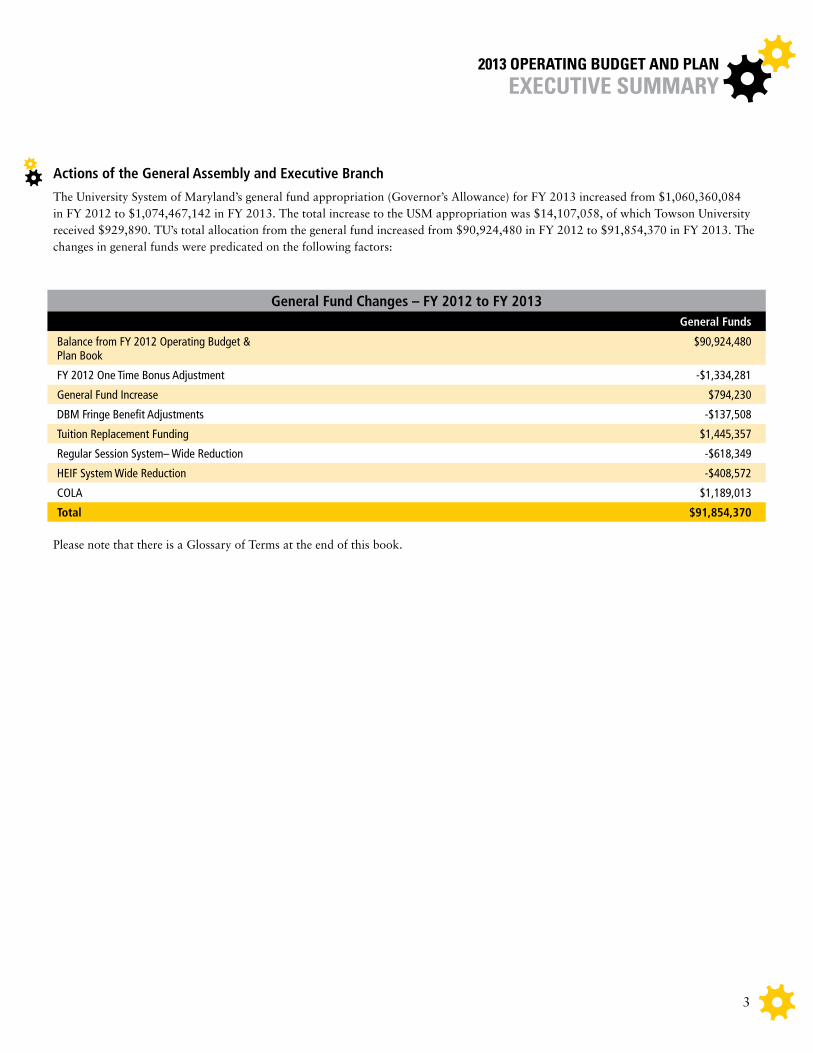
The University System of Maryland’s general fund appropriation (Governor’s Allowance) for FY 2013 increased from $1,060,360,084 in FY 2012 to $1,074,467,142 in FY 2013. The total increase to the USM appropriation was $14,107,058, of which Towson University received $929,890. TU’s total allocation from the general fund increased from $90,924,480 in FY 2012 to $91,854,370 in FY 2013. The changes in general funds were predicated on the following factors:
general Fund Changes – FY 2012 to FY 2013general Funds
Balance from FY 2012 Operating Budget & Plan Book
$90,924,480
FY 2012 One Time Bonus Adjustment -$1,334,281
General Fund Increase $794,230
DBM Fringe Benefit Adjustments -$137,508
Tuition Replacement Funding $1,445,357
Regular Session System– Wide Reduction -$618,349
HEIF System Wide Reduction -$408,572
COLA $1,189,013
Total $91,854,370
Please note that there is a Glossary of Terms at the end of this book.

2013 operating budget and plan
4
State- Assisted
Auxiliary Enterprises
Self-Support restricted Total
FY 2012 Revenue $247,352,402 $102,877,095 $20,208,674 $44,390,007 $414,828,178
FY 2012 Expenditure $245,131,477 $102,448,830 $19,390,007 $44,390,007 $411,224,571
Balance $2,220,925 $428,265 $954,417 $0 $3,603,607
FY 2013 Revenue $253,609,188 $105,501,510 $18,951,116 $45,735,110 $423,796,924
FY 2013 Expenditure $251,299,305 $104,175,131 $18,345,732 $45,735,110 $419,555,278
Balance $2,309,883 $1,326,379 $605,384 $0 $4,241,646
revenue Change
$8,968,746
Expenditure Change
$8,330,707
Towson University’s internal operating budget is comprised of four fund groups as listed below. The FY 2013 total revenue increased by $8,968,746 and total budgets were increased by $8,330,707 over FY 2012.
The Resource Planning and Advisory Committee (RPAC) reviews the budget requests submitted by the divisions for the State-Assisted and Auxiliary Enterprises areas. RPAC prioritizes the request and makes recommendations to the President’s Council. Based on their recommendation and the amount of funding available, a final decision is made by the President. The Self-Support budgets are determined within each division. Self-Supported departments must either spend within the plans submitted or the revenues generated – whichever is the least amount. The Restricted budgets are determined based on the federal, state, local, and private grants and contracts. Only restricted dollars received are allowed to be spent.
The total University budget is the sum of each division’s allocation. Divisions and departments may have a budget in each fund group. The divisions are: Executive, Academic Affairs, Innovation and Applied Research, Student Affairs, Administration and Finance, University Advancement, Athletics, and Central Divisions.
The adjustments made in each division’s budget are explained below.
State-Assisted Budgets
The Executive Division’s budget increased by $4,464,299 (or a 64.0% change over FY 2012). The adjustment includes funding associated with the university’s strategic plan, Towson 2016 and funding for the shift of the University Marketing Subdivision from University Advancement. One-time funding in the amount of $49,500 was allocated for the President’s Inauguration.
The Academic Affairs Division’s budget increased by $4,614,236 (or a 3.6% change over FY 2012). The adjustments include funding associated with faculty promotion & tenure, adjunct II faculty promotion, LIMS (Library Information Management System), Harford Community College operations, on-line course operations, lab/class fee increases, the new exempt pay scale, and funding for the shift of Undergraduate and Graduate Marketing Departments from University Advancement and AIT from Self-Support. Nine positions were approved for FY 2013. New base funding provided 3 staff positions for the Towson City Center, 2 staff position for Sponsored Projects and Research (SPAR) and 2 faculty positions for Course Redesign. Current resources were reallocated for the two additional positions, Assessment Director and Director of Center for Teaching, and Learning. One-time funding in the amount of $379,500 was allocated for the Hagerstown Nursing Program.
universitY summarY
2013 operating budget and plan
5
The Innovation and Applied Research Division’s budget increased by $4,267 (or a 0.4% change over FY 2012). The adjustment includes funding associated with the new exempt pay scale.
The Student Affairs Division’s budget increased by $63,018 (or a 0.8% change over FY 2012). The adjustments include funding associated with the new exempt pay scale. One position was approved and new base funding was provided to the Career Center for one staff position. Current resources were reallocated to provide additional hours of availability in the Counseling Center, increase the salaries for the Counseling Center interns, operating funds for LGBT and the Office of Student Conduct and Civility Education.
The Administration and Finance Division’s budget increased by $1,052,051 (or a 2.1% change over FY 2012). Funding for the shift of the FY 2012 new facilities operations from Central is included. Seven positions were approved and new base funding was provided for three staff positions in the Office of Technology Services. Additionally, current resources were reallocated for Accounting Associate, Systems Developer, OHR Leave Coordinator and Account Clerk positions. Resources were reallocated for the increased operational cost associated with the Campus Solutions–Human Capital Management (CS-HCM) split, annual maintenance of hardware cost, contracts, PeopleSoft licenses and fees. One-time funding, in the amount of $1,078,000 was allocated for the Content Management System (CMS) Content Management Web Redesign initiative, network connectivity to the Towson City Center, in-building radio reception for CLA, E-builder project management software and other campus safety equipment (Blue Light Stations, card swipe access, cameras, etc.).
The University Advancement Division’s budget decreased by $3,672,503 (or a -48.0% change over FY 2012). The adjustments include funding associated with the new exempt pay scale, funding for the shift of Undergraduate and Graduate Marketing departments to Academic Affairs, University Marketing Subdivision to Executive and the University Design Center from Central.
Financial Aid’s budget increased by $149,648 (or a 0.6% change over FY 2012). The adjustment includes an increase in funding for institutional grant scholarships.
The Central Division’s budget increased by $1,932,204 (or a 7.1% change over FY 2012). In addition, there is a $1,189,013 increase for COLA being held for distribution to the divisions
in January. The adjustments include: increases in technology, debt service funding, funding increases to accommodate the operating costs of new campus buildings, rent for the Towson City Center building, fuel and utilities, mandatory adjustments to retirement and personnel system charges, workmen’s compensation, and health benefits. Funding was decreased to reflect the shift of the University Design Center to University Advancement and FY 2012 new facilities operations to Administration and Finance.
The University Contingency budget decreased by $2,628,425 (or a -56.8% change over FY 2012). The adjustment includes a reduction of the contingency to offset unepected changes to revenues or expenditures.
The Turnover Target decreased by $1,000,000 (or a 0.3% change over FY 2012). The turnover target comes from anticipated position vacancies and allows $3,000,000 to be budgeted on the operating side for the university.
Auxiliary Enterprises Budgets
The Athletics Division’s spending authority increased by $197,073 (or a 1.0% change over FY 2012). Athletics was granted permission to spend $697,462 of prior year funding in FY 2013. In addition, their IDC requirement has been reduced by $200,000 for the next two fiscal years (FY 2013 – FY 2014). The Athletic Fees for students did not increase and the revenue projection decreased based on FY 2012 actual revenue. However, the self-generated revenue for FY 2013 is projected to be higher than the FY 2012. Current resources were reallocated to provide additional operational support for the Men and Women’s Basketball teams.
The Academic Affairs Division’s spending authority increased by $20,468 (or a 5.8% change over FY 2012). Additional Auxiliary Fees were provided to increase the FTE from 0.5 to 1.0 for Administrative Assistant position.
The Student Affairs Division’s spending authority increased by $327,320 (or a 1.3% change over FY 2012). Additional Auxiliary Fees were provided for increased operating costs associated with Student Activities and Campus Recreation Services. Two positions were approved and new base funding was provided for one staff position in Greek Life. The second position, Residence Life Coordinator, is supported by Housing and Residence Life’s self-generated revenue. Current resources were reallocated to support the Collegetown Shuttle services and the Center for Student Diversity programming.
universitY summarY

2013 operating budget and plan
6
The Administration and Finance Division’s spending authority increased by $759,046 (or a 3.8% change over FY 2012). Four positions were approved; resources and State Authorized Positions (SAP) were reallocated for the contingent conversion in Events and Conference Services. Funding was reallocated for the two maintenance mechanics and groundkeeper positions. Current resources were reallocated to cover the additional debt.
The University Design Center is now operating under the State-Assisted area within the University Advancement Division.
The Central Division’s spending authority increased by $3,139,885 (or a 4.4% change over FY 2012). Additional Auxiliary Fees were provided for the increased debt of Burdick Hall and the Tiger Arena.
The Contingency spending authority decreased by $541,830 (or a -27.1% change over FY 2012). In order to have funding available for increased debt, the university had to reduce the contingency.
Self Support Budgets
The Academic Affairs Division’s spending authority, primarily in summer and winter session, decreased by $515,691 (or a -3.4% change over FY 2012). AIT courses have been moved to the state-assisted budget and are no longer included in self-support.
The Innovation and Applied Research Division’s spending authority decreased by $431,332(or a -3.2% change over FY 2012). The Division was approved to use up to $317,646 of prior year funding during FY 2013.
The Student Affairs Division’s spending authority decreased by $13,688 (or a -7.4% change over FY 2012).
The Administration and Finance Division’s spending authority increased by $52,186 (or a 3.6% change over FY 2012).
restricted Budgets
Restricted funds have an externally established limitation or stipulation placed on their use. Funds are limited to a specific use by outside agencies or persons, as distinguished funds, over which the institution has complete control and freedom as to use. Only restricted dollars actually received are allowed to be spent.
All of these adjustments are explained in detail in the following sections.
universitY summarY
2013 operating budget and plan
7
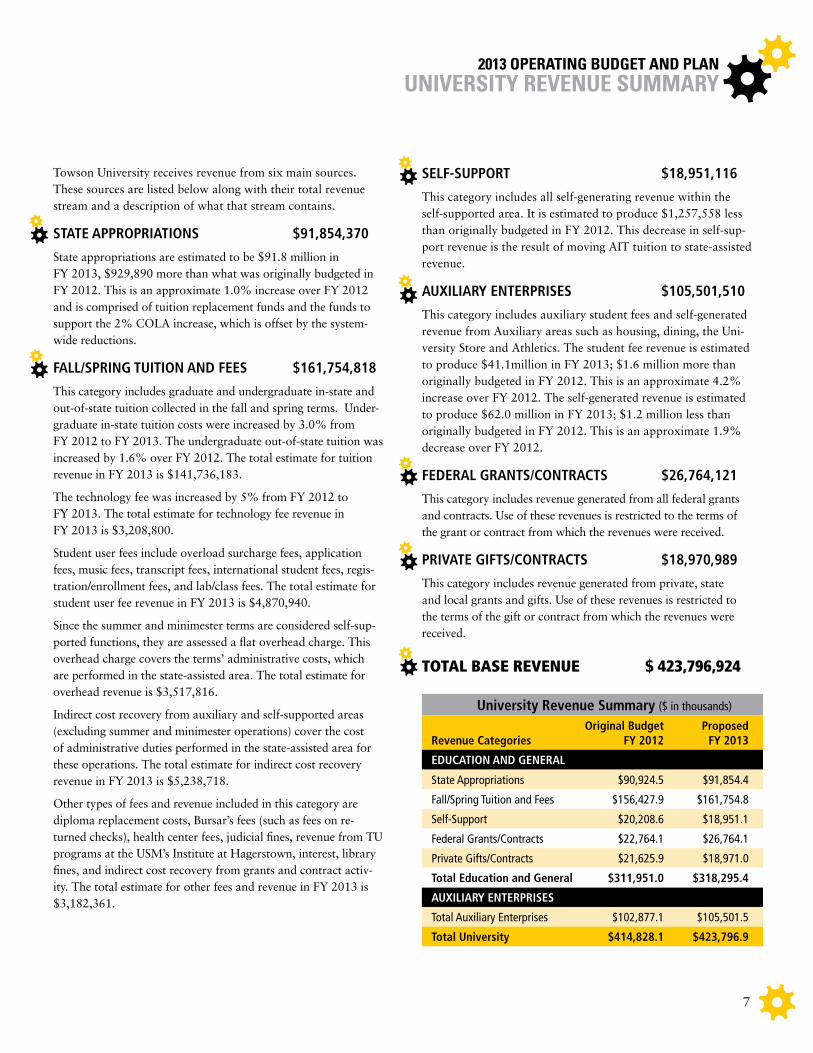
Towson University receives revenue from six main sources. These sources are listed below along with their total revenue stream and a description of what that stream contains.
STATE ApprOpriATiOnS $91,854,370
State appropriations are estimated to be $91.8 million in FY 2013, $929,890 more than what was originally budgeted in FY 2012. This is an approximate 1.0% increase over FY 2012 and is comprised of tuition replacement funds and the funds to support the 2% COLA increase, which is offset by the system-wide reductions.
FAll/Spring TUiTiOn And FEES $161,754,818
This category includes graduate and undergraduate in-state and out-of-state tuition collected in the fall and spring terms. Under-graduate in-state tuition costs were increased by 3.0% from FY 2012 to FY 2013. The undergraduate out-of-state tuition was increased by 1.6% over FY 2012. The total estimate for tuition revenue in FY 2013 is $141,736,183.
The technology fee was increased by 5% from FY 2012 to FY 2013. The total estimate for technology fee revenue in FY 2013 is $3,208,800.
Student user fees include overload surcharge fees, application fees, music fees, transcript fees, international student fees, regis-tration/enrollment fees, and lab/class fees. The total estimate for student user fee revenue in FY 2013 is $4,870,940.
Since the summer and minimester terms are considered self-sup-ported functions, they are assessed a flat overhead charge. This overhead charge covers the terms’ administrative costs, which are performed in the state-assisted area. The total estimate for overhead revenue is $3,517,816.
Indirect cost recovery from auxiliary and self-supported areas (excluding summer and minimester operations) cover the cost of administrative duties performed in the state-assisted area for these operations. The total estimate for indirect cost recovery revenue in FY 2013 is $5,238,718.
Other types of fees and revenue included in this category are diploma replacement costs, Bursar’s fees (such as fees on re-turned checks), health center fees, judicial fines, revenue from TU programs at the USM’s Institute at Hagerstown, interest, library fines, and indirect cost recovery from grants and contract activ-ity. The total estimate for other fees and revenue in FY 2013 is $3,182,361.
SElF-SUppOrT $18,951,116
This category includes all self-generating revenue within the self-supported area. It is estimated to produce $1,257,558 less than originally budgeted in FY 2012. This decrease in self-sup-port revenue is the result of moving AIT tuition to state-assisted revenue.
AUxiliArY EnTErpriSES $105,501,510
This category includes auxiliary student fees and self-generated revenue from Auxiliary areas such as housing, dining, the Uni-versity Store and Athletics. The student fee revenue is estimated to produce $41.1million in FY 2013; $1.6 million more than originally budgeted in FY 2012. This is an approximate 4.2% increase over FY 2012. The self-generated revenue is estimated to produce $62.0 million in FY 2013; $1.2 million less than originally budgeted in FY 2012. This is an approximate 1.9% decrease over FY 2012.
FEdErAl grAnTS/COnTrACTS $26,764,121
This category includes revenue generated from all federal grants and contracts. Use of these revenues is restricted to the terms of the grant or contract from which the revenues were received.
privATE giFTS/COnTrACTS $18,970,989
This category includes revenue generated from private, state and local grants and gifts. Use of these revenues is restricted to the terms of the gift or contract from which the revenues were received.
ToTal Base Revenue $ 423,796,924
University revenue Summary ($ in thousands)
revenue Categories
Original Budget FY 2012
proposed FY 2013
EdUCATiOn And gEnErAl
State Appropriations $90,924.5 $91,854.4
Fall/Spring Tuition and Fees $156,427.9 $161,754.8
Self-Support $20,208.6 $18,951.1
Federal Grants/Contracts $22,764.1 $26,764.1
Private Gifts/Contracts $21,625.9 $18,971.0
Total Education and general $311,951.0 $318,295.4
AUxiliArY EnTErpriSES
Total Auxiliary Enterprises $102,877.1 $105,501.5
Total University $414,828.1 $423,796.9
universitY revenue summarY
2013 operating budget and plan
8
universitY eXpenditure summarY
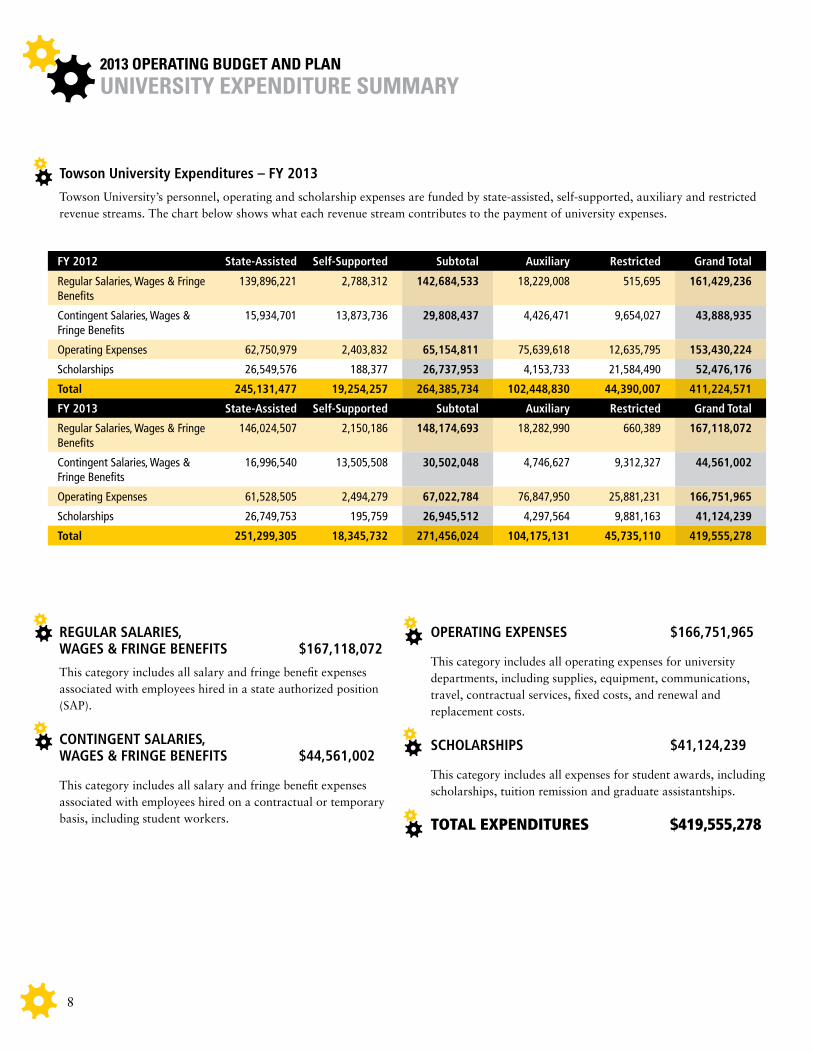
FY 2012 State-Assisted Self-Supported Subtotal Auxiliary restricted grand Total
Regular Salaries, Wages & Fringe Benefits
139,896,221 2,788,312 142,684,533 18,229,008 515,695 161,429,236
Contingent Salaries, Wages & Fringe Benefits
15,934,701 13,873,736 29,808,437 4,426,471 9,654,027 43,888,935
Operating Expenses 62,750,979 2,403,832 65,154,811 75,639,618 12,635,795 153,430,224
Scholarships 26,549,576 188,377 26,737,953 4,153,733 21,584,490 52,476,176
Total 245,131,477 19,254,257 264,385,734 102,448,830 44,390,007 411,224,571
FY 2013 State-Assisted Self-Supported Subtotal Auxiliary restricted grand Total
Regular Salaries, Wages & Fringe Benefits
146,024,507 2,150,186 148,174,693 18,282,990 660,389 167,118,072
Contingent Salaries, Wages & Fringe Benefits
16,996,540 13,505,508 30,502,048 4,746,627 9,312,327 44,561,002
Operating Expenses 61,528,505 2,494,279 67,022,784 76,847,950 25,881,231 166,751,965
Scholarships 26,749,753 195,759 26,945,512 4,297,564 9,881,163 41,124,239
Total 251,299,305 18,345,732 271,456,024 104,175,131 45,735,110 419,555,278
Towson University Expenditures – FY 2013
Towson University’s personnel, operating and scholarship expenses are funded by state-assisted, self-supported, auxiliary and restricted revenue streams. The chart below shows what each revenue stream contributes to the payment of university expenses.
rEgUlAr SAlAriES, WAgES & FringE BEnEFiTS $167,118,072
This category includes all salary and fringe benefit expenses associated with employees hired in a state authorized position (SAP).
COnTingEnT SAlAriES, WAgES & FringE BEnEFiTS $44,561,002
This category includes all salary and fringe benefit expenses associated with employees hired on a contractual or temporary basis, including student workers.
OpErATing ExpEnSES $166,751,965
This category includes all operating expenses for university departments, including supplies, equipment, communications, travel, contractual services, fixed costs, and renewal and replacement costs.
SChOlArShipS $41,124,239
This category includes all expenses for student awards, including scholarships, tuition remission and graduate assistantships.
ToTal expendiTuRes $419,555,278
2013 operating budget and plan
9
education and general state-assisted resource allocation
Towson University’s FY 2013 State-Assisted Budget
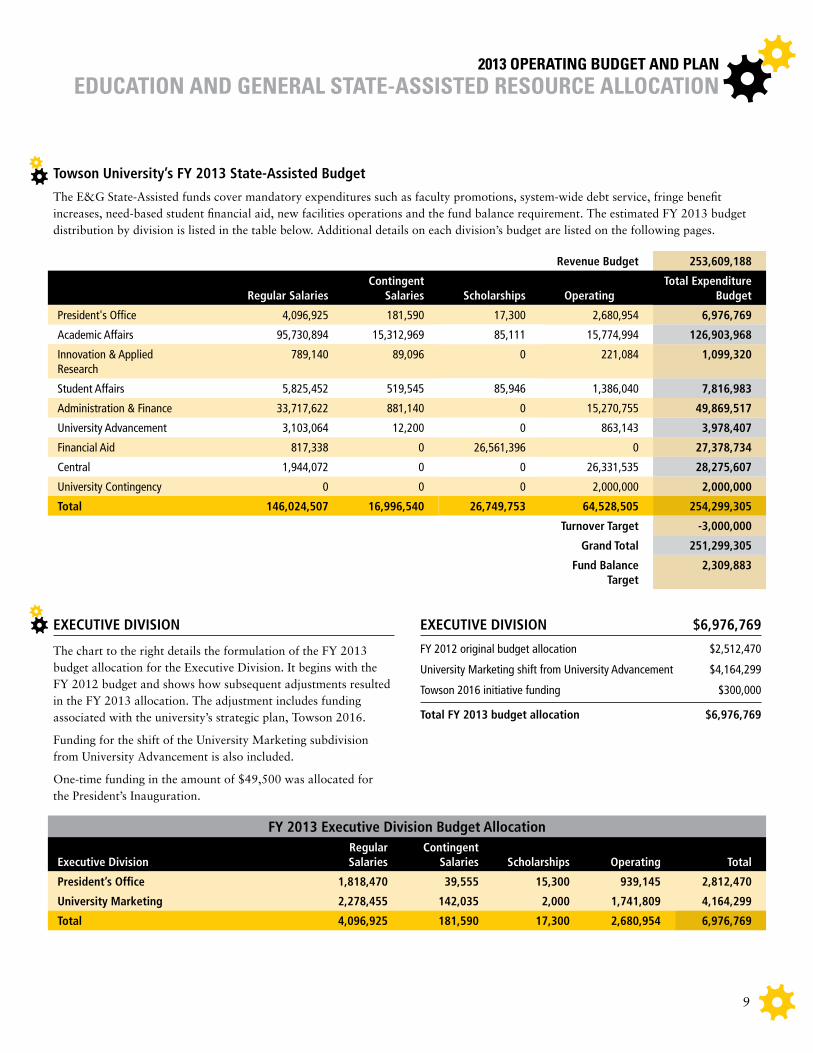
The E&G State-Assisted funds cover mandatory expenditures such as faculty promotions, system-wide debt service, fringe benefit increases, need-based student financial aid, new facilities operations and the fund balance requirement. The estimated FY 2013 budget distribution by division is listed in the table below. Additional details on each division’s budget are listed on the following pages.
revenue Budget 253,609,188
regular Salaries
Contingent Salaries
Scholarships
Operating
Total Expenditure Budget
President's Office 4,096,925 181,590 17,300 2,680,954 6,976,769
Academic Affairs 95,730,894 15,312,969 85,111 15,774,994 126,903,968
Innovation & Applied Research
789,140 89,096 0 221,084 1,099,320
Student Affairs 5,825,452 519,545 85,946 1,386,040 7,816,983
Administration & Finance 33,717,622 881,140 0 15,270,755 49,869,517
University Advancement 3,103,064 12,200 0 863,143 3,978,407
Financial Aid 817,338 0 26,561,396 0 27,378,734
Central 1,944,072 0 0 26,331,535 28,275,607
University Contingency 0 0 0 2,000,000 2,000,000
Total 146,024,507 16,996,540 26,749,753 64,528,505 254,299,305
Turnover Target -3,000,000
grand Total 251,299,305
Fund Balance Target
2,309,883
ExECUTivE diviSiOn $6,976,769
FY 2012 original budget allocation $2,512,470
University Marketing shift from University Advancement $4,164,299
Towson 2016 initiative funding $300,000
Total FY 2013 budget allocation $6,976,769
FY 2013 Executive division Budget Allocation Executive division
regular Salaries
Contingent Salaries
Scholarships
Operating
Total
president’s Office 1,818,470 39,555 15,300 939,145 2,812,470
University Marketing 2,278,455 142,035 2,000 1,741,809 4,164,299
Total 4,096,925 181,590 17,300 2,680,954 6,976,769
ExECUTivE diviSiOn
The chart to the right details the formulation of the FY 2013 budget allocation for the Executive Division. It begins with the FY 2012 budget and shows how subsequent adjustments resulted in the FY 2013 allocation. The adjustment includes funding associated with the university’s strategic plan, Towson 2016.
Funding for the shift of the University Marketing subdivision from University Advancement is also included.
One-time funding in the amount of $49,500 was allocated for the President’s Inauguration.

2013 operating budget and plan
10
education and general state-assisted resource allocation
ACAdEMiC AFFAirS diviSiOn $126,903,968
FY 2012 original budget allocation $122,289,732
Department shift from University Advancement - UG & Grad Marketing $921,868
Faculty promotion & tenure funding $485,450
Adjunct II promotion funding $125,000
LIMS funding $60,000
Harford Community College funding $400,000
On-line course funding $400,000
Staff for Towson City Center (3 positions) $227,700
Staff for SPAR (2 positions) $138,000
Faculty course redesign funding (2 positions) $165,526
Lab/class fee funding $9,065
Exempt pay scale adjustment funding $11,627
AIT move from self support to state-assisted $1,670,000
Total FY 2013 budget allocation $126,903,968
FY 2013 Academic Affairs division Budget Allocation Academic Affairs
regular Salaries
Contingent Salaries
Scholarships
Operating
Total
Academic Affairs Administration 4,313,961 12,984,143 0 6,140,386 23,438,490
Academic Student Services 1,474,940 383,008 0 106,993 1,964,941
College of Business & Economics 12,107,781 69,325 6,000 474,675 12,657,781
College of Education 7,385,447 217,900 0 432,280 8,035,627
College of Fine Arts & Communications 11,202,966 392,642 0 1,232,358 12,827,966
College of Graduate Education & Research 559,476 23,140 0 196,467 779,083
College of Health Professions 12,207,397 104,339 0 854,161 13,165,897
College of Liberal Arts 18,725,272 176,496 16,176 880,603 19,798,547
Enrollment Management 6,417,961 402,236 21,000 1,061,746 7,902,943
Fisher College of Science & Mathematics 17,378,260 400,520 35,000 1,746,100 19,559,880
Interdisciplinary Program 61,180 0 0 12,000 73,180
International Programs 453,554 74,220 6,935 38,845 573,554
Library 3,442,699 85,000 0 2,598,380 6,126,079
Total 95,730,894 15,312,969 85,111 15,774,994 126,903,968
ACAdEMiC AFFAirS diviSiOn
The chart to the right details the formulation of the FY 2013 budget allocation for the Academic Affairs Division. It begins with the FY 2012 budget and shows how subsequent adjustments resulted in the FY 2013 allocation. The adjustments include funding associated with faculty promotion & tenure, adjunct II faculty promotion, LIMS (Library Information Management System), Harford Community College operations, online course operations, lab/class fee increases, and the new exempt pay scale.
Funding for the shift of Undergraduate and Graduate Marketing Departments from University Advancement and AIT from Self-Support is also included.
Nine positions were approved for FY 2013. New base funding provided 3 staff positions for the Towson City Center, 2 staff position for Sponsored Projects and Research (SPAR) and 2 faculty positions for Course Redesign.
Current resources were reallocated for the two additional positions, Assessment Director and Director of Center for Teaching, and Learning.
One-time funding in the amount of $379,500 was allocated for the Hagerstown Nursing Program.

2013 operating budget and plan
11
innOvATiOn & AppliEd rESEArCh diviSiOn $1,099,320
FY 2012 original budget allocation $1,095,053
Exempt pay scale adjustment funding $4,267
Total FY 2013 budget allocation $1,099,320
FY 2013 innovation & Applied research division Budget Allocation innovation & Applied research
regular Salaries
Contingent Salaries
Scholarships
Operating
Total
Total 789,140 89,096 0 221,084 1,099,320
The chart to the right details the formulation of the FY 2013 budget allocation for the Innovation and Applied Research Division. It begins with the FY 2012 budget and shows how subsequent adjustments resulted in the FY 2013 allocation. The adjustment includes funding associated with the new exempt pay scale.
education and general state-assisted resource allocation
STUdEnT AFFAirS diviSiOn $7,816,983
FY 2012 original budget allocation $7,753,965
Staff for Career Center (1 position) $55,200
Exempt pay scale adjustment funding $7,818
Total FY 2013 budget allocation $7,816,983
FY 2013 Student Affairs division Budget Allocation Student Affairs
regular Salaries
Contingent Salaries
Scholarships
Operating
Total
Campus Life 389,535 80,036 8,088 218,705 696,364
Office of Diversity 623,911 35,490 0 108,041 767,442
Student Affairs Administration 1,015,538 27,536 26,088 243,978 1,313,140
Student Development Programs 3,796,468 376,483 51,770 815,316 5,040,037
Total 5,825,452 519,545 85,946 1,386,040 7,816,983
The chart to the right details the formulation of the FY 2013 budget allocation for the Student Affairs Division. It begins with the FY 2012 budget and shows how subsequent adjustments resulted in the FY 2013 allocation. The adjustments include funding associated with the new exempt pay scale.
In FY 2013, one position was approved and new base funding was provided to the Career Center for one staff position.
Current resources were reallocated to provide additional hours of availability in the Counseling Center, increase the salaries for the Counseling Center interns; operating funds for LGBT and the Office of Student Conduct and Civility Education.
innOvATiOn & AppliEd rESEArCh diviSiOn
STUdEnT AFFAirS diviSiOn

2013 operating budget and plan
12
AdMiniSTrATiOn & FinAnCE diviSiOn $49,869,517
FY 2012 original budget allocation $ 48,817,446
FY 2012 Facilities operating from Central $698,671
CRM Recruitment Plus Application Developer $124,200
CMS Content Management Web Developer $105,000
Senior Server/Storage Engineer $124,200
Total FY 2013 budget allocation $49,869,517
FY 2013 Administration & Finance division Budget Allocation Administration & Finance
regular Salaries
Contingent Salaries
Scholarships
Operating
Total
Administration & Finance VP 1,313,481 30,700 0 299,132 1,643,313
Mail Services 426,322 36,141 0 43,217 505,680
Facilities Management 8,986,925 228,280 0 9,636,952 18,852,157
Fiscal Planning & Services 5,689,562 62,105 0 413,857 6,165,524
Human Resources 1,718,074 20,866 0 234,403 1,973,343
Information Technology Services 9,857,534 356,250 0 4,043,942 14,257,726
Public Safety 5,725,724 146,798 0 599,252 6,471,774
Total 33,717,622 881,140 0 15,270,755 49,869,517
The chart to the right details the formulation of the FY 2013 budget allocation for the Administration and Finance Division. It begins with the FY 2012 budget and shows how subsequent adjustments resulted in the FY 2013 allocation.
Funding for the shift of the FY 2012 new facilities operations from Central is also included.
In FY 2013, seven positions were approved. New base funding was provided for three of the staff positions are in the Office of Technology Services. Current resources were reallocated for the other four positions: Accounting Associate, Systems Developer, OHR Leave Coordinator and Account Clerk.
Resources were reallocated for the increased operational cost associated with the CS-HCH split, annual maintenance of hardware cost, contracts, PeopleSoft licenses and fees.
One-time funding, in the amount of $1,078,000 was allocated for the Content Management System (CMS) Content Management Web Redesign initiative, network connectivity to the Towson City Center, in-building radio reception for CLA, E-builder project management software and other campus safety equipment (Blue Light Stations, card swipe access, cameras, etc.).
education and general state-assisted resource allocation
AdMiniSTrATiOn & FinAnCE diviSiOn

2013 operating budget and plan
13
education and general state-assisted resource allocation
UnivErSiTY AdvAnCEMEnT diviSiOn $3,978,407
FY 2012 original budget allocation $7,650,910
Department shift to Academic Affairs - UG & Grad Marketing $-921,868
Department shift from Central - Design Center $1,401,135
University Marketing shift to Executive $-4,164,299
Exempt pay scale adjustment funding $12,529
Total FY 2013 budget allocation $3,978,407
FY 2013 University Advancement division Budget Allocation University Advancement
regular Salaries
Contingent Salaries
Scholarships
Operating
Total
Development & Alumni 2,413,992 7,200 0 637,000 3,058,192
University Advancement 689,072 5,000 0 226,143 920,215
Total 3,103,064 12,200 0 863,143 3,978,407
The chart to the right details the formulation of the FY 2013 budget allocation for the University Advancement Division. It begins with the FY 2012 budget and shows how subsequent adjustments resulted in the FY 2013 allocation. The adjustments include funding associated with the new exempt pay scale.
Funding for the shift of Undergraduate and Graduate Marketing departments to Academic Affairs, University Marketing subdivi-sion to Executive and the University Design Center from Central is also included.
UnivErSiTY AdvAnCEMEnT diviSiOn
FinAnCiAl Aid $27,378,734
FY 2012 original budget allocation $27,229,086
IG scholarship increase funding $149,648
Total FY 2013 budget allocation $27,378,734
FY 2013 Financial Aid Budget Allocation Financial Aid
regular Salaries
Contingent Salaries
Scholarships
Operating
Total
Diversity Grants 0 0 811,091 0 811,091
Financial Aid Students - Department Supported 0 0 1,944 0 1,944
Financial Aid Students - Restricted 0 0 130,000 0 130,000
Financial Aid Students - Tuition Supported Aid 0 0 24,151,531 0 24,151,531
Financial Aid Students - Waivers 817,338 0 1,466,830 0 2,284,168
Total 817,338 0 26,561,396 0 27,378,734
The chart to the right details the formulation of the FY 2013 budget allocation for the Financial Aid Division. It begins with the FY 2012 budget and shows how subsequent adjustments resulted in the FY 2013 allocation. The adjustment includes an increase in funding for institutional grant scholarships.
FinAnCiAl Aid
2013 operating budget and plan
14
education and general state-assisted resource allocation
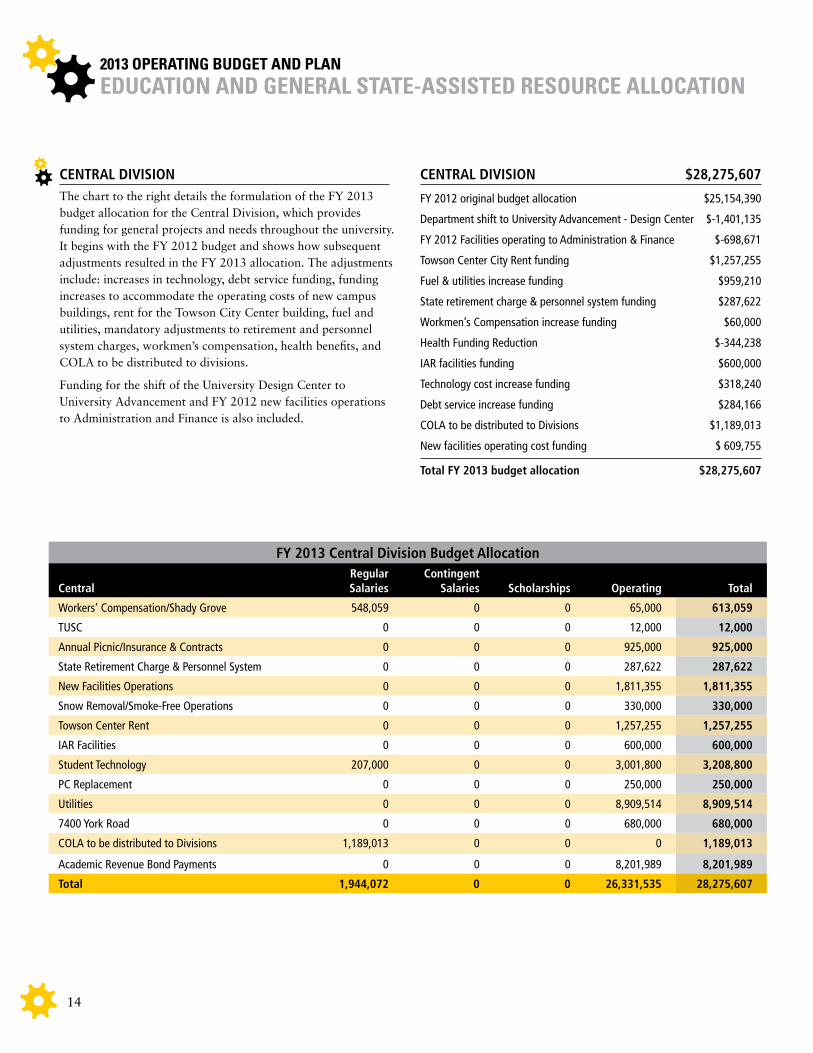
CEnTrAl diviSiOn $28,275,607
FY 2012 original budget allocation $25,154,390
Department shift to University Advancement - Design Center $-1,401,135
FY 2012 Facilities operating to Administration & Finance $-698,671
Towson Center City Rent funding $1,257,255
Fuel & utilities increase funding $959,210
State retirement charge & personnel system funding $287,622
Workmen’s Compensation increase funding $60,000
Health Funding Reduction $-344,238
IAR facilities funding $600,000
Technology cost increase funding $318,240
Debt service increase funding $284,166
COLA to be distributed to Divisions $1,189,013
New facilities operating cost funding $ 609,755
Total FY 2013 budget allocation $28,275,607
FY 2013 Central division Budget Allocation Central
regular Salaries
Contingent Salaries
Scholarships
Operating
Total
Workers’ Compensation/Shady Grove 548,059 0 0 65,000 613,059
TUSC 0 0 0 12,000 12,000
Annual Picnic/Insurance & Contracts 0 0 0 925,000 925,000
State Retirement Charge & Personnel System 0 0 0 287,622 287,622
New Facilities Operations 0 0 0 1,811,355 1,811,355
Snow Removal/Smoke-Free Operations 0 0 0 330,000 330,000
Towson Center Rent 0 0 0 1,257,255 1,257,255
IAR Facilities 0 0 0 600,000 600,000
Student Technology 207,000 0 0 3,001,800 3,208,800
PC Replacement 0 0 0 250,000 250,000
Utilities 0 0 0 8,909,514 8,909,514
7400 York Road 0 0 0 680,000 680,000
COLA to be distributed to Divisions 1,189,013 0 0 0 1,189,013
Academic Revenue Bond Payments 0 0 0 8,201,989 8,201,989
Total 1,944,072 0 0 26,331,535 28,275,607
The chart to the right details the formulation of the FY 2013 budget allocation for the Central Division, which provides funding for general projects and needs throughout the university. It begins with the FY 2012 budget and shows how subsequent adjustments resulted in the FY 2013 allocation. The adjustments include: increases in technology, debt service funding, funding increases to accommodate the operating costs of new campus buildings, rent for the Towson City Center building, fuel and utilities, mandatory adjustments to retirement and personnel system charges, workmen’s compensation, health benefits, and COLA to be distributed to divisions.
Funding for the shift of the University Design Center to University Advancement and FY 2012 new facilities operations to Administration and Finance is also included.
CEnTrAl diviSiOn

2013 operating budget and plan
15
UnivErSiTY COnTingEnCY $2,000,000
FY 2012 original budget allocation $4,628,425
Reduce contingency $-2,628,425
Total FY 2013 budget allocation $2,000,000
FY 2013 University Contingency Budget Allocation University Contingency reserve
regular Salaries
Contingent Salaries
Scholarships
Operating
Total
Total 0 0 0 2,000,000 2,000,000
TUrnOvEr TArgET ($3,000,000)
The turnover target comes from anticipated position vacancies and allows $3,000,000 to be budgeted on the operating side for the university.
FY 2013 Turnover Budget Allocation Turnover Target
regular Salaries
Contingent Salaries
Scholarships
Operating
Total
Total 0 0 0 -3,000,000 -3,000,000
The chart to the right details the formulation of the FY 2013 budget allocation for the university’s contingency, which provides a reserve of funds for unplanned expenses and potential future reductions to state-assisted funds. The table begins with the FY 2012 budget and shows how subsequent adjustments resulted in the FY 2013 allocation. The adjustment includes a reduction of the contingency to have additional funding available to the divisions.
education and general state-assisted resource allocation
UnivErSiTY COnTingEnCY
2013 operating budget and plan
16
Towson University’s FY 2013 Self-Support Budget
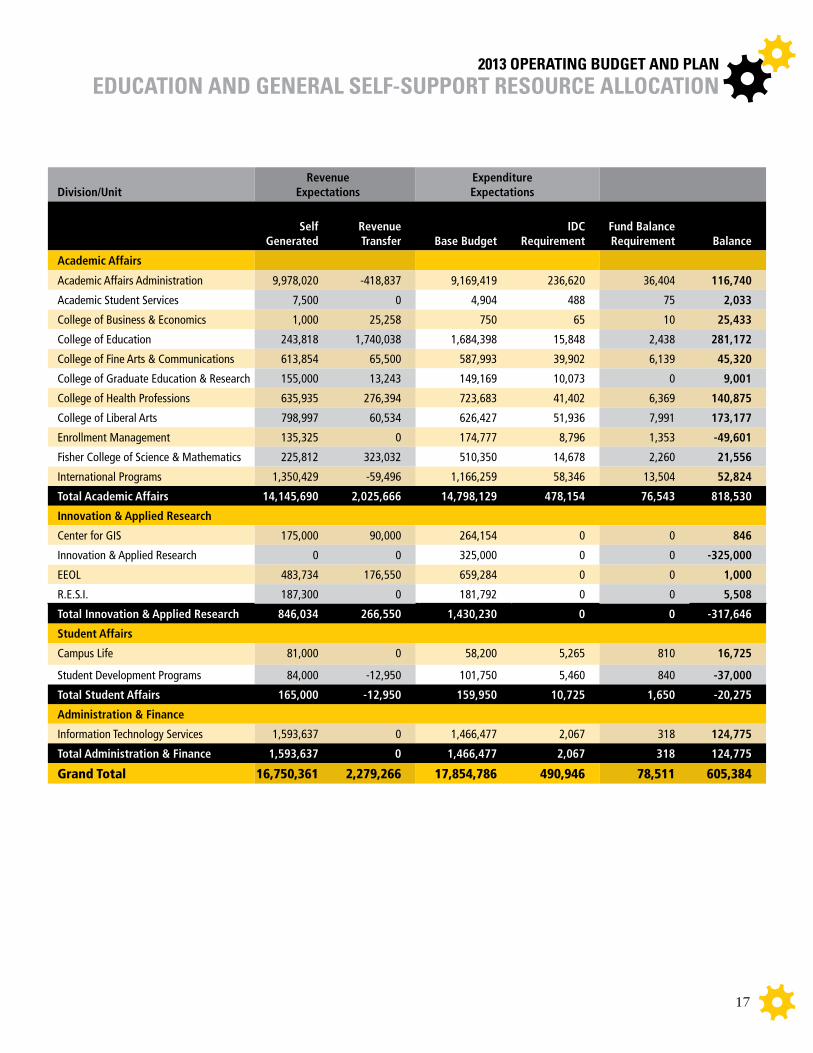
Self-support operations encompass revenues that are related to the conduct of instruction, research and public service, as well as revenues of activities that exist to provide instructional and laboratory experience for students but incidentally create goods and services that may be sold to students, faculty, staff and the general public. These operations include areas like the Regional Economic Studies Institute (RESI), summer sessions and minimester, which are not funded using regular academic year tuition and fees, but rather support themselves by generating their own revenue.
Self-supported operations contribute 1.0% of their annual revenues to the university’s fund balance account. Residual funds beyond this 1.0% contribution are available to support the respective area’s operations and can be budgeted in the current year. Areas may also be allowed to access their accumulated fund balances if the use of those funds does not negatively impact compliance with the USM directive. The university does have a limited ability to authorize the use of prior year fund balances, but expenditures must be coordinated with the University Budget Office before they are made. Upon receiving a request to use prior year fund balance resources, the University Budget Office will assess its impact on the total fund balance and work with the division to craft a financial plan that gives flexibility to the requesting area while maintaining compliance with the USM directive.
An overhead assessment of $3,517,816 is applied to summer session and minimester revenues, which is an increase of $489,900 over FY 2012 actual overhead assessments. IAR is exempt for the fund balance requirement and indirect cost assessment for FY 2013. All other self-supported departments, including closed Towson Learning Network (TLN) courses, are assessed a 6.5% indirect cost assessment based on self-generated revenues. The indirect cost assessments generate a revenue stream that supplements state-assisted functions to the university. Self-supported departments must either spend within the plans submitted or the revenues generated – whichever is the least amount. Revisions to these plans must be documented and submitted to the University Budget Office via the Divisional Budget Officer. Revisions should be presented on the E&G Budget Amendment form located on the University Budget Office Website.
education and general self-support resource allocation
2013 operating budget and plan
17
education and general self-support resource allocation
division/Unit
revenue Expectations
Expenditure Expectations
Self
generated
revenue Transfer
Base Budget
idC
requirement
Fund Balance requirement
Balance
Academic Affairs
Academic Affairs Administration 9,978,020 -418,837 9,169,419 236,620 36,404 116,740
Academic Student Services 7,500 0 4,904 488 75 2,033
College of Business & Economics 1,000 25,258 750 65 10 25,433
College of Education 243,818 1,740,038 1,684,398 15,848 2,438 281,172
College of Fine Arts & Communications 613,854 65,500 587,993 39,902 6,139 45,320
College of Graduate Education & Research 155,000 13,243 149,169 10,073 0 9,001
College of Health Professions 635,935 276,394 723,683 41,402 6,369 140,875
College of Liberal Arts 798,997 60,534 626,427 51,936 7,991 173,177
Enrollment Management 135,325 0 174,777 8,796 1,353 -49,601
Fisher College of Science & Mathematics 225,812 323,032 510,350 14,678 2,260 21,556
International Programs 1,350,429 -59,496 1,166,259 58,346 13,504 52,824
Total Academic Affairs 14,145,690 2,025,666 14,798,129 478,154 76,543 818,530
innovation & Applied research
Center for GIS 175,000 90,000 264,154 0 0 846
Innovation & Applied Research 0 0 325,000 0 0 -325,000
EEOL 483,734 176,550 659,284 0 0 1,000
R.E.S.I. 187,300 0 181,792 0 0 5,508
Total innovation & Applied research 846,034 266,550 1,430,230 0 0 -317,646
Student Affairs
Campus Life 81,000 0 58,200 5,265 810 16,725
Student Development Programs 84,000 -12,950 101,750 5,460 840 -37,000
Total Student Affairs 165,000 -12,950 159,950 10,725 1,650 -20,275
Administration & Finance
Information Technology Services 1,593,637 0 1,466,477 2,067 318 124,775
Total Administration & Finance 1,593,637 0 1,466,477 2,067 318 124,775
Grand Total 16,750,361 2,279,266 17,854,786 490,946 78,511 605,384
2013 operating budget and plan
18
education and general self-support resource allocation
FY 2013 Academic Affairs division Budget Allocation Academic Affairs
Self generated
revenue
regular Salaries
Contingent
Salaries
Scholarships
Operating
Total
Expenses
Academic Affairs Administration 9,522,779 0 9,021,265 28,000 356,774 9,406,039
Academic Student Services 7,425 0 0 0 5,392 5,392
College of Business & Economics 26,248 0 0 0 815 815
College of Education 1,981,418 290,363 1,015,781 51,124 342,978 1,700,246
College of Fine Arts & Communications 673,215 92,060 261,647 0 274,188 627,895
College of Graduate Education & Research 168,243 41,735 12,626 0 104,881 159,242
College of Health Professions 905,960 174,929 274,965 45,628 269,563 765,085
College of Liberal Arts 851,540 210,246 217,007 3,888 247,222 678,363
Enrollment Management 133,972 90,238 0 0 93,335 183,573
Fisher College of Science & Mathematics 546,584 0 137,290 27,525 360,213 525,028
International Programs 1,277,429 252,541 200,731 0 771,333 1,224,605
Total 16,094,813 1,152,112 11,141,312 156,165 2,826,694 15,276,283
Operating Surplus/-deficit (revenue-Expenses)
818,530
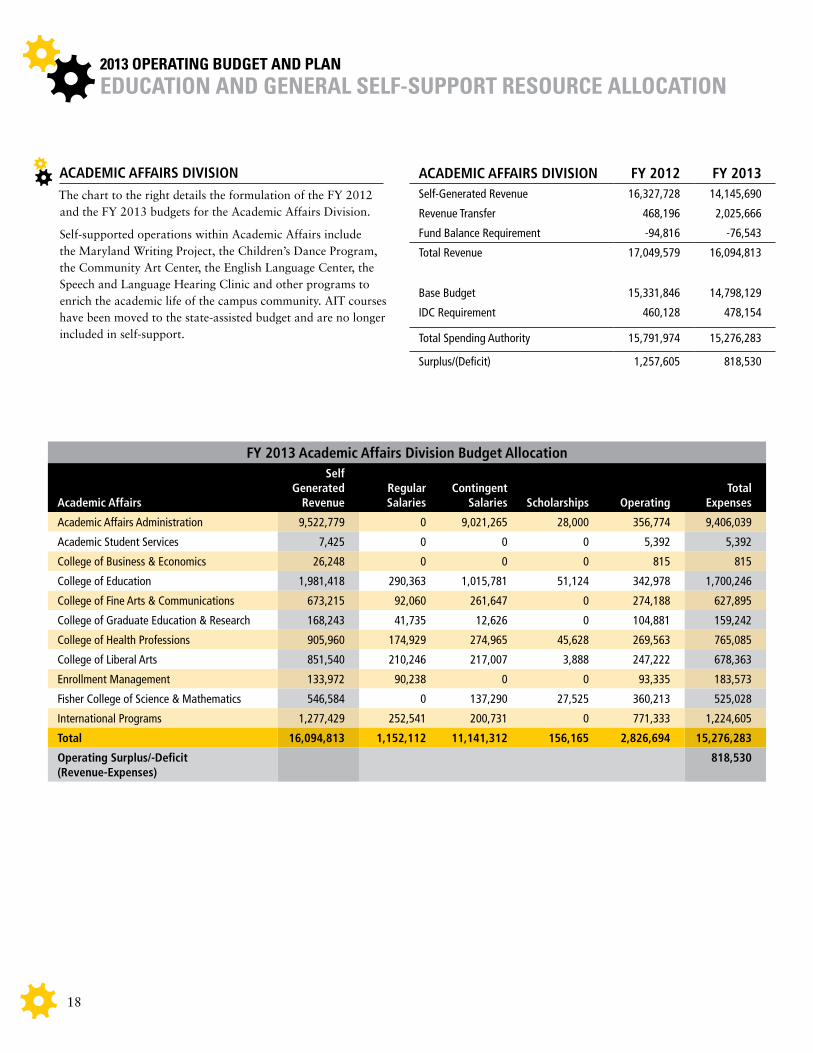
ACAdEMiC AFFAirS diviSiOn FY 2012 FY 2013Self-Generated Revenue 16,327,728 14,145,690
Revenue Transfer 468,196 2,025,666
Fund Balance Requirement -94,816 -76,543
Total Revenue 17,049,579 16,094,813
Base Budget 15,331,846 14,798,129
IDC Requirement 460,128 478,154
Total Spending Authority 15,791,974 15,276,283
Surplus/(Deficit) 1,257,605 818,530
The chart to the right details the formulation of the FY 2012 and the FY 2013 budgets for the Academic Affairs Division.
Self-supported operations within Academic Affairs include the Maryland Writing Project, the Children’s Dance Program, the Community Art Center, the English Language Center, the Speech and Language Hearing Clinic and other programs to enrich the academic life of the campus community. AIT courses have been moved to the state-assisted budget and are no longer included in self-support.
ACAdEMiC AFFAirS diviSiOn

2013 operating budget and plan
19
FY 2013 innovation and Applied research division Budget Allocation innovation & Applied research
Self generated
revenue
regular Salaries
Contingent
Salaries
Scholarships
Operating
Total
Expenses
Center for GIS 265,000 94,535 716,831 4,212 -551,424 264,154
Innovation & Applied Research 0 50,014 21,073 0 253,913 325,000
EEOL 660,284 92,695 269,355 26,958 270,276 659,284
R.E.S.I. 187,300 148,892 1,297,337 0 -1,264,437 181,792
Total 1,112,584 386,136 2,304,596 31,170 -1,291,672 1,430,230
Operating Surplus/-deficit (revenue-Expenses)
-317,646
innOvATiOn & AppliEd rESEArCh
FY 2012
FY 2013
Self-Generated Revenue 1,182,137 846,034
Revenue Transfer 238,000 266,550
Fund Balance Requirement 0 0
Total Revenue 1,420,137 1,112,584
Base Budget 1,861,562 1,430,230
IDC Requirement 0 0
Total Spending Authority 1,861,562 1,430,230
Surplus/(Deficit) -441,425 -317,646
The chart to the right details the formulation of the FY 2012 and FY 2013 budgets for the Innovation and Applied Research Division.
Self-supported operations within Innovation and Applied Research include the Center for Geographic Information Systems (CGIS), Extended Education and Online Learning (EEOL) and the Regional Economic Studies institute (RESI). The Division was approved to use up to $317,646 of prior year funding during FY 2013.
education and general self-support resource allocation
innOvATiOn & AppliEd rESEArCh
2013 operating budget and plan
20
education and general self-support resource allocation
FY 2013 Student Affairs division Budget Allocation Student Affairs
Self generated
revenue
regular Salaries
Contingent
Salaries
Scholarships
Operating
Total
Expenses
Campus Life 80,190 0 51,600 0 11,865 63,465
Student Development Programs 70,210 0 8,000 8,424 90,786 107,210
Total 150,400 0 59,600 8,424 102,651 170,675
Operating Surplus/-deficit (revenue-Expenses)
-20,275
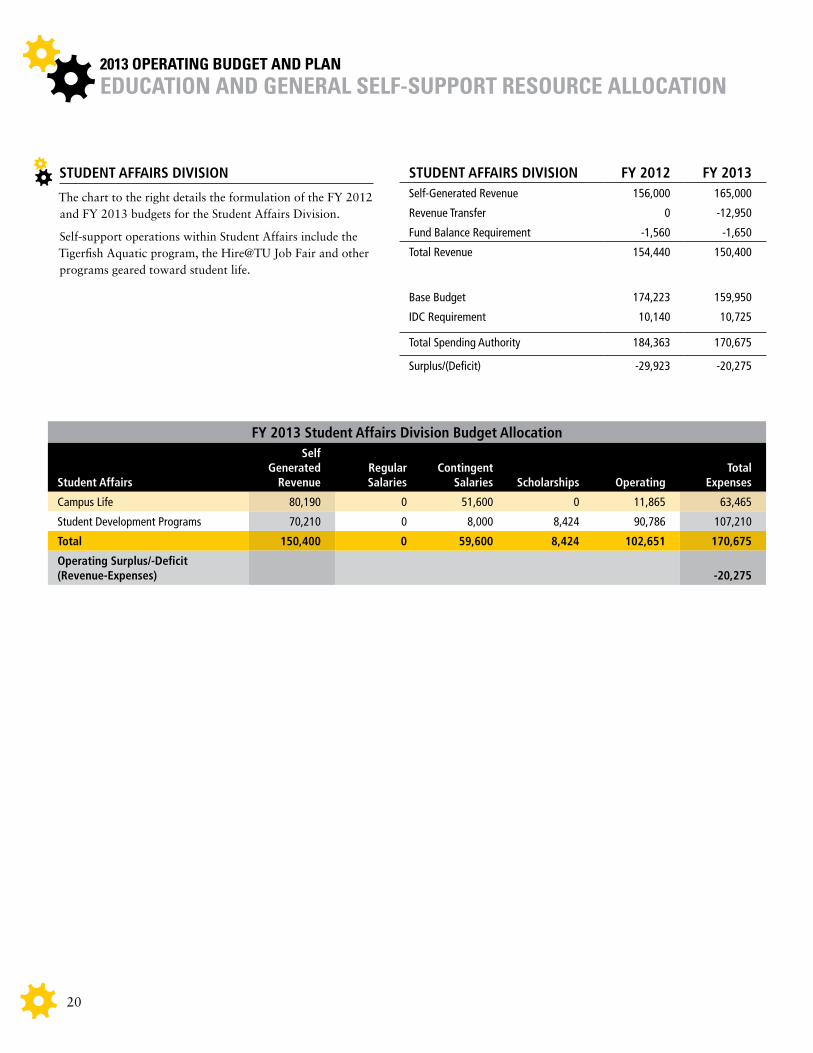
STUdEnT AFFAirS diviSiOn FY 2012 FY 2013Self-Generated Revenue 156,000 165,000
Revenue Transfer 0 -12,950
Fund Balance Requirement -1,560 -1,650
Total Revenue 154,440 150,400
Base Budget 174,223 159,950
IDC Requirement 10,140 10,725
Total Spending Authority 184,363 170,675
Surplus/(Deficit) -29,923 -20,275
The chart to the right details the formulation of the FY 2012 and FY 2013 budgets for the Student Affairs Division.
Self-support operations within Student Affairs include the Tigerfish Aquatic program, the Hire@TU Job Fair and other programs geared toward student life.
STUdEnT AFFAirS diviSiOn

2013 operating budget and plan
21
FY 2013 Administration & Finance division Budget Allocation Administration & Finance
Self generated
revenue
regular Salaries
Contingent
Salaries
Scholarships
Operating
Total
Expenses
Information Technology Services 1,593,319 611,938 0 0 856,606 1,468,544
Total 1,593,319 611,938 0 0 856,606 1,468,544
Operating Surplus/-deficit (revenue-Expenses)
124,775
The chart to the right details the formulation of the FY 2012 and FY 2013 budgets for the Administration and Finance Division, which is comprised of telecommunications.
AdMiniSTrATiOn & FinAnCE diviSiOn
FY 2012
FY 2013
Self-Generated Revenue 1,584,866 1,593,637
Revenue Transfer 0 0
Fund Balance Requirement -348 -318
Total Revenue 1,584,518 1,593,319
Base Budget 1,414,096 1,466,477
IDC Requirement 2,262 2,067
Total Spending Authority 1,416,358 1,468,544
Surplus/(Deficit) 168,160 124,775
education and general self-support resource allocation
AdMiniSTrATiOn & FinAnCE diviSiOn

2013 operating budget and plan
22
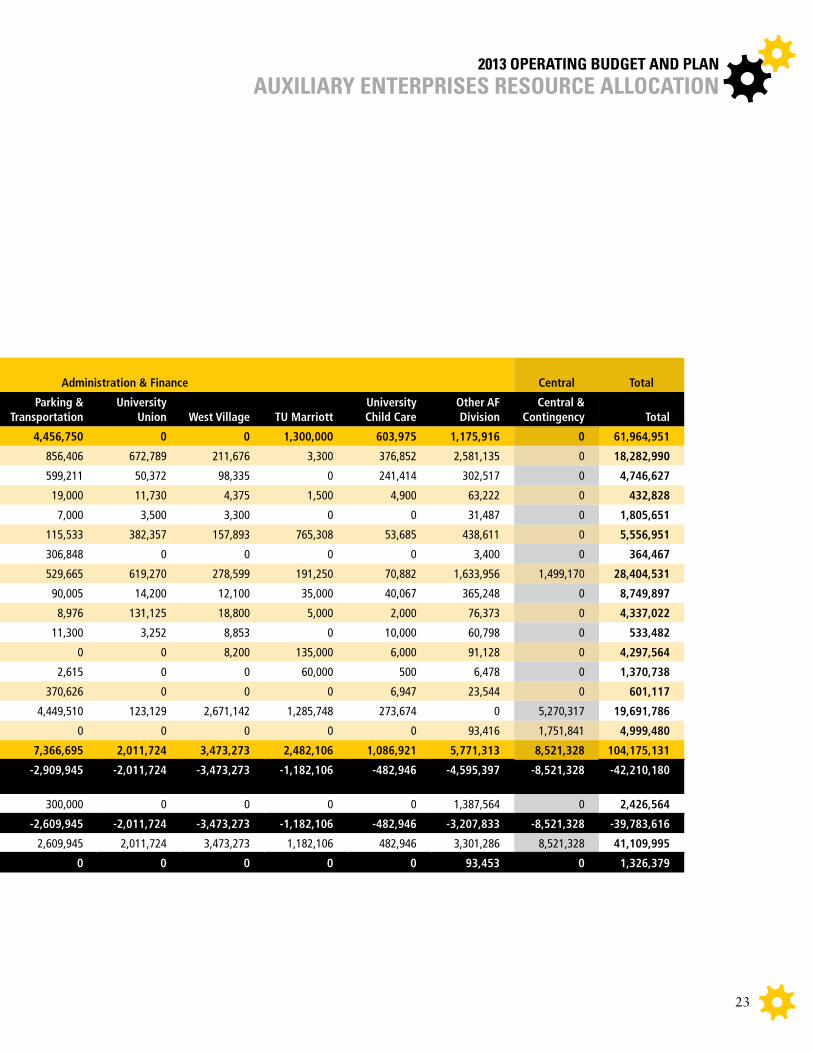
Towson University’s FY 2013 Auxiliary Budget
Towson University’s Auxiliary Enterprises are activities that furnish goods or services to the campus community and charge a fee directly related to – though not necessarily equal to – the cost of the goods or services. The estimated FY 2013 budget distribution for Auxiliary Enterprises is listed in the table below. The indirect cost assessment (IDC) for auxiliary departments is 6.5%. Departments that receive student fees are not assessed with this IDC; the assessment
only affects departments with solely self-generated revenue. It is the university’s intention to grow the IDC to 9.78% of the department’s revenue. Any savings from vacant auxiliary position attrition earnings are held centrally. Additional details on each division’s budget are listed on the following pages.
auXiliarY enterprises resource allocation
Athletics
Academic Affairs
Student Affairs
Administration & Finance
Central
Total
Athletics Marching Band
housing
Other SA division
University Store
dining
Events
parking & Transportation
University Union
West village
TU Marriott
University Child Care
Other AF division
Central & Contingency
Total
Self-generating revenue Budget 3,414,059 0 20,960,590 0 9,115,720 19,605,908 1,332,033 4,456,750 0 0 1,300,000 603,975 1,175,916 0 61,964,951
Obj 01 Regular Payroll 7,821,678 140,764 1,901,329 1,447,427 1,183,878 169,066 916,690 856,406 672,789 211,676 3,300 376,852 2,581,135 0 18,282,990
Obj 02 Contingent Payroll 1,326,547 52,450 871,849 603,279 241,482 7,500 351,671 599,211 50,372 98,335 0 241,414 302,517 0 4,746,627
Obj 03 Communications 202,048 400 57,400 21,033 29,020 3,700 14,500 19,000 11,730 4,375 1,500 4,900 63,222 0 432,828
Obj 04 Travel 1,641,289 7,000 44,500 49,475 8,500 2,500 7,100 7,000 3,500 3,300 0 0 31,487 0 1,805,651
Obj 06 Fuel & Utilities 0 0 2,870,238 64,514 68,705 260,737 379,370 115,533 382,357 157,893 765,308 53,685 438,611 0 5,556,951
Obj 07 Vehicles 9,219 0 2,500 1,000 1,000 32,000 8,500 306,848 0 0 0 0 3,400 0 364,467
Obj 08 Contractual Services 1,562,885 18,000 5,119,379 631,349 344,486 14,405,669 1,499,971 529,665 619,270 278,599 191,250 70,882 1,633,956 1,499,170 28,404,531
Obj 09 Supplies & Materials 909,908 122,594 225,968 213,906 6,598,763 50,238 71,900 90,005 14,200 12,100 35,000 40,067 365,248 0 8,749,897
Obj 10 Equipment Replacement 0 0 3,844,577 500 36,177 202,494 11,000 8,976 131,125 18,800 5,000 2,000 76,373 0 4,337,022
Obj 11 Equipment Additional 116,529 0 25,000 130,991 5,900 158,359 2,500 11,300 3,252 8,853 0 10,000 60,798 0 533,482
Obj 12 Grants & Contributions 3,821,244 14,000 80,066 141,926 0 0 0 0 0 8,200 135,000 6,000 91,128 0 4,297,564
Obj 13 Fixed Charges 189,995 0 1,031,700 69,100 2,500 2,050 5,800 2,615 0 0 60,000 500 6,478 0 1,370,738
Obj 14 Land & Structure 0 0 0 0 0 200,000 0 370,626 0 0 0 6,947 23,544 0 601,117
Debt Service Bond Payment 0 0 4,183,041 266,104 0 1,003,110 166,011 4,449,510 123,129 2,671,142 1,285,748 273,674 0 5,270,317 19,691,786
Internal IDC 668,774 0 612,043 0 599,022 1,274,384 0 0 0 0 0 0 93,416 1,751,841 4,999,480
Total Expenditure Budget 18,270,116 355,208 20,869,590 3,640,604 9,119,433 17,771,807 3,435,013 7,366,695 2,011,724 3,473,273 2,482,106 1,086,921 5,771,313 8,521,328 104,175,131
Operating Surplus/-deficit (revenue-Expenses)
-14,856,057 -355,208 91,000 -3,640,604 -3,713 1,834,101 -2,102,980 -2,909,945 -2,011,724 -3,473,273 -1,182,106 -482,946 -4,595,397 -8,521,328 -42,210,180
Transfer In/-Out 0 0 -91,000 0 100,000 0 730,000 300,000 0 0 0 0 1,387,564 0 2,426,564
Balance -14,856,057 -355,208 0 -3,640,604 96,287 1,834,101 -1,372,980 -2,609,945 -2,011,724 -3,473,273 -1,182,106 -482,946 -3,207,833 -8,521,328 -39,783,616
Student Fee Supplement 14,158,595 355,208 0 3,640,604 0 0 1,372,980 2,609,945 2,011,724 3,473,273 1,182,106 482,946 3,301,286 8,521,328 41,109,995
Fund Balance Target -697,462 0 0 0 96,287 1,834,101 0 0 0 0 0 0 93,453 0 1,326,379
2013 operating budget and plan
23
Athletics
Academic Affairs
Student Affairs
Administration & Finance
Central
Total
Athletics Marching Band
housing
Other SA division
University Store
dining
Events
parking & Transportation
University Union
West village
TU Marriott
University Child Care
Other AF division
Central & Contingency
Total
Self-generating revenue Budget 3,414,059 0 20,960,590 0 9,115,720 19,605,908 1,332,033 4,456,750 0 0 1,300,000 603,975 1,175,916 0 61,964,951
Obj 01 Regular Payroll 7,821,678 140,764 1,901,329 1,447,427 1,183,878 169,066 916,690 856,406 672,789 211,676 3,300 376,852 2,581,135 0 18,282,990
Obj 02 Contingent Payroll 1,326,547 52,450 871,849 603,279 241,482 7,500 351,671 599,211 50,372 98,335 0 241,414 302,517 0 4,746,627
Obj 03 Communications 202,048 400 57,400 21,033 29,020 3,700 14,500 19,000 11,730 4,375 1,500 4,900 63,222 0 432,828
Obj 04 Travel 1,641,289 7,000 44,500 49,475 8,500 2,500 7,100 7,000 3,500 3,300 0 0 31,487 0 1,805,651
Obj 06 Fuel & Utilities 0 0 2,870,238 64,514 68,705 260,737 379,370 115,533 382,357 157,893 765,308 53,685 438,611 0 5,556,951
Obj 07 Vehicles 9,219 0 2,500 1,000 1,000 32,000 8,500 306,848 0 0 0 0 3,400 0 364,467
Obj 08 Contractual Services 1,562,885 18,000 5,119,379 631,349 344,486 14,405,669 1,499,971 529,665 619,270 278,599 191,250 70,882 1,633,956 1,499,170 28,404,531
Obj 09 Supplies & Materials 909,908 122,594 225,968 213,906 6,598,763 50,238 71,900 90,005 14,200 12,100 35,000 40,067 365,248 0 8,749,897
Obj 10 Equipment Replacement 0 0 3,844,577 500 36,177 202,494 11,000 8,976 131,125 18,800 5,000 2,000 76,373 0 4,337,022
Obj 11 Equipment Additional 116,529 0 25,000 130,991 5,900 158,359 2,500 11,300 3,252 8,853 0 10,000 60,798 0 533,482
Obj 12 Grants & Contributions 3,821,244 14,000 80,066 141,926 0 0 0 0 0 8,200 135,000 6,000 91,128 0 4,297,564
Obj 13 Fixed Charges 189,995 0 1,031,700 69,100 2,500 2,050 5,800 2,615 0 0 60,000 500 6,478 0 1,370,738
Obj 14 Land & Structure 0 0 0 0 0 200,000 0 370,626 0 0 0 6,947 23,544 0 601,117
Debt Service Bond Payment 0 0 4,183,041 266,104 0 1,003,110 166,011 4,449,510 123,129 2,671,142 1,285,748 273,674 0 5,270,317 19,691,786
Internal IDC 668,774 0 612,043 0 599,022 1,274,384 0 0 0 0 0 0 93,416 1,751,841 4,999,480
Total Expenditure Budget 18,270,116 355,208 20,869,590 3,640,604 9,119,433 17,771,807 3,435,013 7,366,695 2,011,724 3,473,273 2,482,106 1,086,921 5,771,313 8,521,328 104,175,131
Operating Surplus/-deficit (revenue-Expenses)
-14,856,057 -355,208 91,000 -3,640,604 -3,713 1,834,101 -2,102,980 -2,909,945 -2,011,724 -3,473,273 -1,182,106 -482,946 -4,595,397 -8,521,328 -42,210,180
Transfer In/-Out 0 0 -91,000 0 100,000 0 730,000 300,000 0 0 0 0 1,387,564 0 2,426,564
Balance -14,856,057 -355,208 0 -3,640,604 96,287 1,834,101 -1,372,980 -2,609,945 -2,011,724 -3,473,273 -1,182,106 -482,946 -3,207,833 -8,521,328 -39,783,616
Student Fee Supplement 14,158,595 355,208 0 3,640,604 0 0 1,372,980 2,609,945 2,011,724 3,473,273 1,182,106 482,946 3,301,286 8,521,328 41,109,995
Fund Balance Target -697,462 0 0 0 96,287 1,834,101 0 0 0 0 0 0 93,453 0 1,326,379
auXiliarY enterprises resource allocation
2013 operating budget and plan
24
FY 2013 Athletic division Budget Allocation Athletics
Auxiliary Student Fee
revenue
Self-generated
revenue
regular Salaries
Contingent
Salaries
Scholarships
Operating
Total
Expense
Total 14,158,595 3,414,059 7,821,678 1,326,547 3,821,244 5,300,647 18,270,116
Operating Surplus/-deficit (revenue-Expenses)
-697,462
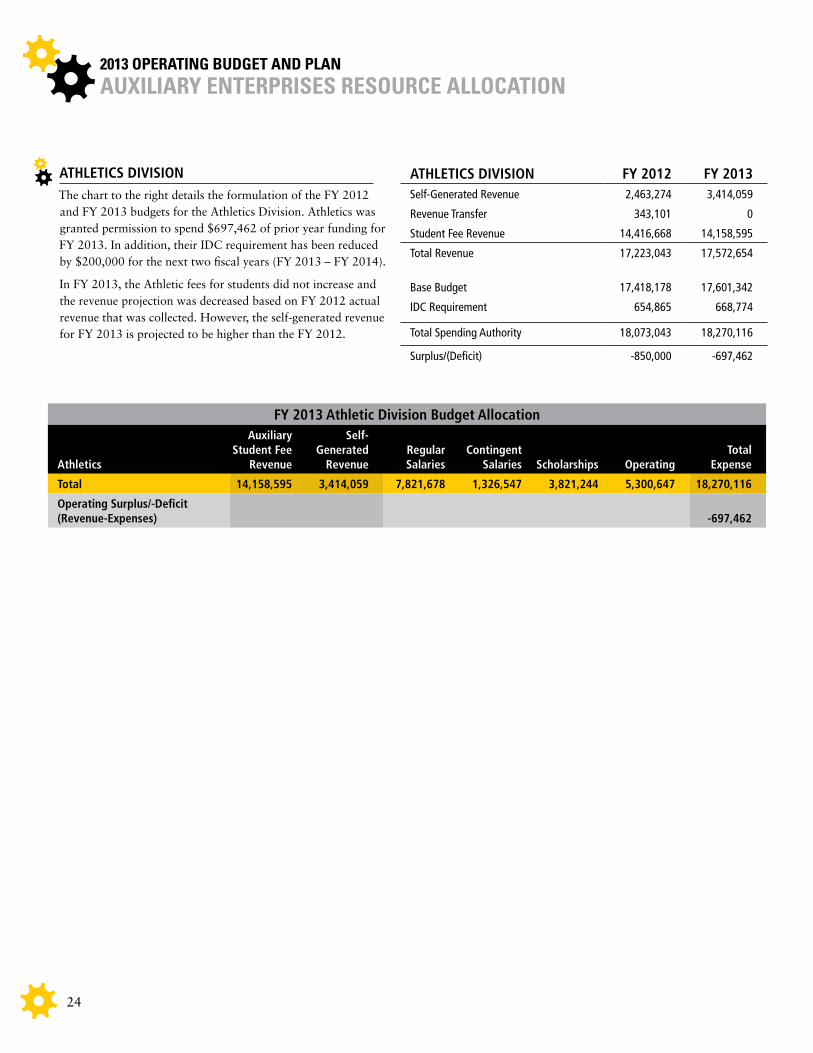
AThlETiCS diviSiOn FY 2012 FY 2013Self-Generated Revenue 2,463,274 3,414,059
Revenue Transfer 343,101 0
Student Fee Revenue 14,416,668 14,158,595
Total Revenue 17,223,043 17,572,654
Base Budget 17,418,178 17,601,342
IDC Requirement 654,865 668,774
Total Spending Authority 18,073,043 18,270,116
Surplus/(Deficit) -850,000 -697,462
The chart to the right details the formulation of the FY 2012 and FY 2013 budgets for the Athletics Division. Athletics was granted permission to spend $697,462 of prior year funding for FY 2013. In addition, their IDC requirement has been reduced by $200,000 for the next two fiscal years (FY 2013 – FY 2014).
In FY 2013, the Athletic fees for students did not increase and the revenue projection was decreased based on FY 2012 actual revenue that was collected. However, the self-generated revenue for FY 2013 is projected to be higher than the FY 2012.
auXiliarY enterprises resource allocation
AThlETiCS diviSiOn

2013 operating budget and plan
25
FY 2013 Academic Affairs division Budget Allocation Academic Affairs
Auxiliary Student Fee
revenue
Self-generated
revenue
regular Salaries
Contingent
Salaries
Scholarships
Operating
Total
Expense
College of Fine Arts & Communications 355,208 0 140,764 52,450 14,000 147,994 355,208
Total 355,208 0 140,764 52,450 14,000 147,994 355,208
Operating Surplus/-deficit (revenue-Expenses)
0
ACAdEMiC AFFAirS diviSiOn FY 2012 FY 2013Self-Generated Revenue 0 0
Revenue Transfer 0 0
Student Fee Revenue 334,740 355,208
Total Revenue 334,740 355,208
Base Budget 334,740 355,208
IDC Requirement 0 0
Total Spending Authority 334,740 355,208
Surplus/(Deficit) 0 0
The chart to the right details the formulation of the FY 2012 and FY 2013 budgets for the Academic Affairs Division. The Auxiliary Enterprise with Academic Affairs is the TU Marching Band.
Additional Auxiliary fees were provided to increase the FTE from 0.5 to 1.0 for Administrative Assistant position.
auXiliarY enterprises resource allocation
ACAdEMiC AFFAirS diviSiOn
2013 operating budget and plan
26
auXiliarY enterprises resource allocation
FY 2013 Student Affairs division Budget Allocation Student Affairs
Auxiliary Student Fee
revenue
Self-generated
revenue
regular Salaries
Contingent
Salaries
Scholarships
Operating
Total
Expense
Campus Life 3,005,492 0 1,247,888 573,279 116,654 1,067,671 3,005,492
Housing & Residence Life 0 20,869,590 1,901,329 871,849 80,066 18,016,346 20,869,590
Office of Diversity 179,323 0 0 20,000 25,272 134,051 179,323
Student Affairs Administration 215,025 0 0 10,000 0 205,025 215,025
Student Development Programs 240,764 0 199,539 0 0 41,225 240,764
Total 3,640,604 20,869,590 3,348,756 1,475,128 221,992 19,464,318 24,510,194
Operating Surplus/-deficit (revenue-Expenses)
0
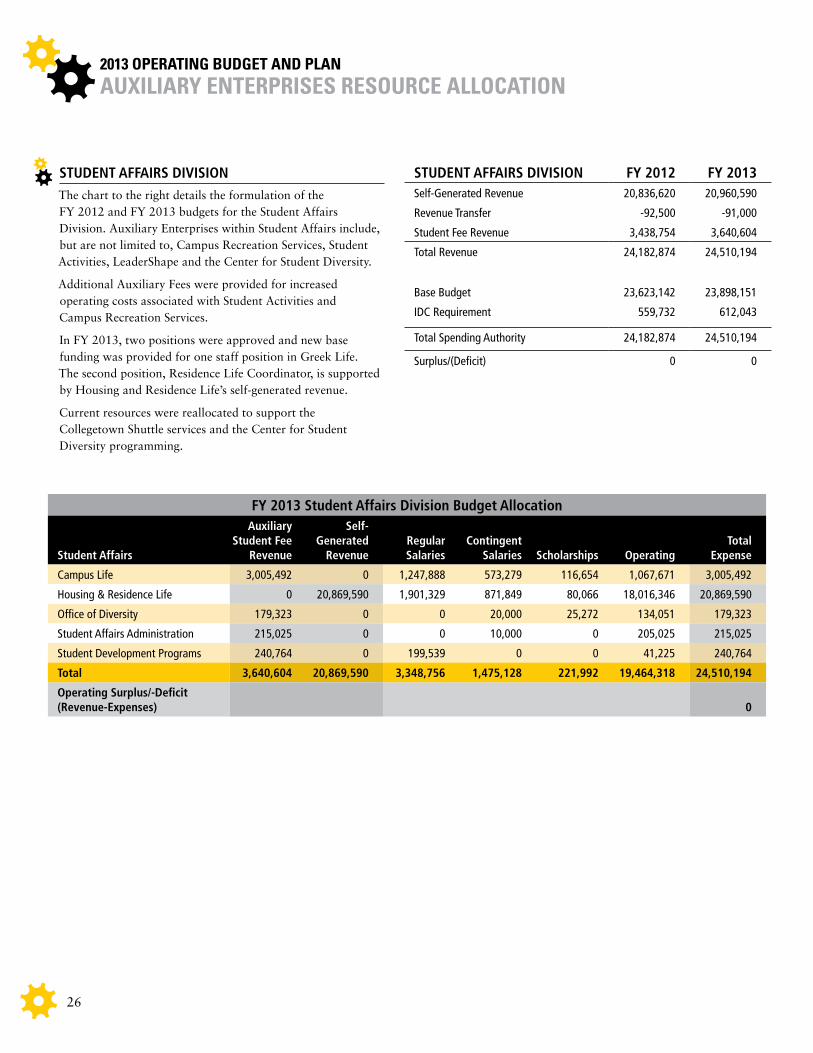
STUdEnT AFFAirS diviSiOn FY 2012 FY 2013Self-Generated Revenue 20,836,620 20,960,590
Revenue Transfer -92,500 -91,000
Student Fee Revenue 3,438,754 3,640,604
Total Revenue 24,182,874 24,510,194
Base Budget 23,623,142 23,898,151
IDC Requirement 559,732 612,043
Total Spending Authority 24,182,874 24,510,194
Surplus/(Deficit) 0 0
The chart to the right details the formulation of the FY 2012 and FY 2013 budgets for the Student Affairs Division. Auxiliary Enterprises within Student Affairs include, but are not limited to, Campus Recreation Services, Student Activities, LeaderShape and the Center for Student Diversity.
Additional Auxiliary Fees were provided for increased operating costs associated with Student Activities and Campus Recreation Services.
In FY 2013, two positions were approved and new base funding was provided for one staff position in Greek Life. The second position, Residence Life Coordinator, is supported by Housing and Residence Life’s self-generated revenue.
Current resources were reallocated to support the Collegetown Shuttle services and the Center for Student Diversity programming.
STUdEnT AFFAirS diviSiOn
2013 operating budget and plan
27
auXiliarY enterprises resource allocation
FY 2013 Administration & Finance division Budget Allocation Administration & Finance
Auxiliary Student Fee
revenue
Self-generated
revenue
regular Salaries
Contingent
Salaries
Scholarships
Operating
Total
Expense
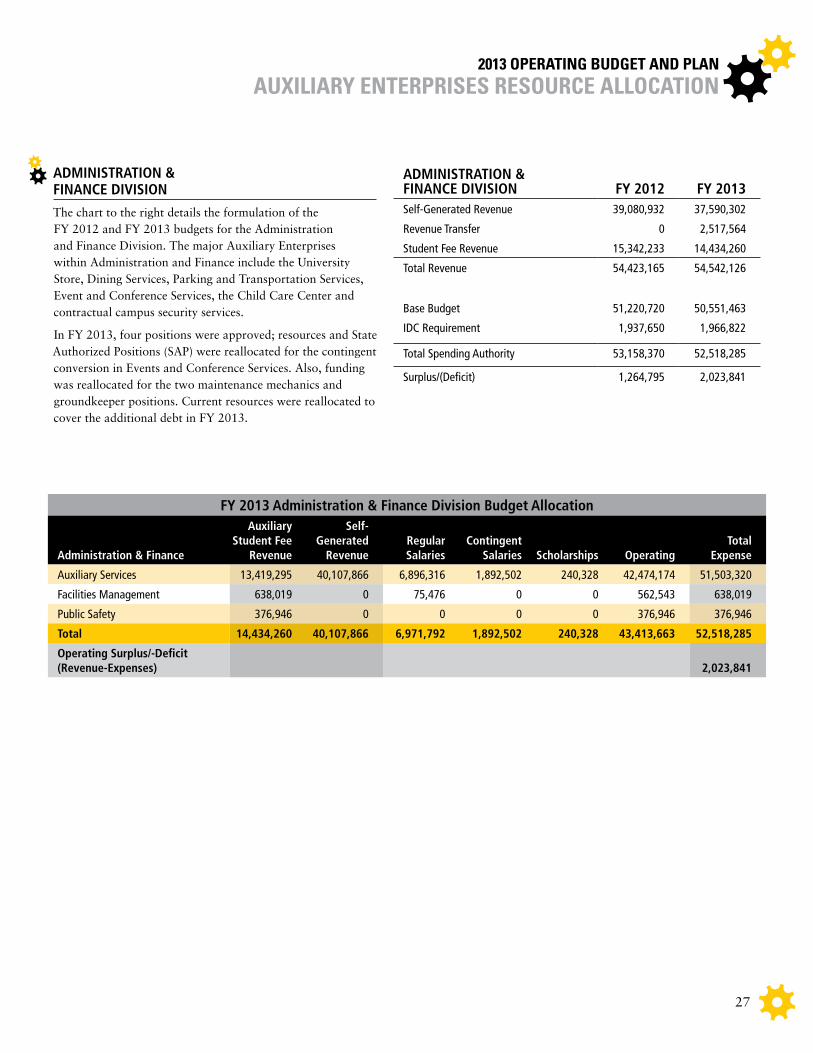
Auxiliary Services 13,419,295 40,107,866 6,896,316 1,892,502 240,328 42,474,174 51,503,320
Facilities Management 638,019 0 75,476 0 0 562,543 638,019
Public Safety 376,946 0 0 0 0 376,946 376,946
Total 14,434,260 40,107,866 6,971,792 1,892,502 240,328 43,413,663 52,518,285
Operating Surplus/-deficit (revenue-Expenses)
2,023,841
AdMiniSTrATiOn & FinAnCE diviSiOn
FY 2012
FY 2013
Self-Generated Revenue 39,080,932 37,590,302
Revenue Transfer 0 2,517,564
Student Fee Revenue 15,342,233 14,434,260
Total Revenue 54,423,165 54,542,126
Base Budget 51,220,720 50,551,463
IDC Requirement 1,937,650 1,966,822
Total Spending Authority 53,158,370 52,518,285
Surplus/(Deficit) 1,264,795 2,023,841
The chart to the right details the formulation of the FY 2012 and FY 2013 budgets for the Administration and Finance Division. The major Auxiliary Enterprises within Administration and Finance include the University Store, Dining Services, Parking and Transportation Services, Event and Conference Services, the Child Care Center and contractual campus security services.
In FY 2013, four positions were approved; resources and State Authorized Positions (SAP) were reallocated for the contingent conversion in Events and Conference Services. Also, funding was reallocated for the two maintenance mechanics and groundkeeper positions. Current resources were reallocated to cover the additional debt in FY 2013.
AdMiniSTrATiOn & FinAnCE diviSiOn
2013 operating budget and plan
28
auXiliarY enterprises resource allocation
FY 2013 University Advancement division Budget Allocation University Advancement
Auxiliary Student Fee
revenue
Self-generated
revenue
regular Salaries
Contingent
Salaries
Scholarships
Operating
Total
Expense
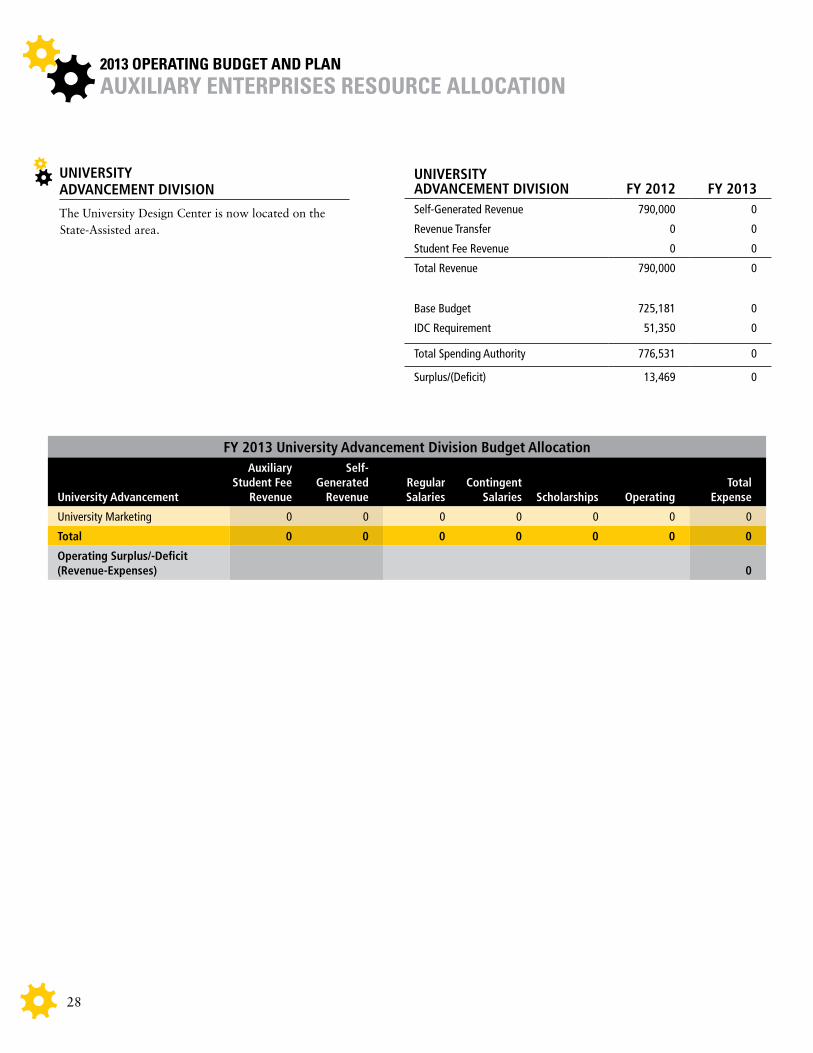
University Marketing 0 0 0 0 0 0 0
Total 0 0 0 0 0 0 0
Operating Surplus/-deficit (revenue-Expenses)
0
UnivErSiTY AdvAnCEMEnT diviSiOn
FY 2012
FY 2013
Self-Generated Revenue 790,000 0
Revenue Transfer 0 0
Student Fee Revenue 0 0
Total Revenue 790,000 0
Base Budget 725,181 0
IDC Requirement 51,350 0
Total Spending Authority 776,531 0
Surplus/(Deficit) 13,469 0
The University Design Center is now located on the State-Assisted area.
UnivErSiTY AdvAnCEMEnT diviSiOn

2013 operating budget and plan
29
auXiliarY enterprises resource allocation
CEnTrAl diviSiOn FY 2012 FY 2013Self-Generated Revenue 0 0
Revenue Transfer 0 0
Student Fee Revenue 3,923,273 7,063,158
Total Revenue 3,923,273 7,063,158
Base Budget 2,295,738 5,311,317
IDC Requirement 1,627,535 1,751,841
Total Spending Authority 3,923,273 7,063,158
Surplus/(Deficit) 0 0
The chart to the right details the formulation of the FY 2012 and FY 2013 budgets for the university’s Central Division, which provides funding for general campus needs. Auxiliary Enterprises within the Central Division are comprised of the IDC and auxiliary debt.
Additional Auxiliary fees were provided for the increased debt of Burdick Hall and the Tiger Area.
FY 2013 Central division Budget Allocation Central
Auxiliary Student Fee
revenue
Self-generated
revenue
regular Salaries
Contingent
Salaries
Scholarships
Operating
Total
Expense
Burdick Debt 1,082,903 0 0 0 0 1,082,903 1,082,903
Central Fund Auxiliary 1,751,841 0 0 0 0 1,751,841 1,751,841
Complex 4,228,414 0 0 0 0 4,228,414 4,228,414
Total 7,063,158 0 0 0 0 7,063,158 7,063,158
Operating Surplus/-Deficit (Revenue-Expenses)
0
CEnTrAl diviSiOn
2013 operating budget and plan
30
auXiliarY enterprises resource allocation
FY 2013 Auxiliary Contingency Budget Allocation Auxiliary Contingency
Auxiliary Student Fee
revenue
Self-generated
revenue
regular Salaries
Contingent
Salaries
Scholarships
Operating
Total
Expense
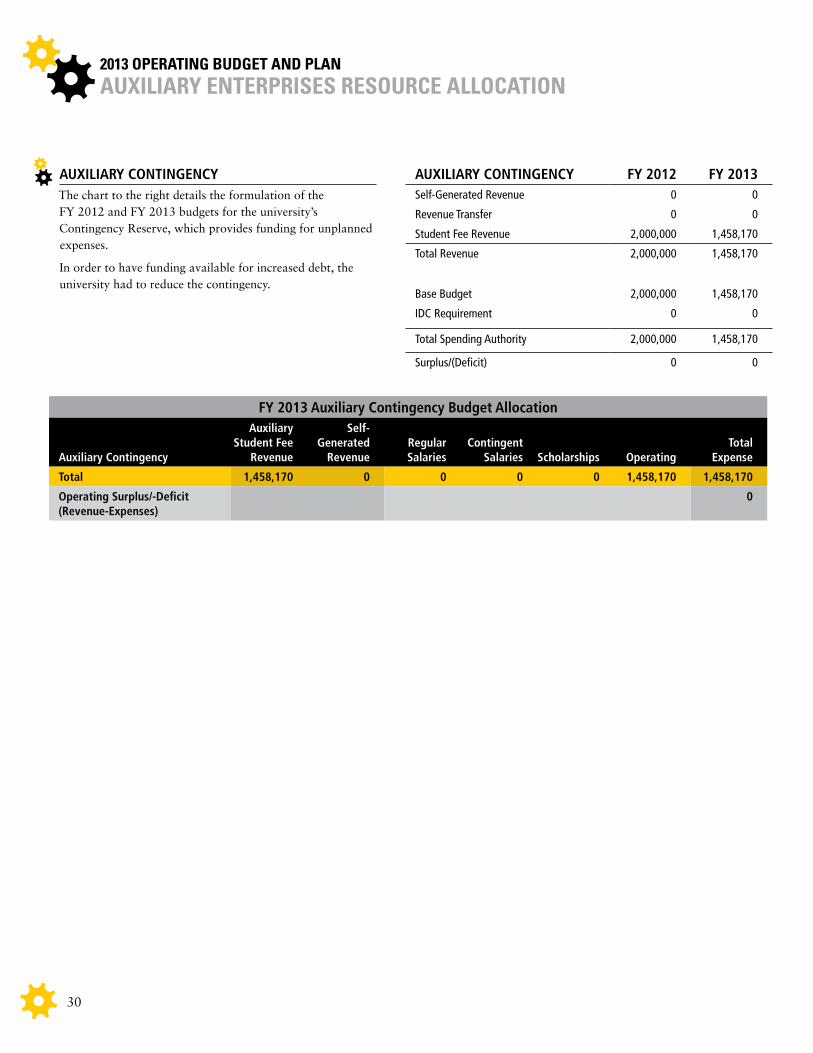
Total 1,458,170 0 0 0 0 1,458,170 1,458,170
Operating Surplus/-deficit (revenue-Expenses)
0
AUxiliArY COnTingEnCY FY 2012 FY 2013Self-Generated Revenue 0 0
Revenue Transfer 0 0
Student Fee Revenue 2,000,000 1,458,170
Total Revenue 2,000,000 1,458,170
Base Budget 2,000,000 1,458,170
IDC Requirement 0 0
Total Spending Authority 2,000,000 1,458,170
Surplus/(Deficit) 0 0
The chart to the right details the formulation of the FY 2012 and FY 2013 budgets for the university’s Contingency Reserve, which provides funding for unplanned expenses.
In order to have funding available for increased debt, the university had to reduce the contingency.
AUxiliArY COnTingEnCY
2013 operating budget and plan
31
Towson University’s FY 2013 restricted Budget
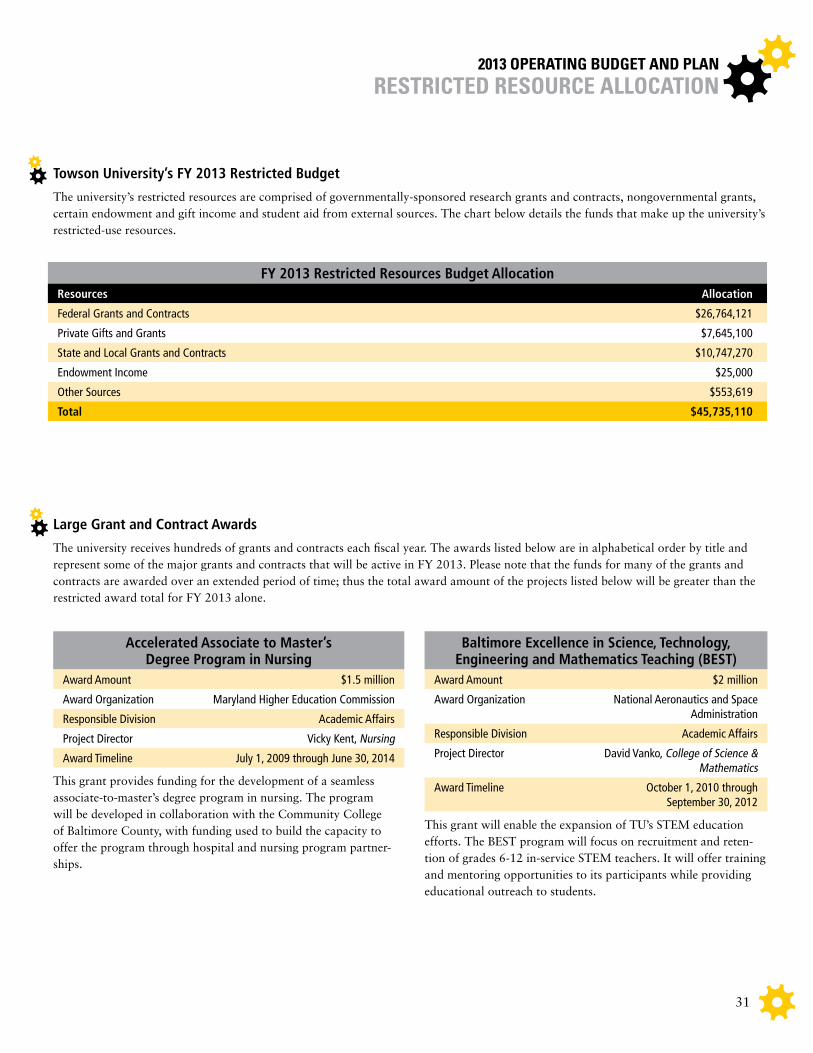
The university’s restricted resources are comprised of governmentally-sponsored research grants and contracts, nongovernmental grants, certain endowment and gift income and student aid from external sources. The chart below details the funds that make up the university’s restricted-use resources.
FY 2013 restricted resources Budget Allocationresources Allocation
Federal Grants and Contracts $26,764,121
Private Gifts and Grants $7,645,100
State and Local Grants and Contracts $10,747,270
Endowment Income $25,000
Other Sources $553,619
Total $45,735,110
Accelerated Associate to Master’s degree program in nursing
Award Amount $1.5 million
Award Organization Maryland Higher Education Commission
Responsible Division Academic Affairs
Project Director Vicky Kent, Nursing
Award Timeline July 1, 2009 through June 30, 2014
This grant provides funding for the development of a seamless associate-to-master’s degree program in nursing. The program will be developed in collaboration with the Community College of Baltimore County, with funding used to build the capacity to offer the program through hospital and nursing program partner-ships.
Baltimore Excellence in Science, Technology, Engineering and Mathematics Teaching (BEST)
Award Amount $2 million
Award Organization National Aeronautics and Space Administration
Responsible Division Academic Affairs
Project Director David Vanko, College of Science & Mathematics
Award Timeline October 1, 2010 through September 30, 2012
This grant will enable the expansion of TU’s STEM education efforts. The BEST program will focus on recruitment and reten-tion of grades 6-12 in-service STEM teachers. It will offer training and mentoring opportunities to its participants while providing educational outreach to students.
large grant and Contract Awards
The university receives hundreds of grants and contracts each fiscal year. The awards listed below are in alphabetical order by title and represent some of the major grants and contracts that will be active in FY 2013. Please note that the funds for many of the grants and contracts are awarded over an extended period of time; thus the total award amount of the projects listed below will be greater than the restricted award total for FY 2013 alone.
restricted resource allocation
2013 operating budget and plan
32
restricted resource allocation
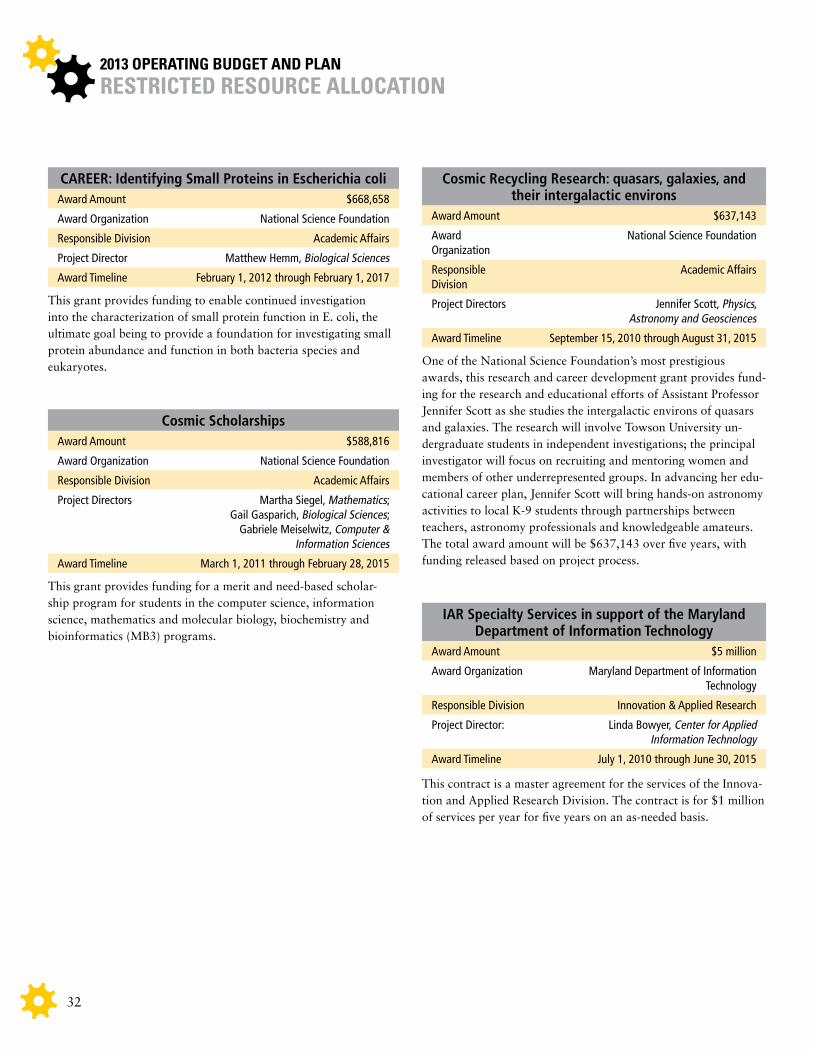
CArEEr: identifying Small proteins in Escherichia coliAward Amount $668,658
Award Organization National Science Foundation
Responsible Division Academic Affairs
Project Director Matthew Hemm, Biological Sciences
Award Timeline February 1, 2012 through February 1, 2017
This grant provides funding to enable continued investigation into the characterization of small protein function in E. coli, the ultimate goal being to provide a foundation for investigating small protein abundance and function in both bacteria species and eukaryotes.
Cosmic Scholarships Award Amount $588,816
Award Organization National Science Foundation
Responsible Division Academic Affairs
Project Directors Martha Siegel, Mathematics; Gail Gasparich, Biological Sciences;
Gabriele Meiselwitz, Computer & Information Sciences
Award Timeline March 1, 2011 through February 28, 2015
This grant provides funding for a merit and need-based scholar-ship program for students in the computer science, information science, mathematics and molecular biology, biochemistry and bioinformatics (MB3) programs.
Cosmic recycling research: quasars, galaxies, and their intergalactic environs
Award Amount $637,143
Award Organization
National Science Foundation
Responsible Division
Academic Affairs
Project Directors Jennifer Scott, Physics, Astronomy and Geosciences
Award Timeline September 15, 2010 through August 31, 2015
One of the National Science Foundation’s most prestigious awards, this research and career development grant provides fund-ing for the research and educational efforts of Assistant Professor Jennifer Scott as she studies the intergalactic environs of quasars and galaxies. The research will involve Towson University un-dergraduate students in independent investigations; the principal investigator will focus on recruiting and mentoring women and members of other underrepresented groups. In advancing her edu-cational career plan, Jennifer Scott will bring hands-on astronomy activities to local K-9 students through partnerships between teachers, astronomy professionals and knowledgeable amateurs. The total award amount will be $637,143 over five years, with funding released based on project process.
iAr Specialty Services in support of the Maryland department of information Technology
Award Amount $5 million
Award Organization Maryland Department of Information Technology
Responsible Division Innovation & Applied Research
Project Director: Linda Bowyer, Center for Applied Information Technology
Award Timeline July 1, 2010 through June 30, 2015
This contract is a master agreement for the services of the Innova-tion and Applied Research Division. The contract is for $1 million of services per year for five years on an as-needed basis.

2013 operating budget and plan
33
iAr Specialty Services in Support of the Maryland State police
Award Amount $5 million
Award Organization Maryland State Police
Responsible Division Innovation & Applied Research
Project Director: Linda Bowyer, Center for Applied Information Technology
Award Timeline February 15, 2011 through June 30, 2015
This contract is a master agreement for IAR services. The contract is for $1 million of services per year for five years on an as-needed basis.
driver’s license System/point of Service System Support
Award Amount $3.936 million
Award Organization Maryland Department of Transportation
Responsible Division Innovation & Applied Research
Project Director: Linda Bowyer, Center for Applied Information Technology
Award Timeline January 1, 2008 through June 30, 2012
This contract is a master agreement for IAR services to be provided on an as-needed basis.
Evaluation of Maryland’s race to the Top projectAward Amount $4.75 million
Award Organization Maryland State Department of Education
Responsible Division Academic Affairs
Project Director Raymond Lorion, College of Education
Award Timeline July 1, 2011 through September 30, 2014 The grant provides funding for the evaluation of the Maryland State Department of Education’s “Race to the Top” program. Towson University’s Center for Application and Innovation Research in Education (CAIRE) will design and implement a “research as intervention” model combining formative and summative assessment tools and building evaluation capacity across public education stakeholders.
Facilitating Seamless Transition from Community College to Towson University
Award Amount $876,472
Award Organization National Institutes of Health
Responsible Division Academic Affairs
Project Director Gail Gasparich, College of Science & Mathematics
Award Timeline September 1, 2003 through August 31, 2013
This grant is part of the Bridges to the Baccalaureate Program, which provides funding to continue recruitment efforts at BCCC and CCBC to increase awareness and gather a pool of qualified students at community college partner institutions; increase program awareness at TU to foster a supportive climate for Bridges students; and to provide an active and supportive academic program for students.
Flower and Fruit development in the diploid Strawberry
Award Amount $317,275
Award Organization University of Maryland College Park
Responsible Division Academic Affairs
Project Director Nadim Alkharouf, Computer & Information Sciences
Award Timeline September 1, 2010 through February 28, 2013
This grant provides funding to enable continued analysis of sequencing data related the development of fruit and flowers in the diploid strawberry.
restricted resource allocation
2013 operating budget and plan
34
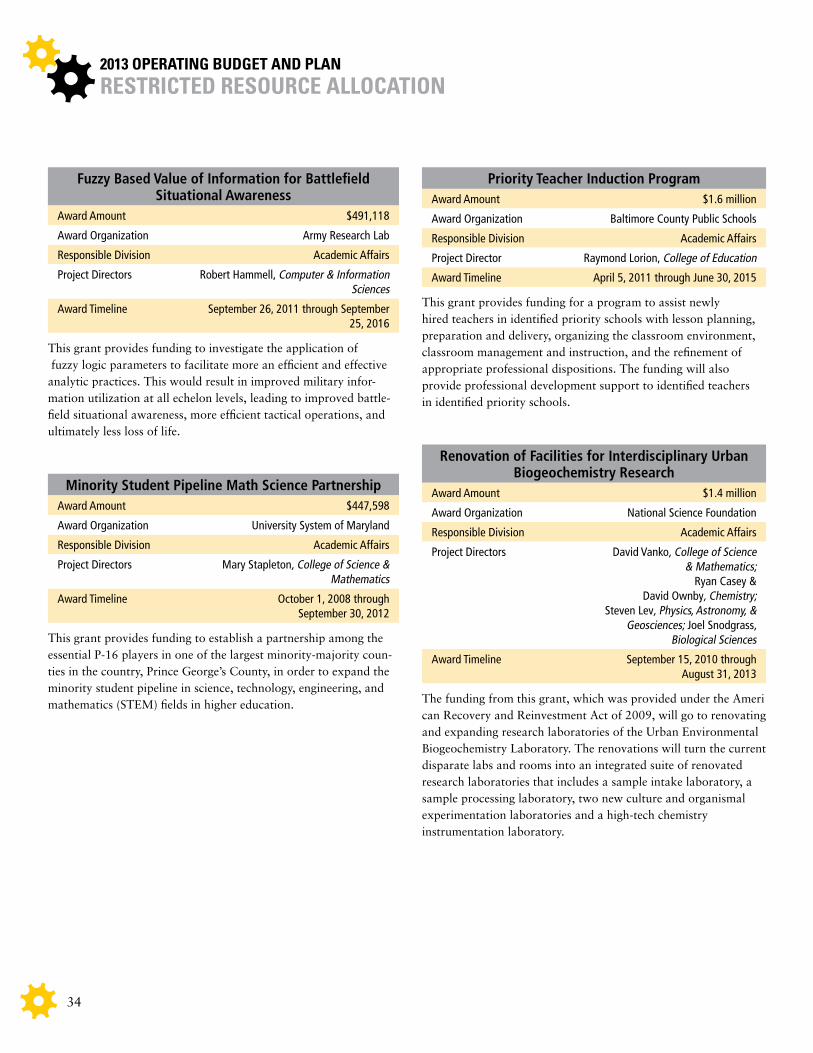
Fuzzy Based value of information for Battlefield Situational Awareness
Award Amount $491,118
Award Organization Army Research Lab
Responsible Division Academic Affairs
Project Directors Robert Hammell, Computer & Information Sciences
Award Timeline September 26, 2011 through September 25, 2016
This grant provides funding to investigate the application of fuzzy logic parameters to facilitate more an efficient and effective analytic practices. This would result in improved military infor-mation utilization at all echelon levels, leading to improved battle-field situational awareness, more efficient tactical operations, and ultimately less loss of life.
Minority Student pipeline Math Science partnershipAward Amount $447,598
Award Organization University System of Maryland
Responsible Division Academic Affairs
Project Directors Mary Stapleton, College of Science & Mathematics
Award Timeline October 1, 2008 through September 30, 2012
This grant provides funding to establish a partnership among the essential P-16 players in one of the largest minority-majority coun-ties in the country, Prince George’s County, in order to expand the minority student pipeline in science, technology, engineering, and mathematics (STEM) fields in higher education.
priority Teacher induction programAward Amount $1.6 million
Award Organization Baltimore County Public Schools
Responsible Division Academic Affairs
Project Director Raymond Lorion, College of Education
Award Timeline April 5, 2011 through June 30, 2015 This grant provides funding for a program to assist newly hired teachers in identified priority schools with lesson planning, preparation and delivery, organizing the classroom environment, classroom management and instruction, and the refinement of appropriate professional dispositions. The funding will also provide professional development support to identified teachers in identified priority schools.
renovation of Facilities for interdisciplinary Urban Biogeochemistry research
Award Amount $1.4 million
Award Organization National Science Foundation
Responsible Division Academic Affairs
Project Directors David Vanko, College of Science & Mathematics;
Ryan Casey & David Ownby, Chemistry;
Steven Lev, Physics, Astronomy, & Geosciences; Joel Snodgrass,
Biological Sciences
Award Timeline September 15, 2010 through August 31, 2013
The funding from this grant, which was provided under the Ameri can Recovery and Reinvestment Act of 2009, will go to renovating and expanding research laboratories of the Urban Environmental Biogeochemistry Laboratory. The renovations will turn the current disparate labs and rooms into an integrated suite of renovated research laboratories that includes a sample intake laboratory, a sample processing laboratory, two new culture and organismal experimentation laboratories and a high-tech chemistry instrumentation laboratory.
restricted resource allocation

2013 operating budget and plan
35
restricted resource allocation
robert noyce Teacher Scholarship programAward Amount $900,000
Award Organization National Science Foundation
Responsible Division Academic Affairs
Project Directors David Vanko, College of Science & Mathematics;
Todd Kenreich, Secondary Education; Donald Thomas, Willard
Hackerman Academy; Jane Wolfson, Environmental
Science and Studies
Award Timeline June 1, 2011 through May 31, 2014 The funding from this grant, which was provided under the American Recovery and Reinvestment Act of 2009, will go to providing scholarships to juniors and seniors who are majoring in science, technology, engineering and mathematics (STEM) fields and who intend to become teachers. It will also provide stipends to STEM professionals who are pursuing teaching certification in the STEM disciplines.
rUi: rEvSYS: A global Monographic revision of the Ant genus paratrechina
Award Amount $507,204
Award Organization National Science Foundation
Responsible Division Academic Affairs
Project Directors John LaPolla, Biological Sciences
Award Timeline March 1, 2008 through February 28, 2013 This grant provides funding to complete a world monographic revision of Paratrechina; infer the phylogenetic relationships among this species using molecular and morphological data; and create an online species catalogue with species diagnoses, interactive keys, and illustrations.
Statewide increase in Master’s prepared nurse Faculty, Administrators & BSn-prepared Bedside
nurses Award Amount $445,356
Award Organization Maryland Higher Education Commission
Responsible Division Academic Affairs
Project Directors Judy Breitenbach, Nursing
Award Timeline July 1, 2007 through December 31, 2012 This grant provides funding to increase the registered nurse capacity and enhance the educational status of nurses within Maryland.
Targeted partnership: Culturally relevant Ecology, learning progressions & Environmental literacy
Award Amount $1.261 million
Award Organization Colorado State University
Responsible Division Academic Affairs
Project Directors Sarah Haines, STEM Education Center
Award Timeline October 1, 2008 through September 30, 2013
This grant provides funding for TU graduate students in NSF supported STEM disciplines to acquire additional skills that will prepare them for professional and scientific careers in the 21st century.
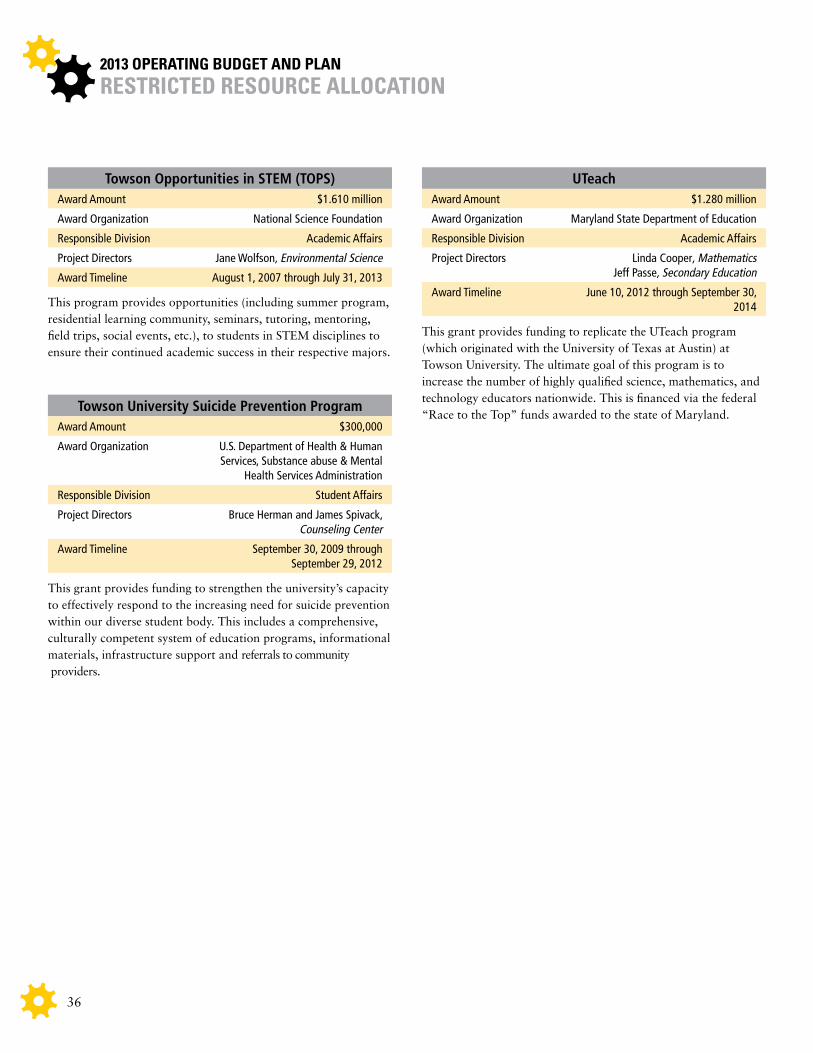
2013 operating budget and plan
36
restricted resource allocation
Towson Opportunities in STEM (TOpS)Award Amount $1.610 million
Award Organization National Science Foundation
Responsible Division Academic Affairs
Project Directors Jane Wolfson, Environmental Science
Award Timeline August 1, 2007 through July 31, 2013 This program provides opportunities (including summer program, residential learning community, seminars, tutoring, mentoring, field trips, social events, etc.), to students in STEM disciplines to ensure their continued academic success in their respective majors.
Towson University Suicide prevention programAward Amount $300,000
Award Organization U.S. Department of Health & Human Services, Substance abuse & Mental
Health Services Administration
Responsible Division Student Affairs
Project Directors Bruce Herman and James Spivack, Counseling Center
Award Timeline September 30, 2009 through September 29, 2012
This grant provides funding to strengthen the university’s capacity to effectively respond to the increasing need for suicide prevention within our diverse student body. This includes a comprehensive, culturally competent system of education programs, informational materials, infrastructure support and referrals to community providers.
UTeachAward Amount $1.280 million
Award Organization Maryland State Department of Education
Responsible Division Academic Affairs
Project Directors Linda Cooper, Mathematics Jeff Passe, Secondary Education
Award Timeline June 10, 2012 through September 30, 2014
This grant provides funding to replicate the UTeach program (which originated with the University of Texas at Austin) at Towson University. The ultimate goal of this program is to increase the number of highly qualified science, mathematics, and technology educators nationwide. This is financed via the federal “Race to the Top” funds awarded to the state of Maryland.
2013 operating budget and plan
37
capital budget projects
CApiTAl
A capital project is generally defined by the USM as any design or construction project that exceeds a total project cost of $1 million. Capital projects are usually grouped into two categories—state-funded capital projects and system-funded capital projects.
Descriptions of ongoing capital projects are provided on the following pages. The projects correspond with the university’s master plan, which is available online at the Facilities Management website.
STATE-FUndEd CApiTAl prOjECTS
State-funded capital projects are typically financed with bond funds allocated from the state of Maryland budget to individual institu-tions. Institutions are not required to reimburse the state for these bonds. Projects eligible for funding from the state include academic and academic support buildings (such as administration buildings, infrastructure and utility improvements). Towson University’s ongoing state-funded capital projects are listed in alphabetical order below.
Campus-Wide Site, infrastructure and Safety improvements
Total Budget $15.012 million
Project Schedule March 2012 – September 2014 The project, as proposed, is for the completion of a variety of safety, infrastructure and site improvements to provide a safer and more functional campus, and to prepare for additional building and enrollment growth. More specifically, the project is comprised of two major components. The first includes the de-sign and construction of a pedestrian bridge from the residential West Village precinct, across Osler Drive, to the Main Academic precinct of campus. In addition to the bridge, associated work re-quired will include re-grading of surrounding areas, the addition of a campus recreation field, storm water management improve-ments, utility and roadway infrastructure relocation and various site, utility and infrastructure improvements needed to advance the recommendations of the 2009 Campus Master Plan.The second component includes the design and construction of a pedestrian walkway (a portion of which may be elevated) from the southeastern end of Linthicum Hall east along Cook Library to Newell Hall. In addition to the pedestrian walkway, associated work required will include demolition of the concrete bridge between Newell Dining Hall and Cook Library, re-grading of surrounding areas, renewal/replacement of the Cook Library plaza and stairs that tie into the walkway, possible relocation of mechanical equipment for Cook Library, and necessary storm water management and site restoration improvements.
public Safety BuildingTotal Budget $8 million
Size 20,000 GSF
Estimated Start July 2010
Estimated Completion January 2013
As proposed, the project is for the design and construction a 20,000 square foot, multi-story building to support the current and future needs of the Towson University Police Department (TUPD). The project will also include the construction of addi-tional parking facilities to offset current shortages to support the TUPD, university fleet and maintenance, and general faculty/staff parking needs. Completion of the facility will allow the TUPD to vacate current space in the General Services building, which can be redistributed to the Facilities Management department. This project is financed through a non-bond funded University allocation.
Smith hall Expansion & renovationTotal Budget $156.05 million
Size 106,700 GSF (new); 220,445 GSF (renovated)
Project Schedule December 2012 – July 2019 As proposed, this project will expand and renovate Smith Hall to meet the current and future undergraduate and graduate program needs of the Jess and Mildred Fisher College of Science and Mathematics. More specifically, this project will accommo-date and address the chemistry, biology, physics, geoscience, and environmental science departments, as well as the molecular biol-ogy, biochemistry and bioinformatics program. The mathematics and computer science departments are currently located in the 7800 York Road building and will remain there for the long-term future. The scope of work for the project involves the following components:
2013 operating budget and plan
38
capital budget projects
1. Construction of a new 106,700 gross square foot building expansion;
2. Comprehensive renovation of the current building; and3. Extension and completion of the main academic campus
central utility loop, including connection of Smith Hall and the expansion.
Ward & West hall renovations Total Budget $10.5 million
Size 9,000 GSF (new); 27,000 GSF (renovated)
Project Schedule May 2011 – January 2014
This project involves the adaptive reuse and renovation of Ward and West Halls to encompass the University’s Health and Counseling Centers. The project also proposes to connect Ward and West Hall with a 9,000 GSF building addition to facilitate additional programmable space and allow for ADA accessibility to both buildings. The Health Center is currently located in the Dowell Health Building, which will be demolished as part of the development of the new College of Health Professions building. The Counseling Center is currently located in Glen Esk and is in need of additional space to accommodate the growing student enrollment. This project is financed through a non-bond funded University allocation.
harford Community College project Total Budget $28.0 million
Project Schedule September 2011 – August 2014
The Harford Community College, HCC, project will provide academic and support space for the University’s programs offered in Harford county and improve access to baccalaure-ate degree programs for students of this region. This project will construct 54,000 GSF of space on the the HCC campus to support 2 + 2 programs in collaboration with the community college. This project is financed through a non-bond funded University allocation.
SYSTEM-FUndEd CApiTAl prOjECTSSystem-funded capital projects are financed through the sale of bonds by the USM. The debt service of these bonds is typically a 20-year amortization period paid for by the institution primarily through auxiliary revenue sources including student fees. Proj-ects that are eligible for funding through this financing method include dining halls, student unions, parking facilities, recreation facilities, and residence hall renovations. Towson University’s ongoing system-funded capital projects are listed below.
Burdick hall renovation phase iii Total Budget $15.0 million
Project Schedule September 2012 – August 2014This project, as proposed, will include the replacement of lower roofs and associated rooftop mechanical units, new window walls and exterior doors, as well as renovation of the building envelope. The HVAC system will be replaced with a more energy efficient system using chilled water produced at the central utility plant and VAV boxes, which will require removal of the existing unit ventilators, new duct work throughout, central distribution of chilled water, new HVAC controls and new interior finishes.
newell & richmond hall renovationsTotal Budget $26.6 million
Project Schedule January 2010 – December 2012This project includes the design and comprehensive renovation of the envelope, roof and entry ways of each building, along with replacement of the gutter systems and rear stairwell into Newell Hall. With the relocation of Housing and Residence Life (HRL) to the new West Village Commons building, HRL’s former office space will be reconfigured and renovated to accommodate ad-ditional student beds.
Towson Center ArenaTotal Budget $73.0 million
Size 110,000 GSF; 5,000 seats
Estimated Start September 2008
Estimated Completion April 2013
This project involves the design and construction of a new 100,000 gross square foot arena that will be connected to the existing Towson Center facility. The new arena will include a minimum of 5,000 spectator seats, luxury suites, concessions, a large multi-purpose gathering space, a hall of fame, offices, a press room, a catering kitchen and other necessary support spaces.
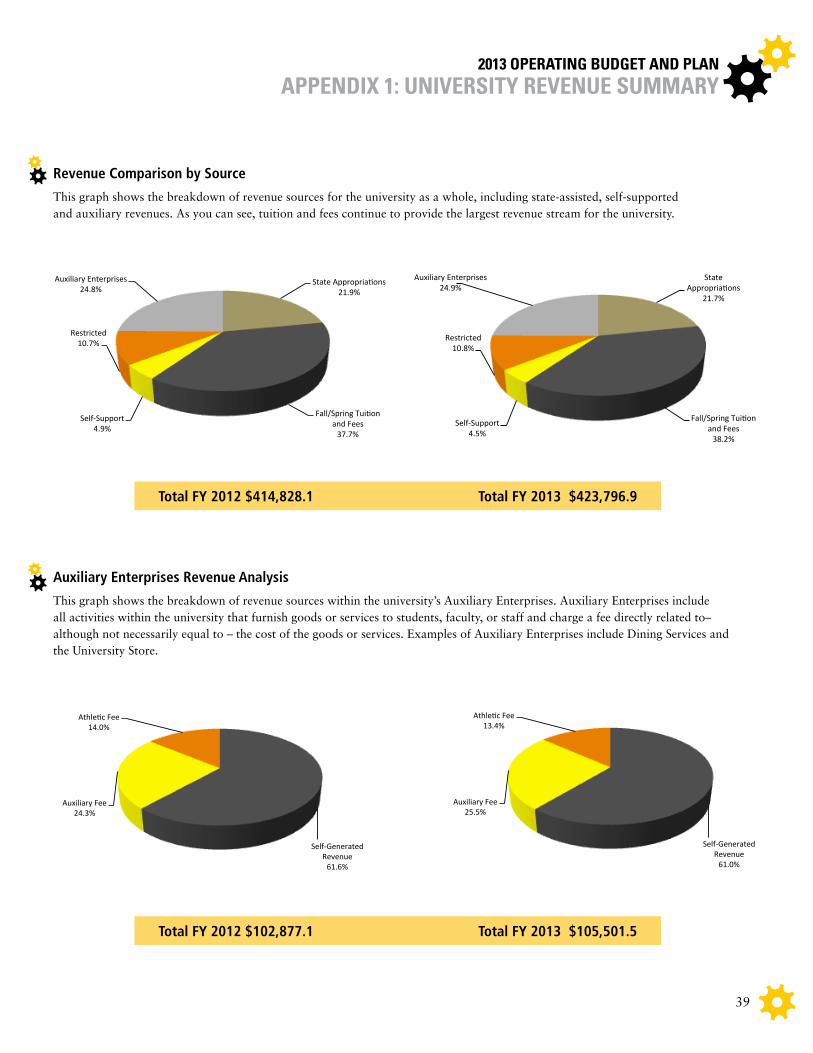
2013 operating budget and plan
39
Auxiliary Enterprises revenue Analysis
This graph shows the breakdown of revenue sources within the university’s Auxiliary Enterprises. Auxiliary Enterprises include all activities within the university that furnish goods or services to students, faculty, or staff and charge a fee directly related to– although not necessarily equal to – the cost of the goods or services. Examples of Auxiliary Enterprises include Dining Services and the University Store.
revenue Comparison by Source
This graph shows the breakdown of revenue sources for the university as a whole, including state-assisted, self-supported and auxiliary revenues. As you can see, tuition and fees continue to provide the largest revenue stream for the university.
appendiX 1: universitY revenue summarY
Total FY 2012 $414,828.1 Total FY 2013 $423,796.9
State Appropria+ons 23.0%
Fall/Spring Tui+on and Fees
36.9%
Self‐Supported
5.0%
Restricted
10.3%
Auxiliary Enterprises 24.8%
State Appropria+ons 21.9%
Fall/Spring Tui+on and Fees
37.7%
Self‐Supported
4.9%
Restricted
10.7%
Auxiliary Enterprises 24.8%
State Appropria+ons 21.9%
Fall/Spring Tui+on and Fees 37.7%
Self-‐Support 4.9%
Restricted 10.7%
Auxiliary Enterprises 24.8%
Total FY 2012 $414,828.1
State Appropria+ons
21.7%
Fall/Spring Tui+on and Fees 38.2%
Self-‐Support 4.5%
Restricted 10.8%
Auxiliary Enterprises 24.9%
Total FY 2013 $423,796.9
Total FY 2012 $102,877.1 Total FY 2013 $105,501.5
Self‐Generated Revenue
61.6%
Auxiliary Fee
24.7%
Athle=c Fee
13.7%
Self‐Generated Revenue
61.6%
Auxiliary Fee
24.4%
Athle<c Fee
14.0%
Self-‐Generated Revenue 61.6%
Auxiliary Fee 24.3%
Athle=c Fee 14.0%
Total FY 2012 $102,877.1
Self-‐Generated Revenue 61.0%
Auxiliary Fee 25.5%
Athle=c Fee 13.4%
Total FY 2012 $105,501.5

2013 operating budget and plan
40
State-Assisted Expenses by Category
This graph shows the categorical breakdown of expenditure sources within the university’s state-assisted budgets. It does not include the sources of expenditures within the auxiliary area. Regular wages, salaries and fringe benefits continue to be the university’s greatest expenditure.
State-Assisted Expenses by division
This graph shows the divisional breakdown of expenditures within the university’s state-assisted budgets. It does not include expenditures that fall within the auxiliary area. The greatest expense continues to be from the Academic Affairs Division in direct support of the university’s mission.
Total FY 2012 $245,131.5 Total FY 2013 $250,110.3
Total FY 2012 $245,131.5 Total FY 2013 $253,110.3
apendiX 2: universitY eXpenditure summarY
Regular Salaries, Wages & Fringe
Benefits 57.1%
Con;ngent Salaries, Wages & Fringe
Benefits 6.5%
Opera;ng Expenses 25.6%
Scholarships 10.8%
Total FY 2012 $245,131.5
Regular Salaries, Wages & Fringe
Benefits 57.9%
Con;ngent Salaries, Wages & Fringe
Benefits 6.8%
Opera;ng Expenses 24.6%
Scholarships 10.7%
Total FY 2012 $253,110.3
President's Office 1.0%
Academic Affairs 49.9%
IAR 0.4%
Student Affairs 3.2%
Administra>on & Finance 19.9%
University Advancement
3.1%
Financial Aid 11.1%
Central 9.4%
Con>ngency 1.9%
Total FY 2012 $245,131.5
President's Office 2.8%
Academic Affairs 50.7%
IAR 0.4%
Student Affairs 3.1%
Administra@on & Finance 19.9%
University Advancement
1.6%
Financial Aid 10.9%
Central 9.6%
Con@ngency 0.8%
Total FY 2013 $250,110.3
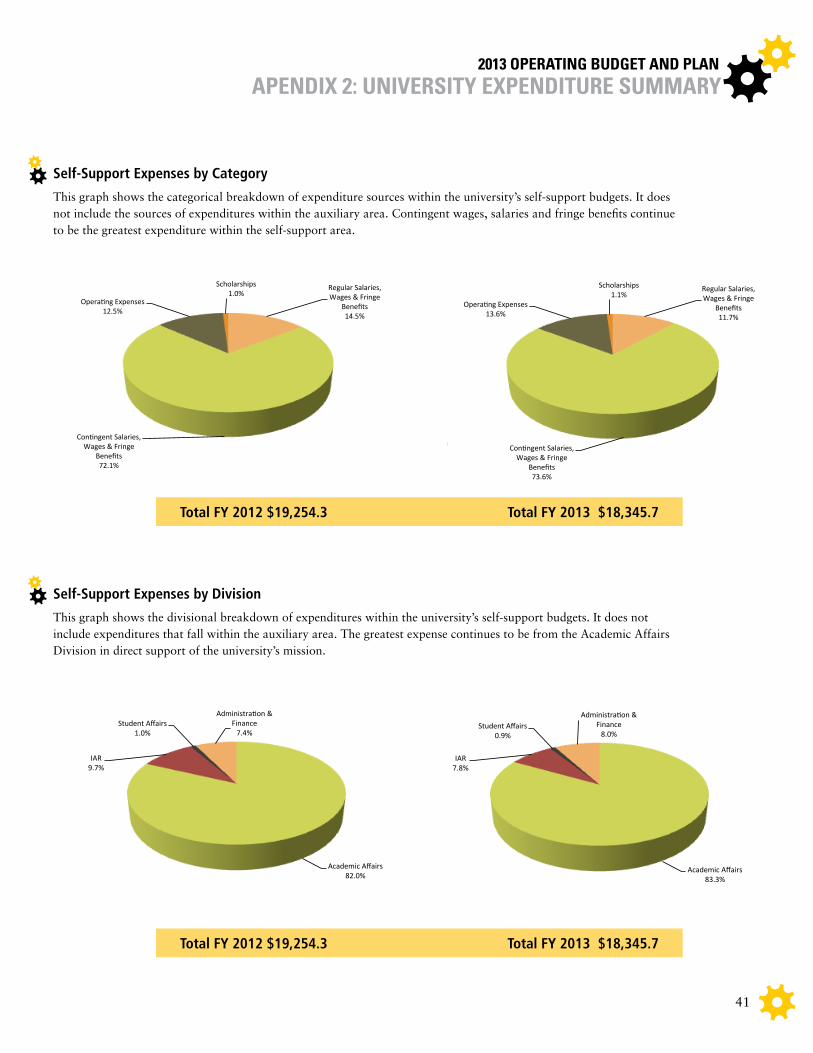
2013 operating budget and plan
41
apendiX 2: universitY eXpenditure summarY
Self-Support Expenses by Category
This graph shows the categorical breakdown of expenditure sources within the university’s self-support budgets. It does not include the sources of expenditures within the auxiliary area. Contingent wages, salaries and fringe benefits continue to be the greatest expenditure within the self-support area.
Total FY 2012 $19,254.3 Total FY 2013 $18,345.7
Self-Support Expenses by division
This graph shows the divisional breakdown of expenditures within the university’s self-support budgets. It does not include expenditures that fall within the auxiliary area. The greatest expense continues to be from the Academic Affairs Division in direct support of the university’s mission.
Total FY 2012 $19,254.3 Total FY 2013 $18,345.7
Regular Salaries, Wages & Fringe
Benefits 14.5%
Con;ngent Salaries, Wages & Fringe
Benefits 72.1%
Opera;ng Expenses 12.5%
Scholarships 1.0%
Total FY 2012 $19,254.3
Regular Salaries, Wages & Fringe
Benefits 11.7%
Con;ngent Salaries, Wages & Fringe
Benefits 73.6%
Opera;ng Expenses 13.6%
Scholarships 1.1%
Total FY 2012 $18,345.7
Regular Salaries, Wages & Fringe
Benefits 14.5%
Con;ngent Salaries, Wages & Fringe
Benefits 72.1%
Opera;ng Expenses 12.5%
Scholarships 1.0% Regular Salaries,
Wages & Fringe Benefits 11.7%
Con:ngent Salaries, Wages & Fringe
Benefits 73.6%
Opera:ng Expenses 13.6%
Scholarships 1.1%
Academic Affairs 82.0%
IAR 9.7%
Student Affairs 1.0%
Administra:on & Finance 7.4%
Total FY 2012 $19,254.3
Academic Affairs 83.3%
IAR 7.8%
Student Affairs 0.9%
Administra9on & Finance 8.0%
Total FY 2012 $18,345.7
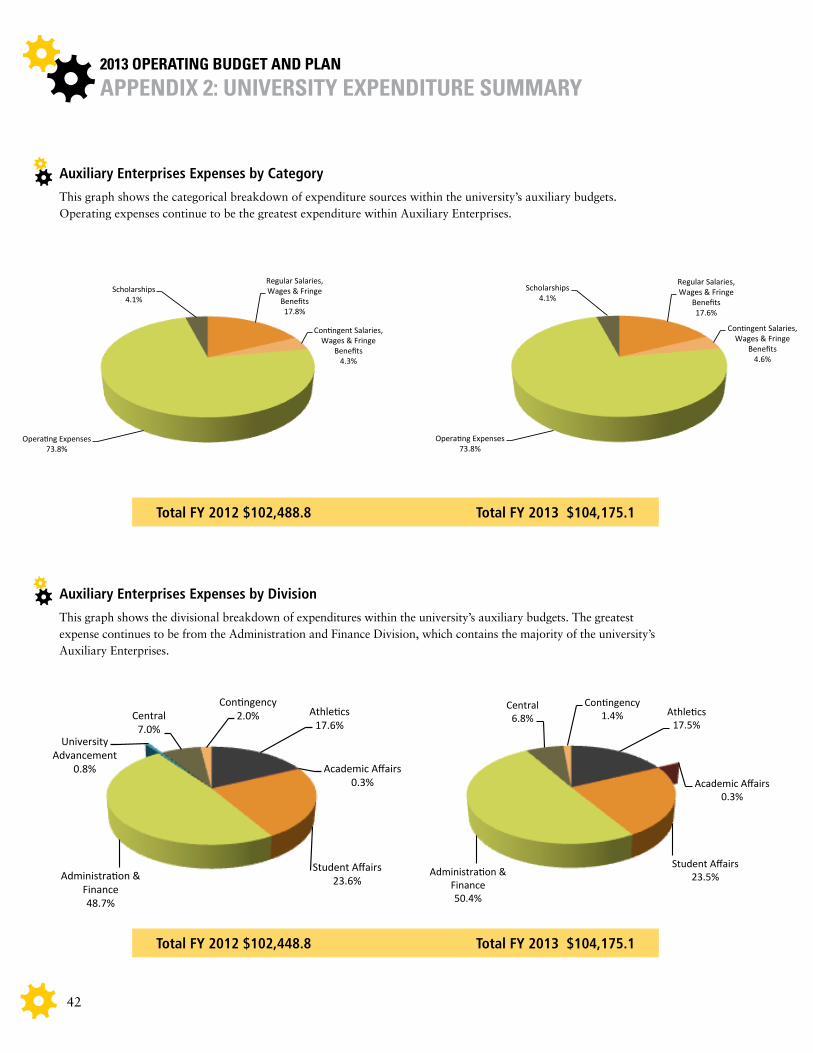
2013 operating budget and plan
42
Auxiliary Enterprises Expenses by Category
This graph shows the categorical breakdown of expenditure sources within the university’s auxiliary budgets. Operating expenses continue to be the greatest expenditure within Auxiliary Enterprises.
Auxiliary Enterprises Expenses by division
This graph shows the divisional breakdown of expenditures within the university’s auxiliary budgets. The greatest expense continues to be from the Administration and Finance Division, which contains the majority of the university’s Auxiliary Enterprises.
Total FY 2012 $102,488.8 Total FY 2013 $104,175.1
Total FY 2012 $102,448.8 Total FY 2013 $104,175.1
appendiX 2: universitY eXpenditure summarY
Regular Salaries, Wages & Fringe
Benefits 17.8%
Con;ngent Salaries, Wages & Fringe
Benefits 4.3%
Opera;ng Expenses 73.8%
Scholarships 4.1%
Total FY 2012 $102,488.8
Regular Salaries, Wages & Fringe
Benefits 17.6%
Con;ngent Salaries, Wages & Fringe
Benefits 4.6%
Opera;ng Expenses 73.8%
Scholarships 4.1%
Total FY 2012 $104,175.1
Regular Salaries, Wages & Fringe
Benefits 17.8%
Con;ngent Salaries, Wages & Fringe
Benefits 4.3%
Opera;ng Expenses 73.8%
Scholarships 4.1%
Total FY 2012 $102,488.8
Regular Salaries, Wages & Fringe
Benefits 17.6%
Con;ngent Salaries, Wages & Fringe
Benefits 4.6%
Opera;ng Expenses 73.8%
Scholarships 4.1%
Total FY 2012 $104,175.1
Athle&cs 17.6%
Academic Affairs 0.3%
Student Affairs 23.6% Administra&on &
Finance 48.7%
University Advancement
0.8%
Central 7.0%
Con&ngency 2.0%
Total FY 2012 $102,448.8
Athle&cs 17.5%
Academic Affairs 0.3%
Student Affairs 23.5% Administra&on &
Finance 50.4%
Central 6.8%
Con&ngency 1.4%
Total FY 2013 $104,175.1

2013 operating budget and plan
43
Regular Salaries, Wages & Fringe
Benefits 17.8%
Con;ngent Salaries, Wages & Fringe
Benefits 4.3%
Opera;ng Expenses 73.8%
Scholarships 4.1%
Total FY 2012 $102,488.8
Regular Salaries, Wages & Fringe
Benefits 17.6%
Con;ngent Salaries, Wages & Fringe
Benefits 4.6%
Opera;ng Expenses 73.8%
Scholarships 4.1%
Total FY 2012 $104,175.1
appendiX 2: universitY eXpenditure summarY
Auxiliary Enterprises Expenses by Function
This graph shows the departmental and/or functional breakdown of expenditures within the university’s Auxiliary Enterprises.
Total FY 2012 $102,448.8 Total FY 2013 $104,175.1
Athle&cs 17.6%
University Store 9.0%
Dining 17.5%
Housing & Residence Life
20.2%
Events, Union, & West Village
8.7%
Parking & Transporta&on
7.5%
Other 13.5% TU MarrioQ
2.5%
Child Care Center 1.0% Debt Reserve
0.5%
Reserve & Fund Balance
2.0%
Total FY 2012 $102,448.8
Athle&cs 17.5%
University Store 8.8%
Dining 17.1%
Housing & Residence Life
20.0%
Events, Union, & West Village
8.6%
Parking & Transporta&on
7.1%
Other 16.2%
TU MarrioQ 2.4%
Child Care Center 1.0%
Reserve & Fund Balance 1.4%
Total FY 2013 $104,175.1
Athle&cs 17.6%
University Store 9.0%
Dining 17.5%
Housing & Residence Life
20.2%
Events, Union, & West Village
8.7%
Parking & Transporta&on
7.5%
Other 13.5% TU MarrioQ
2.5%
Child Care Center 1.0% Debt Reserve
0.5%
Reserve & Fund Balance
2.0%
Total FY 2012 $102,448.8
Athle&cs 17.5%
University Store 8.8%
Dining 17.1%
Housing & Residence Life
20.0%
Events, Union, & West Village
8.6%
Parking & Transporta&on
7.1%
Other 16.2%
TU MarrioO 2.4%
Child Care Center 1.0%
Reserve & Fund Balance 1.4%
Total FY 2013 $104,175.1

2013 operating budget and plan
44
appendiX 3: tu budget trends
FY2009 FY2010 FY2011 FY2012 FY2013 State Appropria2ons $92,705.6 $89,030.7 $89,944.9 $90,924.5 $91,854.4
Fall/Spring Tui2on and Fees $134,840.3 $140,216.8 $144,367.3 $156,427.9 $161,754.8
$0.0 $20,000.0 $40,000.0 $60,000.0 $80,000.0
$100,000.0 $120,000.0 $140,000.0 $160,000.0 $180,000.0
Thou
sand
s
Stateside Revenue Budget
State-Assisted revenue
This graph shows the budget for State Appropriations along with Fall/Spring Tuition and Fees for the past five years.
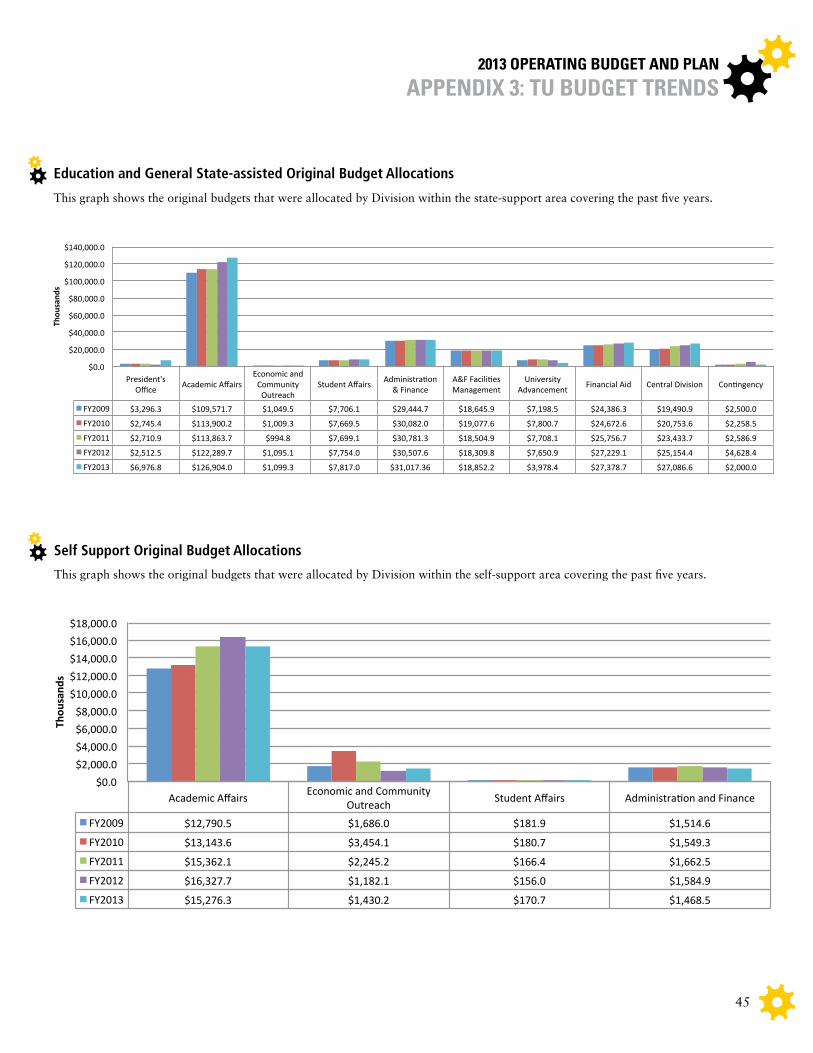
2013 operating budget and plan
45
appendiX 3: tu budget trends
President's Office Academic Affairs
Economic and Community Outreach
Student Affairs Administra9on & Finance
A&F Facili9es Management
University Advancement Financial Aid Central Division Con9ngency
FY2009 $3,296.3 $109,571.7 $1,049.5 $7,706.1 $29,444.7 $18,645.9 $7,198.5 $24,386.3 $19,490.9 $2,500.0
FY2010 $2,745.4 $113,900.2 $1,009.3 $7,669.5 $30,082.0 $19,077.6 $7,800.7 $24,672.6 $20,753.6 $2,258.5
FY2011 $2,710.9 $113,863.7 $994.8 $7,699.1 $30,781.3 $18,504.9 $7,708.1 $25,756.7 $23,433.7 $2,586.9
FY2012 $2,512.5 $122,289.7 $1,095.1 $7,754.0 $30,507.6 $18,309.8 $7,650.9 $27,229.1 $25,154.4 $4,628.4
FY2013 $6,976.8 $126,904.0 $1,099.3 $7,817.0 $31,017.36 $18,852.2 $3,978.4 $27,378.7 $27,086.6 $2,000.0
$0.0
$20,000.0
$40,000.0
$60,000.0
$80,000.0
$100,000.0
$120,000.0
$140,000.0
Thou
sand
s
Educa,on and General State Assisted Original Budget Alloca,ons
Education and general State-assisted Original Budget Allocations
This graph shows the original budgets that were allocated by Division within the state-support area covering the past five years.
Academic Affairs Economic and Community Outreach Student Affairs Administra6on and Finance
FY2009 $12,790.5 $1,686.0 $181.9 $1,514.6
FY2010 $13,143.6 $3,454.1 $180.7 $1,549.3
FY2011 $15,362.1 $2,245.2 $166.4 $1,662.5
FY2012 $16,327.7 $1,182.1 $156.0 $1,584.9
FY2013 $15,276.3 $1,430.2 $170.7 $1,468.5
$0.0 $2,000.0 $4,000.0 $6,000.0 $8,000.0
$10,000.0 $12,000.0 $14,000.0 $16,000.0 $18,000.0
Thou
sand
s
Self Support Original Budget Alloca7ons
Self Support Original Budget Allocations
This graph shows the original budgets that were allocated by Division within the self-support area covering the past five years.
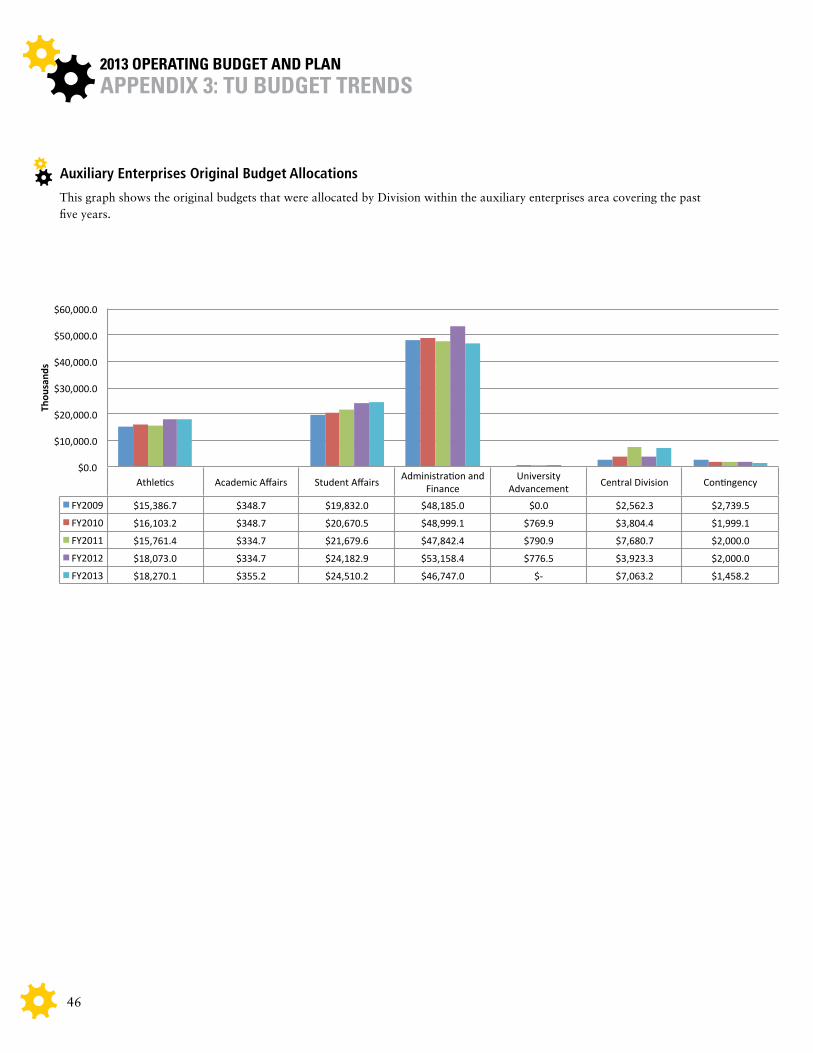
2013 operating budget and plan
46
Athle&cs Academic Affairs Student Affairs Administra&on and Finance
University Advancement Central Division Con&ngency
FY2009 $15,386.7 $348.7 $19,832.0 $48,185.0 $0.0 $2,562.3 $2,739.5
FY2010 $16,103.2 $348.7 $20,670.5 $48,999.1 $769.9 $3,804.4 $1,999.1
FY2011 $15,761.4 $334.7 $21,679.6 $47,842.4 $790.9 $7,680.7 $2,000.0
FY2012 $18,073.0 $334.7 $24,182.9 $53,158.4 $776.5 $3,923.3 $2,000.0
FY2013 $18,270.1 $355.2 $24,510.2 $46,747.0 $-‐ $7,063.2 $1,458.2
$0.0
$10,000.0
$20,000.0
$30,000.0
$40,000.0
$50,000.0
$60,000.0
Thou
sand
s
Auxiliary Enterprises Original Budget Alloca8ons
appendiX 3: tu budget trends
Auxiliary Enterprises Original Budget Allocations
This graph shows the original budgets that were allocated by Division within the auxiliary enterprises area covering the past five years.
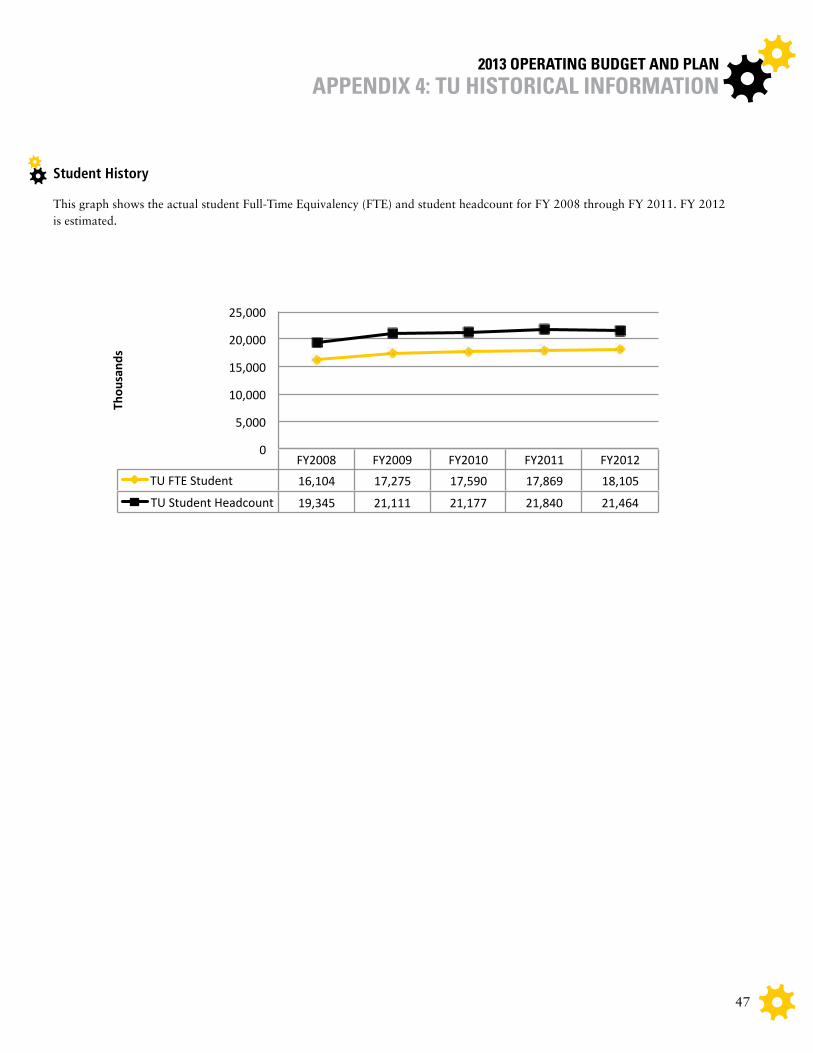
2013 operating budget and plan
47
FY2008 FY2009 FY2010 FY2011 FY2012 TU FTE Student 16,104 17,275 17,590 17,869 18,105
TU Student Headcount 19,345 21,111 21,177 21,840 21,464
0
5,000
10,000
15,000
20,000
25,000
Thou
sand
s
Student History
appendiX 4: tu Historical information
Student history
This graph shows the actual student Full-Time Equivalency (FTE) and student headcount for FY 2008 through FY 2011. FY 2012 is estimated.
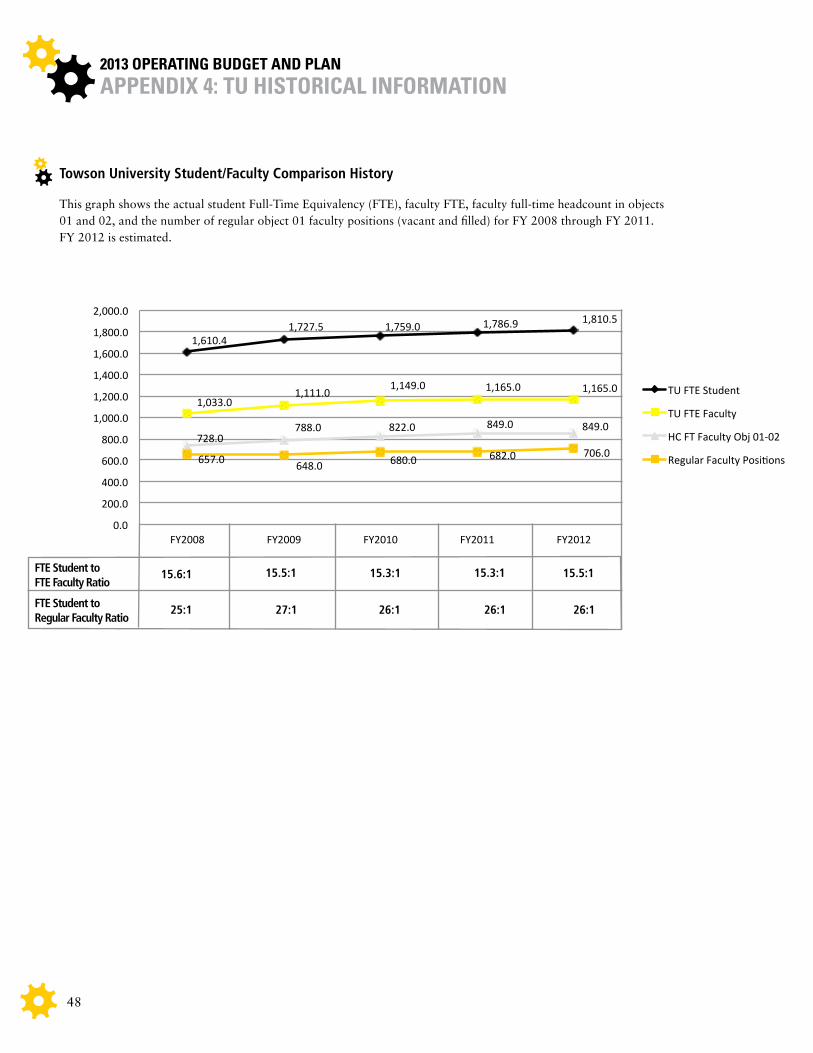
2013 operating budget and plan
48
appendiX 4: tu Historical information
Towson University Student/Faculty Comparison history
This graph shows the actual student Full-Time Equivalency (FTE), faculty FTE, faculty full-time headcount in objects 01 and 02, and the number of regular object 01 faculty positions (vacant and filled) for FY 2008 through FY 2011. FY 2012 is estimated.
1,610.4 1,727.5 1,759.0 1,786.9 1,810.5
1,033.0 1,111.0
1,149.0 1,165.0 1,165.0
728.0 788.0 822.0 849.0 849.0
657.0 648.0 680.0 682.0 706.0
0.0
200.0
400.0
600.0
800.0
1,000.0
1,200.0
1,400.0
1,600.0
1,800.0
2,000.0
FY2008 FY2009 FY2010 FY2011 FY2012
TU Student/ Faculty Comparison History
TU FTE Student
TU FTE Faculty
HC FT Faculty Obj 01-‐02
Regular Faculty PosiJons
FTE Student to FTE Faculty ratio
15.6:1 15.5:1 15.3:1 15.3:1 15.5:1
FTE Student to regular Faculty ratio
25:1 27:1 26:1 26:1 26:1
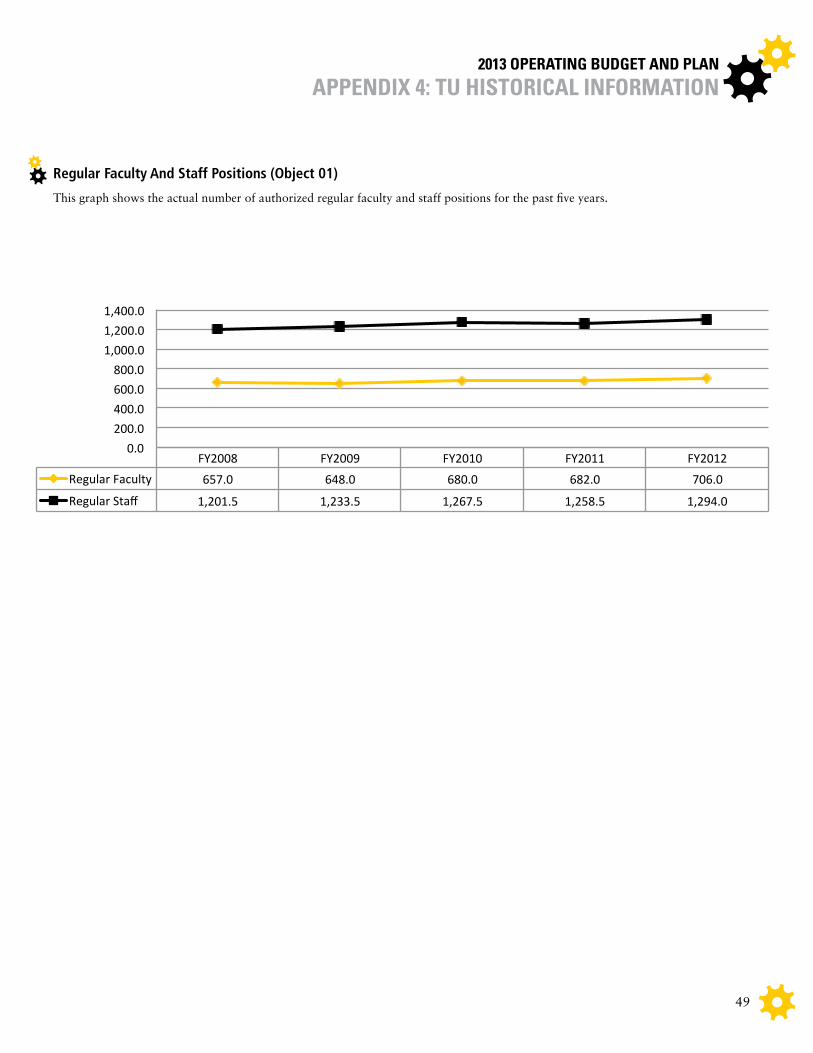
2013 operating budget and plan
49
FY2008 FY2009 FY2010 FY2011 FY2012 Regular Faculty 657.0 648.0 680.0 682.0 706.0
Regular Staff 1,201.5 1,233.5 1,267.5 1,258.5 1,294.0
0.0 200.0 400.0 600.0 800.0
1,000.0 1,200.0 1,400.0
Regular Faculty and Staff Posi5ons (Object 01)
appendiX 4: tu Historical information
regular Faculty And Staff positions (Object 01)
This graph shows the actual number of authorized regular faculty and staff positions for the past five years.
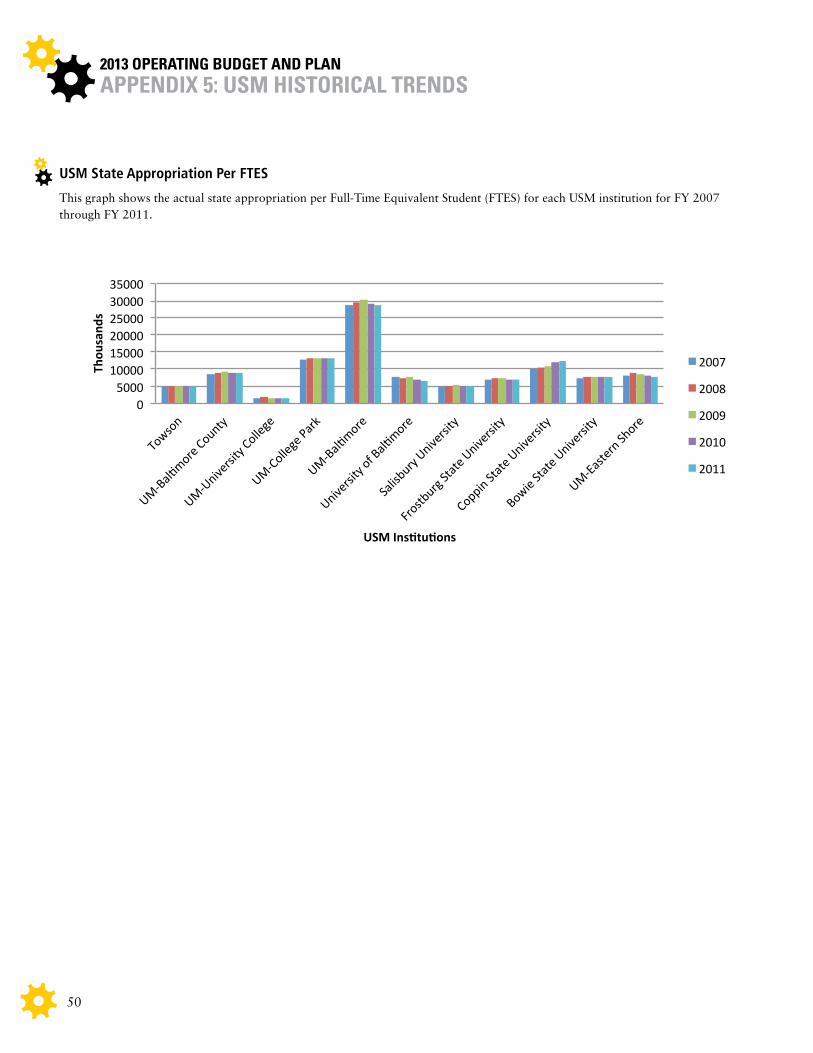
2013 operating budget and plan
50
0 5000
10000 15000 20000 25000 30000 35000
Towson
UM-‐Ba
l2more
County
UM-‐University Co
llege
UM-‐Co
llege Park
UM-‐Ba
l2more
University of Bal2m
ore
Salisb
ury Un
iversity
Frostburg
State
University
Coppin State University
Bowie State U
niversity
UM-‐Eastern Shore
Thou
sand
s
USM Ins.tu.ons
State Appropria.ons per FTES
2007
2008
2009
2010
2011
appendiX 5: usm Historical trends
USM State Appropriation per FTES
This graph shows the actual state appropriation per Full-Time Equivalent Student (FTES) for each USM institution for FY 2007 through FY 2011.

2013 operating budget and plan
51
0 5000
10000 15000 20000 25000 30000 35000
Towson
UM-‐Ba
l2more
County
UM-‐University Co
llege
UM-‐Co
llege Park
UM-‐Ba
l2more
University of Bal2m
ore
Salisb
ury Un
iversity
Frostburg
State
University
Coppin State University
Bowie State U
niversity
UM-‐Eastern Shore
Thou
sand
s
USM Ins.tu.ons
FTE Students
2007
2008
2009
2010
2011
appendiX 5: usm Historical trends
USM FTE Students
This graph shows the actual Full-Time Equivalent Student (FTES) for each USM institution for FY 2007 through FY 2011.
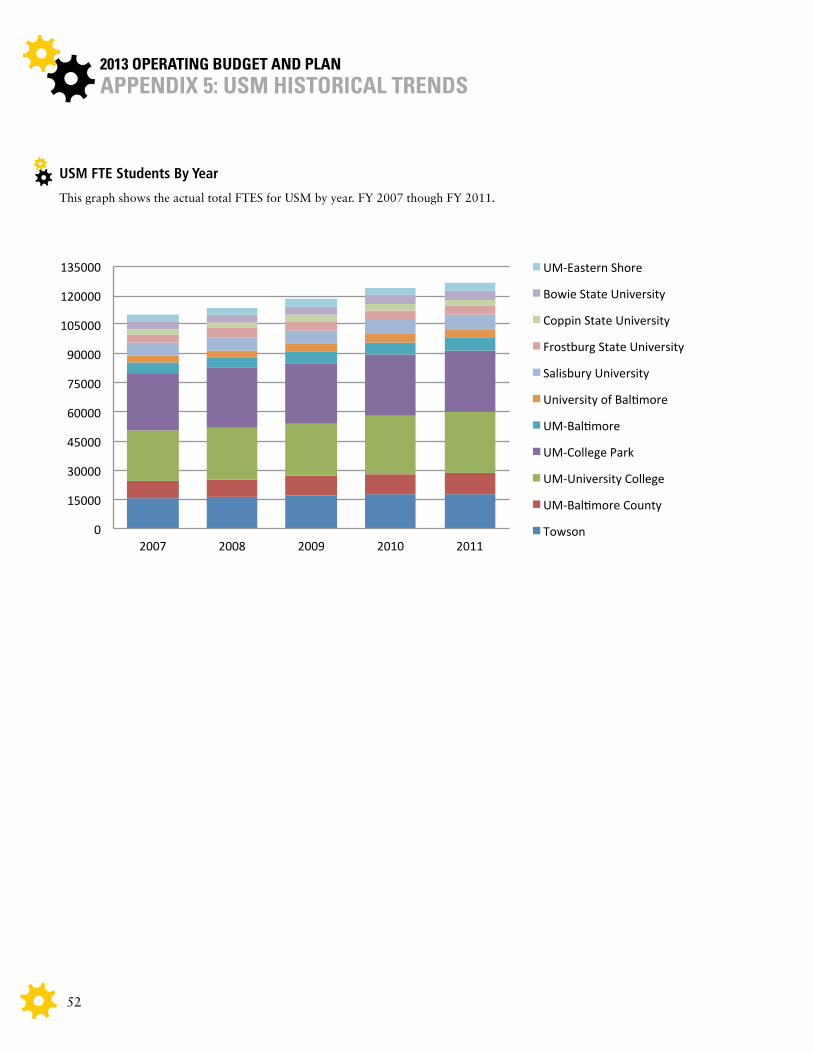
2013 operating budget and plan
52
appendiX 5: usm Historical trends
USM FTE Students By Year
This graph shows the actual total FTES for USM by year. FY 2007 though FY 2011.
0
15000
30000
45000
60000
75000
90000
105000
120000
135000
2007 2008 2009 2010 2011
FTE Students UM-‐Eastern Shore
Bowie State University
Coppin State University
Frostburg State University
Salisbury University
University of BalFmore
UM-‐BalFmore
UM-‐College Park
UM-‐University College
UM-‐BalFmore County
Towson

2013 operating budget and plan
53
glossarY
Academic Support:Includes activities conducted to provide support services to the institution’s primary missions: instruction, research and public service. It includes the retention, preservation and display of educational materials, such as libraries; the provision of services that directly assist the academic functions of the institution; media such as audio-visual services and technology such as computing support, academic administration (including academic deans but not chairpersons) and personnel development providing administration support and management direction to the three primary missions (instruction, research and public service).
AiT:Applied Information Technology
Appropriation:An expenditure authorization with specific limitations as to amount, purpose and time; a formal advance approval of expenditure from designated resources available or estimated to be available.
Auxiliary Enterprises:Activities within the university that furnish goods or services to students, faculty, or staff, and charge a fee directly related to, although not necessarily equal to, the cost of the goods or services. Auxiliary Enterprises are essentially self-supporting activities. The general public may be served incidentally by Auxiliary Enterprises.
Capital Budget:Generally covers expenditures for the construction or renovation of major facilities.
COlA:Cost of Living Adjustment
Contingent Salaries, Wages and Fringe Benefits:Employees not in a State PIN (Position Identification Number) and hired on a contractual or temporary basis. All expenses associated with the temporary employee’s income are included in this grouping.
CS–hCM:Campus Solutions– Human Capital Management
Current Funds:Economic resources, expendable and set aside by the institution for carrying out the primary purposes of the institution, to be expended in the near term and used for operating purposes.
dBM:Department of Budget and Management
Education and general Self-Support:See “Sales and Services of Educational Activities”
Education and general State-Assisted:Education and General (E&G) expenses are recorded for all expenses that are not for Auxiliary Enterprises. They are normally categorized as instruction, research, public service, academic support, student services, institutional support, operation and maintenance of plant, and scholarships and fellowships.
Endowment Funds:Funds, the principle of which a donor or other outside agency has stipulated, as a condition of the gift, remain intact (nonexpendable) in perpetuity, and that only the income from the investment of the fund may be expended.
Endowment income:Yield, usually in the form of interest or dividends, which occurs as a result of investing the principal of an endowment fund. Capital gains and losses are not part of endowment income.
Fiscal Year:The period used by the state for budgeting and account purposes. It begins July 1 and runs through June 30 the following calendar year.
Full-Time Equivalent (FTE):A means for expressing part-time students or faculty as a full-time unit. The formula is generally based on credit hours. Example: An institution may define full-time as being twelve credit hours; a student taking three credit hours would then be equal to .25 FTE.
Fund Balance:The difference between actual revenue and actual expenditures.
Furlough:Furlough is the term used when employees are placed in a temporary non-duty, non-pay status for required budgetary reasons.
grants and Contracts:Revenues from governmental agencies (Federal, State, or Local) received or made available from grants, contracts and cooperative agreements that are not considered contributions.
gross Square Feet (gSF):Unit of measurement of a building from outside its exterior walls. This is the standard used throughout the construction industry.

2013 operating budget and plan
54
glossarY
hEiF: Higher Education Investment Fund
indirect Cost Assessment (idC):An assessment charged to non-state and auxiliary enterprises activities to recover the cost of providing services that are not a direct-billed service (e.g., payroll processing).
iAr:Innovation and Applied Research
institutional Support:Includes expenses for central executive level activities concerned with management and long-range planning for the entire institution. It includes executive management, fiscal operations, general administration and logistical services, public relations and development, and administrative computing support.
instruction:Includes activities that are part of the institution’s instructional program. Expenses for credit and noncredit courses; remedial and tutorial instruction, and regular, special, and extension sessions are included.
investment income:Interest revenue earned on cash balances as allocated by the Comptroller of the State of Maryland.
liMS:Library Information Management System
lgBT:Lesbian, Gay, Bisexual, Transgender
Mandatory Transfers:Transfers arising out of (1) binding legal agreements related to the financing of the educational plant such as amount for debt retirement, interest and required provisions for renewals and replacement of plant, not financed from other sources, and (2) grant agreements with agencies of the federal government, donors and other organizations to match gifts and grants to loan funds.
Miscellaneous Sources:All sources of current funds revenue not included in other classifications.
non-Mandatory Transfers:Transfers that serve a variety of objectives such as moving monies generated through auxiliary enterprises to scholarship funds for use in providing scholarships, or to a capital outlay group for use in providing project funding.
Operating Budget:Generally includes all of the regular unrestricted income available to the institution plus those restricted funds that are earmarked for instructional activities and department support. Activities included in the operating budget are the basic expenses of departments, schools, and colleges, including personnel and day-to-day operating costs; student services; libraries; administration; campus operations and maintenance; development; and the unrestricted portion of endowment income, gifts and student aid.
Operation and Maintenance of physical plant:Activities related to the operation and maintenance of the physical plant, including all operations established to provide services and maintenance related to campus grounds and facilities, utilities and property insurance.
permanent Salaries, Wages and Fringe Benefits:Employees in a state authorized position (SAP) and hired on a permanent basis. All expenses associated with the permanent employee’s income are included in this grouping. private gifts and grants: Revenues generated from individuals and non-governmental sources. Includes revenue received from private donors for which no legal consideration is involved.
public Service:Includes activities established primarily to provide non-instructional services beneficial to individuals and groups external to the institution. These activities include community service programs and cooperative extension services. Included in this category are conferences, institutes, general advisory services, reference bureaus, radio and television, consulting, and similar non-instructional services to particular sectors of the community.
Quasi-Endowment Funds:Funds, functioning as an endowment, that are unrestricted resources. The decision to invest otherwise spendable resources is made by the institution’s governing board or management. These internal designations can be reversed.
research:Includes activities specifically organized to produce research, whether commis¬sioned by an agency external to the institution or separately budgeted by an organizational unit within the institution. Included in this category are expenses for individual and/or project research as well as that of institutes and research centers.

2013 operating budget and plan
55
restricted Budget:Encompass governmentally sponsored research grants and contracts, nongovernmental grants, certain endowment and gift income, and student aid from external sources.
restricted Funds:Funds limited to a specific use by outside agencies or persons, as distinguished from funds over which the institution has complete control and freedom as to use. Restricted funds have an externally estab-lished limitation or stipulation placed on their use.
rpAC: Resource Planning and Advisory Committee
Sales and Service of Auxiliary Enterprises:See “Auxiliary Enterprises.”
Sales and Services of Educational Activities:Revenues that are related incidentally to the conduct of instruction, research, and public service and revenues of activities that exist to provide instructional and laboratory experience for students and that incidentally create goods and services that may be sold to students, faculty, staff and the general public.
Scholarships and Fellowships:Expenses for student awards in the form of scholarships, tuition remission or graduate assistantships.
State Appropriations:Unrestricted revenue received for current operations from, or made available to the institution by, legislative acts or the local taxing authority (the State of Maryland). This category does not include government grants and contracts. Also referred to as general funds.
State Authorized position: Regular employee hired on a permanent basis. Formerly known as a position identification number, or PIN.
State Funded Capital projects:State funded capital projects are those financed from general funds allocated from the State of Maryland budget to individual institutions. These funds are not required to be repaid to the state by the university. Projects eligible for funding from the state include academic and academic support buildings, including administration buildings, infrastructure and utility improvements.
STEM: Science, Technology, Engineering, and Mathematics
Student Services:Includes activities for offices of admissions and enrollment services and activities with the primary purpose of contributing to students’ emotional and physical well-being and intellectual, cultural and social development outside the context of the formal instructional program. Included in this category are expenses for student activities, cultural events, intramural athletics, student organizations, counseling and career guidance, student aid administration, and offices of enrollment management and student health services.
System Funded Capital projects:System funded capital projects are financed through the sale of auxiliary bonds by USM. The debt service of these bonds, typically a 20 year amortization period, is paid for by the institution through auxiliary revenue sources, including student fees. Projects that are eligible for funding through this financing method include dining halls, student unions, recreation facilities, parking facilities and the renovation of residence halls.
Tln:Towson Learning Network
Tuition and Fees:Includes all tuition and fees assessed (net of refunds and discounts) for educational purposes.
USM:University System of Maryland
Unrestricted Funds:Resources provided to the institution with no restrictions on their use.
vacant position Attrition Earnings:The Executive and Legislative Branches of the Government require agencies to budget for less than 100% employment levels. Generally, the expectation of vacant positions is between 2% and 4% percent.
glossarY

2013 operating budget and plan
56
acknowledgements
ExECUTivE STAFF
Maravene Loeschke, President
Mark E. Behm, Interim Vice President for Administration and Finance and Chief Fiscal Officer
James E. DiLisio, Interim Provost and Vice President for Academic Affairs
Debra Moriarty, Vice President for Student Affairs
Gary N. Rubin, Vice President for University Advancement
Dyan Brasington, Vice President for Innovation and Applied Research
UnivErSiTY BUdgET OFFiCE
The creation of the 2013 Operating Budget and Plan would not have been possible without the hard work and dedication of the University Budget Office staff who develop, monitor and analyze the complex, multi-million dollar budget of this institution.
Cathy Mattingly, Director, University Budget Office
Brian O’Connell, Associate Director, University Budget Office
Donna M. Auvil, University Budget Coordinator
Dorothy Proctor, University Budget Coordinator
Angela Hall, University Budget Coordinator
Deanna Martinez, Financial Transaction Supervisor, University Budget Office
rESOUrCE plAnning And AdviSOrY COMMiTTEE
The Resource Planning and Advisory Committee (RPAC) is the University Senate’s representative voice in Towson University’s annual resource planning process. The committee supports the university in a consultative manner by reviewing, advising and recommending on the following:
•annualfundingpriorities•annualtuitionandfees•amendmentsformodificationstothe
ten-year capital plan•changestofiscalpoliciesofthe
university• fundingprioritiesintheeventofa
financial crisis
The RPAC representatives involved in developing Towson University’s FY 2013 Operating Budget are listed below in alphabetical order:
Mark Behm, Administration and Finance (ex-officio, non-voting)
Terry Berkeley, College of Education
Naomi Brioche, Graduate Student Association
Elizabeth Carbone, University Advancement
Diana Emanuel, College of Health Professions
Daniel Ettinger, College of Fine Arts and Communication
Jennifer Gajewski, President’s Office (ex-officio, non-voting)
Gail Gasparich, (NCAA faculty representative)
Shana Gass, Cook Library
Donald Kopka, College of Business and Economics
Bonnie Lingelbach, Student Affairs
Eric Martinez, TUSC (ex-officio)
Christina Morgan, Innovation and Applied Research
Joseph Oster, Auxiliary Services
Douglas Pryor, AAUP (ex-officio)
Matt Sikorski, Student Government Association
Tim Sullivan, University Senate (ex-officio)
Virginia Thompson, College of Liberal Arts
David Vanko, Fisher College of Science and Mathematics
Marcia Welsh, Academic Affairs (ex-officio, non-voting)
Jay Zimmerman, Fisher College of Science and Mathematics
EdiTOriAl And dESign
Eric Martinez, Divisional Communications Specialist, Administration and Finance
Eric VanLieshout, Communications Assistant, Administration and Finance
Lauren Palumbo, Student Graphic Designer, Design Center
Megan Mancuso, Student Graphic Designer, Design Center


Top Related