


Languages
Pages
Legal


2007 annual
report
WWW.VU.EDU.AU
Letter of transmittaL 3
message from the ChanCeLLor 4
viCtora university’s viCe-ChanCeLLor 5
Key aChievements in 2007 6
eduCation and researCh struCture 7
COUNCIL STRUCTURE AND MEMBERS 8
Learning and teaChing statistiCs 10
staffing statistiCs 23
oCCupationaL heaLth and safety 25
fees and Charges 27
statement on risK management 29
reporting on university assoCiates and CommerCiaL ventures 30
expenditure of ConsuLtants 31
WhistLebLoWers’ proteCtion proCedures 32
CounCiL and Committees attendanCe 33
university reguLations 34
freedom of information reporting 36
additionaL CompLianCe disCLosures 38
• Compliance with National Governance Protocols 38
• Statement of compliance with the building and 38 maintenance provisions of the Building Act 1993
• Summary of environmental performance 38
• Grievance and complaint procedures for students and staff 38
• 2007 student complaints summary 39
• National competition policy 39
• Statement of compliance with ESOS Act 39
• Indemnity of Council members 39
• Indemnity of senior officers 40
• Declarations of interest by Council members 40
• Key Performance Indicators 41 – Strategic Plan KPIs 41 – TAFE KPIs 41 – Auditor General’s Report on TAFE Statement of Performance 44 Management Certificate
– TAFE Statement of Performance Management Certificate 45
finanCiaL overvieW 2007 46
viCtoria university and subsidiaries – five-year finanCiaL summary 48
2007 finanCiaL statements index 49
auditor-generaL’s report 50
finanCiaL statements 2007 52
statement by the prinCipaL aCCounting offiCer 52
statement by the ChanCeLLor and the viCe-ChanCeLLor and president 53
report by the members of CounCiL 54
• Income statement 55
• Balance sheet 56
• Statement changes in equity 57
• Cash flow statement 58
• Notes to the financial statements 59
CompLianCe index of disCLosure requirements 2007 101
contents
NOTE: Victoria University’s 2007 Achievements Annual Report is a companion to Victoria University’s 2007 Annual Report Cd. Together, these publications contain all disclosures within the State Government of Victoria’s 2007 annual reporting compliance requirements.

3
3
letter oftransmittal
20 March 2008
The Hon. Jacinta AllanMinister for Skills and Workforce ParticipationLevel 36121 Exhibition StreetMelbourne VIC 3000
Dear Minister,
I have pleasure in presenting to you, on behalf of the Council of Victoria University, the Annual Report for 2007.
After approving the substantive content of the report at its meeting on 25 February 2008, Council delegated to the Chancellor the power to finally approve the Annual Report on its behalf, after endorsement of the Annual Financial Accounts by the Council’s Audit and Risk Committee. I have therefore approved the report as of 20 March 2008.
The Hon. Justice Frank Vincent AO QCChancellor
Professor E HarmanVice-Chancellor and President

54
This has been an extremely productive year for Victoria University with significant benefits being achieved for its staff, its students and members of the broader community as the University continued to extend its positive influence beyond the borders of its sites and campuses and we began the process of implementing the changes outlined in the Making VU A New School of Thought program.
Our emphasis on integrating teaching and learning with industry and community objectives is now being widely recognised. The Business Higher Education Roundtable announced VU as having the Best Community Engagement Collaboration program, for the University’s work in bringing together community and government partners to support newly-arrived African refugees to the west of Melbourne. The University also received funding from the Federal Department of Education, Science and Training for the Partnership Outreach Education Model (POEM) Program, which provides disadvantaged young people with learning opportunities through flexible, accredited education and training options in supported community settings.
Victoria University continued to make significant contributions to the infrastructure of Melbourne’s western region through a series of investments in new facilities. Approximately $80 million in projects approved by VU’s Council are currently in design or construction.
We maintained our commitment to improving facilities for staff and students in 2007, with work upon new Learning Commons now completed at Werribee, City Flinders and St Albans Campuses.
Our students are responding to the positive changes that are becoming increasingly visible across all areas of our operations. The most recent graduates of VU’s vocational education (TAFE) programs recorded a 90 per cent satisfaction rate with the quality of their training, rating VU TAFE above both the Victorian and national averages, according to the TAFE Selected Measures published in 2007. The Hair and Beauty Association of Victoria named Victoria University ‘Educator of the Year’ after four VU students won their respective categories. Multimedia student achievement was particularly well recognised in 2007 with VU graduate Nino Aniceto winning the Best Student Developed Content category in the 2007 Australian Interactive Media Industry Association (AIMIA) Awards;
multimedia student, Karl Ervine, won an Australian Teachers of Media (ATOM) award, a competition where VU students occupied all three finalist spots in the Best Tertiary Multimedia category.
Victoria University staff maintained the University’s reputation as a vibrant academic institution. Multimedia program manager Mark O’Rourke was awarded a 2007 Fulbright Professional Scholarship in Vocational and Technical Education, and seven VU academics shared in three of the prestigious 2007 Carrick Institute Citations for Outstanding Contributions to Student Learning.
Environmental initiatives were again a priority for the University in 2007. Some of the key environmental projects included:
• participating in research to develop the next generation of membrane technology to deliver Australia a safe and sustainable water resource;
• focusing on innovative research programs and demonstration sites for water conservation, including collaborations with the Werribee Centre for Sustainable Water Use and Western Water; and
• maintaining the University’s $15 million investment in Priority Research and Innovation Projects, with a key focus on sustainable water use.
In 2007, the Council continued to emphasise and promote a sustainable financial future, again achieving a budget surplus.
On behalf of the Council, I take this opportunity to thank the Vice-Chancellor, Professor Elizabeth Harman, whose leadership and tireless pursuit of the University’s goals are reflected in Victoria University’s significant achievements in 2007.
The Hon. Justice Frank Vincent AO QCChancellor
message from the chancellor
5
Professor Elizabeth Harman is the Vice-Chancellor and President of Victoria University. In 2007, the Vice-Chancellor oversaw a series of new expansion initiatives that moved the University towards its long-term objectives. These include:
• the creation of two new vocational education faculties: Workforce Development; and Technical and Trade Innovation; and the establishment of a college of further education, VU College;
• formalising our understanding with the University of Texas El Paso to enable combined activities around our mutual interests in access, research, and regional economic and social engagement;
• the strengthening of external relationships with community, industry and professional groups both locally and abroad; and
• a successful external audit of the University undertaken by the Australian Universities Quality Agency.
victoria university’svice-chancellor

76
key achievements in 2007stuDents• The Faculty of Business and Law established innovative teaching practices centred on a
‘finance hub’ at City Flinders Campus
• Twenty-one VU-trained teachers were among the first in the Victorian Government’s Career Change Program, developed to help meet the state’s teacher shortage
• VU won a three-star award from the Institute of Trades Skills Excellence, which identifies VU as among the best training providers in Australia
• VU presented 11,793 awards – 5363 in higher education, and 6430 in TAFE. Sixty-six students received doctorates – 53 at PhD level
staff• More than 80% of staff are participating in individual Staff Performance and
Development Plans – the plan was commended by the Australian University Quality Agency
• VU’s TAFE Change Plan led to structural changes that underpin the repositioning of its vocational education provision
• The VU College Change Plan increased VU’s emphasis on providing access, preparation, transition and learning support for students
• Staff and students were encouraged to embrace diversity with the development of Web CT resources on Indigenous culture, spiritual values and history
• The importance of work/life balance for staff was enhanced with the implementation of an innovative Wellness Strategy through the support of a VU Wellness Partnership
community• The Business Higher Education Roundtable announced VU as having the Best
Community Engagement Collaboration program
• VU’s Office of Industry and Community Engagement developed a community engagement database to assist VU staff in the organisation of community events
• VU’s participation in the Women’s Health Network in the West helped ensure that women have access to health information not locally available
• With funding by Multimedia Victoria, computer science and maths students were placed in businesses to assist the development of new computer systems to improve business processes
inDustry anD professions• Participation in the Advanced Membrane Technologies Research Cluster to develop a
safe, sustainable and energy-efficient water resource
• VU’s Centre for Strategic Economic Studies is investigating the economics of the pharmaceutical industry, both globally and within Australia
• Sleep research produced findings that are likely to result in the development of more effective fire alarms in homes
• Further development of the Western Bulldogs partnership included the development of two sports performance research scholarships worth $25,000
governments anD the public• Development of the new University Strategic Plan, Making VU 2016: A Statement of
Purpose
• Creation of the new vocational education and further education faculties
• Education and Research Board review
• Agreement by Council to the development of a Community Engagement Policy to guide practice
• Greater emphasis on the key drivers for long-term sustainability
• Improvements in the Risk Management Framework

7
eDucation anD researchstructure
deputy viCe-ChanCeLLor (RESEARCH AND REGION)
senior deputy viCe-ChanCeLLor (EDUCATION PROGRAMS)
senior deputy viCe-ChanCeLLor (EDUCATION SERVICES)
exeCutive deans
dean vu CoLLege
exeCutive direCtors
FACULTY OF ARTS, eduCation and human deveLopment
faCuLty of business and LaW
FACULTY OF HEALTH, engineering and sCienCe
faCuLty of WorKforCe deveLopment
faCuLty of teChniCaL and trades innovation
EDUCATION AND RESEARCH B0ARD
COUNCIL
viCe–ChanCeLLor
and president

8 9
councilstructure andmembers
AUDIT AND RISK COMMITTEECOUNCIL
EDUCATION AND RESEARCH BOARD
CHANCELLOR’S COMMITTEE
NOMINATIONS COMMITTEE
REMUNERATION COMMITTEE
RESOURCES COMMITTEE
STRATEGY COMMITTEE
council members
PERSONAL DETAILS CATEGORY OF PROFESSION/MEMBER OF FIRST APPOINTED MOST RECENT MEMBERSHIP OTHER BOARDS TO COUNCIL APPOINTMENT
The Hon. Mr Justice Frank Vincent, AO QC Chancellor Supreme Court Judge, Court of Appeal, 01.01.01 01.01.07 Supreme Court of Victoria
Commissioner Dianne Foggo Appointed by Council Deputy Chancellor, Commissioner, 01.01.99 01.01.05 DipTching, DipPhysEd, GradDipMulticulturalEdMelb Australian Industrial Relations Commission
Professor Elizabeth Harman Ex Officio Vice-Chancellor, President, Victoria University 01.10.03 25.06.07 BA, MAAuck, PhDMcM, FIPAA
Ms Trish McCluskey BAEd Auck Ex Officio Chair, Education and Research Board 01.12.05 13.12.06
Associate Professor Michael Hamel-Green Ex Officio Deputy Chair, Education and Research Board 01.12.05 13.12.06 baMelb, MAMelb, PhDLa Trobe
Associate Professor Mark Minchinton baMonash, PhDMelb Ex Officio Acting Deputy Chair, Education and Research Board 12 06 07 30 11 07
Mr Michael Zaar Elected by staff (general) Student Administration 01.01.06 01.01.06
Mr Kevin Baker Elected by staff (TAFE) Information Technology Department 26.10.06 26.10.06 BScMelb, DipEdMelbStateColl, GradDipEdTech, GradDipComStudMelb
8 9
PERSONAL DETAILS CATEGORY OF PROFESSION/MEMBER OF FIRST APPOINTED MOST RECENT MEMBERSHIP OTHER BOARDS TO COUNCIL APPOINTMENT
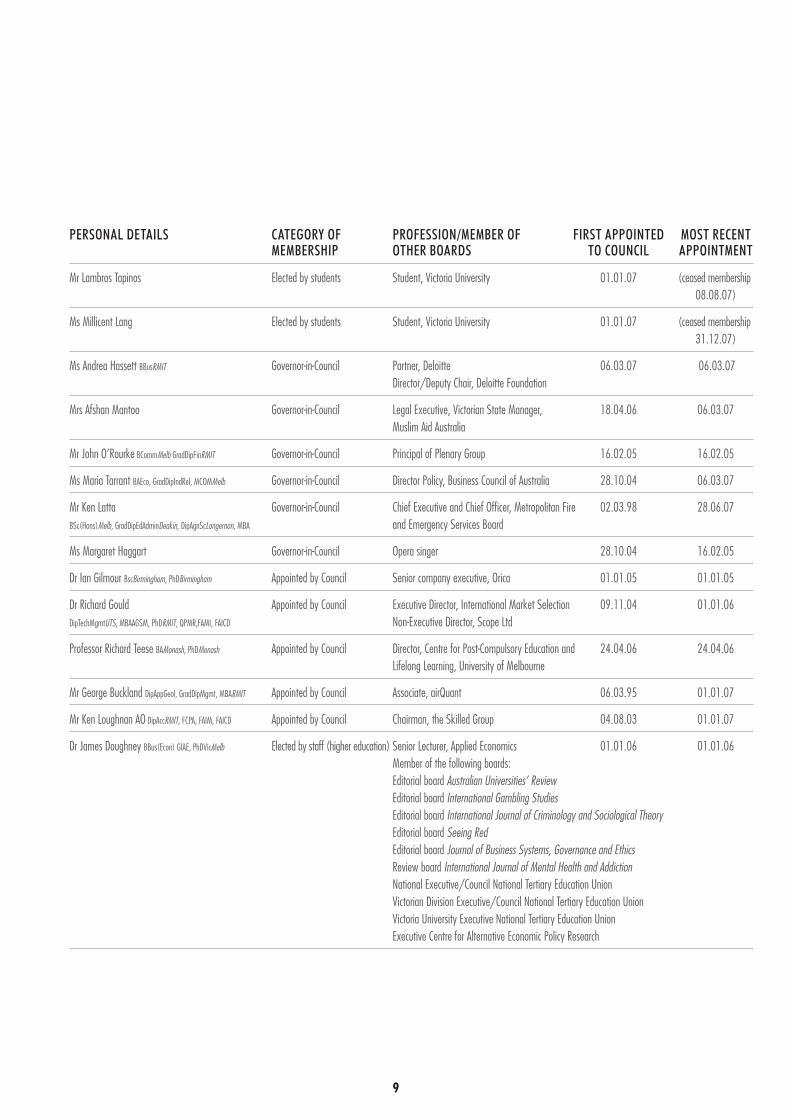
Mr Lambros Tapinos Elected by students Student, Victoria University 01.01.07 (ceased membership 08.08.07)
Ms Millicent Lang Elected by students Student, Victoria University 01.01.07 (ceased membership 31.12.07)
Ms Andrea Hassett BBusRMIT Governor-in-Council Partner, Deloitte 06.03.07 06.03.07 Director/Deputy Chair, Deloitte Foundation
Mrs Afshan Mantoo Governor-in-Council Legal Executive, Victorian State Manager, 18.04.06 06.03.07 Muslim Aid Australia
Mr John O’Rourke BCommMelb GradDipFinRMIT Governor-in-Council Principal of Plenary Group 16.02.05 16.02.05
Ms Maria Tarrant BAEco, GradDipIndRel, MCOMMelb Governor-in-Council Director Policy, Business Council of Australia 28.10.04 06.03.07
Mr Ken Latta Governor-in-Council Chief Executive and Chief Officer, Metropolitan Fire 02.03.98 28.06.07 BSc(Hons)Melb, GradDipEdAdminDeakin, DipAgnScLongernon, MBA and Emergency Services Board
Ms Margaret Haggart Governor-in-Council Opera singer 28.10.04 16.02.05
Dr Ian Gilmour BscBirmingham, PhDBirmingham Appointed by Council Senior company executive, Orica 01.01.05 01.01.05
Dr Richard Gould Appointed by Council Executive Director, International Market Selection 09.11.04 01.01.06 DipTechMgmtUTS, MBAAGSM, PhDRMIT, QPMR,FAMI, FAICD Non-Executive Director, Scope Ltd
Professor Richard Teese baMonash, PhDMonash Appointed by Council Director, Centre for Post-Compulsory Education and 24.04.06 24.04.06 Lifelong Learning, University of Melbourne
Mr George Buckland DipAppGeol, GradDipMgmt, MBARMIT Appointed by Council Associate, airQuant 06.03.95 01.01.07
Mr Ken Loughnan AO DipAccRMIT, FCPA, FAIM, FAICD Appointed by Council Chairman, the Skilled Group 04.08.03 01.01.07
Dr James Doughney BBus(Econ) GIAE, PhDVicMelb Elected by staff (higher education) Senior Lecturer, Applied Economics 01.01.06 01.01.06 Member of the following boards: Editorial board Australian Universities’ Review Editorial board International Gambling Studies Editorial board International Journal of Criminology and Sociological Theory Editorial board Seeing Red Editorial board Journal of Business Systems, Governance and Ethics Review board International Journal of Mental Health and Addiction National Executive/Council National Tertiary Education Union Victorian Division Executive/Council National Tertiary Education Union Victoria University Executive National Tertiary Education Union Executive Centre for Alternative Economic Policy Research
10
learning anDteachingstatistics
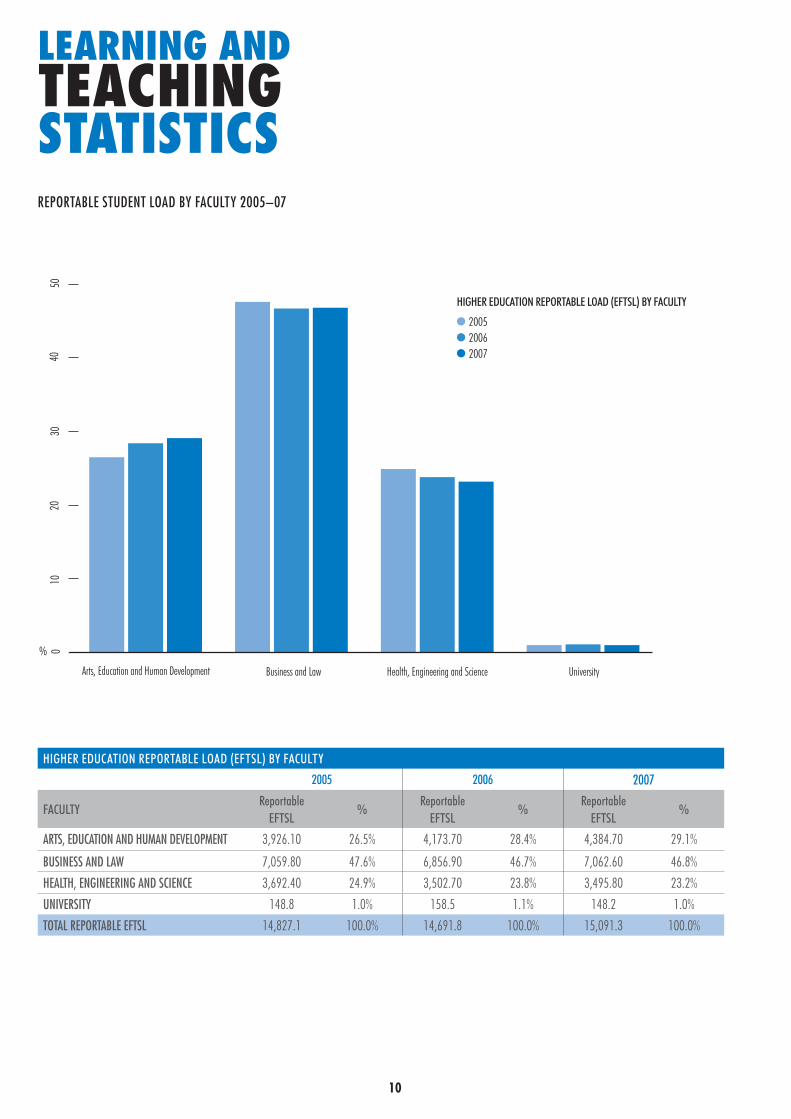
HIGHER EDUCATION REPORTABLE LOAD (EFTSL) BY FACULTY
2005 2006 2007
FACULTYReportable
EFTSL%
Reportable EFTSL
%Reportable
EFTSL%
ARTS, EDUCATION AND HUMAN DEVELOPMENT 3,926.10 26.5% 4,173.70 28.4% 4,384.70 29.1%
BUSINESS AND LAW 7,059.80 47.6% 6,856.90 46.7% 7,062.60 46.8%
HEALTH, ENGINEERING AND SCIENCE 3,692.40 24.9% 3,502.70 23.8% 3,495.80 23.2%
UNIVERSITY 148.8 1.0% 158.5 1.1% 148.2 1.0%
TOTAL REPORTABLE EFTSL 14,827.1 100.0% 14,691.8 100.0% 15,091.3 100.0%
010
2030
4050
Arts, Education and Human Development Business and Law Health, Engineering and Science University
HIGHER EDUCATION REPORTABLE LOAD (EFTSL) BY FACULTY
2005 2006 2007
%
REPORTABLE STUDENT LOAD BY FACULTY 2005–07
11
LEARNING AND TEACHING STATISTICS CONTINUED
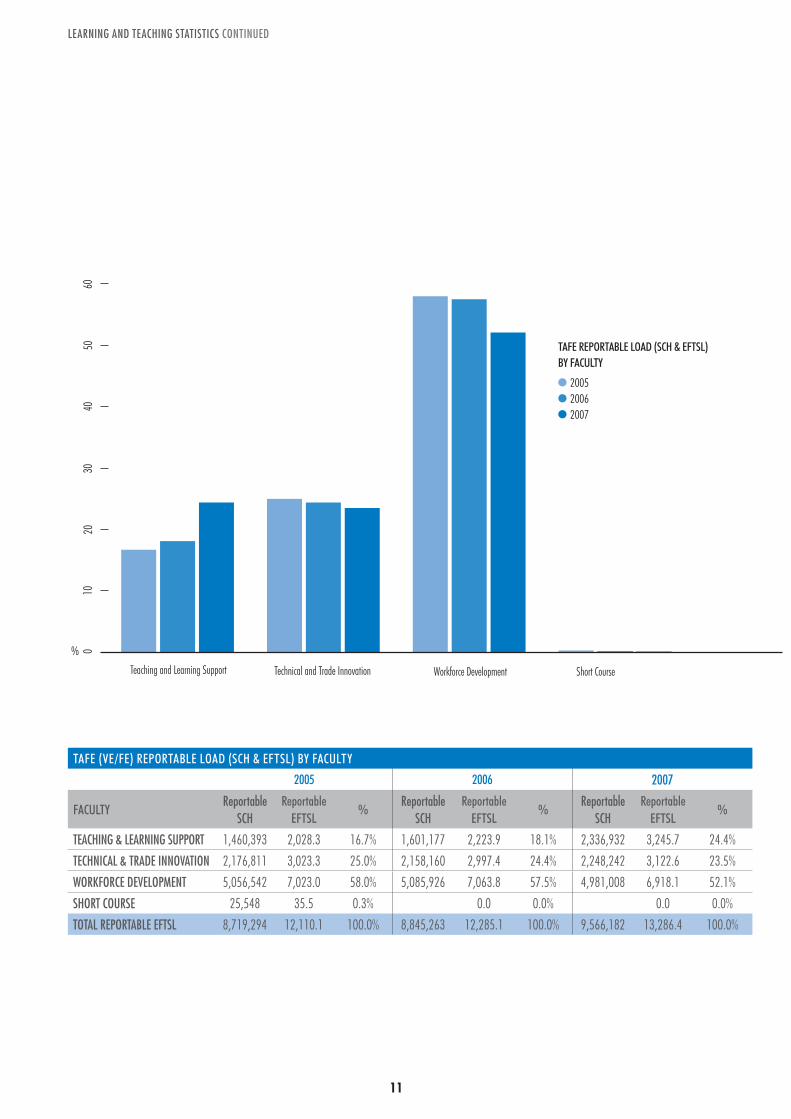
TAFE (VE/FE) REPORTABLE LOAD (SCH & EFTSL) BY FACULTY
2005 2006 2007
FACULTYReportable
SCHReportable
EFTSL%
Reportable SCH
Reportable EFTSL
%Reportable
SCHReportable
EFTSL%
TEACHING & LEARNING SUPPORT 1,460,393 2,028.3 16.7% 1,601,177 2,223.9 18.1% 2,336,932 3,245.7 24.4%
TECHNICAL & TRADE INNOVATION 2,176,811 3,023.3 25.0% 2,158,160 2,997.4 24.4% 2,248,242 3,122.6 23.5%
WORKFORCE DEVELOPMENT 5,056,542 7,023.0 58.0% 5,085,926 7,063.8 57.5% 4,981,008 6,918.1 52.1%
SHORT COURSE 25,548 35.5 0.3% 0.0 0.0% 0.0 0.0%
TOTAL REPORTABLE EFTSL 8,719,294 12,110.1 100.0% 8,845,263 12,285.1 100.0% 9,566,182 13,286.4 100.0%
010
2030
4050
60
Teaching and Learning Support Technical and Trade Innovation Workforce Development Short Course
TAFE REPORTABLE LOAD (SCH & EFTSL)BY FACULTY
2005 2006 2007
%
1312
0
3000
6000
9000
12000
15000
Higher education TAFE
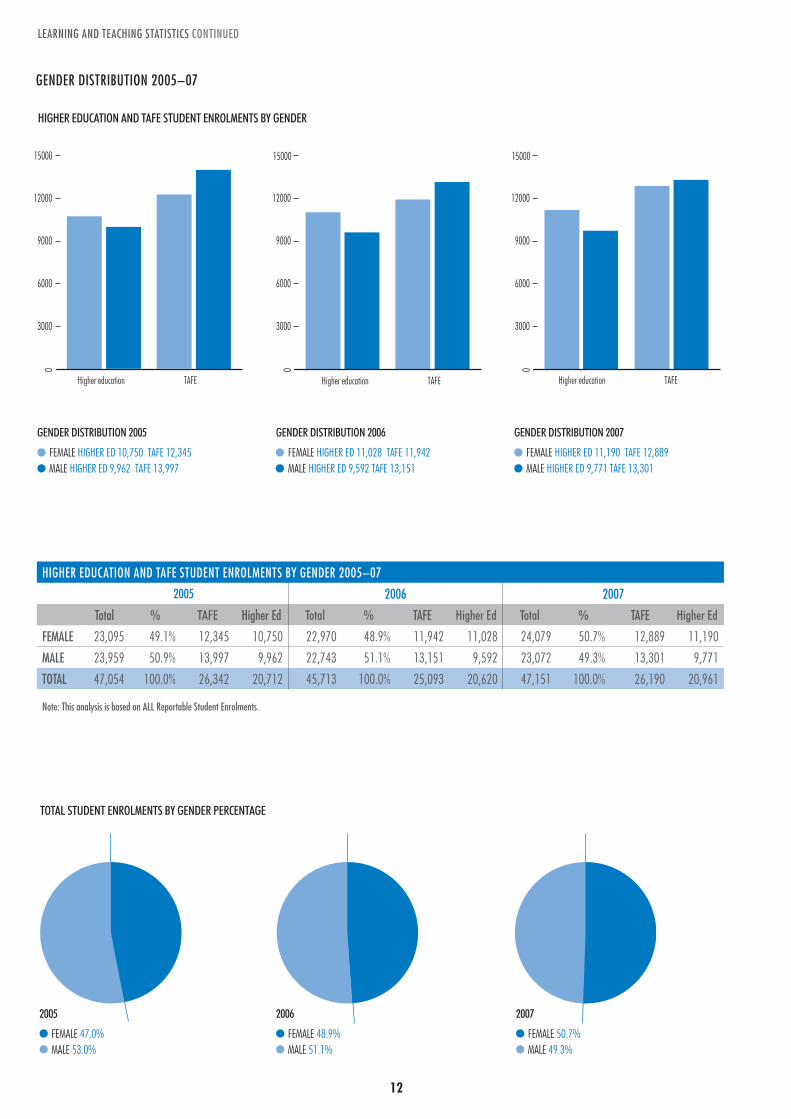
GENDER DISTRIBUTION 2005
FEMALE HIGHER ED 10,750 TAFE 12,345MALE HIGHER ED 9,962 TAFE 13,997
0
3000
6000
9000
12000
15000
GENDER DISTRIBUTION 2006
FEMALE HIGHER ED 11,028 TAFE 11,942MALE HIGHER ED 9,592 TAFE 13,151
0
3000
6000
9000
12000
15000
GENDER DISTRIBUTION 2007
FEMALE HIGHER ED 11,190 TAFE 12,889MALE HIGHER ED 9,771 TAFE 13,301
HIGHER EDUCATION AND TAFE STUDENT ENROLMENTS BY GENDER
Higher education TAFE Higher education TAFE
LEARNING AND TEACHING STATISTICS CONTINUED
GENDER DISTRIBUTION 2005–07
2005
FEMALE 47.0%MALE 53.0%
2006
FEMALE 48.9%MALE 51.1%
2007
FEMALE 50.7%MALE 49.3%
TOTAL STUDENT ENROLMENTS BY GENDER PERCENTAGE
HIGHER EDUCATION AND TAFE STUDENT ENROLMENTS BY GENDER 2005–07
2005 2006 2007
Total % TAFE Higher Ed Total % TAFE Higher Ed Total % TAFE Higher Ed
FEMALE 23,095 49.1% 12,345 10,750 22,970 48.9% 11,942 11,028 24,079 50.7% 12,889 11,190
MALE 23,959 50.9% 13,997 9,962 22,743 51.1% 13,151 9,592 23,072 49.3% 13,301 9,771
TOTAL 47,054 100.0% 26,342 20,712 45,713 100.0% 25,093 20,620 47,151 100.0% 26,190 20,961
Note: This analysis is based on ALL Reportable Student Enrolments.
13
0
10
20
30
40
50
60
70
80
GENDER DISTRIBUTION 2005
ABORIGINAL ORIGIN HIGHER ED 27 TAFE 67ABORIGINAL AND TORRES STRAIT ISLANDER HIGHER ED 1 TAFE 6TORRES STRAIT ISLANDER ORIGIN HIGHER ED 1 TAFE 2
0
20
40
60
80
100
GENDER DISTRIBUTION 2006
ABORIGINAL ORIGIN HIGHER ED 23 TAFE 87ABORIGINAL AND TORRES STRAIT ISLANDER HIGHER ED 0 TAFE 17TORRES STRAIT ISLANDER ORIGIN HIGHER ED 2 TAFE 7
0
20
40
60
80
100
GENDER DISTRIBUTION 2007
ABORIGINAL ORIGIN HIGHER ED 40 TAFE 98ABORIGINAL AND TORRES STRAIT ISLANDER HIGHER ED 1 TAFE 13TORRES STRAIT ISLANDER ORIGIN HIGHER ED 1 TAFE 18
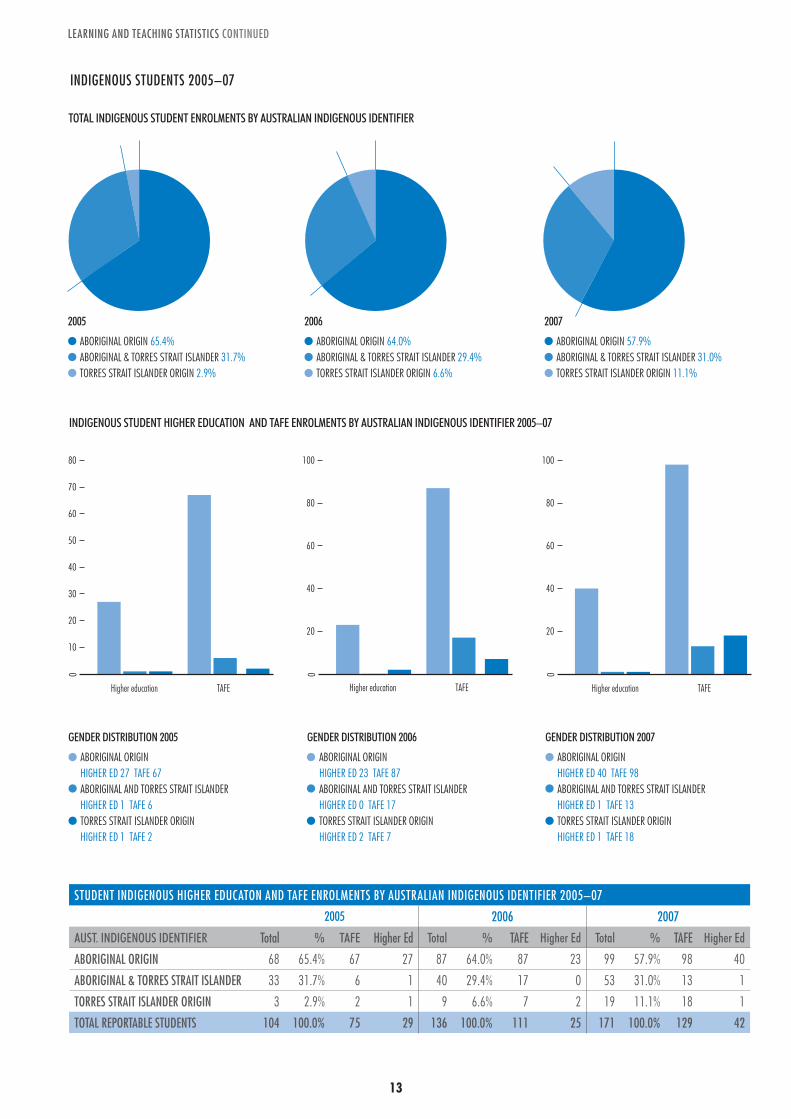
INDIGENOUS STUDENT HIGHER EDUCATION AND TAFE ENROLMENTS BY AUSTRALIAN INDIGENOUS IDENTIFIER 2005–07
Higher education TAFE Higher education TAFE Higher education TAFE
LEARNING AND TEACHING STATISTICS CONTINUED
2005
ABORIGINAL ORIGIN 65.4%ABORIGINAL & TORRES STRAIT ISLANDER 31.7%TORRES STRAIT ISLANDER ORIGIN 2.9%
2006
ABORIGINAL ORIGIN 64.0%ABORIGINAL & TORRES STRAIT ISLANDER 29.4%TORRES STRAIT ISLANDER ORIGIN 6.6%
2007
ABORIGINAL ORIGIN 57.9%ABORIGINAL & TORRES STRAIT ISLANDER 31.0%TORRES STRAIT ISLANDER ORIGIN 11.1%
TOTAL INDIGENOUS STUDENT ENROLMENTS BY AUSTRALIAN INDIGENOUS IDENTIFIER
STUDENT INDIGENOUS HIGHER EDUCATON AND TAFE ENROLMENTS BY AUSTRALIAN INDIGENOUS IDENTIFIER 2005–07
2005 2006 2007
AUST. INDIGENOUS IDENTIFIER Total % TAFE Higher Ed Total % TAFE Higher Ed Total % TAFE Higher Ed
ABORIGINAL ORIGIN 68 65.4% 67 27 87 64.0% 87 23 99 57.9% 98 40
ABORIGINAL & TORRES STRAIT ISLANDER 33 31.7% 6 1 40 29.4% 17 0 53 31.0% 13 1
TORRES STRAIT ISLANDER ORIGIN 3 2.9% 2 1 9 6.6% 7 2 19 11.1% 18 1
TOTAL REPORTABLE STUDENTS 104 100.0% 75 29 136 100.0% 111 25 171 100.0% 129 42
INDIGENOUS STUDENTS 2005–07
1514
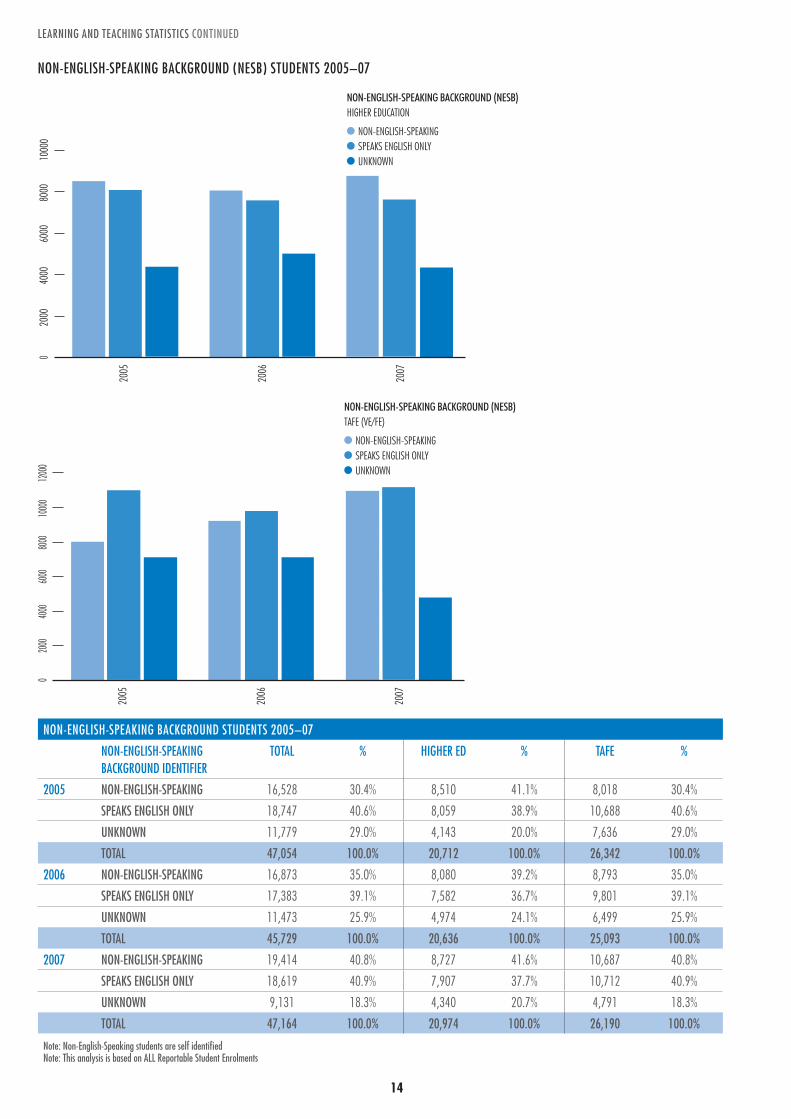
NON-ENGLISH-SPEAKING BACKGROUND (NESB) STUDENTS 2005–07
NON-ENGLISH-SPEAKING BACKGROUND STUDENTS 2005–07
NON-ENGLISH-SPEAKING BACKGROUND IDENTIFIER
TOTAL % HIGHER ED % TAFE %
2005 NON-ENGLISH-SPEAKING 16,528 30.4% 8,510 41.1% 8,018 30.4%
SPEAKS ENGLISH ONLY 18,747 40.6% 8,059 38.9% 10,688 40.6%
UNKNOWN 11,779 29.0% 4,143 20.0% 7,636 29.0%
TOTAL 47,054 100.0% 20,712 100.0% 26,342 100.0%
2006 NON-ENGLISH-SPEAKING 16,873 35.0% 8,080 39.2% 8,793 35.0%
SPEAKS ENGLISH ONLY 17,383 39.1% 7,582 36.7% 9,801 39.1%
UNKNOWN 11,473 25.9% 4,974 24.1% 6,499 25.9%
TOTAL 45,729 100.0% 20,636 100.0% 25,093 100.0%
2007 NON-ENGLISH-SPEAKING 19,414 40.8% 8,727 41.6% 10,687 40.8%
SPEAKS ENGLISH ONLY 18,619 40.9% 7,907 37.7% 10,712 40.9%
UNKNOWN 9,131 18.3% 4,340 20.7% 4,791 18.3%
TOTAL 47,164 100.0% 20,974 100.0% 26,190 100.0%
Note: Non-English-Speaking students are self identified Note: This analysis is based on ALL Reportable Student Enrolments
LEARNING AND TEACHING STATISTICS CONTINUED0
2000
4000
6000
8000
1000
0
2005
2006
2007
NON-ENGLISH-SPEAKING BACKGROUND (NESB) HIGHER EDUCATION
NON-ENGLISH-SPEAKING SPEAKS ENGLISH ONLYUNKNOWN
020
0040
0060
0080
0010
000
1200
0
NON-ENGLISH-SPEAKING BACKGROUND (NESB) TAFE (VE/FE)
NON-ENGLISH-SPEAKING SPEAKS ENGLISH ONLYUNKNOWN
2005
2006
2007

1514
POSTGRADUATE/UNDERGRADUATE ENROLMENTS 2005–07
2005 2006 2007
QUALIFICATION No % No % No %
POSTGRADUATE 5,286 9.8% 4,532 8.7% 4,527 8.4%
UNDERGRADUATE 48,472 90.2% 47,489 91.3% 49,131 91.6%
TOTAL 53,758 100.0% 52,021 100.0% 53,658 100.0%
Note: Enrolments include all TAFE (VE/FE) and higher education courses. Students may be undertaking more than one course within calendar year.
STUDENTS WITH A DISABILITY 2005–07
STUDENTS WITH DISABILITY
2005 2006 2007
HIGHER ED 321 350 405
TAFE 785 803 848
TOTAL 1,106 (2.4%) 1,153 (2.5%) 1,253 (2.7%)
Note: This analysis is based on ALL Reportable Student Enrolments. Note: Students with a disability are self identified.
2005
STUDENTS WITH A DISABILITY 2.4%
2006
STUDENTS WITH A DISABILITY 2.5%
2007
STUDENTS WITH A DISABILITY 2.7%
TOTAL STUDENT ENROLMENTS BY DISABILITY IDENTIFIER
2005
POSTGRADUATE 9.8%UNDERGRADUATE 90.2%
2006
POSTGRADUATE 8.7%UNDERGRADUATE 91.3%
2007
POSTGRADUATE 8.4%UNDERGRADUATE 91.6%
POSTGRADUATE/UNDERGRADUATE ENROLMENTS 2005–07 COURSE ENROLMENTS BY AUSTRALIAN QUALIFICATION LEVELS
LEARNING AND TEACHING STATISTICS CONTINUED

16 17
APPRENTICES/TRAINEES 2005–07
LEARNING AND TEACHING STATISTICS CONTINUED
2005
APPRENTICESHIP 68.1%TRAINEESHIP 31.9%
2006
APPRENTICESHIP 66.7%TRAINEESHIP 33.3%
2007
APPRENTICESHIP 65.2%TRAINEESHIP 34.8%
VOCATIONAL & FURTHER EDUCATION NUMBER OF REPORTABLE COURSE ENROLMENTS BY APPRENTICE/TRAINEEVOCATIONAL & FURTHER EDUCATION COURSE ENROLMENTS BY APPRENTICE/TRAINEE
TAFE (VE/FE) COURSE ENROLMENTS BY APPRENTICE/TRAINEE PROFILE
2005 2006 2007
TAFE APPRENTICE PROFILE No % No % No %
APPRENTICESHIP 2,698 68.1% 2,708 66.7% 2,615 65.2%
TRAINEESHIP 1,263 31.9% 1,355 33.3% 1,395 34.8%
TOTAL 3,961 100.0% 4,063 100.0% 4,010 100.0%
Note: This analysis is based on ALL Reportable Course Enrolments. Any student enrolled in two courses is counted twice, any student enrolled in three courses is counted three times and so on.
050
010
0015
0020
0025
0030
00
TRAINEESHIPAPPRENTICESHIP
TAFE (VE/FE) COURSE ENROLMENTS BY APPRENTICE/TRAINEE
2005 APPRENTICESHIP 2,698 TRAINEESHIP 1,2632006 APPRENTICESHIP 2,708 TRAINEESHIP 1,3552007 APPRENTICESHIP 2,615 TRAINEESHIP 1,395

16 17
020
0040
0060
0080
0010
000
1200
0
City F
linde
rs
City K
ing
Echuca
(Site
)
Foots
cray P
ark
Intern
et (Au
strali
a)
Melto
n
City Q
ueen
(Site
)
St Alb
ans
Sunb
ury
Sydn
ey-alp
ha Be
ta (Si
te)
Werrib
ee
HIGHER EDUCATION COURSE ENROLMENTS BY CAMPUS/SITE ONSHORE 2005–07
200520062007
COURSE ENROLMENTS BY CAMPUS/SITE – ONSHORE 2005–07
HIGHER EDUCATION COURSE ENROLMENTS BY CAMPUS/SITE ONSHORE 2005–07
2005 2006 2007
CAMPUS No % No % No %
CITY FLINDERS 2,727 13.8% 2,269 11.5% 2,890 14.2%
CITY KING 55 0.3% 60 0.3% 43 0.2%
ECHUCA (SITE) 27 0.1% 14 0.1%
FOOTSCRAY PARK 10,196 51.6% 10,349 52.6% 9,859 48.6%
INTERNET (AUSTRALIA) 437 2.2% 343 1.7% 326 1.6%
MELTON 553 2.8% 574 2.9% 606 3.0%
CITY QUEEN (SITE) 546 2.8% 750 3.8% 1,152 5.7%
ST ALBANS 3,381 17.1% 3,550 18.0% 3,734 18.4%
SUNBURY 898 4.5% 940 4.8% 911 4.5%
SYDNEY-ALPHA BETA (SITE) 43 0.2% 27 0.1%
WERRIBEE 890 4.5% 804 4.1% 766 3.8%
TOTAL 19,753 100.0% 19,680 100.0% 20,287 100.0%
Note: The Echuca and Sydney-Alpha-Beta Sites closed in 2006.
Note: This analysis is based on ALL Reportable Course Enrolments. Any student enrolled in two courses is counted twice, any student enrolled in three courses is counted three times and so on.
LEARNING AND TEACHING STATISTICS CONTINUED

18
LEARNING AND TEACHING STATISTICS CONTINUED0
1000
2000
3000
4000
5000
6000
7000
8000
City F
linde
rs
City K
ing
Foots
cray P
ark
Foots
cray N
ichols
on
Indust
ry/wo
rkplac
e/flex
Ed
Intern
et (Au
strali
a)
Melto
n
Newp
ort
City Q
ueen
(Site
)
City
South
Melb
ourne
St Alb
ans
Sunb
ury
Sunsh
ine
Werrib
ee
Unspe
cified
TAFE (VE/FE) COURSE ENROLMENTS BY CAMPUS/SITE – ONSHORE 2005–07200520062007
%
TAFE (VE/FE) COURSE ENROLMENTS BY CAMPUS/SITE – ONSHORE 2005–07
2005 2006 2007
ONSHORE No % No % No %
CITY FLINDERS 503 1.8% 496 1.8% 1,038 3.8%
CITY KING 2496 8.7% 2464 9.1% 2508 9.1%
FOOTSCRAY NICHOLSON 6346 22.1% 5688 21.1% 5907 21.5%
FOOTSCRAY PARK 306 1.1% 233 0.9% 872 3.2%
INDUSTRY/WORKPLACE/FLEX ED 4252 14.8% 4691 17.4% 4570 16.6%
INTERNET (AUSTRALIA) 17 0.1% 17 0.1% 14 0.1%
MELTON 386 1.3% 287 1.1% 230 0.8%
NEWPORT 2,671 9.3% 2,422 9.0% 2,830 10.3%
CITY QUEEN (SITE) 20 0.1% 20 0.1%
CITY SOUTH MELBOURNE 856 3.0% 914 3.4%
ST ALBANS 2543 8.9% 2195 8.1% 2421 8.8%
SUNBURY 908 3.2% 892 3.3% 903 3.3%
SUNSHINE 4101 14.3% 3769 14.0% 3405 12.4%
UNSPECIFIED 8 0.0%
WERRIBEE 3305 11.5% 2912 10.8% 2778 10.1%
TOTAL 28,690 100.0% 27,000 100.0% 27,504 100.0%
Note: City South Melbourne Campus closed in 2006.Note: This analysis is based on ALL Reportable Course Enrolments. Any student enrolled in two courses is counted twice, any student enrolled in three courses is counted three times and so on.
LEARNING AND TEACHING STATISTICS CONTINUED
19
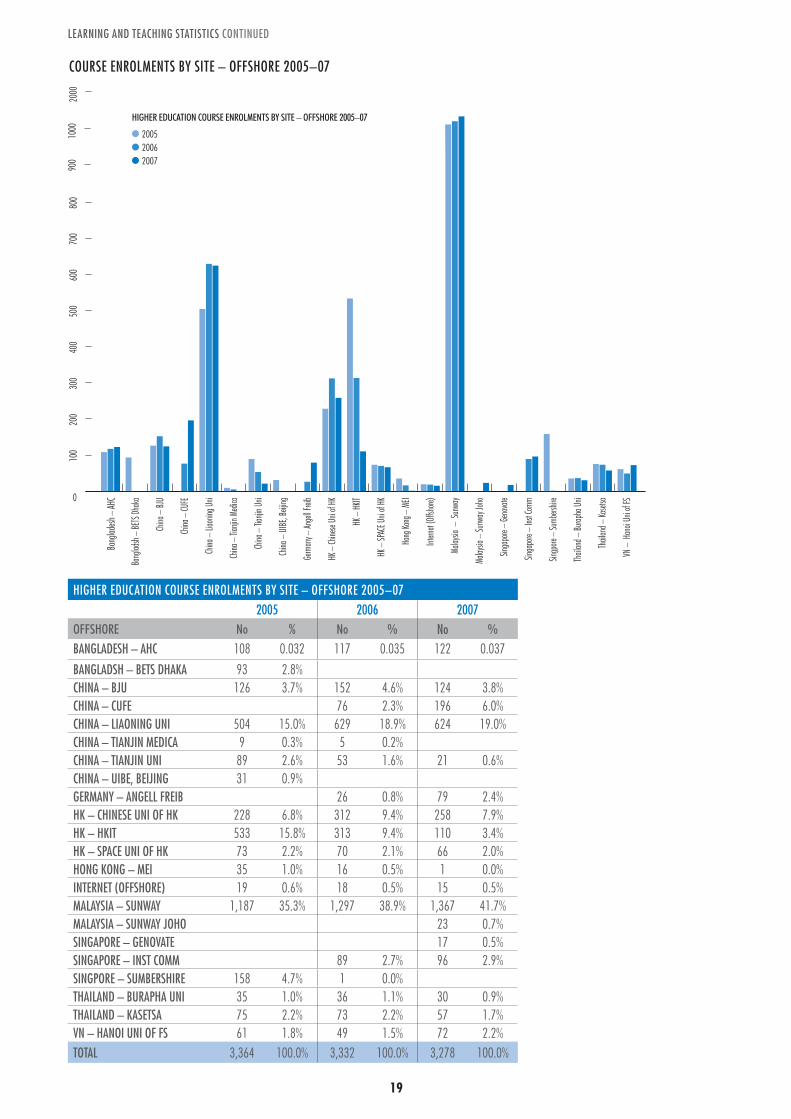
COURSE ENROLMENTS BY SITE – OFFSHORE 2005–07
Bang
ladsh
– BE
TS Dh
aka
Bang
ladesh
– AH
C
China
– BJ
U
China
– Ti
anjin
Med
ica
China
– Li
aonin
g Uni
China
– CU
FE
China
– Ti
anjin
Uni
China
– UI
BE, B
eijing
Germ
any –
Ange
ll Frei
b
HK –
HKIT
HK –
Chine
se Un
i of H
K
HK –
SPAC
E Uni
of HK
Hong
Kong
– M
EI
Malay
sia –
Sun
way
Intern
et (O
ffsho
re)
Singa
pore
– Ins
t Com
m
Singa
pore
– Ge
nova
te
Malay
sia –
Sunw
ay Jo
ho
Thail
and –
Burap
ha Un
i
Singp
ore –
Sumb
ershir
e
VN –
Han
oi Un
i of F
S
Thail
and –
Kaset
sa
HIGHER EDUCATION COURSE ENROLMENTS BY SITE – OFFSHORE 2005–07
200520062007
0
100
200
300
400
500
600
700
800
900
1000
2000
HIGHER EDUCATION COURSE ENROLMENTS BY SITE – OFFSHORE 2005–072005 2006 2007
OFFSHORE No % No % No %BANGLADESH – AHC 108 0.032 117 0.035 122 0.037
BANGLADSH – BETS DHAKA 93 2.8%CHINA – BJU 126 3.7% 152 4.6% 124 3.8%CHINA – CUFE 76 2.3% 196 6.0%CHINA – LIAONING UNI 504 15.0% 629 18.9% 624 19.0%CHINA – TIANJIN MEDICA 9 0.3% 5 0.2%CHINA – TIANJIN UNI 89 2.6% 53 1.6% 21 0.6%CHINA – UIBE, BEIJING 31 0.9%GERMANY – ANGELL FREIB 26 0.8% 79 2.4%HK – CHINESE UNI OF HK 228 6.8% 312 9.4% 258 7.9%HK – HKIT 533 15.8% 313 9.4% 110 3.4%HK – SPACE UNI OF HK 73 2.2% 70 2.1% 66 2.0%HONG KONG – MEI 35 1.0% 16 0.5% 1 0.0%INTERNET (OFFSHORE) 19 0.6% 18 0.5% 15 0.5%MALAYSIA – SUNWAY 1,187 35.3% 1,297 38.9% 1,367 41.7%MALAYSIA – SUNWAY JOHO 23 0.7%SINGAPORE – GENOVATE 17 0.5%SINGAPORE – INST COMM 89 2.7% 96 2.9%SINGPORE – SUMBERSHIRE 158 4.7% 1 0.0%THAILAND – BURAPHA UNI 35 1.0% 36 1.1% 30 0.9%THAILAND – KASETSA 75 2.2% 73 2.2% 57 1.7%VN – HANOI UNI OF FS 61 1.8% 49 1.5% 72 2.2%TOTAL 3,364 100.0% 3,332 100.0% 3,278 100.0%

20 21
China
– He
nan
China
– Li
aonin
g Uni
China
– Si
chuan
Uni
China
– Ti
anjin
Uni
Hena
n Coll
ege o
f Fin
Indon
esia –
LAN
Intern
et
NS –
EDEN
Z Coll
ege
Overs
eas
Shan
dong
Jianzh
u Uni
050
010
0015
0020
0025
00 TAFE (VE/FE) COURSE ENROLMENTS BY SITE – OFFSHORE 2005–07200520062007
TAFE (VE/FE) COURSE ENROLMENTS BY SITE – OFFSHORE 2005–07
2005 2006 2007
ONSHORE No % No % No %
CHINA – HENAN 1480 38.7% 1958 40.9%
CHINA – LIAONING UNI 1498 39.2% 1613 33.7%
CHINA – SICHUAN UNI 96 2.5% 151 3.2%
CHINA – TIANJIN UNI 474 12.4% 83 1.7%
HENAN COLLEGE OF FIN 124 3.2% 409 8.6%
INDONESIA – LAN 242 5.1%
INTERNET 12 0.5% 6 0.2% 2 0.0%
NS – EDENZ COLLEGE 14 0.4%
OVERSEAS 2187 99.5%
SHANDONG JIANZHU UNI 133 3.5% 325 6.8%
TOTAL 2,199 100.0% 3,825 100.0% 4,783 100.0%
LEARNING AND TEACHING STATISTICS CONTINUED
20 21
050
010
0015
0020
0025
0030
0035
0040
00
2005
2006
2007
HIGHER EDUCATION INTERNATIONAL STUDENT COURSE ENROLMENTS – ONSHORE/OFFSHORE 2005–07
OFFSHORE ONSHORE
010
0020
0040
0050
0030
00
2005
2006
2007
TAFE (VE/FE) INTERNATIONAL STUDENT COURSE ENROLMENTS – ONSHORE/OFFSHORE 2005–07
OFFSHORE ONSHORE
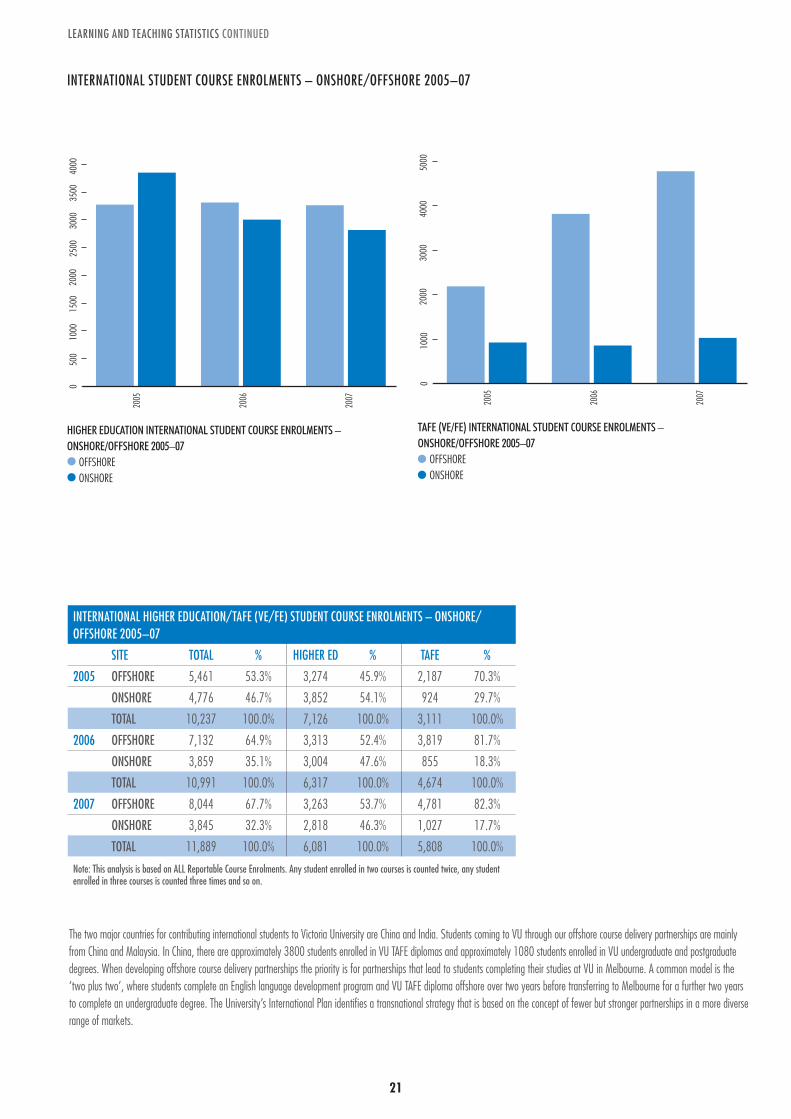
INTERNATIONAL HIGHER EDUCATION/TAFE (VE/FE) STUDENT COURSE ENROLMENTS – ONSHORE/OFFSHORE 2005–07
SITE TOTAL % HIGHER ED % TAFE %
2005 OFFSHORE 5,461 53.3% 3,274 45.9% 2,187 70.3%
ONSHORE 4,776 46.7% 3,852 54.1% 924 29.7%
TOTAL 10,237 100.0% 7,126 100.0% 3,111 100.0%
2006 OFFSHORE 7,132 64.9% 3,313 52.4% 3,819 81.7%
ONSHORE 3,859 35.1% 3,004 47.6% 855 18.3%
TOTAL 10,991 100.0% 6,317 100.0% 4,674 100.0%
2007 OFFSHORE 8,044 67.7% 3,263 53.7% 4,781 82.3%
ONSHORE 3,845 32.3% 2,818 46.3% 1,027 17.7%
TOTAL 11,889 100.0% 6,081 100.0% 5,808 100.0%
Note: This analysis is based on ALL Reportable Course Enrolments. Any student enrolled in two courses is counted twice, any student enrolled in three courses is counted three times and so on.
INTERNATIONAL STUDENT COURSE ENROLMENTS – ONSHORE/OFFSHORE 2005–07
LEARNING AND TEACHING STATISTICS CONTINUED
The two major countries for contributing international students to Victoria University are China and India. Students coming to VU through our offshore course delivery partnerships are mainly from China and Malaysia. In China, there are approximately 3800 students enrolled in VU TAFE diplomas and approximately 1080 students enrolled in VU undergraduate and postgraduate degrees. When developing offshore course delivery partnerships the priority is for partnerships that lead to students completing their studies at VU in Melbourne. A common model is the ‘two plus two’, where students complete an English language development program and VU TAFE diploma offshore over two years before transferring to Melbourne for a further two years to complete an undergraduate degree. The University’s International Plan identifies a transnational strategy that is based on the concept of fewer but stronger partnerships in a more diverse range of markets.

22
2005 PERCENTAGE INTERNATIONAL STUDENT COURSE ENROLMENTS – ONSHORE/OFFSHORE 2005–07
HIGHER EDUCATION
OFFSHORE 45.9%ONSHORE 54.1%
TAFE (VE/FE)
OFFSHORE 70.3%ONSHORE 29.7%
2006 PERCENTAGE INTERNATIONAL STUDENT COURSE ENROLMENTS – ONSHORE/OFFSHORE 2005–07
HIGHER EDUCATION
OFFSHORE 52.4%ONSHORE 47.6%
TAFE (VE/FE)
OFFSHORE 81.7%ONSHORE 18.3%
2007 PERCENTAGE INTERNATIONAL STUDENT COURSE ENROLMENTS – ONSHORE/OFFSHORE 2005–07
HIGHER EDUCATION
OFFSHORE 53.7%ONSHORE 46.3%
TAFE (VE/FE)
OFFSHORE 82.3%ONSHORE 17.7%
LEARNING AND TEACHING STATISTICS CONTINUED
22 23
staffingstatistics
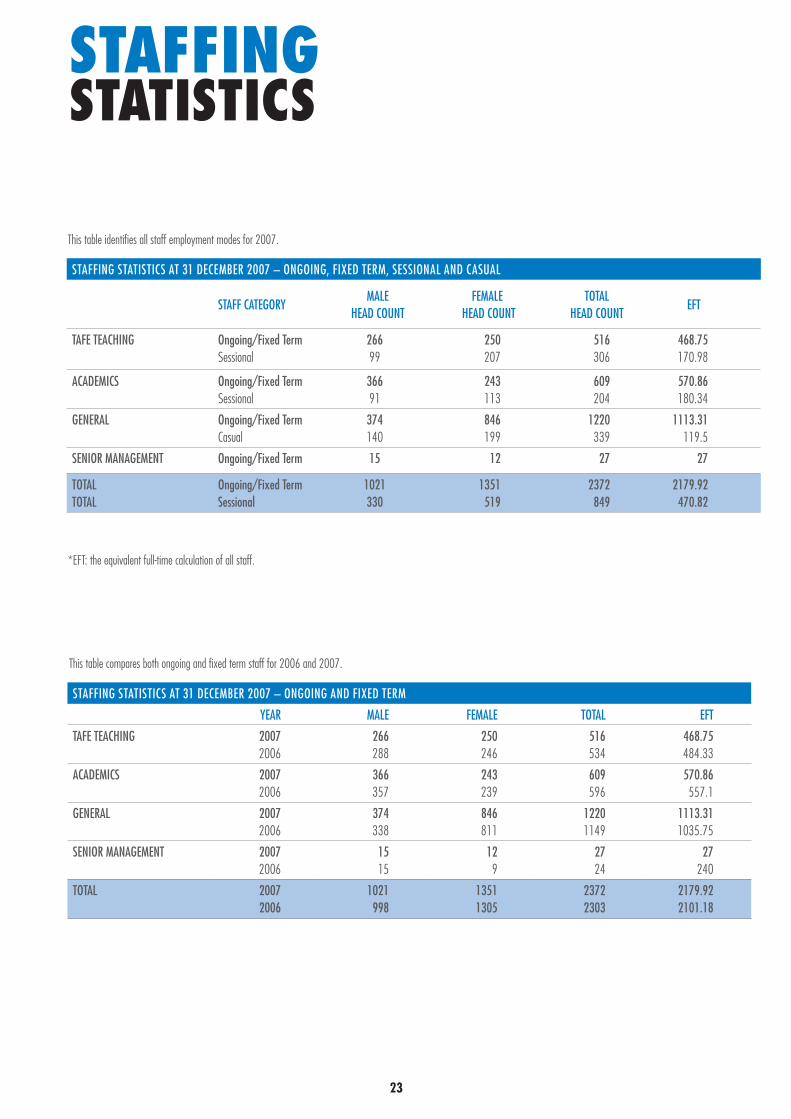
This table identifies all staff employment modes for 2007.
*EFT: the equivalent full-time calculation of all staff.
STAFFING STATISTICS AT 31 DECEMBER 2007 – ONGOING AND FIXED TERM
YEAR MALE FEMALE TOTAL EFT
TAFE TEACHING 20072006
266288
250246
516534
468.75484.33
ACADEMICS 20072006
366357
243239
609596
570.86557.1
GENERAL 20072006
374338
846811
12201149
1113.311035.75
SENIOR MANAGEMENT 20072006
1515
129
2724
27240
TOTAL 20072006
1021998
13511305
23722303
2179.922101.18
This table compares both ongoing and fixed term staff for 2006 and 2007.
STAFFING STATISTICS AT 31 DECEMBER 2007 – ONGOING, FIXED TERM, SESSIONAL AND CASUAL
STAFF CATEGORYMALE
HEAD COUNTFEMALE
HEAD COUNT TOTAL
HEAD COUNTEFT
TAFE TEACHING Ongoing/Fixed Term Sessional
26699
250207
516306
468.75170.98
ACADEMICS Ongoing/Fixed Term Sessional
36691
243113
609204
570.86180.34
GENERAL Ongoing/Fixed Term Casual
374140
846199
1220339
1113.31119.5
SENIOR MANAGEMENT Ongoing/Fixed Term 15 12 27 27
TOTALTOTAL
Ongoing/Fixed Term Sessional
1021330
1351519
2372849
2179.92470.82
2524
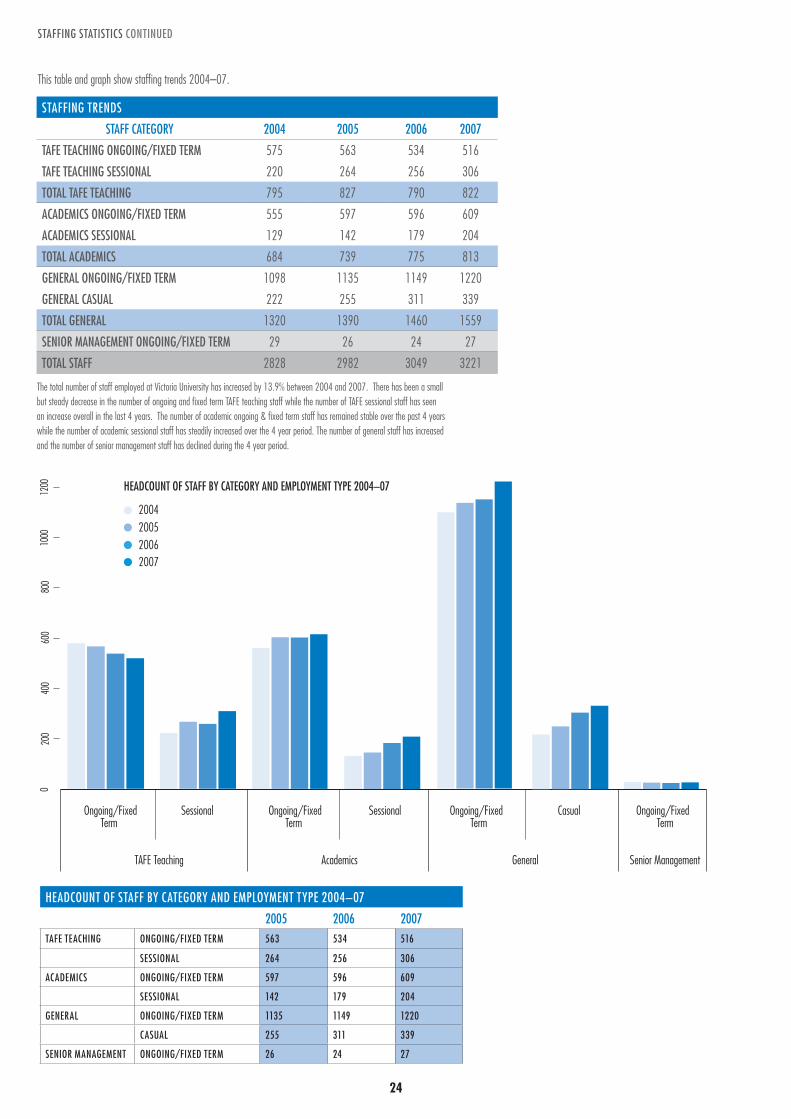
STAFFING TRENDS
STAFF CATEGORY 2004 2005 2006 2007
TAFE TEACHING ONGOING/FIXED TERM 575 563 534 516
TAFE TEACHING SESSIONAL 220 264 256 306
TOTAL TAFE TEACHING 795 827 790 822
ACADEMICS ONGOING/FIXED TERM 555 597 596 609
ACADEMICS SESSIONAL 129 142 179 204
TOTAL ACADEMICS 684 739 775 813
GENERAL ONGOING/FIXED TERM 1098 1135 1149 1220
GENERAL CASUAL 222 255 311 339
TOTAL GENERAL 1320 1390 1460 1559
SENIOR MANAGEMENT ONGOING/FIXED TERM 29 26 24 27
TOTAL STAFF 2828 2982 3049 3221
2004 2005 2006
HEADCOUNT OF STAFF BY CATEGORY AND EMPLOYMENT TYPE 2004–07
0 0 2 0 0 4
0 0 6 0 0 8
0 00 0 1
0 0 2 1
Ongoing/FixedTerm
Ongoing/Fixed Term
Ongoing/Fixed Term
Ongoing/Fixed Term
Sessional
TAFE Teaching Academics General Senior Management
Sessional Casual
2007
The total number of staff employed at Victoria University has increased by 13.9% between 2004 and 2007. There has been a small but steady decrease in the number of ongoing and fixed term TAFE teaching staff while the number of TAFE sessional staff has seen an increase overall in the last 4 years. The number of academic ongoing & fixed term staff has remained stable over the past 4 years while the number of academic sessional staff has steadily increased over the 4 year period. The number of general staff has increased and the number of senior management staff has declined during the 4 year period.
This table and graph show staffing trends 2004–07.
STAFFING STATISTICS CONTINUED
HEADCOUNT OF STAFF BY CATEGORY AND EMPLOYMENT TYPE 2004–07
2005 2006 2007TAFE TEACHING ONGOING/FIXED TERM 563 534 516
SESSIONAL 264 256 306
ACADEMICS ONGOING/FIXED TERM 597 596 609
SESSIONAL 142 179 204
GENERAL ONGOING/FIXED TERM 1135 1149 1220
CASUAL 255 311 339
SENIOR MANAGEMENT ONGOING/FIXED TERM 26 24 27
25
The Human Resources OHS Team has worked with Faculties and Departments to implement the second year of the 2006–2008 Occupational Health & Safety Improvement Plan, leaving the remaining 18 of the original 44 items for completion in 2008.
OHS legislative compliance inspections are being conducted by inspectors under the WorkSafe TAFE and Higher Education Projects. University Staff have prepared the University to a satisfactory standard for these inspections and promptly address any observations for improvement from the inspectorate.
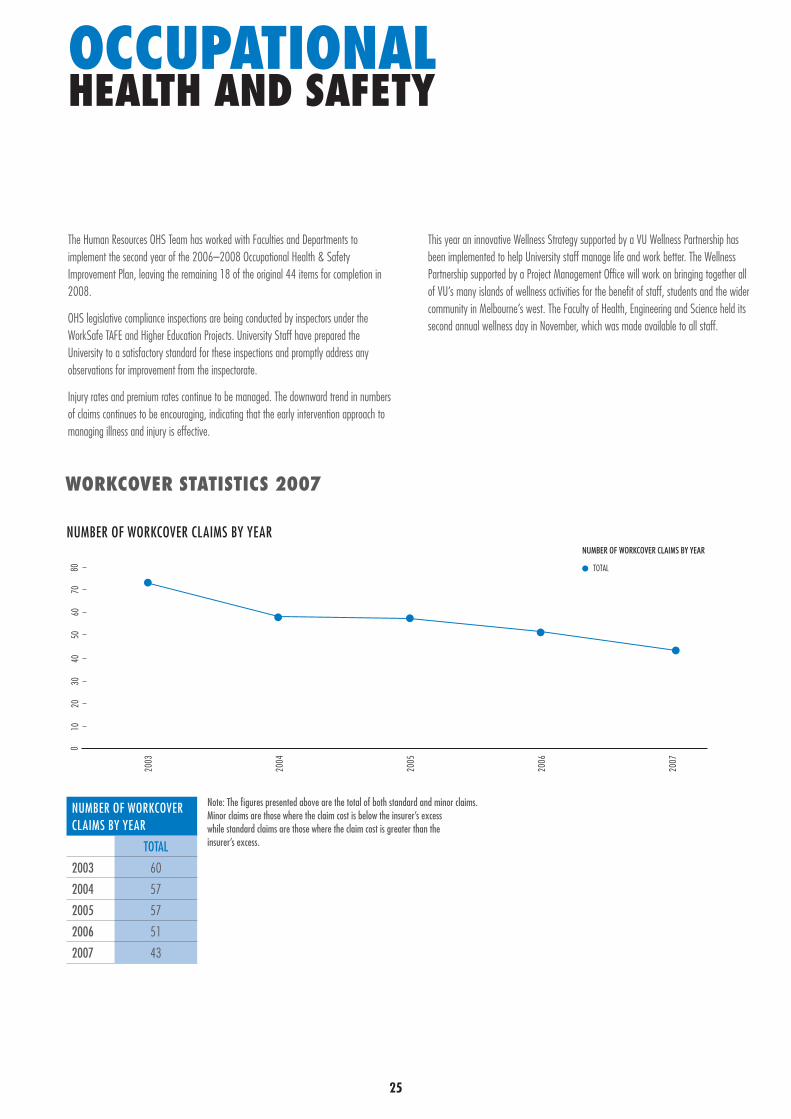
Injury rates and premium rates continue to be managed. The downward trend in numbers of claims continues to be encouraging, indicating that the early intervention approach to managing illness and injury is effective.
This year an innovative Wellness Strategy supported by a VU Wellness Partnership has been implemented to help University staff manage life and work better. The Wellness Partnership supported by a Project Management Office will work on bringing together all of VU’s many islands of wellness activities for the benefit of staff, students and the wider community in Melbourne’s west. The Faculty of Health, Engineering and Science held its second annual wellness day in November, which was made available to all staff.
occupationalhealth anD safety
TOTAL
NUMBER OF WORKCOVER CLAIMS BY YEAR
0 1 0 3
0 5 0 2
0 4 0 6
0 7 0
0 8
30 0 2
40 0 2
50 0 2
60 0 2
700 2
NUMBER OF WORKCOVER CLAIMS BY YEAR
TOTAL
2003 60
2004 57
2005 57
2006 51
2007 43
NUMBER OF WORKCOVER CLAIMS BY YEAR
Workcover statistics 2007
Note: The figures presented above are the total of both standard and minor claims. Minor claims are those where the claim cost is below the insurer’s excess while standard claims are those where the claim cost is greater than the insurer’s excess.

27
COMPARISON OF CLAIMS COST – PHYSICAL AND PSYCHOLOGICAL
NUMBER PHYSICAL CLAIMS
CLAIMS COST PHYSICAL
INSURER'S ESTIMATE PHYSICAL
NUMBER PSYCHOLOGI-CAL CLAIMS
CLAIMS COST PSY-CHOLOGICAL
INSURER'S ESTIMATE
PSYCHOLOGICAL
2003 47 $270,026 $173,229 13 $294,619 $39,177
2004 50 $409,599 $413,110 7 $219,092 $81,052
2005 47 $297,301 $461,777 10 $311,961 $466,731
2006 41 $449,325 $1,038,353 10 $196,935 $265,322
2007 35 $76,751 $1,068,006 8 $65,749 $691,094
CLAIMS COST PHYSICAL INSURER’S ESTIMATE PHYSICALCLAIMS COST PSYCHOLOGICALINSURER’S ESTIMATE PSYCHOLOGICAL
COMPARISON OF CLAIMS COST – PHYSICAL AND PSYCHOLOGICAL
002006
0001004
0080021
00410
00610081
$000’s
3002
4002
5002
6002
7002
COMPARISON OF CLAIMS COST – PHYSICAL AND PSYCHOLOGICAL
26
OCCUPATIONAL HEALTH AND SAFETY CONTINUED
CLAIMS COST TO UNIVERSITY
PHYSICAL AND PSYCHOLOGICAL
INSURER'S ESTIMATE
NUMBER OF STANDARD
CLAIMS
AVERAGE COST PER STANDARD
CLAIMS
2003 $564,645 $212,406 36 $15,685
2004 $628,691 $494,162 44 $14,288
2005 $609,262 $928,508 34 $17,919
2006 $646,260 $1,303,675 35 $18,465
2007 $142,500 $1,759,100 37 $3,851
PHYSICAL AND PSYCHOLOGICAL INSURER’S ESTIMATE PSYCHOLOGICAL
WORKCOVER CLAIMS COST TO UNIVERSITY
0 0 5 0 0 5 1
0 0 5 2 0 0 0 1
0 0 0 2 0
30 0 2
40 0 2
50 0 2
60 0 2
70 0 2
$000s
0
500
1000
1500
WORKCOVER CLAIMS COST TO UNIVERSITY – ALL SECTORS
Note: The insurer’s estimate for standard claims is used in the formula for determining premiums.
2726
Effective from 1 January 2005, the Commonwealth Government amended higher education fee payments for higher education providers. As part of these changes, the Government gave providers the opportunity to deregulate Commonwealth-supported student contributions (formerly known as Higher Education Contributions), allowed full-fee undergraduate courses, and introduced a national priority student contribution band for nursing and education students.
As a consequence, VU increased student contribution fees by 25% for higher education students who began their studies in 2006. Pre-2005 and 2005 continuing students were exempt from any fee increase.
Student contribution amounts are based on the number of Units of Study (subjects) undertaken, their differential student contribution band (except for students who commenced their studies prior to 1997) and equivalent full-time study load (EFTSL) value. Further detail on the Government requirements regarding fees can be found at www.goingtouni.gov.au.
As a result of State Government changes, TAFE fees were capped over a 12-month period from the earliest course commencement date.
higher eDucation feesThere are two types of higher education fees:
• Student Contribution Amounts – for local students enrolled in a Commonwealth Supported Place.
• Tuition Fees – for students enrolled in a full-fee paying place: i. international students pay tuition fees as stated in their invoice. Fees are calculated
based on the year of commencement. A list of international fees is available at http://vu.edu.au/international/
ii. local students who enrol in a full-fee place are required to pay tuition fees.
Details of student contribution amounts and tuition fees for local students are available in the Victoria University Fee Guide at www.vu.edu.au/Courses/Fee_Guide.
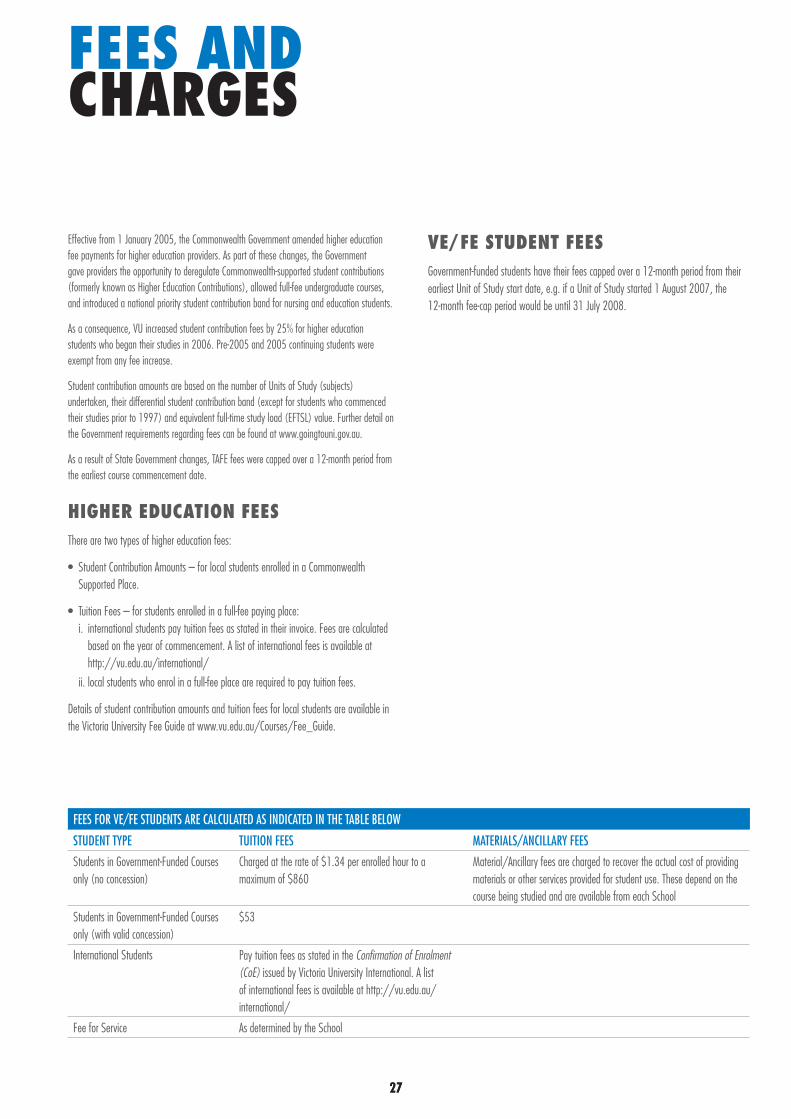
FEES FOR VE/FE STUDENTS ARE CALCULATED AS INDICATED IN THE TABLE BELOW
STUDENT TYPE TUITION FEES MATERIALS/ANCILLARY FEESStudents in Government-Funded Courses only (no concession)
Charged at the rate of $1.34 per enrolled hour to a maximum of $860
Material/Ancillary fees are charged to recover the actual cost of providing materials or other services provided for student use. These depend on the course being studied and are available from each School
Students in Government-Funded Courses only (with valid concession)
$53
International Students Pay tuition fees as stated in the Confirmation of Enrolment (CoE) issued by Victoria University International. A list of international fees is available at http://vu.edu.au/international/
Fee for Service As determined by the School
ve/fe stuDent feesGovernment-funded students have their fees capped over a 12-month period from their earliest Unit of Study start date, e.g. if a Unit of Study started 1 August 2007, the 12-month fee-cap period would be until 31 July 2008.
fees anD charges
27
28 29
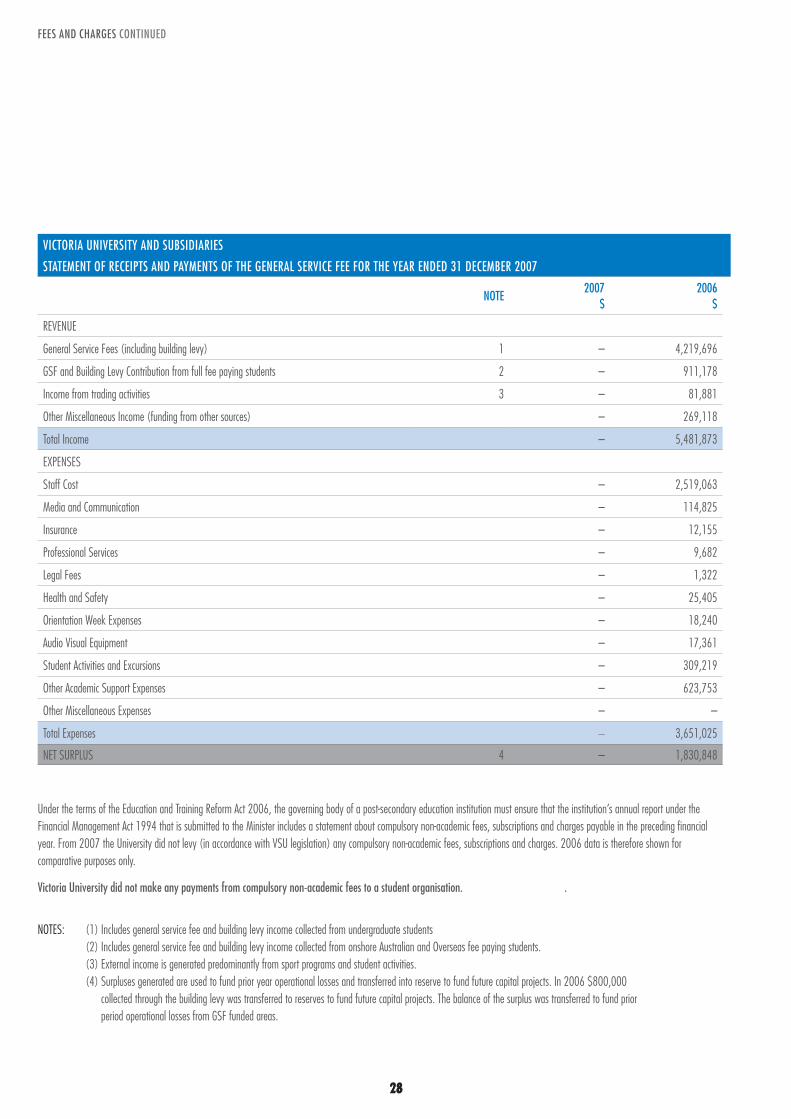
VICTORIA UNIVERSITY AND SUBSIDIARIES
STATEMENT OF RECEIPTS AND PAYMENTS OF THE GENERAL SERVICE FEE FOR THE YEAR ENDED 31 DECEMBER 2007
NOTE2007
$ 2006
$
revenue
General Service Fees (including building levy) 1 – 4,219,696
GSF and Building Levy Contribution from full fee paying students 2 – 911,178
Income from trading activities 3 – 81,881
Other Miscellaneous Income (funding from other sources) – 269,118
Total Income – 5,481,873
expenses
Staff Cost – 2,519,063
Media and Communication – 114,825
Insurance – 12,155
Professional Services – 9,682
Legal Fees – 1,322
Health and Safety – 25,405
Orientation Week Expenses – 18,240
Audio Visual Equipment – 17,361
Student Activities and Excursions – 309,219
Other Academic Support Expenses – 623,753
Other Miscellaneous Expenses – –
Total Expenses – 3,651,025
net surpLus 4 – 1,830,848
Under the terms of the Education and Training Reform Act 2006, the governing body of a post-secondary education institution must ensure that the institution’s annual report under the Financial Management Act 1994 that is submitted to the Minister includes a statement about compulsory non-academic fees, subscriptions and charges payable in the preceding financial year. From 2007 the University did not levy (in accordance with VSU legislation) any compulsory non-academic fees, subscriptions and charges. 2006 data is therefore shown for comparative purposes only.
Victoria University did not make any payments from compulsory non-academic fees to a student organisation. .
notes: (1) Includes general service fee and building levy income collected from undergraduate students (2) Includes general service fee and building levy income collected from onshore Australian and Overseas fee paying students. (3) External income is generated predominantly from sport programs and student activities. (4) Surpluses generated are used to fund prior year operational losses and transferred into reserve to fund future capital projects. In 2006 $800,000
collected through the building levy was transferred to reserves to fund future capital projects. The balance of the surplus was transferred to fund prior period operational losses from GSF funded areas.
FEES AND CHARGES CONTINUED
28
28 29
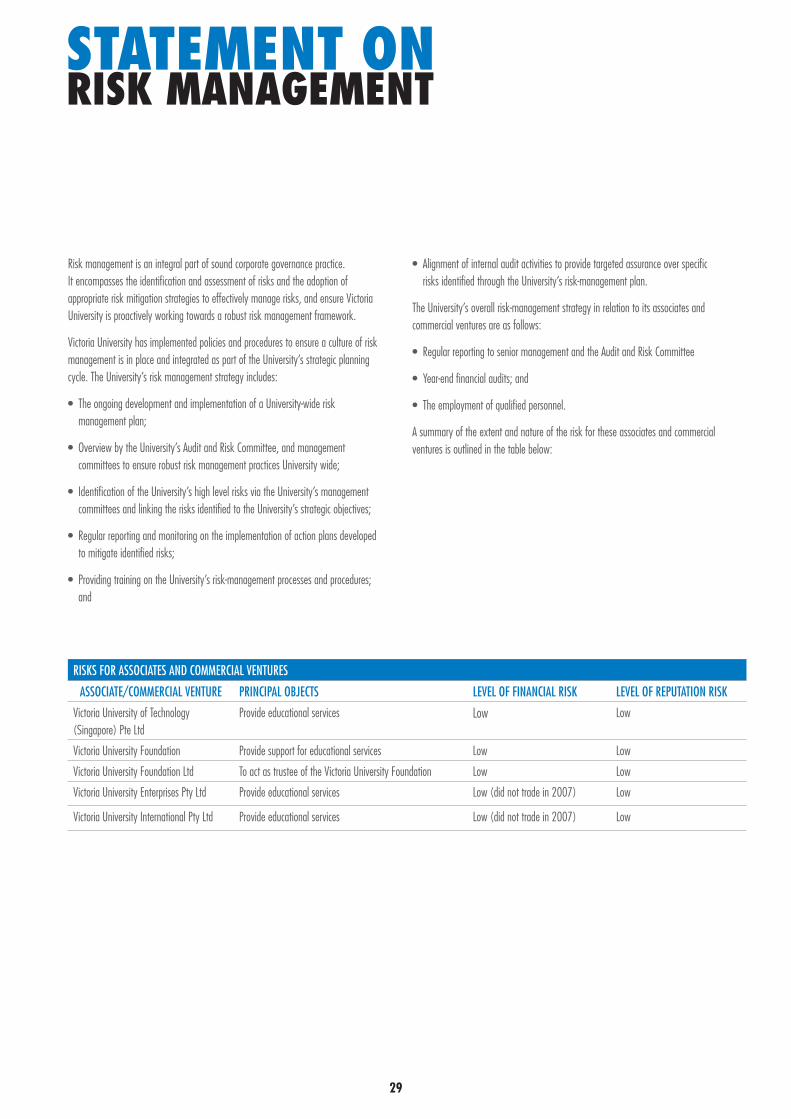
statement onrisk management
RISKS FOR ASSOCIATES AND COMMERCIAL VENTURES
ASSOCIATE/COMMERCIAL VENTURE PRINCIPAL OBJECTS LEVEL OF FINANCIAL RISK LEVEL OF REPUTATION RISKVictoria University of Technology (Singapore) Pte Ltd
Provide educational services Low Low
Victoria University Foundation Provide support for educational services Low Low
Victoria University Foundation Ltd To act as trustee of the Victoria University Foundation Low Low
Victoria University Enterprises Pty Ltd Provide educational services Low (did not trade in 2007) Low
Victoria University International Pty Ltd Provide educational services Low (did not trade in 2007) Low
Risk management is an integral part of sound corporate governance practice. It encompasses the identification and assessment of risks and the adoption of appropriate risk mitigation strategies to effectively manage risks, and ensure Victoria University is proactively working towards a robust risk management framework.
Victoria University has implemented policies and procedures to ensure a culture of risk management is in place and integrated as part of the University’s strategic planning cycle. The University’s risk management strategy includes:
• The ongoing development and implementation of a University-wide risk management plan;
• Overview by the University’s Audit and Risk Committee, and management committees to ensure robust risk management practices University wide;
• Identification of the University’s high level risks via the University’s management committees and linking the risks identified to the University’s strategic objectives;
• Regular reporting and monitoring on the implementation of action plans developed to mitigate identified risks;
• Providing training on the University’s risk-management processes and procedures; and
• Alignment of internal audit activities to provide targeted assurance over specific risks identified through the University’s risk-management plan.
The University’s overall risk-management strategy in relation to its associates and commercial ventures are as follows:
• Regular reporting to senior management and the Audit and Risk Committee
• Year-end financial audits; and
• The employment of qualified personnel.
A summary of the extent and nature of the risk for these associates and commercial ventures is outlined in the table below:

31
reporting on universityassociates anD commercial venturesThe University does not have any associates or other commercial ventures that would warrant separate disclosure under the Victorian Government response to the Review of University Governance regulations. The details of the University’s subsidiary companies are as follows:
INCOME STATEMENTName Principal
ActivitiesDomicile Ownership
InterestTotal Revenue 2007
Total Revenue 2006
Total Expenditure 2007
Total Expenditure 2006
Tax/Extra Ord Items 2007
Tax/Extra Ord Items 2006
Operating Result 2007
Operating Result 2006
Contribution to Uni operating results 2007
Contribution to Uni operating results 2006
% $’000 $’000 $’000 $’000 $’000 $’000 $’000 $’000 $’000 $’000
Victoria University Foundation Ltd *
trustee for the trust
Australia 100% – – – – – – – – – –
Victoria University Foundation Trust
Fund raising for vu
Australia 100% 1,871 377 188 163 – – 1,683 214 1,683 214
Victoria University Enterprises Pty Ltd
Administers IP from Research Related spin-off companies
Australia 100% 89 2 1 – – 1 88 1 88 1
Victoria University of Technology (Singapore) Pte Ltd
Hub for Singapore activities
Singapore 100% 224 148 200 138 – (7) 24 17 24 17
Victoria University International Pty Ltd
Dormant Australia 100% – – – – – – – – – –
Victoria University – AFIC College Ltd (Deregistered on 31 August 2007)
Dormant Australia 50% – – – – – – – – – –
Total – University Associates and commercial ventures
2,184 527 389 301 – (6) 1,795 232 1,795 232
BALANCE SHEETName Working
Capital 2007
Working Capital 2006
Physical Assets 2007
Physical Assets 2006
Total Assets 2007
Total Assets 2006
Internal Borrowings 2007
Internal Borrowings 2006
External Borrowings 2007
External Borrowings 2006
Total Liabilities 2007
Total Liabilities 2006
Equity 2007
Equity 2006
$’000 $’000 $’000 $’000 $’000 $’000 $’000 $’000 $’000 $’000 $’000 $’000 $’000 $’000
Victoria University Foundation Ltd
– – – – – – – – – – – – – –
Victoria University Foundation Trust*
4,226 2,542 25 25 4,255 2,589 – – – – 5 22 4,250 2,567
Victoria University Enterprises Pty Ltd
89 1 – – 89 2 – – – – – 1 89 1
Victoria University of Technology (Singapore) Pte Ltd
43 20 – – 234 169 – – – – 191 149 43 20
Victoria University International Pty Ltd**
– – – – – – – – – – – – – –
Victoria University – AFIC College Ltd Deregistered on 31 August 2007)
– – – – – – – – – – – – – –
Total – University Associates and commercial ventures
4,358 2,563 25 25 4,578 2,760 – – – – 196 172 4,382 2,588
* Victoria University Foundation Ltd, a company limited by guarantee acts as trustee of Victoria University Foundation.** Company has $2 share capital which is represented in its cash assets.
30

31
CONSULTANTS’ EXPENDITURE GREATER AND LESS THAN $100,000
FOR THE YEAR ENDED 31 DECEMBER 2007(a) Consultants costing less than $100,000 Number of engagements Cost $’000
Payments to consultants 301 3,193
(b) Consultants costing more than $100,000 Description Cost $’000
Mcildowie Partners Pty Ltd Architectural Consultants 102
Connell Wagner Engineering Consultant 119
Lyon Architects Building & Architectural Consultants 121
Building Control Services Project Manager Consultant 146
Blomquist & Wark Architects Pty Ltd Architectural Consultants 235
Norman Disney Engineering Consultant 369
John Wardle Pty Ltd Architectural Consultants 1,447
7 2,539
TOTAL CONSULTANTS 308 5,732
expenDitureof consultants
33
Victoria University is committed to the aims and objectives of the Whistleblowers’ Protection Act 2001 (The Act). It does not tolerate improper conduct by its officers and staff, nor the taking of reprisals against those who come forward to disclose such conduct.
The University will take all reasonable steps to protect people who make such disclosures from any detrimental action in reprisal for making the disclosure. It is conscious of the rights of persons against whom allegations might be made and has a policy to afford the subject natural justice.
Victoria University’s Whistleblower Protection Procedures establish a system for reporting disclosures of improper conduct or detrimental action by employees and other public officers. These procedures are available at www.vu.edu.au/GovernancePolicy. The system enables such disclosures to be made to Victoria University’s Whistleblower Hotline or to the Protected Disclosure Co-ordinator. In addition to staff or students, members of the general public may make disclosures.
Victoria University’s Whistleblower Hotline may be contacted on 1800 288 86. The Protected Disclosure Co-ordinator, Dr Steven Stern, may be contacted on +61 3 9919 4008. Potential whistleblowers may also contact the Ombudsman on +61 3 9613 6222.
In 2007, there were five disclosures purportedly made under the Act. One of these disclosures was withdrawn, the rest were assessed not to be protected disclosures and are considered resolved.
No disclosures were referred to the Ombudsman by Victoria University in 2007 for determination as to whether they were public interest disclosures. As a general summary, the overall reason why these disclosures were assessed to be outside the Act was that they were more in the nature of feedback and complaints, rather than disclosures of corrupt or other serious improper conduct governed by the Act.
There was a disclosure in 2006 concerning an allegation of improper conduct by an employee that was initially made to the Ombudsman outside the Act, but was subsequently brought within the Act. A public interest investigation was instituted and referred to the University to undertake towards the end of 2006. As the University considered that its own investigation was being obstructed, at the suggestion of the Ombudsman the University referred this matter back to the Ombudsman in March 2007 for investigation under section 73 of the Act. The Ombudsman determined that the matter raised by the disclosure was incapable of resolution and decided to conclude the investigation into the matter.
During 2007, no investigations were taken over by the Ombudsman from Victoria University and the University is not aware of any requests made to the Ombudsman under section 74 of the Act for the Ombudsman to investigate disclosed matters. Victoria University has not declined to investigate a disclosed matter.
WhistlebloWers’ protection proceDures
32 33
3332
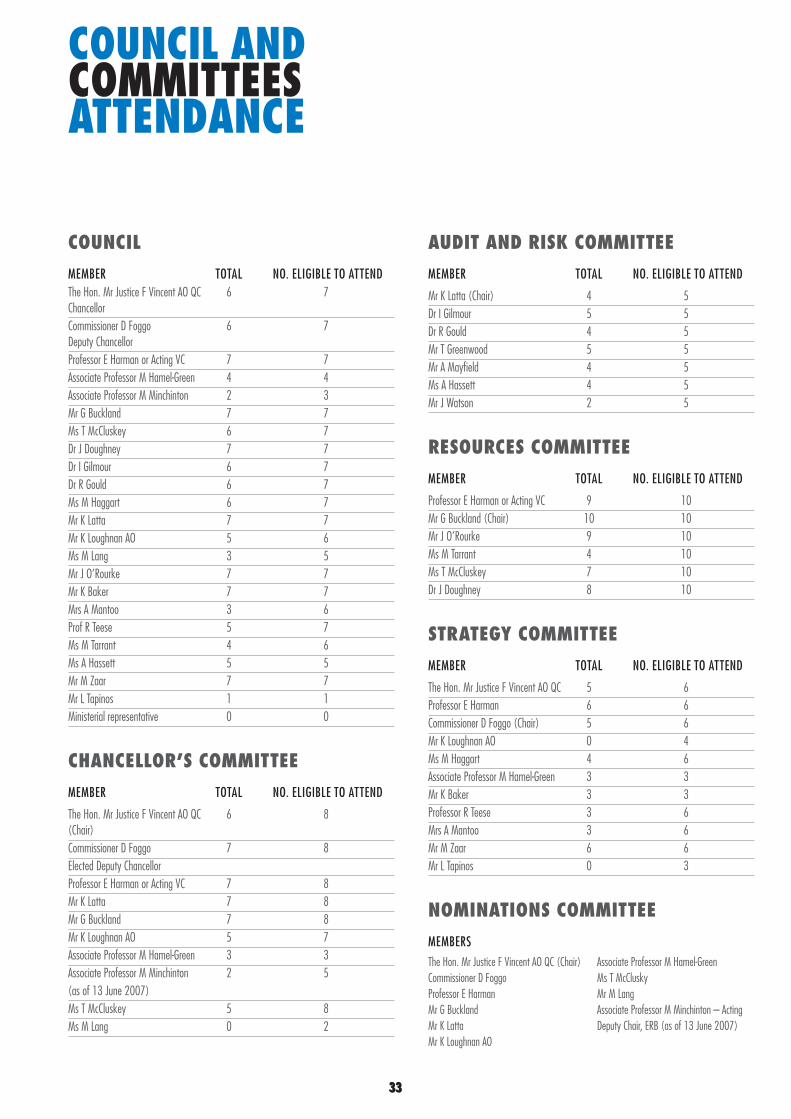
council
MEMBER TOTAL NO. ELIGIBLE TO ATTENDThe Hon. Mr Justice F Vincent AO QC 6 7 ChancellorCommissioner D Foggo 6 7 Deputy ChancellorProfessor E Harman or Acting VC 7 7Associate Professor M Hamel-Green 4 4Associate Professor M Minchinton 2 3Mr G Buckland 7 7Ms T McCluskey 6 7Dr J Doughney 7 7Dr I Gilmour 6 7Dr R Gould 6 7Ms M Haggart 6 7Mr K Latta 7 7Mr K Loughnan AO 5 6Ms M Lang 3 5Mr J O’Rourke 7 7Mr K Baker 7 7Mrs A Mantoo 3 6Prof R Teese 5 7Ms M Tarrant 4 6Ms A Hassett 5 5Mr M Zaar 7 7Mr L Tapinos 1 1Ministerial representative 0 0
chancellor’s committee
MEMBER TOTAL NO. ELIGIBLE TO ATTEND
The Hon. Mr Justice F Vincent AO QC 6 8 (Chair)Commissioner D Foggo 7 8Elected Deputy Chancellor Professor E Harman or Acting VC 7 8Mr K Latta 7 8Mr G Buckland 7 8Mr K Loughnan AO 5 7Associate Professor M Hamel-Green 3 3Associate Professor M Minchinton 2 5(as of 13 June 2007) Ms T McCluskey 5 8Ms M Lang 0 2
auDit anD risk committee
MEMBER TOTAL NO. ELIGIBLE TO ATTEND
Mr K Latta (Chair) 4 5Dr I Gilmour 5 5Dr R Gould 4 5Mr T Greenwood 5 5Mr A Mayfield 4 5Ms A Hassett 4 5Mr J Watson 2 5
resources committee
MEMBER TOTAL NO. ELIGIBLE TO ATTEND
Professor E Harman or Acting VC 9 10Mr G Buckland (Chair) 10 10Mr J O’Rourke 9 10Ms M Tarrant 4 10Ms T McCluskey 7 10Dr J Doughney 8 10
strategy committee
MEMBER TOTAL NO. ELIGIBLE TO ATTEND
The Hon. Mr Justice F Vincent AO QC 5 6Professor E Harman 6 6Commissioner D Foggo (Chair) 5 6Mr K Loughnan AO 0 4Ms M Haggart 4 6Associate Professor M Hamel-Green 3 3Mr K Baker 3 3Professor R Teese 3 6Mrs A Mantoo 3 6Mr M Zaar 6 6Mr L Tapinos 0 3
nominations committee
MEMBERSThe Hon. Mr Justice F Vincent AO QC (Chair) Associate Professor M Hamel-GreenCommissioner D Foggo Ms T McCluskyProfessor E Harman Mr M LangMr G Buckland Associate Professor M Minchinton – ActingMr K Latta Deputy Chair, ERB (as of 13 June 2007)Mr K Loughnan AO
council anD committees attenDance
33

35
statutes anD regulations maDe or amenDeD During the 2007 calenDar year
THE MINISTER FOR EDUCATION AND TRAINING APPROVED THE FOLLOWING LEGISLATION DURING THE PERIOD 1 JANUARY 2007 TO 31 DECEMBER 2007 Statute 2.5 – Schools of Technical and Further Education (Amendment No. 2) (Made by the Minister for Skills and Workforce Participation on 7
October 2007)
Statute 7.1 – Academic Dress (Revocation) (Made by the Minister for Skills and Workforce Participation on 17 December 2007)
Statute 2.3 – The Faculties (Amendment No. 4) (Made by the Minister for Skills and Workforce Participation on 24 December 2007
COUNCIL APPROVED THE FOLLOWING LEGISLATION DURING THE PERIOD 1 JANUARY 2007 TO 31 DECEMBER 2007
Regulation 2.7 – Discipline (Amendment No. 1) (Made by Council on 26 February 2007)
Regulation 2.2 – Education and Research Board (Amendment No. 4) (Made by Council on 27 August 2007)
Regulation 7.1.1 – Academic Dress (Revocation) (Made by Council on 27 August 2007)
Regulation 2.3.1 – Faculties, Schools, Departments and Heads of Departments (Amendment No. 32) (Made by Council on 10 December 2007)
THE VICE–CHANCELLOR AND PRESIDENT APPROVED (BY DELEGATION) THE FOLLOWING LEGISLATION DURING THE PERIOD 1 JANUARY 2007 TO 31 DECEMBER 2007
Regulation 6.1.4 – Amendment No. 217 to Statute 6.1 – Academic Awards, Programs, Courses and Subjects) (Made by the Vice–Chancellor and President on 15 January 2007)
Regulation 6.1.4 – Amendment No. 219 to Statute 6.1 – Academic Awards, Programs, Courses and Subjects) (Made by the Vice–Chancellor and President on 2 March 2007)
Regulation 6.1.4 – Amendment No. 220 to Statute 6.1 – Academic Awards, Programs, Courses and Subjects) (Made by the Vice–Chancellor and President on 2 March 2007)
Regulation 6.1.4 – Amendment No. 221 to Statute 6.1 – Academic Awards, Programs, Courses and Subjects) (Made by the Vice–Chancellor and President on 13 March 2007)
Regulation 6.1.4 – Amendment No. 222 to Statute 6.1 – Academic Awards, Programs, Courses and Subjects) (Made by the Acting Vice–Chancellor on 5 April 2007)
Regulation 6.1.4 – Amendment No. 202 to Statute 6.1 – Academic Awards, Programs, Courses and Subjects) (Made by the Vice–Chancellor and President on 11 May 2007)
Regulation 6.1.4 – Amendment No. 216 to Statute 6.1 – Academic Awards, Programs, Courses and Subjects) (Made by the Acting Vice–Chancellor on 6 August 2007)
Regulation 6.1.4 – Amendment No. 225 to Statute 6.1 – Academic Awards, Programs, Courses and Subjects) (Made by the Acting Vice–Chancellor on 6 August 2007)
Regulation 6.1.4 – Amendment No. 226 to Statute 6.1 – Academic Awards, Programs, Courses and Subjects) (Made by the Acting Vice–Chancellor on 6 August 2007)
Regulation 6.1.4 – Amendment No. 224 to Statute 6.1 – Academic Awards, Programs, Courses and Subjects) (Made by the Acting Vice–Chancellor on 6 August 2007)
Regulation 6.1.4 – Amendment No. 204 to Statute 6.1 – Academic Awards, Programs, Courses and Subjects) (Made by the Acting Vice–Chancellor on 8 August 2007)
Regulation 6.1.4 – Amendment No. 228 to Statute 6.1 – Academic Awards, Programs, Courses and Subjects) (Made by the Acting Vice–Chancellor on 8 August 2007)
Regulation 6.1.4 – Amendment No. 229 to Statute 6.1 – Academic Awards, Programs, Courses and Subjects) (Made by the Acting Vice–Chancellor on 8 August 2007)
Regulation 6.1.4 – Amendment No. 231 to Statute 6.1 – Academic Awards, Programs, Courses and Subjects) (Made by the Acting Vice–Chancellor on 16 August 2007)
Regulation 6.1.4 – Amendment No. 227 to Statute 6.1 – Academic Awards, Programs, Courses and Subjects) (Made by the Acting Vice–Chancellor on 16 August 2007)
34
university regulations
3534
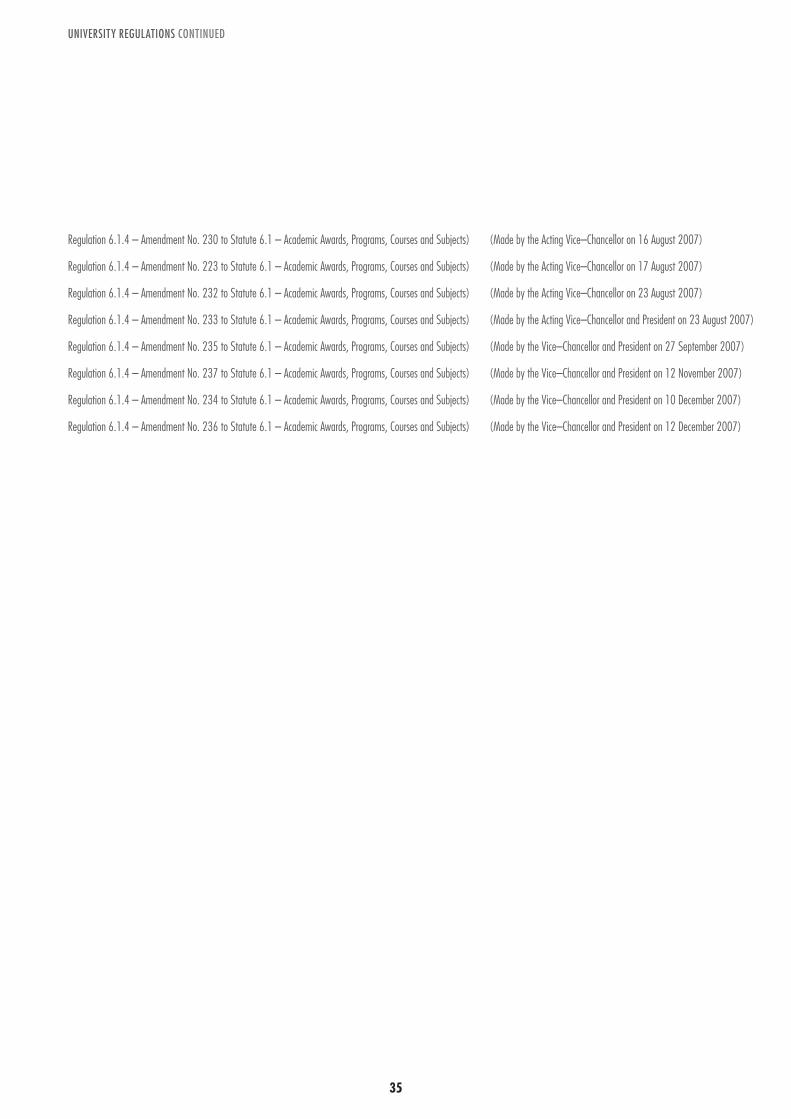
UNIVERSITY REGULATIONS CONTINUED
Regulation 6.1.4 – Amendment No. 230 to Statute 6.1 – Academic Awards, Programs, Courses and Subjects) (Made by the Acting Vice–Chancellor on 16 August 2007)
Regulation 6.1.4 – Amendment No. 223 to Statute 6.1 – Academic Awards, Programs, Courses and Subjects) (Made by the Acting Vice–Chancellor on 17 August 2007)
Regulation 6.1.4 – Amendment No. 232 to Statute 6.1 – Academic Awards, Programs, Courses and Subjects) (Made by the Acting Vice–Chancellor on 23 August 2007)
Regulation 6.1.4 – Amendment No. 233 to Statute 6.1 – Academic Awards, Programs, Courses and Subjects) (Made by the Acting Vice–Chancellor and President on 23 August 2007)
Regulation 6.1.4 – Amendment No. 235 to Statute 6.1 – Academic Awards, Programs, Courses and Subjects) (Made by the Vice–Chancellor and President on 27 September 2007)
Regulation 6.1.4 – Amendment No. 237 to Statute 6.1 – Academic Awards, Programs, Courses and Subjects) (Made by the Vice–Chancellor and President on 12 November 2007)
Regulation 6.1.4 – Amendment No. 234 to Statute 6.1 – Academic Awards, Programs, Courses and Subjects) (Made by the Vice–Chancellor and President on 10 December 2007)
Regulation 6.1.4 – Amendment No. 236 to Statute 6.1 – Academic Awards, Programs, Courses and Subjects) (Made by the Vice–Chancellor and President on 12 December 2007)
37
freeDom ofinformation reporting
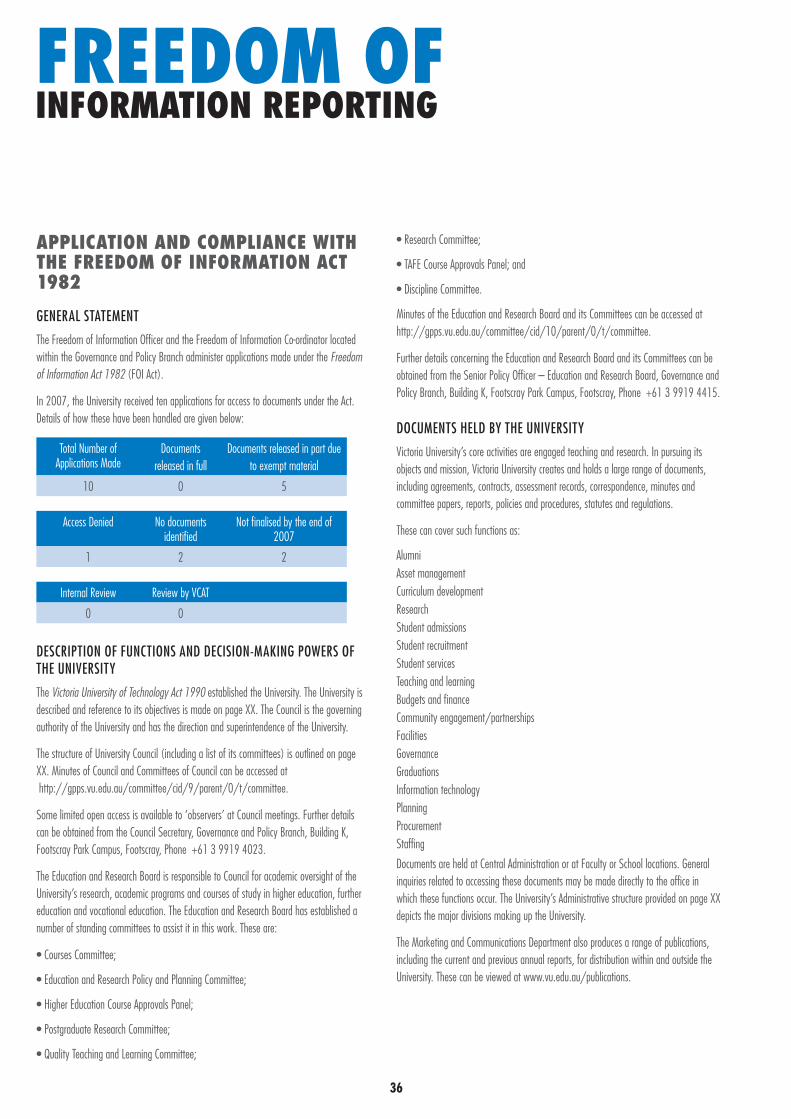
application anD compliance With the freeDom of information act 1982
GENERAL STATEMENT
The Freedom of Information Officer and the Freedom of Information Co-ordinator located within the Governance and Policy Branch administer applications made under the Freedom of Information Act 1982 (FOI Act).
In 2007, the University received ten applications for access to documents under the Act. Details of how these have been handled are given below:
Total Number of Applications Made
Documents released in full
Documents released in part due to exempt material
10 0 5
Access Denied No documents identified
Not finalised by the end of 2007
1 2 2
Internal Review Review by VCAT
0 0
DESCRIPTION OF FUNCTIONS AND DECISION-MAKING POWERS OF THE UNIVERSITY
The Victoria University of Technology Act 1990 established the University. The University is described and reference to its objectives is made on page XX. The Council is the governing authority of the University and has the direction and superintendence of the University.
The structure of University Council (including a list of its committees) is outlined on page XX. Minutes of Council and Committees of Council can be accessed at http://gpps.vu.edu.au/committee/cid/9/parent/0/t/committee.
Some limited open access is available to ‘observers’ at Council meetings. Further details can be obtained from the Council Secretary, Governance and Policy Branch, Building K, Footscray Park Campus, Footscray, Phone +61 3 9919 4023.
The Education and Research Board is responsible to Council for academic oversight of the University’s research, academic programs and courses of study in higher education, further education and vocational education. The Education and Research Board has established a number of standing committees to assist it in this work. These are:
• Courses Committee;
• Education and Research Policy and Planning Committee;
• Higher Education Course Approvals Panel;
• Postgraduate Research Committee;
• Quality Teaching and Learning Committee;
• Research Committee;
• TAFE Course Approvals Panel; and
• Discipline Committee.
Minutes of the Education and Research Board and its Committees can be accessed at http://gpps.vu.edu.au/committee/cid/10/parent/0/t/committee.
Further details concerning the Education and Research Board and its Committees can be obtained from the Senior Policy Officer – Education and Research Board, Governance and Policy Branch, Building K, Footscray Park Campus, Footscray, Phone +61 3 9919 4415.
DOCUMENTS HELD BY THE UNIVERSITY
Victoria University’s core activities are engaged teaching and research. In pursuing its objects and mission, Victoria University creates and holds a large range of documents, including agreements, contracts, assessment records, correspondence, minutes and committee papers, reports, policies and procedures, statutes and regulations.
These can cover such functions as:
AlumniAsset managementCurriculum developmentResearchStudent admissionsStudent recruitmentStudent servicesTeaching and learningBudgets and financeCommunity engagement/partnershipsFacilitiesGovernanceGraduationsInformation technologyPlanningProcurementStaffing
Documents are held at Central Administration or at Faculty or School locations. General inquiries related to accessing these documents may be made directly to the office in which these functions occur. The University’s Administrative structure provided on page XX depicts the major divisions making up the University.
The Marketing and Communications Department also produces a range of publications, including the current and previous annual reports, for distribution within and outside the University. These can be viewed at www.vu.edu.au/publications.
36

3736
INFORMATION ABOUT VICTORIA UNIVERSITY
A wide range of information about the University and its operations is also available from the University’s website at www.vu.edu.au. The website includes reference to the annual university calendar; media releases; admissions information; student information; whistleblower references; and the various faculties, schools and divisions making up the University.
The FOI Web pages at http://gpps.vu.edu.au/freedom/cid/9/parent/0/t/freedom contain a menu of information about the University and links about where to find this, including internal legislation and University policies and procedures.
Consistent with the requirements of the Financial Management Act 1994, Victoria University has prepared material on the following items, details of which are available on request:
• statement regarding declarations of pecuniary interest;
• shares held beneficially by senior officers as nominees of a statutory authority or subsidiary;
• publications;
• changes in prices, fees, charges, rates and levies;
• major external reviews;
• major research and development activities;
• overseas visits undertaken;
• occupational health and safety assessments and measures;
• industrial relations issues; and
• major committees sponsored by Victoria University.
Enquiries regarding details of the above should be addressed to: The Pro Vice-Chancellor (Institutional Services) Dr Rob Brown Victoria University PO Box 14428 Melbourne VIC 8001 Phone +61 3 9919 4005
Major promotional, public relations and marketing actitives by the University in 2007 included:
• Open Day
• Major recruitment campaigns
• Media releases
LIBRARY ACCESS
The University has 12 libraries that are available for use by members of the general public as well as staff and students. Details concerning locations and opening hours can be found at
http://w2.vu.edu.au/library/libraryhours/
PROCEDURE FOR HANDLING REQUESTS
Preliminary inquiries concerning Freedom of Information requests should be made to the FOI Co-ordinator. Formal requests for access to documents in the University’s possession under the Victorian Freedom of Information Act 1982 (FOI Act) are made in writing to:
Mr Murray Dri FOI Co-ordinator Governance and Policy Branch Footscray Park Campus (F116) Victoria University PO Box 14428 Melbourne VIC 8001 Phone +61 3 9919 4118 Fax +61 3 9919 5061
An FOI Request Form is available in PDF format at http://gpps.vu.edu.au/sitebuilder/freedom/knowledge/asset/files/30/foirequestform.doc
Requests must clearly identify that they are made under the FOI Act and be accompanied by the requisite application fee of $22.00. Fees may be waived or reduced in circumstances of financial hardship. Applications for waiver should be directed, in the first instance, to the FOI Co-ordinator. The charges applicable for processing FOI requests are prescribed in the FOI legislation.
Applicants are notified in writing of the decision on a valid request as soon as possible but within 45 days of the receipt of the application. In accordance with the FOI Act, applicants can seek internal review of primary decisions for access. Officers authorised to conduct those reviews are identified in relevant notices to applicants.
The University has established guidelines to assist people with their requests for information. These can be found at
http://gpps.vu.edu.au/freedom/cid/15/parent/1/t/freedom
FREEDOM OF INFORMATION REPORTING CONTINUED
37
38 39
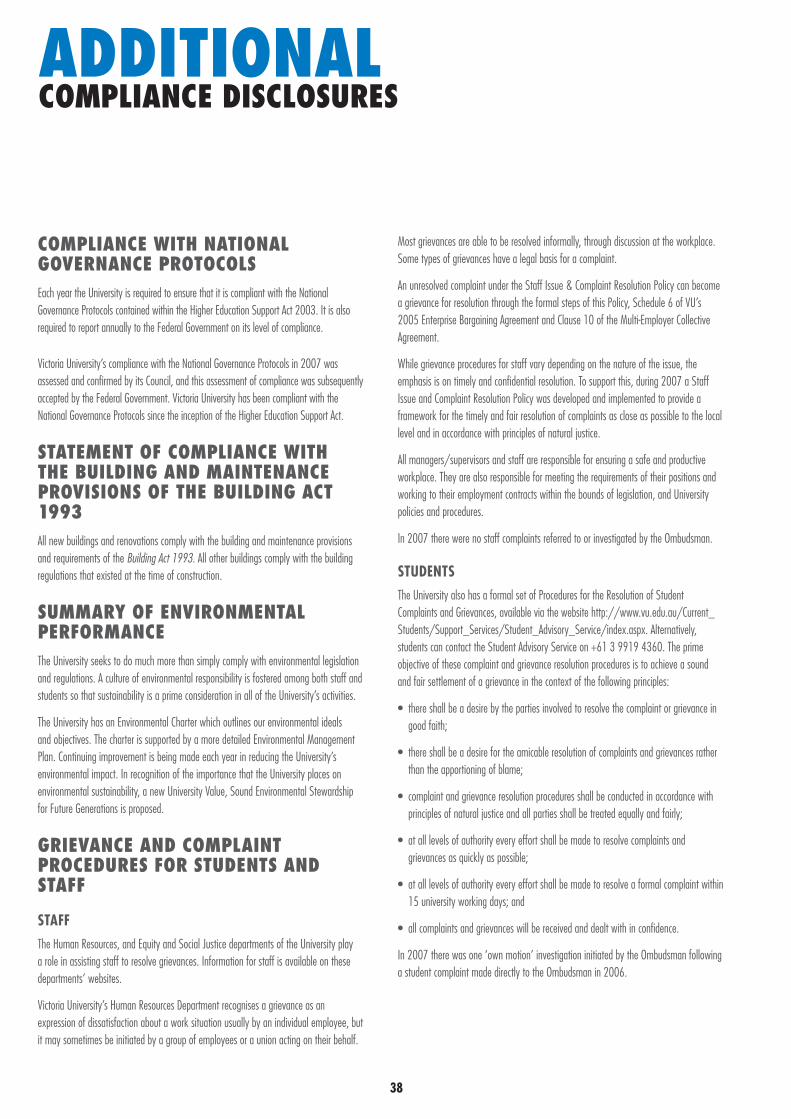
aDDitionalcompliance Disclosures
compliance With national governance protocolsEach year the University is required to ensure that it is compliant with the National Governance Protocols contained within the Higher Education Support Act 2003. It is also required to report annually to the Federal Government on its level of compliance.
Victoria University’s compliance with the National Governance Protocols in 2007 was assessed and confirmed by its Council, and this assessment of compliance was subsequently accepted by the Federal Government. Victoria University has been compliant with the National Governance Protocols since the inception of the Higher Education Support Act.
statement of compliance With the builDing anD maintenance provisions of the builDing act 1993All new buildings and renovations comply with the building and maintenance provisions and requirements of the Building Act 1993. All other buildings comply with the building regulations that existed at the time of construction.
summary of environmental performanceThe University seeks to do much more than simply comply with environmental legislation and regulations. A culture of environmental responsibility is fostered among both staff and students so that sustainability is a prime consideration in all of the University’s activities.
The University has an Environmental Charter which outlines our environmental ideals and objectives. The charter is supported by a more detailed Environmental Management Plan. Continuing improvement is being made each year in reducing the University’s environmental impact. In recognition of the importance that the University places on environmental sustainability, a new University Value, Sound Environmental Stewardship for Future Generations is proposed.
grievance anD complaint proceDures for stuDents anD staff
STAFFThe Human Resources, and Equity and Social Justice departments of the University play a role in assisting staff to resolve grievances. Information for staff is available on these departments’ websites.
Victoria University’s Human Resources Department recognises a grievance as an expression of dissatisfaction about a work situation usually by an individual employee, but it may sometimes be initiated by a group of employees or a union acting on their behalf.
Most grievances are able to be resolved informally, through discussion at the workplace. Some types of grievances have a legal basis for a complaint.
An unresolved complaint under the Staff Issue & Complaint Resolution Policy can become a grievance for resolution through the formal steps of this Policy, Schedule 6 of VU’s 2005 Enterprise Bargaining Agreement and Clause 10 of the Multi-Employer Collective Agreement.
While grievance procedures for staff vary depending on the nature of the issue, the emphasis is on timely and confidential resolution. To support this, during 2007 a Staff Issue and Complaint Resolution Policy was developed and implemented to provide a framework for the timely and fair resolution of complaints as close as possible to the local level and in accordance with principles of natural justice.
All managers/supervisors and staff are responsible for ensuring a safe and productive workplace. They are also responsible for meeting the requirements of their positions and working to their employment contracts within the bounds of legislation, and University policies and procedures.
In 2007 there were no staff complaints referred to or investigated by the Ombudsman.
STUDENTSThe University also has a formal set of Procedures for the Resolution of Student Complaints and Grievances, available via the website http://www.vu.edu.au/Current_Students/Support_Services/Student_Advisory_Service/index.aspx. Alternatively, students can contact the Student Advisory Service on +61 3 9919 4360. The prime objective of these complaint and grievance resolution procedures is to achieve a sound and fair settlement of a grievance in the context of the following principles:
• there shall be a desire by the parties involved to resolve the complaint or grievance in good faith;
• there shall be a desire for the amicable resolution of complaints and grievances rather than the apportioning of blame;
• complaint and grievance resolution procedures shall be conducted in accordance with principles of natural justice and all parties shall be treated equally and fairly;
• at all levels of authority every effort shall be made to resolve complaints and grievances as quickly as possible;
• at all levels of authority every effort shall be made to resolve a formal complaint within 15 university working days; and
• all complaints and grievances will be received and dealt with in confidence.
In 2007 there was one ‘own motion’ investigation initiated by the Ombudsman following a student complaint made directly to the Ombudsman in 2006.
38 39
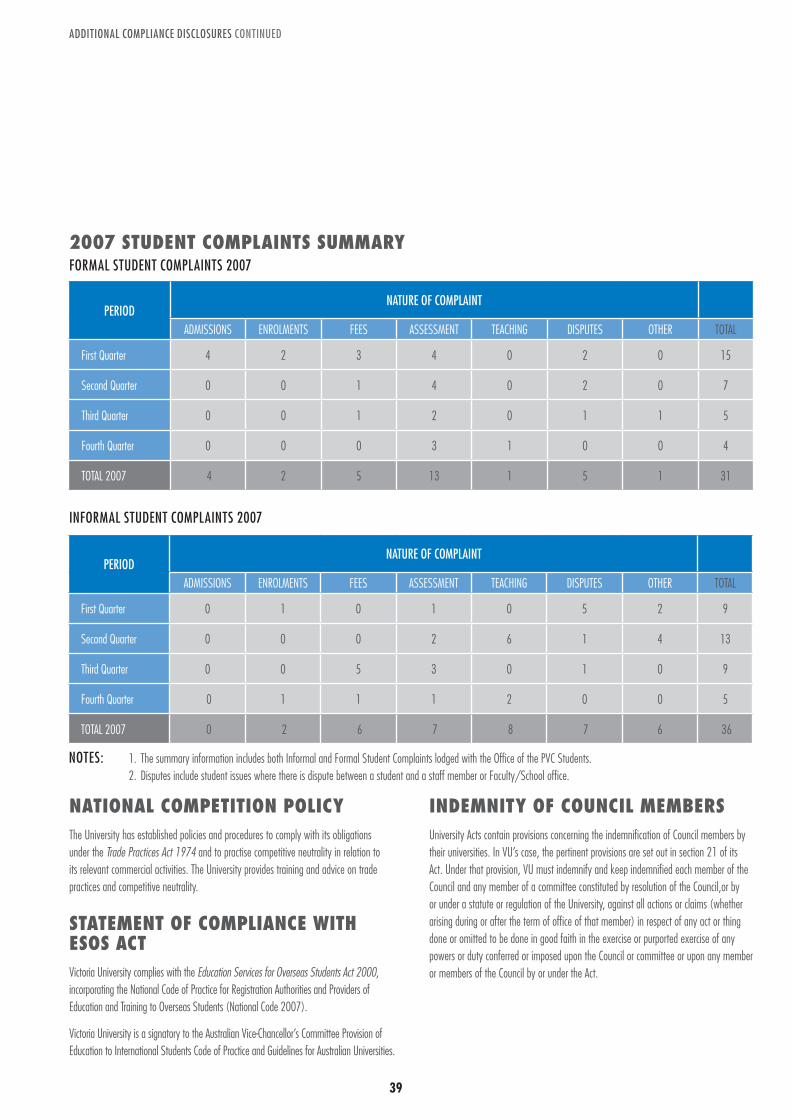
2007 stuDent complaints summary
FORMAL STUDENT COMPLAINTS 2007
INFORMAL STUDENT COMPLAINTS 2007
national competition policy The University has established policies and procedures to comply with its obligations under the Trade Practices Act 1974 and to practise competitive neutrality in relation to its relevant commercial activities. The University provides training and advice on trade practices and competitive neutrality.
statement of compliance With esos actVictoria University complies with the Education Services for Overseas Students Act 2000, incorporating the National Code of Practice for Registration Authorities and Providers of Education and Training to Overseas Students (National Code 2007).
Victoria University is a signatory to the Australian Vice-Chancellor’s Committee Provision of Education to International Students Code of Practice and Guidelines for Australian Universities.
inDemnity of council membersUniversity Acts contain provisions concerning the indemnification of Council members by their universities. In VU’s case, the pertinent provisions are set out in section 21 of its Act. Under that provision, VU must indemnify and keep indemnified each member of the Council and any member of a committee constituted by resolution of the Council,or by or under a statute or regulation of the University, against all actions or claims (whether arising during or after the term of office of that member) in respect of any act or thing done or omitted to be done in good faith in the exercise or purported exercise of any powers or duty conferred or imposed upon the Council or committee or upon any member or members of the Council by or under the Act.
PERIODNATURE OF COMPLAINT
admissions enroLments fees assessment teaChing disputes other totaL
First Quarter 4 2 3 4 0 2 0 15
Second Quarter 0 0 1 4 0 2 0 7
Third Quarter 0 0 1 2 0 1 1 5
Fourth Quarter 0 0 0 3 1 0 0 4
totaL 2007 4 2 5 13 1 5 1 31
ADDITIONAL COMPLIANCE DISCLOSURES CONTINUED
PERIODNATURE OF COMPLAINT
admissions enroLments fees assessment teaChing disputes other totaL
First Quarter 0 1 0 1 0 5 2 9
Second Quarter 0 0 0 2 6 1 4 13
Third Quarter 0 0 5 3 0 1 0 9
Fourth Quarter 0 1 1 1 2 0 0 5
totaL 2007 0 2 6 7 8 7 6 36
NOTES: 1. The summary information includes both Informal and Formal Student Complaints lodged with the Office of the PVC Students. 2. Disputes include student issues where there is dispute between a student and a staff member or Faculty/School office.
inDemnity of senior officersThe University has in place insurance that covers all University officers for:
1. the legal liability of directors or officers of the insured for wrongful acts committed by them on the course of their duties; and
2. the amount the insured organisation is permitted by law to indemnify any of their directors or officers for wrongful acts committed by them in the course of their duties.
Note: ‘Officers’ includes senior officers of the University.
Declarations of interest by council membersAt the beginning of each Council or Council Standing Committee meeting, members of Council and the standing committees are required to declare any interest in relation to the matters being considered by the group at that specific meeting. As a guide, the Council has listed the following as possible areas for conflict of interest:
• employment by, shareholding in, or directorship of a company dealing with the University;
• membership of a body that is in competition or conflict with the University;
• membership of other boards;
• outsourcing or restructuring of work sections by University staff members;
• any matters under discussion that would result in personal financial advantage; and
• in the case of government officials, those who are responsible for any aspect of policy or operations which affect a matter under consideration by the University.
Declarations on all of these matters are formally minuted and retained for reference. The Victoria University Council Code of Conduct, Responsibilities and Protocols also articulate Council members’ responsibilities in relation to conflict of interest and procedures stemming from a potential conflict of interest.
ADDITIONAL COMPLIANCE DISCLOSURES CONTINUED
40
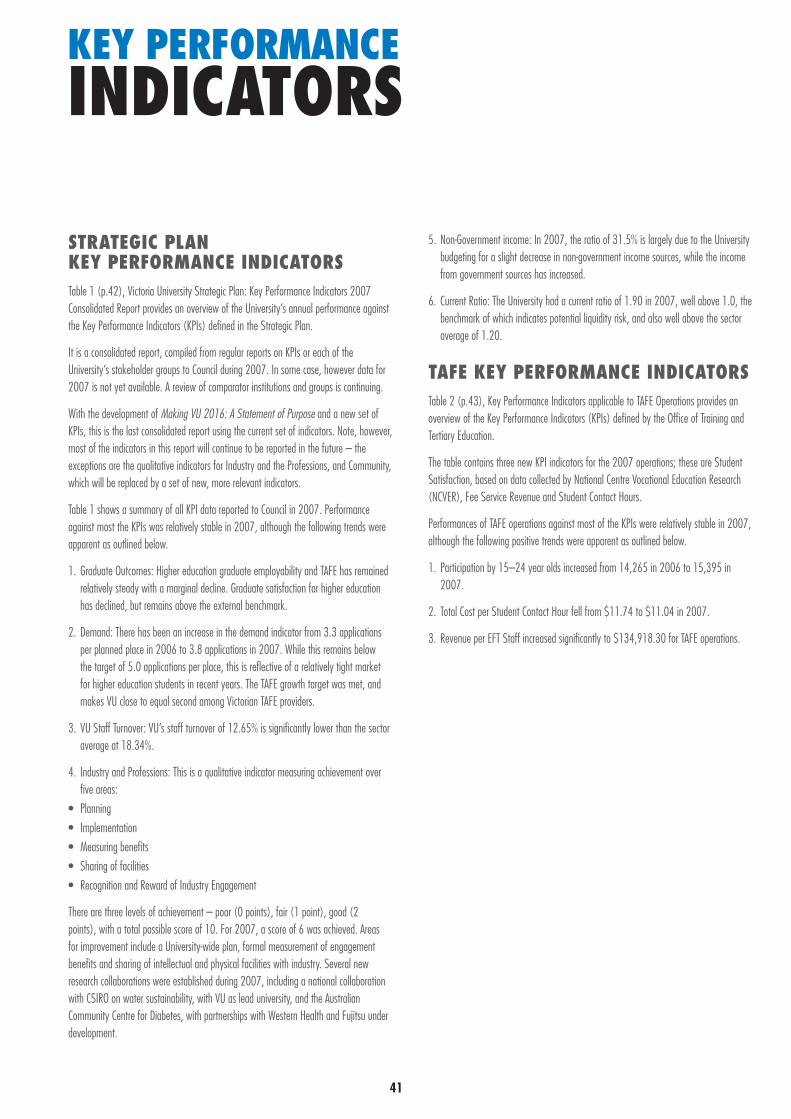
key performanceinDicators
strategic plan key performance inDicatorsTable 1 (p.42), Victoria University Strategic Plan: Key Performance Indicators 2007 Consolidated Report provides an overview of the University’s annual performance against the Key Performance Indicators (KPIs) defined in the Strategic Plan.
It is a consolidated report, compiled from regular reports on KPIs or each of the University’s stakeholder groups to Council during 2007. In some case, however data for 2007 is not yet available. A review of comparator institutions and groups is continuing.
With the development of Making VU 2016: A Statement of Purpose and a new set of KPIs, this is the last consolidated report using the current set of indicators. Note, however, most of the indicators in this report will continue to be reported in the future – the exceptions are the qualitative indicators for Industry and the Professions, and Community, which will be replaced by a set of new, more relevant indicators.
Table 1 shows a summary of all KPI data reported to Council in 2007. Performance against most the KPIs was relatively stable in 2007, although the following trends were apparent as outlined below.
1. Graduate Outcomes: Higher education graduate employability and TAFE has remained relatively steady with a marginal decline. Graduate satisfaction for higher education has declined, but remains above the external benchmark.
2. Demand: There has been an increase in the demand indicator from 3.3 applications per planned place in 2006 to 3.8 applications in 2007. While this remains below the target of 5.0 applications per place, this is reflective of a relatively tight market for higher education students in recent years. The TAFE growth target was met, and makes VU close to equal second among Victorian TAFE providers.
3. VU Staff Turnover: VU’s staff turnover of 12.65% is significantly lower than the sector average at 18.34%.
4. Industry and Professions: This is a qualitative indicator measuring achievement over five areas:
• Planning• Implementation• Measuring benefits• Sharing of facilities• Recognition and Reward of Industry Engagement
There are three levels of achievement – poor (0 points), fair (1 point), good (2 points), with a total possible score of 10. For 2007, a score of 6 was achieved. Areas for improvement include a University-wide plan, formal measurement of engagement benefits and sharing of intellectual and physical facilities with industry. Several new research collaborations were established during 2007, including a national collaboration with CSIRO on water sustainability, with VU as lead university, and the Australian Community Centre for Diabetes, with partnerships with Western Health and Fujitsu under development.
5. Non-Government income: In 2007, the ratio of 31.5% is largely due to the University budgeting for a slight decrease in non-government income sources, while the income from government sources has increased.
6. Current Ratio: The University had a current ratio of 1.90 in 2007, well above 1.0, the benchmark of which indicates potential liquidity risk, and also well above the sector average of 1.20.
tafe key performance inDicatorsTable 2 (p.43), Key Performance Indicators applicable to TAFE Operations provides an overview of the Key Performance Indicators (KPIs) defined by the Office of Training and Tertiary Education.
The table contains three new KPI indicators for the 2007 operations; these are Student Satisfaction, based on data collected by National Centre Vocational Education Research (NCVER), Fee Service Revenue and Student Contact Hours.
Performances of TAFE operations against most of the KPIs were relatively stable in 2007, although the following positive trends were apparent as outlined below.
1. Participation by 15–24 year olds increased from 14,265 in 2006 to 15,395 in 2007.
2. Total Cost per Student Contact Hour fell from $11.74 to $11.04 in 2007.
3. Revenue per EFT Staff increased significantly to $134,918.30 for TAFE operations.
41

42
TABL
E 1: V
ictor
ia Un
iversi
ty St
rate
gic P
lan: K
ey P
erfo
rman
ce In
dicat
ors 2
005–
2007
Cons
olida
ted
Repo
rt
KEY P
ERFO
RMAN
CE IN
DICA
TOR
2005
EXTE
RNAL
BE
NCHM
ARK
2006
EXTE
RNAL
BE
NCHM
ARK
2007
EXTE
RNAL
BENC
HMAR
K
STUD
ENTS
gRAD
UATE
OUT
COME
S: GR
ADUA
TE EM
PLOY
ABILI
TY
– H
igher
Educ
ation
(Sou
rce Gr
adua
te Ca
reers
Austr
alia)
72
.8%
UWS 7
3.2%
78.8
%UW
S 72.
8%
76.3
%NG
U 79
.7%
– TA
FE (S
ource
Grad
uate
Caree
rs Au
strali
a (AG
S) )
74
.9%
76.8
%79
.2%
GRAD
UATE
COUR
SE SA
TISFA
CTIO
N–
Highe
r Edu
cation
(AGS
Cours
e Exp
erien
ce Qu
estion
naire
- mea
n scor
e)42
.4UW
S 35.
342
.6UW
S 31.
7 38
.7NG
U 36
.9
– TA
FE (A
GS Co
urse E
xperi
ence
Quest
ionna
ire - m
ean s
core)
55.3
54.2
51.6
DEMA
ND
– H
igher
Educ
ation
(pref
erenc
es to
plann
ed in
take)
4.7%
–3.
3 –
3.8
– Vo
catio
nal E
duca
tion (
VE) (
VU Sh
are of
Top 3
VTAC
Prefe
rences
)11
.5%
12.5
% all
VE
10.4
%12
.5%
all VE
11
.5 %
12.5
% all
VE
STAF
F
STAF
F RET
ENTIO
N/RE
NEWA
L–
Turno
ver
8.2%
15.6
8% al
l unis
11.8
1%18
.34%
all u
nis12
.65%
Unde
r revie
w
– N
ew Ap
point
ments
8.
7%–
5.91
%–
9.78
%Un
der re
view
Staff
satis
factio
n (Ba
sed on
selec
ted th
ree qu
estion
s in t
he Vo
iceIt s
urvey
) VU
Voice
It Su
rvey i
s und
ertak
en bi
annu
ally w
ith su
rveys
cond
ucted
in 2
004
and
2006
and r
eport
ed th
e foll
owing
year
69%¬
70%
Benc
hmark
Un
iversi
ties
Newc
astle
and C
SU–
69%¬
69%
Benc
hmark
Univ
ersitie
s Ne
wcas
tle, C
SU, G
riffths
, Swi
nburn
e, Ad
elaide
and M
acqu
arie
–
Lost
time (
hours
of le
ave f
rom ac
cepted
Work
cove
r clai
ms)
1208
8.00 h
rs–
1692
4.56
hrs
–12
594.
63 hr
s–
Quali
ty of
Teach
ing (m
ean)
44
.4–
42.6
–39
.0¬¬
–
INDU
STRY
AND
THE P
ROFE
SSIO
NSRe
search
Activ
ity (c
onso
lidate
d rese
arch i
ndex
)19.
65.
5 av
g NGU
s7.
6 Th
e 200
6 CR
I figu
re is
distor
ted by
an
acco
untin
g adju
stmen
t in re
porte
d rese
arch
comp
letion
s
6.8
avg N
GUs
Not c
urren
tly av
ailab
leNo
t curr
ently
avail
able
Indus
try En
gage
ment
(comp
osite
inde
x intr
oduc
ed in
200
6)N/
A_–
Achie
ved t
arget
of 5
Achie
ved t
arget
of 6
COMM
UNITY
Comm
unity
enga
geme
nt (co
mpos
ite in
dex i
ntrod
uced
in 2
006)
N/A_
–Ac
hieve
d targ
et. Al
l leve
l 1 in
dicato
rs sco
red 5
Achie
ved t
arget.
All le
vel 2
indic
tors
score
10
GOVE
RNME
NTS A
ND TH
E PUB
LICNo
n-gov
ernme
nt: go
vernm
ent in
come
ratio
36
:64
37:6
3 av
g NGU
s36
:64
39:6
1 av
g NGU
s31
:69
42:5
8 av
g. Hig
her E
d. pro
viders
in
Austr
alia
Curre
nt rat
io (liq
uidity
ratio
– be
low 1
.0 =
a po
tentia
l risk
)2.
131.
46 av
g NGU
s2.
871.
75 av
g NGU
s1.
91.
20 av
g. Hig
her E
d. pro
viders
in Au
strali
a
Effect
ivene
ss of
gove
rnanc
e bod
iesNa
rrativ
e rep
ort pr
ovide
d to
Coun
cil. Co
uncil,
Acad
emic
Board
an
d VEB
met
all ob
jectiv
es in
2005
Repo
rt pro
vided
to Co
uncil
indica
ting t
hat g
overn
ance
bodie
s had
acted
effect
ively
in 20
06
Repo
rt pro
vided
to Co
uncil
indica
ting t
hat g
overn
ance
bodie
s had
acted
effec
tively
in 2
007
¬No
te da
ta co
llecti
on la
gs by
one y
ear
¬¬
The m
ean s
core
value
of 3
9.0
stated
for 2
007
equa
tes to
a me
an sc
ore va
lue on
3.7
8 ba
sed on
a fiv
e-poin
t sati
sfacti
on sc
ale
KEY PERFORMANCE INDICATORS CONTINUED

42 43
YEAR TAFE EFTSL % ELECTRICITY GAS SPACE INCREASE (M2)
CONSUMPTION (GJ) GREEN (GJ) 2007 CONSUMPTION (GJ)1999 44.5% 34,910 34,879 254,885
2007 46.8% 53,874 5874 45,299 288,804
Variation up 2.3% up 54% up 30% up 13%
KEY PERFORMANCE INDICATORS (KPI)
KPI DEFINITION 2007strategiC aLignment
Participation of 15 – 24 Year olds No. of Students within the age group 15,395
Participation of 25 – 64 Year olds No. of Students within the age group 10,669
training outComes
Module Load Completion Rate Scheduled hours assessed and passed or satisfactorily completed / Total scheduled hours reported less hours recorded with Credit Transfer and continuing studies outcomes.
79.00%
New – Student Satisfaction Proportion of graduates satisfied with the overall quality of training 88.40%
finanCiaL management
Total Cost per Student Contact Hour (SCH) Total funded expenditure (excl Depreciation) / Total SCH $11.04
Working Capital Ratio Current Assets / Current Liabilities (adjusted for non-current LSL) 1.25
Net Operating Margin Funded Operating Surplus / Total Revenue (excl Capital) 2.51%
New – Fee for Service Revenue Fee for Service Revenue/Total Revenue (%) 17.57%
organisationaL management
Revenue per EFT Staff Total Revenue (excl Capital) / Average EFT Staff $134,918.30
New – Student Contact Hours Total number of student contact hours delivered against contracted delivery 9,566,182
environment
Energy Consumption Percentage reduction in energy consumption for Electricity, Gas, LPG, Green Power and Heating Oil see table below
NOTE 1: TAFE consumption is determined by calculating the electricity and gas used at all University campuses and factored by the TAFE EFTSL for the particular year. TAFE EFTSL for 2007 is 2.3% greater than that in 1999. TAFE EFTSL based on Reportable EFTSL. Between 1999 and 2007 the University has had an increase in building m2. The additional space is 33920m2.
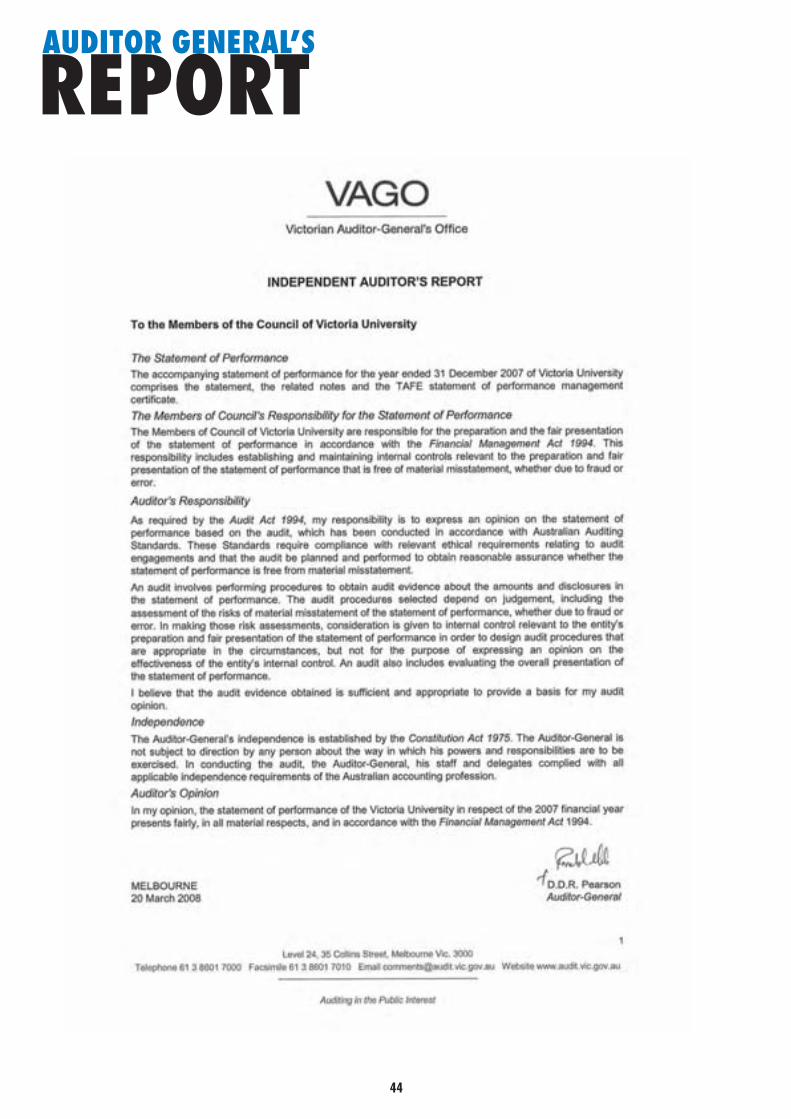
44
auDitor general’s
report

44 45
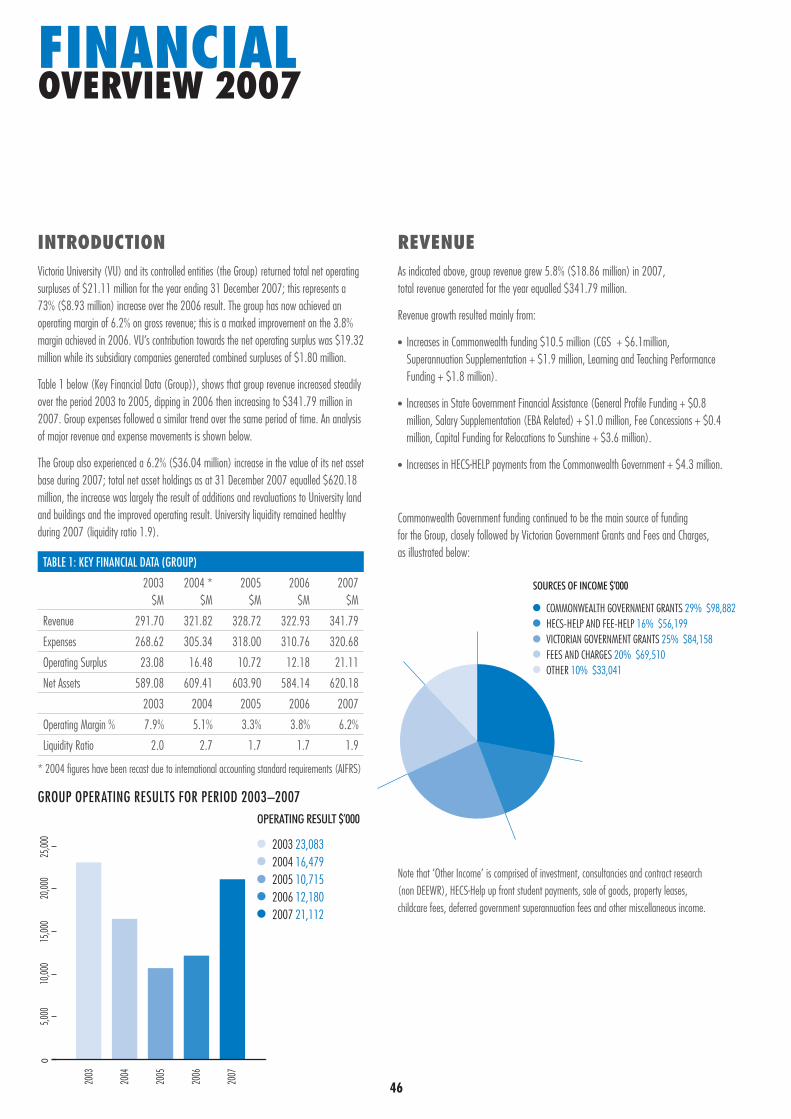
46 47
financial overvieW 2007
introDuctionVictoria University (VU) and its controlled entities (the Group) returned total net operating surpluses of $21.11 million for the year ending 31 December 2007; this represents a 73% ($8.93 million) increase over the 2006 result. The group has now achieved an operating margin of 6.2% on gross revenue; this is a marked improvement on the 3.8% margin achieved in 2006. VU’s contribution towards the net operating surplus was $19.32 million while its subsidiary companies generated combined surpluses of $1.80 million.
Table 1 below (Key Financial Data (Group)), shows that group revenue increased steadily over the period 2003 to 2005, dipping in 2006 then increasing to $341.79 million in 2007. Group expenses followed a similar trend over the same period of time. An analysis of major revenue and expense movements is shown below.
The Group also experienced a 6.2% ($36.04 million) increase in the value of its net asset base during 2007; total net asset holdings as at 31 December 2007 equalled $620.18 million, the increase was largely the result of additions and revaluations to University land and buildings and the improved operating result. University liquidity remained healthy during 2007 (liquidity ratio 1.9).
TABLE 1: KEY FINANCIAL DATA (GROUP)
2003 $M
2004 * $M
2005 $M
2006 $M
2007 $M
Revenue 291.70 321.82 328.72 322.93 341.79
Expenses 268.62 305.34 318.00 310.76 320.68
Operating Surplus 23.08 16.48 10.72 12.18 21.11
Net Assets 589.08 609.41 603.90 584.14 620.18
2003 2004 2005 2006 2007
Operating Margin % 7.9% 5.1% 3.3% 3.8% 6.2%
Liquidity Ratio 2.0 2.7 1.7 1.7 1.9
* 2004 figures have been recast due to international accounting standard requirements (AIFRS)
GROUP OPERATING RESULTS FOR PERIOD 2003–2007
revenue As indicated above, group revenue grew 5.8% ($18.86 million) in 2007, total revenue generated for the year equalled $341.79 million.
Revenue growth resulted mainly from:
• Increases in Commonwealth funding $10.5 million (CGS + $6.1million, Superannuation Supplementation + $1.9 million, Learning and Teaching Performance Funding + $1.8 million).
• Increases in State Government Financial Assistance (General Profile Funding + $0.8 million, Salary Supplementation (EBA Related) + $1.0 million, Fee Concessions + $0.4 million, Capital Funding for Relocations to Sunshine + $3.6 million).
• Increases in HECS-HELP payments from the Commonwealth Government + $4.3 million.
Commonwealth Government funding continued to be the main source of funding for the Group, closely followed by Victorian Government Grants and Fees and Charges, as illustrated below:
Note that ‘Other Income’ is comprised of investment, consultancies and contract research (non DEEWR), HECS-Help up front student payments, sale of goods, property leases, childcare fees, deferred government superannuation fees and other miscellaneous income.
SOURCES OF INCOME $’000
COMMONWEALTH GOVERNMENT GRANTS 29% $98,882 HECS-HELP AND FEE-HELP 16% $56,199 VICTORIAN GOVERNMENT GRANTS 25% $84,158 FEES AND CHARGES 20% $69,510 OTHER 10% $33,041
05,0
0010
,000
15,00
020
,000
25,00
0
2003
2004
2005
2006
2007
OPERATING RESULT $’000
2003 23,083 2004 16,479 2005 10,715 2006 12,180 2007 21,112

46 47
EXPENDITURE $’000
EMPLOYEE BENEFITS AND ON COSTS 65% $208,125 DEPRECIATION AND AMORTISATION 5% $16,716 REPAIRS AND MAINTENANCE 5% $16,480 OTHER EXPENSES 25% $79,357
expensesThe group experienced a 3% ($10 million) increase in expenses during the 2007 year with total expenses equalling $320.68 million. Employee benefits were the largest expense category accounting for 65% of total expenses. In terms of expense growth, the main factors contributing to this were:
• Increases in employee benefits (+$8.0 million), this was largely the result of EBA salary increases and payments relating to staff departures.
• Increases in repairs and maintenance (+$1.4 million). Increases in minor works being the main factor contributing to the increase.
• Increase in other expenses (+$2.5 million). Increases in Scholarship, Grants and Prizes, and Fees and Subscriptions being the main contributors to the increase.
• These increases were partly offset by the reductions in superannuation expenses relating to unfunded superannuation liabilities.
The following graph shows the composition of the group’s main expense categories:
The main components of ‘Other Expenses’ are scholarships, grants and prizes, telecommunications, non-capitalised equipment, travel and staff development, energy costs, inventory used, printing and stationary, consumables, postage, advertising/marketing, and legal and professional fees.
Note: employee benefits include deferred expenditure relating to unfunded superannuation liabilities.
compliance With the higher eDucation support act (hesa)The University has continued to meet the reporting and compliance requirements of the Higher Education Support Act.
report on key performance inDicatorsThe Strategic Plan establishes Key Performance Indicators (KPIs) against which outcomes are monitored and reported as indicators of progress towards the achievement of strategic objectives.
The non-government income ratio (with HECS included as Government Income) measures the proportion of University revenue generated from non-government income sources as a proportion of total income. There has been little change in this ratio in recent years. Measured against our benchmark competitors, Higher Education Providers in Australia (Sector), the contribution of non-government to government income remains below the benchmark ratio of 42:58 (2006 Sector benchmark); VU’s ratio for 2007 was 31:69.
The current ratio KPI is a liquidity ratio measuring the University’s ability to meet its short-term financial obligations. A ratio of less than 1.0 is an indication of potential liquidity risk. At 31 December 2007, VU’s current ratio was a healthy 1.90 compared to the Sector benchmark of 1.20 (2006).
The group’s operating margin of 6.2% was slightly lower than the 2006 Sector benchmark rate of 8.0%.
FINANCIAL OVERVIEW CONTINUED
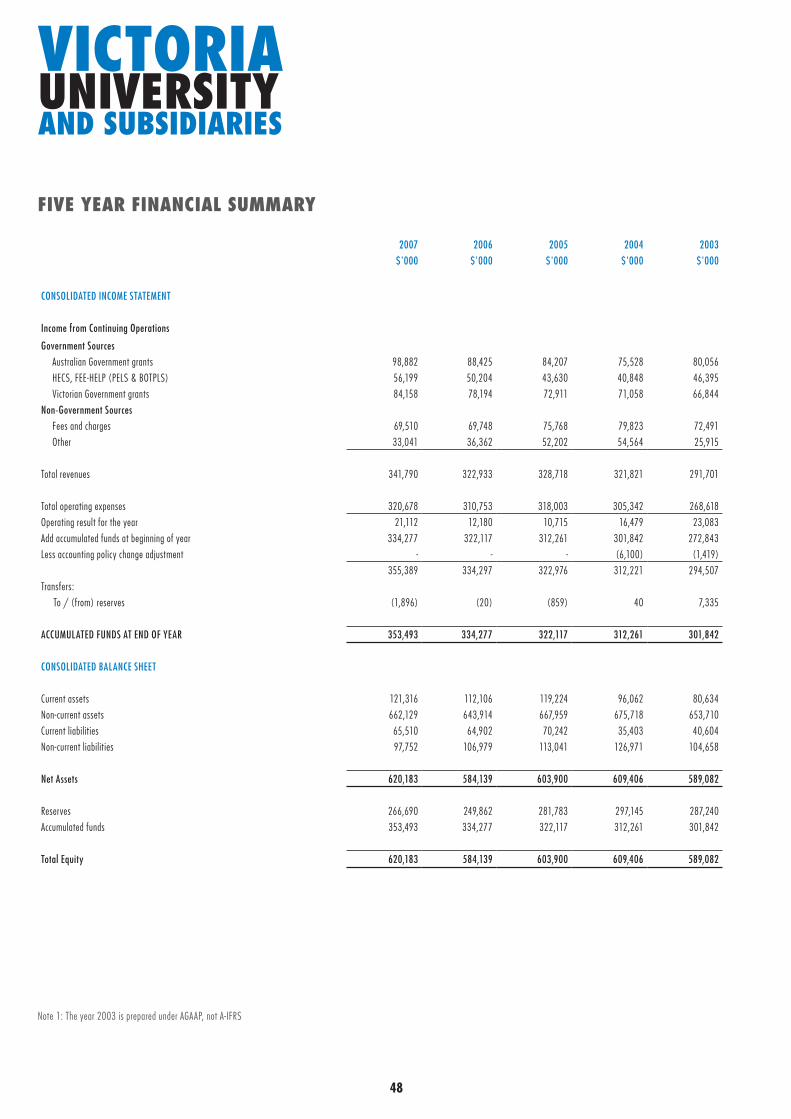
48
victoria university anD subsiDiaries
five year financial summary
2007 2006 2005 2004 2003$'000 $'000 $'000 $'000 $'000
CONSOLIDATED INCOME STATEMENT
Income from Continuing Operations
Government Sources Australian Government grants 98,882 88,425 84,207 75,528 80,056 HECS, FEE-HELP (PELS & BOTPLS) 56,199 50,204 43,630 40,848 46,395 Victorian Government grants 84,158 78,194 72,911 71,058 66,844 Non-Government Sources Fees and charges 69,510 69,748 75,768 79,823 72,491 Other 33,041 36,362 52,202 54,564 25,915
Total revenues 341,790 322,933 328,718 321,821 291,701
Total operating expenses 320,678 310,753 318,003 305,342 268,618 Operating result for the year 21,112 12,180 10,715 16,479 23,083 Add accumulated funds at beginning of year 334,277 322,117 312,261 301,842 272,843 Less accounting policy change adjustment - - - (6,100) (1,419)
355,389 334,297 322,976 312,221 294,507 Transfers: To / (from) reserves (1,896) (20) (859) 40 7,335
ACCUMULATED FUNDS AT END OF YEAR 353,493 334,277 322,117 312,261 301,842
CONSOLIDATED BALANCE SHEET
Current assets 121,316 112,106 119,224 96,062 80,634 Non-current assets 662,129 643,914 667,959 675,718 653,710 Current liabilit ies 65,510 64,902 70,242 35,403 40,604 Non-current liabilit ies 97,752 106,979 113,041 126,971 104,658
Net Assets 620,183 584,139 603,900 609,406 589,082
Reserves 266,690 249,862 281,783 297,145 287,240 Accumulated funds 353,493 334,277 322,117 312,261 301,842
Total Equity 620,183 584,139 603,900 609,406 589,082
Note 1: The year 2003 is prepared under AGAAP, not A-IFRS
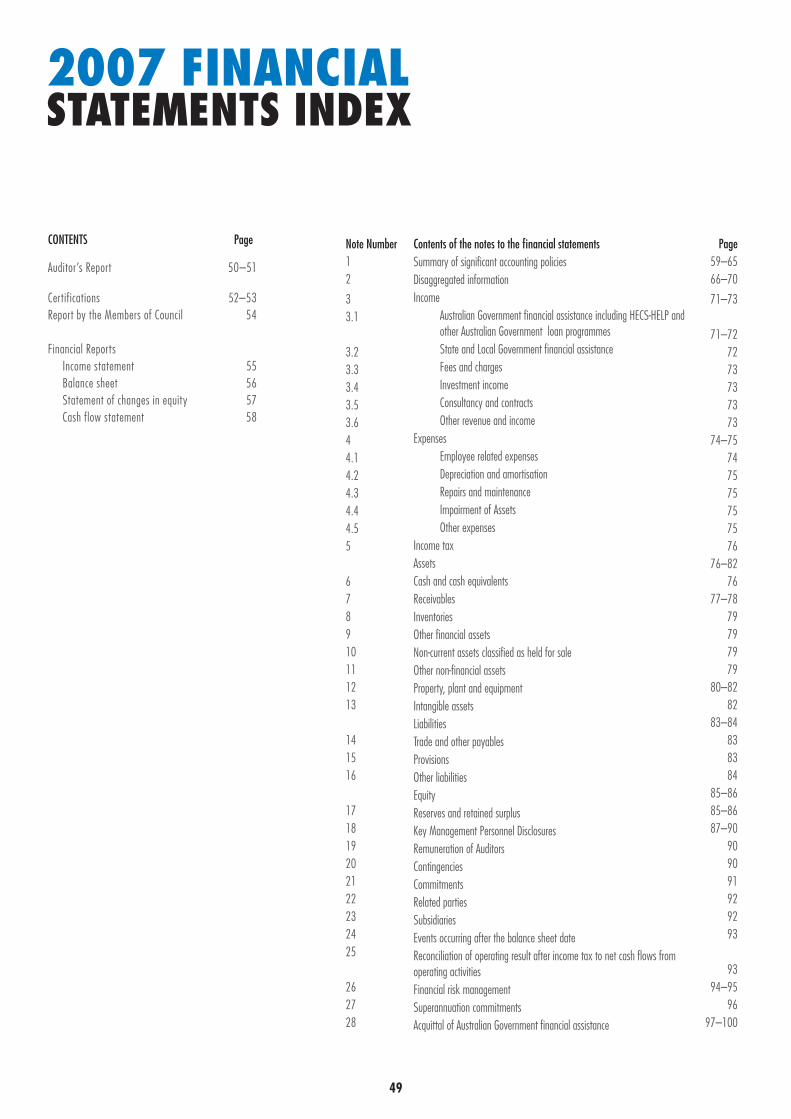
48
Note Number Contents of the notes to the financial statementsSummary of significant accounting policiesDisaggregated information Income Australian Government financial assistance including HECS-HELP and
other Australian Government loan programmes State and Local Government financial assistance Fees and charges Investment income Consultancy and contracts Other revenue and incomeExpenses Employee related expenses Depreciation and amortisation Repairs and maintenance Impairment of Assets Other expensesIncome taxAssetsCash and cash equivalentsReceivablesInventoriesOther financial assetsNon-current assets classified as held for saleOther non-financial assetsProperty, plant and equipmentIntangible assetsLiabilitiesTrade and other payablesProvisions Other liabilitiesEquityReserves and retained surplusKey Management Personnel DisclosuresRemuneration of AuditorsContingenciesCommitmentsRelated partiesSubsidiariesEvents occurring after the balance sheet date Reconciliation of operating result after income tax to net cash flows from operating activitiesFinancial risk managementSuperannuation commitmentsAcquittal of Australian Government financial assistance
Page1 59–652 66–70
3 71–733.1
71–723.2 723.3 733.4 733.5 733.6 734 74–754.1 744.2 754.3 754.4 754.5 755 76
76–826 767 77–788 799 7910 7911 7912 80–8213 82
83–8414 8315 8316 84
85–8617 85–8618 87–9019 9020 9021 9122 9223 9224 9325
9326 94–952728
9697–100
2007 financial statements inDex
CONTENTS Page
Auditor’s Report 50–51
Certifications 52–53Report by the Members of Council 54
Financial Reports
Income statement 55 Balance sheet 56 Statement of changes in equity 57 Cash flow statement 58
49

auDitor general’s
report
50

50 51
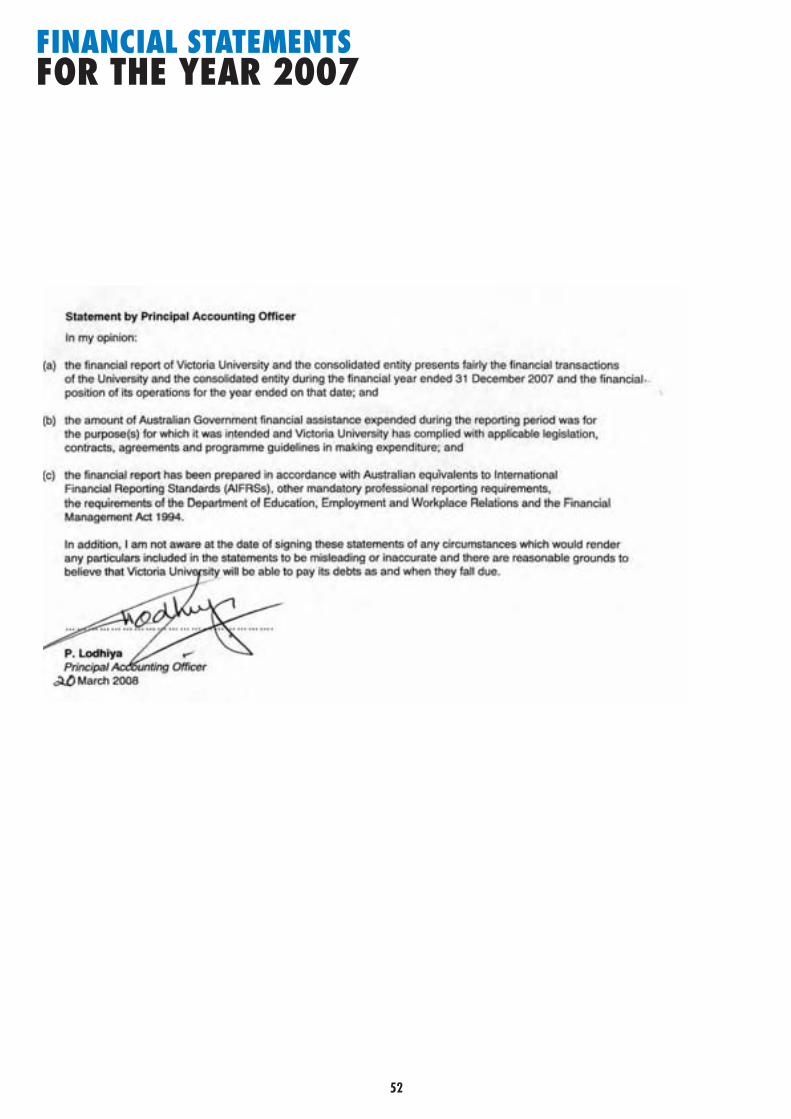
52
financial statements for the year 2007

52 53
financial statements for the year 2007
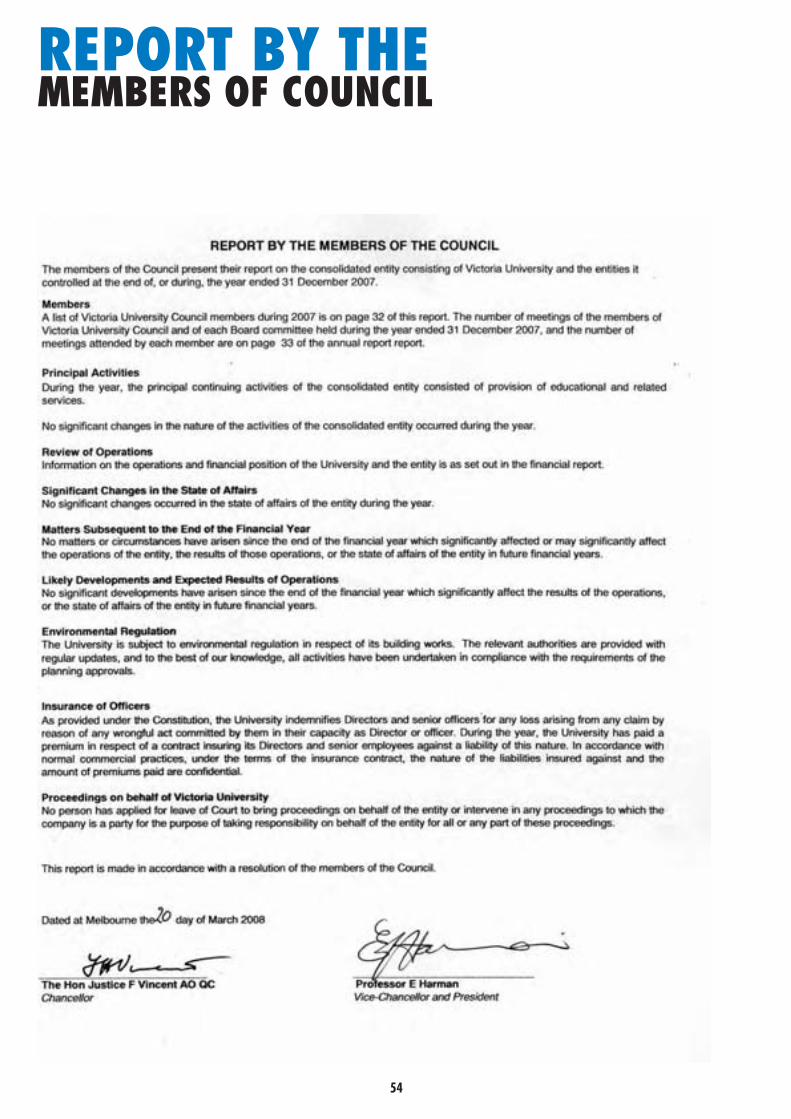
55
report by the members of council
54
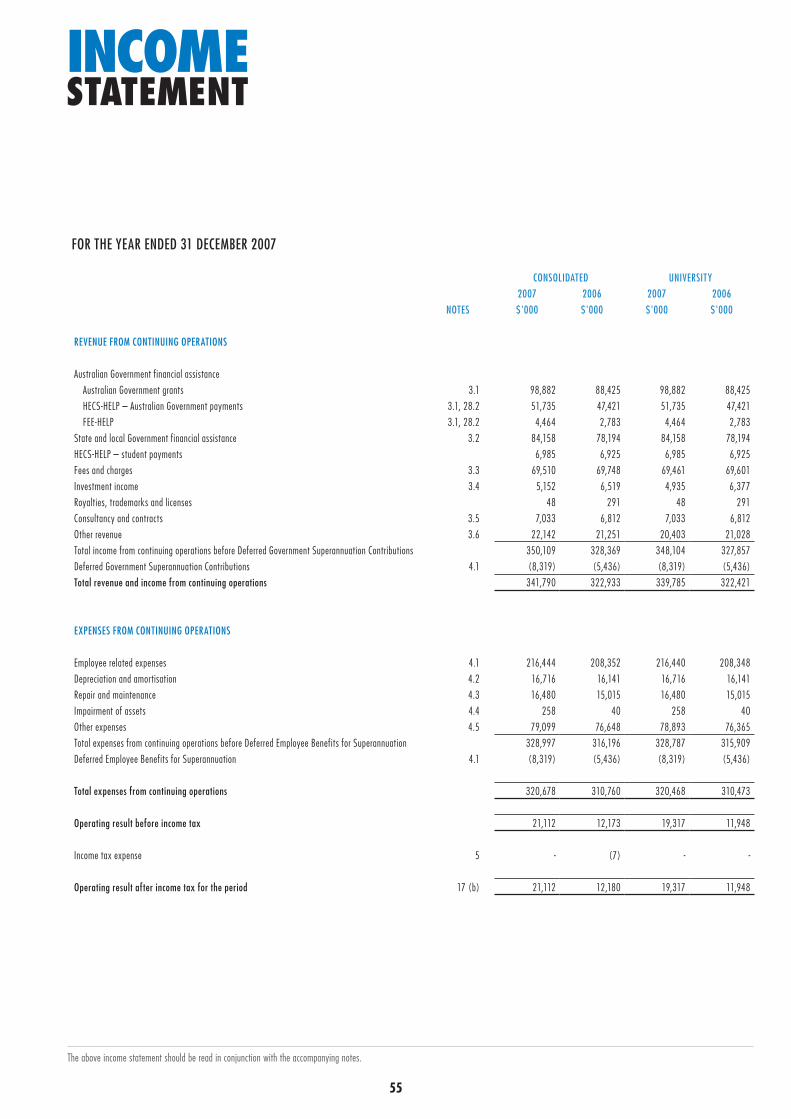
55
income statement
FOR THE YEAR ENDED 31 DECEMBER 2007
CONSOLIDATED UNIVERSITY 2007 2006 2007 2006
NOTES $'000 $'000 $'000 $'000
REVENUE FROM CONTINUING OPERATIONS
Australian Government financial assistance Australian Government grants 3.1 98,882 88,425 98,882 88,425 HECS-HELP – Australian Government payments 3.1, 28.2 51,735 47,421 51,735 47,421 fee-heLp 3.1, 28.2 4,464 2,783 4,464 2,783 State and local Government financial assistance 3.2 84,158 78,194 84,158 78,194 HECS-HELP – student payments 6,985 6,925 6,985 6,925 Fees and charges 3.3 69,510 69,748 69,461 69,601 Investment income 3.4 5,152 6,519 4,935 6,377 Royalties, trademarks and licenses 48 291 48 291 Consultancy and contracts 3.5 7,033 6,812 7,033 6,812 Other revenue 3.6 22,142 21,251 20,403 21,028 Total income from continuing operations before Deferred Government Superannuation Contributions 350,109 328,369 348,104 327,857 Deferred Government Superannuation Contributions 4.1 (8,319) (5,436) (8,319) (5,436) Total revenue and income from continuing operations 341,790 322,933 339,785 322,421
EXPENSES FROM CONTINUING OPERATIONS
Employee related expenses 4.1 216,444 208,352 216,440 208,348 Depreciation and amortisation 4.2 16,716 16,141 16,716 16,141 Repair and maintenance 4.3 16,480 15,015 16,480 15,015 Impairment of assets 4.4 258 40 258 40 Other expenses 4.5 79,099 76,648 78,893 76,365 Total expenses from continuing operations before Deferred Employee Benefits for Superannuation 328,997 316,196 328,787 315,909 Deferred Employee Benefits for Superannuation 4.1 (8,319) (5,436) (8,319) (5,436)
Total expenses from continuing operations 320,678 310,760 320,468 310,473
Operating result before income tax 21,112 12,173 19,317 11,948
Income tax expense 5 - (7) - -
Operating result after income tax for the period 17 (b) 21,112 12,180 19,317 11,948
The above income statement should be read in conjunction with the accompanying notes.
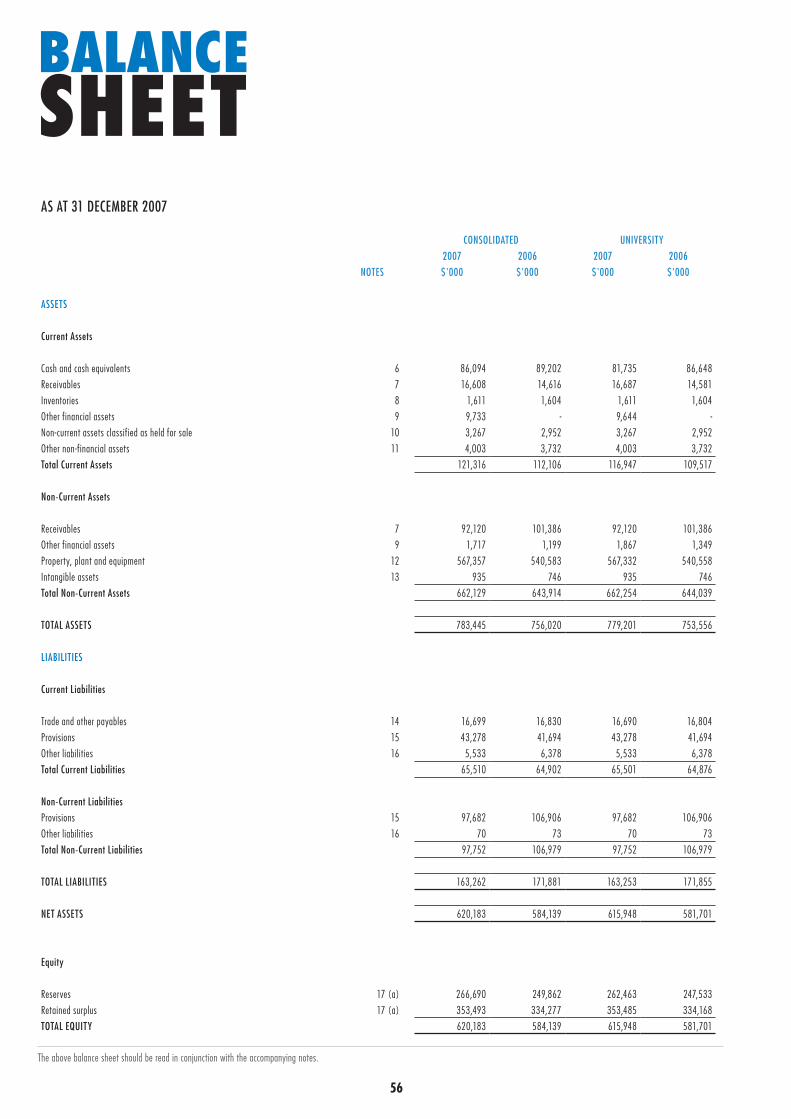
56
balance
sheetAS AT 31 DECEMBER 2007
CONSOLIDATED UNIVERSITY 2007 2006 2007 2006
NOTES $'000 $'000 $'000 $'000
ASSETS
Current Assets
Cash and cash equivalents 6 86,094 89,202 81,735 86,648 Receivables 7 16,608 14,616 16,687 14,581 Inventories 8 1,611 1,604 1,611 1,604 Other financial assets 9 9,733 - 9,644 - Non-current assets classified as held for sale 10 3,267 2,952 3,267 2,952 Other non-financial assets 11 4,003 3,732 4,003 3,732 Total Current Assets 121,316 112,106 116,947 109,517
Non-Current Assets
Receivables 7 92,120 101,386 92,120 101,386 Other financial assets 9 1,717 1,199 1,867 1,349 Property, plant and equipment 12 567,357 540,583 567,332 540,558 Intangible assets 13 935 746 935 746 Total Non-Current Assets 662,129 643,914 662,254 644,039
TOTAL ASSETS 783,445 756,020 779,201 753,556
LIABILITIES
Current Liabilities
Trade and other payables 14 16,699 16,830 16,690 16,804 Provisions 15 43,278 41,694 43,278 41,694 Other liabilit ies 16 5,533 6,378 5,533 6,378 Total Current Liabilities 65,510 64,902 65,501 64,876
Non-Current Liabilities Provisions 15 97,682 106,906 97,682 106,906 Other liabilit ies 16 70 73 70 73 Total Non-Current Liabilities 97,752 106,979 97,752 106,979
TOTAL LIABILITIES 163,262 171,881 163,253 171,855
NET ASSETS 620,183 584,139 615,948 581,701
Equity
Reserves 17 (a) 266,690 249,862 262,463 247,533 Retained surplus 17 (a) 353,493 334,277 353,485 334,168 TOTAL EQUITY 620,183 584,139 615,948 581,701
The above balance sheet should be read in conjunction with the accompanying notes.

56 57
statement of changes
in equity
STATEMENT OF CHANGES IN EQUITY FOR THE YEAR ENDED 31 DECEMBER 2007
CONSOLIDATED UNIVERSITY 2007 2006 2007 2006
NOTES $'000 $'000 $'000 $'000
Total equity at the beginning of the financial year 584,139 603,900 581,701 601,693
– Net gain/(loss) on revaluation of land and buildings 17 (b) 14,930 (31,940) 14,930 (31,940) – Exchange dif ferences on translation of foreign operations 17 (b) 2 (1) - - Net income recognised directly in equity 14,932 (31,941) 14,930 (31,940)Operating result for the year 21,112 12,180 19,317 11,948 Total recognised income and expense for the year 36,044 (19,761) 34,247 (19,992)
Total equity at the end of the financial year 17 (a) 620,183 584,139 615,948 581,701
The above statement of changes in equity should be read in conjunction with the accompanying notes.
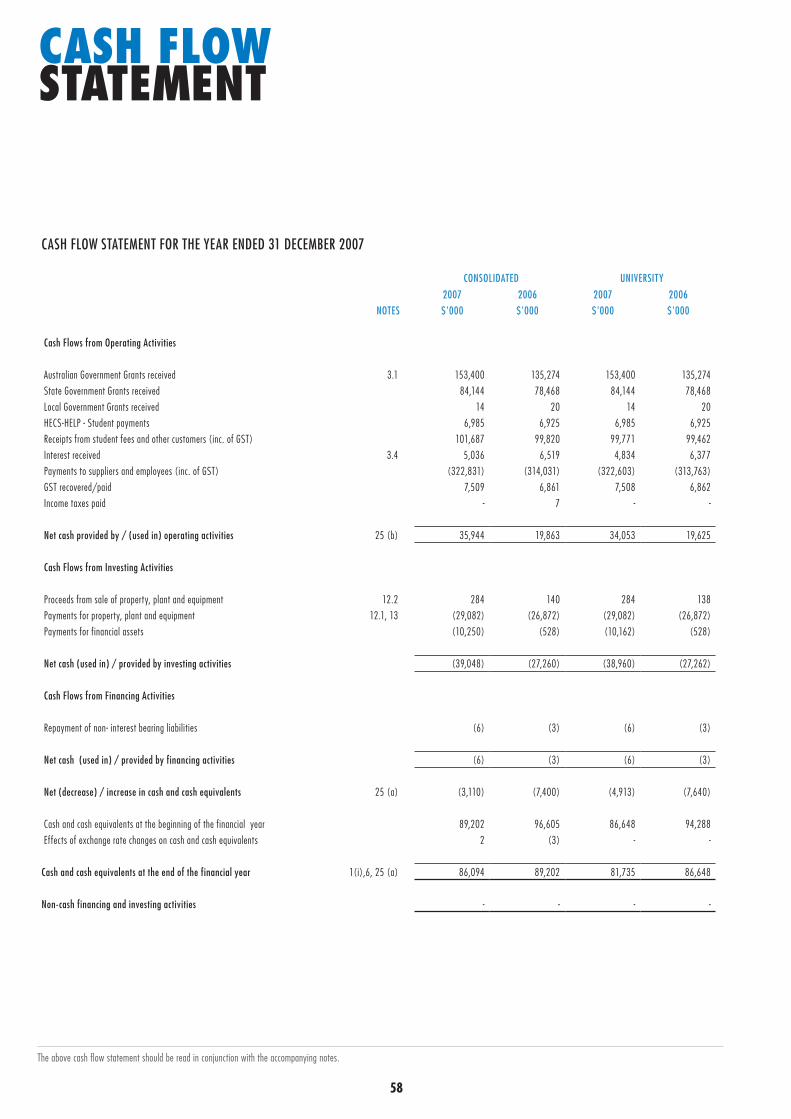
58 59
cash floWstatement
CASH FLOW STATEMENT FOR THE YEAR ENDED 31 DECEMBER 2007
CONSOLIDATED UNIVERSITY 2007 2006 2007 2006
NOTES $'000 $'000 $'000 $'000
Cash Flows from Operating Activities
Australian Government Grants received 3.1 153,400 135,274 153,400 135,274 State Government Grants received 84,144 78,468 84,144 78,468 Local Government Grants received 14 20 14 20 HECS-HELP - Student payments 6,985 6,925 6,985 6,925 Receipts from student fees and other customers (inc. of GST) 101,687 99,820 99,771 99,462 Interest received 3.4 5,036 6,519 4,834 6,377 Payments to suppliers and employees (inc. of GST) (322,831) (314,031) (322,603) (313,763) GST recovered/paid 7,509 6,861 7,508 6,862 Income taxes paid - 7 - -
Net cash provided by / (used in) operating activities 25 (b) 35,944 19,863 34,053 19,625
Cash Flows from Investing Activities
Proceeds from sale of property, plant and equipment 12.2 284 140 284 138 Payments for property, plant and equipment 12.1, 13 (29,082) (26,872) (29,082) (26,872) Payments for financial assets (10,250) (528) (10,162) (528)
Net cash (used in) / provided by investing activities (39,048) (27,260) (38,960) (27,262)
Cash Flows from Financing Activities
Repayment of non- interest bearing liabilit ies (6) (3) (6) (3)
Net cash (used in) / provided by financing activities (6) (3) (6) (3)
Net (decrease) / increase in cash and cash equivalents 25 (a) (3,110) (7,400) (4,913) (7,640)
Cash and cash equivalents at the beginning of the financial year 89,202 96,605 86,648 94,288 Effects of exchange rate changes on cash and cash equivalents 2 (3) - -
Cash and cash equivalents at the end of the financial year 1(i),6, 25 (a) 86,094 89,202 81,735 86,648
Non-cash financing and investing activities - - - -
The above cash flow statement should be read in conjunction with the accompanying notes.

58 59
notes to the financial statements for the year enDeD 31 December 2007
1. summary of significant accounting policies
The principal accounting policies adopted in the preparation of the financial report are set out below. The policies have been consistently applied to all the years presented, unless otherwise stated. The financial report includes separate financial statements for the University as an individual entity and the consolidated entity consisting of the University and its controlled entities.
(A) BASiS oF prEpArATioN This financial report is a general purpose financial report which has been prepared on an accrual basis in accordance with Australian Accounting Standards, AASB Interpretations, the requirements of the Department of Education, Employment and Workplace Relations and other State/Australian Government legislative requirements. Accounting Standards include Australian equivalents to International Financial Reporting Standards (AIFRS).
COMPLIANCE WITH IFRS
The financial statements and notes of Victoria University comply with Australian Accounting Standards, some of which contain requirements specific to not-for-profit entities that are inconsistent with IFRS requirements.
HISTORICAL COST CONVENTION
These financial statements have been prepared on an accrual basis under the historical cost convention, as modified by the revaluation of financial assets and liabilities at fair value through profit or loss, certain classes of property, plant and equipment and investment property.
CRITICAL ACCOUNTING ESTIMATES AND JUDGEMENTS
The preparation of financial statements in conformity with Australian Accounting Standards requires the use of certain critical accounting estimates. It also requires management to exercise its judgement in the process of applying the University’s accounting policies. The areas involving a higher degree of judgement or complexity, or areas where assumptions and estimates are significant to the financial statements, are disclosed below:
KEY ESTIMATES (1) IMPAIRMENT
The group assesses impairment at each reporting date by evaluating conditions specific to the University and to its controlled entities that may lead to the impairment of assets. Where an impairment trigger exists, the recoverable amount of the asset is determined. A number of key estimates are incorporated in the value-in-use calculations performed in assessing recoverable amounts.
(2) STATE SUPERANNUATION FUND
AASB 119 Employee Benefits requires that the estimated present value of superannuation obligations recognised in the financial statements should be determined as at balance date. These financial statements recognise estimated superannuation obligations in respect of the State Superannuation Fund using an actuarial estimate as at 30 June 2007. As there is no net impact on the balance sheet or income statement from these superannuation obligations (due to recognition of a corresponding receivable), the costs of providing an actuarial assessment at balance date (31 December 2007) outweigh the benefits. The University has therefore elected not to obtain an estimate of its superannuation obligations as at balance date. Consequently superannuation obligations (and corresponding receivable) are stated in the financial statements based on estimates prepared 6 months in arrears.
KEY JUDGEMENT (1) ALLOWANCE FOR DOUBTFUL DEBTS
Included in accounts receivable at 31 December 2007 are amounts which have been outstanding beyond the normal trading terms. The likelihood of the recovery of these amounts has been assessed and an estimated allowance made for non recovery of particular amounts outstanding.
(B) priNCiplES oF CoNSoliDATioN The consolidated financial statements incorporate the assets and liabilities of all controlled entities of the University (‘’parent entity’’) as at 31 December 2007 and the results of all controlled entities for the year then ended. The University and its controlled entities together are referred to in this financial report as the Group or the Consolidated Entity. Controlled entities are all those entities over which the Group has the ability to govern the financial and operating policies, generally accompanying a shareholding of more than one-half of the voting rights. The existence and effect of potential voting rights that are currently exercisable or convertible are considered when assessing whether the Group controls another entity. Controlled entities are fully consolidated from the date on which control is transferred to the Group. They are de-consolidated from the date control ceases.
Inter entity transactions, balances and unrealised gains on transactions between Group entities are eliminated. Unrealised losses are also eliminated unless the transaction provides evidence of the impairment of the asset transferred. Accounting policies of controlled entities have been changed where necessary to ensure consistency with the policies adopted by the Group.
Refer to note 23 for details on controlled entities.
60 61
(C) ForEigN CUrrENCy TrANSlATioN
(I) FUNCTIONAL AND PRESENTATION CURRENCY
Items included in the financial statements of each of the Group’s entities are measured using the currency of the primary economic environment in which the entity operates (‘the functional currency’). The consolidated financial statements are presented in Australian dollars, which is Victoria University’s functional and presentation currency.
(II) TRANSACTIONS AND BALANCES
Foreign currency transactions are translated into the functional currency using the exchange rates prevailing at the dates of the transactions. Foreign exchange gains and losses resulting from the settlement of such transactions and from the translation at year-end exchange rates of monetary assets and liabilities denominated in foreign currencies are recognised in the income statement.
Exchange differences arising on the translation of non-monetary items are recognised directly in equity, otherwise the exchange difference is recognised in the income statement.
(III) GROUP COMPANIES
The results and financial position of all the Group entities (none of which has the currency of a hyperinflationary economy) that have a functional currency different from the presentation currency are translated into the presentation currency as follows:
– assets and liabilities for each balance sheet presented are translated at the closing rate at the date of that balance sheet;
– income and expenses for each income statement are translated at average exchange rates; and
– all resulting exchange differences are recognised as a separate component of equity.
On consolidation, exchange differences arising from the translation of any net investment in foreign entities are taken to equity.
(D) rEvENUE rECogNiTioN Revenue is measured at the fair value of the consideration received or receivable. Amounts disclosed as revenue are net of any taxes paid. Revenue is recognised for the major business activities as follows:
(I) GOVERNMENT GRANTS
Commonwealth and State Government operating grants are recognised at their fair value as income in the period in which they are received when the university obtains control of the rights to receive the grants, it is likely that the economic benefits will flow to the entity and it can be reliably measured.
(II) STUDENT FEES AND CHARGES
Student fees and charges revenue is recognised by reference to the percentage of services provided. Where student fees and charges revenue has been clearly received in respect of courses or programs to be delivered in the following year, any non-refundable portion of the fees is treated as revenue in the year of receipt and the balance as revenue in advance.
(III) OTHER REVENUE
Fee for service revenue is recognised by reference to the percentage completion of each contract, i.e., in the reporting period in which the service is rendered. Where fee for service revenue of a reciprocal nature has been clearly received in respect of programs or services to be delivered in the following year, such amounts are deferred and disclosed as revenue in advance.
Investment income is recognised on a proportional basis taking into account the interest rates applicable to the financial assets.
Revenue from the provision of goods or services is recognised when goods are delivered or services have been rendered.
Any gain or loss on disposal is recognised at the date control of the asset is passed to the buyer and is determined after deducting from the proceeds the carrying value of the asset at the time.
All other revenues are recognised in the year to which they apply.
(E) iNComE TAx Victoria University, Victoria University Foundation and Victoria University Foundation Ltd are exempt from income tax pursuant to section 23(e) of the Income Tax Assessment Act 1936, as amended. All other controlled entities are subject to income tax.
(F) lEASES Leases in which a significant portion of the risks and rewards of ownership are retained by the lessor are classified as operating leases (note 21(a)). Payments made under operating leases are charged to the income statement on a straight-line basis over the period of the lease.
(g) ACqUiSiTioN oF ASSETS The purchase method of accounting is used to account for all acquisitions of assets regardless of whether equity instruments or other assets are acquired. Cost is measured as the fair value of the assets given plus costs directly attributable to the acquisition.
The Group’s policy is to capitalise non-current physical assets and intangible assets (with the exception of land and works of art) costing $5,000 or more.
NOTES TO THE FINANCIAL STATEMENTS FOR THE YEAR ENDED 31 DECEMBER 2007 – 1. SUMMARY OF SIGNIFICANT ACCOUNTING POLICIES CONTINUED
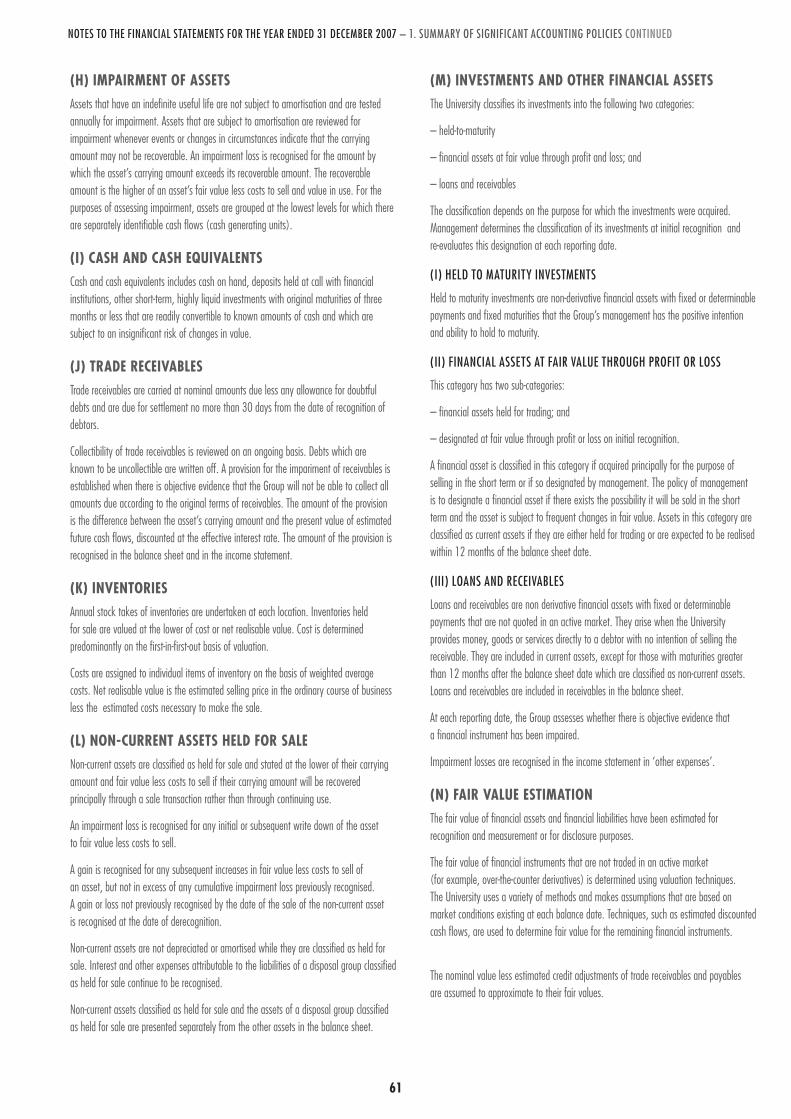
60 61
(h) impAirmENT oF ASSETS Assets that have an indefinite useful life are not subject to amortisation and are tested annually for impairment. Assets that are subject to amortisation are reviewed for impairment whenever events or changes in circumstances indicate that the carrying amount may not be recoverable. An impairment loss is recognised for the amount by which the asset’s carrying amount exceeds its recoverable amount. The recoverable amount is the higher of an asset’s fair value less costs to sell and value in use. For the purposes of assessing impairment, assets are grouped at the lowest levels for which there are separately identifiable cash flows (cash generating units).
(i) CASh AND CASh EqUivAlENTSCash and cash equivalents includes cash on hand, deposits held at call with financial institutions, other short-term, highly liquid investments with original maturities of three months or less that are readily convertible to known amounts of cash and which are subject to an insignificant risk of changes in value.
(j) TrADE rECEivABlESTrade receivables are carried at nominal amounts due less any allowance for doubtful debts and are due for settlement no more than 30 days from the date of recognition of debtors.
Collectibility of trade receivables is reviewed on an ongoing basis. Debts which are known to be uncollectible are written off. A provision for the impariment of receivables is established when there is objective evidence that the Group will not be able to collect all amounts due according to the original terms of receivables. The amount of the provision is the difference between the asset’s carrying amount and the present value of estimated future cash flows, discounted at the effective interest rate. The amount of the provision is recognised in the balance sheet and in the income statement.
(k) iNvENToriESAnnual stock takes of inventories are undertaken at each location. Inventories held for sale are valued at the lower of cost or net realisable value. Cost is determined predominantly on the first-in-first-out basis of valuation.
Costs are assigned to individual items of inventory on the basis of weighted average costs. Net realisable value is the estimated selling price in the ordinary course of business less the estimated costs necessary to make the sale.
(l) NoN-CUrrENT ASSETS hElD For SAlE Non-current assets are classified as held for sale and stated at the lower of their carrying amount and fair value less costs to sell if their carrying amount will be recovered principally through a sale transaction rather than through continuing use.
An impairment loss is recognised for any initial or subsequent write down of the asset to fair value less costs to sell.
A gain is recognised for any subsequent increases in fair value less costs to sell of an asset, but not in excess of any cumulative impairment loss previously recognised. A gain or loss not previously recognised by the date of the sale of the non-current asset is recognised at the date of derecognition.
Non-current assets are not depreciated or amortised while they are classified as held for sale. Interest and other expenses attributable to the liabilities of a disposal group classified as held for sale continue to be recognised.
Non-current assets classified as held for sale and the assets of a disposal group classified as held for sale are presented separately from the other assets in the balance sheet.
(m) iNvESTmENTS AND oThEr FiNANCiAl ASSETSThe University classifies its investments into the following two categories:
– held-to-maturity
– financial assets at fair value through profit and loss; and
– loans and receivables
The classification depends on the purpose for which the investments were acquired. Management determines the classification of its investments at initial recognition and re-evaluates this designation at each reporting date.
(I) HELD TO MATURITY INVESTMENTS
Held to maturity investments are non-derivative financial assets with fixed or determinable payments and fixed maturities that the Group’s management has the positive intention and ability to hold to maturity.
(II) FINANCIAL ASSETS AT FAIR VALUE THROUGH PROFIT OR LOSS
This category has two sub-categories:
– financial assets held for trading; and
– designated at fair value through profit or loss on initial recognition.
A financial asset is classified in this category if acquired principally for the purpose of selling in the short term or if so designated by management. The policy of management is to designate a financial asset if there exists the possibility it will be sold in the short term and the asset is subject to frequent changes in fair value. Assets in this category are classified as current assets if they are either held for trading or are expected to be realised within 12 months of the balance sheet date.
(III) LOANS AND RECEIVABLES
Loans and receivables are non derivative financial assets with fixed or determinable payments that are not quoted in an active market. They arise when the University provides money, goods or services directly to a debtor with no intention of selling the receivable. They are included in current assets, except for those with maturities greater than 12 months after the balance sheet date which are classified as non-current assets. Loans and receivables are included in receivables in the balance sheet.
At each reporting date, the Group assesses whether there is objective evidence that a financial instrument has been impaired.
Impairment losses are recognised in the income statement in ‘other expenses’.
(N) FAir vAlUE ESTimATioN The fair value of financial assets and financial liabilities have been estimated for recognition and measurement or for disclosure purposes.
The fair value of financial instruments that are not traded in an active market (for example, over-the-counter derivatives) is determined using valuation techniques. The University uses a variety of methods and makes assumptions that are based on market conditions existing at each balance date. Techniques, such as estimated discounted cash flows, are used to determine fair value for the remaining financial instruments.
The nominal value less estimated credit adjustments of trade receivables and payables are assumed to approximate to their fair values.
NOTES TO THE FINANCIAL STATEMENTS FOR THE YEAR ENDED 31 DECEMBER 2007 – 1. SUMMARY OF SIGNIFICANT ACCOUNTING POLICIES CONTINUED

62
The assets’ residual values and useful lives are reviewed, and adjusted if appropriate, at each balance sheet date.
An asset’s carrying amount is written down immediately to its recoverable amount if the asset’s carrying amount is greater than its estimated recoverable amount.
Gains and losses on disposals are determined by comparing proceeds with carrying amounts. These are included in the income statement. When revalued assets are sold, it is Group policy to transfer the amounts included in other reserves in respect of those assets to retained earnings.
Assets other than those that are carried at cost are revalued with sufficient regularity to ensure that the carrying amount of each asset does not differ materially from its fair value. The Group’s policy is to formally revalue those assets with useful lives of 30 or greater years every six years provided there are no material movements in the in between years. The Group has no assets with useful lives of less than 30 years that would warrant a revaluation. Revaluation increments or decrements arise from differences between an asset’s depreciated cost or deemed cost and fair value.
Last formal revlaution was undertaken in December 2007.
(o) propErTy, plANT AND EqUipmENTEach class of property, plant and equipment is carried at cost or fair values, and where applicable, net of any accumulated depreciation and impairment losses.
Land and buildings are shown at fair value, based on periodic valuations by external independent valuers, less subsequent depreciation for buildings. Any accumulated depreciation at the date of revaluation is eliminated against the gross carrying amount of the asset and the net amount is restated to the revalued amount of the asset. All other property, plant and equipment is stated at historical cost less depreciation. Historical cost includes expenditure that is directly attributable to the acquisition of the items.
Subsequent costs are included in the asset’s carrying amount or recognised as a separate asset, as appropriate, only when it is probable that future economic benefits associated with the item will flow to the Group and the cost of the item can be measured reliably. All other repairs and maintenance are charged to the income statement during the financial period in which they are incurred.
Increases in the carrying amounts arising on revaluation of land and buildings are credited to revaluation reserves in equity. Where an increase reverses a decrease previously recognised in profit or loss, the increase is first recognised in profit and loss. Decreases that reverse previous increases of the same asset are first charged against revaluation reserves directly in equity to the extent of the remaining reserve attributable to the asset; all other decreases are charged to the income statement.
Land and works of arts are not depreciated. Other assets are depreciated from the date of acquisition or, in respect of buildings under construction, from the time they are made ready for use. Depreciation on these assets is calculated using the straight line method to allocate their cost or revalued amounts, net of their residual values, over their estimated useful lives, as follows:
NOTES TO THE FINANCIAL STATEMENTS FOR THE YEAR ENDED 31 DECEMBER 2007 – 1. SUMMARY OF SIGNIFICANT ACCOUNTING POLICIES CONTINUED
2007 2006Buildings 40 years 40 yearsPlant and equipment – Furniture and fit tings 10 years 10 years– Computer equipment 4 years 4 years – Motor vehicles 5 years 5 years – General equipment 8 – 20 years 8 – 20 yearsLibrary Collections – Books 10 years 10 years– Serials 5 years 5 years– Audio Visual and software 4 years 4 years
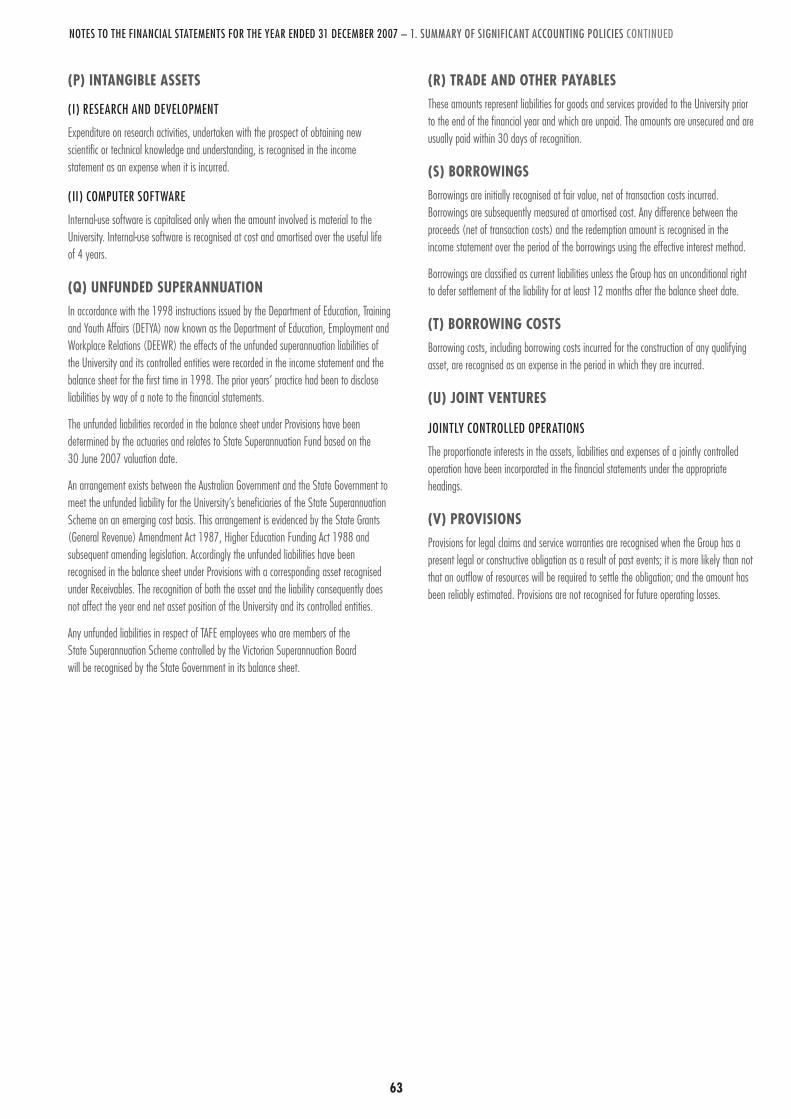
62 63
(p) iNTANgiBlE ASSETS
(I) RESEARCH AND DEVELOPMENT
Expenditure on research activities, undertaken with the prospect of obtaining new scientific or technical knowledge and understanding, is recognised in the income statement as an expense when it is incurred.
(II) COMPUTER SOFTWARE
Internal-use software is capitalised only when the amount involved is material to the University. Internal-use software is recognised at cost and amortised over the useful life of 4 years.
(q) UNFUNDED SUpErANNUATioN In accordance with the 1998 instructions issued by the Department of Education, Training and Youth Affairs (DETYA) now known as the Department of Education, Employment and Workplace Relations (DEEWR) the effects of the unfunded superannuation liabilities of the University and its controlled entities were recorded in the income statement and the balance sheet for the first time in 1998. The prior years’ practice had been to disclose liabilities by way of a note to the financial statements.
The unfunded liabilities recorded in the balance sheet under Provisions have been determined by the actuaries and relates to State Superannuation Fund based on the 30 June 2007 valuation date.
An arrangement exists between the Australian Government and the State Government to meet the unfunded liability for the University’s beneficiaries of the State Superannuation Scheme on an emerging cost basis. This arrangement is evidenced by the State Grants (General Revenue) Amendment Act 1987, Higher Education Funding Act 1988 and subsequent amending legislation. Accordingly the unfunded liabilities have been recognised in the balance sheet under Provisions with a corresponding asset recognised under Receivables. The recognition of both the asset and the liability consequently does not affect the year end net asset position of the University and its controlled entities.
Any unfunded liabilities in respect of TAFE employees who are members of the State Superannuation Scheme controlled by the Victorian Superannuation Board will be recognised by the State Government in its balance sheet.
(r) TrADE AND oThEr pAyABlES These amounts represent liabilities for goods and services provided to the University prior to the end of the financial year and which are unpaid. The amounts are unsecured and are usually paid within 30 days of recognition.
(S) BorrowiNgS Borrowings are initially recognised at fair value, net of transaction costs incurred. Borrowings are subsequently measured at amortised cost. Any difference between the proceeds (net of transaction costs) and the redemption amount is recognised in the income statement over the period of the borrowings using the effective interest method.
Borrowings are classified as current liabilities unless the Group has an unconditional right to defer settlement of the liability for at least 12 months after the balance sheet date.
(T) BorrowiNg CoSTS Borrowing costs, including borrowing costs incurred for the construction of any qualifying asset, are recognised as an expense in the period in which they are incurred.
(U) joiNT vENTUrES
JOINTLY CONTROLLED OPERATIONS
The proportionate interests in the assets, liabilities and expenses of a jointly controlled operation have been incorporated in the financial statements under the appropriate headings.
(v) proviSioNS Provisions for legal claims and service warranties are recognised when the Group has a present legal or constructive obligation as a result of past events; it is more likely than not that an outflow of resources will be required to settle the obligation; and the amount has been reliably estimated. Provisions are not recognised for future operating losses.
NOTES TO THE FINANCIAL STATEMENTS FOR THE YEAR ENDED 31 DECEMBER 2007 – 1. SUMMARY OF SIGNIFICANT ACCOUNTING POLICIES CONTINUED

64 65
(w) EmployEE BENEFiTS Provision is made for benefits accruing to employees in respect of wages and salaries, annual leave and long service leave when it is probable that settlement will be required and they are capable of being measured reliably. The calculation of employee benefits includes all relevant on-costs and are calculated as follows at reporting date.
(I) WAGES AND SALARIES, AND ANNUAL LEAVE
Liabilities for wages and salaries, and annual leave expected to be settled within 12 months of the reporting date are recognised at their nominal values using the remuneration rate expected to apply at the time of settlement.
(II) LONG SERVICE LEAVE
The liability for long service leave is recognised in the provision for employee benefits and measured as the present value of expected future payments to be made in respect of services provided by employees up to the reporting date. Consideration is given to expected future wage and salary levels, experience of employee departures and periods of service. Expected future payments are discounted using market yields at the reporting date on national government bonds with terms to maturity and currency that match, as closely as possible, the estimated future cash outflows.
Regardless of the expected timing of settlement, provisions made in respect of employee benefits are classified as a current liability unless there is an unconditional right to defer the settlement of the liability for at least 12 months after the reporting date, in which case it would be classified as a non-current liability. Provisions made for annual leave and unconditional long service leave would be classified as a current liability where the employee has a present entitlement to the benefit. A non-current liability would include long service leave entitlement accrued for employees with less than 10 years of continuous service.
(III) RETIREMENT BENEFIT OBLIGATIONS
The majority of the employees of the Group are entitled to benefits on retirement, disability or death from the Group’s superannuation plan. The Group has a defined benefit and contribution scheme within one of its plans. The defined benefit scheme provides defined lump sum benefits based on years of service and final average salary. The defined contribution scheme receives fixed contributions from the Group and the Group’s legal or constructive obligation is limited to these contributions.
A liability or asset in respect of one of the defined benefit superannuation plans, State Superannuation Fund, is recognised in the balance sheet, and is measured as the present value of the defined benefit obligation at the reporting date plus unrecognised actuarial gains (less unrecognised actuarial losses) less the fair value of the superannuation fund’s assets at that date and any unrecognised past service cost. The present value of the defined benefit obligation is based on expected future payments which arise from membership of the fund to the reporting date, calculated annually by independent actuaries. Consideration is given to expected future wage and salary levels, experience of employee departures and periods of service.
Expected future payments are discounted using market yields at the reporting date on national government bonds with terms to maturity and currency that match, as closely as possible, the estimated future cash outflows.
Past service costs are recognised immediately in income, unless the changes to the superannuation fund are conditional on the employees remaining in service for a specified period of time (the vesting period). In this case, the past service costs are amortised on a straight-line basis over the vesting period.
The amount charged to the income statement in respect of the superannuation plans represents the contributions made by the University to the superannuation plan in respect to the current services of current University staff.
Contributions to the defined contribution fund are recognised as an expense as they become payable.
(IV) TERMINATION BENEFITS
Termination benefits, valued at nominal amount, are payable when employment is terminated before the normal retirement date, or when an employee accepts voluntary redundancy in exchange for these benefits.
NOTES TO THE FINANCIAL STATEMENTS FOR THE YEAR ENDED 31 DECEMBER 2007 – 1. SUMMARY OF SIGNIFICANT ACCOUNTING POLICIES CONTINUED
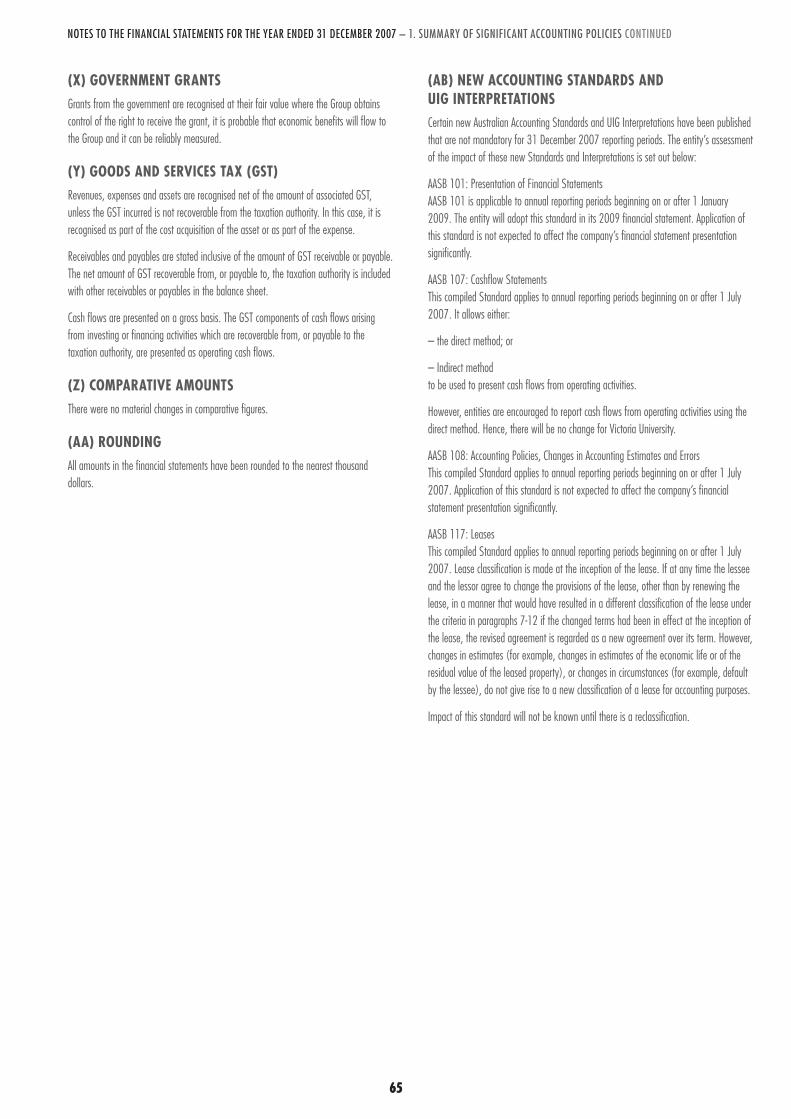
64 6565
(x) govErNmENT grANTS Grants from the government are recognised at their fair value where the Group obtains control of the right to receive the grant, it is probable that economic benefits will flow to the Group and it can be reliably measured.
(y) gooDS AND SErviCES TAx (gST)Revenues, expenses and assets are recognised net of the amount of associated GST, unless the GST incurred is not recoverable from the taxation authority. In this case, it is recognised as part of the cost acquisition of the asset or as part of the expense.
Receivables and payables are stated inclusive of the amount of GST receivable or payable. The net amount of GST recoverable from, or payable to, the taxation authority is included with other receivables or payables in the balance sheet.
Cash flows are presented on a gross basis. The GST components of cash flows arising from investing or financing activities which are recoverable from, or payable to the taxation authority, are presented as operating cash flows.
(z) CompArATivE AmoUNTS There were no material changes in comparative figures.
(AA) roUNDiNg All amounts in the financial statements have been rounded to the nearest thousand dollars.
NOTES TO THE FINANCIAL STATEMENTS FOR THE YEAR ENDED 31 DECEMBER 2007 – 1. SUMMARY OF SIGNIFICANT ACCOUNTING POLICIES CONTINUED
(AB) NEw ACCoUNTiNg STANDArDS AND Uig iNTErprETATioNS Certain new Australian Accounting Standards and UIG Interpretations have been published that are not mandatory for 31 December 2007 reporting periods. The entity’s assessment of the impact of these new Standards and Interpretations is set out below:
AASB 101: Presentation of Financial Statements AASB 101 is applicable to annual reporting periods beginning on or after 1 January 2009. The entity will adopt this standard in its 2009 financial statement. Application of this standard is not expected to affect the company’s financial statement presentation significantly.
AASB 107: Cashflow Statements This compiled Standard applies to annual reporting periods beginning on or after 1 July 2007. It allows either:
– the direct method; or
– Indirect method to be used to present cash flows from operating activities.
However, entities are encouraged to report cash flows from operating activities using the direct method. Hence, there will be no change for Victoria University.
AASB 108: Accounting Policies, Changes in Accounting Estimates and Errors This compiled Standard applies to annual reporting periods beginning on or after 1 July 2007. Application of this standard is not expected to affect the company’s financial statement presentation significantly.
AASB 117: Leases This compiled Standard applies to annual reporting periods beginning on or after 1 July 2007. Lease classification is made at the inception of the lease. If at any time the lessee and the lessor agree to change the provisions of the lease, other than by renewing the lease, in a manner that would have resulted in a different classification of the lease under the criteria in paragraphs 7-12 if the changed terms had been in effect at the inception of the lease, the revised agreement is regarded as a new agreement over its term. However, changes in estimates (for example, changes in estimates of the economic life or of the residual value of the leased property), or changes in circumstances (for example, default by the lessee), do not give rise to a new classification of a lease for accounting purposes.
Impact of this standard will not be known until there is a reclassification.

66 67
NOTES TO THE FINANCIAL STATEMENTS FOR THE YEAR ENDED 31 DECEMBER 2007 – 2. DISAGGREGATED INFORMATION
2. DisaggregateD information
REVENUE* RESULTS ASSETS 2007 2006 2007 2006 2007 2006
$’000 $’000 $’000 $’000 $’000 $’000
(A) GEOGRAPHICAL [CONSOLIDATED ENTITY]
Australia 333,730 316,272 20,053 11,356 783,211 755,851 Asia 7,914 6,663 1,145 809 234 169 Others 163 63 (86) 15 - -
Total Geographical 341,807 322,998 21,112 12,180 783,445 756,020
*The above revenue is the total revenue including the gross proceeds on sale of non-current assets, whereas the Income Statement revenue includes the net (loss) or gain on disposal of non-current assets i.e., proceeds less written down value of assets sold. Refer to note 12.2 for the written down value included in the Income Statement in arriving at the net gain or loss on disposal of property, plant and equipment.

66 67
NOTES TO THE FINANCIAL STATEMENTS FOR THE YEAR ENDED 31 DECEMBER 2007 – 2. DISAGGREGATED INFORMATION CONTINUED
2. DisaggregateD information (con’t)
HIGHER EDUCATION VET
TOTAL UNIVERSITY
HIGHER EDUCATION VET
TOTAL UNIVERSITY
2007 2007 2007 2006 2006 2006NOTES $’000 $’000 $’000 $’000 $’000 $’000
(B) INDUSTRY [PARENT ENTITY]
Income from continuing operations
Australian Government financial assistance Australian Government grants 98,865 17 98,882 88,425 - 88,425 HECS-HELP - Australian Government Payments 51,735 - 51,735 47,421 - 47,421 fee-heLp 4,464 - 4,464 2,783 - 2,783 State and local Government financial assistance 1,064 83,094 84,158 1,473 76,721 78,194 HECS-HELP - Student Payments 6,985 - 6,985 6,925 - 6,925 Fees & charges 43,054 26,407 69,461 44,863 24,738 69,601 Investment income 3,454 1,481 4,935 4,471 1,906 6,377 Royalties, trademarks & licenses 45 3 48 290 1 291 Consultancy and contracts 6,997 36 7,033 6,812 - 6,812 Other revenue 13,998 6,405 20,403 14,491 6,537 21,028
Total income from continuing operations before Deferred Government Superannuation Contributions 230,661 117,443 348,104 217,954 109,903 327,857
Deferred Government Superannuation Contributions (8,319) - (8,319) (5,436) - (5,436)
Total revenue from continuing operations 222,342 117,443 339,785 212,518 109,903 322,421
Expenses from continuing operations
Employee related expenses 141,701 74,739 216,440 136,220 72,128 208,348 Depreciation and amortisation 10,795 5,921 16,716 10,492 5,649 16,141 Repair and maintenance 11,206 5,274 16,480 10,398 4,617 15,015 Impairment of assets 294 (36) 258 18 22 40 Other expenses 53,481 25,412 78,893 50,683 25,682 76,365
Total expenses from continuing operations before Deferred Employee Benefits for Superannuation 217,477 111,310 328,787 207,811 108,098 315,909
Deferred Employee Benefits for Superannuation (8,319) - (8,319) (5,436) - (5,436)
Total expenses from ordinary activities 209,158 111,310 320,468 202,375 108,098 310,473
Operating result after income tax for the period 13,184 6,133 19,317 10,143 1,805 11,948
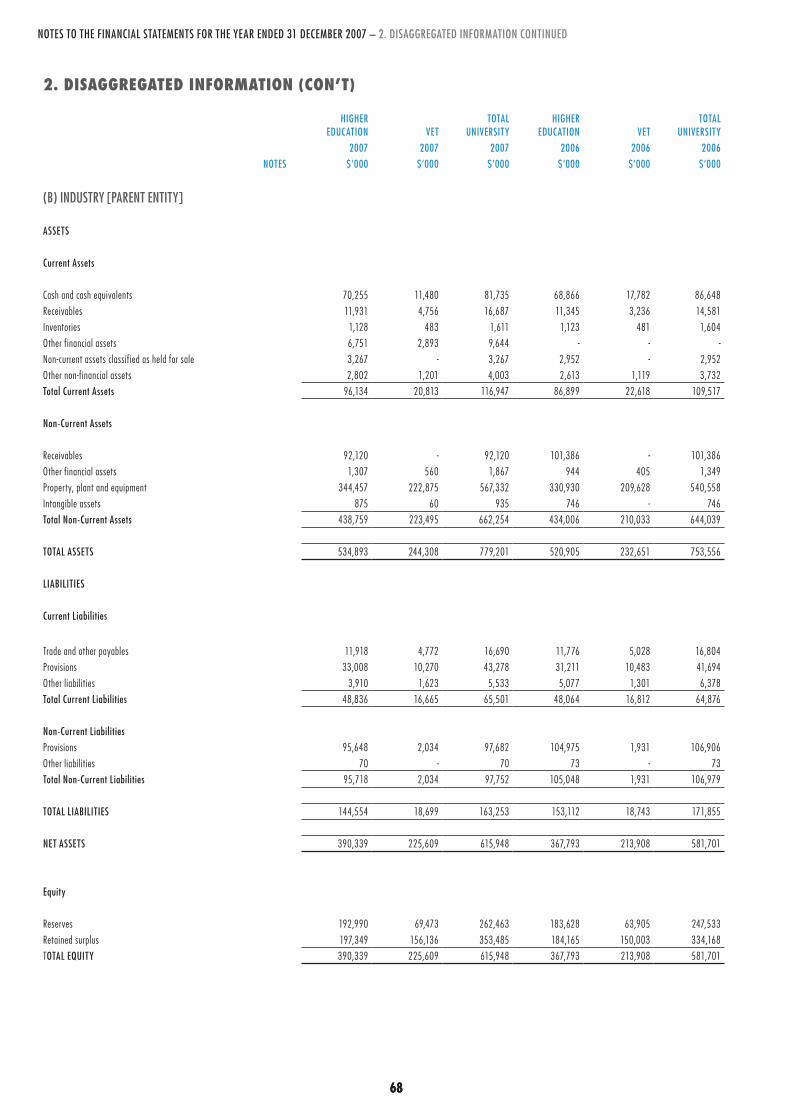
68 6968
NOTES TO THE FINANCIAL STATEMENTS FOR THE YEAR ENDED 31 DECEMBER 2007 – 2. DISAGGREGATED INFORMATION CONTINUED
2. DisaggregateD information (con’t)
HIGHER EDUCATION VET
TOTAL UNIVERSITY
HIGHER EDUCATION VET
TOTAL UNIVERSITY
2007 2007 2007 2006 2006 2006NOTES $’000 $’000 $’000 $’000 $’000 $’000
(B) INDUSTRY [PARENT ENTITY]
ASSETS
Current Assets
Cash and cash equivalents 70,255 11,480 81,735 68,866 17,782 86,648 Receivables 11,931 4,756 16,687 11,345 3,236 14,581 Inventories 1,128 483 1,611 1,123 481 1,604 Other financial assets 6,751 2,893 9,644 - - -Non-current assets classified as held for sale 3,267 - 3,267 2,952 - 2,952 Other non-financial assets 2,802 1,201 4,003 2,613 1,119 3,732 Total Current Assets 96,134 20,813 116,947 86,899 22,618 109,517
Non-Current Assets
Receivables 92,120 - 92,120 101,386 - 101,386 Other financial assets 1,307 560 1,867 944 405 1,349 Property, plant and equipment 344,457 222,875 567,332 330,930 209,628 540,558 Intangible assets 875 60 935 746 - 746 Total Non-Current Assets 438,759 223,495 662,254 434,006 210,033 644,039
TOTAL ASSETS 534,893 244,308 779,201 520,905 232,651 753,556
LIABILITIES
Current Liabilities
Trade and other payables 11,918 4,772 16,690 11,776 5,028 16,804 Provisions 33,008 10,270 43,278 31,211 10,483 41,694 Other liabilit ies 3,910 1,623 5,533 5,077 1,301 6,378 Total Current Liabilities 48,836 16,665 65,501 48,064 16,812 64,876
Non-Current Liabilities Provisions 95,648 2,034 97,682 104,975 1,931 106,906 Other liabilit ies 70 - 70 73 - 73 Total Non-Current Liabilities 95,718 2,034 97,752 105,048 1,931 106,979
TOTAL LIABILITIES 144,554 18,699 163,253 153,112 18,743 171,855
NET ASSETS 390,339 225,609 615,948 367,793 213,908 581,701
Equity
Reserves 192,990 69,473 262,463 183,628 63,905 247,533 Retained surplus 197,349 156,136 353,485 184,165 150,003 334,168 tOTAL EQUITY 390,339 225,609 615,948 367,793 213,908 581,701
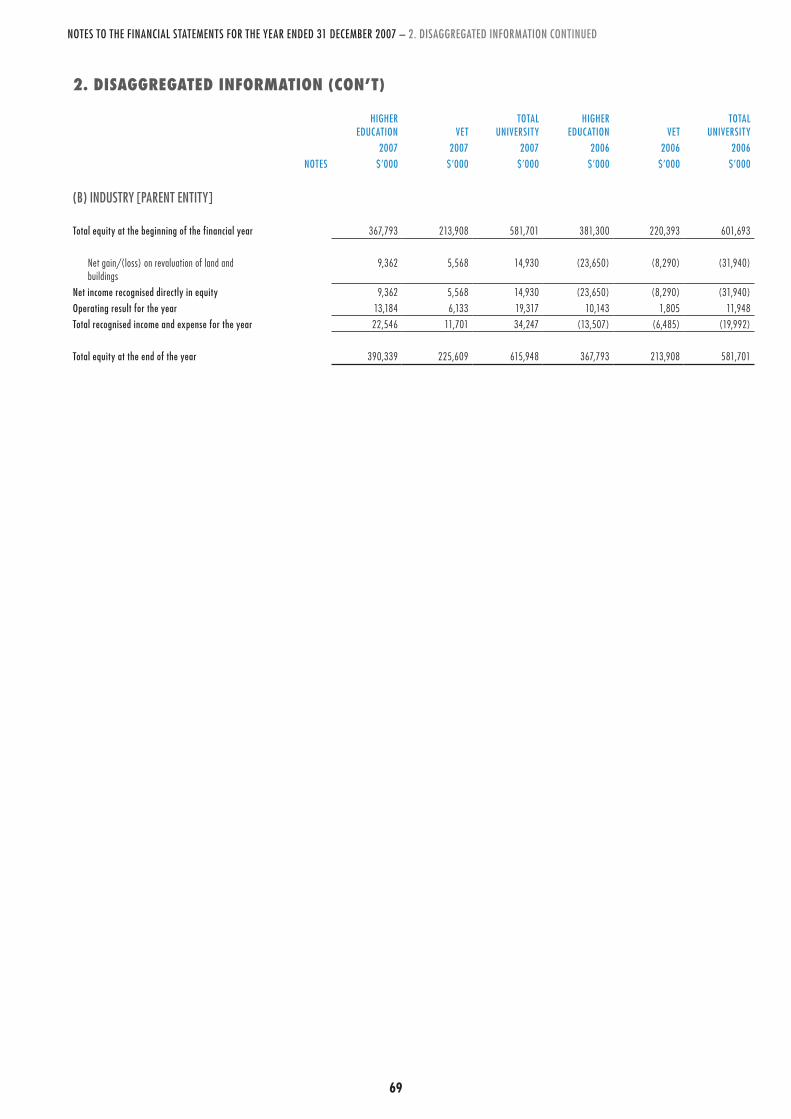
68 6968
NOTES TO THE FINANCIAL STATEMENTS FOR THE YEAR ENDED 31 DECEMBER 2007 – 2. DISAGGREGATED INFORMATION CONTINUED
2. DisaggregateD information (con’t)
HIGHER EDUCATION VET
TOTAL UNIVERSITY
HIGHER EDUCATION VET
TOTAL UNIVERSITY
2007 2007 2007 2006 2006 2006NOTES $’000 $’000 $’000 $’000 $’000 $’000
(B) INDUSTRY [PARENT ENTITY]
Total equity at the beginning of the financial year 367,793 213,908 581,701 381,300 220,393 601,693
Net gain/(loss) on revaluation of land and buildings
9,362 5,568 14,930 (23,650) (8,290) (31,940)
Net income recognised directly in equity 9,362 5,568 14,930 (23,650) (8,290) (31,940)Operating result for the year 13,184 6,133 19,317 10,143 1,805 11,948 Total recognised income and expense for the year 22,546 11,701 34,247 (13,507) (6,485) (19,992)
Total equity at the end of the year 390,339 225,609 615,948 367,793 213,908 581,701
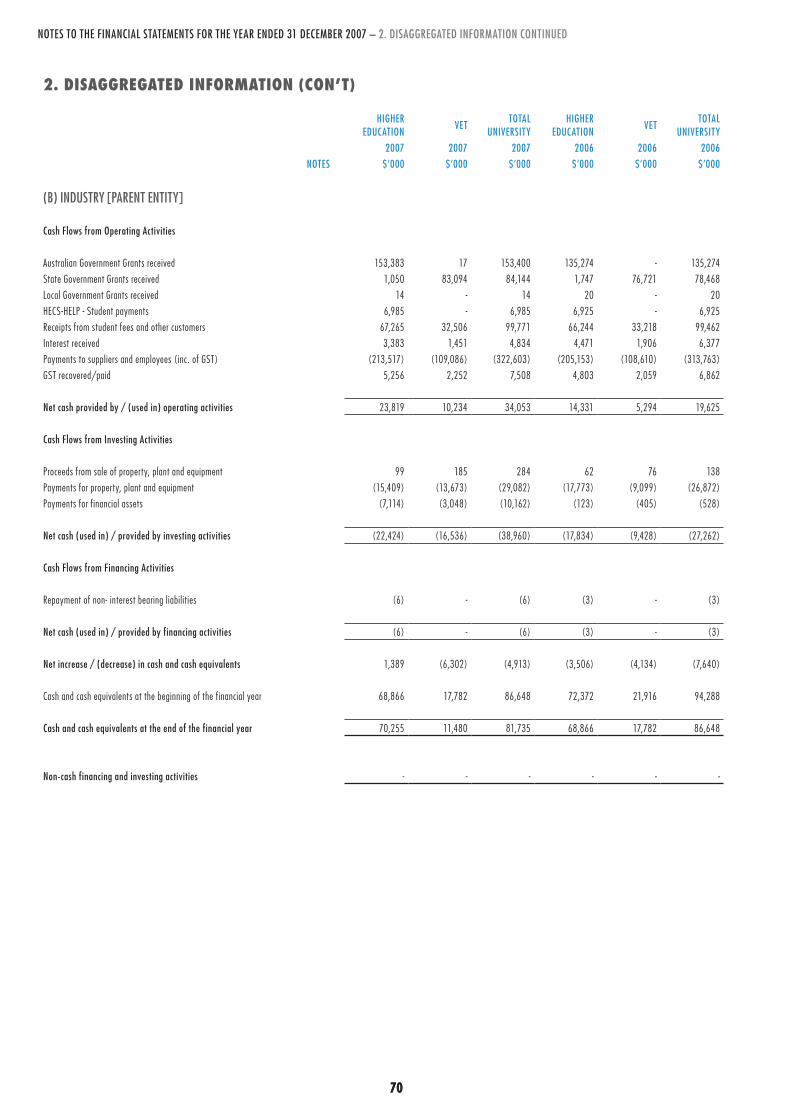
70 7170
NOTES TO THE FINANCIAL STATEMENTS FOR THE YEAR ENDED 31 DECEMBER 2007 – 2. DISAGGREGATED INFORMATION CONTINUED
2. DisaggregateD information (con’t)
HIGHER EDUCATION
VETTOTAL
UNIVERSITYHIGHER
EDUCATIONVET
TOTAL UNIVERSITY
2007 2007 2007 2006 2006 2006NOTES $’000 $’000 $’000 $’000 $’000 $’000
(B) INDUSTRY [PARENT ENTITY]
Cash Flows from Operating Activities
Australian Government Grants received 153,383 17 153,400 135,274 - 135,274 State Government Grants received 1,050 83,094 84,144 1,747 76,721 78,468 Local Government Grants received 14 - 14 20 - 20 HECS-HELP - Student payments 6,985 - 6,985 6,925 - 6,925 Receipts from student fees and other customers 67,265 32,506 99,771 66,244 33,218 99,462 Interest received 3,383 1,451 4,834 4,471 1,906 6,377 Payments to suppliers and employees (inc. of GST) (213,517) (109,086) (322,603) (205,153) (108,610) (313,763)GST recovered/paid 5,256 2,252 7,508 4,803 2,059 6,862
Net cash provided by / (used in) operating activities 23,819 10,234 34,053 14,331 5,294 19,625
Cash Flows from Investing Activities
Proceeds from sale of property, plant and equipment 99 185 284 62 76 138 Payments for property, plant and equipment (15,409) (13,673) (29,082) (17,773) (9,099) (26,872)Payments for financial assets (7,114) (3,048) (10,162) (123) (405) (528)
Net cash (used in) / provided by investing activities (22,424) (16,536) (38,960) (17,834) (9,428) (27,262)
Cash Flows from Financing Activities
Repayment of non- interest bearing liabilit ies (6) - (6) (3) - (3)
Net cash (used in) / provided by financing activities (6) - (6) (3) - (3)
Net increase / (decrease) in cash and cash equivalents 1,389 (6,302) (4,913) (3,506) (4,134) (7,640)
Cash and cash equivalents at the beginning of the financial year 68,866 17,782 86,648 72,372 21,916 94,288
Cash and cash equivalents at the end of the financial year 70,255 11,480 81,735 68,866 17,782 86,648
Non-cash financing and investing activities - - - - - -

70 7170
NOTES TO THE FINANCIAL STATEMENTS FOR THE YEAR ENDED 31 DECEMBER 2007 – 3. INCOME
CONSOLIDATED UNIVERSITY
2007 2006 2007 2006 NOTES $'000 $'000 $'000 $'000
3. income
3.1 AUSTRALIAN GOVERNMENT FINANCIAL ASSISTANCE INCLUDING HECS-HELP AND OTHER AUSTRALIAN GOVERNMENT LOAN PROGRAMMES
(A) COMMONWEALTH GRANTS SCHEME AND OTHER GRANTS Commonwealth Grants Scheme # 75,038 68,936 75,038 68,936 Indigenous Support Fund 102 110 102 110 Equity Support Programmes 353 273 353 273 Workplace Reform Programme 1,110 1,038 1,110 1,038 Workplace Productivity Programme 100 200 100 200 Learning & Teaching Performance Fund 1,878 - 1,878 - Capital Development Pool 885 1,451 885 1,451 Superannuation Programme 5,237 3,263 5,237 3,263 Collaboration and Structural Reform Programme 472 1,015 472 1,015 Total Commonwealth Grants Scheme and Other Grants 28.1 85,175 76,286 85,175 76,286
(B) HIGHER EDUCATION LOAN PROGRAMMES heCs-heLp 51,735 47,421 51,735 47,421 fee-heLp 4,464 2,783 4,464 2,783 Total Higher Education Loan Programmes 28.2 56,199 50,204 56,199 50,204
(C) SCHOLARSHIPS Australian Postgraduate Awards 859 813 859 813 International Postgraduate Research Scholarships 234 42 234 42 Commonwealth Education Costs Scholarship 945 676 945 676 Commonwealth Accommodation Scholarships 1,090 911 1,090 911 Total Scholarships 28.3 3,128 2,442 3,128 2,442
(D) DEEWR RESEARCH Institutional Grants Scheme 1,976 2,039 1,976 2,039 Research Training Scheme 5,230 5,238 5,230 5,238 Research Infrastructure Block Grants 745 827 745 827 Implementation Assistance Programme 47 - 47 - Australian Scheme for Higher Education Repositories 102 - 102 - Commercialisation Training Scheme 50 - 50 - Total DEEWR - Research Grants 28.4 8,150 8,104 8,150 8,104
(E) AUSTRALIAN RESEARCH COUNCIL Discovery Discovery Projects – Large Grants 793 715 793 715 Total Discovery 28.5 793 715 793 715
Linkages Special Research Initiatives - 36 - 36 Linkage Projects - Spirt 415 497 415 497 Total Linkages 28.5 415 533 415 533
# includes the basic CGS grant amount, CGS-Enabling Loading and HEFA Transition Fund
(F) OTHER AUSTRALIAN GOVERNMENT FINANCIAL ASSISTANCE Other 1,221 345 1,221 345 Total Other Australian Government Financial Assistance 1,221 345 1,221 345
TOTAL AUSTRALIAN GOVERNMENT FINANCIAL ASSISTANCE 155,081 138,629 155,081 138,629
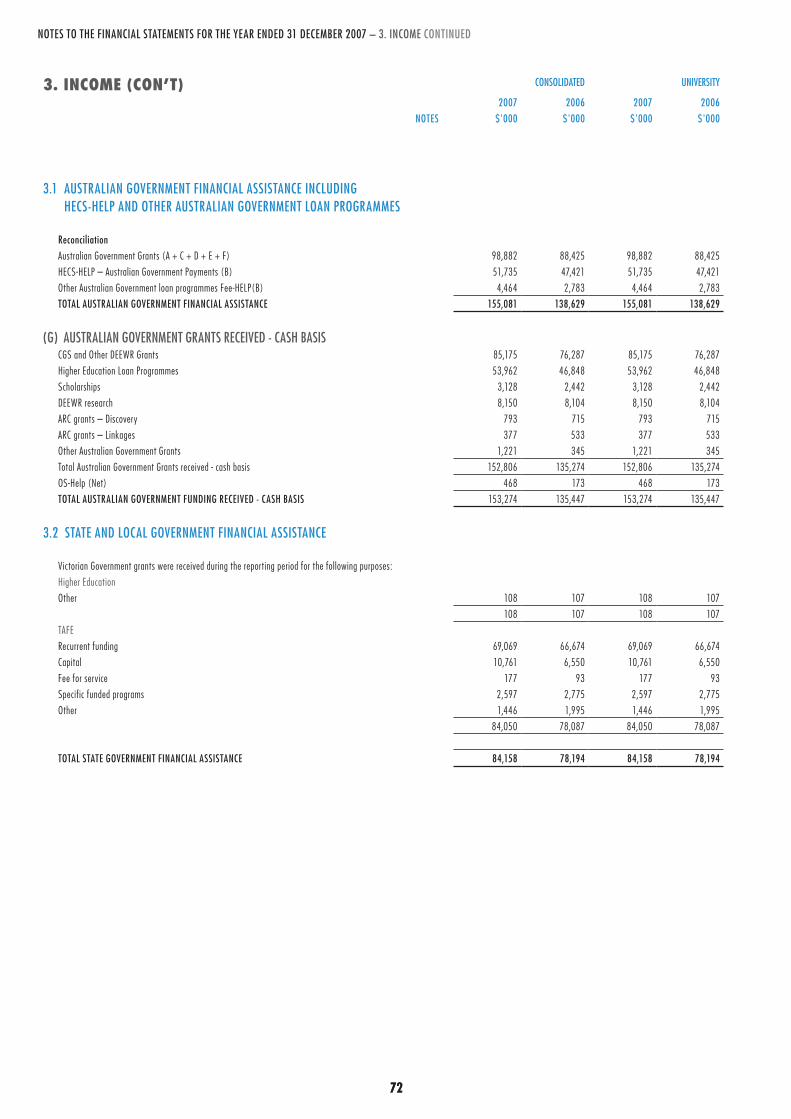
72 7372
NOTES TO THE FINANCIAL STATEMENTS FOR THE YEAR ENDED 31 DECEMBER 2007 – 3. INCOME CONTINUED
3. income (con’t) CONSOLIDATED UNIVERSITY
2007 2006 2007 2006 NOTES $'000 $'000 $'000 $'000
3.1 AUSTRALIAN GOVERNMENT FINANCIAL ASSISTANCE INCLUDING HECS-HELP AND OTHER AUSTRALIAN GOVERNMENT LOAN PROGRAMMES
Reconciliation Australian Government Grants (A + C + D + E + F) 98,882 88,425 98,882 88,425 HECS-HELP – Australian Government Payments (B) 51,735 47,421 51,735 47,421 Other Australian Government loan programmes Fee-HELP(B) 4,464 2,783 4,464 2,783 TOTAL AUSTRALIAN GOVERNMENT FINANCIAL ASSISTANCE 155,081 138,629 155,081 138,629
(G) AUSTRALIAN GOVERNMENT GRANTS RECEIVED - CASH BASIS CGS and Other DEEWR Grants 85,175 76,287 85,175 76,287 Higher Education Loan Programmes 53,962 46,848 53,962 46,848 Scholarships 3,128 2,442 3,128 2,442 DEEWR research 8,150 8,104 8,150 8,104 ARC grants – Discovery 793 715 793 715 ARC grants – Linkages 377 533 377 533 Other Australian Government Grants 1,221 345 1,221 345 Total Australian Government Grants received - cash basis 152,806 135,274 152,806 135,274 OS-Help (Net) 468 173 468 173 TOTAL AUSTRALIAN GOVERNMENT FUNDING RECEIVED - CASH BASIS 153,274 135,447 153,274 135,447
3.2 STATE AND LOCAL GOVERNMENT FINANCIAL ASSISTANCE
Victorian Government grants were received during the reporting period for the following purposes: Higher Education Other 108 107 108 107
108 107 108 107 tafe Recurrent funding 69,069 66,674 69,069 66,674 Capital 10,761 6,550 10,761 6,550 Fee for service 177 93 177 93 Specific funded programs 2,597 2,775 2,597 2,775 Other 1,446 1,995 1,446 1,995 84,050 78,087 84,050 78,087
TOTAL STATE GOVERNMENT FINANCIAL ASSISTANCE 84,158 78,194 84,158 78,194
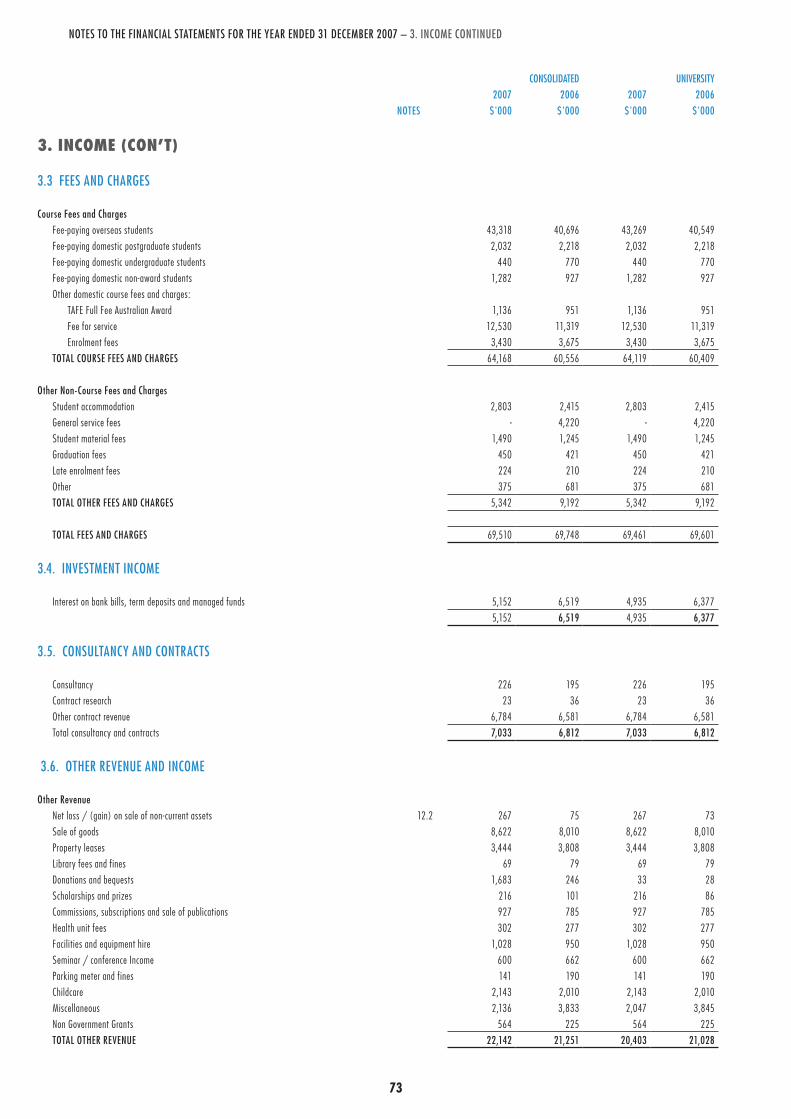
72 7372
NOTES TO THE FINANCIAL STATEMENTS FOR THE YEAR ENDED 31 DECEMBER 2007 – 3. INCOME CONTINUED
CONSOLIDATED UNIVERSITY 2007 2006 2007 2006 NOTES $'000 $'000 $'000 $'000
3. income (con’t)
3.3 FEES AND CHARGES
Course Fees and Charges Fee-paying overseas students 43,318 40,696 43,269 40,549 Fee-paying domestic postgraduate students 2,032 2,218 2,032 2,218 Fee-paying domestic undergraduate students 440 770 440 770 Fee-paying domestic non-award students 1,282 927 1,282 927 Other domestic course fees and charges: TAFE Full Fee Australian Award 1,136 951 1,136 951 Fee for service 12,530 11,319 12,530 11,319 Enrolment fees 3,430 3,675 3,430 3,675 TOTAL COURSE FEES AND CHARGES 64,168 60,556 64,119 60,409
Other Non-Course Fees and Charges Student accommodation 2,803 2,415 2,803 2,415 General service fees - 4,220 - 4,220 Student material fees 1,490 1,245 1,490 1,245 Graduation fees 450 421 450 421 Late enrolment fees 224 210 224 210 Other 375 681 375 681 TOTAL OTHER FEES AND CHARGES 5,342 9,192 5,342 9,192
TOTAL FEES AND CHARGES 69,510 69,748 69,461 69,601
3.4. INVESTMENT INCOME
Interest on bank bills, term deposits and managed funds 5,152 6,519 4,935 6,377 5,152 6,519 4,935 6,377
3.5. CONSULTANCY AND CONTRACTS
Consultancy 226 195 226 195 Contract research 23 36 23 36 Other contract revenue 6,784 6,581 6,784 6,581 Total consultancy and contracts 7,033 6,812 7,033 6,812
3.6. OTHER REVENUE AND INCOME
Other Revenue Net loss / (gain) on sale of non-current assets 12.2 267 75 267 73 Sale of goods 8,622 8,010 8,622 8,010 Property leases 3,444 3,808 3,444 3,808 Library fees and fines 69 79 69 79 Donations and bequests 1,683 246 33 28 Scholarships and prizes 216 101 216 86 Commissions, subscriptions and sale of publications 927 785 927 785 Health unit fees 302 277 302 277 Facilit ies and equipment hire 1,028 950 1,028 950 Seminar / conference Income 600 662 600 662 Parking meter and fines 141 190 141 190 Childcare 2,143 2,010 2,143 2,010 Miscellaneous 2,136 3,833 2,047 3,845 Non Government Grants 564 225 564 225 TOTAL OTHER REVENUE 22,142 21,251 20,403 21,028
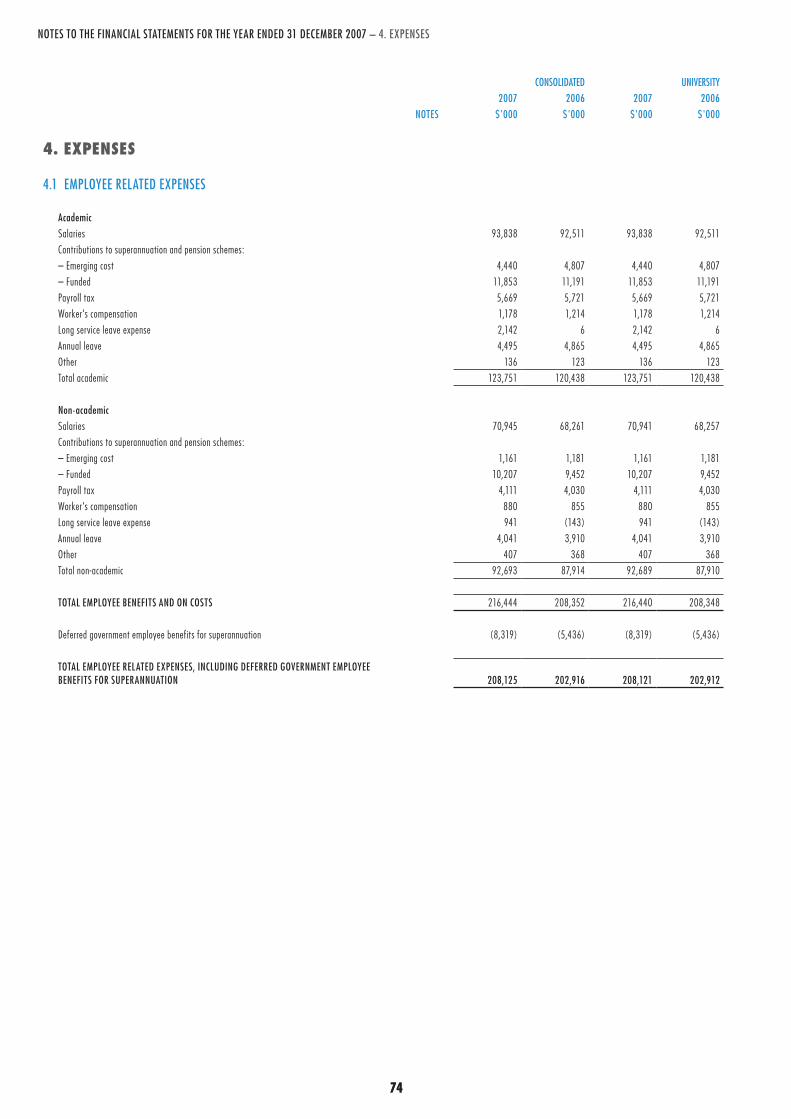
74 7574
NOTES TO THE FINANCIAL STATEMENTS FOR THE YEAR ENDED 31 DECEMBER 2007 – 4. EXPENSES
CONSOLIDATED UNIVERSITY 2007 2006 2007 2006 NOTES $'000 $'000 $'000 $'000
4. expenses
4.1 EMPLOYEE RELATED EXPENSES
Academic Salaries 93,838 92,511 93,838 92,511 Contributions to superannuation and pension schemes: – Emerging cost 4,440 4,807 4,440 4,807 – Funded 11,853 11,191 11,853 11,191 Payroll tax 5,669 5,721 5,669 5,721 Worker's compensation 1,178 1,214 1,178 1,214 Long service leave expense 2,142 6 2,142 6 Annual leave 4,495 4,865 4,495 4,865 Other 136 123 136 123 Total academic 123,751 120,438 123,751 120,438
Non-academic Salaries 70,945 68,261 70,941 68,257 Contributions to superannuation and pension schemes: – Emerging cost 1,161 1,181 1,161 1,181 – Funded 10,207 9,452 10,207 9,452 Payroll tax 4,111 4,030 4,111 4,030 Worker's compensation 880 855 880 855 Long service leave expense 941 (143) 941 (143)Annual leave 4,041 3,910 4,041 3,910 Other 407 368 407 368 Total non-academic 92,693 87,914 92,689 87,910
TOTAL EMPLOYEE BENEFITS AND ON COSTS 216,444 208,352 216,440 208,348
Deferred government employee benefits for superannuation (8,319) (5,436) (8,319) (5,436)
TOTAL EMPLOYEE RELATED EXPENSES, INCLUDING DEFERRED GOVERNMENT EMPLOYEE BENEFITS FOR SUPERANNUATION 208,125 202,916 208,121 202,912

74 7574
NOTES TO THE FINANCIAL STATEMENTS FOR THE YEAR ENDED 31 DECEMBER 2007 – 4. EXPENSES CONTINUED
CONSOLIDATED UNIVERSITY 2007 2006 2007 2006 NOTES $'000 $'000 $'000 $'000
4. expenses from orDinary activities (con’t)
4.2 DEPRECIATION AND AMORTISATION
Depreciation Buildings 10,609 10,653 10,609 10,653 Library collections 2,705 2,583 2,705 2,583 Plant, equipment and motor vehicles 3,110 2,733 3,110 2,733 Total depreciation 16,424 15,969 16,424 15,969
Amortisation Software 292 172 292 172 Total amortisation 292 172 292 172
TOTAL DEPRECIATION AND AMORTISATION 16,716 16,141 16,716 16,141
4.3 REPAIRS AND MAINTENANCE
Repairs and maintenance 7,722 7,342 7,722 7,342 Minor works 2,487 1,923 2,487 1,923 Cleaning 3,464 3,197 3,464 3,197 Security 2,665 2,422 2,665 2,422 Others 142 131 142 131 TOTAL REPAIRS AND MAINTENANCE 16,480 15,015 16,480 15,015
4.4 IMPAIRMENT OF ASSETS
Trade receivables 256 37 256 37 Student loans 2 3 2 3 TOTAL IMPAIRMENT OF ASSETS 258 40 258 40
4.5 OTHER EXPENSES
Scholarships, grants and prizes 9,101 8,536 8,923 8,396 Refund of income received in prior year 71 490 71 490 Donations 81 40 81 40 Telecommunications 3,798 3,010 3,798 3,010 Non-capitalised equipment 6,922 6,213 6,922 6,213 Travel, staff development and entertainment 8,849 8,429 8,849 8,429 Inventory used 5,286 4,970 5,286 4,969 Operating lease rental expenses 2,681 2,271 2,681 2,271 Energy costs 4,277 4,260 4,277 4,260 Printing and stationeries 3,673 3,399 3,673 3,399 Postage and freight 1,197 1,547 1,197 1,547 Fees and subscriptions 10,374 8,821 10,374 8,700 Legal and professional fees 5,585 7,856 5,562 7,834 Advertising, marketing and promotional expenses 4,738 4,334 4,738 4,334 Class materials and consumables 4,198 4,335 4,198 4,335 Student placement and practicum expenses 1,151 1,307 1,151 1,307 Other miscellaneous 7,117 6,830 7,112 6,831 TOTAL OTHER EXPENSES 79,099 76,648 78,893 76,365
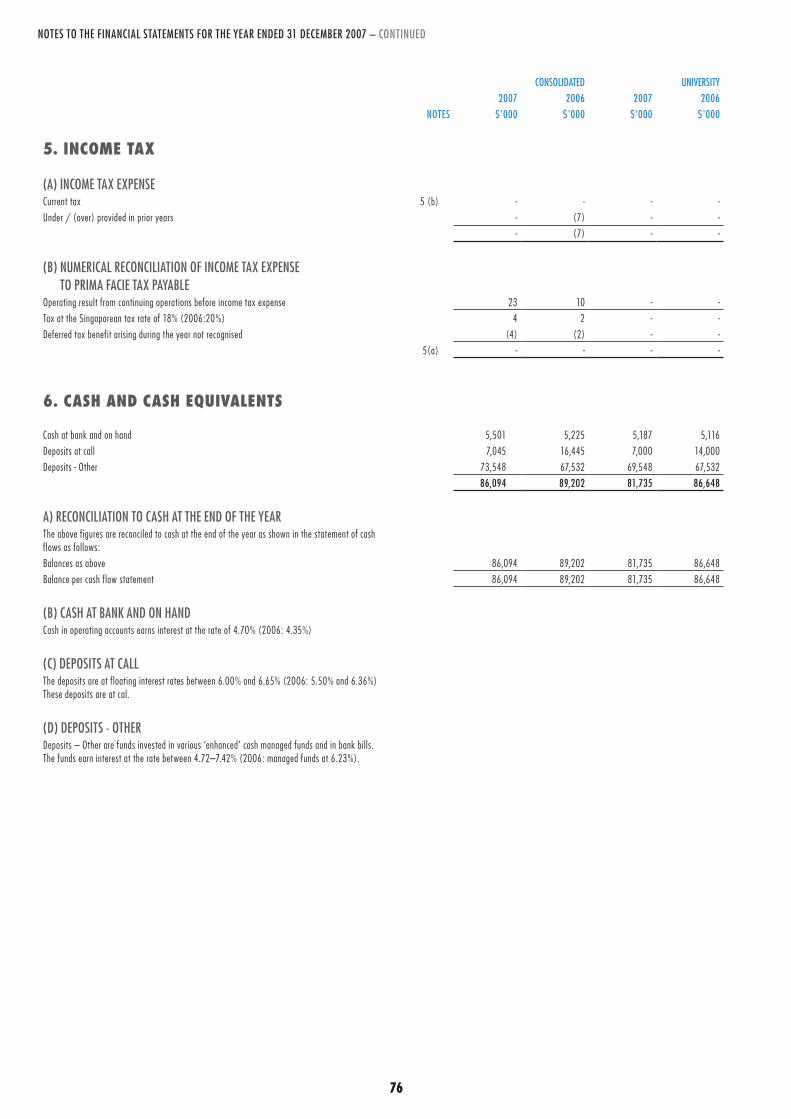
76 7776
NOTES TO THE FINANCIAL STATEMENTS FOR THE YEAR ENDED 31 DECEMBER 2007 – CONTINUED
CONSOLIDATED UNIVERSITY 2007 2006 2007 2006 NOTES $'000 $'000 $'000 $'000
5. income tax
(A) INCOME TAX EXPENSE Current tax 5 (b) - - - - Under / (over) provided in prior years - (7) - -
- (7) - -
(B) NUMERICAL RECONCILIATION OF INCOME TAX EXPENSE TO PRIMA FACIE TAX PAYABLE
Operating result from continuing operations before income tax expense 23 10 - - Tax at the Singaporean tax rate of 18% (2006:20%) 4 2 - - Deferred tax benefit arising during the year not recognised (4) (2) - -
5(a) - - - -
6. cash anD cash equivalents
Cash at bank and on hand 5,501 5,225 5,187 5,116 Deposits at call 7,045 16,445 7,000 14,000 Deposits - Other 73,548 67,532 69,548 67,532 86,094 89,202 81,735 86,648
A) RECONCILIATION TO CASH AT THE END OF THE YEAR The above figures are reconciled to cash at the end of the year as shown in the statement of cash flows as follows: Balances as above 86,094 89,202 81,735 86,648 Balance per cash flow statement 86,094 89,202 81,735 86,648
(B) CASH AT BANK AND ON HAND Cash in operating accounts earns interest at the rate of 4.70% (2006: 4.35%)
(C) DEPOSITS AT CALL The deposits are at floating interest rates between 6.00% and 6.65% (2006: 5.50% and 6.36%) These deposits are at cal.
(D) DEPOSITS - OTHER Deposits – Other are funds invested in various ‘enhanced’ cash managed funds and in bank bills. The funds earn interest at the rate between 4.72–7.42% (2006: managed funds at 6.23%).
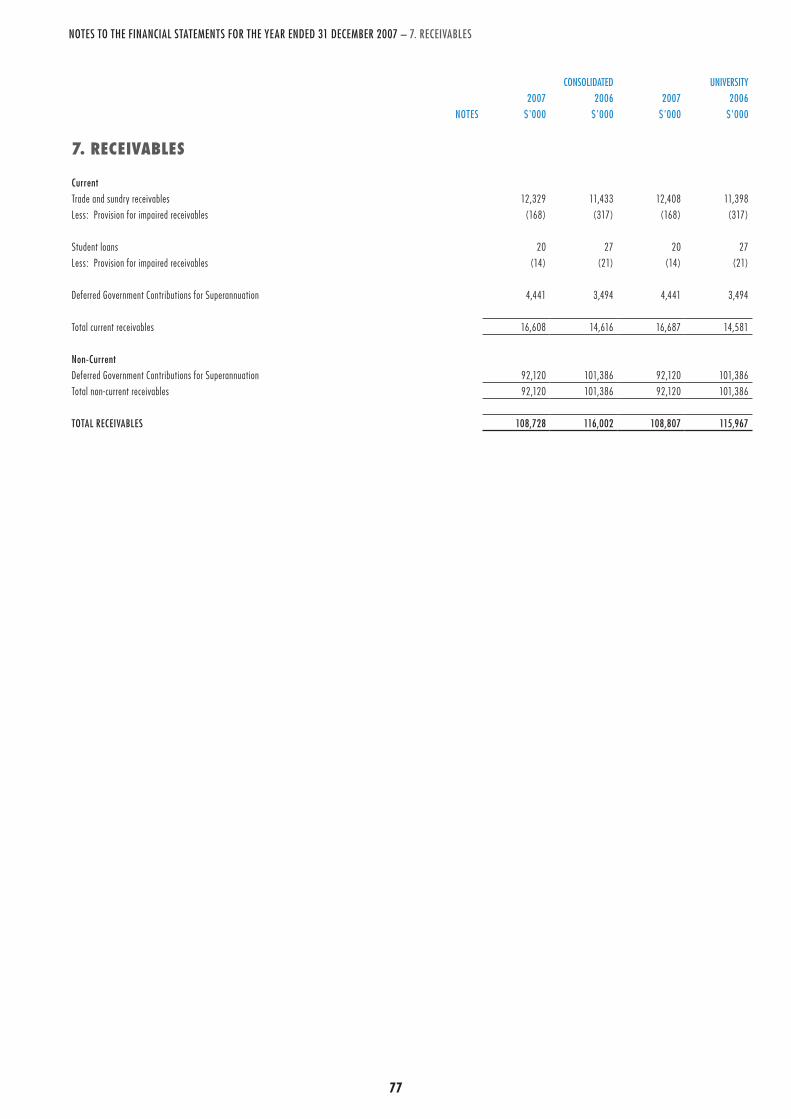
76 7776
NOTES TO THE FINANCIAL STATEMENTS FOR THE YEAR ENDED 31 DECEMBER 2007 – 7. RECEIVABLES
CONSOLIDATED UNIVERSITY 2007 2006 2007 2006 NOTES $'000 $'000 $'000 $'000
7. receivables
Current Trade and sundry receivables 12,329 11,433 12,408 11,398 Less: Provision for impaired receivables (168) (317) (168) (317)
Student loans 20 27 20 27 Less: Provision for impaired receivables (14) (21) (14) (21)
Deferred Government Contributions for Superannuation 4,441 3,494 4,441 3,494
Total current receivables 16,608 14,616 16,687 14,581
Non-Current Deferred Government Contributions for Superannuation 92,120 101,386 92,120 101,386 Total non-current receivables 92,120 101,386 92,120 101,386
TOTAL RECEIVABLES 108,728 116,002 108,807 115,967
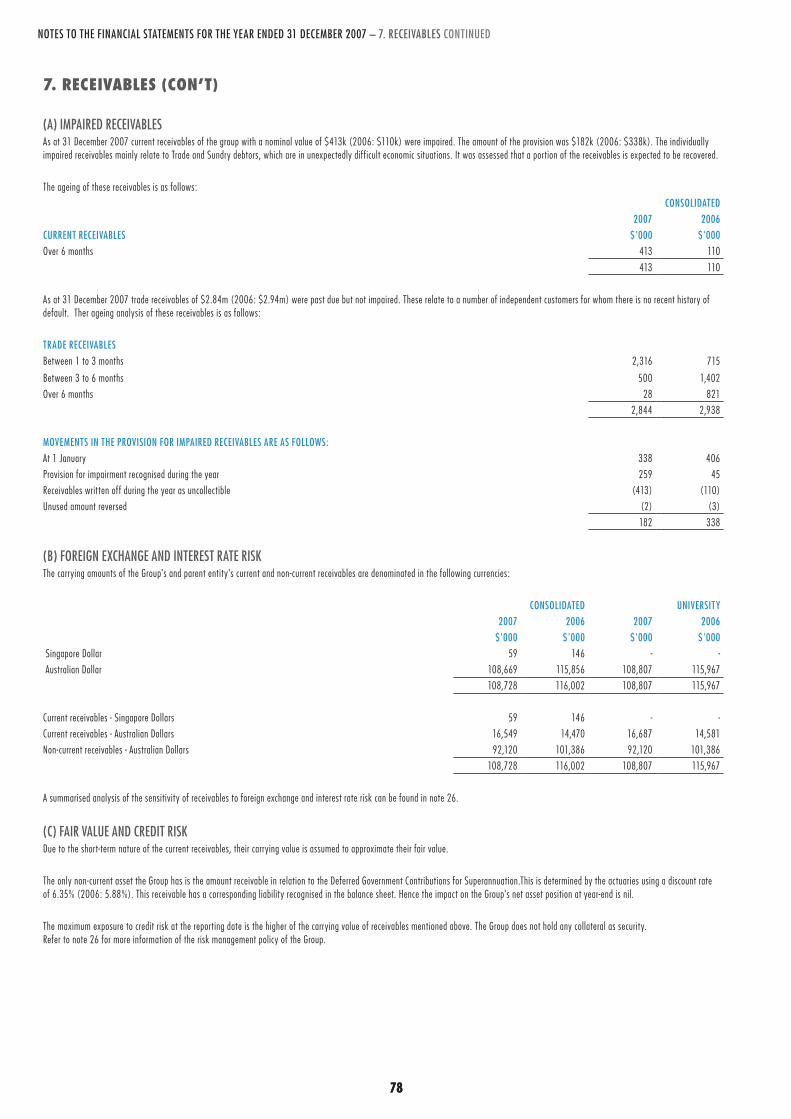
78 7978
NOTES TO THE FINANCIAL STATEMENTS FOR THE YEAR ENDED 31 DECEMBER 2007 – 7. RECEIVABLES CONTINUED
7. receivables (con’t)
(A) IMPAIRED RECEIVABLES As at 31 December 2007 current receivables of the group with a nominal value of $413k (2006: $110k) were impaired. The amount of the provision was $182k (2006: $338k). The individually impaired receivables mainly relate to Trade and Sundry debtors, which are in unexpectedly dif ficult economic situations. It was assessed that a portion of the receivables is expected to be recovered.
The ageing of these receivables is as follows: CONSOLIDATED
2007 2006CURRENT RECEIVABLES $'000 $'000 Over 6 months 413 110
413 110
As at 31 December 2007 trade receivables of $2.84m (2006: $2.94m) were past due but not impaired. These relate to a number of independent customers for whom there is no recent history of default. Ther ageing analysis of these receivables is as follows:
TRADE RECEIVABLESBetween 1 to 3 months
Between 3 to 6 months
2,316
500
715
1,402Over 6 months 28 821
2,844 2,938
MOVEMENTS IN THE PROVISION FOR IMPAIRED RECEIVABLES ARE AS FOLLOWS:At 1 January 338 406 Provision for impairment recognised during the year 259 45 Receivables writ ten off during the year as uncollectible (413) (110)Unused amount reversed (2) (3)
182 338
(B) FOREIGN EXCHANGE AND INTEREST RATE RISK The carrying amounts of the Group's and parent entity's current and non-current receivables are denominated in the following currencies:
CONSOLIDATED UNIVERSITY 2007 2006 2007 2006
$'000 $'000 $'000 $'000 Singapore Dollar 59 146 - - Australian Dollar 108,669 115,856 108,807 115,967
108,728 116,002 108,807 115,967
Current receivables - Singapore Dollars 59 146 - - Current receivables - Australian Dollars 16,549 14,470 16,687 14,581 Non-current receivables - Australian Dollars 92,120 101,386 92,120 101,386
108,728 116,002 108,807 115,967
A summarised analysis of the sensitivity of receivables to foreign exchange and interest rate risk can be found in note 26.
(C) FAIR VALUE AND CREDIT RISK Due to the short-term nature of the current receivables, their carrying value is assumed to approximate their fair value.
The only non-current asset the Group has is the amount receivable in relation to the Deferred Government Contributions for Superannuation.This is determined by the actuaries using a discount rate of 6.35% (2006: 5.88%). This receivable has a corresponding liability recognised in the balance sheet. Hence the impact on the Group's net asset position at year-end is nil.
The maximum exposure to credit risk at the reporting date is the higher of the carrying value of receivables mentioned above. The Group does not hold any collateral as security. Refer to note 26 for more information of the risk management policy of the Group.
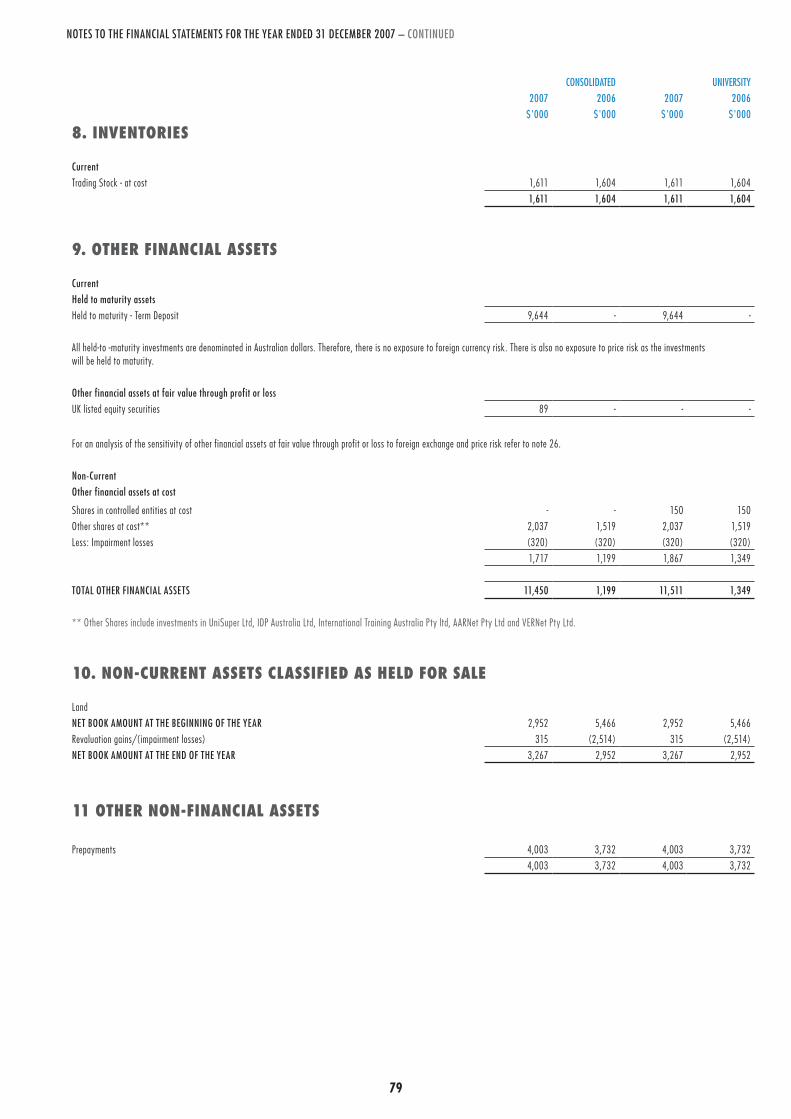
78 7978
NOTES TO THE FINANCIAL STATEMENTS FOR THE YEAR ENDED 31 DECEMBER 2007 – CONTINUED
CONSOLIDATED UNIVERSITY 2007 2006 2007 2006 $'000 $'000 $'000 $'000
8. inventories
Current Trading Stock - at cost 1,611 1,604 1,611 1,604
1,611 1,604 1,611 1,604
9. other financial assets
Current Held to maturity assets Held to maturity - Term Deposit 9,644 - 9,644 -
All held-to -maturity investments are denominated in Australian dollars. Therefore, there is no exposure to foreign currency risk. There is also no exposure to price risk as the investments will be held to maturity.
Other financial assets at fair value through profit or loss UK listed equity securities 89 - - -
For an analysis of the sensitivity of other financial assets at fair value through profit or loss to foreign exchange and price risk refer to note 26.
Non-Current Other financial assets at cost
Shares in controlled entities at cost - - 150 150 Other shares at cost** 2,037 1,519 2,037 1,519 Less: Impairment losses (320) (320) (320) (320)
1,717 1,199 1,867 1,349
TOTAL OTHER FINANCIAL ASSETS 11,450 1,199 11,511 1,349
** Other Shares include investments in UniSuper Ltd, IDP Australia Ltd, International Training Australia Pty ltd, AARNet Pty Ltd and VERNet Pty Ltd.
10. non-current assets classifieD as helD for sale
LandNET BOOK AMOUNT AT THE BEGINNING OF THE YEAR 2,952 5,466 2,952 5,466 Revaluation gains/(impairment losses) 315 (2,514) 315 (2,514)NET BOOK AMOUNT AT THE END OF THE YEAR 3,267 2,952 3,267 2,952
11 other non-financial assets
Prepayments 4,003 3,732 4,003 3,732 4,003 3,732 4,003 3,732
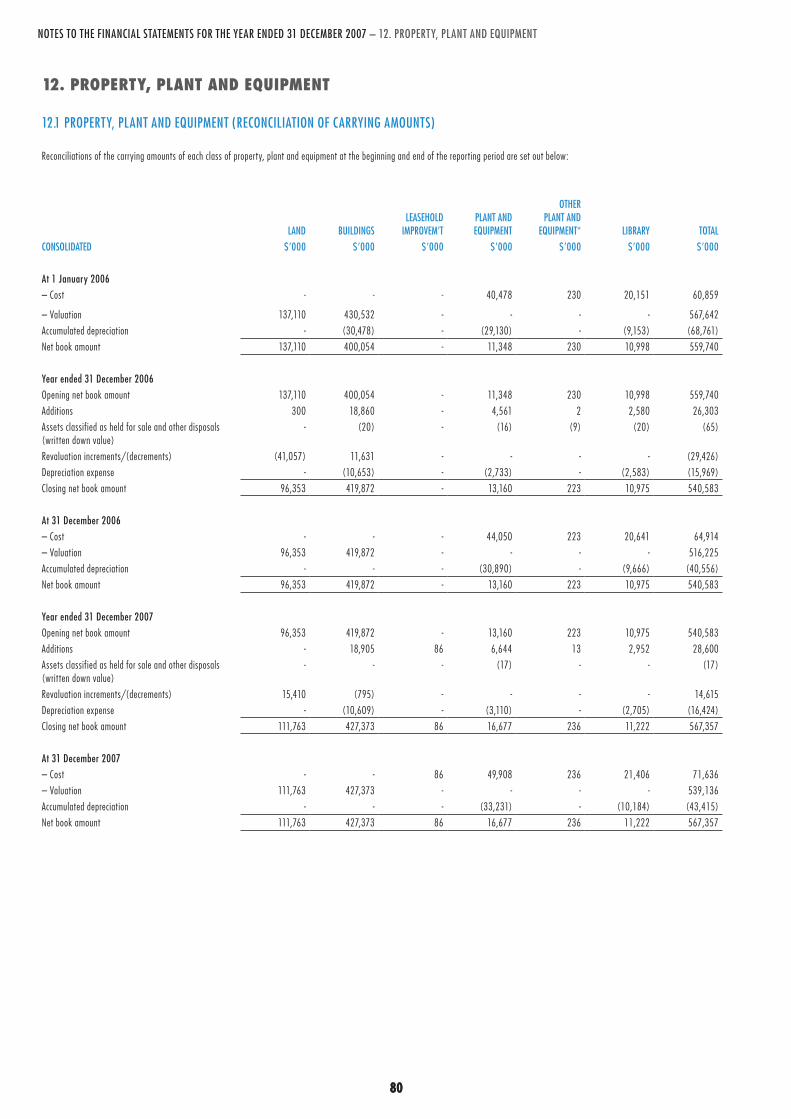
80 8180
NOTES TO THE FINANCIAL STATEMENTS FOR THE YEAR ENDED 31 DECEMBER 2007 – 12. PROPERTY, PLANT AND EQUIPMENT
12. property, plant anD equipment
12.1 PROPERTY, PLANT AND EQUIPMENT (RECONCILIATION OF CARRYING AMOUNTS)
Reconciliations of the carrying amounts of each class of property, plant and equipment at the beginning and end of the reporting period are set out below:
LAND BUILDINGS LEASEHOLD IMPROVEM’T
PLANT AND EQUIPMENT
OTHER PLANT AND
EQUIPMENT* LIBRARY TOTAL CONSOLIDATED $’000 $’000 $’000 $’000 $’000 $’000 $’000 At 1 January 2006– Cost - - - 40,478 230 20,151 60,859
– Valuation 137,110 430,532 - - - - 567,642 Accumulated depreciation - (30,478) - (29,130) - (9,153) (68,761)Net book amount 137,110 400,054 - 11,348 230 10,998 559,740
Year ended 31 December 2006Opening net book amount 137,110 400,054 - 11,348 230 10,998 559,740 Additions 300 18,860 - 4,561 2 2,580 26,303 Assets classified as held for sale and other disposals (writ ten down value)
- (20) - (16) (9) (20) (65)
Revaluation increments/(decrements) (41,057) 11,631 - - - - (29,426)Depreciation expense - (10,653) - (2,733) - (2,583) (15,969)Closing net book amount 96,353 419,872 - 13,160 223 10,975 540,583
At 31 December 2006– Cost - - - 44,050 223 20,641 64,914 – Valuation 96,353 419,872 - - - - 516,225 Accumulated depreciation - - - (30,890) - (9,666) (40,556)Net book amount 96,353 419,872 - 13,160 223 10,975 540,583
Year ended 31 December 2007Opening net book amount 96,353 419,872 - 13,160 223 10,975 540,583 Additions - 18,905 86 6,644 13 2,952 28,600 Assets classified as held for sale and other disposals (writ ten down value)
- - - (17) - - (17)
Revaluation increments/(decrements) 15,410 (795) - - - - 14,615 Depreciation expense - (10,609) - (3,110) - (2,705) (16,424)Closing net book amount 111,763 427,373 86 16,677 236 11,222 567,357
At 31 December 2007– Cost - - 86 49,908 236 21,406 71,636 – Valuation 111,763 427,373 - - - - 539,136 Accumulated depreciation - - - (33,231) - (10,184) (43,415)Net book amount 111,763 427,373 86 16,677 236 11,222 567,357
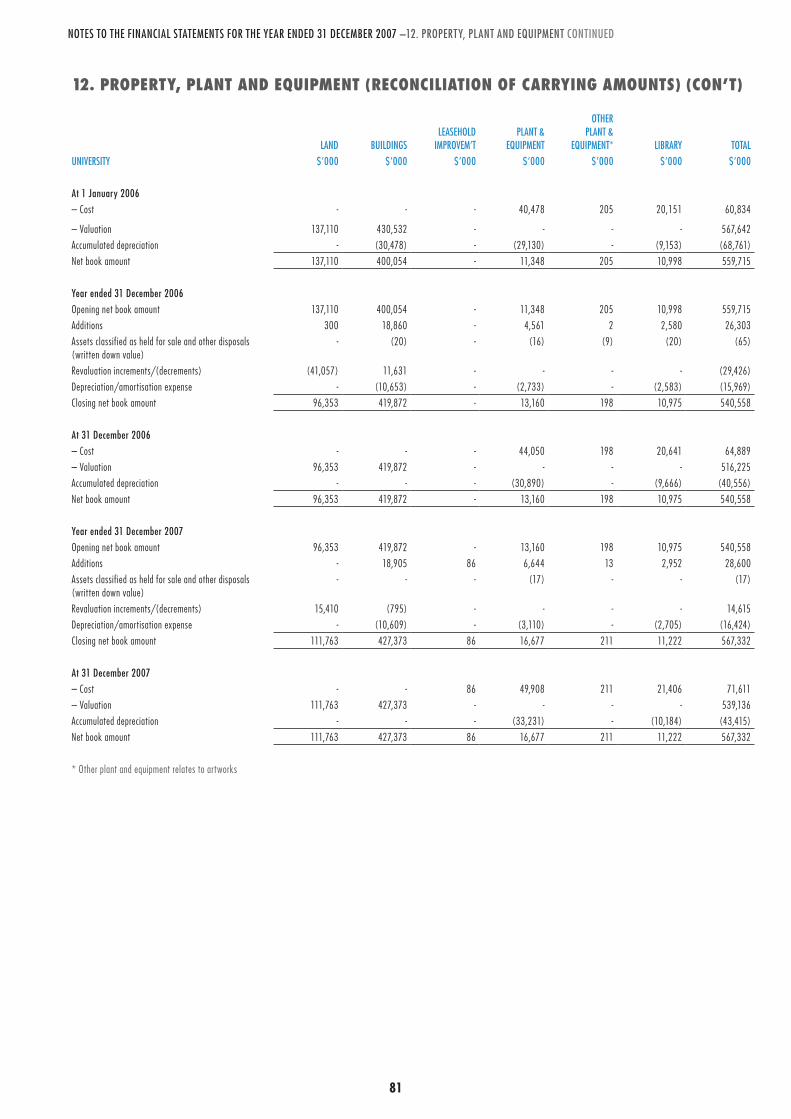
80 8180
NOTES TO THE FINANCIAL STATEMENTS FOR THE YEAR ENDED 31 DECEMBER 2007 –12. PROPERTY, PLANT AND EQUIPMENT CONTINUED
12. property, plant anD equipment (reconciliation of carrying amounts) (con’t)
LAND BUILDINGS LEASEHOLD
IMPROVEM’TPLANT &
EQUIPMENT
OTHER PLANT &
EQUIPMENT* LIBRARY TOTAL UNIVERSITY $’000 $’000 $’000 $’000 $’000 $’000 $’000
At 1 January 2006– Cost - - - 40,478 205 20,151 60,834
– Valuation 137,110 430,532 - - - - 567,642 Accumulated depreciation - (30,478) - (29,130) - (9,153) (68,761)Net book amount 137,110 400,054 - 11,348 205 10,998 559,715
Year ended 31 December 2006Opening net book amount 137,110 400,054 - 11,348 205 10,998 559,715 Additions 300 18,860 - 4,561 2 2,580 26,303 Assets classified as held for sale and other disposals (writ ten down value)
- (20) - (16) (9) (20) (65)
Revaluation increments/(decrements) (41,057) 11,631 - - - - (29,426)Depreciation/amortisation expense - (10,653) - (2,733) - (2,583) (15,969)Closing net book amount 96,353 419,872 - 13,160 198 10,975 540,558
At 31 December 2006– Cost - - - 44,050 198 20,641 64,889 – Valuation 96,353 419,872 - - - - 516,225 Accumulated depreciation - - - (30,890) - (9,666) (40,556)Net book amount 96,353 419,872 - 13,160 198 10,975 540,558
Year ended 31 December 2007Opening net book amount 96,353 419,872 - 13,160 198 10,975 540,558 Additions - 18,905 86 6,644 13 2,952 28,600 Assets classified as held for sale and other disposals (writ ten down value)
- - - (17) - - (17)
Revaluation increments/(decrements) 15,410 (795) - - - - 14,615 Depreciation/amortisation expense - (10,609) - (3,110) - (2,705) (16,424)Closing net book amount 111,763 427,373 86 16,677 211 11,222 567,332
At 31 December 2007– Cost - - 86 49,908 211 21,406 71,611 – Valuation 111,763 427,373 - - - - 539,136 Accumulated depreciation - - - (33,231) - (10,184) (43,415)Net book amount 111,763 427,373 86 16,677 211 11,222 567,332
* Other plant and equipment relates to artworks

82 83
NOTES TO THE FINANCIAL STATEMENTS FOR THE YEAR ENDED 31 DECEMBER 2007 – CONTINUED
12. property, plant anD equipment (reconciliation of carrying amounts) (con’t) CONSOLIDATED UNIVERSITY
2007 2006 2007 2006 NOTES $'000 $'000 $'000 $'000
12.2 OPERATING RESULT FROM DISPOSAL OF PROPERTY, PLANT AND EQUIPMENT
Proceeds from sale of property, plant and equipment 284 140 284 138
Written down value of assets sold (17) (65) (17) (65)Revaluation reserve realised on disposal - - - - Written down value of assets sold (17) (65) (17) (65)
Net gain / (loss) on disposal of property, plant and equipment 3.6 267 75 267 73
12..3 VALUATIONS OF LAND AND BUILDINGS
The valuation basis for land and buildings is fair value based on valuation by external independent valuers, as conducted in 2007 and 2006, adjusted for any market movements or based on value-in-use. The revaluation surplus / short fall was taken to revaluation reserves in equity (note 17(b)).
13. intangible assets
SOFTWARE TOTAL CONSOLIDATED AND UNIVERSITY $000 $000
At 1 January 2006Cost 2,039 2,039 Accumulated amortisation and impairment (1,689) (1,689)Net book amount 350 350
Year ended 31 December 2006Opening net book amount 350 350 Additions 568 568 Amortisation charge (172) (172)Closing net book amount 746 746
At 31 December 2006Cost 2,608 2,608 Accumulated amortisation and impairment (1,862) (1,862)Net book amount 746 746
Year ended 31 December 2007Opening net book amount 746 746 Additions 481 481 Amortisation charge (292) (292)Closing net book amount 935 935
At 31 December 2007Cost 3,078 3,078 Accumulated amortisation and impairment (2,143) (2,143)Closing net book amount 935 935
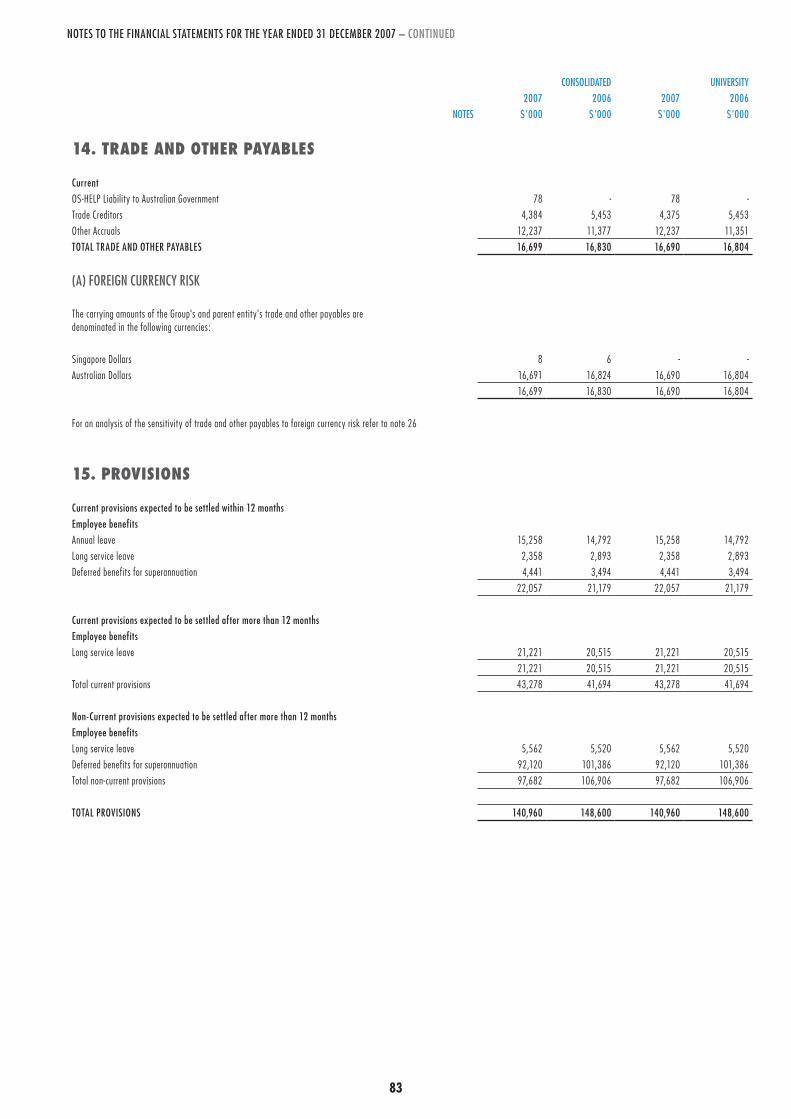
82 83
NOTES TO THE FINANCIAL STATEMENTS FOR THE YEAR ENDED 31 DECEMBER 2007 – CONTINUED
CONSOLIDATED UNIVERSITY 2007 2006 2007 2006
NOTES $'000 $'000 $'000 $'000
14. traDe anD other payables
CurrentOS-HELP Liability to Australian Government 78 - 78 - Trade Creditors 4,384 5,453 4,375 5,453 Other Accruals 12,237 11,377 12,237 11,351 TOTAL TRADE AND OTHER PAYABLES 16,699 16,830 16,690 16,804
(A) FOREIGN CURRENCY RISK
The carrying amounts of the Group's and parent entity's trade and other payables are denominated in the following currencies:
Singapore Dollars 8 6 - - Australian Dollars 16,691 16,824 16,690 16,804
16,699 16,830 16,690 16,804
For an analysis of the sensitivity of trade and other payables to foreign currency risk refer to note 26
15. provisions
Current provisions expected to be settled within 12 monthsEmployee benefitsAnnual leave 15,258 14,792 15,258 14,792 Long service leave 2,358 2,893 2,358 2,893 Deferred benefits for superannuation 4,441 3,494 4,441 3,494
22,057 21,179 22,057 21,179
Current provisions expected to be settled after more than 12 monthsEmployee benefitsLong service leave 21,221 20,515 21,221 20,515
21,221 20,515 21,221 20,515 Total current provisions 43,278 41,694 43,278 41,694
Non-Current provisions expected to be settled after more than 12 monthsEmployee benefitsLong service leave 5,562 5,520 5,562 5,520 Deferred benefits for superannuation 92,120 101,386 92,120 101,386 Total non-current provisions 97,682 106,906 97,682 106,906
TOTAL PROVISIONS 140,960 148,600 140,960 148,600
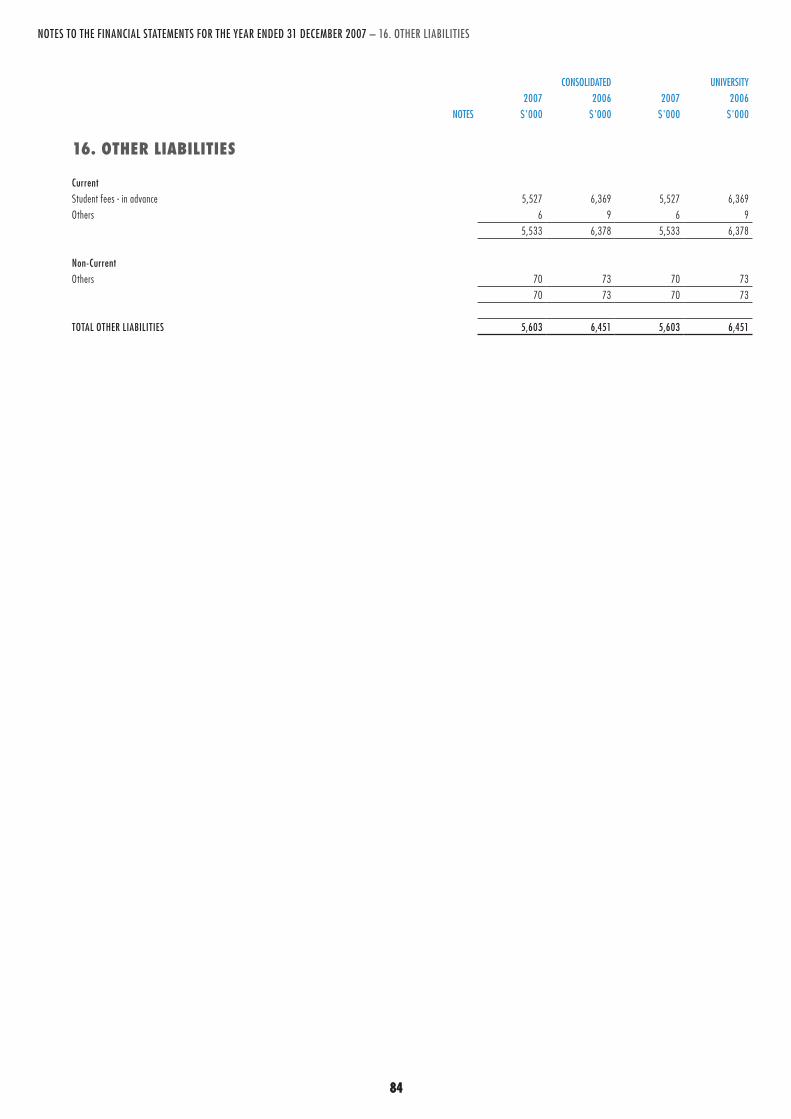
84 8584
NOTES TO THE FINANCIAL STATEMENTS FOR THE YEAR ENDED 31 DECEMBER 2007 – 16. OTHER LIABILITIES
CONSOLIDATED UNIVERSITY 2007 2006 2007 2006
NOTES $'000 $'000 $'000 $'000
16. other liabilities
CurrentStudent fees - in advance 5,527 6,369 5,527 6,369 Others 6 9 6 9
5,533 6,378 5,533 6,378
Non-CurrentOthers 70 73 70 73
70 73 70 73
TOTAL OTHER LIABILITIES 5,603 6,451 5,603 6,451
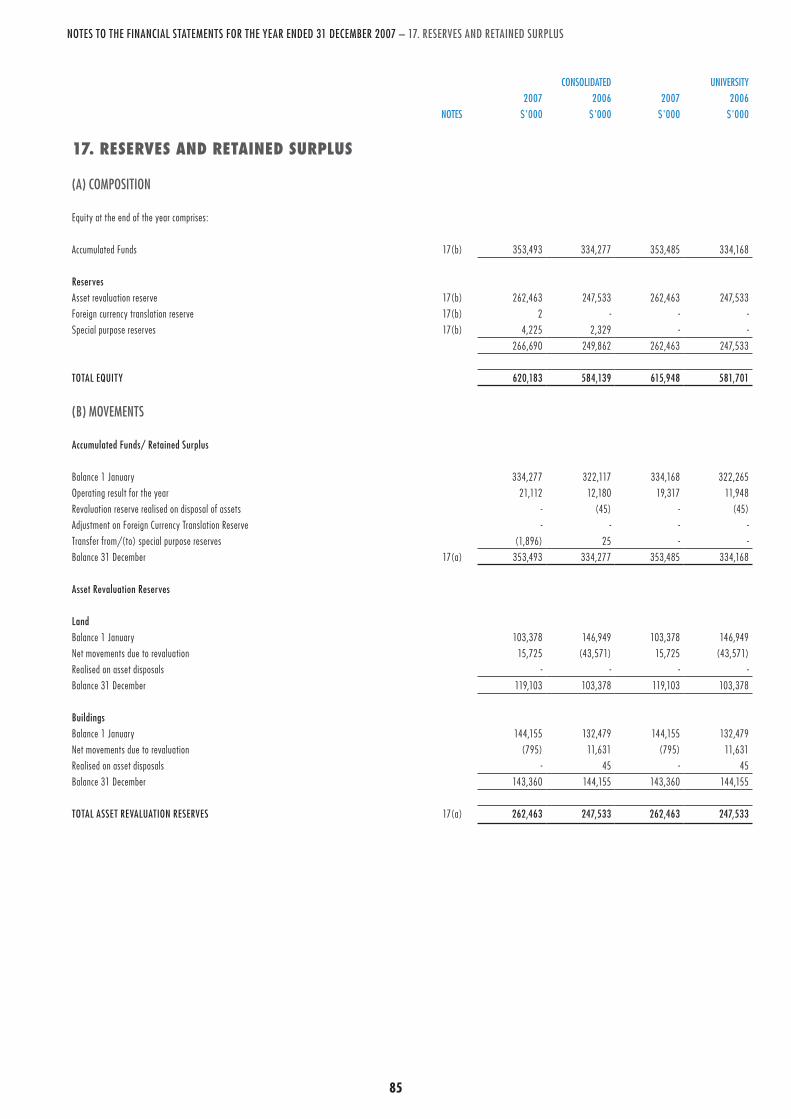
84 8584
NOTES TO THE FINANCIAL STATEMENTS FOR THE YEAR ENDED 31 DECEMBER 2007 – 17. RESERVES AND RETAINED SURPLUS
CONSOLIDATED UNIVERSITY 2007 2006 2007 2006
NOTES $'000 $'000 $'000 $'000
17. reserves anD retaineD surplus
(A) COMPOSITION
Equity at the end of the year comprises:
Accumulated Funds 17(b) 353,493 334,277 353,485 334,168
ReservesAsset revaluation reserve 17(b) 262,463 247,533 262,463 247,533 Foreign currency translation reserve 17(b) 2 - - - Special purpose reserves 17(b) 4,225 2,329 - -
266,690 249,862 262,463 247,533
TOTAL EQUITY 620,183 584,139 615,948 581,701
(B) MOVEMENTS
Accumulated Funds/ Retained Surplus
Balance 1 January 334,277 322,117 334,168 322,265 Operating result for the year 21,112 12,180 19,317 11,948 Revaluation reserve realised on disposal of assets - (45) - (45)Adjustment on Foreign Currency Translation Reserve - - - - Transfer from/(to) special purpose reserves (1,896) 25 - - Balance 31 December 17(a) 353,493 334,277 353,485 334,168
Asset Revaluation Reserves
LandBalance 1 January 103,378 146,949 103,378 146,949 Net movements due to revaluation 15,725 (43,571) 15,725 (43,571)Realised on asset disposals - - - - Balance 31 December 119,103 103,378 119,103 103,378
BuildingsBalance 1 January 144,155 132,479 144,155 132,479 Net movements due to revaluation (795) 11,631 (795) 11,631 Realised on asset disposals - 45 - 45 Balance 31 December 143,360 144,155 143,360 144,155
TOTAL ASSET REVALUATION RESERVES 17(a) 262,463 247,533 262,463 247,533
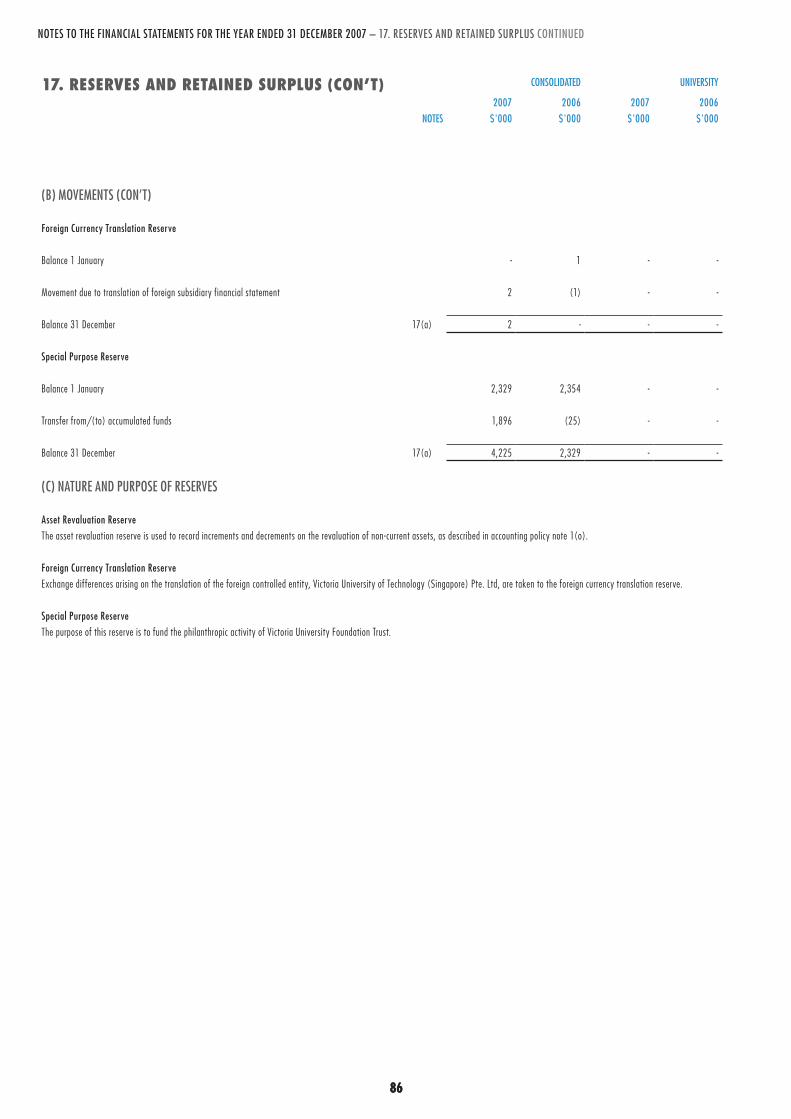
86 8786
NOTES TO THE FINANCIAL STATEMENTS FOR THE YEAR ENDED 31 DECEMBER 2007 – 17. RESERVES AND RETAINED SURPLUS CONTINUED
17. reserves anD retaineD surplus (con’t) CONSOLIDATED UNIVERSITY
2007 2006 2007 2006NOTES $'000 $'000 $'000 $'000
(B) MOVEMENTS (CON’T)
Foreign Currency Translation Reserve
Balance 1 January - 1 - -
Movement due to translation of foreign subsidiary financial statement 2 (1) - -
Balance 31 December 17(a) 2 - - -
Special Purpose Reserve
Balance 1 January 2,329 2,354 - -
Transfer from/(to) accumulated funds 1,896 (25) - -
Balance 31 December 17(a) 4,225 2,329 - -
(C) NATURE AND PURPOSE OF RESERVES
Asset Revaluation ReserveThe asset revaluation reserve is used to record increments and decrements on the revaluation of non-current assets, as described in accounting policy note 1(o).
Foreign Currency Translation ReserveExchange dif ferences arising on the translation of the foreign controlled entity, Victoria University of Technology (Singapore) Pte. Ltd, are taken to the foreign currency translation reserve.
Special Purpose ReserveThe purpose of this reserve is to fund the philanthropic activity of Victoria University Foundation Trust.

86 8786
NOTES TO THE FINANCIAL STATEMENTS FOR THE YEAR ENDED 31 DECEMBER 2007 –18. KEY MANAGEMENT PERSONNEL DISCLOSURES
(A) NAMES OF RESPONSIBLE PERSONS AND EXECUTIVE OFFICERS
(I) NAMES OF RESPONSIBLE PERSONS For the purposes of the Financial Management Act 1994, the Minister for Education and Training and members of the University Council are the responsible persons of the University. The names of persons who were responsible persons at anytime during the financial year, were: The Hon. Jacinta Allan, Minister for Skills and Workforce Participation
Professor E.Harman, Vice-Chancellor and President.
Council Members during 2007 were:Mr K. Baker Mr G. BucklandDr J. Doughney Commissioner D. Foggo (Deputy Chancellor)Dr I. Gilmour Dr R. GouldMs M. Haggart Assoc. Professor M.Hamel-Green (to 11 June 2007)Professor E. Harman (Vice Chancellor and President)Ms A. Hassett (Appointed on 6 March 2007)Ms M. LangMr K. LattaMr K. LoughnanMrs A.Mantoo (Appointed on 6 March 2007)Ms. T. McCluskeyAssoc. Professor M. Minchinton (member of Council from 12 June 2007 to 30 November 2007)Mr J. O'Rourke Mr L. Tapinos (Resigned on 8 August 2007)Ms M. Tarrant (Appointed on 6 March 2007)Professor R.Teese The Hon. Justice Mr F. Vincent (Chancellor)Mr M.Zaar
(II) NAMES OF EXECUTIVE OFFICERSDr R. BrownMr G. Carter Professor R. Carter Professor C. Clark Mr P. County Professor P. Creamer (Commenced on 23 July 2007)Ms A. de Villiers Professor R. EadeProfessor J. Finkelstein Ms K. Fitzpatrick (Commenced on 23 July 2007)Dr M. Grossman (Commenced on 30 July 2007)Professor E. Harman (Vice Chancellor and President)Mr J.Hickman Ms A. Jones (Ceased on 7 May 2007) Dr A.T. Jones Professor B. King (Commenced on 16 July 2007)Ms L. King (Commenced on 7 May 2007)Mr P.KentMr P. Lange (Ceased on 18 June 2007)*Mr P. Lodhiya Professor E. Martin (Ceased on 29 July 2007)Professor S. Martin Professor J. McCallum Ms B. McLennanProfessor J.Mienczakowski (Ceased on 18 June 2007)Professor G. MorrisMs C. Morrissey (Commenced on 7 May 2007)Mr L. Newman (Commenced on 9 July 2007)Ms J. Richards (Ceased on 7 May 2007)*Professor L. Rosenman (Commenced on 29 January 2007)Professor I. Rouse Dr S. Stern Ms S. Thomas (Ceased on 13 July 2007)Mr S. Weller Ms K. Whye (Ceased on 7 May 2007)*Ms S. Young (Commenced on 23 July 2007)
* Acting members until 3 positions were filled.
18. key management personnel Disclosures

88 89
NOTES TO THE FINANCIAL STATEMENTS FOR THE YEAR ENDED 31 DECEMBER 2007 –18. KEY MANAGEMENT PERSONNEL DISCLOSURES CONTINUED
(B) REMUNERATION OF BOARD MEMBERS AND EXECUTIVES
REMUNERATION OF BOARD MEMBERS CONSOLIDATED UNIVERSITY 2007 2006 2007 2006
$’000 $’000 $’000 $’000 REMUNERATIONIncome paid or payable, or otherwise made available, to Council members by entities in the consolidated entity and related parties in connection with the management of affairs of the parent entity or its controlled entities: 95 73 91 69
Remuneration paid to Ministers is reported in the Annual Report of the Department of Premier and Cabinet.
CONSOLIDATED UNIVERSITY 2007 2006 2007 2006
NUMBER NUMBER NUMBER NUMBER REMUNERATION BANDSNil to $14,999 39 35 22 22
TOTAL NUMBERS 39 35 22 22
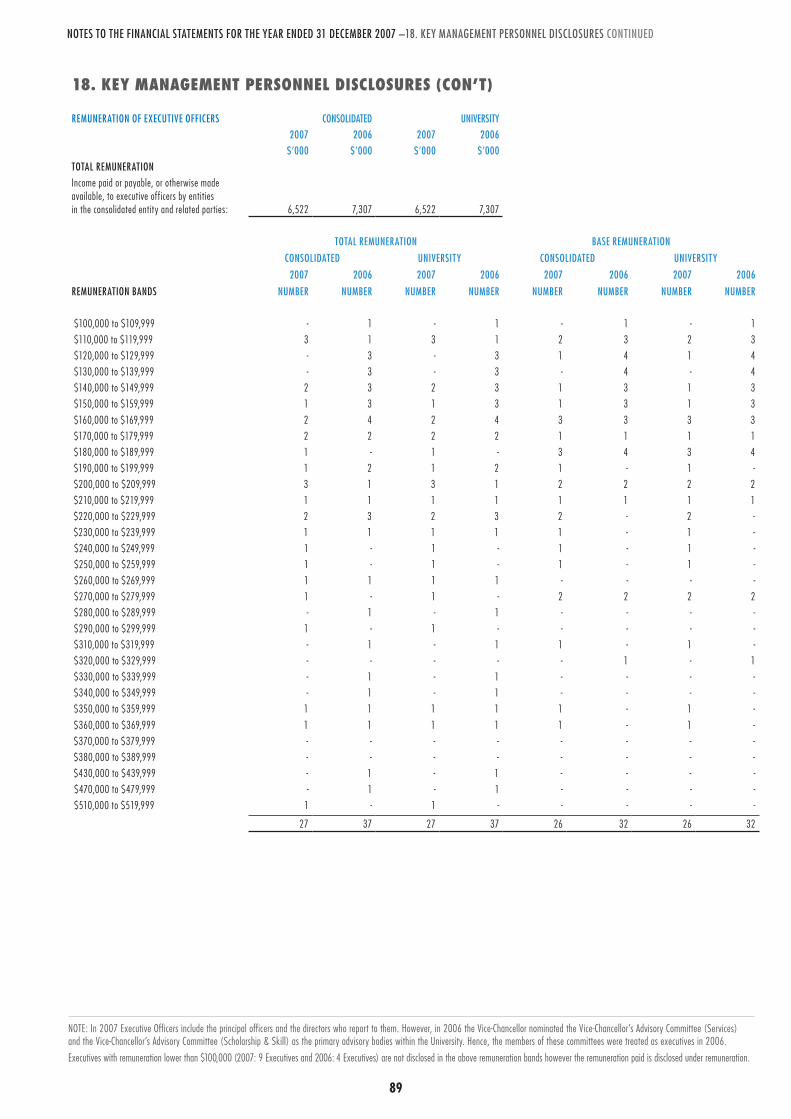
88 89
NOTES TO THE FINANCIAL STATEMENTS FOR THE YEAR ENDED 31 DECEMBER 2007 –18. KEY MANAGEMENT PERSONNEL DISCLOSURES CONTINUED
18. key management personnel Disclosures (con’t)
REMUNERATION OF EXECUTIVE OFFICERS CONSOLIDATED UNIVERSITY 2007 2006 2007 2006
$’000 $’000 $’000 $’000 TOTAL REMUNERATIONIncome paid or payable, or otherwise made available, to executive officers by entities in the consolidated entity and related parties: 6,522 7,307 6,522 7,307
TOTAL REMUNERATION BASE REMUNERATION
CONSOLIDATED UNIVERSITY CONSOLIDATED UNIVERSITY
2007 2006 2007 2006 2007 2006 2007 2006
REMUNERATION BANDS NUMBER NUMBER NUMBER NUMBER NUMBER NUMBER NUMBER NUMBER
$100,000 to $109,999 - 1 - 1 - 1 - 1 $110,000 to $119,999 3 1 3 1 2 3 2 3 $120,000 to $129,999 - 3 - 3 1 4 1 4 $130,000 to $139,999 - 3 - 3 - 4 - 4 $140,000 to $149,999 2 3 2 3 1 3 1 3 $150,000 to $159,999 1 3 1 3 1 3 1 3 $160,000 to $169,999 2 4 2 4 3 3 3 3 $170,000 to $179,999 2 2 2 2 1 1 1 1 $180,000 to $189,999 1 - 1 - 3 4 3 4 $190,000 to $199,999 1 2 1 2 1 - 1 - $200,000 to $209,999 3 1 3 1 2 2 2 2 $210,000 to $219,999 1 1 1 1 1 1 1 1 $220,000 to $229,999 2 3 2 3 2 - 2 - $230,000 to $239,999 1 1 1 1 1 - 1 - $240,000 to $249,999 1 - 1 - 1 - 1 - $250,000 to $259,999 1 - 1 - 1 - 1 - $260,000 to $269,999 1 1 1 1 - - - - $270,000 to $279,999 1 - 1 - 2 2 2 2 $280,000 to $289,999 - 1 - 1 - - - - $290,000 to $299,999 1 - 1 - - - - - $310,000 to $319,999 - 1 - 1 1 - 1 - $320,000 to $329,999 - - - - - 1 - 1 $330,000 to $339,999 - 1 - 1 - - - - $340,000 to $349,999 - 1 - 1 - - - - $350,000 to $359,999 1 1 1 1 1 - 1 - $360,000 to $369,999 1 1 1 1 1 - 1 - $370,000 to $379,999 - - - - - - - - $380,000 to $389,999 - - - - - - - - $430,000 to $439,999 - 1 - 1 - - - - $470,000 to $479,999 - 1 - 1 - - - - $510,000 to $519,999 1 - 1 - - - - -
27 37 27 37 26 32 26 32
NOTE: In 2007 Executive Officers include the principal officers and the directors who report to them. However, in 2006 the Vice-Chancellor nominated the Vice-Chancellor’s Advisory Committee (Services) and the Vice-Chancellor’s Advisory Committee (Scholarship & Skill) as the primary advisory bodies within the University. Hence, the members of these committees were treated as executives in 2006.Executives with remuneration lower than $100,000 (2007: 9 Executives and 2006: 4 Executives) are not disclosed in the above remuneration bands however the remuneration paid is disclosed under remuneration.
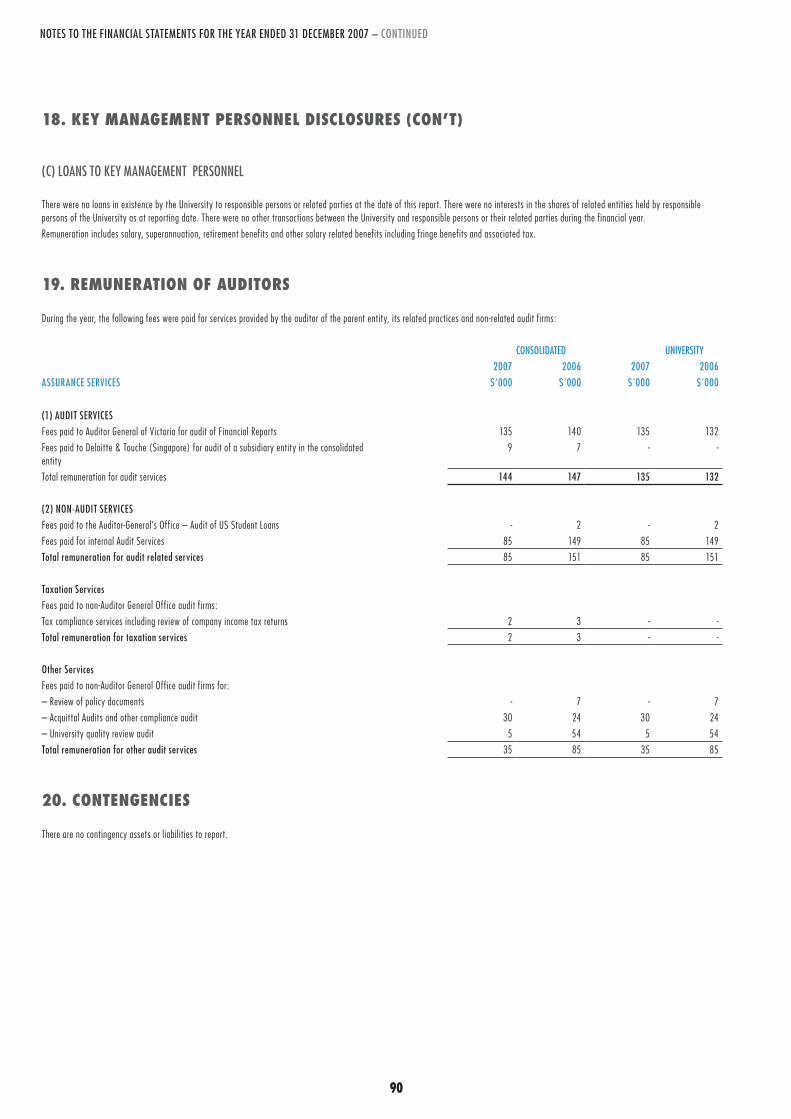
90 9190
NOTES TO THE FINANCIAL STATEMENTS FOR THE YEAR ENDED 31 DECEMBER 2007 – CONTINUED
18. key management personnel Disclosures (con’t)
(C) LOANS TO KEY MANAGEMENT PERSONNEL
There were no loans in existence by the University to responsible persons or related parties at the date of this report. There were no interests in the shares of related entities held by responsible persons of the University as at reporting date. There were no other transactions between the University and responsible persons or their related parties during the financial year. Remuneration includes salary, superannuation, retirement benefits and other salary related benefits including fringe benefits and associated tax.
19. remuneration of auDitors
During the year, the following fees were paid for services provided by the auditor of the parent entity, its related practices and non-related audit firms:
CONSOLIDATED UNIVERSITY 2007 2006 2007 2006
ASSURANCE SERVICES $'000 $'000 $'000 $'000
(1) AUDIT SERVICESFees paid to Auditor General of Victoria for audit of Financial Reports 135 140 135 132 Fees paid to Deloit te & Touche (Singapore) for audit of a subsidiary entity in the consolidated entity
9 7 - -
Total remuneration for audit services 144 147 135 132
(2) NON-AUDIT SERVICESFees paid to the Auditor-General’s Office – Audit of US Student Loans - 2 - 2 Fees paid for internal Audit Services 85 149 85 149 Total remuneration for audit related services 85 151 85 151
Taxation ServicesFees paid to non-Auditor General Office audit firms:Tax compliance services including review of company income tax returns 2 3 - - Total remuneration for taxation services 2 3 - -
Other ServicesFees paid to non-Auditor General Office audit firms for:– Review of policy documents - 7 - 7– Acquit tal Audits and other compliance audit 30 24 30 24 – University quality review audit 5 54 5 54 Total remuneration for other audit services 35 85 35 85
20. contengencies
There are no contingency assets or liabilit ies to report.
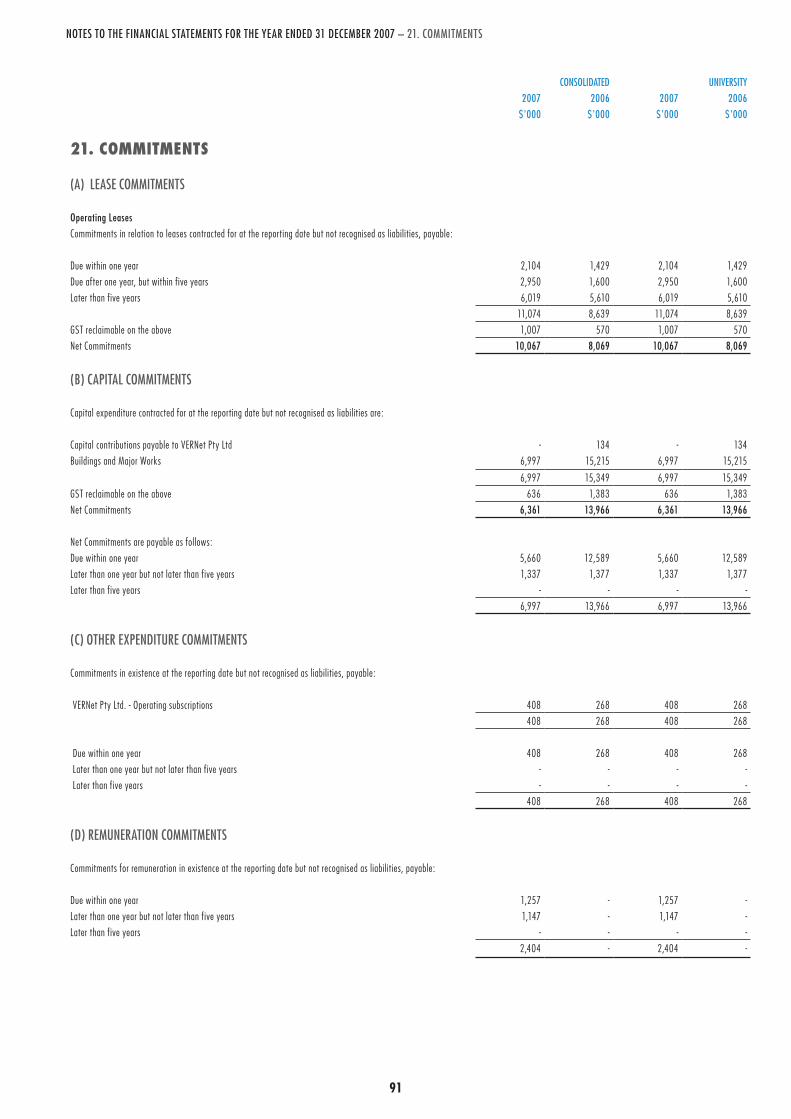
90 9190
NOTES TO THE FINANCIAL STATEMENTS FOR THE YEAR ENDED 31 DECEMBER 2007 – 21. COMMITMENTS
CONSOLIDATED UNIVERSITY 2007 2006 2007 2006
$'000 $'000 $'000 $'000
21. commitments
(A) LEASE COMMITMENTS
Operating Leases Commitments in relation to leases contracted for at the reporting date but not recognised as liabilit ies, payable:
Due within one year 2,104 1,429 2,104 1,429 Due after one year, but within five years 2,950 1,600 2,950 1,600 Later than five years 6,019 5,610 6,019 5,610
11,074 8,639 11,074 8,639 GST reclaimable on the above 1,007 570 1,007 570 Net Commitments 10,067 8,069 10,067 8,069
(B) CAPITAL COMMITMENTS
Capital expenditure contracted for at the reporting date but not recognised as liabilit ies are:
Capital contributions payable to VERNet Pty Ltd - 134 - 134 Buildings and Major Works 6,997 15,215 6,997 15,215
6,997 15,349 6,997 15,349 GST reclaimable on the above 636 1,383 636 1,383 Net Commitments 6,361 13,966 6,361 13,966
Net Commitments are payable as follows: Due within one year 5,660 12,589 5,660 12,589 Later than one year but not later than five years 1,337 1,377 1,337 1,377 Later than five years - - - -
6,997 13,966 6,997 13,966
(C) OTHER EXPENDITURE COMMITMENTS
Commitments in existence at the reporting date but not recognised as liabilit ies, payable:
VERNet Pty Ltd. - Operating subscriptions 408 268 408 268 408 268 408 268
Due within one year 408 268 408 268 Later than one year but not later than five years - - - - Later than five years - - - -
408 268 408 268
(D) REMUNERATION COMMITMENTS
Commitments for remuneration in existence at the reporting date but not recognised as liabilit ies, payable:
Due within one year 1,257 - 1,257 - Later than one year but not later than five years 1,147 - 1,147 - Later than five years - - - -
2,404 - 2,404 -

92 9392
NOTES TO THE FINANCIAL STATEMENTS FOR THE YEAR ENDED 31 DECEMBER 2007 – CONTINUED
22. relateD parties
(A) SUBSIDIARIES Interests in subsidiaries are set out in note 23.
(B) KEY MANAGEMENT PERSONNELDisclosures relating to responsible officers and specified executives are set out in note 18.
UNIVERSITY 2007 2006
$'000 $'000
(C) TRANSACTIONS WITH RELATED PARTIESThe following transactions occurred with related parties:Training fee income from Victoria University of Technology (Singapore) Pte Ltd 179 118 Donations paid to Victoria University Foundation 4 2 Audit fees paid on behalf of Victoria University International Pty Ltd 1 1 Audit fees paid on behalf of Victoria University Enterprises Pty Ltd 1 1
(D) OUTSTANDING BALANCESThe following balances are outstanding at the reporting date in relation to transactions with related parties:
Current:Amount receivable from Victoria University Foundation - 13 Amount payable to Victoria University Foundation 4 - Amount receivable from Victoria University of Technology (Singapore) Pte Ltd 179 143
23. subsiDiaries
The consolidated financial statements incorporate the assets, liabilit ies and results of the following subsidiaries in accordance with the accounting policy described in note 1 (B):
NAME OF ENTITYCOUNTRY OF
INCORPORATIONCLASS OF
SHARES
EQUITY HOLDING2007
%2006
%Victoria University Foundation Ltd (ACN 007 151 895) Australia Ordinary 100 100 Victoria University Foundation * Australia - 100 100 Victoria University Enterprises Pty Ltd (ACN 007 382 818) Australia Ordinary 100 100 Victoria University of Technology (Singapore) Pte Ltd Singapore Ordinary 100 100 Victoria University International Pty Ltd (ACN 079 529 089) Australia Ordinary 100 100 Victoria University - AFIC College Ltd ( ACN 117 848 284) (Deregistered on 31 August 2007) Australia - - 50
*Victoria University Foundation Ltd, a company limited by guarantee acts as trustee of the Victoria University Foundation.

92 9392
NOTES TO THE FINANCIAL STATEMENTS FOR THE YEAR ENDED 31 DECEMBER 2007 – CONTINUED
24. events occurring after the balance sheet Date
No matters or circumstances have arisen since the end of the reporting period which significantly affected or may affect the operations of the entity, the results of those operations, or the state of affairs of the company in future financial years.
25. reconciliation of operating result after income tax to net cash floWs from operating activities
CONSOLIDATED UNIVERSITY 2007 2006 2007 2006
NOTES $'000 $'000 $'000 $'000
(A) RECONCILIATION OF CASH
Cash at Beginning of Year Cash on hand 78 82 78 82 Cash at bank 5,147 8,347 5,038 8,302 Money market deposits 83,977 88,176 81,532 85,904
89,202 96,605 86,648 94,288
Cash at End of Year Cash on hand 74 78 74 78 Cash at bank 5,427 5,147 5,113 5,038 Money market deposits 80,593 83,977 76,548 81,532
6 86,094 89,202 81,735 86,648
Cash Movement for the Year (3,108) (7,403) (4,913) (7,640)
(B) RECONCILIATION OF NET CASH FROM OPERATING ACTIVITIES TO NET OPERATING RESULT
Operating result for the year 21,112 12,180 19,317 11,948
Add non cash items: Depreciation and amortisation 16,716 16,141 16,716 16,141 Net (gain) / loss on sale of non-current assets 3.6 (267) (75) (267) (73)
Changes in operating assets and liabilities: Increase/(Decrease) in Employee benefits 679 (1,753) 679 (1,753)Increase/(Decrease) in Payables (131) (4,942) (113) (4,962)(Decrease)/Increase in Revenue in advance (842) 712 (842) 712 (Increase)/Decrease in Receivables (1,045) (1,872) (1,159) (1,860)(Increase)/Decrease in Prepayments (271) (284) (271) (284)Decrease/(Increase) in Inventories (7) (244) (7) (244)
NET CASH PROVIDED BY OPERATING ACTIVITIES 35,944 19,863 34,053 19,625

94 9594
NOTES TO THE FINANCIAL STATEMENTS FOR THE YEAR ENDED 31 DECEMBER 2007 – 26. FINANCIAL RISK MANAGEMENT
26. financial risk management
The University’s financial instruments consist mainly of deposits with banks, local money market instruments, short term investments, funds under management, accounts receivables and payables and leases.
The main risks the University is exposed to through its financial instruments are market risk, credit risk, liquidity risk and cash flow and fair value interest rate risk.
(A) MARKET RISKMarket risk is the risk that the value of financial instruments fluctuating due to changes in foreign exchange rates, changes in market interest rates, and changes in market prices.
The university and its subsidiaries in their daily operations are exposed to a number of market risks. Market risks relate to the risk that market rates and prices will change and that this will have an adverse affect on the operating result and /or net worth of the group. e.g. an adverse movement in interest rates or foreign currency exchange rates.
The Council ensures that all market risk exposure is consistent with the business strategy and within the risk tolerance of the University. Regular risk reports are presented to the Council. There has been no significant change in the Group’s exposure, or its objectives, policies and processes for managing market risk or the methods used to measure this risk from the previous reporting period.
(I) FOREIGN EXCHANGE RISKThe University is exposed to fluctuations in foreign currencies arising from the delivery of services in currencies other than Australian dollars. This risk is mitigated by trade receivables being invoiced in Australian dollars. In addition foreign currency bank accounts are maintained to mitigate any foreign currency risk exposure.
(II) PRICE RISKThe University is exposed to price risk in respect of fee for service and contract services which are subject to open market competition.
The Group is also exposed to equity price risk. This arises from investments held at fair value through profit or loss. The Group’s publicly traded equity investments are quoted in the London Alternate Investment Market. The price risk for the unlisted securities is immaterial in terms of possible impact on profit or loss or total equity. It is therefore, not included in the sensitivity analysis.
(III) CASH FLOW AND FAIR VALUE INTEREST RATE RISK The Group's exposure to interest rate risk is the risk that a financial instrument's value will fluctuate as a result of changes in market interest rates.The Group is exposed to interest rate risk associated with cash management activities whereby excess funds are placed with financial institutions and are subjected to changes in the basis of prime interest rate. Management believes that the interest rate is manageable and hence, the Group does not use derivative financial instruments to mitigate this risk.
(IV) SUMMARISED SENSITIVITY ANALYSISThe following table summarises the sensitivity of the Group’s financial assets and financial liabilit ies to interest rate risk, foreign exchange risk and other price risk.
INTEREST RATE RISK FOREIGN EXCHANGE RISK OTHER PRICE RISK-1% +1% -10% +10% -10% +10%
31 DECEMBER 2007 CARRYING AMOUNT RESULT EQUITY RESULT EQUITY RESULT EQUITY RESULT EQUITY RESULT EQUITY RESULT EQUITY
$’000 $’000 $’000 $’000 $’000 $’000 $’000 $’000 $’000 $’000 $’000 $’000 $’000
Financial assetsCash and Cash Equivalents - at bank 5,501 (55) (55) 55 55 - - - - - - - - Cash and Cash Equivalents -Deposits at Call 7,045 (71) (71) 71 71 - - - - - - - - Cash and Cash Equivalents -Deposits - Other 73,548 (736) (736) 736 736 - - - - - - - - Receivables - Debtors 12,167 - - - - (6) (6) 6 6 - - - - Financial Assets - Held to maturity 9,644 (50) (50) 50 50 - - - - - - - - Financial Assets - Fair value through P&L 89 - - - - (9) (9) 9 9 (9) (9) 9 9 Other financial assets - unlisted shares 1,717 - - - - - - - - - - - - Financial Liabilit iesCreditors and payables 22,302 - - - - (18) (18) 18 18 - - - - Total increase/ (decrease) (912) (912) 912 912 (33) (33) 33 33 (9) (9) 9 9
INTEREST RATE RISK FOREIGN EXCHANGE RISK OTHER PRICE RISK-1% +1% -10% +10% -10% +10%
31 DECEMBER 2006 CARRYING AMOUNT RESULT EQUITY RESULT EQUITY RESULT EQUITY RESULT EQUITY RESULT EQUITY RESULT EQUITY$’000 $’000 $’000 $’000 $’000 $’000 $’000 $’000 $’000 $’000 $’000 $’000 $’000
Financial assetsCash and Cash Equivalents - at bank 5,225 (53) (53) 53 53 - - - - - - - - Cash and Cash Equivalents -Deposits at Call 16,445 (165) (165) 165 165 - - - - - - - - Cash and Cash Equivalents -Deposits - Other 67,532 (675) (675) 675 675 - - - - - - - - Receivables - Debtors 11,122 - - - - (15) (15) 15 15 - - - - Other financial assets - unlisted shares 1,199 - - - - - - - - - - - - Financial Liabilit iesCreditors and payables 23,281 - - - - (14) (14) 14 14 - - - - Total increase/ (decrease) (893) (893) 893 893 (29) (29) 29 29 - - - -
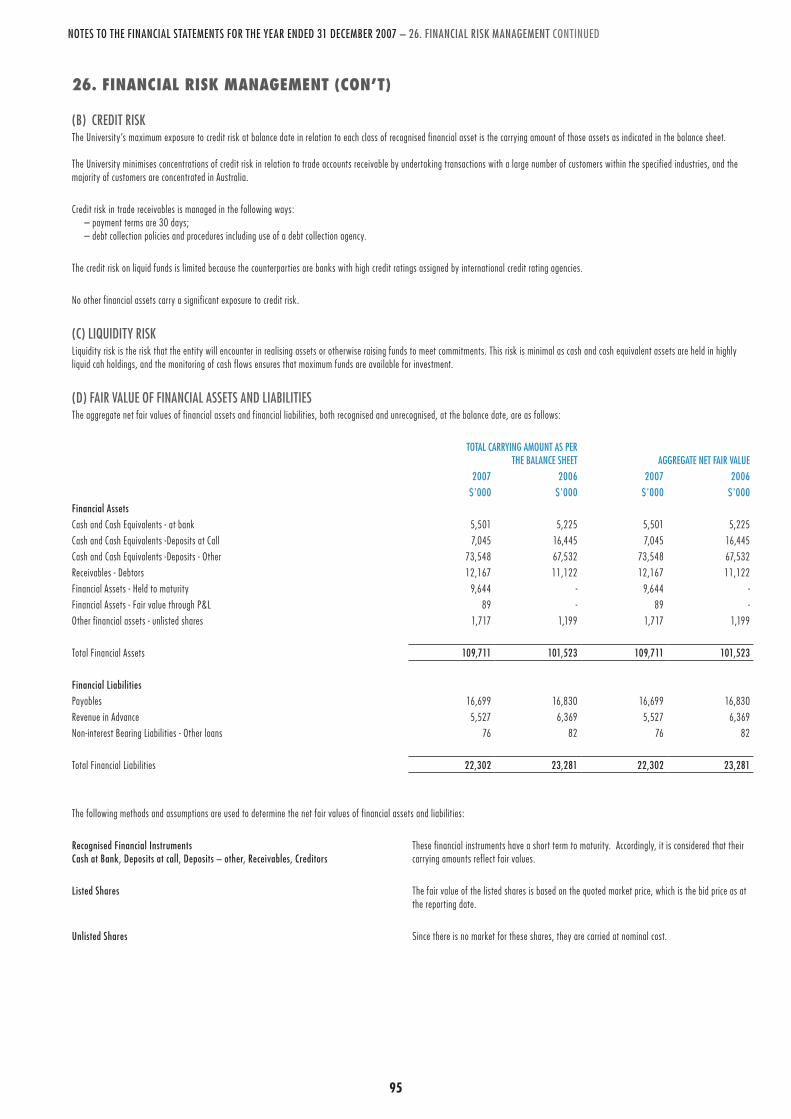
94 9594
NOTES TO THE FINANCIAL STATEMENTS FOR THE YEAR ENDED 31 DECEMBER 2007 – 26. FINANCIAL RISK MANAGEMENT CONTINUED
26. financial risk management (con’t)
(B) CREDIT RISKThe University’s maximum exposure to credit risk at balance date in relation to each class of recognised financial asset is the carrying amount of those assets as indicated in the balance sheet.
The University minimises concentrations of credit risk in relation to trade accounts receivable by undertaking transactions with a large number of customers within the specified industries, and the majority of customers are concentrated in Australia.
Credit risk in trade receivables is managed in the following ways: – payment terms are 30 days; – debt collection policies and procedures including use of a debt collection agency.
The credit risk on liquid funds is limited because the counterparties are banks with high credit ratings assigned by international credit rating agencies.
No other financial assets carry a significant exposure to credit risk.
(C) LIQUIDITY RISKLiquidity risk is the risk that the entity will encounter in realising assets or otherwise raising funds to meet commitments. This risk is minimal as cash and cash equivalent assets are held in highly liquid cah holdings, and the monitoring of cash flows ensures that maximum funds are available for investment.
(D) FAIR VALUE OF FINANCIAL ASSETS AND LIABILITIESThe aggregate net fair values of financial assets and financial liabilit ies, both recognised and unrecognised, at the balance date, are as follows:
TOTAL CARRYING AMOUNT AS PER THE BALANCE SHEET AGGREGATE NET FAIR VALUE
2007 2006 2007 2006 $'000 $'000 $'000 $'000
Financial Assets Cash and Cash Equivalents - at bank 5,501 5,225 5,501 5,225 Cash and Cash Equivalents -Deposits at Call 7,045 16,445 7,045 16,445 Cash and Cash Equivalents -Deposits - Other 73,548 67,532 73,548 67,532 Receivables - Debtors 12,167 11,122 12,167 11,122 Financial Assets - Held to maturity 9,644 - 9,644 - Financial Assets - Fair value through P&L 89 - 89 - Other financial assets - unlisted shares 1,717 1,199 1,717 1,199
Total Financial Assets 109,711 101,523 109,711 101,523
Financial Liabilities Payables 16,699 16,830 16,699 16,830 Revenue in Advance 5,527 6,369 5,527 6,369 Non-interest Bearing Liabilit ies - Other loans 76 82 76 82
Total Financial Liabilit ies 22,302 23,281 22,302 23,281
The following methods and assumptions are used to determine the net fair values of financial assets and liabilit ies:
Recognised Financial Instruments Cash at Bank, Deposits at call, Deposits – other, Receivables, Creditors
These financial instruments have a short term to maturity. Accordingly, it is considered that their carrying amounts reflect fair values.
Listed Shares The fair value of the listed shares is based on the quoted market price, which is the bid price as at the reporting date.
Unlisted Shares Since there is no market for these shares, they are carried at nominal cost.
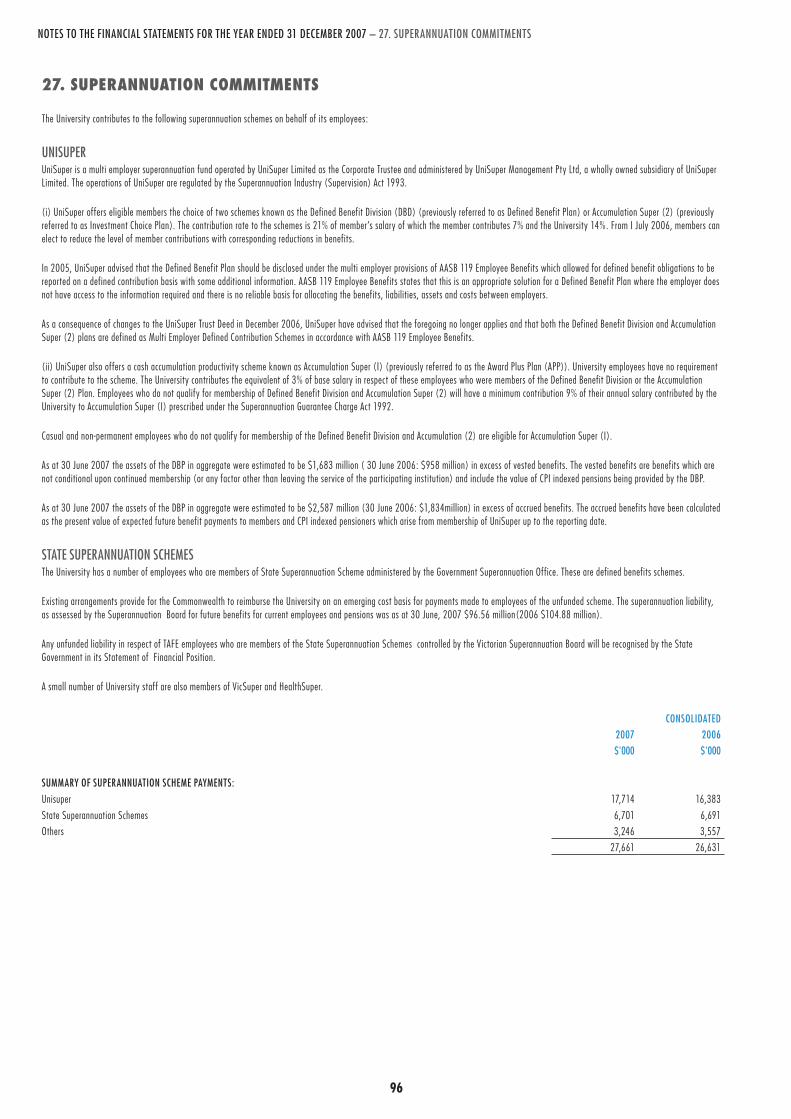
96 97
NOTES TO THE FINANCIAL STATEMENTS FOR THE YEAR ENDED 31 DECEMBER 2007 – 27. SUPERANNUATION COMMITMENTS
27. superannuation commitments
The University contributes to the following superannuation schemes on behalf of its employees:
UNISUPERUniSuper is a multi employer superannuation fund operated by UniSuper Limited as the Corporate Trustee and administered by UniSuper Management Pty Ltd, a wholly owned subsidiary of UniSuper Limited. The operations of UniSuper are regulated by the Superannuation Industry (Supervision) Act 1993.
(i) UniSuper offers eligible members the choice of two schemes known as the Defined Benefit Division (DBD) (previously referred to as Defined Benefit Plan) or Accumulation Super (2) (previously referred to as Investment Choice Plan). The contribution rate to the schemes is 21% of member’s salary of which the member contributes 7% and the University 14%. From I July 2006, members can elect to reduce the level of member contributions with corresponding reductions in benefits.
In 2005, UniSuper advised that the Defined Benefit Plan should be disclosed under the multi employer provisions of AASB 119 Employee Benefits which allowed for defined benefit obligations to be reported on a defined contribution basis with some additional information. AASB 119 Employee Benefits states that this is an appropriate solution for a Defined Benefit Plan where the employer does not have access to the information required and there is no reliable basis for allocating the benefits, liabilit ies, assets and costs between employers.
As a consequence of changes to the UniSuper Trust Deed in December 2006, UniSuper have advised that the foregoing no longer applies and that both the Defined Benefit Division and Accumulation Super (2) plans are defined as Multi Employer Defined Contribution Schemes in accordance with AASB 119 Employee Benefits.
(ii) UniSuper also offers a cash accumulation productivity scheme known as Accumulation Super (I) (previously referred to as the Award Plus Plan (APP)). University employees have no requirement to contribute to the scheme. The University contributes the equivalent of 3% of base salary in respect of these employees who were members of the Defined Benefit Division or the Accumulation Super (2) Plan. Employees who do not qualify for membership of Defined Benefit Division and Accumulation Super (2) will have a minimum contribution 9% of their annual salary contributed by the University to Accumulation Super (I) prescribed under the Superannuation Guarantee Charge Act 1992.
Casual and non-permanent employees who do not qualify for membership of the Defined Benefit Division and Accumulation (2) are eligible for Accumulation Super (I).
As at 30 June 2007 the assets of the DBP in aggregate were estimated to be $1,683 million ( 30 June 2006: $958 million) in excess of vested benefits. The vested benefits are benefits which are not conditional upon continued membership (or any factor other than leaving the service of the participating institution) and include the value of CPI indexed pensions being provided by the DBP.
As at 30 June 2007 the assets of the DBP in aggregate were estimated to be $2,587 million (30 June 2006: $1,834million) in excess of accrued benefits. The accrued benefits have been calculated as the present value of expected future benefit payments to members and CPI indexed pensioners which arise from membership of UniSuper up to the reporting date.
STATE SUPERANNUATION SCHEMESThe University has a number of employees who are members of State Superannuation Scheme administered by the Government Superannuation Office. These are defined benefits schemes.
Existing arrangements provide for the Commonwealth to reimburse the University on an emerging cost basis for payments made to employees of the unfunded scheme. The superannuation liability, as assessed by the Superannuation Board for future benefits for current employees and pensions was as at 30 June, 2007 $96.56 million(2006 $104.88 million). Any unfunded liability in respect of TAFE employees who are members of the State Superannuation Schemes controlled by the Victorian Superannuation Board will be recognised by the State Government in its Statement of Financial Position.
A small number of University staff are also members of VicSuper and HealthSuper.
CONSOLIDATED 2007 2006
$'000 $'000
SUMMARY OF SUPERANNUATION SCHEME PAYMENTS:Unisuper 17,714 16,383 State Superannuation Schemes 6,701 6,691 Others 3,246 3,557
27,661 26,631
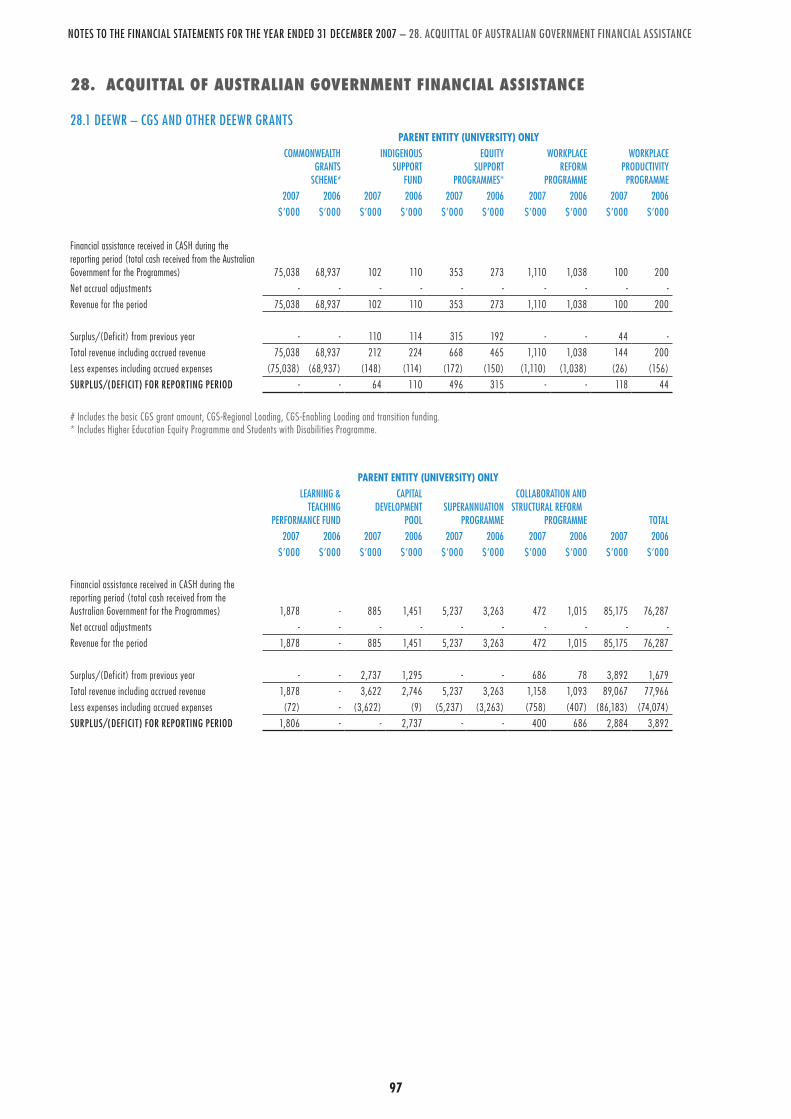
96 97
NOTES TO THE FINANCIAL STATEMENTS FOR THE YEAR ENDED 31 DECEMBER 2007 – 28. ACQUITTAL OF AUSTRALIAN GOVERNMENT FINANCIAL ASSISTANCE
28. acquittal of australian government financial assistance
28.1 DEEWR – CGS AND OTHER DEEWR GRANTS pArENT ENTiTy (UNivErSiTy) oNly
COMMONWEALTH GRANTS SCHEME #
INDIGENOUS SUPPORT
FUND
EQUITY SUPPORT
PROGRAMMES*
WORKPLACE REFORM
PROGRAMME
WORKPLACE PRODUCTIVITY
PROGRAMME 2007 2006 2007 2006 2007 2006 2007 2006 2007 2006
$’000 $’000 $’000 $’000 $’000 $’000 $’000 $’000 $’000 $’000
Financial assistance received in CASH during the reporting period (total cash received from the Australian Government for the Programmes) 75,038 68,937 102 110 353 273 1,110 1,038 100 200 Net accrual adjustments - - - - - - - - - - Revenue for the period 75,038 68,937 102 110 353 273 1,110 1,038 100 200
Surplus/(Deficit) from previous year - - 110 114 315 192 - - 44 - Total revenue including accrued revenue 75,038 68,937 212 224 668 465 1,110 1,038 144 200 Less expenses including accrued expenses (75,038) (68,937) (148) (114) (172) (150) (1,110) (1,038) (26) (156)SURPLUS/(DEFICIT) FOR REPORTING PERIOD - - 64 110 496 315 - - 118 44
# Includes the basic CGS grant amount, CGS-Regional Loading, CGS-Enabling Loading and transition funding.* Includes Higher Education Equity Programme and Students with Disabilit ies Programme.
pArENT ENTiTy (UNivErSiTy) oNlyLEARNING &
TEACHING PERFORMANCE FUND
CAPITAL DEVELOPMENT
POOL SUPERANNUATION
PROGRAMME
COLLABORATION AND STRUCTURAL REFORM
PROGRAMME TOTAL2007 2006 2007 2006 2007 2006 2007 2006 2007 2006
$’000 $’000 $’000 $’000 $’000 $’000 $’000 $’000 $’000 $’000
Financial assistance received in CASH during the reporting period (total cash received from the Australian Government for the Programmes) 1,878 - 885 1,451 5,237 3,263 472 1,015 85,175 76,287 Net accrual adjustments - - - - - - - - - - Revenue for the period 1,878 - 885 1,451 5,237 3,263 472 1,015 85,175 76,287
Surplus/(Deficit) from previous year - - 2,737 1,295 - - 686 78 3,892 1,679 Total revenue including accrued revenue 1,878 - 3,622 2,746 5,237 3,263 1,158 1,093 89,067 77,966 Less expenses including accrued expenses (72) - (3,622) (9) (5,237) (3,263) (758) (407) (86,183) (74,074)SURPLUS/(DEFICIT) FOR REPORTING PERIOD 1,806 - - 2,737 - - 400 686 2,884 3,892
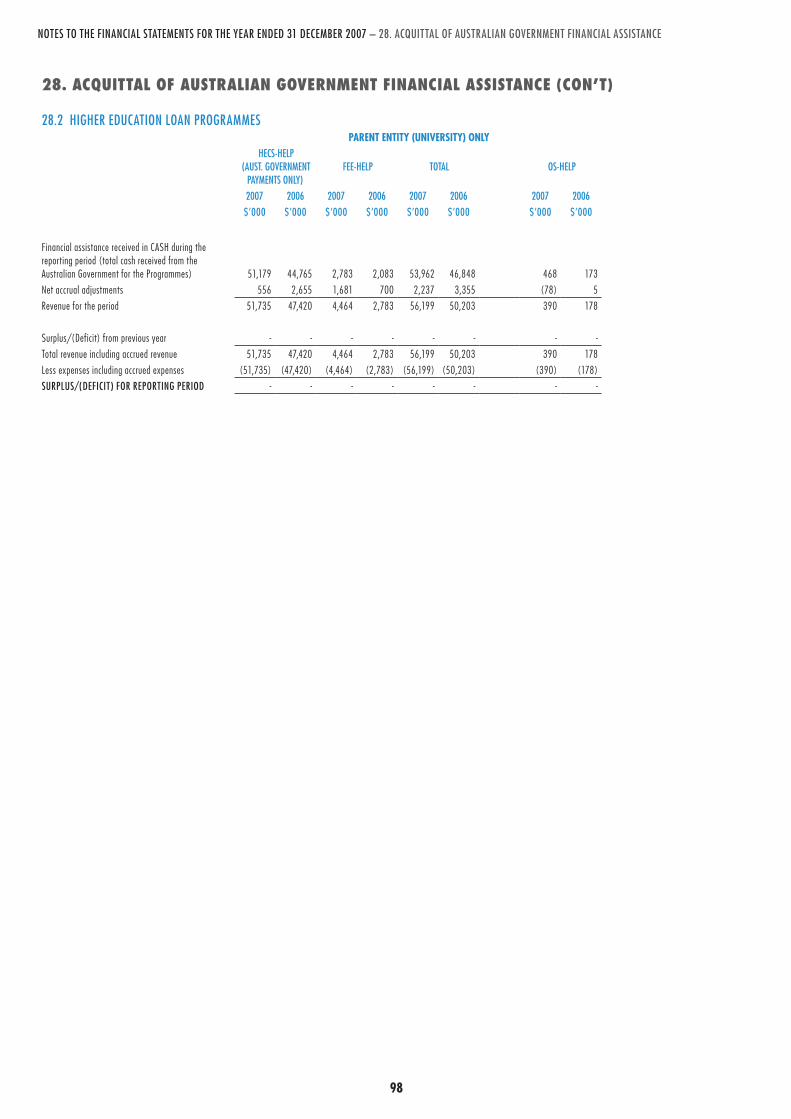
98 99
NOTES TO THE FINANCIAL STATEMENTS FOR THE YEAR ENDED 31 DECEMBER 2007 – 28. ACQUITTAL OF AUSTRALIAN GOVERNMENT FINANCIAL ASSISTANCE
28. acquittal of australian government financial assistance (con’t)
28.2 HIGHER EDUCATION LOAN PROGRAMMES pArENT ENTiTy (UNivErSiTy) oNly
HECS-HELP (AUST. GOVERNMENT
PAYMENTS ONLY) FEE-HELP TOTAL OS-HELP
2007 2006 2007 2006 2007 2006 2007 2006$’000 $’000 $’000 $’000 $’000 $’000 $’000 $’000
Financial assistance received in CASH during the reporting period (total cash received from the Australian Government for the Programmes) 51,179 44,765 2,783 2,083 53,962 46,848 468 173 Net accrual adjustments 556 2,655 1,681 700 2,237 3,355 (78) 5 Revenue for the period 51,735 47,420 4,464 2,783 56,199 50,203 390 178
Surplus/(Deficit) from previous year - - - - - - - - Total revenue including accrued revenue 51,735 47,420 4,464 2,783 56,199 50,203 390 178 Less expenses including accrued expenses (51,735) (47,420) (4,464) (2,783) (56,199) (50,203) (390) (178)SURPLUS/(DEFICIT) FOR REPORTING PERIOD - - - - - - - -

98 99
NOTES TO THE FINANCIAL STATEMENTS FOR THE YEAR ENDED 31 DECEMBER 2007 – 28. ACQUITTAL OF AUSTRALIAN GOVERNMENT FINANCIAL ASSISTANCE CONTINUED
28. acquittal of australian government financial assistance (con’t)
28.3 SCHOLARSHIPS pArENT ENTiTy (UNivErSiTy) oNly
AUSTRALIAN POSTGRADUATE
AWARDS
INTERNATIONAL POSTGRADUATE
RESEARCH SCHOLARSHIPS
COMMONWEALTH EDUCATION COST
SCHOLARSHIPS
COMMONWEALTH ACCOMMODATION
SCHOLARSHIPS TOTAL2007 2006 2007 2006 2007 2006 2007 2006 2007 2006
$’000 $’000 $’000 $’000 $’000 $’000 $’000 $’000 $’000 $’000
Financial assistance received in CASH during the reporting period (total cash received from the Australian Government for the Programmes) 859 813 234 42 945 676 1,090 911 3,128 2,442 Net accrual adjustments - - - - - - - - - - Revenue for the period 859 813 234 42 945 676 1,090 911 3,128 2,442
Surplus/(Deficit) from previous year 122 68 (174) (60) 70 16 119 90 137 114 Total revenue including accrued revenue 981 881 60 (18) 1,015 692 1,209 1,001 3,265 2,556 Less expenses including accrued expenses (843) (759) (170) (156) (988) (622) (1,086) (882) (3,087) (2,419)SURPLUS/(DEFICIT) FOR REPORTING PERIOD 138 122 (110) (174) 27 70 123 119 178 137
28.4 DEEWR RESEARCH pArENT ENTiTy (UNivErSiTy) oNly
INSTITUTIONAL GRANTS SCHEME
RESEARCH TRAINING SCHEME
RESEARCH INFRASTRUCTURE
BLOCK GRANTS
IMPLEMENTATION ASSISTANCE
PROGRAMME
AUSTRALIAN SCHEME FOR
HIGHER EDUCATION REPOSITORIES
COMMERCIALISAT’N TRAINING SCHEME TOTAL
2007 2006 2007 2006 2007 2006 2007 2006 2007 2006 2007 2006 2007 2006$’000 $’000 $’000 $’000 $’000 $’000 $’000 $’000 $’000 $’000 $’000 $’000 $’000 $’000
Financial assistance received in CASH during the reporting period (total cash received from the Australian Government for the Programmes) 1,976 2,039 5,230 5,238 745 827 47 - 102 - 50 - 8,150 8,104 Net accrual adjustments - - - - - - - - - - - - - - Revenue for the period 1,976 2,039 5,230 5,238 745 827 47 - 102 - 50 - 8,150 8,104
Surplus/(Deficit) from previous year - 71 - - - - - - - - - - - 71 Total revenue including accrued revenue 1,976 2,110 5,230 5,238 745 827 47 - 102 - 50 - 8,150 8,175 Less expenses including accrued expenses (1,423) (2,110) (5,230) (5,238) (745) (827) (47) - (111) - - - (7,556) (8,175)SURPLUS/(DEFICIT) FOR REPORTING PERIOD 553 - - - - - - - (9) - 50 - 594 -
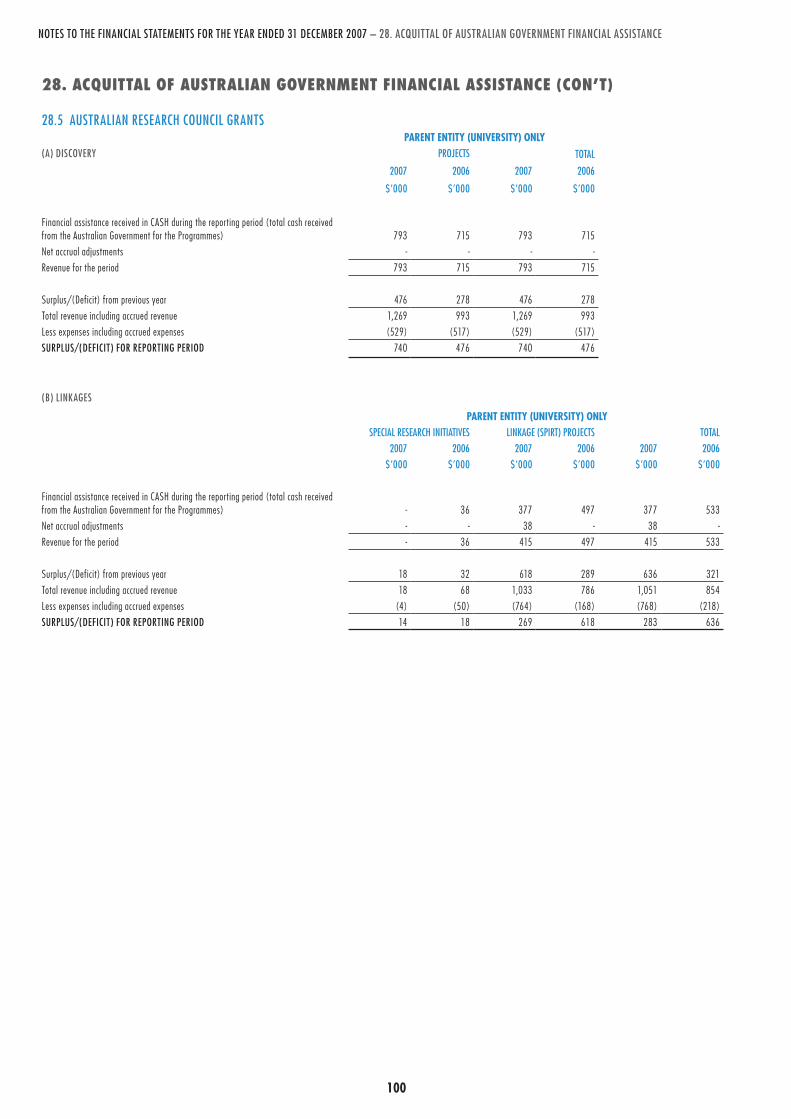
100 101
NOTES TO THE FINANCIAL STATEMENTS FOR THE YEAR ENDED 31 DECEMBER 2007 – 28. ACQUITTAL OF AUSTRALIAN GOVERNMENT FINANCIAL ASSISTANCE
28. acquittal of australian government financial assistance (con’t)
28.5 AUSTRALIAN RESEARCH COUNCIL GRANTS pArENT ENTiTy (UNivErSiTy) oNly
(A) DISCOVERY PROJECTS TOTAL
2007 2006 2007 2006
$’000 $’000 $’000 $’000
Financial assistance received in CASH during the reporting period (total cash received from the Australian Government for the Programmes) 793 715 793 715 Net accrual adjustments - - - - Revenue for the period 793 715 793 715
Surplus/(Deficit) from previous year 476 278 476 278 Total revenue including accrued revenue 1,269 993 1,269 993 Less expenses including accrued expenses (529) (517) (529) (517)SURPLUS/(DEFICIT) FOR REPORTING PERIOD 740 476 740 476
(B) LINKAGES
pArENT ENTiTy (UNivErSiTy) oNlySPECIAL RESEARCH INITIATIVES LINKAGE (SPIRT) PROJECTS TOTAL
2007 2006 2007 2006 2007 2006$’000 $’000 $’000 $’000 $’000 $’000
Financial assistance received in CASH during the reporting period (total cash received from the Australian Government for the Programmes) - 36 377 497 377 533 Net accrual adjustments - - 38 - 38 - Revenue for the period - 36 415 497 415 533
Surplus/(Deficit) from previous year 18 32 618 289 636 321 Total revenue including accrued revenue 18 68 1,033 786 1,051 854 Less expenses including accrued expenses (4) (50) (764) (168) (768) (218)SURPLUS/(DEFICIT) FOR REPORTING PERIOD 14 18 269 618 283 636
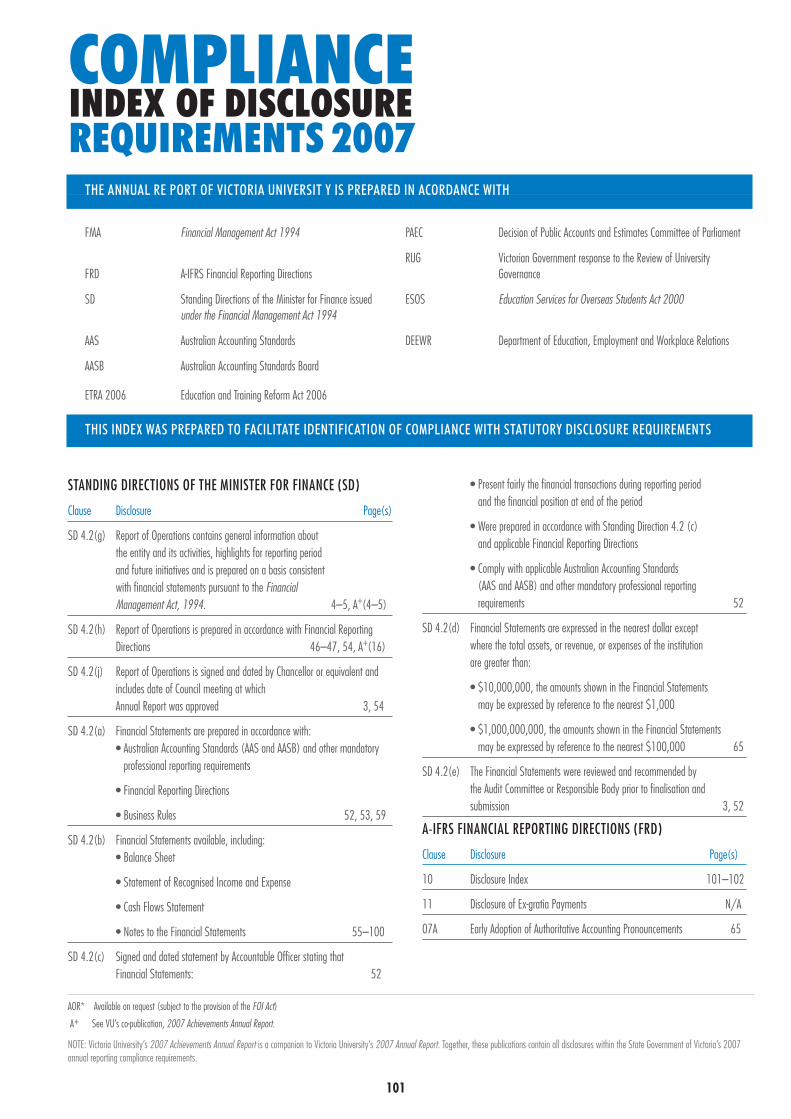
100 101
STANDING DIRECTIONS OF THE MINISTER FOR FINANCE (SD)
Clause Disclosure Page(s)
SD 4.2(g) Report of Operations contains general information about the entity and its activities, highlights for reporting period and future initiatives and is prepared on a basis consistent with financial statements pursuant to the Financial Management Act, 1994. 4–5, A+(4–5)
SD 4.2(h) Report of Operations is prepared in accordance with Financial Reporting Directions 46–47, 54, A+(16)
SD 4.2(j) Report of Operations is signed and dated by Chancellor or equivalent and includes date of Council meeting at which Annual Report was approved 3, 54
SD 4.2(a) Financial Statements are prepared in accordance with: • Australian Accounting Standards (AAS and AASB) and other mandatory
professional reporting requirements
• Financial Reporting Directions
• Business Rules 52, 53, 59
SD 4.2(b) Financial Statements available, including: • Balance Sheet
• Statement of Recognised Income and Expense
• Cash Flows Statement
• Notes to the Financial Statements 55–100
SD 4.2(c) Signed and dated statement by Accountable Officer stating that Financial Statements: 52
• Present fairly the financial transactions during reporting period and the financial position at end of the period
• Were prepared in accordance with Standing Direction 4.2 (c) and applicable Financial Reporting Directions
• Comply with applicable Australian Accounting Standards (AAS and AASB) and other mandatory professional reporting requirements 52
SD 4.2(d) Financial Statements are expressed in the nearest dollar except where the total assets, or revenue, or expenses of the institution are greater than:
• $10,000,000, the amounts shown in the Financial Statements may be expressed by reference to the nearest $1,000
• $1,000,000,000, the amounts shown in the Financial Statements may be expressed by reference to the nearest $100,000 65
SD 4.2(e) The Financial Statements were reviewed and recommended by the Audit Committee or Responsible Body prior to finalisation and submission 3, 52
A-IFRS FINANCIAL REPORTING DIRECTIONS (FRD)
Clause Disclosure Page(s)
10 Disclosure Index 101–102
11 Disclosure of Ex-gratia Payments N/A
07A Early Adoption of Authoritative Accounting Pronouncements 65
comPlianceindeX oF disclosurereQuirements 2007
THE ANNUAL RE PORT OF VICTORIA UNIVERSIT Y IS PREPARED IN ACORDANCE wITH
fma Financial Management Act 1994 PAEC Decision of Public Accounts and Estimates Committee of Parliament
RUG Victorian Government response to the Review of University FRD A-IFRS Financial Reporting Directions Governance
SD Standing Directions of the Minister for Finance issued ESOS Education Services for Overseas Students Act 2000 under the Financial Management Act 1994
AAS Australian Accounting Standards DEEWR Department of Education, Employment and Workplace Relations
AASB Australian Accounting Standards Board
ETRA 2006 Education and Training Reform Act 2006
THIS INDEX wAS PREPARED TO FACILITATE IDENTIFICATION OF COMPLIANCE wITH STATUTORY DISCLOSURE REQUIREMENTS
AOR* Available on request (subject to the provision of the FOI Act)
a+ See VU’s co-publication, 2007 Achievements Annual Report.
NOTE: Victoria University’s 2007 Achievements Annual Report is a companion to Victoria University’s 2007 Annual Report. Together, these publications contain all disclosures within the State Government of Victoria’s 2007 annual reporting compliance requirements.
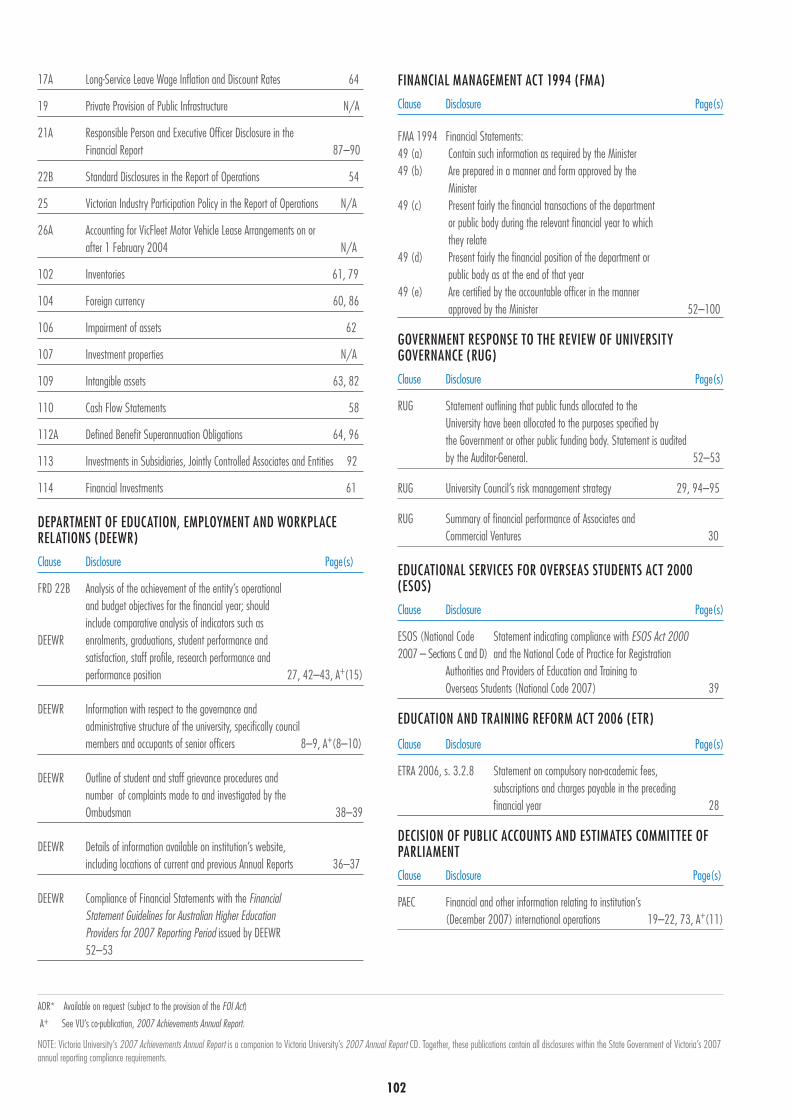
102
AOR* Available on request (subject to the provision of the FOI Act)
a+ See VU’s co-publication, 2007 Achievements Annual Report.
NOTE: Victoria University’s 2007 Achievements Annual Report is a companion to Victoria University’s 2007 Annual Report Cd. Together, these publications contain all disclosures within the State Government of Victoria’s 2007 annual reporting compliance requirements.
17A Long-Service Leave Wage Inflation and Discount Rates 64
19 Private Provision of Public Infrastructure N/A
21A Responsible Person and Executive Officer Disclosure in the Financial Report 87–90
22B Standard Disclosures in the Report of Operations 54
25 Victorian Industry Participation Policy in the Report of Operations N/A
26A Accounting for VicFleet Motor Vehicle Lease Arrangements on or after 1 February 2004 N/A
102 Inventories 61, 79
104 Foreign currency 60, 86
106 Impairment of assets 62
107 Investment properties N/A
109 Intangible assets 63, 82
110 Cash Flow Statements 58
112A Defined Benefit Superannuation Obligations 64, 96
113 Investments in Subsidiaries, Jointly Controlled Associates and Entities 92
114 Financial Investments 61
DEPARTMENT OF EDUCATION, EMPLOYMENT AND WORKPLACE RELATIONS (DEEWR)
Clause Disclosure Page(s)
FRD 22B Analysis of the achievement of the entity’s operational and budget objectives for the financial year; should include comparative analysis of indicators such as DEEWR enrolments, graduations, student performance and satisfaction, staff profile, research performance and performance position 27, 42–43, A+(15)
DEEWR Information with respect to the governance and administrative structure of the university, specifically council members and occupants of senior officers 8–9, A+(8–10)
DEEWR Outline of student and staff grievance procedures and number of complaints made to and investigated by the Ombudsman 38–39
DEEWR Details of information available on institution’s website, including locations of current and previous Annual Reports 36–37
DEEWR Compliance of Financial Statements with the Financial Statement Guidelines for Australian Higher Education Providers for 2007 Reporting Period issued by DEEWR 52–53
FINANCIAL MANAGEMENT ACT 1994 (FMA)
Clause Disclosure Page(s)
FMA 1994 Financial Statements:49 (a) Contain such information as required by the Minister49 (b) Are prepared in a manner and form approved by the
Minister49 (c) Present fairly the financial transactions of the department
or public body during the relevant financial year to which they relate
49 (d) Present fairly the financial position of the department or public body as at the end of that year
49 (e) Are certified by the accountable officer in the manner approved by the Minister 52–100
GOVERNMENT RESPONSE TO THE REVIEW OF UNIVERSITY GOVERNANCE (RUG)
Clause Disclosure Page(s)
RUG Statement outlining that public funds allocated to the University have been allocated to the purposes specified by the Government or other public funding body. Statement is audited by the Auditor-General. 52–53
RUG University Council’s risk management strategy 29, 94–95
RUG Summary of financial performance of Associates and Commercial Ventures 30
EDUCATIONAL SERVICES FOR OVERSEAS STUDENTS ACT 2000 (ESOS)
Clause Disclosure Page(s)
ESOS (National Code Statement indicating compliance with ESOS Act 2000 2007 – Sections C and D) and the National Code of Practice for Registration Authorities and Providers of Education and Training to Overseas Students (National Code 2007) 39
EDUCATION AND TRAINING REFORM ACT 2006 (ETR)
Clause Disclosure Page(s)
ETRA 2006, s. 3.2.8 Statement on compulsory non-academic fees, subscriptions and charges payable in the preceding financial year 28
DECISION OF PUBLIC ACCOUNTS AND ESTIMATES COMMITTEE OF PARLIAMENT
Clause Disclosure Page(s)
paeC Financial and other information relating to institution’s (December 2007) international operations 19–22, 73, A+(11)

102
this page has been intentionaLLy Left bLanK


WWW.VU.EDU.AUCRICOS Provider No. 00124K
Top Related