


Languages
Pages
Legal


2006 Profile of Home Buyers and Sellers Texas Report
Prepared for: Texas Association of REALTORS® Prepared by: NATIONAL ASSOCIATION OF REALTORS® Research Division December 2006

2006 Profile of Home Buyers and Sellers Texas Report
Table of Contents Introduction ................................................................................................................................................... 2
Highlights ....................................................................................................................................................... 4
Conclusion..................................................................................................................................................... 6
Appendix: Selected Exhibits........................................................................................................................ 7
Report Compiled by: Paul C. Bishop, Ph.D. Harika Bickicioglu
202-383-1246 202-383-1155
2006 Profile of Home Buyers and Sellers 1 NATIONAL ASSOCIATION OF REALTORS®

2006 Profile of Home Buyers and Sellers Texas Report
Introduction Home buyers and sellers rely on real estate professionals to assist them in many aspects of the home sales transaction. From the initial search to the closing, real estate agents and brokers help guide home buyers through the many steps that culminate in a successful home purchase. Real estate professionals also help home sellers by developing a marketing plan, pricing the home competitively and utilizing their experience to assist sellers through each step of the process. The NATIONAL ASSOCIATION OF REALTORS® surveys home buyers and sellers annually to gather detailed information on the home buying and selling process. These surveys provide information on demographics, housing characteristics and the experience of buyers and sellers in the housing market. Buyers and sellers also share information on the role of real estate professionals in home sales transactions. The 2006 Profile of Home Buyers and Sellers describes the critical role that real estate professionals play in the real estate market. Buyers report that they depend on agents and brokers to help them find the right home and guide them through the process of completing the purchase. Sellers note that real estate professionals are key to marketing their home and negotiating the best price, contingencies, transaction date and other important elements. This report, drawn from the national survey, provides REALTORS® in Texas with insights into the characteristics and needs of their clients. It also helps REALTORS® to improve their client service. Others benefit from the findings of this research by better understanding the housing market and how the unique role of real estate professionals continues to be important as the housing market evolves. THE NATIONAL HOUSING ENVIRONMENT After more than a decade of setting one sales record after another, the housing market entered a period of somewhat lower sales and less robust price gains in late 2005 and early 2006. Existing-home sales peaked at over 7.2 million units in the second half of 2005 but declined steadily through the first half of 2006. At the same time, the inventory of homes for sale rose bringing with it a softening of home prices. Reasons for the readjustment in the housing market are obvious: homes in many areas of the country became too pricey, affordability suffered and the home buying public lost confidence. Households and investors moved to the sidelines with many waiting to get back into the real estate market when property prices retreat to more suitable levels. As the housing market eases from the frenzied pace of the past few years, home buyers, and especially first-time buyers, will benefit. They will have a greater selection of homes to choose from while reducing the odds that they will be priced out of the market due to rapidly escalating prices. Although mortgage rates have risen modestly from their recent lows, few analysts are predicting a sharp uptick in rates in the near-term. Looking beyond to the intermediate term, the fundamentals for the housing market remain solid. The U.S. Census Bureau projects that more than one million new households will be formed
2006 Profile of Home Buyers and Sellers 2 NATIONAL ASSOCIATION OF REALTORS®

annually over the next several years. This pace of household formation is similar to the growth rate during the past decade. Most of this increase will stem from the natural formation of new households as children leave home. But some of this increase will also be attributable to population gains from immigration. Homeownership of non-native-born households meets and exceeds that of native-born households after about 25 years. With the strong flow of legal immigrants to the United States over the past 30 years, the gains in homeownership from this segment should continue. In addition to the demand for housing based on increases in population, the aging of the U.S. population is also an important factor. The homeownership rate approaches 80 percent for households in their 60s and peaks at nearly 83 percent for households in their early 70s. Baby boomers, now just reaching age 60, will continue to purchase homes. Most will purchase a primary residence, but a significant share will also purchase a vacation home or investment property in the years ahead. NOTES In August 2006, the NATIONAL ASSOCIATION OF REALTORS® mailed an eight-page questionnaire to 129,500 consumers who bought a home between July 2005 and June 2006. The survey yielded 7,548 usable responses with a response rate, after adjusting for undeliverable addresses, of 6.3 percent. There were 627 unweighted responses from Texas, yielding a response rate of 6.0 percent, which form the basis for this report. Consumer names and addresses were obtained from Experian, a firm that maintains an extensive database of recent home buyers derived from county records. Information about sellers comes from those buyers who also sold a home. All information in this Profile is characteristic of the 12-month period ending June 2006, with the exception of income data, which was reported for 2005. In some sections comparisons are also given for results obtained in previous surveys. Not all results are directly comparable due to changes in questionnaire design and sample size. Some results are presented for the four Census regions: Northeast, Midwest, South and West. The median is the primary statistical measure used throughout this report. Due to rounding and omissions for space, percentage distributions may not add to 100 percent.
2006 Profile of Home Buyers and Sellers NATIONAL ASSOCIATION OF REALTORS®
3
2006 Profile of Home Buyers and Sellers Texas Report
Highlights When buying or selling a home, today’s real estate consumers have more choices than ever. For home buyers there are numerous ways to search for and find a home, a broad array of mortgage products with which they can finance their home and a growing list of services that their agent can provide to assist them in the process. Home sellers can choose to sell their home themselves or enlist the professional assistance of an agent who can provide various levels of service to best suit each home seller’s needs. Because the real estate market is always evolving, it is important for real estate professionals to have a clear picture of today’s home buyers and sellers. The 2006 Profile of Home Buyers and Sellers describes the characteristics and motivations of recent home buyers and sellers in Texas and in so doing helps real estate professionals track the changing demands of consumers in a dynamic market. CHARACTERISTICS OF HOME BUYERS
• The median age of home buyers was 41 years old. Among first-time buyers, the median age was 33.
• The median household income of home buyers was $75,000 compared to $71,800 in the U.S. • 56 percent of home buyers reported that there were no children under age 18 residing in
the home. • 68 percent of home buyers were married couples, 20 percent single females, 5 percent
single males, and 5 percent were unmarried couples. • First-time home buyers accounted for 35 percent of homes purchased in 2006. • 53 percent of first-time home buyers were between 25 and 34 years old. • The median income of first-time home buyers was $62,700 compared to $58,300 among
all first-time buyers nationally. CHARACTERISTICS OF HOMES PURCHASED
• 86 percent of homes purchased were detached single family homes. • The typical home buyer purchased a home 18 miles from their previous residence. • The median price of homes purchased was $156,000 compared to $214,000 in the U.S. • The typical buyer purchased a home that was 2,089 square feet in size. • Recent home buyers plan to live in their home a median of 8 years.
THE HOME SEARCH PROCESS
• Recent home buyers searched for a home for a median 8 weeks and saw a median 11 homes.
• 87 percent of home buyers used a real estate professional during their home search. • 62 percent of home buyers used the Internet frequently to search for homes. • Among home buyers, the typical Internet searcher was 39 years old and visited a median
12 homes. The typical home buyer that did not use the Internet to search for homes was 49 years old and saw a median 8 homes.
• 30 percent of home buyers first learned about the home they purchased from a real estate professional; 25 percent first learned about the home they purchased through the Internet.
• 75 percent of buyers viewed the Internet as a very useful tool in their home search. • 69 percent of buyers rated real estate agents as a very useful information source with an
additional 21 percent rating them somewhat useful.
2006 Profile of Home Buyers and Sellers NATIONAL ASSOCIATION OF REALTORS®
4

HOME BUYING AND REAL ESTATE PROFESSIONALS • 79 percent of home buyers purchased their home through a real estate agent. • Buyers searched for a median of 3 weeks on their own before contacting an agent. • 60 percent of first-time buyers were referred to their agent by a friend, neighbor or relative. • 98 percent of buyers ranked honesty and integrity as a “very important” factor when
choosing a real estate professional to assist with a home purchase. • When asked about their agent’s performance on those qualities considered important,
79 percent reported they were “very satisfied” with the honesty and integrity of their agent.
• 62 percent of recent buyers will definitely use their agent again, and an additional 20 percent will probably use the agent again or recommend to others.
FINANCING THE HOME PURCHASE
• 99 percent of home buyers financed their home purchase; 100 percent of first-time home buyers financed the purchase of their home compared to 98 percent of repeat buyers.
• Savings were the chief source of the downpayment for most first-time home buyers (81 percent).
• 57 percent of repeat buyers used proceeds from the sale of their primary residence toward the downpayment; 49 percent relied on savings for a portion of the downpayment.
• 48 percent of all buyers believe that their home purchase is a better financial investment than stocks.
HOME SELLERS AND THEIR SELLING EXPERIENCE
• The median age of home sellers was 46 years; they had a median household income of $89,500.
• 73 percent of home sellers were married and 49 percent had no children under 18 years old living at home.
• The typical home seller owned their home for 5 years. • The typical home was on the market for 6 weeks. 54 percent of home sellers did not
reduce their asking price before their home sold. • 86 percent of sellers used an agent or broker to sell their home. • 67 percent of all sellers were very satisfied with the selling process.
HOME SELLERS AND REAL ESTATE PROFESSIONAL
• 72 percent of sellers contacted only one agent before selecting one to help assist in the sale of their home.
• When selecting a real estate professional, 45 percent of sellers received a recommendation from a friend, neighbor or relative.
• 41 percent of sellers used the same agent for their home purchase. • 87 percent of sellers used the Internet to market their home. • 77 percent of sellers used an agent that provided a broad range of services and
managed most aspects of the sales transaction. • 63 percent of sellers reported they would definitely use the same real estate agent again.
FOR SALE BY OWNER SELLERS (FSBO)
• 9 percent of sellers sold their home without the assistance of an agent compared with 12 percent of sellers nationally. Among all sellers, 6 percent were FSBO sellers who knew the buyer.
• 99 percent of FSBO sellers sold a detached single-family home. • The median selling price of FSBO homes was $205,000 compared with $165,000 for agent-
assisted home sales.
2006 Profile of Home Buyers and Sellers NATIONAL ASSOCIATION OF REALTORS®
5

2006 Profile of Home Buyers and Sellers Texas Report
Conclusion Even as the housing market retreats from the frenzied pace of the past several years, home buying and selling remains an important segment of the national and local economies. Buyers and sellers continue to have opportunities to trade up, trade down, relocate or purchase a second home. As importantly, first-time buyers, accounting for 40 percent of the market, are discovering and capturing the benefits of homeownership. The robust housing market of the past several years has supported the national economy with record sales activity and healthy price appreciation that has added trillions of dollars to the aggregate wealth of the nation’s homeowners. As importantly, millions of households have become homeowners for the first time and can secure the financial and personal benefits that homeownership offers. Consumers rely on the experience and expertise of real estate professionals to assist when buying and selling a home. Working in an extremely competitive environment, agents and brokers provide high levels of service to meet the varied needs of home buyers and sellers. The value that consumers place on the services offered by real estate professionals is reflected in the large majority of both buyers and sellers who would use their agents again or recommend them to others. The 2006 Profile of Home Buyers and Sellers allows real estate professionals to better understand their clients and how their needs are evolving over time. For example, survey results show that typical Texas buyers had a slightly higher income and were the same age with buyers nationwide. Buyers were more likely to purchase a detached single family home, and more likely to purchase a home located in the suburbs compared with other buyers nationwide. Information in this report will assist REALTORS® as they strive to meet the varied needs of their clients while offering superior service to America’s home buyers and sellers.
2006 Profile of Home Buyers and Sellers NATIONAL ASSOCIATION OF REALTORS®
6

2006 Profile of Home Buyers and Sellers NATIONAL ASSOCIATION OF REALTORS®
7
2006 Profile of Home Buyers and Sellers Texas Report
Appendix: Selected Exhibits Age of First-time and Repeat Buyers ......................................................................................................... 1
Household income of First-time and Repeat Buyers ............................................................................... 2
First-time Buyers ............................................................................................................................................. 3
Price of Home Purchased, First-time and Repeat Buyers....................................................................... 4
Use of Internet to Search for Homes.......................................................................................................... 5
Length of Search, by Use of Internet ......................................................................................................... 6
Where Buyer Found the Home They Purchased...................................................................................... 7
Method of Home Purchase, by Use of Internet ....................................................................................... 8
Method Used to Sell Home, by Seller Urgency ........................................................................................ 9
Sales Price Compared to Listing Price, by Seller Urgency.................................................................... 10
Number of Weeks Recently Sold Home was on the Market................................................................ 11
Would Seller Use Real Estate Agent Again or Recommend to Others .............................................. 12
Note: A complete set of Exhibits along with comparable national survey results
are available in the full data report.
CHARACTERISTICS OF HOME BUYERS
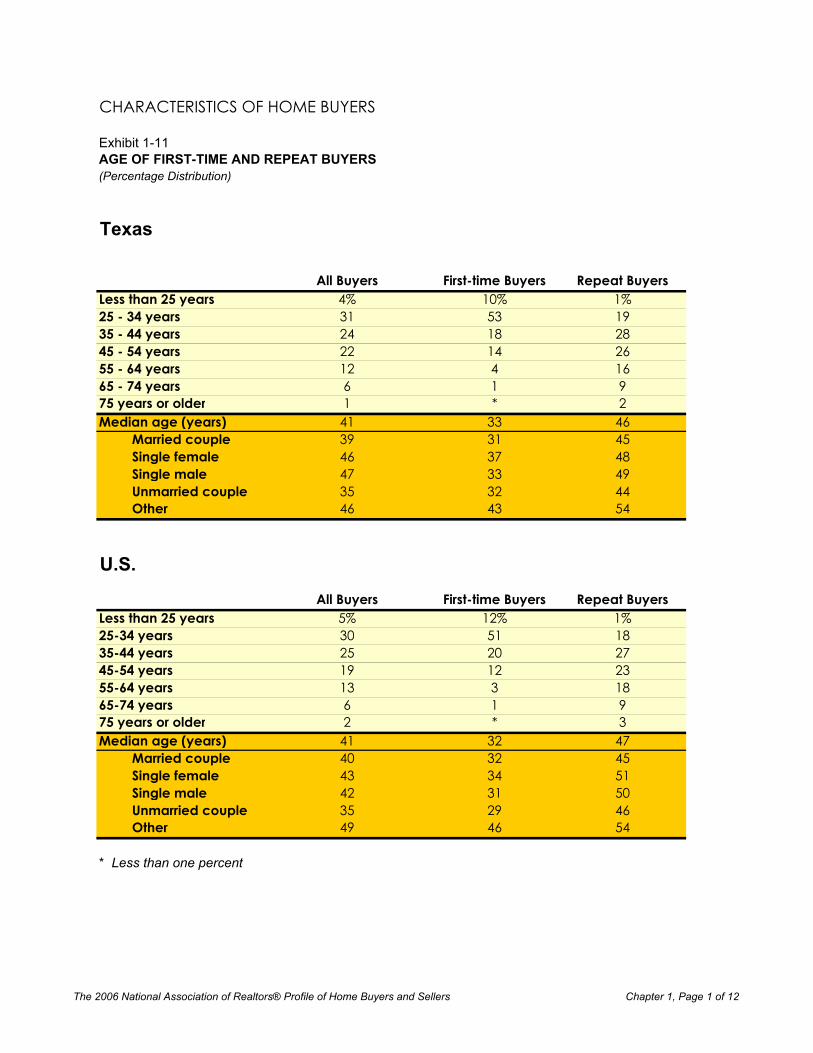
Exhibit 1-11AGE OF FIRST-TIME AND REPEAT BUYERS(Percentage Distribution)
Texas
All Buyers First-time Buyers Repeat BuyersLess than 25 years 4% 10% 1%25 - 34 years 31 53 1935 - 44 years 24 18 2845 - 54 years 22 14 2655 - 64 years 12 4 1665 - 74 years 6 1 975 years or older 1 * 2Median age (years) 41 33 46
Married couple 39 31 45Single female 46 37 48Single male 47 33 49Unmarried couple 35 32 44Other 46 43 54
U.S.
All Buyers First-time Buyers Repeat BuyersLess than 25 years 5% 12% 1%25-34 years 30 51 1835-44 years 25 20 2745-54 years 19 12 2355-64 years 13 3 1865-74 years 6 1 975 years or older 2 * 3Median age (years) 41 32 47
Married couple 40 32 45Single female 43 34 51Single male 42 31 50Unmarried couple 35 29 46Other 49 46 54
* Less than one percent
The 2006 National Association of Realtors® Profile of Home Buyers and Sellers Chapter 1, Page 1 of 12

CHARACTERISTICS OF HOME BUYERS
Exhibit 1-12HOUSEHOLD INCOME OF FIRST-TIME AND REPEAT BUYERS, 2005(Percentage Distribution)
Texas
All Buyers First-time Buyers Repeat BuyersLess than $25,000 5% 6% 4%$25,000 - $34,999 6 9 3$35,000 - $44,999 7 7 7$45,000 - $54,999 11 18 6$55,000 - $64,999 8 13 5$65,000 - $74,999 14 16 13$75,000 - $84,999 10 8 11$85,000 - $99,999 10 12 9$100,000 - $124,999 13 5 17$125,000 - $149,999 7 3 9$150,000 - $174,999 4 1 7$175,000 - $199,999 3 2 3$200,000 or more 3 1 5Median income (2005) $75,000 $62,700 $85,400
Married couple $82,500 $65,900 $100,800Single female $55,400 $51,200 $63,100Single male $81,500 $66,700 $84,000Unmarried couple $68,300 $61,200 $91,100Other $57,500 $65,800 $56,700
U.S.All Buyers First-time Buyers Repeat Buyers
Less than $25,000 4% 6% 3%$25,000 - $34,999 8 14 5$35,000 - $44,999 9 12 7$45,000 - $54,999 10 14 8$55,000 - $64,999 11 14 10$65,000 - $74,999 10 10 10$75,000 - $84,999 9 8 9$85,000 - $99,999 9 8 10$100,000 - $124,999 11 6 14$125,000 - $149,999 6 3 9$150,000 - $174,999 4 2 5$175,000 - $199,999 2 1 2$200,000 or more 5 2 7Median income (2005) $71,800 $58,300 $81,900
Married couple $82,000 $66,200 $91,700Single female $48,100 $43,300 $53,600Single male $66,100 $56,800 $72,200Unmarried couple $76,000 $63,600 $96,400Other $57,300 $53,300 $60,000
* Less than one percent
The 2006 National Association of Realtors® Profile of Home Buyers and Sellers Chapter 1, Page 2 of 12

CHARACTERISTICS OF HOME BUYERS
Exhibit 1-9FIRST-TIME HOME BUYERS, BY REGION(Percent of all Home Buyers)
Texas 35%U.S. 36%Northeast 40%Midwest 40%South 34%West 34%
FIRST-TIME HOME BUYERS, BY REGION(Percent of all Home Buyers)
35%36%
40% 40%
34% 34%
20%
25%
30%
35%
40%
45%
50%
Texas U.S. Northeast Midwest South West
The 2006 National Association of Realtors® Profile of Home Buyers and Sellers Chapter 1, Page 3 of 12

CHARACTERISTICS OF HOMES PURCHASED
Exhibit 2-12PRICE OF HOME PURCHASED, FIRST-TIME AND REPEAT BUYERS(Percentage Distribution)
Texas
All Buyers First-time Buyers Repeat BuyersLess than $75,000 6% 9% 3%$75,000 to $99,999 9 14 6$100,000 to $124,999 12 21 7$125,000 to $149,999 17 21 15$150,000 to $174,999 16 18 16$175,000 to $199,999 8 6 9$200,000 to $249,999 13 2 20$250,000 to $299,999 9 3 13$300,000 to $349,999 3 4 3$350,000 to $399,999 2 * 3$400,000 to $499,999 3 2 3$500,000 or more 2 * 3Median price $156,023 $129,756 $181,884
* Less than one percent
U.S.
All Buyers First-time Buyers Repeat BuyersLess than $75,000 5% 8% 3%$75,000 to $99,999 6 11 4$100,000 to $124,999 8 12 5$125,000 to $149,999 9 13 7$150,000 to $174,999 9 11 8$175,000 to $199,999 9 9 9$200,000 to $249,999 13 12 14$250,000 to $299,999 10 8 11$300,000 to $349,999 7 5 9$350,000 to $399,999 5 3 6$400,000 to $499,999 7 5 8$500,000 or more 12 5 16Median price $214,000 $165,000 $249,000
The 2006 National Association of Realtors® Profile of Home Buyers and Sellers Chapter 2, Page 4 of 12

THE HOME SEARCH PROCESS
Exhibit 3-6USE OF INTERNET TO SEARCH FOR HOMES, BY REGION(Percentage Distribution)
Texas U.S. Northeast Midwest South WestFrequently 62% 59% 63% 61% 57% 56%Occasionally 20 21 19 19 22 25Not at all 19 20 18 19 21 19
Buyers who Purchased a Home in the:
The 2006 National Association of Realtors® Profile of Home Buyers and Sellers Chapter 3, Page 5 of 12

THE HOME SEARCH PROCESS
Exhibit 3-14LENGTH OF SEARCH, BY USE OF INTERNET(Median Weeks)
Texas
Used Internet to Search
Did Not Use Internet to Search
All buyers 8 6First-time buyers 8 6Repeat buyers 8 8
Buyers using an agent 8 5Before contacting agent 3 2After contacting agent 5 3
U.S.
Used Internet to Search
Did Not Use Internet to Search
All buyers 8 6First-time buyers 10 6Repeat buyers 8 5
Buyers using an agent 8 6Before contacting agent 2 3After contacting agent 6 3
The 2006 National Association of Realtors® Profile of Home Buyers and Sellers Chapter 4, Page 6 of 12

THE HOME SEARCH PROCESS
Exhibit 3-11WHERE BUYER FOUND THE HOME THEY PURCHASED, 1997-2006(Percentage Distribution)
Texas
2006Real estate agent 30%Internet 25Yard sign 13Print newspaper advertisement 2Friend, relative or neighbor 9Directly from sellers/Knew the sellers 3Home builder or their agent 17Home book or magazine 1Other --
U.S.
1997 1999 2001 2003 2004 2005 2006Real estate agent 50% 49% 48% 41% 38% 36% 36%Internet 2 4 8 11 15 24 24Yard sign 17 15 15 16 16 15 15Friend, relative or neighbor 9 8 8 7 7 7 8Home builder or their agent 3 4 3 7 7 7 8Print newspaper advertisement 8 8 7 7 5 5 5Directly from sellers/Knew the sellers 4 3 4 4 5 3 3Home book or magazine 3 3 2 1 2 1 1Other * 4 3 6 4 -- --
* Less than one percent
The 2006 National Association of Realtors® Profile of Home Buyers and Sellers Chapter 3, Page 7 of 12

THE HOME SEARCH PROCESS
Exhibit 3-18METHOD OF HOME PURCHASE, BY USE OF INTERNET(Percentage Distribution)
Texas
Used Internet to Search
Did Not Use Internet to Search
Through a real estate agent/broker 83% 58%Directly from builder or builder's agent 13 30Directly from previous owner whom buyer didn't know 3 3Directly from previous owner whom buyer knew 1 7Foreclosure or trustee sale * *Other * 2
U.S.
Used Internet to Search
Did Not Use Internet to Search
Through a real estate agent/broker 81% 63%Directly from builder or builder's agent 10 21Directly from previous owner whom buyer didn't know 5 5Directly from previous owner whom buyer knew 2 10Foreclosure or trustee sale 1 *Other 1 1
* Less than one percent
The 2006 National Association of Realtors® Profile of Home Buyers and Sellers Chapter 3, Page 8 of 12

HOME SELLERS AND THEIR SELLING EXPERIENCE
Exhibit 6-18METHOD USED TO SELL HOME, BY SELLER URGENCY(Percentage Distribution)
TexasVery
urgentlySomewhat
urgentlyNot
urgentlySold home using an agent or broker 86% 93% 85% 83%
Seller used agent/broker only 83 93 81 82Seller first tried to sell it themselves, but then used an agent 2 * 4 1
For-sale-by-owner (FSBO) 9 4 10 12Seller sold home without using a real estate agent or broker 9 4 10 10First listed with an agent, but then sold home themselves 1 * * 2
Sold home to a homebuying company 2 3 2 *Other 3 * 2 4
U.S.
All SellersVery
urgentlySomewhat
urgentlyNot
urgentlySold home using an agent or broker 84% 84% 86% 82%
Seller used agent/broker only 80 82 81 78Seller first tried to sell it themselves, but then used an agent 5 2 5 5
For-sale-by-owner (FSBO) 12 12 12 14Seller sold home without using a real estate agent or broker 11 11 11 13First listed with an agent, but then sold home themselves 1 1 1 1
Sold home to a homebuying company 1 1 1 *Other 3 3 2 4
* Less than one percent
All Sellers
Seller Needed to Sell:
Seller Needed to Sell:
The 2006 National Association of Realtors® Profile of Home Buyers and Sellers Chapter 6, Page 9 of 12

HOME SELLERS AND THEIR SELLING EXPERIENCE
Exhibit 6-22SALES PRICE COMPARED WITH LISTING PRICE, BY SELLER URGENCY(Percentage Distribution of Sales Price as a Percent of Listing Price)
Texas
Very urgently
Somewhat urgently
Not urgently
Less than 90% 4% 7% 2% 5%90% to 94% 15 18 19 895% to 99% 44 30 53 42100% 28 35 16 41101% to 110% 7 11 7 4More than 110% 2 * 4 *Median (sales price as a percent of listing price)
98% 98% 97% 99%
* Less than one percent
U.S.
All SellersVery
urgentlySomewhat
urgentlyNot
urgentlyLess than 90% 7% 7% 7% 6%90% to 94% 14 16 16 1095% to 99% 41 39 41 43100% 26 25 23 31101% to 110% 9 11 9 7More than 110% 3 2 4 4Median (sales price as a percent of listing price)
98% 98% 98% 99%
All Sellers
Seller Needed to Sell:
Seller Needed to Sell:
The 2006 National Association of Realtors® Profile of Home Buyers and Sellers Chapter 6, Page 10 of 12
HOME SELLERS AND THEIR SELLING EXPERIENCE
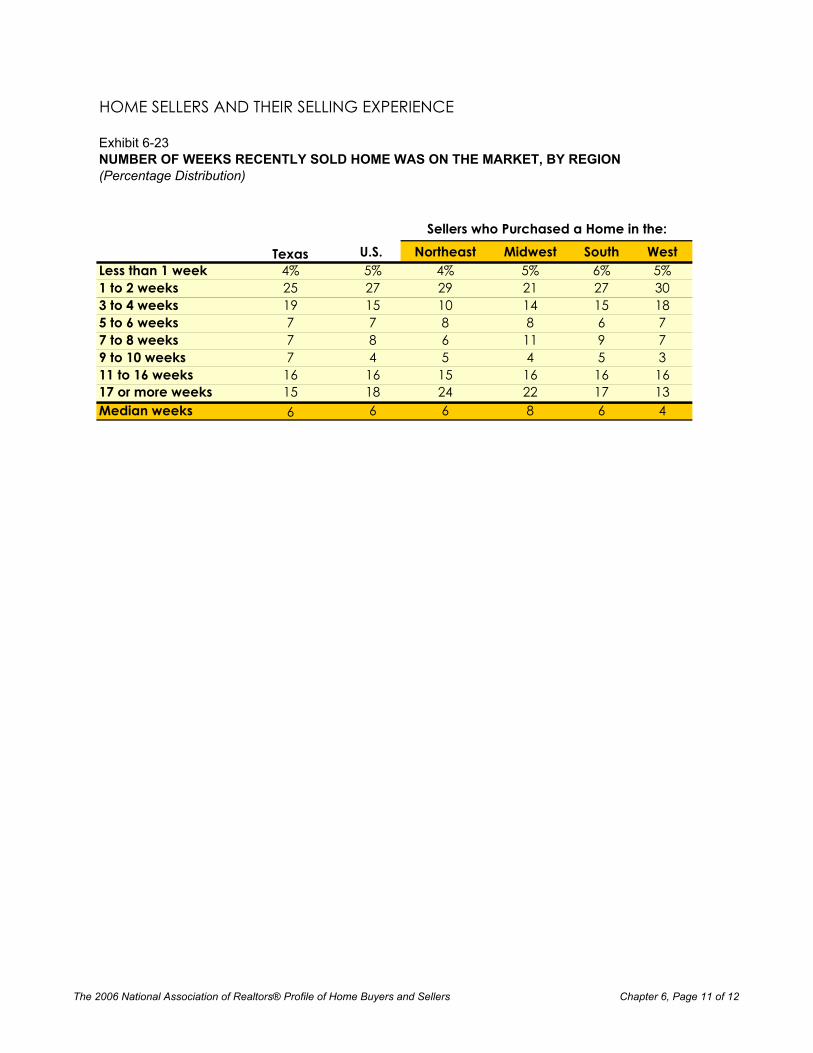
Exhibit 6-23NUMBER OF WEEKS RECENTLY SOLD HOME WAS ON THE MARKET, BY REGION(Percentage Distribution)
U.S. Northeast Midwest South WestLess than 1 week 4% 5% 4% 5% 6% 5%1 to 2 weeks 25 27 29 21 27 303 to 4 weeks 19 15 10 14 15 185 to 6 weeks 7 7 8 8 6 77 to 8 weeks 7 8 6 11 9 79 to 10 weeks 7 4 5 4 5 311 to 16 weeks 16 16 15 16 16 1617 or more weeks 15 18 24 22 17 13Median weeks 6 6 6 8 6 4
Sellers who Purchased a Home in the:
Texas
The 2006 National Association of Realtors® Profile of Home Buyers and Sellers Chapter 6, Page 11 of 12
HOME SELLING AND REAL ESTATE PROFESSIONALS
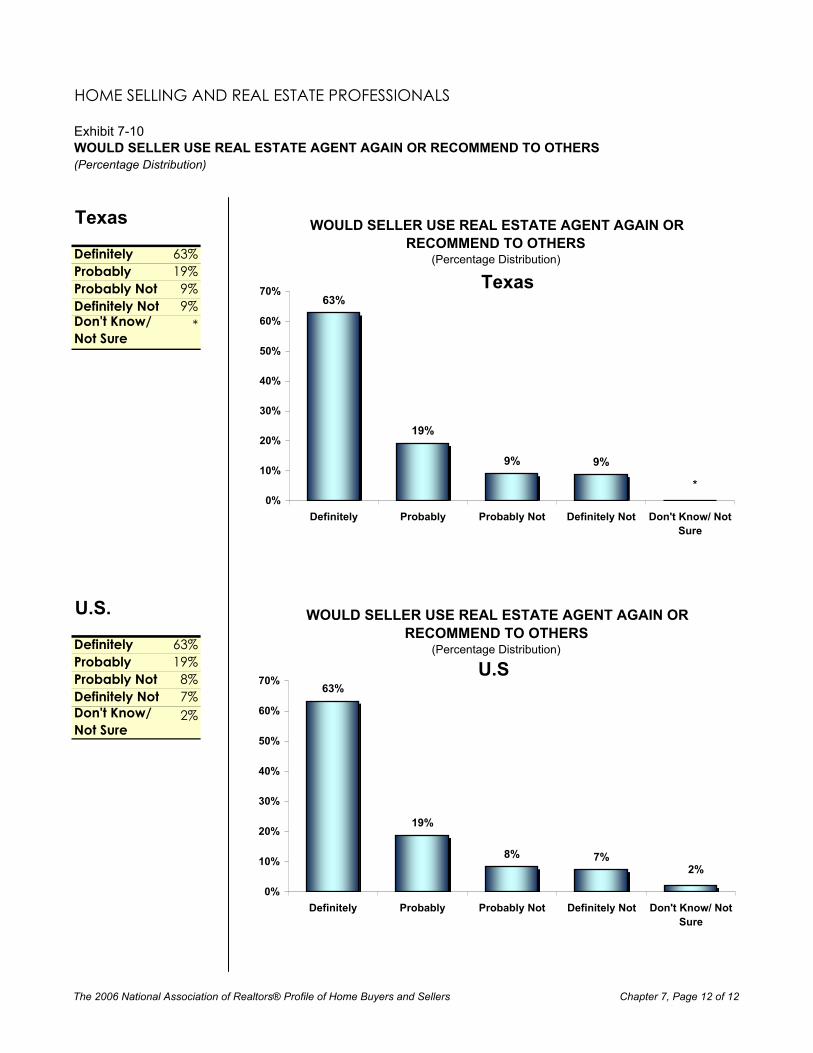
Exhibit 7-10WOULD SELLER USE REAL ESTATE AGENT AGAIN OR RECOMMEND TO OTHERS(Percentage Distribution)
Texas
Definitely 63%Probably 19%Probably Not 9%Definitely Not 9%Don't Know/ Not Sure
*
U.S.
Definitely 63%Probably 19%Probably Not 8%Definitely Not 7%Don't Know/ Not Sure
2%
WOULD SELLER USE REAL ESTATE AGENT AGAIN OR RECOMMEND TO OTHERS
(Percentage Distribution)
63%
19%
9% 9%
*0%
10%
20%
30%
40%
50%
60%
70%
Definitely Probably Probably Not Definitely Not Don't Know/ NotSure
Texas
WOULD SELLER USE REAL ESTATE AGENT AGAIN ORRECOMMEND TO OTHERS
(Percentage Distribution)
63%
19%
8% 7%2%
0%
10%
20%
30%
40%
50%
60%
70%
Definitely Probably Probably Not Definitely Not Don't Know/ NotSure
U.S
The 2006 National Association of Realtors® Profile of Home Buyers and Sellers Chapter 7, Page 12 of 12

Texas Association of REALTORS®
2006 Profile of Home Buyers and Sellers
Prepared by:NATIONAL ASSOCIATION OF REALTORS®
Research Division
November 2006

Introduction
After more than a decade of setting one sales record after another, existing-home sales peaked in the second half of 2005, but have declined steadily through the first half of 2006. At the same time, increases in home prices started to level. As the housing market eases from the frenzied pace of the past few years, home buyers, especiallyfirst-time buyers, will have a greater selection of homes and more affordable prices. Although mortgage rates have risen modestly from their recent lows, a sharp increase is not expected in the near-term. The fundamentals for the housing market remain solid.
The U.S. Census Bureau projects that more than one million new households will be formed annually over the next several years. Most of this increase will stem from the natural formation of new households as children leave home. But some of this increase will also be attributable to population gains from immigration. In addition, the aging of the U.S. population will have an important effect on the demand for housing. Baby boomers, now just reaching age 60, will continue to purchase homes. Most will purchase a primary residence, but a significant share will also purchase a vacation home or investment property in the years ahead.
Whatever the motivation for purchasing a home, real estate professionals will continue to play a critical role in the housing market. Buyers rely on agents and brokers to help them find the right home and guide them through the process of completing the purchase; sellers depend on real estate professionals to market their home, negotiate the best price, and assist them through each step of the selling process. Real estate professionals understand how to market unique properties and how to demonstrate the unique features of an otherwise typical home. They also know how to handle multiple offers, can provide advice on required repairs, and can coordinate many of the legal and financial aspects of the home sales transaction. Some sellers and some buyers navigate this course without a professional, but a majority believe they benefit from the experience and perspective of a real estate agent for a transaction that is important both financially and emotionally.
The NATIONAL ASSOCIATION OF REALTORS® surveys home buyers and sellers annually to gather detailed information on the home buying and selling process. These surveys provide information on demographics, housing characteristics and the experience of buyers and sellers in the housing market. Buyers and sellers also share information on the role of real estate professionals in home sales transactions. The results of the survey are reported in the 2006 NATIONAL ASSOCIATION OF REALTORS® Profile of Home Buyers and Sellers. The data in this report, based on Texas home buyers and sellers, is drawn from this national survey to provide REALTORS®
with insights into the characteristics and needs of their clients.
All information in this report is characteristic of the 12-month period ending June 2006, with the exception of income data which was reported for 2005. Throughout this report, data based on the sub-sample of Texas home buyers and sellers is compared with the national survey results in eight sections:
1: Characteristics of Home Buyers 2: Characteristics of Homes Purchased3: The Home Search Process4: Home Buying and Real Estate Professionals5: Financing the Home Purchase6: Home Sellers and their Selling Experience7: Home Selling and Real Estate Professionals8: For Sale by Owner (FSBO) Sellers
The primary measure of central tendency used throughout this report is the median, the middle point in the distribution of responses to a particular question or equivalently the point at which half of the responses are above and below a particular value.
The 2006 National Association of Realtors® Profile of Home Buyers and Sellers Chapter 1, Page 2 of 26

CHARACTERISTICS OF HOME BUYERS
Exhibit 1-1 AGE OF HOME BUYERS, BY REGIONExhibit 1-2 HOUSEHOLD INCOME OF HOME BUYERS, 2005Exhibit 1-3 ADULT COMPOSITION OF HOME BUYER HOUSEHOLDSExhibit 1-4 NUMBER OF CHILDREN UNDER THE AGE OF 18 RESIDING IN HOUSEHOLDExhibit 1-5 RACE/ETHNICITY OF HOME BUYERS, BY REGIONExhibit 1-6 PRIMARY LANGUAGE SPOKEN IN HOME BUYER HOUSEHOLD, BY REGIONExhibit 1-7 NATIONAL ORIGIN OF HOME BUYERS, BY REGIONExhibit 1-8 FIRST-TIME HOME BUYERSExhibit 1-9 FIRST-TIME HOME BUYERS, BY REGIONExhibit 1-10 FIRST-TIME AND REPEAT HOME BUYERS BY HOUSEHOLD TYPEExhibit 1-11 AGE OF FIRST-TIME AND REPEAT BUYERSExhibit 1-12 HOUSEHOLD INCOME OF FIRST-TIME AND REPEAT BUYERS, 2005Exhibit 1-13 RACE/ETHNICITY OF FIRST-TIME AND REPEAT BUYERSExhibit 1-14 PRIMARY LANGUAGE SPOKEN IN FIRST-TIME AND REPEAT BUYER HOUSEHOLDExhibit 1-15 NATIONAL ORIGIN OF FIRST-TIME AND REPEAT BUYERSExhibit 1-16 PRIOR LIVING ARRANGEMENT OF FIRST-TIME AND REPEAT BUYERSExhibit 1-17 PRIMARY REASON FOR PURCHASING A HOME, FIRST-TIME AND REPEAT BUYERSExhibit 1-18 PRIMARY REASON FOR PURCHASING A HOME, BY AGEExhibit 1-19 AGE OF HOME BUYERS, BY INTENDED USE OF HOMEExhibit 1-20 HOUSEHOLD INCOME OF BUYERS, BY INTENDED USE OF HOME

CHARACTERISTICS OF HOME BUYERS
Texas Number of Total Respondents = 335
Exhibit 1-1AGE OF HOME BUYERS, BY REGION(Percentage Distribution)
Texas U.S. Northeast Midwest South WestLess than 25 years 4% 5% 3% 7% 4% 5%25 - 34 years 31 30 30 33 29 2835 - 44 years 24 25 28 25 23 2445 - 54 years 22 19 19 17 21 1955 - 64 years 12 13 12 10 13 1565 - 74 years 6 6 6 5 7 775 years or older 1 2 2 2 3 2Median age (years) 41 41 41 38 42 42
Buyers who Purchased a Home in the:
The 2006 National Association of Realtors® Profile of Home Buyers and Sellers Chapter 1, Page 4 of 26

CHARACTERISTICS OF HOME BUYERS
Exhibit 1-2HOUSEHOLD INCOME OF HOME BUYERS, 2005(Percentage Distribution)
Texas U.S. Northeast Midwest South WestLess than $25,000 5% 4% 3% 5% 5% 3%$25,000 - $34,999 6 8 8 9 9 6$35,000 - $44,999 7 9 9 10 9 8$45,000 - $54,999 11 10 8 12 11 9$55,000 - $64,999 8 11 11 13 10 11$65,000 - $74,999 14 10 10 10 12 10$75,000 - $84,999 10 9 11 8 9 10$85,000 - $99,999 10 9 11 10 9 9$100,000 - $124,999 13 11 11 10 10 14$125,000 - $149,999 7 6 7 5 6 8$150,000 - $174,999 4 4 4 2 4 5$175,000 - $199,999 3 2 2 1 2 2$200,000 or more 3 5 7 4 5 6Median income (2005) $75,000 $71,800 $75,600 $65,800 $70,100 $78,200
Buyers who Purchased a Home in the:
The 2006 National Association of Realtors® Profile of Home Buyers and Sellers Chapter 1, Page 5 of 26

CHARACTERISTICS OF HOME BUYERS
Exhibit 1-3ADULT COMPOSITION OF HOME BUYER HOUSEHOLDS(Percentage Distribution)
Texas
2006Married couple 68%Single female 20Single male 5Unmarried couple 5Other 2
U.S.
1995 1997 1999 2001 2003 2004 2005 2006Married couple 70% 64% 66% 68% 59% 62% 61% 61%Single female 14 18 18 15 21 18 21 22Single male 9 11 9 7 11 8 9 9Unmarried couple 6 5 6 7 8 9 7 7Other 1 2 1 3 1 2 2 1
The 2006 National Association of Realtors® Profile of Home Buyers and Sellers Chapter 1, Page 6 of 26
CHARACTERISTICS OF HOME BUYERS
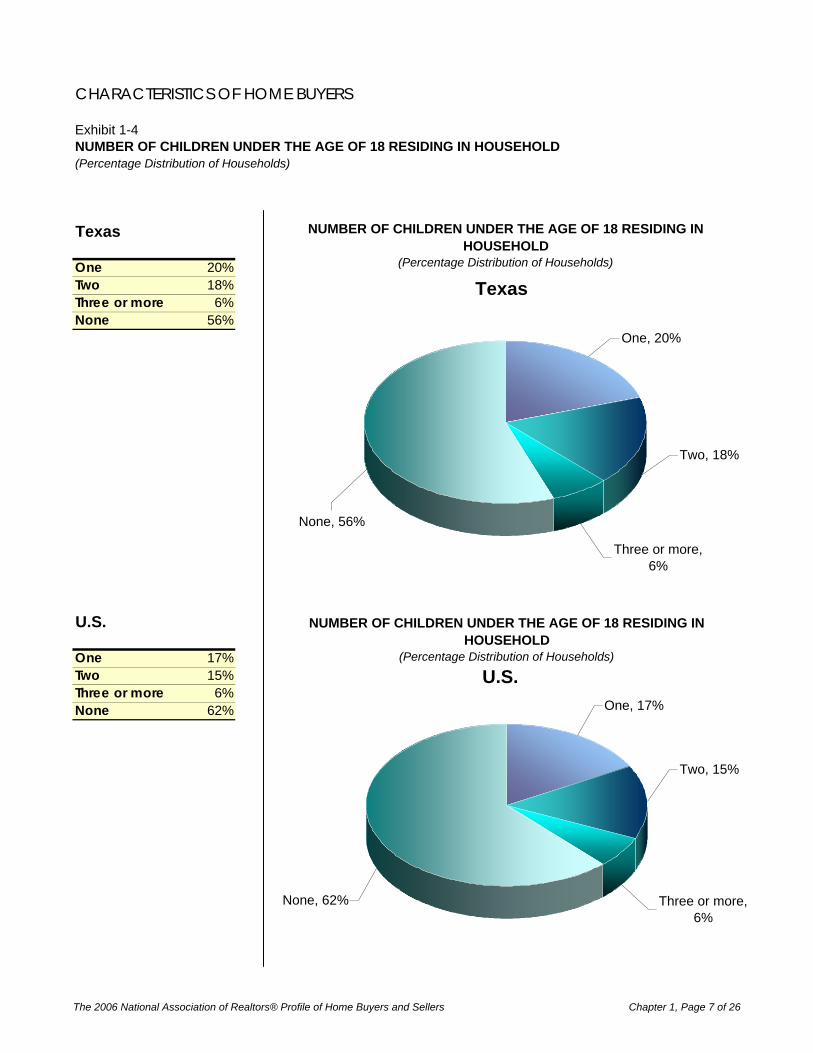
Exhibit 1-4NUMBER OF CHILDREN UNDER THE AGE OF 18 RESIDING IN HOUSEHOLD(Percentage Distribution of Households)
Texas
One 20%Two 18%Three or more 6%None 56%
U.S.
One 17%Two 15%Three or more 6%None 62%
NUMBER OF CHILDREN UNDER THE AGE OF 18 RESIDING IN HOUSEHOLD
(Percentage Distribution of Households)
None, 56%
Three or more, 6%
Two, 18%
One, 20%
Texas
NUMBER OF CHILDREN UNDER THE AGE OF 18 RESIDING IN HOUSEHOLD
(Percentage Distribution of Households)
One, 17%
Two, 15%
Three or more, 6%
None, 62%
U.S.
The 2006 National Association of Realtors® Profile of Home Buyers and Sellers Chapter 1, Page 7 of 26

CHARACTERISTICS OF HOME BUYERS
Exhibit 1-5 RACE/ETHNICITY OF HOME BUYERS, BY REGION(Percent of Respondents)
Texas U.S. Northeast Midwest South WestWhite/Caucasian 74% 81% 84% 88% 79% 77%Black/African-American 8 7 4 6 11 3Hispanic/Latino 14 6 5 3 6 9Asian/Pacific Islander 5 5 5 2 4 10Other 1 2 1 1 2 3
Note: Respondents were permitted to select as many races and ethnicities as they felt applicable. The percentage distribution may therefore sum to more than 100 percent.
Buyers who Purchased a Home in the:
The 2006 National Association of Realtors® Profile of Home Buyers and Sellers Chapter 1, Page 8 of 26

CHARACTERISTICS OF HOME BUYERS
Exhibit 1-6PRIMARY LANGUAGE SPOKEN IN HOME BUYER HOUSEHOLD, BY REGION(Percentage Distribution)
Texas U.S. Northeast Midwest South WestEnglish 94% 95% 93% 97% 96% 94%Other 6 5 7 3 4 6
Buyers who Purchased a Home in the:
The 2006 National Association of Realtors® Profile of Home Buyers and Sellers Chapter 1, Page 9 of 26

CHARACTERISTICS OF HOME BUYERS
Exhibit 1-7NATIONAL ORIGIN OF HOME BUYERS, BY REGION(Percentage Distribution)
Texas U.S. Northeast Midwest South WestBorn in U.S. 89% 89% 85% 94% 90% 87%Not born in U.S. 11 11 15 6 10 13
Buyers who Purchased a Home in the:
The 2006 National Association of Realtors® Profile of Home Buyers and Sellers Chapter 1, Page 10 of 26

CHARACTERISTICS OF HOME BUYERS
Exhibit 1-8FIRST-TIME HOME BUYERS(Percent of all Homebuyers)
Year Percentage1995 42%1997 42%1999 42%2001 42%2003 40%2004 40%2005 40%2006 US 36%
2006 Texas 35%
FIRST-TIME HOME BUYERS(Percent of all Home Buyers)
42% 42% 42% 42%40% 40% 40%
36%35%
20%
25%
30%
35%
40%
45%
50%
1995 1997 1999 2001 2003 2004 2005 2006 2006
U.S. Texas
The 2006 National Association of Realtors® Profile of Home Buyers and Sellers Chapter 1, Page 11 of 26

CHARACTERISTICS OF HOME BUYERS
Exhibit 1-9FIRST-TIME HOME BUYERS, BY REGION(Percent of all Home Buyers)
Texas 35%U.S. 36%Northeast 40%Midwest 40%South 34%West 34%
FIRST-TIME HOME BUYERS, BY REGION(Percent of all Home Buyers)
35%36%
40% 40%
34% 34%
20%
25%
30%
35%
40%
45%
50%
Texas U.S. Northeast Midwest South West
The 2006 National Association of Realtors® Profile of Home Buyers and Sellers Chapter 1, Page 12 of 26

CHARACTERISTICS OF HOME BUYERS
Exhibit 1-10FIRST-TIME AND REPEAT HOME BUYERS BY HOUSEHOLD TYPE(Percentage Distribution of Households Among First-Time Buyers)
Texas
Married couple 64%Single female 18%Single male 4%Unmarried couple 10%Other 4%
U.S.
Married couple 49%Single female 27%Single male 11%Unmarried couple 11%Other 2%
FIRST-TIME HOME BUYERS(Percentage Distribution)
Other, 4%Unmarried
couple, 10%
Single male, 4%
Single female, 18%
Married couple, 64%
Texas
FIRST-TIME HOME BUYERS(Percentage Distribution)
Other, 2%Unmarried couple, 11%
Single male, 11%
Single female, 27%
Married couple, 49%
U.S.
The 2006 National Association of Realtors® Profile of Home Buyers and Sellers Chapter 1, Page 13 of 26

Texas
Married couple 70%Single female 21%Single male 5%Unmarried couple 2%Other 1%
U.S.
Married couple 67%Single female 18%Single male 9%Unmarried couple 5%Other 1%
REPEAT HOME BUYERS(Percentage Distribution)
Other, 1%
Unmarried couple, 2%
Single male, 5%
Single female, 21%
Married couple, 70%
Texas
REPEAT HOME BUYERS(Percentage Distribution)
Other, 1%
Married couple, 67%
Single female, 18%
Single male, 9%
Unmarried couple, 5%
U.S.
The 2006 National Association of Realtors® Profile of Home Buyers and Sellers Chapter 1, Page 15 of 26

CHARACTERISTICS OF HOME BUYERS
Exhibit 1-11AGE OF FIRST-TIME AND REPEAT BUYERS(Percentage Distribution)
Texas
All Buyers First-time Buyers Repeat BuyersLess than 25 years 4% 10% 1%25 - 34 years 31 53 1935 - 44 years 24 18 2845 - 54 years 22 14 2655 - 64 years 12 4 1665 - 74 years 6 1 975 years or older 1 * 2Median age (years) 41 33 46
Married couple 39 31 45Single female 46 37 48Single male 47 33 49Unmarried couple 35 32 44Other 46 43 54
U.S.
All Buyers First-time Buyers Repeat BuyersLess than 25 years 5% 12% 1%25-34 years 30 51 1835-44 years 25 20 2745-54 years 19 12 2355-64 years 13 3 1865-74 years 6 1 975 years or older 2 * 3Median age (years) 41 32 47
Married couple 40 32 45Single female 43 34 51Single male 42 31 50Unmarried couple 35 29 46Other 49 46 54
* Less than one percent
The 2006 National Association of Realtors® Profile of Home Buyers and Sellers Chapter 1, Page 17 of 26

CHARACTERISTICS OF HOME BUYERS
Exhibit 1-12HOUSEHOLD INCOME OF FIRST-TIME AND REPEAT BUYERS, 2005(Percentage Distribution)
Texas
All Buyers First-time Buyers Repeat BuyersLess than $25,000 5% 6% 4%$25,000 - $34,999 6 9 3$35,000 - $44,999 7 7 7$45,000 - $54,999 11 18 6$55,000 - $64,999 8 13 5$65,000 - $74,999 14 16 13$75,000 - $84,999 10 8 11$85,000 - $99,999 10 12 9$100,000 - $124,999 13 5 17$125,000 - $149,999 7 3 9$150,000 - $174,999 4 1 7$175,000 - $199,999 3 2 3$200,000 or more 3 1 5Median income (2005) $75,000 $62,700 $85,400
Married couple $82,500 $65,900 $100,800Single female $55,400 $51,200 $63,100Single male $81,500 $66,700 $84,000Unmarried couple $68,300 $61,200 $91,100Other $57,500 $65,800 $56,700
U.S.All Buyers First-time Buyers Repeat Buyers
Less than $25,000 4% 6% 3%$25,000 - $34,999 8 14 5$35,000 - $44,999 9 12 7$45,000 - $54,999 10 14 8$55,000 - $64,999 11 14 10$65,000 - $74,999 10 10 10$75,000 - $84,999 9 8 9$85,000 - $99,999 9 8 10$100,000 - $124,999 11 6 14$125,000 - $149,999 6 3 9$150,000 - $174,999 4 2 5$175,000 - $199,999 2 1 2$200,000 or more 5 2 7Median income (2005) $71,800 $58,300 $81,900
Married couple $82,000 $66,200 $91,700Single female $48,100 $43,300 $53,600Single male $66,100 $56,800 $72,200Unmarried couple $76,000 $63,600 $96,400Other $57,300 $53,300 $60,000
* Less than one percent
The 2006 National Association of Realtors® Profile of Home Buyers and Sellers Chapter 1, Page 18 of 26

CHARACTERISTICS OF HOME BUYERS
Exhibit 1-13RACE/ETHNICITY OF FIRST-TIME AND REPEAT BUYERS(Percent of Respondents)
Texas
All Buyers First-time Buyers Repeat BuyersWhite/Caucasian 74% 64% 80%Black/African-American 8 9 7Asian/Pacific Islander 14 6 5Hispanic/Latino 5 24 9Other 1 2 1
U.S.
All Buyers First-time Buyers Repeat BuyersWhite/Caucasian 81% 73% 86%Black/African-American 7 11 5Hispanic/Latino 6 9 4Asian/Pacific Islander 5 7 4Other 2 3 1
Note: Respondents were permitted to select as many races and ethnicities as they felt applicable. The percentage distribution may therefore sum to more than 100 percent.
The 2006 National Association of Realtors® Profile of Home Buyers and Sellers Chapter 1, Page 19 of 26

CHARACTERISTICS OF HOME BUYERS
Exhibit 1-14PRIMARY LANGUAGE SPOKEN IN FIRST-TIME AND REPEAT BUYER HOUSEHOLD(Percentage Distribution)
Texas
All Buyers First-time Buyers Repeat BuyersEnglish 94% 91% 96%Other 6 9 4
U.S.
All Buyers First-time Buyers Repeat BuyersEnglish 95% 93% 96%Other 5 7 4
The 2006 National Association of Realtors® Profile of Home Buyers and Sellers Chapter 1, Page 20 of 26

CHARACTERISTICS OF HOME BUYERS
Exhibit 1-15NATIONAL ORIGIN OF FIRST-TIME AND REPEAT BUYERS(Percentage Distribution)
Texas
All Buyers First-time Buyers Repeat BuyersBorn in U.S. 89% 84% 92%Not born in U.S. 11 16 8
U.S.
All Buyers First-time Buyers Repeat BuyersBorn in U.S. 89% 86% 91%Not born in U.S. 11 14 9
The 2006 National Association of Realtors® Profile of Home Buyers and Sellers Chapter 1, Page 21 of 26

CHARACTERISTICS OF HOME BUYERS
Exhibit 1-16PRIOR LIVING ARRANGEMENT OF FIRST-TIME AND REPEAT BUYERS(Percentage Distribution)
Texas
All BuyersFirst-time
BuyersRepeat Buyers
Owned previous residence 46% 2% 71%Rented an apartment or house 45 85 22Lived with parents, relatives or friends 7 9 6Rented the home buyer ultimately purchased 1 3 *Not applicable or no change in living arrangement 1 1 1
U.S.
All BuyersFirst-time
BuyersRepeat Buyers
Owned previous residence 49% 4% 75%Rented an apartment or house 38 75 17Lived with parents, relatives or friends 9 17 4Rented the home buyer ultimately purchased 2 3 1Not applicable or no change in living arrangement 2 1 2
* Less than one percent
Note: After selling their previous home, buyers may have rented a home or apartment beforepurchasing their next home. A first-time buyer could have acquired ownership of their previous home(as an inheritance or gift, for example) without having been the buyer of the home. Thus, a first-time buyer could have owned a home prior to their first home purchase.
The 2006 National Association of Realtors® Profile of Home Buyers and Sellers Chapter 1, Page 22 of 26

CHARACTERISTICS OF HOME BUYERS
Exhibit 1-17PRIMARY REASON FOR PURCHASING A HOME, FIRST-TIME AND REPEAT BUYERS(Percentage Distribution)
Texas
All BuyersFirst-time
BuyersRepeat Buyers
Desire to own a home of my own/ establish household 33% 71% 12%Desire for larger home 12 4 17Job-related relocation or move 17 6 23Change in family situation 10 7 11Desire for a home in a better area 10 3 13Desire to be closer to job, school, relatives or transit 8 3 10Desire for smaller home 3 1 4Retirement 2 1 3Desire for vacation home/investment property 1 1 1Purchased home for family member or relative * * 1Other 4 4 5
U.S.
All BuyersFirst-time
BuyersRepeat Buyers
Desire to own a home of my own/ establish household 32% 74% 9%Desire for larger home 14 4 20Job-related relocation or move 12 4 16Change in family situation 9 8 10Desire for a home in a better area 8 3 11Desire to be closer to job, school, relatives or transit 7 2 10Desire for smaller home 5 1 7Retirement 4 1 6Desire for vacation home/investment property 1 1 2Purchased home for family member or relative 1 * 1Other 6 2 9
* Less than one percent
The 2006 National Association of Realtors® Profile of Home Buyers and Sellers Chapter 1, Page 23 of 26

CHARACTERISTICS OF HOME BUYERS
Exhibit 1-18PRIMARY REASON FOR PURCHASING A HOME, BY AGE(Percentage Distribution)
Texas
All Buyers 18-24 25-44 45-64
65 or older
Desire to own a home of my own/ establish household 33% 50% 39% 27% 10%Desire for larger home 12 8 15 8 13Job-related relocation or move 17 16 20 18 4Change in family situation 3 12 9 9 19Desire for a home in a better area 2 1 8 12 10Desire to be closer to job, school, relatives or transit 1 1 5 13 8Desire for smaller home * * 1 5 8Retirement 2 N/A * 2 18Desire for vacation home/investment property 1 * 1 1 *Purchased home for family member or relative * * * 1 1Other 4 12 3 5 9
U.S.
All Buyers 18-24 25-44 45-64
65 or older
Desire to own a home of my own/ establish household 32% 70% 41% 19% 4%Desire for larger home 14 5 18 12 6Job-related relocation or move 12 4 14 12 1Change in family situation 9 11 8 11 10Desire for a home in a better area 8 2 7 9 8Desire to be closer to job, school, relatives or transit 7 4 6 8 15Desire for smaller home 5 1 1 8 22Retirement 4 N/A * 8 20Desire for vacation home/investment property 1 1 1 2 1Purchased home for family member or relative 1 1 * 1 2Other 6 2 4 9 11
* Less than one percentN/A not applicable
Age
Age
The 2006 National Association of Realtors® Profile of Home Buyers and Sellers Chapter 1, Page 24 of 26

CHARACTERISTICS OF HOME BUYERS
Exhibit 1-19AGE OF HOME BUYERS, BY INTENDED USE OF HOME(Percentage Distribution)
Texas
Primary Residence
Non-primary Residence/ Second
HomeLess than 25 years 4% *25 - 34 years 31 2335 - 44 years 24 845 - 54 years 22 3555 - 64 years 12 3365 - 74 years 6 *75 years or older 1 *Median age (years) 40 52
* Less than one percent
U.S.
Primary Residence
Non-primary Residence/ Second
HomeLess than 25 years 5% 1%25 - 34 years 31 1335 - 44 years 25 2145 - 54 years 19 2455 - 64 years 13 2365 - 74 years 6 1575 years or older 2 2Median age (years) 41 52
Buyers who Purchased a:
Buyers who Purchased a:
The 2006 National Association of Realtors® Profile of Home Buyers and Sellers Chapter 1, Page 25 of 26

CHARACTERISTICS OF HOME BUYERS
Exhibit 1-20HOUSEHOLD INCOME OF BUYERS, BY INTENDED USE OF HOME(Percentage Distribution)
Texas
Primary Residence
Non-primary Residence/
Second HomeLess than $25,000 4% 16%$25,000 - $34,999 6 8$35,000 - $44,999 7 *$45,000 - $54,999 11 *$55,000 - $64,999 8 *$65,000 - $74,999 14 7$75,000 - $84,999 10 *$85,000 - $99,999 9 35$100,000 - $124,999 13 26$125,000 - $149,999 7 8$150,000 - $174,999 5 *$175,000 - $199,999 3 *$200,000 or more 4 *Median income (2005) $75,000 $93,100
* Less than one percent
U.S.
Primary Residence
Non-primary Residence/
Second HomeLess than $25,000 4% 6%$25,000 - $34,999 8 9$35,000 - $44,999 9 7$45,000 - $54,999 10 10$55,000 - $64,999 11 12$65,000 - $74,999 10 8$75,000 - $84,999 9 4$85,000 - $99,999 9 9$100,000 - $124,999 11 12$125,000 - $149,999 6 8$150,000 - $174,999 4 4$175,000 - $199,999 2 4$200,000 or more 5 8Median income (2005) $71,800 $73,500
Buyers who Purchased a:
Buyers who Purchased a:
The 2006 National Association of Realtors® Profile of Home Buyers and Sellers Chapter 1, Page 26 of 26

CHARACTERISTICS OF HOMES PURCHASED
Exhibit 2-1 NEW AND PREVIOUSLY OWNED HOMES PURCHASED, 1995-2006Exhibit 2-2 NEW AND PREVIOUSLY OWNED HOMES PURCHASED, BY REGIONExhibit 2-3 TYPE OF HOME PURCHASED, BY REGIONExhibit 2-4 TYPE OF HOME PURCHASED BY FIRST-TIME AND REPEAT BUYERSExhibit 2-5 LOCATION OF HOME PURCHASED, BY REGIONExhibit 2-6 LOCATION OF HOME PURCHASED BY FIRST-TIME AND REPEAT BUYERSExhibit 2-7 LOCATION OF HOME PURCHASED VERSUS LOCATION OF HOME SOLDExhibit 2-8 DISTANCE BETWEEN HOME RECENTLY PURCHASED AND PREVIOUS RESIDENCEExhibit 2-9 FACTORS INFLUENCING NEIGHBORHOOD CHOICE, BY LOCATIONExhibit 2-10 PRICE OF HOME PURCHASED, BY REGIONExhibit 2-11 PRICE OF HOME PURCHASED, NEW AND PREVIOUSLY OWNEDExhibit 2-12 PRICE OF HOME PURCHASED, FIRST-TIME AND REPEAT BUYERSExhibit 2-13 PURCHASE PRICE COMPARED WITH ASKING PRICE, BY REGIONExhibit 2-14 SIZE OF HOME PURCHASED, FIRST-TIME AND REPEAT BUYERSExhibit 2-15 HOME SIZE AND PRICE PER SQUARE FOOT, BY LOCATION AND REGIONExhibit 2-16 CHARACTERISTICS OF HOME ON WHICH BUYER COMPROMISED, BY LOCATIONExhibit 2-17 CHARACTERISTICS OF HOME ON WHICH BUYER COMPROMISED, FIRST-TIME AND REPEAT BUYERSExhibit 2-18 EXPECTED LENGTH OF TENURE IN HOME PURCHASED, FIRST-TIME AND REPEAT BUYERSExhibit 2-19 EXPECTED LENGTH OF TENURE IN HOME PURCHASED, BY AGEExhibit 2-20 PURCHASE PRICE, PRIMARY RESIDENCE AND SECOND HOMEExhibit 2-21 TYPE OF HOME, PRIMARY RESIDENCE AND SECOND HOMEExhibit 2-22 LOCATION OF HOME, PRIMARY RESIDENCE AND SECOND HOME

CHARACTERISTICS OF HOMES PURCHASED
Exhibit 2-1NEW AND PREVIOUSLY OWNED HOMES PURCHASED, 1995-2006(Percentage Distribution)
Texas
NewPreviously
Owned2006 31% 69%
U.S.
NewPreviously
Owned1995 24% 76%1997 18% 82%1999 22% 78%2001 21% 79%2003 28% 72%2004 21% 79%2005 23% 77%2006 22% 78%
NEW AND PREVIOUSLY OWNED HOMES PURCHASED(Percentage Distribution)
31%
69%
0%
20%
40%
60%
80%
100%
2006
New Previously Owned
Texas
NEW AND PREVIOUSLY OWNED HOMES PURCHASED(Percentage Distribution)
24%18%
22% 21%28%
21% 23% 22%
76%82%
78% 79%72%
79% 77% 78%
0%
20%
40%
60%
80%
100%
1995 1997 1999 2001 2003 2004 2005 2006
New Previously Owned
U.S.
The 2006 National Association of Realtors® Profile of Home Buyers and Sellers Chapter 2, Page 2 of 26

CHASED
URCHASED
23% 22%
77% 78%
2005 2006
The 2006 National Association of Realtors® Profile of Home Buyers and Sellers Chapter 2, Page 4 of 26

The 2006 National Association of Realtors® Profile of Home Buyers and Sellers Chapter 2, Page 5 of 26

CHARACTERISTICS OF HOMES PURCHASED
Exhibit 2-2NEW AND PREVIOUSLY OWNED HOMES PURCHASED, BY REGION(Percentage Distribution)
U.S. Northeast Midwest South WestNew 31% 22% 13% 21% 26% 22%Previously Owned 69 78 87 79 74 78
Buyers who Purchased a Home in the:Texas
The 2006 National Association of Realtors® Profile of Home Buyers and Sellers Chapter 2, Page 6 of 26

CHARACTERISTICS OF HOMES PURCHASED
Exhibit 2-3TYPE OF HOME PURCHASED, BY REGION(Percentage Distribution)
U.S. Northeast Midwest South WestDetached single-family home 86% 75% 70% 77% 76% 75%Townhouse/row house 5 9 11 8 10 8Apartment/condo in building with 5 or more units
2 8 8 8 7 10
Duplex/apartment/condo in 2 to 4 unit building
1 3 5 4 2 2
Other 5 5 5 3 6 5
Buyers who Purchased a Home in the:Texas
The 2006 National Association of Realtors® Profile of Home Buyers and Sellers Chapter 2, Page 7 of 26

CHARACTERISTICS OF HOMES PURCHASED
Exhibit 2-4TYPE OF HOME PURCHASED BY FIRST-TIME AND REPEAT BUYERS(Percentage Distribution)
Texas
All BuyersFirst-time
BuyersRepeat Buyers
Detached single-family home 86% 83% 88%Townhouse/row house 5 6 5Apartment/condo in building with 5 or more units 2 2 3Duplex/apartment/condo in 2 to 4 unit building 1 3 *Other 5 6 4
* Less than one percent
U.S.
All BuyersFirst-time
BuyersRepeat Buyers
Detached single-family home 75% 66% 80%Townhouse/row house 9 13 7Apartment/condo in building with 5 or more units 8 11 6Duplex/apartment/condo in 2 to 4 unit building 3 3 3Other 5 6 4
The 2006 National Association of Realtors® Profile of Home Buyers and Sellers Chapter 2, Page 8 of 26
CHARACTERISTICS OF HOMES PURCHASED
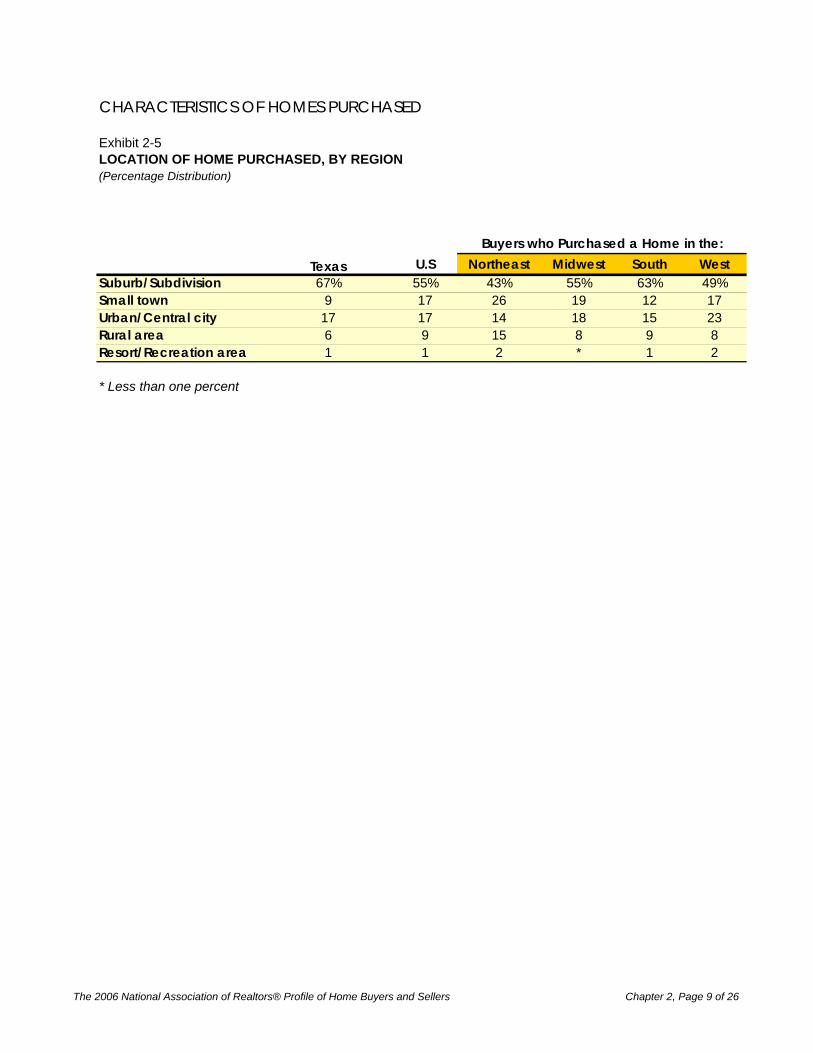
Exhibit 2-5LOCATION OF HOME PURCHASED, BY REGION(Percentage Distribution)
U.S Northeast Midwest South WestSuburb/Subdivision 67% 55% 43% 55% 63% 49%Small town 9 17 26 19 12 17Urban/Central city 17 17 14 18 15 23Rural area 6 9 15 8 9 8Resort/Recreation area 1 1 2 * 1 2
* Less than one percent
Buyers who Purchased a Home in the:Texas
The 2006 National Association of Realtors® Profile of Home Buyers and Sellers Chapter 2, Page 9 of 26

CHARACTERISTICS OF HOMES PURCHASED
Exhibit 2-6LOCATION OF HOME PURCHASED BY FIRST-TIME AND REPEAT BUYERS(Percentage Distribution)
Texas
All Buyers First-time Buyers Repeat BuyersSuburb/Subdivision 67% 68% 67%Small town 9 7 11Urban/Central city 17 21 15Rural area 6 4 6Resort/Recreation area 1 * 1
* Less than one percent
U.S.
All Buyers First-time Buyers Repeat BuyersSuburb/Subdivision 55% 52% 57%Small town 17 15 18Urban/Central city 17 23 14Rural area 9 9 10Resort/Recreation area 1 1 2
The 2006 National Association of Realtors® Profile of Home Buyers and Sellers Chapter 2, Page 10 of 26

CHARACTERISTICS OF HOMES PURCHASED
Exhibit 2-7LOCATION OF HOME PURCHASED VERSUS LOCATION OF HOME SOLD(Percentage Distribution Among those that Sold a Home)
Texas
Suburb/ Subdivision
Small town
Urban/ Central city
Rural area
Resort/ Recreation
areaSuburb/Subdivision 49% 6% 4% 3% *Small town 4 4 1 1 *Urban area/Central city 10 1 5 1 *Rural area 3 1 3 1 *Resort/Recreation area * * * 1 1
U.S.
Suburb/ Subdivision
Small town
Urban/ Central city
Rural area
Resort/ Recreation
areaSuburb/Subdivision 40% 5% 3% 4% 1%Small town 4 7 1 1 *Urban area/Central city 8 3 7 2 *Rural area 4 3 1 3 *Resort/Recreation area 1 * * * *
* Less than one percent
LOCATION OF HOME
SOLD
LOCATION OF HOME PURCHASED
LOCATION OF HOME PURCHASED
LOCATION OF HOME
SOLD
The 2006 National Association of Realtors® Profile of Home Buyers and Sellers Chapter 2, Page 11 of 26

CHARACTERISTICS OF HOMES PURCHASED
Exhibit 2-8DISTANCE BETWEEN HOME RECENTLY PURCHASED AND PREVIOUS RESIDENCE(Median Miles)
MilesTexas 18U.S. 13Northeast 10Midwest 12South 15West 12
MEDIAN DISTANCE BETWEEN HOME RECENTLY PURCHASED AND PREVIOUS RESIDENCE
(Median Miles)
18
13
10
12
15
12
0
2
4
6
8
10
12
14
16
18
20
Texas U.S. Northeast Midwest South West
The 2006 National Association of Realtors® Profile of Home Buyers and Sellers Chapter 2, Page 12 of 26

CHARACTERISTICS OF HOMES PURCHASED
Exhibit 2-9FACTORS INFLUENCING NEIGHBORHOOD CHOICE, BY LOCATION(Percent of Respondents)
Texas
All Buyers
Suburb/ Subdivision
Small town
Urban/ Central
city Rural
Resort/ Recreation
areaQuality of the neighborhood 68% 73% 57% 65% 47% 60%Convenient to job 48 47 50 57 38 27Convenient to friends/family 34 34 36 35 22 33Design of neighborhood 32 34 23 35 14 27Convenient to shopping 30 29 27 40 15 54Quality of the school district 37 41 39 17 39 27Convenient to schools 25 29 20 17 20 27Convenient to entertainment/leisure activities 20 16 14 37 11 67Convenient to parks/recreational facilities 15 14 15 22 3 33Convenient to health facilities 12 10 10 13 4 54Home in a planned community 16 19 8 8 8 40Convenient to airport 6 6 10 6 4 6Convenient to public transportation 4 3 * 12 * 27Other 7 5 14 5 26 *
* Less than one percent
U.S.
All Buyers
Suburb/ Subdivision
Small town
Urban/ Central
city Rural
Resort/ Recreation
areaQuality of the neighborhood 63% 69% 60% 57% 51% 55%Convenient to job 48 49 42 54 40 32Convenient to friends/family 36 36 39 38 28 43Design of neighborhood 28 31 27 25 21 33Convenient to shopping 28 31 22 30 15 33Quality of the school district 27 32 24 13 25 16Convenient to schools 19 21 20 15 17 12Convenient to entertainment/leisure activities 19 19 12 33 9 42Convenient to parks/recreational facilities 16 15 14 23 8 31Convenient to health facilities 11 12 11 10 6 24Home in a planned community 11 13 10 5 6 24Convenient to airport 7 8 4 9 3 15Convenient to public transportation 7 5 4 17 2 6Other 9 7 11 8 23 10
Buyers who Purchased a Home in a:
Buyers who Purchased a Home in a:
The 2006 National Association of Realtors® Profile of Home Buyers and Sellers Chapter 2, Page 13 of 26

CHARACTERISTICS OF HOMES PURCHASED
Exhibit 2-10PRICE OF HOME PURCHASED, BY REGION(Percentage Distribution)
U.S. Northeast Midwest South WestLess than $75,000 6% 5% 7% 6% 5% 1%$75,000 to $99,999 9 6 5 10 8 1$100,000 to $124,999 12 8 5 10 10 2$125,000 to $149,999 17 9 6 12 12 5$150,000 to $174,999 16 9 5 13 11 4$175,000 to $199,999 8 9 6 11 11 6$200,000 to $249,999 13 13 11 15 14 12$250,000 to $299,999 9 10 12 8 8 13$300,000 to $349,999 3 7 9 5 6 11$350,000 to $399,999 2 5 8 3 4 7$400,000 to $499,999 3 7 11 4 4 12$500,000 or more 2 12 14 4 8 25Median price $156,023 $214,000 $265,000 $174,900 $183,000 $320,000
Buyers who Purchased a Home in the:
Texas
The 2006 National Association of Realtors® Profile of Home Buyers and Sellers Chapter 2, Page 14 of 26

CHARACTERISTICS OF HOMES PURCHASED
Exhibit 2-11PRICE OF HOME PURCHASED, NEW AND PREVIOUSLY OWNED(Percentage Distribution)
Texas
All Buyers New Home Previously Owned HomeLess than $75,000 6% 2% 7%$75,000 to $99,999 9 1 12$100,000 to $124,999 12 6 15$125,000 to $149,999 17 14 18$150,000 to $174,999 16 19 15$175,000 to $199,999 8 13 6$200,000 to $249,999 13 20 10$250,000 to $299,999 9 12 8$300,000 to $349,999 3 3 3$350,000 to $399,999 2 3 1$400,000 to $499,999 3 4 2$500,000 or more 2 3 2Median price $156,023 $185,000 $147,000
U.S.
All Buyers New Home Previously Owned HomeLess than $75,000 5% * 6%$75,000 to $99,999 6 2 7$100,000 to $124,999 8 4 9$125,000 to $149,999 9 7 10$150,000 to $174,999 9 9 9$175,000 to $199,999 9 10 9$200,000 to $249,999 13 17 12$250,000 to $299,999 10 13 9$300,000 to $349,999 7 10 7$350,000 to $399,999 5 7 4$400,000 to $499,999 7 8 7$500,000 or more 12 13 11Median price $214,000 $250,000 $200,000
* Less than one percent
Buyers who Purchased a:
Buyers who Purchased a:
The 2006 National Association of Realtors® Profile of Home Buyers and Sellers Chapter 2, Page 15 of 26

CHARACTERISTICS OF HOMES PURCHASED
Exhibit 2-12PRICE OF HOME PURCHASED, FIRST-TIME AND REPEAT BUYERS(Percentage Distribution)
Texas
All Buyers First-time Buyers Repeat BuyersLess than $75,000 6% 9% 3%$75,000 to $99,999 9 14 6$100,000 to $124,999 12 21 7$125,000 to $149,999 17 21 15$150,000 to $174,999 16 18 16$175,000 to $199,999 8 6 9$200,000 to $249,999 13 2 20$250,000 to $299,999 9 3 13$300,000 to $349,999 3 4 3$350,000 to $399,999 2 * 3$400,000 to $499,999 3 2 3$500,000 or more 2 * 3Median price $156,023 $129,756 $181,884
* Less than one percent
U.S.
All Buyers First-time Buyers Repeat BuyersLess than $75,000 5% 8% 3%$75,000 to $99,999 6 11 4$100,000 to $124,999 8 12 5$125,000 to $149,999 9 13 7$150,000 to $174,999 9 11 8$175,000 to $199,999 9 9 9$200,000 to $249,999 13 12 14$250,000 to $299,999 10 8 11$300,000 to $349,999 7 5 9$350,000 to $399,999 5 3 6$400,000 to $499,999 7 5 8$500,000 or more 12 5 16Median price $214,000 $165,000 $249,000
The 2006 National Association of Realtors® Profile of Home Buyers and Sellers Chapter 2, Page 16 of 26

CHARACTERISTICS OF HOMES PURCHASED
Exhibit 2-13PURCHASE PRICE COMPARED WITH ASKING PRICE, BY REGION(Percentage Distribution)
Percent of asking price: U.S. Northeast Midwest South WestLess than 90% 10% 8% 10% 10% 7% 5%90% to 94% 13 13 17 16 12 995% to 99% 34 34 35 40 34 30100% 26 32 28 25 35 37101% to 110% 15 11 9 7 11 16More than 110% 2 2 2 2 2 3Median (purchase price as a percent of asking price)
98% 99% 98% 98% 99% 100%
Buyers who Purchased a Home in the:Texas
The 2006 National Association of Realtors® Profile of Home Buyers and Sellers Chapter 2, Page 17 of 26

CHARACTERISTICS OF HOMES PURCHASED
Exhibit 2-14SIZE OF HOME PURCHASED, FIRST-TIME AND REPEAT BUYERS(Percentage Distribution)
Texas
All Buyers First-time Buyers Repeat Buyers1,000 sq ft or less 2% 5% 1%1,001 to 1,500 sq ft 16 23 121,501 to 2,000 sq ft 28 44 192,001 to 2,500 sq ft 23 17 272,501 to 3,000 sq ft 15 7 193,001 to 3,500 sq ft 7 5 83,501 sq ft or more 9 1 14Median (sq ft) 2,089 1,757 2,339
U.S.
All Buyers First-time Buyers Repeat Buyers1,000 sq ft or less 8% 14% 4%1,001 to 1,500 sq ft 24 35 181,501 to 2,000 sq ft 30 31 292,001 to 2,500 sq ft 17 11 212,501 to 3,000 sq ft 10 5 133,001 to 3,500 sq ft 6 2 83,501 sq ft or more 6 2 8Median (sq ft) 1,815 1,516 1,993
The 2006 National Association of Realtors® Profile of Home Buyers and Sellers Chapter 2, Page 18 of 26

CHARACTERISTICS OF HOMES PURCHASED
Exhibit 2-15HOME SIZE AND PRICE PER SQUARE FOOT, BY LOCATION AND REGION(Median)
U.S. Northeast Midwest South WestAll homes purchased
Square feet 2,089 1,815 1,804 1,789 1,865 1,753Price per square foot $79 $118 $144 $104 $98 $187
Detached single-family homeSquare feet 2,164 1,928 1,884 1,884 1,984 1,896Price per square foot $79 $112 $140 $101 $94 $180
Townhouse or row houseSquare feet 1,766 1,629 1,725 1,617 1,658 1,452Price per square foot $87 $136 $131 $120 $131 $219
Duplex/apartment/condo in 2-4 unit buildingSquare feet 1,277 1,587 1,751 1,577 1,589 1,334Price per square foot $88 $129 $143 $121 $121 $185
Apartment/condo in building with 5 or more unitsSquare feet 1,240 1,151 1,266 1,295 1,175 963Price per square foot $111 $189 $203 $123 $172 $296
Buyers who Purchased a Home in the:Texas
The 2006 National Association of Realtors® Profile of Home Buyers and Sellers Chapter 2, Page 19 of 26

CHARACTERISTICS OF HOMES PURCHASED
Exhibit 2-16CHARACTERISTICS OF HOME ON WHICH BUYER COMPROMISED, BY LOCATION(Percent of Respondents)
Texas
Suburb/ Subdivision
Small town
Urban/ Central
city Rural
Resort/ Recreation
areaSize of home 17% 15% 32% 18% 16% 33%Planned expenditures/price of home 17 16 15 21 13 27Condition of home 14 11 24 26 12 *Lot size 14 15 18 7 8 6Style of home 12 10 25 11 18 6Distance from job 14 14 13 11 24 27Quality of the neighborhood 7 7 8 10 9 0Distance from friends or family 6 7 1 2 5 54Quality of the schools 3 2 * 4 3 27Distance from school 2 1 * 2 6 27Other compromises not listed 5 5 1 8 8 *None – Made no compromises 40 41 35 38 32 33
* Less than one percent
U.S.
All BuyersSuburb/
SubdivisionSmall town
Urban/ Central
city Rural
Resort/ Recreation
areaSize of home 19% 17% 18% 26% 18% 18%Planned expenditures/price of home 17 17 17 21 14 22Condition of home 15 13 17 19 16 11Lot size 14 14 15 13 17 12Style of home 14 13 13 16 14 11Distance from job 13 13 12 8 18 11Quality of the neighborhood 7 5 7 12 5 6Distance from friends or family 7 6 6 5 12 8Quality of the schools 3 3 2 4 3 5Distance from school 2 2 1 1 3 3Other compromises not listed 6 6 6 6 9 7None – Made no compromises 36 37 37 32 33 41
Buyers who Purchased a Home in a:
Buyers who Purchased a Home in a:
All Buyers
The 2006 National Association of Realtors® Profile of Home Buyers and Sellers Chapter 2, Page 20 of 26

CHARACTERISTICS OF HOMES PURCHASED
Exhibit 2-17CHARACTERISTICS OF HOME ON WHICH BUYER COMPROMISED, FIRST-TIME AND REPEAT BUYERS(Percentage of Respondents)
Texas
All Buyers First-time Buyers Repeat BuyersSize of home 17% 15% 17%Planned expenditures/price of home 17 12 19Condition of home 14 15 14Lot size 14 12 15Style of home 12 10 13Distance from job 14 18 11Quality of the neighborhood 7 6 8Distance from friends or family 14 3 7Quality of the schools 12 3 2Distance from school 2 3 1Other compromises not listed 5 8 4None – Made no compromises 40 39 40
U.S.
All Buyers First-time Buyers Repeat BuyersSize of home 19% 24% 16%Planned expenditures/price of home 17 18 17Condition of home 15 16 15Lot size 14 13 15Style of home 14 16 13Distance from job 13 16 11Quality of the neighborhood 7 9 5Distance from friends or family 7 8 6Quality of the schools 3 4 3Distance from school 2 2 1Other compromises not listed 6 5 6None – Made no compromises 36 32 37
The 2006 National Association of Realtors® Profile of Home Buyers and Sellers Chapter 2, Page 21 of 26

CHARACTERISTICS OF HOMES PURCHASED
Exhibit 2-18EXPECTED LENGTH OF TENURE IN HOME PURCHASED, FIRST-TIME AND REPEAT BUYERS(Percentage Distribution)
Texas
All Buyers First-time Buyers Repeat Buyers1 year or less * * *2 to 3 years 9 7 94 to 5 years 17 27 126 to 7 years 10 8 118 to 10 years 10 9 1111 to 15 years 9 5 1116 or more years 19 20 19Don't Know 26 23 28Median 8 6 9
U.S.
All Buyers First-time Buyers Repeat Buyers1 year or less 1% 1% 1%2 to 3 years 11 14 104 to 5 years 18 25 146 to 7 years 7 8 78 to 10 years 12 11 1311 to 15 years 6 4 716 or more years 20 16 22Don't Know 24 20 26Median 8 6 9
The 2006 National Association of Realtors® Profile of Home Buyers and Sellers Chapter 2, Page 22 of 26

CHARACTERISTICS OF HOMES PURCHASED
Exhibit 2-19EXPECTED LENGTH OF TENURE IN HOME PURCHASED, BY AGE(Percentage Distribution)
Texas
All Buyers 18-24 25-44 45-64 65 or older1 year or less * * * * *2 to 3 years 9 16 11 4 44 to 5 years 17 21 23 11 56 to 7 years 10 17 11 9 28 to 10 years 10 8 13 8 811 to 15 years 9 12 7 10 1216 or more years 19 9 16 28 9Don't Know 26 17 19 31 60Median 8 6 7 12 11
* Less than one percent
U.S.
All Buyers 18-24 25-44 45-64 65 or older1 year or less 1% 1% 1% 1% 1%2 to 3 years 11 17 13 8 64 to 5 years 18 36 23 11 56 to 7 years 7 12 9 6 28 to 10 years 12 11 12 14 1011 to 15 years 6 2 6 7 716 or more years 20 8 18 25 20Don't Know 24 12 18 28 49Median 8 5 6 9 12
Age
Age
The 2006 National Association of Realtors® Profile of Home Buyers and Sellers Chapter 2, Page 23 of 26

CHARACTERISTICS OF HOMES PURCHASED
Exhibit 2-20PURCHASE PRICE, PRIMARY RESIDENCE AND SECOND HOME(Percentage Distribution)
Texas
All BuyersPrimary
Residence
Non-primary Residence/
Second HomeLess than $75,000 6% 6% 8%$75,000 to $99,999 9 9 16$100,000 to $124,999 12 12 31$125,000 to $149,999 17 17 18$150,000 to $174,999 16 16 24$175,000 to $199,999 8 8 *$200,000 to $249,999 13 14 3$250,000 to $299,999 9 9 *$300,000 to $349,999 3 3 *$350,000 to $399,999 2 2 *$400,000 to $499,999 3 3 *$500,000 or more 2 2 *Median price $156,023 $157,000 $135,550
* Less than one percent
U.S.
All BuyersPrimary
Residence
Non-primary Residence/
Second HomeLess than $75,000 5% 4% 9%$75,000 to $99,999 6 6 9$100,000 to $124,999 8 8 9$125,000 to $149,999 9 9 8$150,000 to $174,999 9 9 8$175,000 to $199,999 9 9 10$200,000 to $249,999 13 13 9$250,000 to $299,999 10 10 9$300,000 to $349,999 7 7 7$350,000 to $399,999 5 5 6$400,000 to $499,999 7 7 5$500,000 or more 12 12 12Median price $214,000 $214,900 $189,000
Buyers who Purchased a:
Buyers who Purchased a:
The 2006 National Association of Realtors® Profile of Home Buyers and Sellers Chapter 2, Page 24 of 26

CHARACTERISTICS OF HOMES PURCHASED
Exhibit 2-21TYPE OF HOME, PRIMARY RESIDENCE AND SECOND HOME(Percentage Distribution)
Texas
All BuyersPrimary
Residence
Non-primary Residence/
Second HomeDetached single-family home 86% 87% 60%Townhouse/row house 5 5 24Duplex/apartment/condo in 2 to 4 unit building 1 1 *Apartment/condo in building with 5 or more units 2 2 8Other 5 5 7
* Less than one percent
U.S.
All BuyersPrimary
Residence
Non-primary Residence/
Second HomeDetached single-family home 75% 76% 61%Townhouse/row house 9 9 11Duplex/apartment/condo in 2 to 4 unit building 8 3 5Apartment/condo in building with 5 or more units 3 8 14Other 5 5 9
Buyers who Purchased a:
Buyers who Purchased a:
The 2006 National Association of Realtors® Profile of Home Buyers and Sellers Chapter 2, Page 25 of 26

CHARACTERISTICS OF HOMES PURCHASED
Exhibit 2-22LOCATION OF HOME, PRIMARY RESIDENCE AND SECOND HOME(Percentage Distribution)
Texas
All Buyers Primary Residence
Non-primary Residence/ Second
HomeSuburb/Subdivision 67% 67% 67%Small town 9 9 *Urban/Central city 17 17 18Rural area 6 6 *Resort/Recreation area 1 1 16
* Less than one percent
U.S.
All Buyers Primary Residence
Non-primary Residence/ Second
HomeSuburb/Subdivision 55% 56% 49%Small town 17 17 16Urban/Central city 17 17 21Rural area 9 9 9Resort/Recreation area 1 1 5
Buyers who Purchased a:
Buyers who Purchased a:
The 2006 National Association of Realtors® Profile of Home Buyers and Sellers Chapter 2, Page 26 of 26

THE HOME SEARCH PROCESS
Exhibit 3-1 SEARCH ACTIVITY OF HOME BUYERS, BY REGIONExhibit 3-2 SEARCH ACTIVITY OF FIRST-TIME AND REPEAT BUYERSExhibit 3-3 LENGTH OF SEARCH FOR BUYERS WHO USED AN AGENT, FIRST-TIME AND REPEAT BUYERSExhibit 3-4 INFORMATION SOURCES USED IN HOME SEARCH BY FIRST-TIME AND REPEAT BUYERSExhibit 3-5 USEFULNESS OF INFORMATION SOURCESExhibit 3-6 USE OF INTERNET TO SEARCH FOR HOMES, BY REGIONExhibit 3-7 USE OF INTERNET TO SEARCH FOR HOMES BY FIRST-TIME AND REPEAT BUYERSExhibit 3-8 USE OF INTERNET TO SEARCH FOR HOMES, BY AGEExhibit 3-9 USE OF INTERNET TO SEARCH FOR HOMES, 2003-2006Exhibit 3-10 ACTIONS TAKEN AS A RESULT OF INTERNET HOME SEARCH, FIRST-TIME AND REPEAT BUYERSExhibit 3-11 WHERE BUYER FOUND THE HOME THEY PURCHASED, 1997-2006Exhibit 3-12 BUYERS WHO FOUND THEIR HOME ON THE INTERNET, 1997-2006Exhibit 3-13 CHARACTERISTICS OF HOME SEARCHERS, BY USE OF INTERNETExhibit 3-14 LENGTH OF SEARCH, BY USE OF INTERNETExhibit 3-15 NUMBER OF HOMES VISITED, BY USE OF INTERNETExhibit 3-16 INFORMATION SOURCES USED IN HOME SEARCH, BY USE OF INTERNETExhibit 3-17 WHERE BUYERS FOUND THE HOME THEY PURCHASED, BY USE Exhibit 3-18 METHOD OF HOME PURCHASE, BY USE OF INTERNETExhibit 3-19 WHAT HOME BUYERS WERE LOOKING FOR ONLINE, FIRST-TIME AND REPEAT BUYERSExhibit 3-20 WHAT HOME BUYERS WERE LOOKING FOR ONLINE, BY AGEExhibit 3-21 VALUE OF WEB SITE FEATURESExhibit 3-22 WEB SITES USED IN HOME SEARCH, BY REGIONExhibit 3-23 WEB SITES USED IN HOME SEARCH BY FIRST-TIME AND REPEAT BUYERS

THE HOME SEARCH PROCESS
Exhibit 3-1SEARCH ACTIVITY OF HOME BUYERS, BY REGION(Median)
Texas U.S. Northeast Midwest South West
Number of Weeks Searched2001 7 7 7 7 72003 8 10 8 8 62004 8 12 8 8 82005 8 10 8 8 62006 8 8 12 8 8 8
Number of Homes Seen2001 10 11 8 7 102003 10 9 10 9 122004 9 8 10 9 102005 9 8 11 9 92006 11 9 8 9 8 11
Buyers who Purchased a Home in the:
The 2006 National Association of Realtors® Profile of Home Buyers and Sellers Chapter 3, Page 2 of 26

THE HOME SEARCH PROCESS
Exhibit 3-2SEARCH ACTIVITY OF FIRST-TIME AND REPEAT BUYERS(Median)
First-time Repeat First-time RepeatBuyers Buyers Buyers Buyers
Number of Weeks Searched 8 8 8 8Number of Homes Seen 11 12 8 10
U.S.
Texas U.S.
SEARCH ACTIVITY OF FIRST-TIME AND REPEAT BUYERS(Median)
8
11
8
12
0
2
4
6
8
10
12
Number of Weeks Searched Number of Homes Seen
First-time Buyers Repeat Buyers
Texas
SEARCH ACTIVITY OF FIRST-TIME AND REPEAT BUYERS(Median)
8 88
10
0
2
4
6
8
10
12
Number of Weeks Searched Number of Homes Seen
First-time Buyers Repeat Buyers
U.S.
The 2006 National Association of Realtors® Profile of Home Buyers and Sellers Chapter 3, Page 3 of 26
THE HOME SEARCH PROCESS
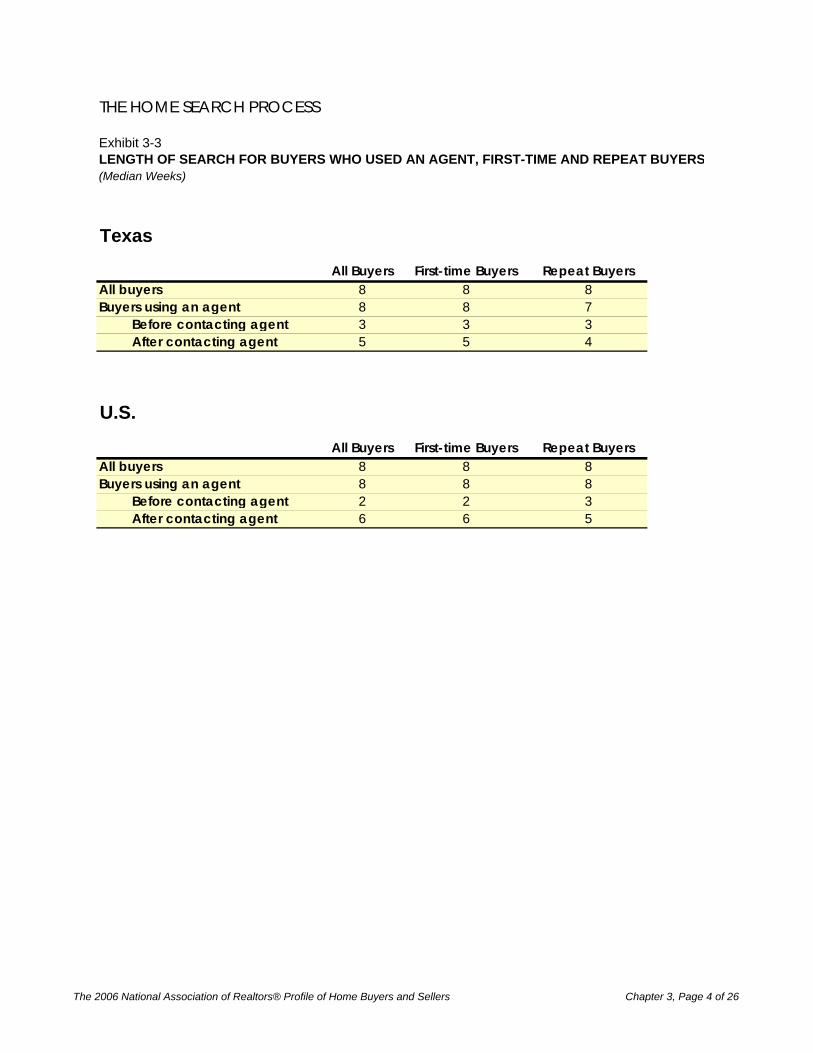
Exhibit 3-3LENGTH OF SEARCH FOR BUYERS WHO USED AN AGENT, FIRST-TIME AND REPEAT BUYERS(Median Weeks)
Texas
All Buyers First-time Buyers Repeat BuyersAll buyers 8 8 8Buyers using an agent 8 8 7
Before contacting agent 3 3 3After contacting agent 5 5 4
U.S.
All Buyers First-time Buyers Repeat BuyersAll buyers 8 8 8Buyers using an agent 8 8 8
Before contacting agent 2 2 3After contacting agent 6 6 5
The 2006 National Association of Realtors® Profile of Home Buyers and Sellers Chapter 3, Page 4 of 26

THE HOME SEARCH PROCESS
Exhibit 3-4INFORMATION SOURCES USED IN HOME SEARCH BY FIRST-TIME AND REPEAT BUYERS(Percent of Respondents)
TexasAll Buyers First-time Buyers Repeat Buyers
Real estate agent 87% 89% 86%Internet 81 82 81Yard sign 61 56 64Print newspaper advertisement 44 41 45Open house 32 26 36Home book or magazine 26 27 25Home builder 43 36 48Television 14 14 14Billboard 11 12 10Relocation company 6 5 5
U.S.All Buyers First-time Buyers Repeat Buyers
Real estate agent 85% 84% 85%Internet 80 83 78Yard sign 63 63 62Print newspaper advertisement 55 54 56Open house 47 44 49Home book or magazine 34 34 33Home builder 26 19 30Television 11 13 10Billboard 9 9 8Relocation company 5 4 6
The 2006 National Association of Realtors® Profile of Home Buyers and Sellers Chapter 3, Page 5 of 26

THE HOME SEARCH PROCESS
Exhibit 3-5USEFULNESS OF INFORMATION SOURCES(Percentage Distribution Among Buyers that Used Each Source)
Texas
Very Useful Somewhat Useful Not UsefulInternet 75% 24% 1%Real estate agent 69 21 10Yard sign 30 40 30Open house 16 25 58Print newspaper advertisement 19 31 50Home builder 26 26 48Home book or magazine 10 20 70Billboard 5 11 84Television 6 13 82Relocation company 3 9 88
U.S.
Very Useful Somewhat Useful Not UsefulInternet 73% 25% 2%Real estate agent 69 20 11Yard sign 31 40 30Open house 22 30 48Print newspaper advertisement 20 37 43Home builder 15 17 68Home book or magazine 11 24 65Billboard 3 9 88Television 3 13 85Relocation company 2 7 91
The 2006 National Association of Realtors® Profile of Home Buyers and Sellers Chapter 3, Page 6 of 26

THE HOME SEARCH PROCESS
Exhibit 3-6USE OF INTERNET TO SEARCH FOR HOMES, BY REGION(Percentage Distribution)
Texas U.S. Northeast Midwest South WestFrequently 62% 59% 63% 61% 57% 56%Occasionally 20 21 19 19 22 25Not at all 19 20 18 19 21 19
Buyers who Purchased a Home in the:
The 2006 National Association of Realtors® Profile of Home Buyers and Sellers Chapter 3, Page 7 of 26

THE HOME SEARCH PROCESS
Exhibit 3-7USE OF INTERNET TO SEARCH FOR HOMES BY FIRST-TIME AND REPEAT BUYERS(Percentage Distribution)
First-time Buyers Repeat Buyers First-time Buyers Repeat BuyersFrequently 62% 61% 62% 57%Occasionally 20% 20% 22% 22%Not at all 18% 19% 17% 22%
0
U.S.
U.S.Texas
USE OF INTERNET TO SEARCH FOR HOMES BY FIRST-TIME AND REPEAT BUYERS
62% 61%
20% 20%18% 19%
0%
10%
20%
30%
40%
50%
60%
70%
80%
First-time Buyers Repeat Buyers
Frequently Occasionally Not at all
Texas
USE OF INTERNET TO SEARCH FOR HOMES BY FIRST-TIME AND REPEAT BUYERS
57%62%
22%22% 22%17%
0%
10%
20%
30%
40%
50%
60%
70%
80%
First-time Buyers Repeat Buyers
Frequently Occasionally Not at all
U.S.
The 2006 National Association of Realtors® Profile of Home Buyers and Sellers Chapter 3, Page 8 of 26

THE HOME SEARCH PROCESS
Exhibit 3-8USE OF INTERNET TO SEARCH FOR HOMES, BY AGE
Frequently Occasionally Frequently Occasionally18-24 66% 18% 69% 18%25-44 71% 16% 69% 18%45-64 55% 27% 49% 27%65 or older 27% 14% 21% 23%
0
U.S.
U.S.Texas
Use of Internet to Search for Homes, by Age
69% 69%
49%
21%
18% 18%
27%
23%
0%
10%
20%
30%
40%
50%
60%
70%
80%
90%
100%
18-24 25-44 45-64 65 or older
Frequently Occasionally
U.S.
Use of Internet to Search for Homes, by Age
66% 71%55%
27%
18%16%
27%
14%
0%
10%
20%
30%
40%
50%
60%
70%
80%
90%
100%
18-24 25-44 45-64 65 or older
Frequently Occasionally
Texas
The 2006 National Association of Realtors® Profile of Home Buyers and Sellers Chapter 3, Page 9 of 26

THE HOME SEARCH PROCESS
Exhibit 3-9USE OF INTERNET TO SEARCH FOR HOMES, 2003-2006
Frequently Occasionally Frequently Occasionally2003 42% 29%2004 53% 24%2005 57% 22%2006 62% 20% 59% 21%
0
U.S.
U.S.Texas
USE OF INTERNET TO SEARCH FOR HOMES
62%
20%
0%
10%
20%
30%
40%
50%
60%
70%
80%
90%
100%
2004 2005 2006
Frequently Occasionally
Texas
USE OF INTERNET TO SEARCH FOR HOMES
42%53% 57% 59%
29%24% 22% 21%
0%
10%
20%
30%
40%
50%
60%
70%
80%
90%
100%
2003 2004 2005 2006
Frequently Occasionally
U.S.
The 2006 National Association of Realtors® Profile of Home Buyers and Sellers Chapter 3, Page 11 of 26

THE HOME SEARCH PROCESS
Exhibit 3-10ACTIONS TAKEN AS A RESULT OF INTERNET HOME SEARCH, FIRST-TIME AND REPEAT BUYERS(Percent of Respondents Among Buyers Who Used the Internet)
Texas
All Buyers
First-time Buyers
Repeat Buyers
Drove by or viewed a home 74% 77% 73%Walked through a home viewed online 64 55 68Requested more information 19 23 17Found agent used to assist in the search or purchase of a home 24 25 24Pre-qualified for a mortgage online 9 10 8Found a mortgage lender online 5 5 5Applied for a mortgage online 8 7 8Contacted builder or developer 17 19 15
U.S.
All Buyers
First-time Buyers
Repeat Buyers
Drove by or viewed a home 74% 75% 73%Walked through a home viewed online 61 58 62Found the agent used to search for or buy a home 23 24 22Requested more information 22 28 19Contacted builder or developer 11 8 13Pre-qualified for a mortgage online 7 8 6Applied for a mortgage online 5 6 4Found a mortgage lender online 4 5 3
The 2006 National Association of Realtors® Profile of Home Buyers and Sellers Chapter 3, Page 13 of 26

THE HOME SEARCH PROCESS
Exhibit 3-11WHERE BUYER FOUND THE HOME THEY PURCHASED, 1997-2006(Percentage Distribution)
Texas
2006Real estate agent 30%Internet 25Yard sign 13Print newspaper advertisement 2Friend, relative or neighbor 9Directly from sellers/Knew the sellers 3Home builder or their agent 17Home book or magazine 1Other --
U.S.
1997 1999 2001 2003 2004 2005 2006Real estate agent 50% 49% 48% 41% 38% 36% 36%Internet 2 4 8 11 15 24 24Yard sign 17 15 15 16 16 15 15Friend, relative or neighbor 9 8 8 7 7 7 8Home builder or their agent 3 4 3 7 7 7 8Print newspaper advertisement 8 8 7 7 5 5 5Directly from sellers/Knew the sellers 4 3 4 4 5 3 3Home book or magazine 3 3 2 1 2 1 1Other * 4 3 6 4 -- --
* Less than one percent
The 2006 National Association of Realtors® Profile of Home Buyers and Sellers Chapter 3, Page 14 of 26

THE HOME SEARCH PROCESS
Exhibit 3-12BUYERS WHO FOUND THEIR HOME ON THE INTERNET, 1997-2006
Year Percentage1997 2%1999 4%2001 8%2003 11%2004 15%2005 24%2006 US 24%
2006 Texas 25%
BUYERS WHO FOUND THEIRHOME ON THE INTERNET, 1997-2006
2%4%
8%
11%
15%
24% 24% 25%
0%
5%
10%
15%
20%
25%
30%
1997 1999 2001 2003 2004 2005 2006 2006
U.S. Texas
The 2006 National Association of Realtors® Profile of Home Buyers and Sellers Chapter 3, Page 15 of 26

THE HOME SEARCH PROCESS
Exhibit 3-13 Exhibit 3-13CHARACTERISTICS OF HOME SEARCHERS, BY USE OF INTERNET CHARACTERISTICS OF HOME SEARCHERS, BY USE OF INTERNET(Percentage Distribution) (Percentage Distribution)
Texas U.S.
Household CompostionUsed Internet to
SearchDid Not Use
Internet to Search Household CompostionUsed Internet to
SearchDid Not Use
Internet to SearchMarried couple 68% 66% Married couple 63% 54%Single female 20 26 Single female 20 26Single male 5 1 Single male 9 12Unmarried couple 5 7 Unmarried couple 7 7Other 2 * Other 1 1
Age of Buyer HouseholdUsed Internet to
SearchDid Not Use
Internet to Search Age of Buyer HouseholdUsed Internet to
SearchDid Not Use
Internet to SearchLess than 25 years 4% 3% Less than 25 years 5% 3%25 - 34 years 34 19 25 - 34 years 34 1735 - 44 years 25 20 35 - 44 years 26 1845 - 54 years 23 19 45 - 54 years 19 2155 - 64 years 10 15 55 - 64 years 11 1965 - 74 years 3 19 65 - 74 years 4 1575 years or older 1 5 75 years or older 1 8Median age (years) 39 49 Median age (years) 39 51
Household Income (2005)Used Internet to
SearchDid Not Use
Internet to Search Household Income (2005)Used Internet to
SearchDid Not Use
Internet to SearchLess than $25,000 4% 7% Less than $25,000 3% 7%$25,000 - $34,999 5 9 $25,000 - $34,999 8 11$35,000 - $44,999 5 14 $35,000 - $44,999 8 13$45,000 - $54,999 10 13 $45,000 - $54,999 10 12$55,000 - $64,999 9 5 $55,000 - $64,999 11 11$65,000 - $74,999 14 14 $65,000 - $74,999 11 10$75,000 - $84,999 11 4 $75,000 - $84,999 10 7$85,000 - $99,999 10 8 $85,000 - $99,999 10 7$100,000 - $124,999 13 14 $100,000 - $124,999 12 9$125,000 - $149,999 8 2 $125,000 - $149,999 7 4$150,000 - $174,999 5 3 $150,000 - $174,999 4 2$175,000 - $199,999 3 1 $175,000 - $199,999 2 1$200,000 or more 3 6 $200,000 or more 5 5Median income $77,600 $66,200 Median income $74,300 $61,000
* Less than one percent
The 2006 National Association of Realtors® Profile of Home Buyers and Sellers Chapter 3, Page 16 of 26

THE HOME SEARCH PROCESS
Exhibit 3-14LENGTH OF SEARCH, BY USE OF INTERNET(Median Weeks)
Texas
Used Internet to Search
Did Not Use Internet to Search
All buyers 8 6First-time buyers 8 6Repeat buyers 8 8
Buyers using an agent 8 5Before contacting agent 3 2After contacting agent 5 3
U.S.
Used Internet to Search
Did Not Use Internet to Search
All buyers 8 6First-time buyers 10 6Repeat buyers 8 5
Buyers using an agent 8 6Before contacting agent 2 3After contacting agent 6 3
The 2005 National Association of Realtors® Profile of Home Buyers and Sellers Chapter 4, Page 17 of 26

THE HOME SEARCH PROCESS
Exhibit 3-15NUMBER OF HOMES VISITED, BY USE OF INTERNET(Percentage Distribution)
Texas
Used Internet to Search
Did Not Use Internet to Search
None 2% 9%1 to 4 13 225 to 9 24 3010 to 14 18 2015 to 19 13 720 to 24 10 625 or more 21 5Median 12 8
U.S.
Used Internet to Search
Did Not Use Internet to Search
None 3% 18%1 to 4 17 275 to 9 26 2310 to 14 20 1515 to 19 11 620 to 24 7 525 or more 15 6Median 11 6
The 2006 National Association of Realtors® Profile of Home Buyers and Sellers Chapter 3, Page 18 of 26

THE HOME SEARCH PROCESS
Exhibit 3-16INFORMATION SOURCES USED IN HOME SEARCH, BY USE OF INTERNET(Percent of Respondents)
Texas
Used Internet to Search
Did Not Use Internet to Search
Real estate agent 88% 80%Yard sign 62 53Print newspaper advertisement 43 46Open house 32 28Home book or magazine 27 20Home builder 41 54Television 16 3Billboard 11 9Relocation company 6 3
U.S.
Used Internet to Search
Did Not Use Internet to Search
Real estate agent 87% 74%Yard sign 64 52Print newspaper advertisement 57 45Open house 49 36Home book or magazine 35 27Home builder 25 30Television 11 9Billboard 8 9Relocation company 5 3
The 2006 National Association of Realtors® Profile of Home Buyers and Sellers Chapter 3, Page 19 of 26

THE HOME SEARCH PROCESS
Exhibit 3-17WHERE BUYERS FOUND THE HOME THEY PURCHASED, BY USE OF INTERNET(Percentage Distribution)
Texas
Used Internet to Search
Did Not Use Internet to Search
Real estate agent 33% 20%Internet 29 N/AYard sign 13 16Friend, relative or neighbor 6 19Print newspaper advertisement 2 4Directly from sellers/Knew the sellers 1 8Home builder or their agent 15 28Home book or magazine * 2
* Less than one percent
U.S.
Used Internet to Search
Did Not Use Internet to Search
Real estate agent 35% 38%Internet 29 2Yard sign 15 15Home builder or their agent 7 11Friend, relative or neighbor 6 17Print newspaper advertisement 5 7Directly from sellers/Knew the sellers 2 7Home book or magazine 1 2
The 2006 National Association of Realtors® Profile of Home Buyers and Sellers Chapter 3, Page 20 of 26

THE HOME SEARCH PROCESS
Exhibit 3-18METHOD OF HOME PURCHASE, BY USE OF INTERNET(Percentage Distribution)
Texas
Used Internet to Search
Did Not Use Internet to Search
Through a real estate agent/broker 83% 58%Directly from builder or builder's agent 13 30Directly from previous owner whom buyer didn't know 3 3Directly from previous owner whom buyer knew 1 7Foreclosure or trustee sale * *Other * 2
U.S.
Used Internet to Search
Did Not Use Internet to Search
Through a real estate agent/broker 81% 63%Directly from builder or builder's agent 10 21Directly from previous owner whom buyer didn't know 5 5Directly from previous owner whom buyer knew 2 10Foreclosure or trustee sale 1 *Other 1 1
* Less than one percent
The 2006 National Association of Realtors® Profile of Home Buyers and Sellers Chapter 3, Page 21 of 26

THE HOME SEARCH PROCESS
Exhibit 3-19WHAT HOME BUYERS WERE LOOKING FOR ONLINE, FIRST-TIME AND REPEAT BUYERS(Percent of Respondents Among Buyers Who Used the Internet)
Texas
All Buyers First-time Buyers Repeat BuyersProperties for sale 94% 95% 94%General information about an area 25 29 23A real estate company 3 1 5A real estate agent 1 1 2
U.S.
All Buyers First-time Buyers Repeat BuyersProperties for sale 96% 97% 95%General information about an area 21 19 22A real estate company 3 3 3A real estate agent 3 3 3
The 2006 National Association of Realtors® Profile of Home Buyers and Sellers Chapter 3, Page 22 of 26

THE HOME SEARCH PROCESS
Exhibit 3-20WHAT HOME BUYERS WERE LOOKING FOR ONLINE, BY AGE(Percent of Respondents Among Buyers Who Used the Internet)
Texas
All Buyers 18-24 25-44 45-64 65 or olderProperties for sale 94% 99% 94% 95% 99%General information about an area 25 22 25 24 22A real estate company 3 * 4 2 *A real estate agent 1 10 2 * 1
* Less than one percent
U.S.
All Buyers 18-24 25-44 45-64 65 or olderProperties for sale 96% 97% 97% 94% 88%General information about an area 21 14 21 22 20A real estate company 3 2 3 3 2A real estate agent 3 3 3 3 3
Age
Age
The 2006 National Association of Realtors® Profile of Home Buyers and Sellers Chapter 3, Page 23 of 26

THE HOME SEARCH PROCESS
Exhibit 3-21VALUE OF WEB SITE FEATURES(Percentage Distribution Among Buyers Who Used the Internet)
Texas
Very Useful
Somewhat Useful
Not Useful
Did Not Use
Photos 87% 10% 2% 1%Detailed property information 82 17 1 *Virtual tours 62 30 5 3Interactive maps 50 35 10 5Neighborhood information 46 36 10 8Real estate agent contact information 31 33 14 22
* Less than one percent
U.S.
Very Useful
Somewhat Useful
Not Useful
Did Not Use
Photos 83% 15% 1% 1%Detailed property information 81 17 1 1Virtual tours 60 28 6 6Interactive maps 43 38 9 10Neighborhood information 37 44 10 9Real estate agent contact information 31 37 13 19
The 2006 National Association of Realtors® Profile of Home Buyers and Sellers Chapter 3, Page 24 of 26

THE HOME SEARCH PROCESS
Exhibit 3-22WEB SITES USED IN HOME SEARCH, BY REGION(Percent of Respondents Among Buyers Who Used the Internet)
Texas U.S. Northeast Midwest South WestMultiple Listing Services (MLS) Web site 49% 53% 56% 49% 52% 58%REALTOR.com® 51 52 56 52 53 46Real estate company Web site 36 41 44 48 41 32Real estate agent Web site 34 40 42 42 40 38Newspaper Web site 12 14 17 13 13 14Real estate magazine Web site 5 6 6 4 7 7Other 18 10 6 8 12 10
Buyers who Purchased a Home in the:
The 2006 National Association of Realtors® Profile of Home Buyers and Sellers Chapter 3, Page 25 of 26

THE HOME SEARCH PROCESS
Exhibit 3-23WEB SITES USED IN HOME SEARCH BY FIRST-TIME AND REPEAT BUYERS(Percent of Respondents Among Buyers Who Used the Internet)
Texas
All BuyersFirst-time
BuyersRepeat Buyers
Multiple Listing Services (MLS) Web site 49% 50% 49%REALTOR.com® 51 47 53Real estate company Web site 36 28 40Real estate agent Web site 34 34 34Newspaper Web site 12 13 11Real estate magazine Web site 5 4 6Other 18 20 17
U.S.
All BuyersFirst-time
BuyersRepeat Buyers
Multiple Listing Services (MLS) Web site 53% 54% 53%REALTOR.com® 52 46 55Real estate company Web site 41 43 40Real estate agent Web site 40 41 40Newspaper Web site 14 16 12Real estate magazine Web site 6 7 6Other 10 9 10
The 2006 National Association of Realtors® Profile of Home Buyers and Sellers Chapter 3, Page 26 of 26

HOME BUYING AND REAL ESTATE PROFESSIONALS
Exhibit 4-1 METHOD OF HOME PURCHASE, 1995-2006Exhibit 4-2 METHOD OF HOME PURCHASE, BY REGIONExhibit 4-3 METHOD OF HOME PURCHASE, NEW AND PREVIOUSLY OWNED HOMESExhibit 4-4 AGENT REPRESENTATION DISCLOSURE, FIRST-TIME AND REPEAT BUYERSExhibit 4-5 BUYER REPRESENTATIVE ARRANGEMENT WITH AGENT, FIRST-TIME AND REPEAT BUYERSExhibit 4-6 HOW REAL ESTATE AGENT WAS COMPENSATEDExhibit 4-7 WHAT BUYERS WANT MOST FROM REAL ESTATE AGENTSExhibit 4-8 WHAT BUYERS WANT MOST FROM REAL ESTATE AGENTS, FIRST-TIME AND REPEAT BUYERSExhibit 4-9 NUMBER OF REAL ESTATE AGENTS USED IN THE HOME SEARCHExhibit 4-10 BENEFITS PROVIDED BY REAL ESTATE AGENT DURING HOME PURCHASE PROCESS, FIRST-TIME AND
REPEAT BUYERSExhibit 4-11 HOW BUYER FOUND REAL ESTATE AGENT, FIRST-TIME AND REPEAT BUYERSExhibit 4-12 NUMBER OF REAL ESTATE AGENTS INTERVIEWED BY FIRST-TIME AND REPEAT BUYERSExhibit 4-13 MOST IMPORTANT FACTORS WHEN CHOOSING AN AGENTExhibit 4-14 IMPORTANCE OF REAL ESTATE AGENT SKILLS AND QUALITIESExhibit 4-15 AGENT SKILLS AND QUALITIES CONSIDERED 'VERY IMPORTANT' BY FIRST-TIME AND REPEAT BUYERSExhibit 4-16 SATISFACTION WITH REAL ESTATE AGENT SKILLS AND QUALITIESExhibit 4-17 WOULD BUYER USE REAL ESTATE AGENT AGAIN OR RECOMMEND TO OTHERS

HOME BUYING AND REAL ESTATE PROFESSIONALS
Exhibit 4-1METHOD OF HOME PURCHASE, 1995-2006(Percentage Distribution)
Texas
2006Through a real estate agent or broker 79%Directly from builder or builder's agent 16Directly from the previous owner 5Through a foreclosure or trustee sale *
U.S.
1995 1997 1999 2001 2003 2004 2005 2006Through a real estate agent or broker 81% 79% 79% 69% 75% 77% 77% 77%Directly from builder or builder's agent 9 9 11 15 14 12 12 13Directly from the previous owner 9 11 9 15 9 9 9 9Through a foreclosure or trustee sale 1 1 1 1 1 1 * 1
*Less than one percent
The 2006 National Association of Realtors® Profile of Home Buyers and Sellers Chapter 4, Page 2 of 18

HOME BUYING AND REAL ESTATE PROFESSIONALS
Exhibit 4-2METHOD OF HOME PURCHASE, BY REGION(Percentage Distribution)
U.S. Northeast Midwest South WestThrough a real estate agent or broker 79% 77% 82% 77% 75% 78%Directly from builder or builder's agent 16 13 7 13 14 15Directly from the previous owner 5 9 9 10 10 6 Knew previous owner 2 4 5 4 4 4 Did not know previous owner 3 5 5 6 6 3Through a foreclosure or trustee sale * 1 1 * 1 *
*Less than one percent
Buyers who Purchased a Home in the:
Texas
The 2006 National Association of Realtors® Profile of Home Buyers and Sellers Chapter 4, Page 3 of 18

HOME BUYING AND REAL ESTATE PROFESSIONALS
Exhibit 4-3METHOD OF HOME PURCHASE, NEW AND PREVIOUSLY OWNED HOMES(Percentage Distribution)
Texas
All Buyers New HomePreviously
Owned HomeThrough a real estate agent or broker 79% 55% 89%Directly from builder or builder's agent 16 45 3Directly from the previous owner 5 * 7 Knew previous owner 2 * 3 Did not know previous owner 3 * 4Through a foreclosure or trustee sale * * *
U.S.
All Buyers New HomePreviously
Owned HomeThrough a real estate agent or broker 77% 47% 86%Directly from builder or builder's agent 13 52 2Directly from the previous owner 9 1 11 Knew previous owner 4 * 5 Did not know previous owner 5 1 6Through a foreclosure or trustee sale 1 * 1
*Less than one percent
Buyers who Purchased a:
Buyers who Purchased a:
The 2006 National Association of Realtors® Profile of Home Buyers and Sellers Chapter 4, Page 4 of 18

HOME BUYING AND REAL ESTATE PROFESSIONALS
Exhibit 4-4AGENT REPRESENTATION DISCLOSURE, FIRST-TIME AND REPEAT BUYERS(Percentage Distribution)
Texas
Disclosure Statement Signed? All Buyers First-time Buyers Repeat BuyersYes, at first meeting 35% 28% 38%Yes, when contract was written 21 18 23Yes, at some other time 10 13 8No 19 25 16Don't know 15 16 15
U.S.
Disclosure Statement Signed? All Buyers First-time Buyers Repeat BuyersYes, at first meeting 30% 26% 32%Yes, when contract was written 26 26 26Yes, at some other time 8 9 8No 20 23 18Don't know 16 16 16
The 2006 National Association of Realtors® Profile of Home Buyers and Sellers Chapter 4, Page 5 of 18

HOME BUYING AND REAL ESTATE PROFESSIONALS
Exhibit 4-5BUYER REPRESENTATIVE ARRANGEMENT WITH AGENT, FIRST-TIME AND REPEAT BUYERS(Percentage Distribution)
Texas
All Buyers First-time Buyers Repeat BuyersYes, a written arrangement 43% 43% 43%Yes, an oral arrangement 27 30 25No 19 12 23Don't know 11 15 9
U.S.
All Buyers First-time Buyers Repeat BuyersYes, a written arrangement 44% 41% 45%Yes, an oral arrangement 20 22 18No 26 24 26Don't know 11 12 10
The 2006 National Association of Realtors® Profile of Home Buyers and Sellers Chapter 4, Page 6 of 18
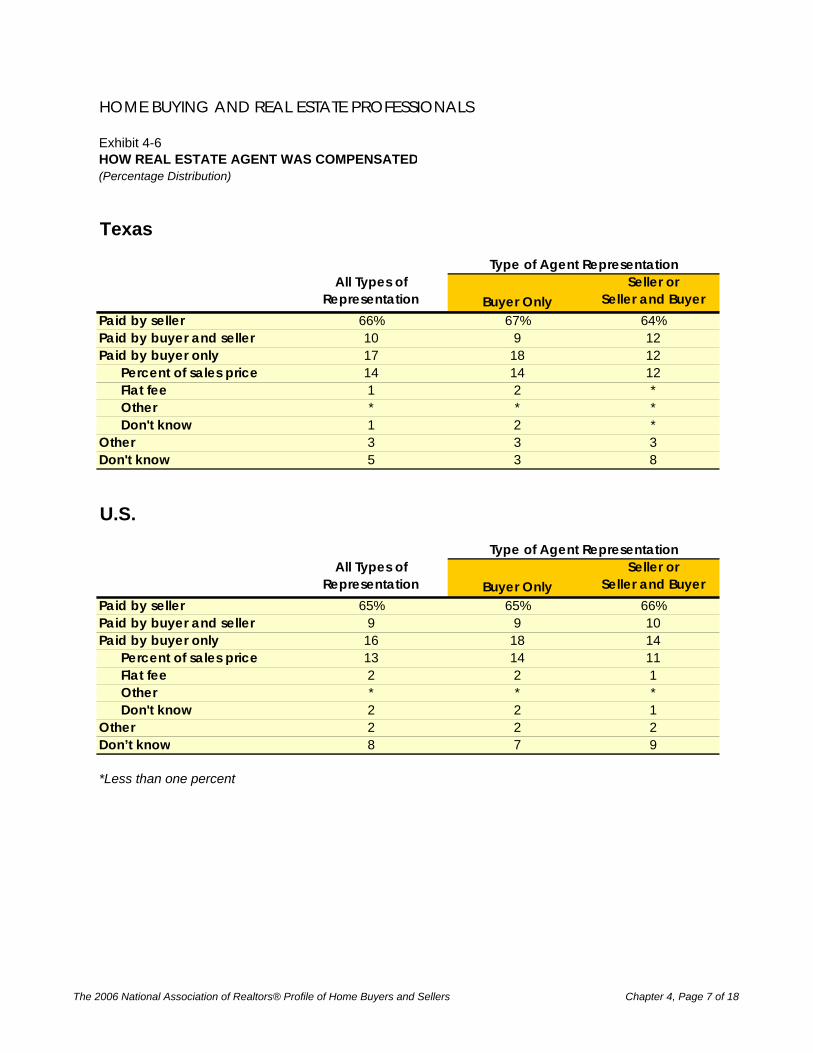
HOME BUYING AND REAL ESTATE PROFESSIONALS
Exhibit 4-6HOW REAL ESTATE AGENT WAS COMPENSATED(Percentage Distribution)
Texas
All Types of Representation Buyer Only
Seller or Seller and Buyer
Paid by seller 66% 67% 64%Paid by buyer and seller 10 9 12Paid by buyer only 17 18 12
Percent of sales price 14 14 12Flat fee 1 2 *Other * * *Don't know 1 2 *
Other 3 3 3Don't know 5 3 8
U.S.
All Types of Representation Buyer Only
Seller or Seller and Buyer
Paid by seller 65% 65% 66%Paid by buyer and seller 9 9 10Paid by buyer only 16 18 14
Percent of sales price 13 14 11Flat fee 2 2 1Other * * *Don't know 2 2 1
Other 2 2 2Don’t know 8 7 9
*Less than one percent
Type of Agent Representation
Type of Agent Representation
The 2006 National Association of Realtors® Profile of Home Buyers and Sellers Chapter 4, Page 7 of 18

HOME BUYING AND REAL ESTATE PROFESSIONALS
Exhibit 4-7WHAT BUYERS WANT MOST FROM REAL ESTATE AGENTS(Percentage Distribution)
Texas U.S.Help find the right home to purchase 51% 50%Help buyer negotiate the terms of sale 12% 13%Determine what comparable homes were selling for 8% 10%Help with the price negotiations 9% 9%Help with paperwork 7% 8%Help determining how much buyer can afford to spend on a home 5% 5%Help find and arrange financing 5% 3%Other 3% 2%
WHAT BUYERS WANT MOST FROM REAL ESTATE PROFESSIONALS
(Percentage Distribution)
Other, 3%
Help find and arrange financing, 5%
Help buyer negotiate the terms of sale, 12%
Help determining how much buyer can afford to spend on a home,
5%
Help with paperwork, 7%
Determine what comparable homes were selling for, 8%
Help with the price negotiations, 9%
Help find the right home to purchase,
51%
Texas
WHAT BUYERS WANT MOST FROM REAL ESTATEPROFESSIONALS
(Percentage Distribution)
Help find the right home to purchase,
50%
Help with the price negotiations, 9%
Help with paperwork, 8%
Help determining how much buyer can afford to spend on a home,
5%
Other, 2%Help find and arrange financing, 3%
Determine what comparable homes
were selling for, 10% Help buyer negotiate the terms of sale, 13%
U.S.
The 2006 National Association of Realtors® Profile of Home Buyers and Sellers Chapter 4, Page 8 of 18

HOME BUYING AND REAL ESTATE PROFESSIONALS
Exhibit 4-8WHAT BUYERS WANT MOST FROM REAL ESTATE AGENTS, FIRST-TIME AND REPEAT BUYERS(Percentage Distribution)
Texas
All BuyersFirst time Buyers
Repeat Buyers
Help find the right home to purchase 51% 41% 57%Help buyer negotiate the terms of sale 12 12 12Determine what comparable homes were selling for 8 9 8Help with the price negotiations 9 15 7Help with paperwork 7 6 8Help determining how much buyer can afford to spend on a home 5 7 3Help find and arrange financing 5 6 4Other 3 4 2
U.S.
All BuyersFirst time Buyers
Repeat Buyers
Help find the right home to purchase 50% 45% 53%Help buyer negotiate the terms of sale 13 13 13Determine what comparable homes were selling for 10 8 11Help with the price negotiations 9 9 8Help with paperwork 8 9 8Help determining how much buyer can afford to spend on a home 5 9 3Help find and arrange financing 3 4 2Help find renters for buyer's property * 1 *Other 2 3 2
*Less than one percent
The 2006 National Association of Realtors® Profile of Home Buyers and Sellers Chapter 4, Page 9 of 18

HOME BUYING AND REAL ESTATE PROFESSIONALS
Exhibit 4-9NUMBER OF REAL ESTATE AGENTS USED IN THE HOME SEARCH(Percentage Distribution)
Texas
One 82%Two 15%Three 2%Four 1%Five or More 1%
U.S.
One 77%Two 16%Three 4%Four 1%Five or More 2%
THE NUMBER OF REAL ESTATE AGENTS USED IN THEHOME SEARCH
(Percentage Distribution)
One, 82%
Two, 15%
Three, 2%Five or More, 1%
Four, 1%
Texas
THE NUMBER OF REAL ESTATE AGENTS USED IN THEHOME SEARCH
(Percentage Distribution)
One, 77%
Two, 16%
Three, 4%Five or More, 2%Four, 1%
U.S.
The 2006 National Association of Realtors® Profile of Home Buyers and Sellers Chapter 4, Page 10 of 18

HOME BUYING AND REAL ESTATE PROFESSIONALS
Exhibit 4-10
(Percent of Respondents)
Texas
All Buyers First-time Buyers Repeat BuyersHelped buyer understand the process 55% 78% 42%Pointed out unnoticed features/faults with property 40 49 36Improved buyer's knowledge of search areas 38 35 40Negotiated better sales contract terms 41 42 40Shortened buyer's home search 32 28 35Negotiated a better price 26 32 22Narrowed buyer's search area 24 16 29Expanded buyer's search area 19 21 18Provided better list of mortgage lenders 21 21 21None of the above 8 6 9Provided a better list of service providers * * *
*Less than one percent
U.S.
All Buyers First-time Buyers Repeat BuyersHelped buyer understand the process 55% 73% 44%Pointed out unnoticed features/faults with property 40 42 39Improved buyer's knowledge of search areas 37 32 39Negotiated better sales contract terms 36 38 35Shortened buyer's home search 35 33 37Negotiated a better price 29 31 28Narrowed buyer's search area 20 17 22Expanded buyer's search area 20 19 21Provided better list of mortgage lenders 19 21 17None of the above 9 9 9Provided a better list of service providers 1 1 1
BENEFITS PROVIDED BY REAL ESTATE AGENT DURING HOME PURCHASE PROCESS, FIRST-TIME AND REPEAT BUYERS
The 2006 National Association of Realtors® Profile of Home Buyers and Sellers Chapter 4, Page 11 of 18

HOME BUYING AND REAL ESTATE PROFESSIONALS
Exhibit 4-11HOW BUYER FOUND REAL ESTATE AGENT, FIRST-TIME AND REPEAT BUYERS(Percentage Distribution)
Texas
All BuyersFirst-time
BuyersRepeat Buyers
Referred by (or is) a friend, neighbor or relative 48% 60% 42%Used agent previously to buy or sell a home 8 1 12Internet Web site 9 9 9Visited an open house and met agent 2 2 3Saw contact information on For Sale sign 7 7 7Referred by another real estate agent/broker 5 6 5Walked into or called office and agent was on duty 4 3 4Referred through employer or relocation company 7 5 8Personal contact by agent (telephone, email, etc.) 2 1 3Newspaper, Yellow Pages or home book ad 2 3 1Direct mail (newsletter, flyer, postcard, etc.) * * 1Advertising specialty (calendar, magnet, etc.) * * *Other 5 4 6
U.S.
All BuyersFirst-time
BuyersRepeat Buyers
Referred by (or is) a friend, neighbor or relative 40% 49% 35%Used agent previously to buy or sell a home 13 2 19Internet Web site 7 8 7Visited an open house and met agent 7 6 7Saw contact information on For Sale sign 7 8 6Referred by another real estate agent/broker 5 6 5Walked into or called office and agent was on duty 4 4 4Referred through employer or relocation company 4 2 5Personal contact by agent (telephone, email, etc.) 3 3 3Newspaper, Yellow Pages or home book ad 2 2 1Direct mail (newsletter, flyer, postcard, etc.) * * *Advertising specialty (calendar, magnet, etc.) * 1 *Other 7 8 6
*Less than one percent
The 2006 National Association of Realtors® Profile of Home Buyers and Sellers Chapter 4, Page 12 of 18

HOME BUYING AND REAL ESTATE PROFESSIONALS
Exhibit 4-12NUMBER OF REAL ESTATE AGENTS INTERVIEWED BY FIRST-TIME AND REPEAT BUYERS(Percentage Distribution)
Texas
All Buyers First-time Buyers Repeat BuyersOne 67% 67% 67%Two 18 16 20Three 10 14 8Four 3 2 3Five or more 1 1 2
U.S.
All Buyers First-time Buyers Repeat BuyersOne 65% 60% 69%Two 20 23 18Three 10 11 9Four 2 3 2Five or more 3 3 3
The 2006 National Association of Realtors® Profile of Home Buyers and Sellers Chapter 4, Page 13 of 18

HOME BUYING AND REAL ESTATE PROFESSIONALS
Exhibit 4-13MOST IMPORTANT FACTORS WHEN CHOOSING AN AGENT(Percentage Distribution)
Texas U.S.Agent is honest and trustworthy 22% 25%Reputation of agent 24% 23%Agent is friend or family member 14% 16%Agent's knowledge of the neighborhood 17% 13%Agent has caring personality/good listener 14% 12%Agent's association with a particular firm 4% 4%Professional designations held by agent 1% 1%Other 4% 5%
MOST IMPORTANT FACTORS IN CHOOSING AN AGENT(Percentage Distribution)
Other, 4%
Professional designations held
by agent, 1%
Agent's association with a particular
firm, 4%
Agent has caring personality/good
listener, 14%
Reputation of agent, 24%Agent is friend or
family member, 14%
Agent's knowledge of the
neighborhood, 17%
Agent is honest and trustworthy, 22%
Texas
MOST IMPORTANT FACTORS IN CHOOSING AN AGENT(Percentage Distribution)
Other, 5%
Professional designations held
by agent, 1%Agent's association
with a particular firm, 4%
Agent has caring personality/good
listener, 12%
Agent is honest and trustworthy, 25%
Agent's knowledge of the
neighborhood, 13%
Agent is friend or family member,
16%
Reputation of agent, 23%
U.S.
The 2006 National Association of Realtors® Profile of Home Buyers and Sellers Chapter 4, Page 14 of 18

HOME BUYING AND REAL ESTATE PROFESSIONALS
Exhibit 4-14IMPORTANCE OF REAL ESTATE AGENT SKILLS AND QUALITIES(Percentage Distribution)
Texas
Very Important
Somewhat Important
Not Important
Honesty and integrity 98% 2% *Knowledge of purchase process 95 5 1Responsiveness 96 4 *Knowledge of real estate market 92 8 *Communication skills 86 14 *Negotiation skills 86 13 1People skills 79 20 1Knowledge of local area 80 19 1Skills with technology 34 53 13
U.S.
Very Important
Somewhat Important
Not Important
Honesty and integrity 97% 3% *Knowledge of purchase process 93 6 1Responsiveness 92 7 *Knowledge of real estate market 91 9 *Communication skills 83 16 1Negotiation skills 81 17 1People skills 78 20 1Knowledge of local area 76 22 2Skills with technology 39 50 12
*Less than one percent
The 2006 National Association of Realtors® Profile of Home Buyers and Sellers Chapter 4, Page 15 of 18

HOME BUYING AND REAL ESTATE PROFESSIONALS
Exhibit 4-15
(Percentage Distribution)
Texas
All BuyersFirst-time
BuyersRepeat Buyers
Honesty and integrity 98% 96% 99%Knowledge of purchase process 95 98 93Responsiveness 96 99 94Knowledge of real estate market 92 91 92Communication skills 86 87 85Negotiation skills 86 88 84People skills 79 83 77Knowledge of local area 80 73 83Skills with technology 34 35 33
U.S.
All BuyersFirst-time
BuyersRepeat Buyers
Honesty and integrity 97% 96% 97%Knowledge of purchase process 93 95 93Responsiveness 92 93 92Knowledge of real estate market 91 88 92Communication skills 83 84 82Negotiation skills 81 83 80People skills 78 78 78Knowledge of local area 76 69 80Skills with technology 39 36 40
AGENT SKILLS AND QUALITIES CONSIDERED 'VERY IMPORTANT' BY FIRST-TIME AND REPEAT BUYERS
The 2006 National Association of Realtors® Profile of Home Buyers and Sellers Chapter 4, Page 16 of 18

HOME BUYING AND REAL ESTATE PROFESSIONALS
Exhibit 4-16SATISFACTION WITH REAL ESTATE AGENT SKILLS AND QUALITIES(Percentage Distribution)
Texas
Very Satisfied Somewhat Satisfied Not SatisfiedKnowledge of purchase process 81% 15% 3%Honesty and integrity 79 15 7Knowledge of real estate market 79 17 4People skills 75 21 4Responsiveness 78 14 8Knowledge of local area 76 18 6Communication skills 74 20 6Skills with technology 70 24 7Negotiation skills 69 19 12
U.S.
Very Satisfied Somewhat Satisfied Not SatisfiedKnowledge of purchase process 84% 13% 2%Honesty and integrity 83 12 5Knowledge of real estate market 81 16 3People skills 80 17 4Responsiveness 80 16 5Knowledge of local area 78 19 3Communication skills 77 18 5Skills with technology 70 26 4Negotiation skills 70 22 8
The 2006 National Association of Realtors® Profile of Home Buyers and Sellers Chapter 4, Page 17 of 18

HOME BUYING AND REAL ESTATE PROFESSIONALS
Exhibit 4-17WOULD BUYER USE REAL ESTATE AGENT AGAIN OR RECOMMEND TO OTHERS(Percent distribution)
Texas
Definitely 62%Probably 20%Probably Not 9%Definitely Not 8%Don't Know 1%
U.S.
Definitely 66%Probably 19%Probably Not 6%Definitely Not 7%Don't Know 2%
WOULD BUYER USE ESTATE AGENT AGAIN OR RECOMMEND TO OTHERS
(Percentage Distribution)
62%
20%
9% 8%
1%0%
10%
20%
30%
40%
50%
60%
70%
Definitely Probably Probably Not Definitely Not Don't Know
Texas
WOULD BUYER USE ESTATE AGENT AGAIN OR RECOMMEND TO OTHERS
(Percentage Distribution)
2%7%6%
19%
66%
0%
10%
20%
30%
40%
50%
60%
70%
Definitely Probably Probably Not Definitely Not Don't Know
U.S
The 2006 National Association of Realtors® Profile of Home Buyers and Sellers Chapter 4, Page 18 of 18

FINANCING THE HOME PURCHASE
Exhibit 5-1 BUYERS WHO FINANCED THEIR HOME PURCHASE, BY REGIONExhibit 5-2 BUYERS WHO FINANCED THEIR HOME PURCHASE, BY AGEExhibit 5-3 PERCENT OF HOME FINANCED BY FIRST-TIME AND REPEAT BUYERSExhibit 5-4 PERCENT OF HOME FINANCED, BY REGIONExhibit 5-5 SOURCES OF DOWNPAYMENT, FIRST-TIME AND REPEAT BUYERSExhibit 5-6 TYPE OF MORTGAGE, FIRST-TIME AND REPEAT BUYERSExhibit 5-7 HOME PURCHASE IS A GOOD FINANCIAL INVESTMENT, FIRST-TIME AND REPEAT BUYERS

FINANCING THE HOME PURCHASE
Exhibit 5-1BUYERS WHO FINANCED THEIR HOME PURCHASE, BY REGION(Percent of Respondents)
U.S. Northeast Midwest South WestAll Buyers 99% 92% 90% 94% 92% 93%
First-time Buyers 100 98 98 99 97 98Repeat Buyers 98 89 85 90 90 91
Buyers who Purchased a Home in the:Texas
The 2006 National Association of Realtors® Profile of Home Buyers and Sellers Chapter 5, Page 2 of 8

FINANCING THE HOME PURCHASE
Exhibit 5-2BUYERS WHO FINANCED THEIR HOME PURCHASE, BY AGE(Percent of Respondents)
Texas
All Buyers 99%18-24 100%25-44 99%45-64 100%65 or older 89%
U.S.
All Buyers 92%18-24 99%25-44 99%45-64 90%65 or older 58%
BUYERS WHO FINANCED THEIR HOME PURCHASE, BY AGE
99%100%
99%100%
89%
80%
100%
All Buyers 18-24 25-44 45-64 65 or older
Texas
BUYERS WHO FINANCED THEIR HOME PURCHASE, BY AGE
92%99% 99%
90%
58%
0%
20%
40%
60%
80%
100%
All Buyers 18-24 25-44 45-64 65 or older
Age
U.S.
Age
The 2006 National Association of Realtors® Profile of Home Buyers and Sellers Chapter 5, Page 3 of 8
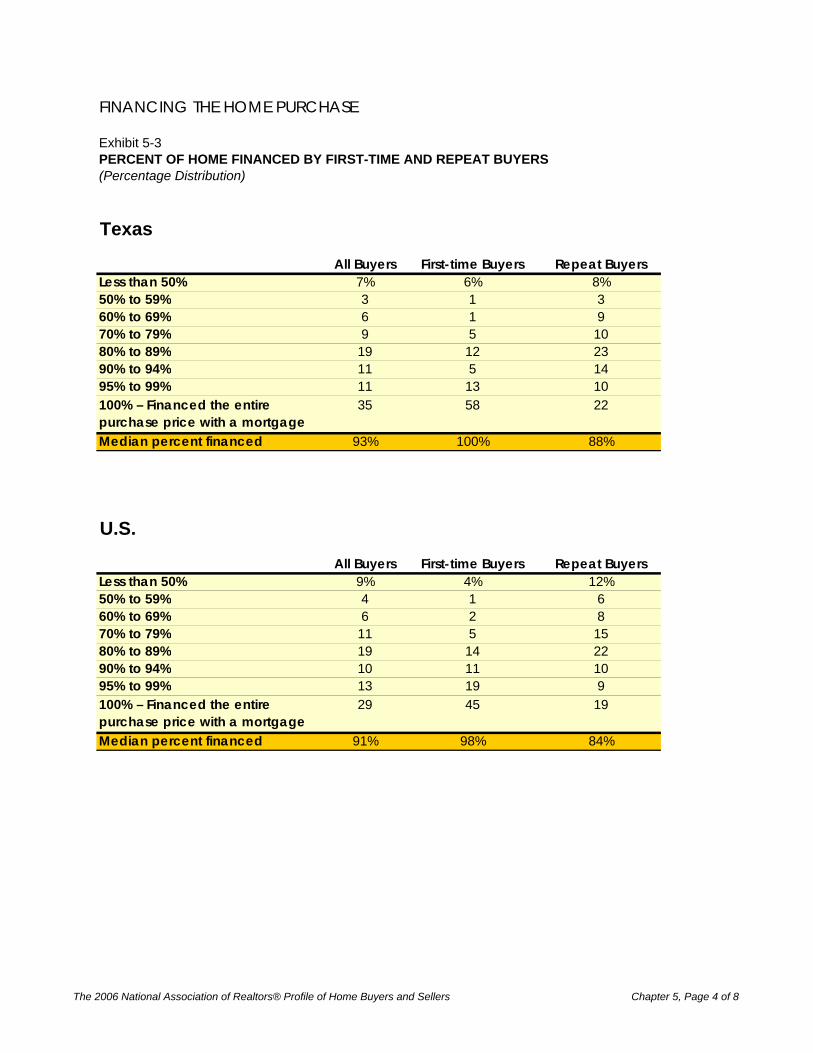
FINANCING THE HOME PURCHASE
Exhibit 5-3PERCENT OF HOME FINANCED BY FIRST-TIME AND REPEAT BUYERS(Percentage Distribution)
Texas
All Buyers First-time Buyers Repeat BuyersLess than 50% 7% 6% 8%50% to 59% 3 1 360% to 69% 6 1 970% to 79% 9 5 1080% to 89% 19 12 2390% to 94% 11 5 1495% to 99% 11 13 10100% – Financed the entire purchase price with a mortgage
35 58 22
Median percent financed 93% 100% 88%
U.S.
All Buyers First-time Buyers Repeat BuyersLess than 50% 9% 4% 12%50% to 59% 4 1 660% to 69% 6 2 870% to 79% 11 5 1580% to 89% 19 14 2290% to 94% 10 11 1095% to 99% 13 19 9100% – Financed the entire purchase price with a mortgage
29 45 19
Median percent financed 91% 98% 84%
The 2006 National Association of Realtors® Profile of Home Buyers and Sellers Chapter 5, Page 4 of 8

FINANCING THE HOME PURCHASE
Exhibit 5-4PERCENT OF HOME FINANCED, BY REGION(Median)
U.S. Northeast Midwest South WestAll Buyers 93% 91% 87% 92% 93% 88%First-time Buyers 100% 98% 96% 98% 100% 99%Repeat Buyers 88% 84% 78% 85% 87% 82%
Buyers who Purchased a Home in the:Texas
Percent of Home Financed, by Region(Median)
93% 91%87%
92% 93%88%
100% 98% 96% 98% 100% 99%
88%84%
78%85% 87%
82%
0%
10%
20%
30%
40%
50%
60%
70%
80%
90%
100%
U.S. Northeast Midwest South West
All Buyers First-time Buyers Repeat Buyers
The 2006 National Association of Realtors® Profile of Home Buyers and Sellers Chapter 5, Page 5 of 8

FINANCING THE HOME PURCHASE
Exhibit 5-5SOURCES OF DOWNPAYMENT, FIRST-TIME AND REPEAT BUYERS(Percent of Respondents Among those who Made a Downpayment)
Texas
All Buyers
First-time Buyers
Repeat Buyers
Savings 57% 81% 49%Proceeds from sale of primary residence 44 5 57Gift from relative or friend 7 23 2Sale of stocks or bonds 5 4 5Equity from primary residence buyer continue to own 2 2 2401k/pension fund including a loan 5 9 3Loan from relative or friend 3 4 2Proceeds from sale of real estate other than primary residence 3 * 3Inheritance 1 4 *Individual Retirement Account (IRA) 2 5 2Loan from financial institution other than a mortgage 1 * 1Sale of personal property 1 * 1Life insurance 3 4 2Investment property sales (1031 exchange) 1 * 1Other 3 5 2
* Less than one percent
U.S.
All Buyers
First-time Buyers
Repeat Buyers
Savings 50% 73% 40%Proceeds from sale of primary residence 44 4 62Gift from relative or friend 9 22 3Sale of stocks or bonds 7 10 6Equity from primary residence buyer continue to own 5 1 6401k/pension fund including a loan 4 7 3Loan from relative or friend 4 8 2Proceeds from sale of real estate other than primary residence 3 1 3Inheritance 2 3 2Individual Retirement Account (IRA) 2 4 1Loan from financial institution other than a mortgage 2 3 1Sale of personal property 1 1 2Life insurance 1 1 1Investment property sales (1031 exchange) 1 1 1Other 4 6 3
The 2006 National Association of Realtors® Profile of Home Buyers and Sellers Chapter 5, Page 6 of 8

FINANCING THE HOME PURCHASE
Exhibit 5-6TYPE OF MORTGAGE, FIRST-TIME AND REPEAT BUYERS(Percentage Distribution Among those who Financed their Home Purchase)
Texas
All Buyers First-time Buyers Repeat BuyersFixed-rate mortgage 83% 78% 86%Fixed- then adjustable-rate mortgage 8 14 5Adjustable-rate mortgage 6 4 6Don't know 2 3 2Other 1 1 1
U.S.
All Buyers First-time Buyers Repeat BuyersFixed-rate mortgage 71% 67% 73%Fixed- then adjustable-rate mortgage 15 19 13Adjustable-rate mortgage 8 8 9Don't know 3 4 2Other 3 2 3
The 2006 National Association of Realtors® Profile of Home Buyers and Sellers Chapter 5, Page 7 of 8

FINANCING THE HOME PURCHASE
Exhibit 5-7HOME PURCHASE IS A GOOD FINANCIAL INVESTMENT, FIRST-TIME AND REPEAT BUYERS(Percentage Distribution)
Texas
All Buyers First-time Buyers Repeat BuyersYes, better than stocks 48% 48% 48%Yes, about as good as stocks 30 34 29Yes, but not as good as stocks 10 8 11No 2 1 3Don't know 9 9 9
U.S.
All Buyers First-time Buyers Repeat BuyersYes, better than stocks 52% 52% 53%Yes, about as good as stocks 29 29 30Yes, but not as good as stocks 7 7 7No 2 2 3Don't know 9 11 8
The 2006 National Association of Realtors® Profile of Home Buyers and Sellers Chapter 5, Page 8 of 8

HOME SELLERS AND THEIR SELLING EXPERIENCE
Exhibit 6-1 AGE OF HOME SELLERS, BY REGIONExhibit 6-2 HOUSEHOLD INCOME OF HOME SELLERS, 2005Exhibit 6-3 ADULT COMPOSITION OF HOME SELLER HOUSEHOLDS, 2004-2006Exhibit 6-4 NUMBER OF CHILDREN UNDER THE AGE OF 18 RESIDING IN HOME SELLER HOUSEHOLDExhibit 6-5 RACE/ETHNICITY OF HOME SELLERS, BY REGIONExhibit 6-6 PRIMARY LANGUAGE SPOKEN IN HOME SELLER HOUSEHOLD, BY REGIONExhibit 6-7 TYPE OF HOME SOLDExhibit 6-8 LOCATION OF HOME SOLDExhibit 6-9 TYPE OF HOME SOLD BY LOCATIONExhibit 6-10 SIZE OF HOME PURCHASED COMPARED TO HOME RECENTLY SOLDExhibit 6-11 SIZE OF HOME PURCHASED COMPARED TO HOME RECENTLY SOLD, BY AGE OF SELLERExhibit 6-12 PRIMARY REASON FOR SELLING PREVIOUS HOME, BY AGEExhibit 6-13 TENURE IN PREVIOUS HOME, BY TYPE OF HOMEExhibit 6-14 NUMBER OF HOMES PREVIOUSLY OWNED, BY AGEExhibit 6-15 DISTANCE BETWEEN HOME PURCHASED AND HOME RECENTLY SOLD, BY REGIONExhibit 6-16 TASKS PERFORMED IN THE SELLING PROCESSExhibit 6-17 METHOD USED TO SELL HOME, BY REGIONExhibit 6-18 METHOD USED TO SELL HOME, BY SELLER URGENCYExhibit 6-19 METHOD OF SALE, BY BUYER AND SELLER RELATIONSHIPExhibit 6-20 METHOD USED TO SELL HOME, 1995-2006Exhibit 6-21 SALES PRICE COMPARED WITH LISTING PRICE, BY REGIONExhibit 6-22 SALES PRICE COMPARED WITH LISTING PRICE, BY SELLER URGENCYExhibit 6-23 NUMBER OF WEEKS RECENTLY SOLD HOME WAS ON THE MARKET, BY REGIONExhibit 6-24 SALES PRICE COMPARED WITH LISTING PRICE, BY NUMBER OF WEEKS HOME WAS ON
THE MARKETExhibit 6-25 NUMBER OF TIMES ASKING PRICE WAS REDUCED, BY NUMBER OF WEEKS HOME WAS
ON THE MARKETExhibit 6-26 SATISFACTION WITH THE SELLING PROCESS

HOME SELLERS AND THEIR SELLING EXPERIENCE
Exhibit 6-1AGE OF HOME SELLERS, BY REGION(Percentage Distribution)
U.S. Northeast Midwest South WestLess than 25 years * 1% 1% 1% 1% 1%25 - 34 years 20 18 18 22 18 1735 - 44 years 27 28 30 32 25 2745 - 54 years 25 22 20 21 24 2155 - 64 years 16 18 17 13 18 2265 - 74 years 10 10 10 8 11 975 years or older 3 4 4 3 4 3Median age (years) 46 46 45 44 48 47
* Less than one percent
Sellers who Purchased a Home in the:Texas
The 2006 National Association of Realtors® Profile of Home Buyers and Sellers Chapter 6, Page 2 of 28

HOME SELLERS AND THEIR SELLING EXPERIENCE
Exhibit 6-2HOUSEHOLD INCOME OF HOME SELLERS, 2005(Percentage Distribution)
U.S. Northeast Midwest South WestLess than $25,000 4% 3% 2% 4% 3% 3%$25,000 - $34,999 3 5 4 5 6 2$35,000 - $44,999 5 6 6 5 7 6$45,000 - $54,999 5 7 6 7 7 6$55,000 - $64,999 5 10 9 10 10 11$65,000 - $74,999 14 11 10 9 12 10$75,000 - $84,999 12 10 12 10 9 11$85,000 - $99,999 9 10 11 15 9 8$100,000 - $124,999 20 15 15 15 14 17$125,000 - $149,999 9 9 9 8 9 9$150,000 - $174,999 6 5 4 4 5 6$175,000 - $199,999 4 2 2 2 3 3$200,000 or more 4 8 10 7 7 9Median income (2005) $89,500 $83,800 $85,400 $85,500 $80,400 $87,700
Sellers who Purchased a Home in the:
Texas
The 2006 National Association of Realtors® Profile of Home Buyers and Sellers Chapter 6, Page 3 of 28

HOME SELLERS AND THEIR SELLING EXPERIENCE
Exhibit 6-3ADULT COMPOSITION OF HOME SELLER HOUSEHOLDS, 2004-2006(Percentage Distribution)
Texas
2006Married couple 73%Single female 20Single male 4Unmarried couple 2Other 1
U.S.
2004 2005 2006Married couple 74% 71% 72%Single female 15 17 17Single male 5 6 6Unmarried couple 5 3 4Other 1 1 1
The 2006 National Association of Realtors® Profile of Home Buyers and Sellers Chapter 6, Page 4 of 28

HOME SELLERS AND THEIR SELLING EXPERIENCE
Exhibit 6-4NUMBER OF CHILDREN UNDER THE AGE OF 18 RESIDING IN HOME SELLER HOUSEHOLD(Percentage Distribution of Homeseller Households)
One 19%Two 26%Three or more 6%None 49%
U.S.
One 16%Two 18%Three or more 7%None 59%
Texas NUMBER OF CHILDREN UNDER THE AGE OF 18 RESIDING IN HOME SELLER HOUSEHOLD
(Percentage Distribution)
None, 49%
Three or more, 6%
Two, 26%
One, 19%
Texas
NUMBER OF CHILDREN UNDER THE AGE OF 18 RESIDING IN HOME SELLER HOUSEHOLD
(Percentage Distribution)
One, 16%
Two, 18%
Three or more, 7%
None, 59%
U.S.
The 2006 National Association of Realtors® Profile of Home Buyers and Sellers Chapter 6, Page 5 of 28

HOME SELLERS AND THEIR SELLING EXPERIENCE
Exhibit 6-5RACE/ETHNICITY OF HOME SELLERS, BY REGION(Percent of Respondents)
U.S. Northeast Midwest South WestWhite/Caucasian 85% 89% 92% 95% 87% 85%Black/African-American 5 4 2 2 7 3Asian/Pacific Islander 4 3 4 1 2 6Hispanic/Latino 7 4 2 1 4 6Other 1 1 1 1 1 1
Note: Respondents were permitted to select as many races and ethnicities as they felt applicable. The percentage distribution may therefore sum to more than 100 percent.
Sellers who Purchased a Home in the:Texas
The 2006 National Association of Realtors® Profile of Home Buyers and Sellers Chapter 6, Page 6 of 28

HOME SELLERS AND THEIR SELLING EXPERIENCE
Exhibit 6-6PRIMARY LANGUAGE SPOKEN IN HOME SELLER HOUSEHOLD, BY REGION(Percentage Distribution)
U.S. Northeast Midwest South WestEnglish 95% 97% 96% 98% 97% 95%Other 5 3 4 2 3 5
Sellers who Purchased a Home in the:Texas
The 2006 National Association of Realtors® Profile of Home Buyers and Sellers Chapter 6, Page 7 of 28

HOME SELLERS AND THEIR SELLING EXPERIENCE
Exhibit 6-7TYPE OF HOME SOLD(Percentage Distribution)
U.S.Detached single-family home 89% 78%Townhouse/row house 4% 9%Duplex/apartment/condo in 2 to 4 unit building * 1%Apartment/condo in a building with 5 or more units 2% 7%Other 5% 5%
Texas
TYPE OF HOME SOLD(Percentage Distribution)
Detached single-family home, 89%
Other, 5%
Townhouse/row house, 4%
Apartment/condo in a building with 5 or more units, 2%
Duplex/apartment/condo in 2 to 4 unit building, *
Texas
TYPE OF HOME SOLD(Percentage Distribution)
Detached single-family home, 78%
Duplex/apartment/condo in 2 to 4
unit building, 1%
Apartment/condo in a building with 5 or more units, 7%
Townhouse/row house, 9%
Other, 5%
U.S.
The 2006 National Association of Realtors® Profile of Home Buyers and Sellers Chapter 6, Page 8 of 28

HOME SELLERS AND THEIR SELLING EXPERIENCE
Exhibit 6-8LOCATION OF HOME SOLD(Percentage Distribution)
U.S.Suburb/Subdivision 63% 53% Small town 9% 20% Urban area/Central city 16% 13% Rural area 9% 11% Resort/Recreation area 3% 2%
Texas
LOCATION OF HOME SOLD(Percentage Distribution)
Rural area, 9%
Suburb/Subdivision, 63%
Resort/Recreation area, 3%
Urban area/Central city, 16%
Small town, 9%
Texas
LOCATION OF HOME SOLD(Percentage Distribution)
Rural area, 11%
Suburb/Subdivision, 53%
Resort/Recreation area, 2%
Urban area/Central city, 13%
Small town, 20%
U.S.
The 2006 National Association of Realtors® Profile of Home Buyers and Sellers Chapter 6, Page 9 of 28

HOME SELLERS AND THEIR SELLING EXPERIENCE
Exhibit 6-9TYPE OF HOME SOLD BY LOCATION(Percentage Distribution)
Texas
All Sellers
Suburb/ Subdivision
Small town
Urban/ Central city
Rural area
Resort/ Recreation
areaDetached single-family home 89% 90% 99% 83% 97% 74%Townhouse/row house 4 5 * 5 * *Duplex/apartment/condo in 2 to 4 unit building
* * * * * *
Apartment/condo in a building with 5 or more units
2 * * 7 * 26
Other 5 5 1 5 3 *
U.S.
All Sellers
Suburb/ Subdivision
Small town
Urban/ Central city
Rural area
Resort/ Recreation
areaDetached single-family home 78% 81% 85% 68% 78% 62%Townhouse/row house 9 11 6 11 3 *Duplex/apartment/condo in 2 to 4 unit building
1 * * 2 2 6
Apartment/condo in a building with 5 or more units
7 6 3 14 1 15
Other 5 2 5 4 17 16
* Less than one percent
Sellers who Purchased a Home in a:
Sellers who Purchased a Home in a:
The 2006 National Association of Realtors® Profile of Home Buyers and Sellers Chapter 6, Page 10 of 28

HOME SELLERS AND THEIR SELLING EXPERIENCE
Exhibit 6-10SIZE OF HOME PURCHASED COMPARED TO HOME RECENTLY SOLD(Percentage Distribution)
Texas
1,000 sq ft orless
1,001 sq ft to1,500 sq ft
1,501 sq ft to2,000 sq ft
2,001 sq ft to2,500 sq ft
2,501 sq ft to3,000 sq ft
More than 3,000 sq ft
1,000 sq ft or less * 1% 1% * * *1,001 to 1,500 sq ft * 4 2 4 3 11,501 to 2,000 sq ft * 1 7 14 8 52,001 to 2,500 sq ft * 1 4 7 6 52,501 to 3,000 sq ft * 1 2 2 4 3More than 3,000 sq ft * 1 1 1 4 6
U.S.
1,000 sq ft orless
1,001 sq ft to1,500 sq ft
1,501 sq ft to2,000 sq ft
2,001 sq ft to2,500 sq ft
2,501 sq ft to3,000 sq ft
More than 3,000 sq ft
1,000 sq ft or less 1 3% 2% 1% * *1,001 to 1,500 sq ft 1 6 10 5 2 11,501 to 2,000 sq ft 1 4 9 8 4 42,001 to 2,500 sq ft * 2 4 4 3 42,501 to 3,000 sq ft * 1 2 2 2 3More than 3,000 sq ft * * 2 2 2 5
Trading Down Trading Up
* Less than one percent
Size of Home Sold
Size of Home Purchased
Size of Home Purchased
Size of Home Sold
The 2006 National Association of Realtors® Profile of Home Buyers and Sellers Chapter 6, Page 11 of 28

HOME SELLERS AND THEIR SELLING EXPERIENCE
Exhibit 6-11SIZE OF HOME PURCHASED COMPARED TO HOME RECENTLY SOLD, BY AGE OF SELLER(Median square feet)
Texas
Size of home sold
Size of home purchased Difference
18 to 34 years 1,717 2,184 46735 to 44 years 2,089 2,749 66045 to 54 years 2,069 2,457 38855 to 64 years 1,939 2,246 30765 to 74 years 2,163 2,205 4175 years or older 1,782 2,257 474
U.S.
Size of home sold
Size of home purchased Difference
18 to 34 years 1,512 2,080 56835 to 44 years 1,785 2,310 52545 to 54 years 1,877 2,128 25155 to 64 years 2,060 2,009 -5165 to 74 years 1,913 1,822 -9175 years or older 1,895 1,765 -130
The 2006 National Association of Realtors® Profile of Home Buyers and Sellers Chapter 6, Page 12 of 28

HOME SELLERS AND THEIR SELLING EXPERIENCE
Exhibit 6-12PRIMARY REASON FOR SELLING PREVIOUS HOME, BY AGE(Percentage Distribution)
Texas
18-24 25-44 45-64 65 or older
Home is too small 15% * 20% 10% 12%Neighborhood has become less desirable 17 100 17 20 13Change in family situation 12 * 12 13 10Want to move closer to my job 11 * 15 11 *Want to move closer to friends or family 12 * 8 13 23Job relocation 14 * 19 14 *Home is too large 3 * 2 4 6Moving due to retirement 2 N/A * 3 5Upkeep of home is too difficult due to health or finances 3 * 2 1 18Can not afford the mortgage and other expenses of owning * * * * *Other 10 * 6 12 14
U.S.
18-24 25-44 45-64 65 or older
Home is too small 19% 38% 30% 13% 3%Neighborhood has become less desirable 13 10 14 13 8Change in family situation 11 5 11 13 8Want to move closer to my job 10 * 14 8 1Want to move closer to friends or family 9 14 5 8 28Job relocation 9 5 12 9 *Home is too large 7 * 2 9 19Moving due to retirement 5 N/A * 7 12Upkeep of home is too difficult due to health or finances 3 * 1 3 8Can not afford the mortgage and other expenses of owning 3 14 2 3 2Other 12 14 10 15 10
* Less than one percent
Age
Age
All Sellers
All Sellers
The 2006 National Association of Realtors® Profile of Home Buyers and Sellers Chapter 6, Page 13 of 28

HOME SELLERS AND THEIR SELLING EXPERIENCE
Exhibit 6-13TENURE IN PREVIOUS HOME, BY TYPE OF HOME(Percentage Distribution)
Texas
All TypesCabin/
cottage
Duplex/apartment/ condo in 2
to 4 unitstructure
Apartment/ condo in
building with 5 or more
unitsTownhouse/
row house
Detached single-family home
Mobile/ manufactured
home Other1 year or less 6% * * * * 7% * 9%2 to 3 years 23 * 100 49 68 22 * 34 to 5 years 23 * * 13 30 22 37 446 to 7 years 16 89 * 36 1 16 * *8 to 10 years 11 * * 3 * 11 49 4411 to 15 years 10 * * * * 11 5 *16 to 20 years 3 11 * * * 3 * *21 year or more 8 * * * * 8 9 *Median 5 7 3 4 3 5 9 5
U.S.
All TypesCabin/
cottage
Duplex/apartment/condo in 2-
4 unit structure
Apartment/condo in
building with 5 or more
unitsTownhouse/
row house
Detached single-family home
Mobile/ manufactured
home Other1 year or less 6% * * 7% 6% 6% 1% 0%2 to 3 years 24 43 36 35 31 23 11 264 to 5 years 19 13 14 21 21 19 14 116 to 7 years 11 17 8 12 11 11 13 138 to 10 years 12 0 14 10 9 12 24 1311 to 15 years 11 13 3 7 10 12 13 416 to 20 years 7 13 11 7 4 7 13 1321 year or more 11 * 11 * 8 12 10 17Median 6 5 5 4 5 6 9 7
* Less than one percent
The 2006 National Association of Realtors® Profile of Home Buyers and Sellers Chapter 6, Page 14 of 28

HOME SELLERS AND THEIR SELLING EXPERIENCE
Exhibit 6-14NUMBER OF HOMES PREVIOUSLY OWNED, BY AGE(Percentage Distribution)
Texas
All Sellers 18-44 45-64 65 or olderOne 8% 11% 4% 8%Two 34 51 20 14Three 22 28 21 4Four 13 6 20 18Five or more 23 5 34 55Median 3 homes 2 homes 4 homes 5 homes
U.S.
All Sellers 18-44 45-64 65 or olderOne 13% 18% 10% 9%Two 33 47 23 15Three 21 21 21 22Four 15 9 18 24Five or more 18 5 29 29Median 3 homes 2 homes 3 homes 3 homes
Age
Age
The 2006 National Association of Realtors® Profile of Home Buyers and Sellers Chapter 6, Page 15 of 28

HOME SELLERS AND THEIR SELLING EXPERIENCE
Exhibit 6-15DISTANCE BETWEEN HOME PURCHASED AND HOME RECENTLY SOLD, BY REGION(Median Miles)
Texas U.S. Northeast Midwest South West2006 45 17 12 13 26 16
Sellers who Purchased a Home in the:
DISTANCE BETWEEN HOME PURCHASED AND HOME RECENTLY SOLD, BY REGION
(Median Miles)
45
1712 13
26
16
0
5
10
15
20
25
30
35
40
45
50
Texas U.S. Northeast Midwest South West
The 2006 National Association of Realtors® Profile of Home Buyers and Sellers Chapter 6, Page 16 of 28

HOME SELLERS AND THEIR SELLING EXPERIENCE
Exhibit 6-16TASKS PERFORMED IN THE SELLING PROCESS(Percentage Distribution)
Texas
Did myself without
assistance
Assisted by real estate agent
Paid another professional
for assistance
Task not performed
Don't know
Determine asking price 24% 70% 2% 2% 1%Hold open house 6 48 3 42 1Schedule showings with potential buyers 11 71 9 6 2Enter property in Multiple Listing Service 1 83 5 9 2Place ads in newspapers, mags, etc. 4 60 * 31 5Contact buyers by phone, mail, etc. 5 52 1 30 11Advertise or place listing on Internet 4 76 3 14 2Review sales contracts/purchase offers 7 85 3 4 1Negotiate with buyers 8 81 5 5 1Coordinate appraisal, home inspection, etc. 13 69 11 4 3Pre-qualify buyers for a mortgage 6 50 14 16 14Manage paperwork, contracts, etc. 6 83 7 3 2Attend closing 19 69 5 6 2
U.S.
Did myself without
assistance
Assisted by real estate agent
Paid another professional
for assistance
Task not performed
Don't know
Determine asking price 24% 71% 3% 1% *Hold open house 9 52 1 38 *Schedule showings with potential buyers 12 76 4 7 1Enter property in Multiple Listing Service 3 80 1 14 1Place ads in newspapers, mags, etc. 7 63 1 25 3Contact buyers by phone, mail, etc. 5 59 1 26 8Advertise or place listing on Internet 5 74 2 16 3Review sales contracts/purchase offers 8 80 6 6 1Negotiate with buyers 13 78 3 6 1Coordinate appraisal, home inspection, etc. 13 72 7 6 2Pre-qualify buyers for a mortgage 6 49 16 17 13Manage paperwork, contracts, etc. 9 78 9 3 1Attend closing 16 71 8 3 1
* Less than one percent
The 2006 National Association of Realtors® Profile of Home Buyers and Sellers Chapter 6, Page 17 of 28

HOME SELLERS AND THEIR SELLING EXPERIENCE
Exhibit 6-17METHOD USED TO SELL HOME, BY REGION(Percentage Distribution)
U.S. Northeast Midwest South WestSold home using an agent or broker 86% 84% 87% 81% 83% 87%
Seller used agent/broker only 83 80 82 76 78 84Seller first tried to sell it themselves, but then used an agent 2 5 5 5 5 3
For-sale-by-owner (FSBO) 9 12 11 14 13 10Seller sold home without using a real estate agent or broker 9 11 10 13 12 9First listed with an agent, but then sold home themselves 1 1 2 1 1 1
Sold home to a homebuying company 2 1 * 1 1 *Other 3 3 1 4 2 3
* Less than one percent
Sellers who Purchased a Home in the:Texas
The 2006 National Association of Realtors® Profile of Home Buyers and Sellers Chapter 6, Page 18 of 28

HOME SELLERS AND THEIR SELLING EXPERIENCE
Exhibit 6-18METHOD USED TO SELL HOME, BY SELLER URGENCY(Percentage Distribution)
TexasVery
urgentlySomewhat
urgentlyNot
urgentlySold home using an agent or broker 86% 93% 85% 83%
Seller used agent/broker only 83 93 81 82Seller first tried to sell it themselves, but then used an agent 2 * 4 1
For-sale-by-owner (FSBO) 9 4 10 12Seller sold home without using a real estate agent or broker 9 4 10 10First listed with an agent, but then sold home themselves 1 * * 2
Sold home to a homebuying company 2 3 2 *Other 3 * 2 4
U.S.
All SellersVery
urgentlySomewhat
urgentlyNot
urgentlySold home using an agent or broker 84% 84% 86% 82%
Seller used agent/broker only 80 82 81 78Seller first tried to sell it themselves, but then used an agent 5 2 5 5
For-sale-by-owner (FSBO) 12 12 12 14Seller sold home without using a real estate agent or broker 11 11 11 13First listed with an agent, but then sold home themselves 1 1 1 1
Sold home to a homebuying company 1 1 1 *Other 3 3 2 4
* Less than one percent
All Sellers
Seller Needed to Sell:
Seller Needed to Sell:
The 2006 National Association of Realtors® Profile of Home Buyers and Sellers Chapter 6, Page 19 of 28

HOME SELLERS AND THEIR SELLING EXPERIENCE
Exhibit 6-19METHOD OF SALE, BY BUYER AND SELLER RELATIONSHIP(Percentage Distribution)
Texas
Buyer and Seller RelationshipSeller Knew
BuyerSeller did not Know Buyer
All sellers 10% 90%Sold home using an agent or broker 4 96
Seller used agent/broker only 4 96Seller first tried to sell it themselves, but then used an agent 2 98
For-sale-by-owner (FSBO) 62 38Sold home without using a real estate agent or broker 68 32First listed with an agent, but then sold home themselves * 100
Other 5 95
Method of Home Sale All SellersSeller Knew
BuyerSeller did not Know Buyer
Sold home using an agent or broker 86% 38% 91%Sold it using a licensed real estate agent or broker 83 38 89First tried to sell home themselves, but then used an agent 2 1 3
For-sale-by-owner (FSBO) 9 60 4Sold home without using a real estate agent or broker 9 60 3First listed with an agent, but then sold home themselves 1 * 1
Other 3 2 3
* Less than one percent
U.S.
Buyer and Seller RelationshipSeller Knew
BuyerSeller did not Know Buyer
All sellers 9% 91%Sold home using an agent or broker 4 96
Sold it using a licensed real estate agent or broker 4 96First tried to sell home themselves, but then used an agent 6 94
For-sale-by-owner (FSBO) 40 60Sold home without using a real estate agent or broker 40 60First listed with an agent, but then sold home themselves 43 57
Other 23 77
Method of Home Sale All SellersSeller Knew
BuyerSeller did not Know Buyer
Sold home using an agent or broker 84% 38% 89%Sold it using a licensed real estate agent or broker 80 35 84First tried to sell home themselves, but then used an agent 5 3 5
For-sale-by-owner (FSBO) 12 53 8Sold home without using a real estate agent or broker 11 49 8First listed with an agent, but then sold home themselves 1 4 1
The 2006 National Association of Realtors® Profile of Home Buyers and Sellers Chapter 6, Page 20 of 28

Other 3 8 3
The 2006 National Association of Realtors® Profile of Home Buyers and Sellers Chapter 6, Page 21 of 28

HOME SELLERS AND THEIR SELLING EXPERIENCE
Exhibit 6-20METHOD USED TO SELL HOME, 1995-2006(Percentage Distribution)
Texas
2006Sold home using an agent or broker 86%For-sale-by-owner (FSBO) 9Sold it to a home buying company 2Other 3
U.S.
1995 1997 1999 2001 2003 2004 2005 2006Sold home using an agent or broker 81% 80% 77% 79% 83% 82% 85% 84%For-sale-by-owner (FSBO) 15 18 16 13 14 14 13 12Sold to home buying company 2 1 2 1 1 1 1 1Other 2 1 5 7 3 3 2 3
The 2006 National Association of Realtors® Profile of Home Buyers and Sellers Chapter 6, Page 22 of 28

HOME SELLERS AND THEIR SELLING EXPERIENCE
Exhibit 6-21SALES PRICE COMPARED WITH LISTING PRICE, BY REGION(Percentage Distribution of Sales Price as a Percent of List Price)
U.S. Northeast Midwest South WestLess than 90% 4% 7% 10% 7% 8% 3%90% to 94% 15 14 17 15 14 1195% to 99% 44 41 39 54 39 34100% 28 26 22 18 27 32101% to 110% 7 9 7 4 9 14More than 110% 2 3 5 1 3 6Median (sales price as a percent of listing price)
98% 98% 98% 97% 98% 100%
Sellers who Purchased a Home in the:
Texas
The 2006 National Association of Realtors® Profile of Home Buyers and Sellers Chapter 6, Page 23 of 28

HOME SELLERS AND THEIR SELLING EXPERIENCE
Exhibit 6-22SALES PRICE COMPARED WITH LISTING PRICE, BY SELLER URGENCY(Percentage Distribution of Sales Price as a Percent of Listing Price)
Texas
Very urgently
Somewhat urgently
Not urgently
Less than 90% 4% 7% 2% 5%90% to 94% 15 18 19 895% to 99% 44 30 53 42100% 28 35 16 41101% to 110% 7 11 7 4More than 110% 2 * 4 *Median (sales price as a percent of listing price)
98% 98% 97% 99%
* Less than one percent
U.S.
All SellersVery
urgentlySomewhat
urgentlyNot
urgentlyLess than 90% 7% 7% 7% 6%90% to 94% 14 16 16 1095% to 99% 41 39 41 43100% 26 25 23 31101% to 110% 9 11 9 7More than 110% 3 2 4 4Median (sales price as a percent of listing price)
98% 98% 98% 99%
All Sellers
Seller Needed to Sell:
Seller Needed to Sell:
The 2006 National Association of Realtors® Profile of Home Buyers and Sellers Chapter 6, Page 24 of 28

HOME SELLERS AND THEIR SELLING EXPERIENCE
Exhibit 6-23NUMBER OF WEEKS RECENTLY SOLD HOME WAS ON THE MARKET, BY REGION(Percentage Distribution)
U.S. Northeast Midwest South WestLess than 1 week 4% 5% 4% 5% 6% 5%1 to 2 weeks 25 27 29 21 27 303 to 4 weeks 19 15 10 14 15 185 to 6 weeks 7 7 8 8 6 77 to 8 weeks 7 8 6 11 9 79 to 10 weeks 7 4 5 4 5 311 to 16 weeks 16 16 15 16 16 1617 or more weeks 15 18 24 22 17 13Median weeks 6 6 6 8 6 4
Sellers who Purchased a Home in the:
Texas
The 2006 National Association of Realtors® Profile of Home Buyers and Sellers Chapter 6, Page 25 of 28

HOME SELLERS AND THEIR SELLING EXPERIENCE
Exhibit 6-24SALES PRICE COMPARED WITH LISTING PRICE, BY NUMBER OF WEEKS HOME WAS ON THE MARKET(Percentage Distribution of Sales Price as a Percent of Listing Price)
Texas
All SellersLess than 1 week
1 to 2 weeks
3 to 4 weeks
5 to 8 weeks
9 to 16 weeks
17 or more weeks
Less than 90% 4% 2% * * 6% 3% 17%90% to 94% 15 18 4 10 8 27 3095% to 99% 44 18 35 59 54 52 39100% 28 54 44 25 24 13 8101% to 110% 7 5 13 3 8 3 6More than 110% 2 2 4 4 * 1 *Median (sales price as a percent of listing price)
98% 100% 100% 98% 98% 97% 95%
* Less than one percent
U.S.
All SellersLess than 1 week
1 to 2 weeks
3 to 4 weeks
5 to 8 weeks
9 to 16 weeks
17 or more weeks
Less than 90% 7% 4% 2% 2% 3% 8% 22%90% to 94% 14 6 3 7 15 26 2895% to 99% 41 13 38 49 57 43 37100% 26 64 40 26 17 13 8101% to 110% 9 12 14 14 6 6 2More than 110% 3 1 4 3 2 4 3Median (sales price as a percent of listing price)
98% 100% 100% 99% 98% 97% 95%
Sellers whose Home was on the Market for:
Sellers whose Home was on the Market for:
The 2006 National Association of Realtors® Profile of Home Buyers and Sellers Chapter 6, Page 26 of 28

HOME SELLERS AND THEIR SELLING EXPERIENCE
Exhibit 6-25NUMBER OF TIMES ASKING PRICE WAS REDUCED, BY NUMBER OF WEEKS HOME WAS ON THE MARKET(Percentage Distribution)
Texas
All SellersLess than 1 week
1 to 2 weeks
3 to 4 weeks
5 to 8 weeks
9 to 16 weeks
17 or more weeks
None, did not reduce the asking price
54% 77% 76% 54% 44% 41% 26%
One 34 23 21 43 44 43 33Two 10 * 3 3 11 12 32Three or more 2 * * * * 4 9
U.S.
All SellersLess than 1 week
1 to 2 weeks
3 to 4 weeks
5 to 8 weeks
9 to 16 weeks
17 or more weeks
None, did not reduce the asking price
53% 88% 77% 67% 43% 33% 21%
One 34 12 21 31 50 47 37Two 8 * 1 2 7 14 19Three or more 5 * * * 1 5 22
* Less than one percent
Sellers whose Home was on the Market for:
Sellers whose Home was on the Market for:
The 2006 National Association of Realtors® Profile of Home Buyers and Sellers Chapter 6, Page 27 of 28

HOME SELLERS AND THEIR SELLING EXPERIENCE
Exhibit 6-26SATISFACTION WITH THE SELLING PROCESS(Percentage Distribution)
U.S.Very Satisfied 67% 65%Somewhat Satisfied 22 25Somewhat Dissatisfied 6 7Very Dissatisfied 4 4
Texas
Satisfaction with Selling Process(Percentage Distribution)
Very Dissatisfied, 4%Somewhat
Dissatisfied, 6%
Somewhat Satisfied, 22% Very Satisfied,
68%
Texas
Satisfaction with Selling Process(Percentage Distribution)
Somewhat Dissatisfied, 7
Somewhat Satisfied, 25
Very Satisfied, 65%
Very Dissatisfied, 4
U.S.
The 2006 National Association of Realtors® Profile of Home Buyers and Sellers Chapter 6, Page 28 of 28
HOME SELLING AND REAL ESTATE PROFESSIONALS
Exhibit 7-1 METHOD USED TO FIND REAL ESTATE AGENTExhibit 7-2 NUMBER OF AGENTS CONTACTED BEFORE SELECTING ONE TO ASSIST WITH SALE OF HOMEExhibit 7-3 DID SELLER USE THE SAME REAL ESTATE AGENT FOR THEIR HOME PURCHASE?Exhibit 7-4 WHAT SELLERS MOST WANT FROM REAL ESTATE AGENTSExhibit 7-5 MOST IMPORTANT FACTOR IN CHOOSING A REAL ESTATE AGENT TO SELL HOMEExhibit 7-6 METHODS REAL ESTATE AGENT USED TO MARKET HOME, BY REGIONExhibit 7-7 HOME LISTED ON MULTIPLE LISTING SERVICEExhibit 7-8 LEVEL OF SERVICE PROVIDED BY THE REAL ESTATE AGENTExhibit 7-9 HOW REAL ESTATE AGENT WAS COMPENSATEDExhibit 7-10 WOULD SELLER USE REAL ESTATE AGENT AGAIN OR RECOMMEND TO OTHERS

HOME SELLING AND REAL ESTATE PROFESSIONALS
Exhibit 7-1METHOD USED TO FIND REAL ESTATE AGENT(Percentage Distribution)
Texas
Referred by (or is) a friend, neighbor or relative 45%Used agent previously to buy or sell a home 31Visited an open house and met agent 2Personal contact by agent (telephone, email, etc.) 4Referred by another real estate or broker 4Referred through employer or relocation company 4Direct mail (newsletter, flyer, postcard, etc.) 5Internet Web site 3Newspaper, Yellow pages or home book ad 1Advertising specialty (calendar, magnet, etc.) 2Saw contact information on For Sale sign *
U.S.
Referred by (or is) a friend, neighbor or relative 44%Used agent previously to buy or sell a home 30Visited an open house and met agent 5Personal contact by agent (telephone, email, etc.) 5Referred by another real estate or broker 4Referred through employer or relocation company 3Direct mail (newsletter, flyer, postcard, etc.) 3Internet Web site 2Newspaper, Yellow pages or home book ad 1Advertising specialty (calendar, magnet, etc.) 1Saw contact information on For Sale sign *
* Less than one percent
The 2006 National Association of Realtors® Profile of Home Buyers and Sellers Chapter 7, Page 2 of 11
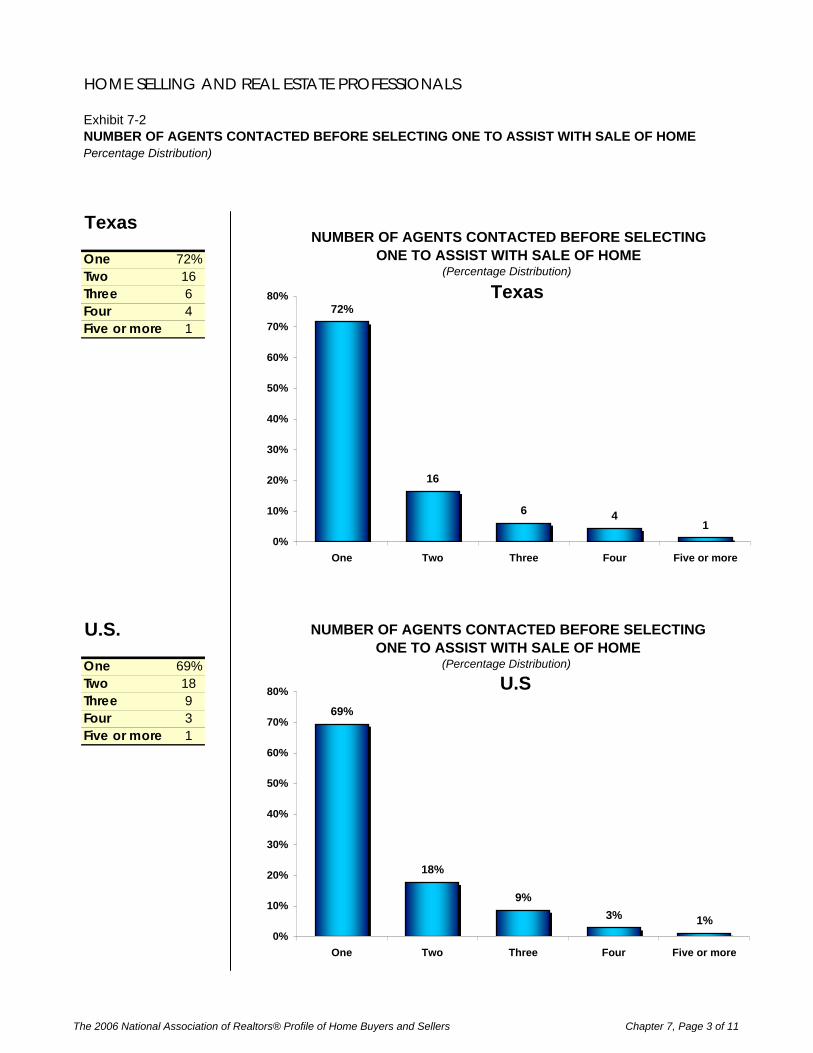
HOME SELLING AND REAL ESTATE PROFESSIONALS
Exhibit 7-2NUMBER OF AGENTS CONTACTED BEFORE SELECTING ONE TO ASSIST WITH SALE OF HOMEPercentage Distribution)
Texas
One 72%Two 16Three 6Four 4Five or more 1
U.S.
One 69%Two 18Three 9Four 3Five or more 1
NUMBER OF AGENTS CONTACTED BEFORE SELECTING ONE TO ASSIST WITH SALE OF HOME
(Percentage Distribution)
72%
16
6 41
0%
10%
20%
30%
40%
50%
60%
70%
80%
One Two Three Four Five or more
Texas
NUMBER OF AGENTS CONTACTED BEFORE SELECTING ONE TO ASSIST WITH SALE OF HOME
(Percentage Distribution)
1%3%9%
18%
69%
0%
10%
20%
30%
40%
50%
60%
70%
80%
One Two Three Four Five or more
U.S
The 2006 National Association of Realtors® Profile of Home Buyers and Sellers Chapter 7, Page 3 of 11

HOME SELLING AND REAL ESTATE PROFESSIONALS
Exhibit 7-3DID SELLER USE THE SAME REAL ESTATE AGENT FOR THEIR HOME PURCHASE?(Percentage Distribution among those who Used an Agent to Purchase a Home)
Texas
Yes 41%No 59%
U.S.
Yes 50%No 50%
DID SELLER USE THE SAME AGENT FOR THEIR HOME PURCHASE?
(Percentage Distribution Among those who Used an Agent to Purchase a Home)
No, 59%
Yes, 41%
Texas
DID SELLER USE THE SAME AGENT FOR THEIR HOME PURCHASE?
( Percentage Distribution Among those who Used an Agent to Purchase a Home)
No, 50%
Yes, 50%
U.S.
The 2006 National Association of Realtors® Profile of Home Buyers and Sellers Chapter 7, Page 4 of 11

HOME SELLING AND REAL ESTATE PROFESSIONALS
Exhibit 7-4WHAT SELLERS MOST WANT FROM REAL ESTATE AGENTS(Percentage Distribution)
Texas
Help sell the home within specific timeframe 25%Help find a buyer for home 24Help seller market home to potential buyers 18Help price home competitively 14Help seller find ways to fix up home to sell it for more 7Help with negotiation and dealing with buyers 7Help with paperwork/inspections/preparing for settlement 5Help see homes available for seller to purchase *Other *
* Less than one percent
U.S.
Help sell the home within specific timeframe 25%Help find a buyer for home 22Help seller market home to potential buyers 16Help price home competitively 16Help seller find ways to fix up home to sell it for more 10Help with negotiation and dealing with buyers 4Help with paperwork/inspections/preparing for settlement 3Help see homes available for seller to purchase 1Other 2
The 2006 National Association of Realtors® Profile of Home Buyers and Sellers Chapter 7, Page 5 of 11

HOME SELLING AND REAL ESTATE PROFESSIONALS
Exhibit 7-5MOST IMPORTANT FACTOR IN CHOOSING A REAL ESTATE AGENT TO SELL HOME(Percentage Distribution)
Texas U.S.Reputation of real estate agent 38% 35%Agent is honest and trustworthy 17% 21%Agent is friend or family member 13% 15%Agent's knowledge of the neighborhood 15% 11%Agent's association with a particular firm 6% 6%Agent has caring personality/good listener 6% 5%Professional designation(s) held by real estate agent 2% 2%Other 4% 5%
MOST IMPORTANT FACTOR IN CHOOSING A REAL ESTATEAGENT TO SELL HOME
(Percentage Distribution)Professional designation(s) held
by real estate agent, 2%
Other, 4%Agent has caring personality/good
listener, 6%
Agent is honest and trustworthy, 17%
Agent is friend or family member, 13%
Agent's knowledge of the neighborhood,
15%
Agent's association with a particular firm,
6%
Reputation of real estate agent, 38%
Texas
MOST IMPORTANT FACTOR IN CHOOSING A REAL ESTATEAGENT TO SELL HOME
(Percentage Distribution)
Other, 5%
Professional designation(s) held
by real estate agent, 2%
Agent has caring personality/good
listener, 5%
Agent is honest and trustworthy, 21%
Agent is friend or family member, 15%
Agent's knowledge of the neighborhood,
11%
Agent's association with a particular firm,
6%
Reputation of real estate agent, 35%
U.S.
The 2006 National Association of Realtors® Profile of Home Buyers and Sellers Chapter 7, Page 6 of 11

HOME SELLING AND REAL ESTATE PROFESSIONALS
Exhibit 7-6METHODS REAL ESTATE AGENT USED TO MARKET HOME, BY REGION(Percent of Respondents who used a Real Estate Agent to Sell)
Northeast Midwest South WestListing on the Internet 87% 85% 85% 84% 86% 84%Yard sign 84 78 66 82 79 81Open house 48 56 65 56 51 61Print newspaper advertisement 36 48 60 55 42 42Real estate magazine 35 32 33 33 32 30Direct mail (flyers, postcards, etc.) 13 22 20 17 21 29Television 9 4 4 4 4 4Other 2 5 7 5 5 6
Sellers who purchased a home in the:All sellersTexas
The 2006 National Association of Realtors® Profile of Home Buyers and Sellers Chapter 7, Page 7 of 11

HOME SELLING AND REAL ESTATE PROFESSIONALS
Exhibit 7-7HOME LISTED ON MULTIPLE LISTING SERVICE(Percentage Distribution)
Texas
Yes 92%No 2%Don't know 5%
U.S.
Yes 88%No 5%Don't know 6%
HOME LISTED ON MULTIPLE LISTING SERVICE(Percentage Distribution)
Don't know, 5%
No, 2%
Yes, 92%
Texas
HOME LISTED ON MULTIPLE LISTING SERVICE(Percentage Distribution)
No, 5%
Yes, 88%
Don't know, 6%U.S
The 2006 National Association of Realtors® Profile of Home Buyers and Sellers Chapter 7, Page 8 of 11

HOME SELLING AND REAL ESTATE PROFESSIONALS
Exhibit 7-8LEVEL OF SERVICE PROVIDED BY THE REAL ESTATE AGENT(Percentage Distribution)
Texas
A broad range of services and management of most aspects of the home sale
77%
A limited set of services as requested by the seller
13%
The agent listed the home on the MLS and performed few if any additional services
10%
U.S.
A broad range of services and management of most aspects of the home sale
83%
A limited set of services as requested by the seller
9%
The agent listed the home on the MLS and performed few if any additional services
8%
LEVEL OF SERVICE PROVIDED BY THE REAL ESTATEAGENT
(Percentage Distribution)
The agent listed the home on the
MLS and performed few if any additional services, 10%
A limited set of services as
requested by the seller, 13%
A broad range of services and
management of most aspects of the home sale,
77%
Texas
LEVEL OF SERVICE PROVIDED BY THE REAL ESTATE AGENT
(Percentage Distribution)
A limited set of services as
requested by the seller, 9%
A broad range of services and
management of most aspects of the home sale,
83%
The agent listed the home on the
MLS and performed few if any additional services, 8%
U.S.
The 2006 National Association of Realtors® Profile of Home Buyers and Sellers Chapter 7, Page 9 of 11

HOME SELLING AND REAL ESTATE PROFESSIONALS
Exhibit 7-9HOW REAL ESTATE AGENT WAS COMPENSATED(Percentage Distribution)
Texas
Paid by seller 77% Percent of sales price 74 Flat fee 3 Per task fee * Other * Don't Know 4Paid by buyer and seller 11Paid by buyer only 3Other 8Don't Know 2
U.S.
Paid by seller 81% Percent of sales price 75 Flat fee 4 Per task fee * Other 1 Don't Know 2Paid by buyer and seller 8Paid by buyer only 5Other 4Don't Know 2
* Less than one percent
The 2006 National Association of Realtors® Profile of Home Buyers and Sellers Chapter 7, Page 10 of 11

HOME SELLING AND REAL ESTATE PROFESSIONALS
Exhibit 7-10WOULD SELLER USE REAL ESTATE AGENT AGAIN OR RECOMMEND TO OTHERS(Percentage Distribution)
Texas
Definitely 63%Probably 19%Probably Not 9%Definitely Not 9%Don't Know/ Not Sure
*
U.S.
Definitely 63%Probably 19%Probably Not 8%Definitely Not 7%Don't Know/ Not Sure
2%
WOULD SELLER USE REAL ESTATE AGENT AGAIN OR RECOMMEND TO OTHERS
(Percentage Distribution)
63%
19%
9% 9%
*0%
10%
20%
30%
40%
50%
60%
70%
Definitely Probably Probably Not Definitely Not Don't Know/ NotSure
Texas
WOULD SELLER USE REAL ESTATE AGENT AGAIN ORRECOMMEND TO OTHERS
(Percentage Distribution)
63%
19%
8% 7%2%
0%
10%
20%
30%
40%
50%
60%
70%
Definitely Probably Probably Not Definitely Not Don't Know/ NotSure
U.S.
The 2006 National Association of Realtors® Profile of Home Buyers and Sellers Chapter 7, Page 11 of 11

FOR SALE BY OWNERS SELLERS
Exhibit 8-1 FSBO AND AGENT-ASSISTED SALES, BY LOCATIONExhibit 8-2 FSBO AND AGENT-ASSISTED SALES, 2003-2006Exhibit 8-3 CHARACTERISTICS OF FSBO AND AGENT-ASSISTED SELLERSExhibit 8-4 TYPE OF HOME SOLD, FSBO AND AGENT-ASSISTED SELLERSExhibit 8-5 LOCATION OF HOME SOLD, FSBO AND AGENT-ASSISTED SELLERSExhibit 8-6 SELLING PRICE, FSBO AND AGENT-ASSISTED SELLERSExhibit 8-7 TIME ON THE MARKET, FSBO AND AGENT-ASSISTED SELLERSExhibit 8-8 SELLER URGENCY, FSBO AND AGENT-ASSISTED SELLERSExhibit 8-9 MOST IMPORTANT REASON FOR SELLING HOME AS FSBOExhibit 8-10 METHOD USED BY FSBO SELLERS TO MARKET HOMEExhibit 8-11 MOST DIFFICULT TASK FOR FSBO SELLERSExhibit 8-12 BUYER OF FSBO HOME WAS ASSISTED BY A REAL ESTATE AGENTExhibit 8-13 HOW FSBO SELLERS WILL SELL THEIR CURRENT HOME

FOR SALE BY OWNERS SELLERS
Exhibit 8-1FSBO AND AGENT-ASSISTED SALES, BY LOCATION(Percentage Distribution)
Texas
Suburb/ Subdivision Small town
Urban/ Central
cityRural area
Resort/ Recreation
areaFor-sale-by-owner (FSBO) 9% 6% 25% 9% 16% 19%
Seller knew buyer 6 3 17 5 16 19Seller did not know buyer 4 3 9 4 * *
Agent-assisted 86 89 67 91 73 81Other 5 5 8 * 11 *
* Less than one percent
U.S.
Suburb/ Subdivision Small town
Urban/ Central
cityRural area
Resort/ Recreation
areaFor-sale-by-owner (FSBO) 12% 11% 17% 11% 16% 10%
Seller knew buyer 5 4 7 6 7 6Seller did not know buyer 7 7 10 5 9 4
Agent-assisted 84 86 80 86 81 85Other 3 3 3 4 3 5
All sellers
Sellers who Sold a Home in a:
All sellers
Sellers who Sold a Home in a:
The 2006 National Association of Realtors® Profile of Home Buyers and Sellers Chapter 8, Page 2 of 15

FOR SALE BY OWNERS SELLERS
Exhibit 8-2FSBO AND AGENT-ASSISTED SALES, 2003-2006(Percentage Distribution)
Texas
2006All FSBO (For-sale-by-owner) 9%
Seller knew buyer 6Seller did not know buyer 4
Agent-assisted 86Other 5
U.S.
2003 2004 2005 2006All FSBO (For-sale-by-owner) 14% 14% 13% 12%
Seller knew buyer 5 5 5 5Seller did not know buyer 9 10 8 7
Agent-assisted 83 82 85 84Other 4 4 2 3
The 2006 National Association of Realtors® Profile of Home Buyers and Sellers Chapter 8, Page 3 of 15

FOR SALE BY OWNERS SELLERS
Exhibit 8-3CHARACTERISTICS OF FSBO AND AGENT-ASSISTED SELLERS
Texas
All Sellers All FSBO
Seller Knew Buyer
Seller did not Know
BuyerAll Agent-assisted
Agent-assisted
only
First FSBO, then Agent-
assistedMedian age 46 44 44 43 46 47 38Median income $89,500 $82,700 $109,400 $69,600 $94,400 $94,600 $68,600Household composition
Married couple 73% 93% 89% 100% 70% 71% 64%Single female 20 1 2 * 22 22 36Single male 4 5 8 * 5 5 *Unmarried couple 2 1 1 * 2 2 *Other 1 * * * 1 1 *
Number of homes ownedOne 8% 16% 14% 20% 8% 7% 22%Two 34 21 15 31 36 36 31Three 22 21 19 23 22 22 47Four 13 9 14 * 13 13 *Five or more 23 33 38 25 22 22 *Median 3 3 4 2 3 3 2
U.S.
All Sellers All FSBO
Seller Knew Buyer
Seller did not Know
BuyerAll Agent-assisted
Agent-assisted
only
First FSBO, then Agent-
assistedMedian age 46 47 48 46 46 46 43Median income $83,800 $77,800 $78,300 $78,000 $85,900 $87,100 $70,700Household composition
Married couple 72% 70% 60% 78% 73% 73% 67%Single female 17 16 22 12 16 16 16Single male 6 8 10 6 6 6 7Unmarried couple 4 5 7 3 4 4 7Other 1 1 1 * 1 1 3
Number of homes ownedOne 13% 14% 20% 11% 13% 11% 34%Two 33 36 35 37 33 33 27Three 21 21 19 21 22 22 21Four 15 14 12 15 14 15 7Five or more 18 15 13 16 18 19 11Median 3 2 2 3 3 3 2
* Less than one percent
FSBO
FSBO Agent-Assisted
Agent-Assisted
The 2006 National Association of Realtors® Profile of Home Buyers and Sellers Chapter 8, Page 4 of 15

FOR SALE BY OWNERS SELLERS
Exhibit 8-4TYPE OF HOME SOLD, FSBO AND AGENT-ASSISTED SELLERS(Percentage Distribution)
Texas
All sellers All FSBO
Seller knew buyer
Seller did not know
buyerAgent-assisted
Detached single-family home 89% 99% 98% 100% 90%Townhouse/row house 4 1 1 * 4Duplex/apartment/condo in 2 to 4 unit building * * * * *Apartment/condo in a building with 5 or more units 2 1 1 * 2Mobile/manufactured home 3 * * * 1Other 2 * * * 2
* Less than one percent
U.S.
All sellers All FSBO
Seller knew buyer
Seller did not know
buyerAgent-assisted
Detached single-family home 78% 83% 88% 79% 78%Townhouse/row house 9 5 4 7 10Duplex/apartment/condo in 2 to 4 unit building 1 2 3 1 1Apartment/condo in a building with 5 or more units 7 4 3 5 7Mobile/manufactured home 3 4 2 6 2Other 2 1 1 1 2
FSBO
FSBO
The 2006 National Association of Realtors® Profile of Home Buyers and Sellers Chapter 8, Page 5 of 15

FOR SALE BY OWNERS SELLERS
Exhibit 8-5LOCATION OF HOME SOLD, FSBO AND AGENT-ASSISTED SELLERS(Percentage Distribution)
Texas
All sellers All FSBOSeller knew
buyerSeller did not know buyer Agent-assisted
Suburb/Subdivision 63% 40% 29% 58% 66%Small town 9 24 26 22 7Urban area/Central city 16 16 13 20 18Rural area 9 15 25 * 8Resort/Recreation area 3 4 7 * 2
* Less than one percent
U.S.
All sellers All FSBOSeller knew
buyerSeller did not know buyer Agent-assisted
Suburb/Subdivision 53% 48% 39% 54% 54%Small town 13 18 20 17 13Urban area/Central city 20 18 23 14 20Rural area 11 14 15 14 10Resort/Recreation area 2 2 3 1 2
FSBO
FSBO
The 2006 National Association of Realtors® Profile of Home Buyers and Sellers Chapter 8, Page 6 of 15

FOR SALE BY OWNERS SELLERS
Exhibit 8-6SELLING PRICE, FSBO AND AGENT-ASSISTED SELLERS(Percentage Distribution)
Texas
All Sellers All FSBOSeller knew
buyer
Seller did not know
buyerAll Agent-assisted
Agent-assisted only
First FSBO, then Agent-
assistedMedian selling price $165,000 $205,100 $229,500 $157,700 $165,000 $163,700 $196,000Lowest selling price $28,000 $35,000 $35,000 $92,000 $28,000 $28,000 $89,500Highest selling price $1,900,000 $425,000 $365,000 $425,000 $1,900,000 $1,900,000 $387,000Sample size 132 12 8 4 114 111 3Sales price compared with asking price:Less than 90% 4% 1% 2% * 5% 5% *90% to 94% 15 9 * 26 15 15 *95% to 99% 44 9 * 28 48 47 82100% 28 81 98 46 23 23 18101% to 110% 7 * * * 8 8 *More than 110% 2 * * * 2 2 *Median (sales price as a percent of asking price)
98% 100% 100% 98% 98% 98% 97%
Number of times asking price was reduced:None 54% 83% 98% 59% 51% 50% 67%One 34 9 2 20 36 36 33Two 10 8 * 20 11 12 *Three or more 2 * * * 2 2 *
* Less than one percent
U.S.
All Sellers All FSBOSeller knew
buyer
Seller did not know
buyerAll Agent-assisted
Agent-assisted only
First FSBO, then Agent-
assistedMedian selling price $239,000 $187,200 $195,400 $180,000 $247,000 $250,000 $192,000Sales price compared with asking price:Less than 90% 7% 8% 5% 11% 7% 6% 19%90% to 94% 14 8 3 11 15 15 1795% to 99% 41 35 20 46 42 42 41100% 26 42 67 25 23 24 14101% to 110% 9 5 2 6 9 10 5More than 110% 3 2 3 1 4 4 4Median (sales price as a percent of asking price)
98% 99% 100% 98% 98% 98% 96%
Number of times asking price was reduced:None 53% 63% 75% 54% 52% 53% 35%One 34 31 17 40 34 34 44Two 8 5 7 3 9 9 6Three or more 5 2 1 3 5 5 16
FSBO
FSBO Agent-Assisted
Agent-Assisted
CAUTIONARY NOTE: Small sample sizes in some cases do not allow statistically robust results to be obtained. Please use caution when interpreting the results in cases where sample sizes are small.
The 2006 National Association of Realtors® Profile of Home Buyers and Sellers Chapter 8, Page 7 of 15

FOR SALE BY OWNERS SELLERS
Exhibit 8-7TIME ON THE MARKET, FSBO AND AGENT-ASSISTED SELLERS(Percentage Distribution)
Texas
All Sellers All FSBO
Seller knew buyer
Seller did not know
buyerAll Agent-assisted
Agent-assisted
only
First FSBO, then Agent-
assistedLess than 1 week 4% 26% 40% 11% 1% 1% N/A1 to 2 weeks 25 34 59 6 25 26 23 to 4 weeks 19 * * * 20 20 *5 to 6 weeks 7 * * * 8 8 167 to 8 weeks 7 10 1 20 6 6 *9 to 10 weeks 7 20 * 41 6 5 3111 to 16 weeks 16 1 * 1 18 19 *17 or more weeks 15 10 * 20 16 15 51Median weeks 6 2 1 10 6 6 18
U.S.
All Sellers All FSBO
Seller knew buyer
Seller did not know
buyerAll Agent-assisted
Agent-assisted
only
First FSBO, then Agent-
assistedLess than 1 week 5% 19% 40% 8% 3% 3% N/A1 to 2 weeks 27 29 36 26 27 27 123 to 4 weeks 15 17 4 22 14 15 55 to 6 weeks 7 5 4 4 8 8 57 to 8 weeks 8 6 6 5 8 8 89 to 10 weeks 4 2 2 2 5 5 611 to 16 weeks 16 16 * 23 16 16 2017 or more weeks 18 8 7 8 19 18 44Median weeks 6 3 1 4 6 6 12
* Less than one percent
FSBO
FSBO Agent-Assisted
Agent-Assisted
The 2006 National Association of Realtors® Profile of Home Buyers and Sellers Chapter 8, Page 8 of 15

FOR SALE BY OWNERS SELLERS
Exhibit 8-8SELLER URGENCY, FSBO AND AGENT-ASSISTED SELLERS(Percentage Distribution)
Texas
Sellers needed to sell: All Sellers All FSBO
Seller knew buyer
Seller did not know
buyerAll Agent-assisted
Agent-assisted
only
First FSBO, then Agent-
assistedVery urgently 21% 9% 14% * 23% 23% *Somewhat urgently 44 46 38 58 44 43 80Not urgently 34 45 48 42 33 34 20
* Less than one percent
U.S.
Sellers needed to sell: All Sellers All FSBO
Seller knew buyer
Seller did not know
buyerAll Agent-assisted
Agent-assisted
only
First FSBO, then Agent-
assistedVery urgently 20% 19% 13% 23% 20% 20% 10%Somewhat urgently 50 47 61 37 51 50 58Not urgently 30 34 25 40 30 29 32
FSBO
FSBO Agent-Assisted
Agent-Assisted
The 2006 National Association of Realtors® Profile of Home Buyers and Sellers Chapter 8, Page 9 of 15

FOR SALE BY OWNERS SELLERS
Exhibit 8-9MOST IMPORTANT REASON FOR SELLING HOME AS FSBO(Percentage Distribution)
Texas
All FSBOSeller knew
buyerSeller did not know buyer
Did not want to pay commission fee 43% 31% 67%Sold it to a relative, friend or neighbor 36 53 *Buyers contacted seller directly 20 16 30Did not want to deal with an agent * * *Agent was unable to sell home 1 * 4Seller has real estate license * * *Could not find agent to handle transaction * * *Other * * *
U.S.
All FSBOSeller knew
buyerSeller did not know buyer
Did not want to pay commission fee 51% 26% 66%Sold it to a relative, friend or neighbor 22 54 2Buyers contacted seller directly 12 12 12Did not want to deal with an agent 8 4 10Agent was unable to sell home 3 4 3Seller has real estate license 2 * 3Could not find agent to handle transaction 1 * 1Other 2 * 3
* Less than one percent
The 2006 National Association of Realtors® Profile of Home Buyers and Sellers Chapter 8, Page 10 of 15
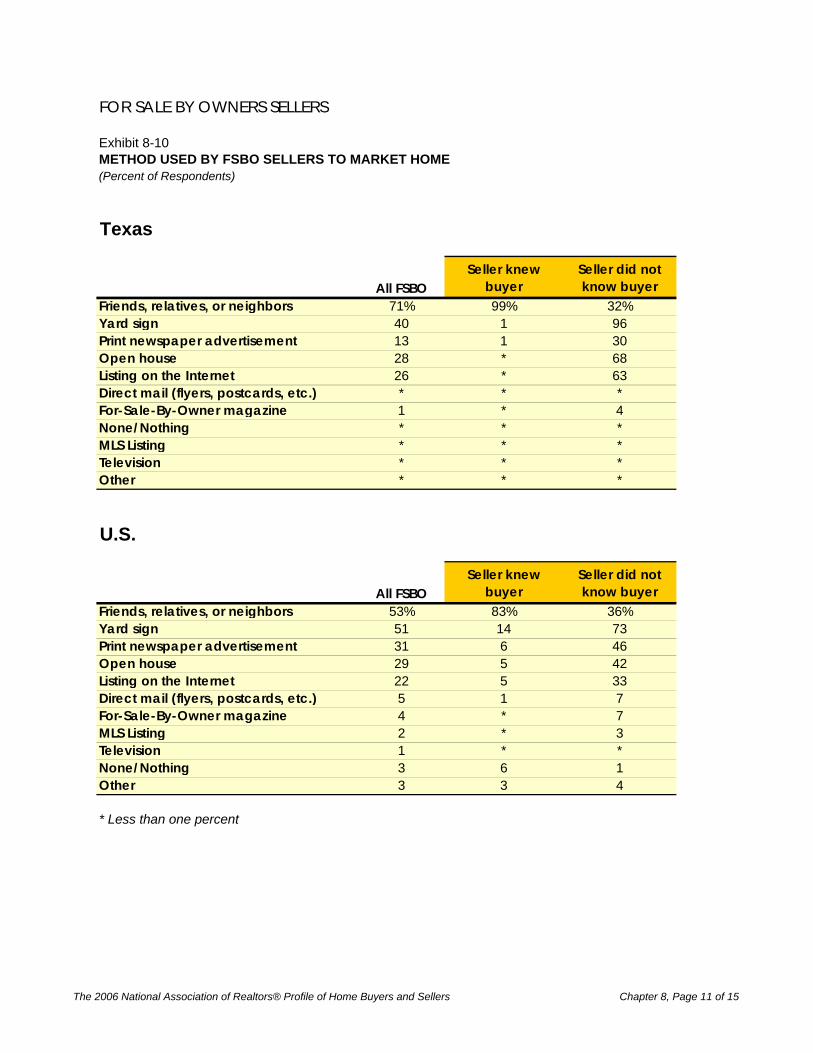
FOR SALE BY OWNERS SELLERS
Exhibit 8-10METHOD USED BY FSBO SELLERS TO MARKET HOME(Percent of Respondents)
Texas
All FSBOSeller knew
buyerSeller did not know buyer
Friends, relatives, or neighbors 71% 99% 32%Yard sign 40 1 96Print newspaper advertisement 13 1 30Open house 28 * 68Listing on the Internet 26 * 63Direct mail (flyers, postcards, etc.) * * *For-Sale-By-Owner magazine 1 * 4None/Nothing * * *MLS Listing * * *Television * * *Other * * *
U.S.
All FSBOSeller knew
buyerSeller did not know buyer
Friends, relatives, or neighbors 53% 83% 36%Yard sign 51 14 73Print newspaper advertisement 31 6 46Open house 29 5 42Listing on the Internet 22 5 33Direct mail (flyers, postcards, etc.) 5 1 7For-Sale-By-Owner magazine 4 * 7MLS Listing 2 * 3Television 1 * *None/Nothing 3 6 1Other 3 3 4
* Less than one percent
The 2006 National Association of Realtors® Profile of Home Buyers and Sellers Chapter 8, Page 11 of 15

FOR SALE BY OWNERS SELLERS
Exhibit 8-11MOST DIFFICULT TASK FOR FSBO SELLERS(Percent of Respondents)
Texas
All FSBOSeller knew
buyerSeller did not know buyer
Preparing or fixing up the home for sale 13% 17% 3%Understanding and performing paperwork 12 * 47Selling within the length of time planned 1 * 5Getting the price right 17 23 *Attracting potential buyers 11 * 42Having enough time to devote to all aspects of the sale 11 15 *Helping buyer obtain financing 12 16 *None/Nothing 22 29 3Other 22 29 3
U.S.
All FSBOSeller knew
buyerSeller did not know buyer
Preparing or fixing up the home for sale 18% 21% 16%Understanding and performing paperwork 16 16 17Selling within the length of time planned 15 13 17Getting the price right 11 17 7Attracting potential buyers 9 * 15Having enough time to devote to all aspects of the sale 9 10 8Helping buyer obtain financing 5 8 2None/Nothing 14 14 14Other 2 * 3
* Less than one percent
The 2006 National Association of Realtors® Profile of Home Buyers and Sellers Chapter 8, Page 12 of 15

FOR SALE BY OWNERS SELLERS
Exhibit 8-12BUYER OF FSBO HOME WAS ASSISTED BY A REAL ESTATE AGENT(Percentage of Distribution)
Texas
All FSBOSeller knew
buyerSeller did not know buyer
Assisted by an agent 20% * 53%Not assisted by an agent 80 100 47Don't know * * *
U.S.
All FSBOSeller Knew
BuyerSeller did not Know Buyer
Assisted by an agent 18% 6% 26%Not assisted by an agent 78 92 69Don't know 4 2 5
The 2006 National Association of Realtors® Profile of Home Buyers and Sellers Chapter 8, Page 13 of 15
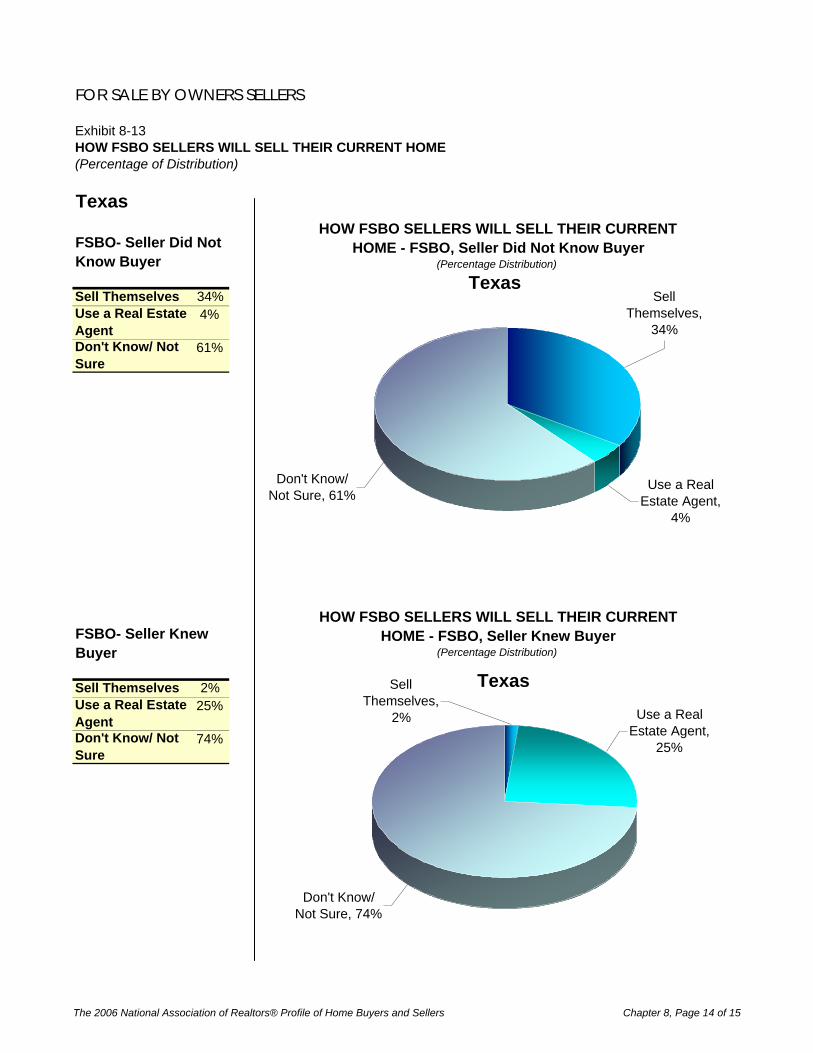
FOR SALE BY OWNERS SELLERS
Exhibit 8-13HOW FSBO SELLERS WILL SELL THEIR CURRENT HOME(Percentage of Distribution)
Texas
Sell Themselves 34%Use a Real Estate Agent
4%
Don't Know/ Not Sure
61%
Sell Themselves 2%Use a Real Estate Agent
25%
Don't Know/ Not Sure
74%
FSBO- Seller Did Not Know Buyer
FSBO- Seller Knew Buyer
HOW FSBO SELLERS WILL SELL THEIR CURRENT HOME - FSBO, Seller Did Not Know Buyer
(Percentage Distribution)
Don't Know/ Not Sure, 61%
Use a Real Estate Agent,
4%
Sell Themselves,
34%
Texas
HOW FSBO SELLERS WILL SELL THEIR CURRENT HOME - FSBO, Seller Knew Buyer
(Percentage Distribution)
Use a Real Estate Agent,
25%
Don't Know/ Not Sure, 74%
Sell Themselves,
2%
Texas
The 2006 National Association of Realtors® Profile of Home Buyers and Sellers Chapter 8, Page 14 of 15

FOR SALE BY OWNERS SELLERS
HOW FSBO SELLERS WILL SELL THEIR CURRENT HOME(Percentage of Distribution)
U.S.
Sell Themselves 46%Use a Real Estate Agent
10%
Don't Know/ Not Sure
44%
Sell Themselves 13%Use a Real Estate Agent
35%
Don't Know/ Not Sure
51%
FSBO- Seller Did Not Know Buyer
FSBO- Seller Knew Buyer
HOW FSBO SELLERS WILL SELL THEIR CURRENT HOME - FSBO, Seller Did Not Know Buyer
(Percentage Distribution)
Sell Themselves,
46%Don't Know/
Not Sure, 44%
Use a Real Estate Agent,
10%
U.S.
HOW FSBO SELLERS WILL SELL THEIR CURRENT HOME - FSBO, Seller Knew Buyer
(Percentage Distribution)
Sell Themselves,
13%
Don't Know/ Not Sure, 51%
Use a Real Estate Agent,
35%
U.S.
The 2006 National Association of Realtors® Profile of Home Buyers and Sellers Chapter 8, Page 15 of 15
Top Related