


Languages
Pages
Legal

7/30/2019 2006 _ harris county _ deer park isd _ 2006 texas school survey of drug and alcohol use _ elementary report
http://slidepdf.com/reader/full/2006-harris-county-deer-park-isd-2006-texas-school-survey-of-drug-and 1/38
Deer Park
Spring 2006
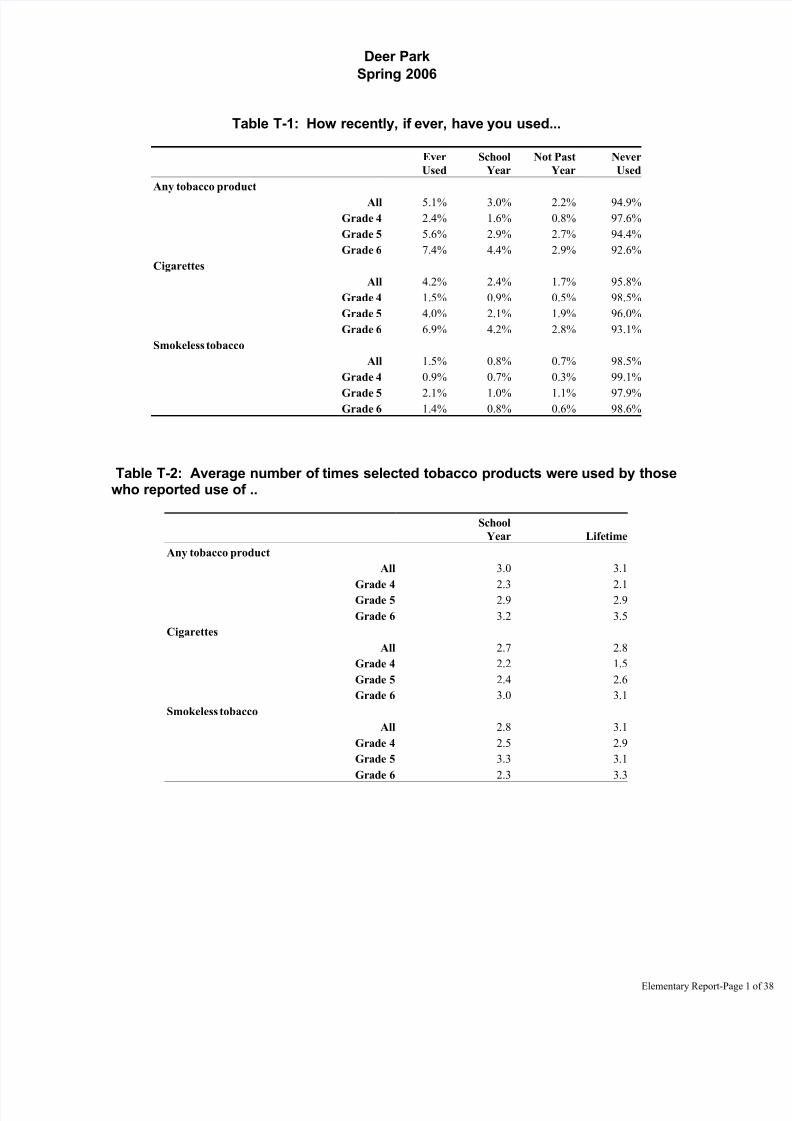
Table T-1: How recently, if ever, have you used...
Ever
Used
School
Year
Not Past
Year
Never
Used
Any tobacco product
All 5.1% 3.0% 2.2% 94.9%
Grade 4 2.4% 1.6% 0.8% 97.6%
Grade 5 5.6% 2.9% 2.7% 94.4%
Grade 6 7.4% 4.4% 2.9% 92.6%
Cigarettes
All 4.2% 2.4% 1.7% 95.8%
Grade 4 1.5% 0.9% 0.5% 98.5%
Grade 5 4.0% 2.1% 1.9% 96.0%
Grade 6 6.9% 4.2% 2.8% 93.1%
Smokeless tobacco
All 1.5% 0.8% 0.7% 98.5%
Grade 4 0.9% 0.7% 0.3% 99.1%
Grade 5 2.1% 1.0% 1.1% 97.9%Grade 6 1.4% 0.8% 0.6% 98.6%
Table T-2: Average number of times selected tobacco products were used by thosewho reported use of ..
School
Year Lifetime
Any tobacco product
All 3.0 3.1
Grade 4 2.3 2.1Grade 5 2.9 2.9
Grade 6 3.2 3.5
Cigarettes
All 2.7 2.8
Grade 4 2.2 1.5
Grade 5 2.4 2.6
Grade 6 3.0 3.1
Smokeless tobacco
All 2.8 3.1
Grade 4 2.5 2.9
Grade 5 3.3 3.1
Grade 6 2.3 3.3
Elementary Report-Page

7/30/2019 2006 _ harris county _ deer park isd _ 2006 texas school survey of drug and alcohol use _ elementary report
http://slidepdf.com/reader/full/2006-harris-county-deer-park-isd-2006-texas-school-survey-of-drug-and 2/38
Deer Park
Spring 2006
Table T-3: Average age of first use of tobacco:
Grade 4 Grade 5 Grade 6
8.2 9.3 9.9
Table T-4: Age of first use of tobacco by family situation:
Never Under 8 8 9 10 11 Over 11
Two Parent Family
All 96.4% 0.7% 0.5% 0.6% 0.7% 0.6% 0.5%
Grade 4 97.6% 1.0% 0.2% 0.6% 0.6% 0.0% 0.0%
Grade 5 96.6% 0.4% 0.7% 0.7% 0.7% 0.7% 0.2%
Grade 6 95.0% 0.6% 0.6% 0.6% 0.8% 1.1% 1.3%
Other Family Situation
All 90.8% 2.4% 0.9% 0.9% 1.6% 2.0% 1.4%
Grade 4 96.9% 2.2% 0.0% 0.4% 0.0% 0.4% 0.0%
Grade 5 89.4% 3.0% 0.9% 0.9% 3.0% 3.0% 0.0%
Grade 6 86.6% 2.2% 1.7% 1.3% 1.7% 2.6% 3.9%
Table T-5: About how many of your close friends use ...
Never
Heard Of None Some Most
Any tobacco product?
All 0.8% 86.1% 12.0% 1.1%
Grade 4 1.1% 92.2% 6.0% 0.7%
Grade 5 0.6% 85.2% 12.8% 1.4%Grade 6 0.6% 81.2% 16.9% 1.3%
Cigarettes?
All 2.4% 86.1% 10.8% 0.7%
Grade 4 3.3% 91.2% 5.4% 0.1%
Grade 5 2.6% 85.4% 11.0% 1.0%
Grade 6 1.3% 81.7% 16.0% 1.0%
Smokeless tobacco?
All 6.5% 89.0% 3.8% 0.6%
Grade 4 11.3% 86.8% 1.3% 0.6%
Grade 5 5.6% 89.0% 4.7% 0.8%
Grade 6 2.9% 91.2% 5.4% 0.6%
Elementary Report-Page

7/30/2019 2006 _ harris county _ deer park isd _ 2006 texas school survey of drug and alcohol use _ elementary report
http://slidepdf.com/reader/full/2006-harris-county-deer-park-isd-2006-texas-school-survey-of-drug-and 3/38
Deer Park
Spring 2006
Table T-6: Have you ever been offered ...
Never
Heard Of Yes No
Any tobacco product?
All 1.3% 15.5% 83.2%
Grade 4 2.2% 10.0% 87.8%
Grade 5 0.9% 15.2% 83.9%
Grade 6 1.0% 21.1% 77.9%
Cigarettes?
All 2.8% 12.9% 84.3%
Grade 4 4.0% 8.3% 87.8%
Grade 5 3.2% 12.5% 84.4%
Grade 6 1.3% 18.0% 80.7%
Smokeless tobacco?
All 7.4% 5.7% 86.9%
Grade 4 12.2% 3.2% 84.6%
Grade 5 6.4% 5.8% 87.8%
Grade 6 3.6% 8.0% 88.3%
Table T-7: How dangerous do you think it is for kids your age to use ...
Never
Heard Of
Very
Dangerous Dangerous
Not at All
Dangerous Do Not Know
Any tobacco product?
All 0.7% 76.6% 18.5% 0.7% 3.5%
Grade 4 1.4% 80.4% 13.5% 0.5% 4.2%
Grade 5 0.5% 78.7% 17.0% 0.6% 3.2%
Grade 6 0.1% 70.8% 24.8% 1.0% 3.2%
Cigarettes?
All 2.0% 64.9% 27.6% 0.6% 4.9%
Grade 4 3.1% 67.7% 22.8% 0.3% 6.1%
Grade 5 2.2% 68.5% 24.6% 0.5% 4.2%
Grade 6 0.6% 58.7% 35.4% 1.1% 4.3%
Smokeless tobacco?
All 5.3% 63.8% 22.4% 1.6% 6.9%
Grade 4 9.8% 65.2% 16.8% 1.1% 7.2%
Grade 5 4.5% 66.3% 20.4% 2.2% 6.7%
Grade 6 1.9% 59.8% 29.9% 1.4% 7.0%
Elementary Report-Page

7/30/2019 2006 _ harris county _ deer park isd _ 2006 texas school survey of drug and alcohol use _ elementary report
http://slidepdf.com/reader/full/2006-harris-county-deer-park-isd-2006-texas-school-survey-of-drug-and 4/38
Deer Park
Spring 2006
Table A-1: How recently, if ever, have you used..
Ever
Used
School
Year
Not Past
Year
Never
Used
Any alcohol product
All 22.2% 14.5% 7.7% 77.8%
Grade 4 15.3% 10.3% 5.0% 84.7%
Grade 5 20.0% 14.2% 5.8% 80.0%
Grade 6 31.2% 19.0% 12.2% 68.8%
Beer
All 14.3% 8.0% 6.3% 85.7%
Grade 4 10.6% 6.6% 3.9% 89.4%
Grade 5 12.8% 7.3% 5.5% 87.2%
Grade 6 19.5% 10.0% 9.5% 80.5%
Wine coolers
All 7.6% 4.8% 2.8% 92.4%
Grade 4 3.1% 2.0% 1.1% 96.9%
Grade 5 6.6% 5.5% 1.1% 93.4%
Grade 6 12.8% 6.7% 6.1% 87.2%Wine
All 10.2% 6.3% 3.9% 89.8%
Grade 4 6.2% 4.4% 1.8% 93.8%
Grade 5 9.8% 6.0% 3.8% 90.2%
Grade 6 14.6% 8.5% 6.1% 85.4%
Liquor
All 5.8% 4.1% 1.8% 94.2%
Grade 4 3.2% 1.6% 1.6% 96.8%
Grade 5 4.5% 3.5% 1.0% 95.5%
Grade 6 9.6% 7.0% 2.6% 90.4%
Elementary Report-Page
7/30/2019 2006 _ harris county _ deer park isd _ 2006 texas school survey of drug and alcohol use _ elementary report
http://slidepdf.com/reader/full/2006-harris-county-deer-park-isd-2006-texas-school-survey-of-drug-and 5/38
Deer Park
Spring 2006
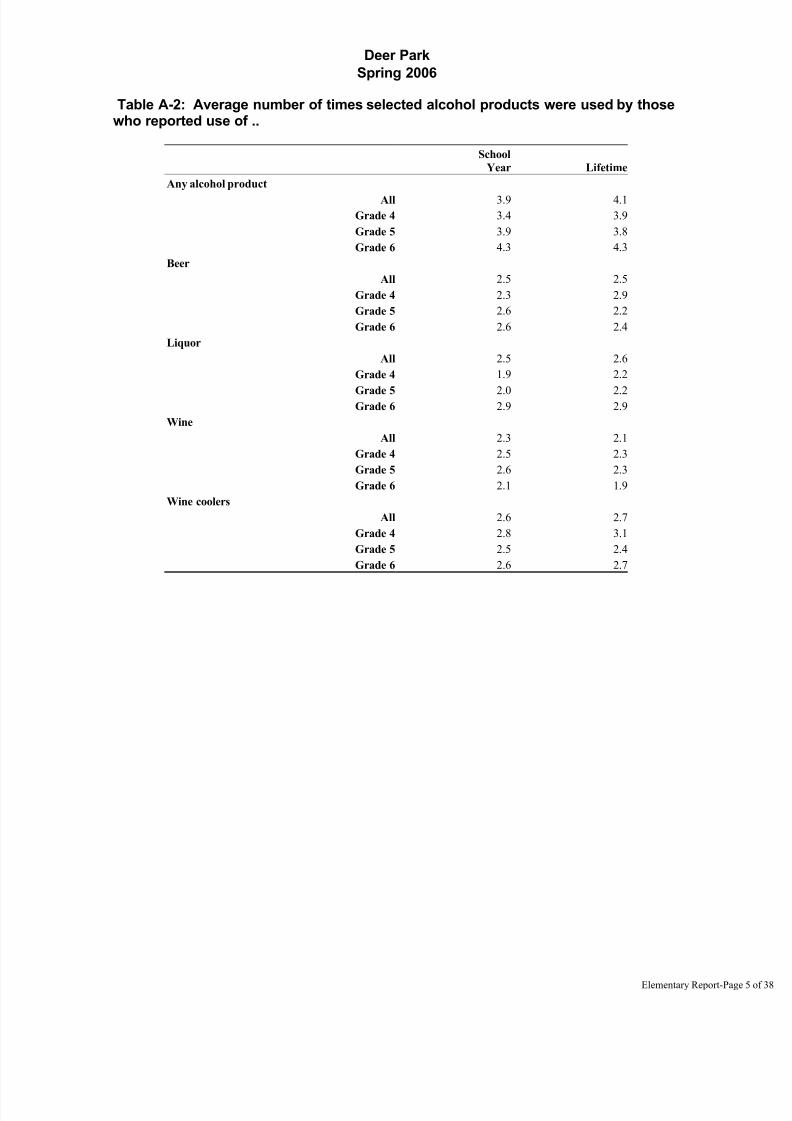
Table A-2: Average number of times selected alcohol products were used by thosewho reported use of ..
School
Year Lifetime
Any alcohol product
All 3.9 4.1
Grade 4 3.4 3.9
Grade 5 3.9 3.8
Grade 6 4.3 4.3
Beer
All 2.5 2.5
Grade 4 2.3 2.9
Grade 5 2.6 2.2
Grade 6 2.6 2.4
Liquor
All 2.5 2.6
Grade 4 1.9 2.2
Grade 5 2.0 2.2Grade 6 2.9 2.9
Wine
All 2.3 2.1
Grade 4 2.5 2.3
Grade 5 2.6 2.3
Grade 6 2.1 1.9
Wine coolers
All 2.6 2.7
Grade 4 2.8 3.1
Grade 5 2.5 2.4
Grade 6 2.6 2.7
Elementary Report-Page

7/30/2019 2006 _ harris county _ deer park isd _ 2006 texas school survey of drug and alcohol use _ elementary report
http://slidepdf.com/reader/full/2006-harris-county-deer-park-isd-2006-texas-school-survey-of-drug-and 6/38
Deer Park
Spring 2006
Table A-3: In the past year, how many times have you had two or more drinks at one time of ..
Never 1 Time 2 Times 3+ Times Ever
Beer?
All 89.1% 7.0% 2.1% 1.8% 10.9%
Grade 4 89.8% 6.9% 1.5% 1.8% 10.2%
Grade 5 88.3% 7.1% 2.9% 1.7% 11.7%
Grade 6 89.3% 6.9% 2.0% 1.9% 10.7%
Wine Coolers?
All 94.3% 3.1% 1.3% 1.3% 5.7%
Grade 4 96.9% 2.0% 0.8% 0.3% 3.1%
Grade 5 94.5% 1.9% 1.7% 1.8% 5.5%
Grade 6 91.5% 5.3% 1.4% 1.7% 8.5%
Wine?
All 91.2% 6.2% 1.5% 1.1% 8.8%
Grade 4 93.0% 5.2% 1.0% 0.8% 7.0%
Grade 5 91.6% 5.6% 1.8% 0.9% 8.4%
Grade 6 89.0% 7.7% 1.7% 1.6% 11.0%
Liquor?All 94.8% 2.8% 1.4% 0.9% 5.2%
Grade 4 96.1% 2.9% 0.7% 0.3% 3.9%
Grade 5 95.5% 2.5% 1.6% 0.5% 4.5%
Grade 6 92.8% 3.2% 2.0% 2.0% 7.2%
Elementary Report-Page

7/30/2019 2006 _ harris county _ deer park isd _ 2006 texas school survey of drug and alcohol use _ elementary report
http://slidepdf.com/reader/full/2006-harris-county-deer-park-isd-2006-texas-school-survey-of-drug-and 7/38
Deer Park
Spring 2006
Table A-4: Average age of first use of alcohol:
Grade 4 Grade 5 Grade 6
Alcohol
8.2 9.0 9.8
Beer
8.3 8.9 9.7
Wine Coolers
8.6 9.9 10.1
Wine
8.6 9.4 10.1
Liquor
8.6 9.7 10.5
Table A-5: Age of first use of alcohol by family situation:
Never Under 8 8 9 10 11 Over 11
Two Parent Family
All 81.1% 4.3% 3.1% 3.4% 3.0% 3.1% 2.0%
Grade 4 85.8% 4.7% 3.2% 4.1% 1.8% 0.4% 0.0%
Grade 5 82.5% 3.3% 3.6% 3.6% 4.7% 2.4% 0.0%
Grade 6 75.1% 5.0% 2.5% 2.3% 2.5% 6.5% 6.1%
Other Family Situation
All 68.4% 8.7% 3.6% 4.7% 5.8% 5.5% 3.2%
Grade 4 76.9% 9.3% 4.4% 6.7% 2.7% 0.0% 0.0%
Grade 5 70.6% 6.4% 3.8% 4.7% 9.8% 4.3% 0.4%
Grade 6 58.6% 10.3% 2.6% 3.0% 5.2% 11.6% 8.6%
Table A-6 : Lifetime prevalence of use of alcohol by reported conduct problemsthis school year:
No Absences
or Conduct
Problems Cut School
Sent to
Principal Both
16.8% 72.7% 36.0% 89.0%
Elementary Report-Page
7/30/2019 2006 _ harris county _ deer park isd _ 2006 texas school survey of drug and alcohol use _ elementary report
http://slidepdf.com/reader/full/2006-harris-county-deer-park-isd-2006-texas-school-survey-of-drug-and 8/38
Deer Park
Spring 2006
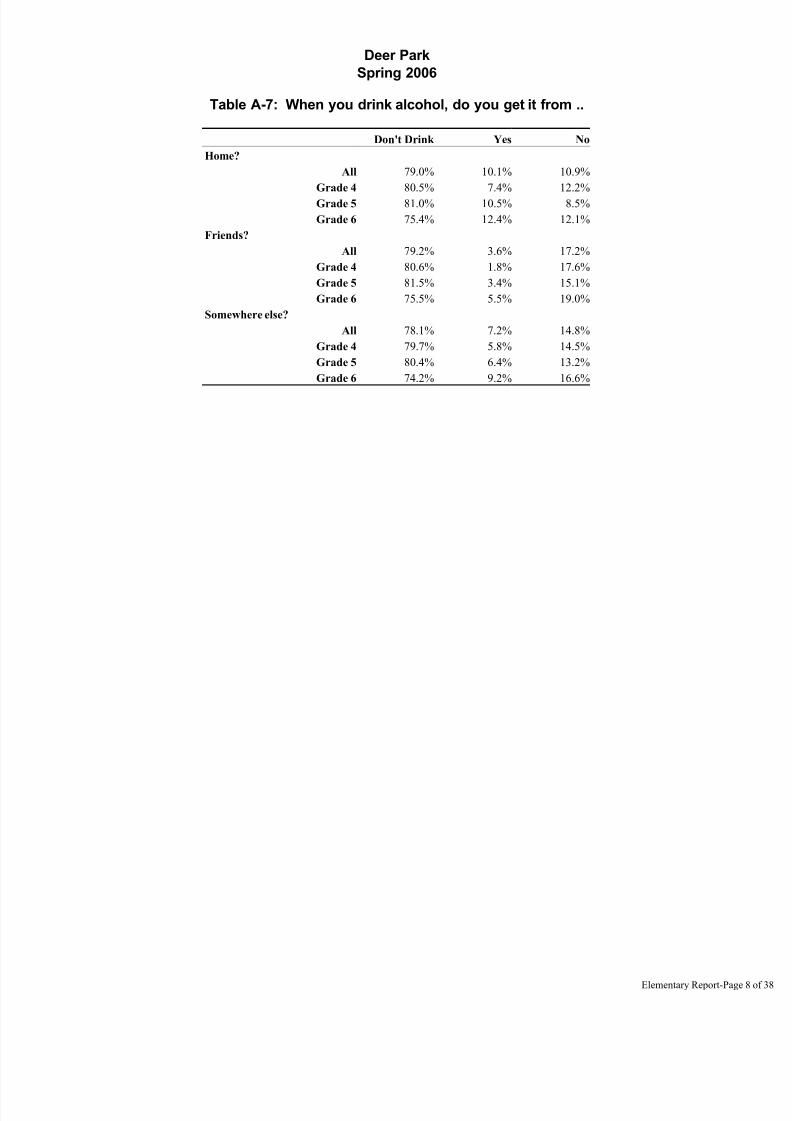
Table A-7: When you drink alcohol, do you get it from ..
Don't Drink Yes No
Home?
All 79.0% 10.1% 10.9%
Grade 4 80.5% 7.4% 12.2%
Grade 5 81.0% 10.5% 8.5%
Grade 6 75.4% 12.4% 12.1%
Friends?
All 79.2% 3.6% 17.2%
Grade 4 80.6% 1.8% 17.6%
Grade 5 81.5% 3.4% 15.1%
Grade 6 75.5% 5.5% 19.0%
Somewhere else?
All 78.1% 7.2% 14.8%
Grade 4 79.7% 5.8% 14.5%
Grade 5 80.4% 6.4% 13.2%
Grade 6 74.2% 9.2% 16.6%
Elementary Report-Page
7/30/2019 2006 _ harris county _ deer park isd _ 2006 texas school survey of drug and alcohol use _ elementary report
http://slidepdf.com/reader/full/2006-harris-county-deer-park-isd-2006-texas-school-survey-of-drug-and 9/38
Deer Park
Spring 2006
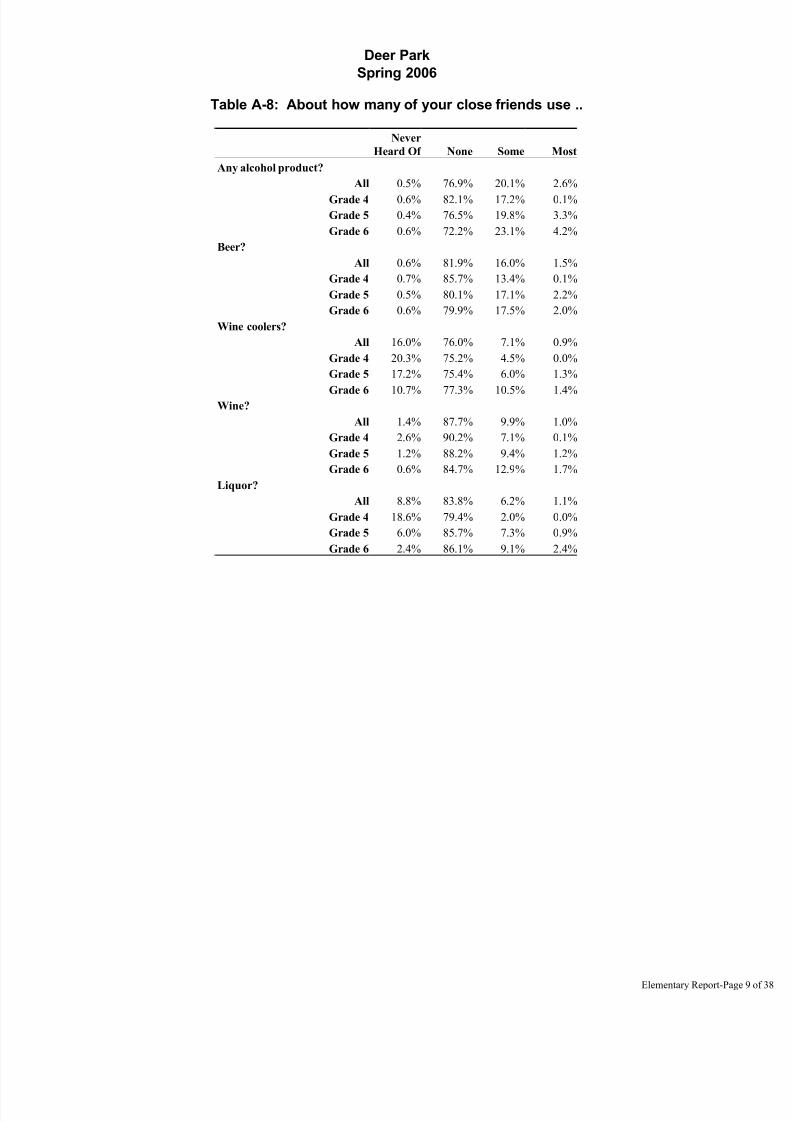
Table A-8: About how many of your close friends use ..
Never
Heard Of None Some Most
Any alcohol product?
All 0.5% 76.9% 20.1% 2.6%
Grade 4 0.6% 82.1% 17.2% 0.1%
Grade 5 0.4% 76.5% 19.8% 3.3%
Grade 6 0.6% 72.2% 23.1% 4.2%
Beer?
All 0.6% 81.9% 16.0% 1.5%
Grade 4 0.7% 85.7% 13.4% 0.1%
Grade 5 0.5% 80.1% 17.1% 2.2%
Grade 6 0.6% 79.9% 17.5% 2.0%
Wine coolers?
All 16.0% 76.0% 7.1% 0.9%
Grade 4 20.3% 75.2% 4.5% 0.0%
Grade 5 17.2% 75.4% 6.0% 1.3%
Grade 6 10.7% 77.3% 10.5% 1.4%Wine?
All 1.4% 87.7% 9.9% 1.0%
Grade 4 2.6% 90.2% 7.1% 0.1%
Grade 5 1.2% 88.2% 9.4% 1.2%
Grade 6 0.6% 84.7% 12.9% 1.7%
Liquor?
All 8.8% 83.8% 6.2% 1.1%
Grade 4 18.6% 79.4% 2.0% 0.0%
Grade 5 6.0% 85.7% 7.3% 0.9%
Grade 6 2.4% 86.1% 9.1% 2.4%
Elementary Report-Page

7/30/2019 2006 _ harris county _ deer park isd _ 2006 texas school survey of drug and alcohol use _ elementary report
http://slidepdf.com/reader/full/2006-harris-county-deer-park-isd-2006-texas-school-survey-of-drug-and 10/38
Deer Park
Spring 2006
Table A-9: Have you ever been offered ..
Never
Heard Of Yes No
Any alcohol product?
All 0.8% 23.7% 75.5%
Grade 4 0.8% 17.9% 81.3%
Grade 5 0.8% 24.5% 74.7%
Grade 6 0.7% 28.7% 70.6%
Beer?
All 0.9% 18.8% 80.3%
Grade 4 0.8% 15.3% 83.8%
Grade 5 0.9% 19.8% 79.3%
Grade 6 0.9% 21.1% 78.0%
Wine coolers?
All 16.7% 7.2% 76.1%
Grade 4 20.8% 3.4% 75.8%
Grade 5 18.4% 7.2% 74.5%
Grade 6 11.0% 10.9% 78.1%Wine?
All 2.1% 10.8% 87.1%
Grade 4 2.6% 7.5% 89.9%
Grade 5 2.2% 11.2% 86.6%
Grade 6 1.4% 13.9% 84.7%
Liquor?
All 9.1% 6.9% 84.0%
Grade 4 18.6% 3.1% 78.4%
Grade 5 6.9% 6.4% 86.8%
Grade 6 2.0% 11.1% 86.9%
Elementary Report-Page
7/30/2019 2006 _ harris county _ deer park isd _ 2006 texas school survey of drug and alcohol use _ elementary report
http://slidepdf.com/reader/full/2006-harris-county-deer-park-isd-2006-texas-school-survey-of-drug-and 11/38
Deer Park
Spring 2006
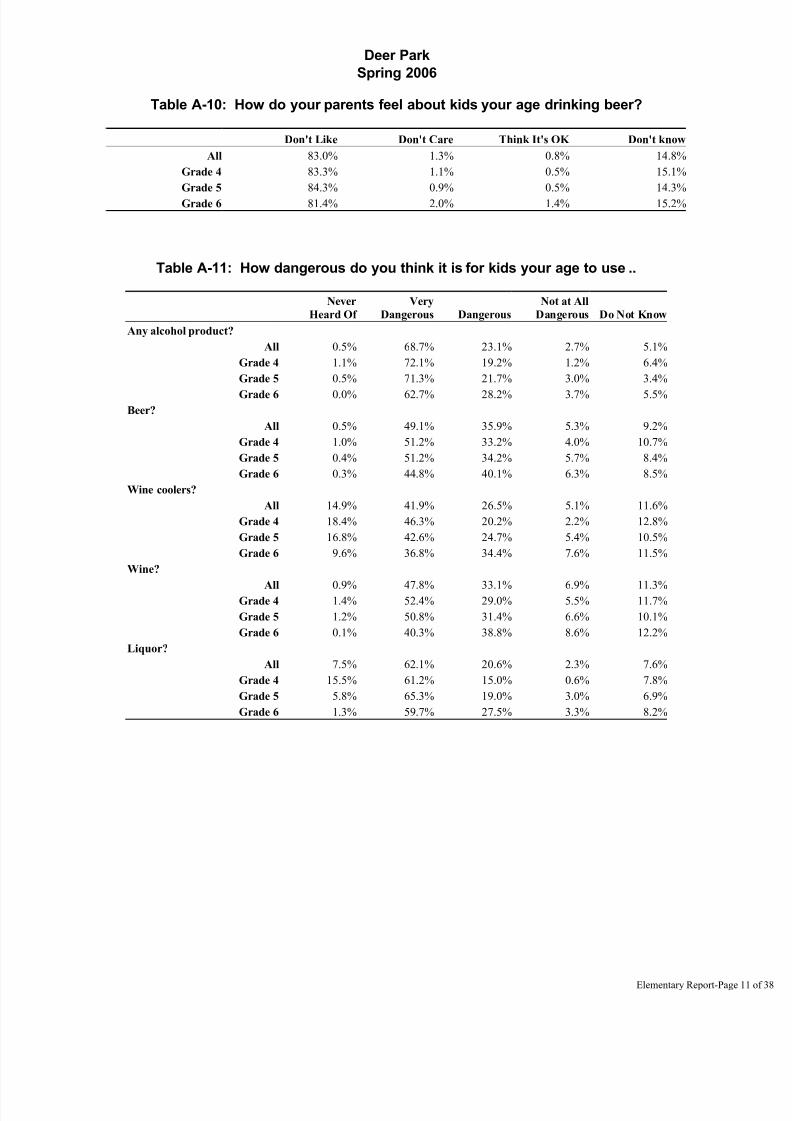
Table A-10: How do your parents feel about kids your age drinking beer?
Don't Like Don't Care Think It's OK Don't know
All 83.0% 1.3% 0.8% 14.8%
Grade 4 83.3% 1.1% 0.5% 15.1%
Grade 5 84.3% 0.9% 0.5% 14.3%
Grade 6 81.4% 2.0% 1.4% 15.2%
Table A-11: How dangerous do you think it is for kids your age to use ..
Never
Heard Of
Very
Dangerous Dangerous
Not at All
Dangerous Do Not Know
Any alcohol product?
All 0.5% 68.7% 23.1% 2.7% 5.1%
Grade 4 1.1% 72.1% 19.2% 1.2% 6.4%
Grade 5 0.5% 71.3% 21.7% 3.0% 3.4%
Grade 6 0.0% 62.7% 28.2% 3.7% 5.5%Beer?
All 0.5% 49.1% 35.9% 5.3% 9.2%
Grade 4 1.0% 51.2% 33.2% 4.0% 10.7%
Grade 5 0.4% 51.2% 34.2% 5.7% 8.4%
Grade 6 0.3% 44.8% 40.1% 6.3% 8.5%
Wine coolers?
All 14.9% 41.9% 26.5% 5.1% 11.6%
Grade 4 18.4% 46.3% 20.2% 2.2% 12.8%
Grade 5 16.8% 42.6% 24.7% 5.4% 10.5%
Grade 6 9.6% 36.8% 34.4% 7.6% 11.5%
Wine?
All 0.9% 47.8% 33.1% 6.9% 11.3%Grade 4 1.4% 52.4% 29.0% 5.5% 11.7%
Grade 5 1.2% 50.8% 31.4% 6.6% 10.1%
Grade 6 0.1% 40.3% 38.8% 8.6% 12.2%
Liquor?
All 7.5% 62.1% 20.6% 2.3% 7.6%
Grade 4 15.5% 61.2% 15.0% 0.6% 7.8%
Grade 5 5.8% 65.3% 19.0% 3.0% 6.9%
Grade 6 1.3% 59.7% 27.5% 3.3% 8.2%
Elementary Report-Page

7/30/2019 2006 _ harris county _ deer park isd _ 2006 texas school survey of drug and alcohol use _ elementary report
http://slidepdf.com/reader/full/2006-harris-county-deer-park-isd-2006-texas-school-survey-of-drug-and 12/38
Deer Park
Spring 2006
Table D-1: How recently, if ever, have you used Marijuana..
Ever
Used
School
Year
Not Past
Year
Never
Used
All 1.4% 1.0% 0.5% 98.6%
Grade 4 0.3% 0.0% 0.3% 99.7%
Grade 5 0.9% 0.6% 0.2% 99.1%
Grade 6 3.1% 2.2% 0.8% 96.9%
Table D-2: Average number of times marijuana was used by those reporting usage:
School
Year Lifetime
All 4.6 4.0
Grade 4 * *
Grade 5 3.5 2.9
Grade 6 4.8 4.3
Elementary Report-Page

7/30/2019 2006 _ harris county _ deer park isd _ 2006 texas school survey of drug and alcohol use _ elementary report
http://slidepdf.com/reader/full/2006-harris-county-deer-park-isd-2006-texas-school-survey-of-drug-and 13/38
Deer Park
Spring 2006
Table D-3: Average age of first use of marijuana:
Grade 4 Grade 5 Grade 6
* 9.3 10.8
Table D-4: Age of first use of marijuana by family situation:
Never Under 8 8 9 10 11 Over 11
Two Parent Family
All 99.0% 0.2% 0.0% 0.1% 0.0% 0.2% 0.6%
Grade 4 99.6% 0.4% 0.0% 0.0% 0.0% 0.0% 0.0%
Grade 5 99.4% 0.0% 0.0% 0.2% 0.0% 0.4% 0.0%
Grade 6 97.9% 0.2% 0.0% 0.0% 0.0% 0.2% 1.7%
Other Family Situation
All 97.2% 0.6% 0.3% 0.3% 0.3% 0.7% 0.6%
Grade 4 100.0% 0.0% 0.0% 0.0% 0.0% 0.0% 0.0%
Grade 5 97.0% 0.9% 0.4% 0.9% 0.0% 0.9% 0.0%
Grade 6 94.8% 0.9% 0.4% 0.0% 0.9% 1.3% 1.7%
Elementary Report-Page

7/30/2019 2006 _ harris county _ deer park isd _ 2006 texas school survey of drug and alcohol use _ elementary report
http://slidepdf.com/reader/full/2006-harris-county-deer-park-isd-2006-texas-school-survey-of-drug-and 14/38
Deer Park
Spring 2006
Table D-5 : Lifetime prevalence of use of marijuana by reported conductproblems this school year:
No Absences
or Conduct
Problems Cut School
Sent to
Principal Both
0.5% 10.8% 4.0% 17.7%
Table D-6: About how many of your close friends use marijuana?
Never
Heard Of None Some Most
All 13.6% 80.9% 4.4% 1.2%
Grade 4 24.4% 74.4% 1.1% 0.1%
Grade 5 12.6% 82.6% 3.7% 1.0%
Grade 6 4.0% 85.6% 8.2% 2.3%
Table D-7: Have you ever been offered marijuana?
Never
Heard Of Yes No
All 13.5% 5.2% 81.3%
Grade 4 24.0% 2.6% 73.4%
Grade 5 12.0% 5.5% 82.5%
Grade 6 4.7% 7.4% 87.9%
Table D-8: How do your parents feel about kids your age smoking marijuana?
Don't Like Don't Care Think It's OK Don't know
All 83.9% 0.6% 0.1% 15.4%
Grade 4 78.3% 0.1% 0.1% 21.4%
Grade 5 86.2% 0.8% 0.0% 13.1%
Grade 6 87.0% 1.0% 0.1% 11.8%
Table D-9: How dangerous do you think it is for kids your age to use marijuana?
Never
Heard Of
Very
Dangerous Dangerous
Not at All
Dangerous Do Not Know
All 11.8% 74.8% 7.1% 1.3% 5.0%
Grade 4 22.2% 64.0% 7.0% 0.4% 6.4%
Grade 5 10.0% 79.2% 4.9% 1.2% 4.8%
Grade 6 3.4% 81.1% 9.4% 2.3% 3.8%
Elementary Report-Page

7/30/2019 2006 _ harris county _ deer park isd _ 2006 texas school survey of drug and alcohol use _ elementary report
http://slidepdf.com/reader/full/2006-harris-county-deer-park-isd-2006-texas-school-survey-of-drug-and 15/38
Deer Park
Spring 2006
Table I-1: How recently, if ever, have you used Inhalants..
Ever
Used
School
Year
Not Past
Year
Never
Used
All 10.0% 7.8% 2.2% 90.0%
Grade 4 9.5% 7.9% 1.6% 90.5%
Grade 5 10.3% 8.0% 2.4% 89.7%
Grade 6 10.0% 7.5% 2.5% 90.0%
Table I-2: Have you ever sniffed any of the following inhalants to get high?
Not Used Used
Correction Fluid/Whiteout
All 98.1% 1.9%
Grade 4 98.5% 1.5%
Grade 5 97.9% 2.1%
Grade 6 98.0% 2.0%Gasoline
All 96.4% 3.6%
Grade 4 96.4% 3.6%
Grade 5 95.9% 4.1%
Grade 6 96.9% 3.1%
Glue
All 96.9% 3.1%
Grade 4 95.4% 4.6%
Grade 5 97.0% 3.0%
Grade 6 98.3% 1.7%
Paint Thinner
All 97.9% 2.1%Grade 4 97.8% 2.2%
Grade 5 97.7% 2.3%
Grade 6 98.3% 1.7%
Spray Paint
All 97.2% 2.8%
Grade 4 97.1% 2.9%
Grade 5 96.8% 3.2%
Grade 6 97.7% 2.3%
Other Inhalants
All 95.6% 4.4%
Grade 4 97.6% 2.4%
Grade 5 95.4% 4.6%
Grade 6 94.0% 6.0%
Elementary Report-Page
7/30/2019 2006 _ harris county _ deer park isd _ 2006 texas school survey of drug and alcohol use _ elementary report
http://slidepdf.com/reader/full/2006-harris-county-deer-park-isd-2006-texas-school-survey-of-drug-and 16/38
Deer Park
Spring 2006
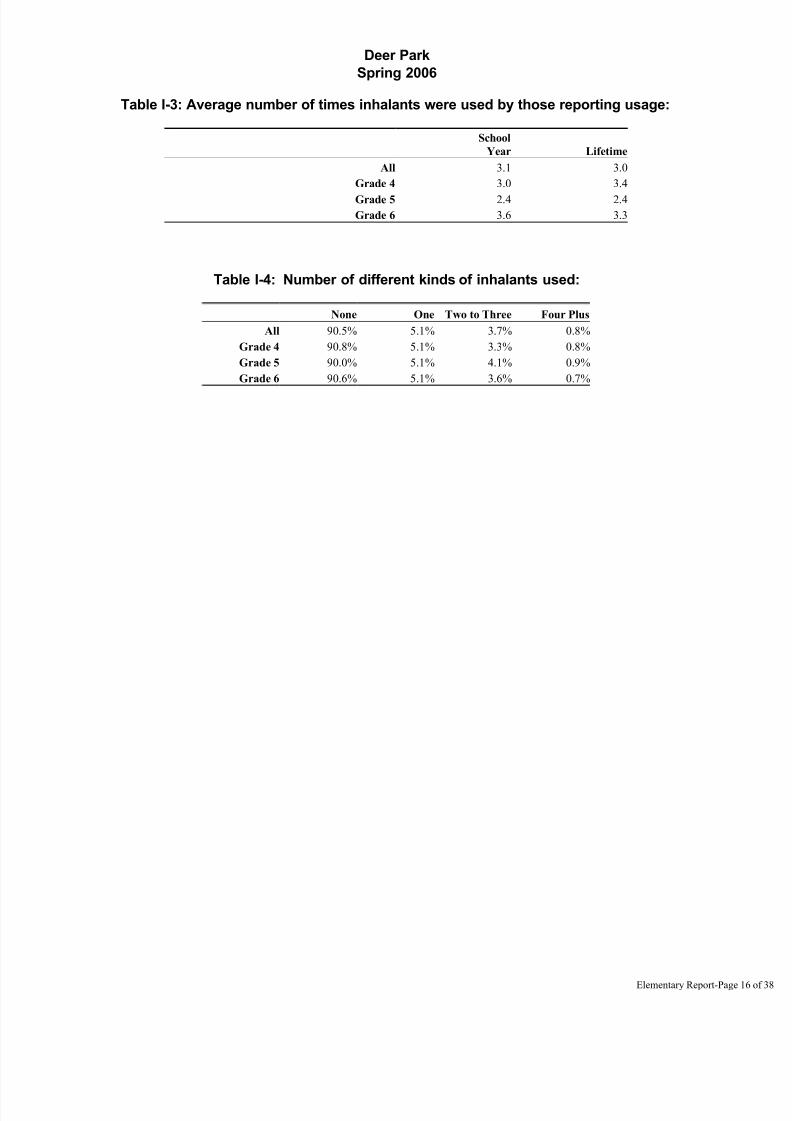
Table I-3: Average number of times inhalants were used by those reporting usage:
School
Year Lifetime
All 3.1 3.0
Grade 4 3.0 3.4
Grade 5 2.4 2.4
Grade 6 3.6 3.3
Table I-4: Number of different kinds of inhalants used:
None One Two to Three Four Plus
All 90.5% 5.1% 3.7% 0.8%
Grade 4 90.8% 5.1% 3.3% 0.8%
Grade 5 90.0% 5.1% 4.1% 0.9%
Grade 6 90.6% 5.1% 3.6% 0.7%
Elementary Report-Page

7/30/2019 2006 _ harris county _ deer park isd _ 2006 texas school survey of drug and alcohol use _ elementary report
http://slidepdf.com/reader/full/2006-harris-county-deer-park-isd-2006-texas-school-survey-of-drug-and 17/38
Deer Park
Spring 2006
Table I-5: Average age of first use of inhalants:
Grade 4 Grade 5 Grade 6
8.1 9.4 9.9
Table I-6: Age of first use of inhalants by family situation:
Never Under 8 8 9 10 11 Over 11
Two Parent Family
All 95.2% 1.5% 0.3% 0.8% 0.8% 1.0% 0.4%
Grade 4 96.6% 1.4% 0.2% 1.4% 0.4% 0.0% 0.0%
Grade 5 94.9% 1.3% 0.4% 0.5% 1.6% 1.3% 0.0%
Grade 6 94.0% 1.9% 0.2% 0.4% 0.4% 1.7% 1.3%
Other Family Situation
All 94.1% 1.5% 0.6% 0.4% 1.0% 1.3% 1.1%
Grade 4 96.8% 1.8% 0.5% 0.9% 0.0% 0.0% 0.0%
Grade 5 94.4% 0.9% 0.9% 0.4% 1.7% 1.3% 0.4%
Grade 6 91.3% 1.7% 0.4% 0.0% 1.3% 2.6% 2.6%
Elementary Report-Page

7/30/2019 2006 _ harris county _ deer park isd _ 2006 texas school survey of drug and alcohol use _ elementary report
http://slidepdf.com/reader/full/2006-harris-county-deer-park-isd-2006-texas-school-survey-of-drug-and 18/38
Deer Park
Spring 2006
Table I-7: Lifetime prevalence of use of inhalants by reported conductproblems this school year:
No Absences
or Conduct
Problems Cut School
Sent to
Principal Both
3.6% 21.9% 9.8% 32.1%
Table I-8: About how many of your close friends use inhalants?
Never
Heard Of None Some Most
All 8.8% 82.0% 7.5% 1.6%
Grade 4 16.5% 80.4% 2.4% 0.7%
Grade 5 7.2% 83.9% 7.3% 1.7%
Grade 6 3.2% 81.7% 12.6% 2.5%
Elementary Report-Page

7/30/2019 2006 _ harris county _ deer park isd _ 2006 texas school survey of drug and alcohol use _ elementary report
http://slidepdf.com/reader/full/2006-harris-county-deer-park-isd-2006-texas-school-survey-of-drug-and 19/38
Deer Park
Spring 2006
Table I-9: Have you ever been offered inhalants?
Never
Heard Of Yes No
All 8.6% 6.7% 84.6%
Grade 4 15.1% 2.9% 82.0%
Grade 5 7.6% 6.9% 85.5%
Grade 6 3.3% 10.3% 86.4%
Table I-10: How dangerous do you think it is for kids your age to use inhalants?
Never
Heard Of
Very
Dangerous Dangerous
Not at All
Dangerous Do Not Know
All 7.4% 63.0% 18.8% 2.1% 8.7%
Grade 4 14.2% 57.6% 15.1% 1.1% 12.0%
Grade 5 6.1% 64.6% 19.0% 2.5% 7.9%
Grade 6 2.0% 66.9% 22.3% 2.6% 6.2%
Elementary Report-Page
7/30/2019 2006 _ harris county _ deer park isd _ 2006 texas school survey of drug and alcohol use _ elementary report
http://slidepdf.com/reader/full/2006-harris-county-deer-park-isd-2006-texas-school-survey-of-drug-and 20/38
Deer Park
Spring 2006
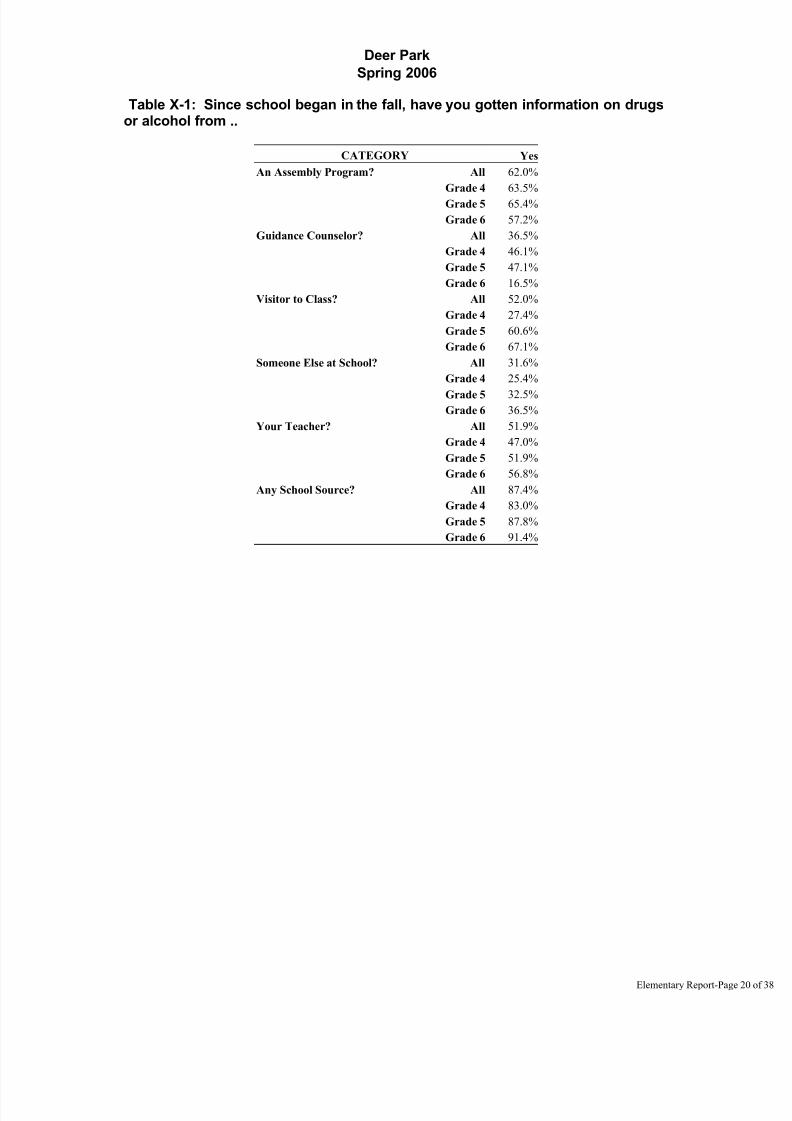
Table X-1: Since school began in the fall, have you gotten information on drugsor alcohol from ..
CATEGORY Yes
An Assembly Program? All 62.0%
Grade 4 63.5%
Grade 5 65.4%
Grade 6 57.2%
Guidance Counselor? All 36.5%
Grade 4 46.1%
Grade 5 47.1%
Grade 6 16.5%
Visitor to Class? All 52.0%
Grade 4 27.4%
Grade 5 60.6%
Grade 6 67.1%
Someone Else at School? All 31.6%
Grade 4 25.4%
Grade 5 32.5%Grade 6 36.5%
Your Teacher? All 51.9%
Grade 4 47.0%
Grade 5 51.9%
Grade 6 56.8%
Any School Source? All 87.4%
Grade 4 83.0%
Grade 5 87.8%
Grade 6 91.4%
Elementary Report-Page
7/30/2019 2006 _ harris county _ deer park isd _ 2006 texas school survey of drug and alcohol use _ elementary report
http://slidepdf.com/reader/full/2006-harris-county-deer-park-isd-2006-texas-school-survey-of-drug-and 21/38
Deer Park
Spring 2006
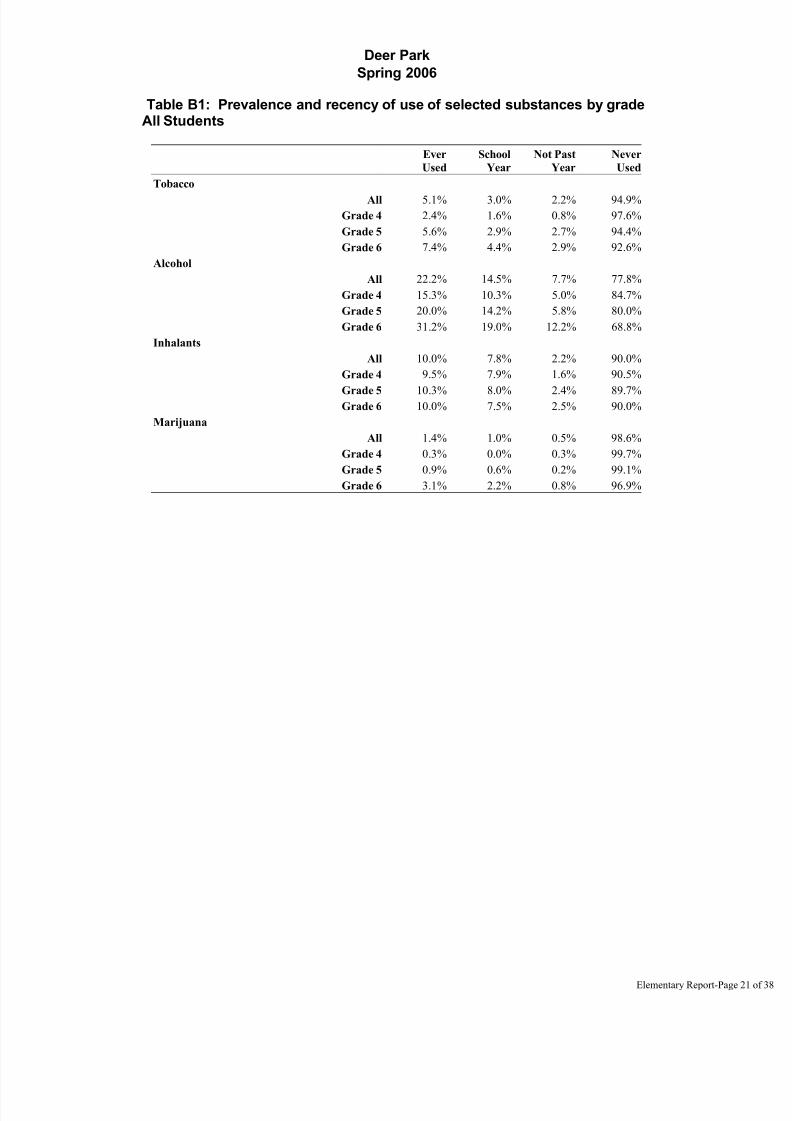
Table B1: Prevalence and recency of use of selected substances by gradeAll Students
Ever
Used
School
Year
Not Past
Year
Never
Used
Tobacco
All 5.1% 3.0% 2.2% 94.9%
Grade 4 2.4% 1.6% 0.8% 97.6%
Grade 5 5.6% 2.9% 2.7% 94.4%
Grade 6 7.4% 4.4% 2.9% 92.6%
Alcohol
All 22.2% 14.5% 7.7% 77.8%
Grade 4 15.3% 10.3% 5.0% 84.7%
Grade 5 20.0% 14.2% 5.8% 80.0%
Grade 6 31.2% 19.0% 12.2% 68.8%
Inhalants
All 10.0% 7.8% 2.2% 90.0%
Grade 4 9.5% 7.9% 1.6% 90.5%
Grade 5 10.3% 8.0% 2.4% 89.7%Grade 6 10.0% 7.5% 2.5% 90.0%
Marijuana
All 1.4% 1.0% 0.5% 98.6%
Grade 4 0.3% 0.0% 0.3% 99.7%
Grade 5 0.9% 0.6% 0.2% 99.1%
Grade 6 3.1% 2.2% 0.8% 96.9%
Elementary Report-Page

7/30/2019 2006 _ harris county _ deer park isd _ 2006 texas school survey of drug and alcohol use _ elementary report
http://slidepdf.com/reader/full/2006-harris-county-deer-park-isd-2006-texas-school-survey-of-drug-and 22/38
Deer Park
Spring 2006
Table B2: Prevalence and recency of use of selected substances by gradeMale Students
Ever
Used
School
Year
Not Past
Year
Never
Used
Tobacco
All 6.9% 4.1% 2.8% 93.1%
Grade 4 3.5% 2.6% 0.9% 96.5%
Grade 5 7.5% 5.0% 2.6% 92.5%
Grade 6 9.4% 4.7% 4.7% 90.6%
Alcohol
All 26.1% 16.2% 10.0% 73.9%
Grade 4 18.3% 11.9% 6.4% 81.7%
Grade 5 22.5% 14.9% 7.6% 77.5%
Grade 6 37.1% 21.3% 15.8% 62.9%
Inhalants
All 11.6% 8.7% 2.9% 88.4%
Grade 4 11.1% 8.5% 2.6% 88.9%
Grade 5 12.8% 9.9% 2.8% 87.2%Grade 6 10.9% 7.5% 3.3% 89.1%
Marijuana
All 1.8% 1.1% 0.7% 98.2%
Grade 4 0.3% 0.0% 0.3% 99.7%
Grade 5 1.2% 1.0% 0.2% 98.8%
Grade 6 3.9% 2.2% 1.7% 96.1%
Elementary Report-Page

7/30/2019 2006 _ harris county _ deer park isd _ 2006 texas school survey of drug and alcohol use _ elementary report
http://slidepdf.com/reader/full/2006-harris-county-deer-park-isd-2006-texas-school-survey-of-drug-and 23/38
Deer Park
Spring 2006
Table B3: Prevalence and recency of use of selected substances by gradeFemale Students
Ever
Used
School
Year
Not Past
Year
Never
Used
Tobacco
All 3.4% 1.8% 1.5% 96.6%
Grade 4 1.5% 0.8% 0.8% 98.5%
Grade 5 3.4% 0.5% 2.9% 96.6%
Grade 6 5.3% 4.2% 1.1% 94.7%
Alcohol
All 18.4% 12.9% 5.4% 81.6%
Grade 4 12.8% 9.0% 3.8% 87.3%
Grade 5 17.3% 13.4% 3.9% 82.7%
Grade 6 25.3% 16.7% 8.6% 74.7%
Inhalants
All 8.3% 6.9% 1.4% 91.7%
Grade 4 8.1% 7.4% 0.8% 91.9%
Grade 5 7.7% 5.8% 1.8% 92.3%Grade 6 9.2% 7.5% 1.7% 90.8%
Marijuana
All 1.0% 0.8% 0.2% 99.0%
Grade 4 0.3% 0.0% 0.3% 99.7%
Grade 5 0.5% 0.3% 0.3% 99.5%
Grade 6 2.2% 2.2% 0.0% 97.8%
Elementary Report-Page

7/30/2019 2006 _ harris county _ deer park isd _ 2006 texas school survey of drug and alcohol use _ elementary report
http://slidepdf.com/reader/full/2006-harris-county-deer-park-isd-2006-texas-school-survey-of-drug-and 24/38
Deer Park
Spring 2006
Table B4: Prevalence and recency of use of selected substances by gradeWhite Students
Ever
Used
School
Year
Not Past
Year
Never
Used
Tobacco
All 4.7% 2.8% 1.9% 95.3%
Grade 4 1.8% 1.0% 0.8% 98.2%
Grade 5 4.4% 2.7% 1.7% 95.6%
Grade 6 7.7% 4.6% 3.1% 92.3%
Alcohol
All 19.0% 12.4% 6.6% 81.0%
Grade 4 12.2% 8.3% 3.9% 87.8%
Grade 5 16.4% 12.0% 4.4% 83.6%
Grade 6 27.8% 16.7% 11.1% 72.2%
Inhalants
All 8.3% 6.8% 1.5% 91.7%
Grade 4 8.9% 7.3% 1.6% 91.1%
Grade 5 9.8% 7.6% 2.2% 90.2%Grade 6 6.2% 5.5% 0.8% 93.8%
Marijuana
All 1.2% 0.8% 0.4% 98.8%
Grade 4 0.3% 0.0% 0.3% 99.7%
Grade 5 1.2% 0.7% 0.5% 98.8%
Grade 6 2.1% 1.6% 0.5% 97.9%
Elementary Report-Page

7/30/2019 2006 _ harris county _ deer park isd _ 2006 texas school survey of drug and alcohol use _ elementary report
http://slidepdf.com/reader/full/2006-harris-county-deer-park-isd-2006-texas-school-survey-of-drug-and 25/38
Deer Park
Spring 2006
Table B5: Prevalence and recency of use of selected substances by gradeAfrican/American Students
Ever
Used
School
Year
Not Past
Year
Never
Used
Tobacco
All 9.9% 8.3% 1.6% 90.1%
Grade 4 10.0% 10.0% 0.0% 90.0%
Grade 5 12.5% 8.3% 4.2% 87.5%
Grade 6 6.3% 6.3% 0.0% 93.8%
Alcohol
All 33.5% 19.9% 13.6% 66.5%
Grade 4 25.0% 15.0% 10.0% 75.0%
Grade 5 33.3% 25.0% 8.3% 66.7%
Grade 6 43.8% 18.8% 25.0% 56.3%
Inhalants
All 13.9% 10.4% 3.5% 86.1%
Grade 4 11.1% 11.1% 0.0% 88.9%
Grade 5 12.5% 8.3% 4.2% 87.5%Grade 6 18.8% 12.5% 6.3% 81.3%
Marijuana
All 1.8% 0.0% 1.8% 98.2%
Grade 4 0.0% 0.0% 0.0% 100.0%
Grade 5 0.0% 0.0% 0.0% 100.0%
Grade 6 6.3% 0.0% 6.3% 93.8%
Elementary Report-Page

7/30/2019 2006 _ harris county _ deer park isd _ 2006 texas school survey of drug and alcohol use _ elementary report
http://slidepdf.com/reader/full/2006-harris-county-deer-park-isd-2006-texas-school-survey-of-drug-and 26/38
Deer Park
Spring 2006
Table B6: Prevalence and recency of use of selected substances by gradeMexican/American Students
Ever
Used
School
Year
Not Past
Year
Never
Used
Tobacco
All 5.8% 3.2% 2.7% 94.2%
Grade 4 2.8% 2.0% 0.8% 97.2%
Grade 5 6.2% 2.8% 3.5% 93.8%
Grade 6 8.2% 4.7% 3.5% 91.8%
Alcohol
All 26.4% 18.0% 8.4% 73.6%
Grade 4 20.0% 13.5% 6.5% 80.0%
Grade 5 22.6% 16.7% 5.9% 77.4%
Grade 6 35.9% 23.4% 12.5% 64.1%
Inhalants
All 12.8% 9.7% 3.1% 87.2%
Grade 4 10.4% 8.3% 2.1% 89.6%
Grade 5 12.6% 10.1% 2.4% 87.4%Grade 6 15.2% 10.5% 4.7% 84.8%
Marijuana
All 2.1% 1.6% 0.5% 97.9%
Grade 4 0.4% 0.0% 0.4% 99.6%
Grade 5 0.7% 0.7% 0.0% 99.3%
Grade 6 5.1% 3.9% 1.2% 94.9%
Elementary Report-Page

7/30/2019 2006 _ harris county _ deer park isd _ 2006 texas school survey of drug and alcohol use _ elementary report
http://slidepdf.com/reader/full/2006-harris-county-deer-park-isd-2006-texas-school-survey-of-drug-and 27/38
Deer Park
Spring 2006
Table B7: Prevalence and recency of use of selected substances by gradeStudents Reporting A Grades
Ever
Used
School
Year
Not Past
Year
Never
Used
Tobacco
All 1.8% 0.8% 1.0% 98.2%
Grade 4 0.4% 0.0% 0.4% 99.6%
Grade 5 3.0% 1.7% 1.3% 97.0%
Grade 6 2.0% 0.7% 1.3% 98.0%
Alcohol
All 17.0% 9.9% 7.1% 83.0%
Grade 4 10.9% 6.0% 4.9% 89.1%
Grade 5 15.9% 10.6% 5.3% 84.1%
Grade 6 23.5% 12.8% 10.7% 76.5%
Inhalants
All 5.5% 4.4% 1.1% 94.5%
Grade 4 5.0% 3.9% 1.1% 95.0%
Grade 5 7.0% 5.7% 1.3% 93.0%Grade 6 4.7% 3.7% 1.0% 95.3%
Marijuana
All 0.6% 0.3% 0.2% 99.4%
Grade 4 0.4% 0.0% 0.4% 99.6%
Grade 5 1.0% 0.7% 0.3% 99.0%
Grade 6 0.3% 0.3% 0.0% 99.7%
Elementary Report-Page

7/30/2019 2006 _ harris county _ deer park isd _ 2006 texas school survey of drug and alcohol use _ elementary report
http://slidepdf.com/reader/full/2006-harris-county-deer-park-isd-2006-texas-school-survey-of-drug-and 28/38
Deer Park
Spring 2006
Table B8: Prevalence and recency of use of selected substances by gradeStudents Reporting grades lower than A
Ever
Used
School
Year
Not Past
Year
Never
Used
Tobacco
All 7.5% 4.5% 3.0% 92.5%
Grade 4 3.8% 2.7% 1.1% 96.2%
Grade 5 7.3% 3.7% 3.7% 92.7%
Grade 6 11.4% 7.3% 4.1% 88.6%
Alcohol
All 25.8% 17.6% 8.2% 74.2%
Grade 4 18.3% 13.2% 5.1% 81.7%
Grade 5 22.5% 16.6% 5.9% 77.5%
Grade 6 36.9% 23.3% 13.6% 63.1%
Inhalants
All 12.9% 10.1% 2.8% 87.1%
Grade 4 12.2% 10.4% 1.8% 87.8%
Grade 5 12.7% 9.6% 3.1% 87.3%Grade 6 13.9% 10.2% 3.7% 86.1%
Marijuana
All 2.0% 1.4% 0.6% 98.0%
Grade 4 0.2% 0.0% 0.2% 99.8%
Grade 5 0.8% 0.6% 0.2% 99.2%
Grade 6 5.1% 3.6% 1.5% 94.9%
Elementary Report-Page

7/30/2019 2006 _ harris county _ deer park isd _ 2006 texas school survey of drug and alcohol use _ elementary report
http://slidepdf.com/reader/full/2006-harris-county-deer-park-isd-2006-texas-school-survey-of-drug-and 29/38
Deer Park
Spring 2006
Table B9: Prevalence and recency of use of selected substances by gradeStudents Living With 2 Parents
Ever
Used
School
Year
Not Past
Year
Never
Used
Tobacco
All 3.3% 2.1% 1.2% 96.7%
Grade 4 1.6% 1.4% 0.2% 98.4%
Grade 5 3.6% 1.8% 1.8% 96.4%
Grade 6 4.8% 3.1% 1.7% 95.2%
Alcohol
All 18.8% 12.4% 6.4% 81.2%
Grade 4 12.9% 8.4% 4.5% 87.1%
Grade 5 16.8% 12.0% 4.8% 83.2%
Grade 6 26.7% 16.8% 9.9% 73.3%
Inhalants
All 9.4% 7.2% 2.1% 90.6%
Grade 4 9.3% 7.9% 1.4% 90.7%
Grade 5 9.9% 7.4% 2.5% 90.1%Grade 6 8.9% 6.4% 2.5% 91.1%
Marijuana
All 1.0% 0.7% 0.3% 99.0%
Grade 4 0.4% 0.0% 0.4% 99.6%
Grade 5 0.5% 0.4% 0.2% 99.5%
Grade 6 2.1% 1.7% 0.4% 97.9%
Elementary Report-Page

7/30/2019 2006 _ harris county _ deer park isd _ 2006 texas school survey of drug and alcohol use _ elementary report
http://slidepdf.com/reader/full/2006-harris-county-deer-park-isd-2006-texas-school-survey-of-drug-and 30/38
Deer Park
Spring 2006
Table B10: Prevalence and recency of use of selected substances by gradeStudents Not Living With 2 Parents
Ever
Used
School
Year
Not Past
Year
Never
Used
Tobacco
All 9.3% 5.0% 4.3% 90.7%
Grade 4 4.3% 2.2% 2.2% 95.7%
Grade 5 10.5% 5.4% 5.0% 89.5%
Grade 6 12.8% 7.3% 5.6% 87.2%
Alcohol
All 30.0% 19.3% 10.7% 70.0%
Grade 4 20.4% 14.3% 6.1% 79.6%
Grade 5 27.7% 19.3% 8.4% 72.3%
Grade 6 41.0% 23.9% 17.1% 59.0%
Inhalants
All 11.4% 9.1% 2.3% 88.6%
Grade 4 10.2% 8.0% 2.2% 89.8%
Grade 5 11.3% 9.2% 2.1% 88.7%Grade 6 12.6% 10.0% 2.6% 87.4%
Marijuana
All 2.4% 1.6% 0.7% 97.6%
Grade 4 0.0% 0.0% 0.0% 100.0%
Grade 5 1.7% 1.3% 0.4% 98.3%
Grade 6 5.2% 3.4% 1.7% 94.8%
Elementary Report-Page

7/30/2019 2006 _ harris county _ deer park isd _ 2006 texas school survey of drug and alcohol use _ elementary report
http://slidepdf.com/reader/full/2006-harris-county-deer-park-isd-2006-texas-school-survey-of-drug-and 31/38
Deer Park
Spring 2006
Table B11: Prevalence and recency of use of selected substances by gradeStudents Living in Town More Than 3 Years
Ever
Used
School
Year
Not Past
Year
Never
Used
Tobacco
All 5.0% 3.1% 1.9% 95.0%
Grade 4 1.9% 1.4% 0.5% 98.1%
Grade 5 5.2% 2.9% 2.3% 94.8%
Grade 6 7.8% 4.8% 2.9% 92.2%
Alcohol
All 21.2% 14.5% 6.7% 78.8%
Grade 4 13.7% 9.3% 4.4% 86.3%
Grade 5 18.4% 13.8% 4.5% 81.6%
Grade 6 30.9% 19.8% 11.0% 69.1%
Inhalants
All 9.9% 7.8% 2.2% 90.1%
Grade 4 10.2% 8.8% 1.4% 89.8%
Grade 5 10.7% 8.3% 2.4% 89.3%Grade 6 9.0% 6.4% 2.6% 91.0%
Marijuana
All 1.5% 1.0% 0.5% 98.5%
Grade 4 0.4% 0.0% 0.4% 99.6%
Grade 5 1.1% 0.8% 0.3% 98.9%
Grade 6 2.8% 2.1% 0.7% 97.2%
Elementary Report-Page
7/30/2019 2006 _ harris county _ deer park isd _ 2006 texas school survey of drug and alcohol use _ elementary report
http://slidepdf.com/reader/full/2006-harris-county-deer-park-isd-2006-texas-school-survey-of-drug-and 32/38
Deer Park
Spring 2006
Table B12: Prevalence and recency of use of selected substances by gradeStudents Living in Town 3 Years or Less
Ever
Used
School
Year
Not Past
Year
Never
Used
Tobacco
All 5.0% 3.1% 2.0% 95.0%
Grade 4 2.5% 1.2% 1.2% 97.5%
Grade 5 6.6% 3.3% 3.3% 93.4%
Grade 6 5.4% 4.3% 1.1% 94.6%
Alcohol
All 25.6% 15.3% 10.2% 74.4%
Grade 4 21.0% 14.8% 6.2% 79.0%
Grade 5 25.8% 15.0% 10.8% 74.2%
Grade 6 29.0% 16.1% 12.9% 71.0%
Inhalants
All 9.9% 8.2% 1.7% 90.1%
Grade 4 8.6% 7.4% 1.2% 91.4%
Grade 5 9.9% 7.4% 2.5% 90.1%Grade 6 11.0% 9.9% 1.1% 89.0%
Marijuana
All 1.4% 1.1% 0.4% 98.6%
Grade 4 0.0% 0.0% 0.0% 100.0%
Grade 5 0.0% 0.0% 0.0% 100.0%
Grade 6 4.3% 3.3% 1.1% 95.7%
Elementary Report-Page

7/30/2019 2006 _ harris county _ deer park isd _ 2006 texas school survey of drug and alcohol use _ elementary report
http://slidepdf.com/reader/full/2006-harris-county-deer-park-isd-2006-texas-school-survey-of-drug-and 33/38
Deer Park
Spring 2006
The FREQ Procedure
Q1 Frequency Percent
Female 1145 50.20
Male 1136 49.80
Q2 Frequency Percent
Grade 4 750 32.90
Grade 5 767 33.64
Grade 6 763 33.46
Q3 Frequency Percent
No 706 31.18
Yes 1559 68.82
Frequency Missing = 15.815465131
Q4 Frequency Percent
8 or younger 1 0.04
9 187 8.23
10 684 30.08
11 742 32.62
12 596 26.20
13 or older 64 2.82
Frequency Missing = 6.9024676223
Q5 Frequency Percent
African/American 60 2.67
Asian/American 40 1.78
Mexican/American 793 35.44
Native/American 32 1.43
Other 126 5.61
White 1187 53.07
Frequency Missing = 43.589612982
Q6 Frequency Percent
Mostly A's 888 39.62
Mostly B's 1003 44.79
Mostly C's 245 10.94
Mostly D's 55 2.46
Mostly F's 49 2.19
Frequency Missing = 40.809951893
Q7 Frequency Percent
Don't Know 196 8.63
No 296 13.05
Yes 1777 78.32
Frequency Missing = 12.808996078
Q8 Frequency Percent
Don't Know 778 34.46
No 466 20.63
Yes 1014 44.91
Frequency Missing = 23.33211237
Q9 Frequency Percent
Don't Know 734 32.98
No 792 35.59
Yes 700 31.43
Frequency Missing = 54.876248372
Q10 Frequency Percent
Don't Know 18 0.83
No 1129 50.56Yes 1085 48.61
Frequency Missing = 48.993034359
Q11a Frequency Percent
Not Used 2133 96.40
Used 80 3.60
Frequency Missing = 68.304086957
Q11b Frequency Percent
Not Used 2137 97.90
Used 46 2.10
Frequency Missing = 97.982355045
Q11c Frequency Percent
Not Used 2122 96.92
Used 68 3.08
Frequency Missing = 91.9647540
Q11d Frequency Percent
Not Used 2153 98.13
Used 41 1.87
Frequency Missing = 86.5557205
Q11e Frequency Percent
Not Used 2148 97.21
Used 62 2.79
Frequency Missing = 71.3544350
Q11f Frequency Percent
Not Used 2119 95.64
Used 97 4.36
Frequency Missing = 65.1818824
Q12a Frequency PerceNever heard of 79 3.
Never used 2074 92.
1-2 times 74 3.
3-10 times 9 0.
11+ times 7 0.
Frequency Missing = 37.6392054
Q12b Frequency Perce
Never heard of 261 11.
Never used 1926 86.1-2 times 23 1.
3-10 times 4 0.
11+ times 3 0.
Frequency Missing = 65.0353074
The frequencies have been weighted so that the
analysis reflects the distribution of students by grade
level in the district
Page

7/30/2019 2006 _ harris county _ deer park isd _ 2006 texas school survey of drug and alcohol use _ elementary report
http://slidepdf.com/reader/full/2006-harris-county-deer-park-isd-2006-texas-school-survey-of-drug-and 34/38
Deer Park
Spring 2006
Q12c Frequency Percent
Never heard of 22 0.99
Never used 1879 85.16
1-2 times 258 11.69
3-10 times 36 1.62
11+ times 12 0.54
Frequency Missing = 74.437423376
Q12d Frequency Percent
Never heard of 456 20.66
Never used 1590 72.11
1-2 times 129 5.85
3-10 times 24 1.07
11+ times 7 0.32
Frequency Missing = 75.699386665
Q12e Frequency Percent
Never heard of 46 2.08
Never used 1927 87.89
1-2 times 197 8.98
3-10 times 17 0.78
11+ times 6 0.27
Frequency Missing = 88.247021509
Q12f Frequency Percent
Never heard of 268 12.12
Never used 1825 82.37
1-2 times 98 4.44
3-10 times 20 0.92
11+ times 3 0.14
Frequency Missing = 65.804438656
Q12h Frequency Percent
Never heard of 252 11.40
Never used 1844 83.53
1-2 times 85 3.87
3-10 times 18 0.84
11+ times 8 0.37
Frequency Missing = 73.654303508
Q12i Frequency Percent
Never heard of 407 18.29
Never used 1785 80.32
1-2 times 19 0.88
3-10 times 7 0.32
11+ times 4 0.19
Frequency Missing = 58.795561385
Q13a Frequency Percent
Never heard of 73 3.27
Never used 2112 94.28
1-2 times 45 1.99
3-10 times 7 0.31
11+ times 3 0.14
Frequency Missing = 40.423529456
Q13b Frequency Percent
Never heard of 241 10.89
Never used 1956 88.25
1-2 times 15 0.68
3-10 times 3 0.14
11+ times 1 0.04
Frequency Missing = 65.08384939
Q13c Frequency Percent
Never heard of 20 0.92
Never used 1995 90.87
1-2 times 149 6.78
3-10 times 25 1.16
11+ times 6 0.27
Frequency Missing = 85.617649117
Q13d Frequency Percent
Never heard of 448 20.21
Never used 1662 74.94
1-2 times 88 3.98
3-10 times 14 0.65
11+ times 5 0.22
Frequency Missing = 63.402823444
Q13e Frequency Perce
Never heard of 45 2.
Never used 2021 91.
1-2 times 124 5.
3-10 times 13 0.11+ times 6 0.
Frequency Missing = 71.479496
Q13f Frequency Perce
Never heard of 271 12.
Never used 1860 83.
1-2 times 76 3.
3-10 times 13 0.
11+ times 3 0.
Frequency Missing = 58.8441033
Q13h Frequency Perce
Never heard of 245 11.
Never used 1880 84.
1-2 times 70 3.
3-10 times 13 0.
11+ times 8 0.
Frequency Missing = 64.5630399
Q13i Frequency Perce
Never heard of 380 17.
Never used 1828 81.
1-2 times 11 0.
3-10 times 7 0.
11+ times 3 0.
Frequency Missing = 50.5452854
The frequencies have been weighted so that the
analysis reflects the distribution of students by grade
level in the district
Page

7/30/2019 2006 _ harris county _ deer park isd _ 2006 texas school survey of drug and alcohol use _ elementary report
http://slidepdf.com/reader/full/2006-harris-county-deer-park-isd-2006-texas-school-survey-of-drug-and 35/38
Deer Park
Spring 2006
Q14a Frequency Percent
7 or younger 18 0.82
8 years old 10 0.45
9 years old 13 0.58
10 years old 23 1.03
11 years old 20 0.91
12 or older 17 0.76
Never heard/used 2122 95.44
Frequency Missing = 57.780970664
Q14b Frequency Percent
7 or younger 11 0.49
8 years old 4 0.18
9 years old 5 0.23
10 years old 4 0.18
11 years old 6 0.27
12 or older 2 0.09
Never heard/used 2184 98.56
Frequency Missing = 64.803836601
Q14c Frequency Percent
7 or younger 88 3.99
8 years old 44 1.99
9 years old 55 2.51
10 years old 59 2.70
11 years old 53 2.4012 or older 26 1.20
Never heard/used 1871 85.20
Frequency Missing = 84.617047063
Q14d Frequency Percent
7 or younger 22 1.01
8 years old 12 0.56
9 years old 26 1.20
10 years old 39 1.75
11 years old 36 1.6412 or older 26 1.19
Never heard/used 2047 92.65
Frequency Missing = 72.092726661
Q14e Frequency Percent
7 or younger 31 1.43
8 years old 36 1.63
9 years old 34 1.54
10 years old 51 2.34
11 years old 54 2.44
12 or older 24 1.10
Never heard/used 1965 89.52
Frequency Missing = 85.583095847
Q14f Frequency Percent
7 or younger 11 0.51
8 years old 12 0.53
9 years old 18 0.81
10 years old 25 1.13
11 years old 24 1.10
12 or older 22 1.01
Never heard/used 2097 94.90
Frequency Missing = 70.932510133
Q14h Frequency Percent
7 or younger 33 1.51
8 years old 8 0.36
9 years old 15 0.68
10 years old 20 0.89
11 years old 25 1.1412 or older 14 0.62
Never heard/used 2094 94.81
Frequency Missing = 72.866520752
Q14i Frequency Percent
7 or younger 7 0.32
8 years old 2 0.09
9 years old 3 0.13
10 years old 2 0.10
11 years old 8 0.3612 or older 13 0.57
Never heard/used 2184 98.43
Frequency Missing = 62.580487417
Q15a Frequency Perce
Never heard of 52 2.
None 1901 86.
Some 239 10.
Most 16 0.
Frequency Missing = 72.8226417
Q15b Frequency Perce
Never heard of 142 6.
None 1931 89.
Some 82 3.
Most 14 0.
Frequency Missing = 111.892750
Q15c Frequency Perce
Never heard of 13 0.
None 1774 81.
Some 347 16.
Most 32 1.
Frequency Missing = 115.295917
Q15d Frequency Perce
Never heard of 346 16.
None 1641 76.
Some 153 7.
Most 20 0.
Frequency Missing = 121.086710
Q15e Frequency Perce
Never heard of 31 1.
None 1896 87.
Some 214 9.
Most 22 1.
Frequency Missing = 118.128783
The frequencies have been weighted so that the
analysis reflects the distribution of students by grade
level in the district
Page
7/30/2019 2006 _ harris county _ deer park isd _ 2006 texas school survey of drug and alcohol use _ elementary report
http://slidepdf.com/reader/full/2006-harris-county-deer-park-isd-2006-texas-school-survey-of-drug-and 36/38
Deer Park
Spring 2006
Q15f Frequency Percent
Never heard of 191 8.84
None 1807 83.81
Some 134 6.20
Most 25 1.14
Frequency Missing = 125.07512979
Q15h Frequency Percent
Never heard of 190 8.83
None 1768 82.01
Some 162 7.52
Most 35 1.64
Frequency Missing = 124.74562585
Q15i Frequency Percent
Never heard of 297 13.55
None 1771 80.90
Some 96 4.38
Most 26 1.17
Frequency Missing = 92.466911915
Q16a Frequency Percent
Never heard of 62 2.81
No 1866 84.26
Yes 286 12.93
Frequency Missing = 66.920776137
Q16b Frequency Percent
Never heard of 162 7.42
No 1897 86.91
Yes 124 5.67
Frequency Missing = 98.381816932
Q16c Frequency Percent
Never heard of 19 0.87
No 1751 80.35
Yes 409 18.78
Frequency Missing = 101.21934573
Q16d Frequency Percent
Never heard of 363 16.72
No 1654 76.13
Yes 156 7.16
Frequency Missing = 108.68278815
Q16e Frequency Percent
Never heard of 46 2.09
No 1903 87.06
Yes 237 10.85
Frequency Missing = 95.49669541
Q16f Frequency Percent
Never heard of 198 9.09
No 1832 84.04
Yes 150 6.88
Frequency Missing = 100.60611533
Q16h Frequency Percent
Never heard of 189 8.61
No 1862 84.65Yes 148 6.75
Frequency Missing = 81.450963536
Q16i Frequency Percent
Never heard of 299 13.52
No 1799 81.29
Yes 115 5.19
Frequency Missing = 68.216328861
Q17a Frequency Percent
Do Not Drink 1727 78.96
No 240 10.95
Yes 221 10.09
Frequency Missing = 93.2341300
Q17b Frequency Percen
Do Not Drink 1720 79.1
No 375 17.2
Yes 78 3.5
Frequency Missing = 108.36355
Q17c Frequency Percen
Do Not Drink 1703 78.0
No 322 14.7
Yes 156 7.1
Frequency Missing = 99.1752117
Q18a Frequency Perce
Very dangerous 1440 64
Dangerous 613 27
Not at all 14 0
Don't know 108 4
Never heard of 43 1
Frequency Missing = 62.4787406
Q18b Frequency PerceVery dangerous 1406 63
Dangerous 494 22
Not at all 35 1
Don't know 153 6
Never heard of 118 5
Frequency Missing = 74.7753038
Q18c Frequency Perce
Very dangerous 1078 49
Dangerous 788 35Not at all 117 5
Don't know 202 9
Never heard of 12 0
Frequency Missing = 84.4228793
The frequencies have been weighted so that the
analysis reflects the distribution of students by grade
level in the district
Page

7/30/2019 2006 _ harris county _ deer park isd _ 2006 texas school survey of drug and alcohol use _ elementary report
http://slidepdf.com/reader/full/2006-harris-county-deer-park-isd-2006-texas-school-survey-of-drug-and 37/38
Deer Park
Spring 2006
Q18d Frequency Percent
Very dangerous 918 41.90
Dangerous 580 26.48
Not at all 112 5.11
Don't know 253 11.57
Never heard of 327 14.94
Frequency Missing = 90.643973833
Q18e Frequency Percent
Very dangerous 1046 47.80
Dangerous 724 33.09
Not at all 151 6.89
Don't know 248 11.33
Never heard of 20 0.90
Frequency Missing = 92.41370709
Q18f Frequency Percent
Very dangerous 1363 62.05
Dangerous 452 20.56
Not at all 50 2.28
Don't know 168 7.63
Never heard of 164 7.48
Frequency Missing = 84.737445377
Q18h Frequency Percent
Very dangerous 1384 63.05
Dangerous 413 18.83
Not at all 45 2.05
Don't know 190 8.67
Never heard of 162 7.40
Frequency Missing = 85.414155596
Q18i Frequency Percent
Very dangerous 1655 74.81
Dangerous 157 7.09
Not at all 28 1.29
Don't know 111 5.00
Never heard of 261 11.81
Frequency Missing = 68.211665973
Q19a Frequency Percent
No 1030 48.07
Yes 1113 51.93
Frequency Missing = 137.17752527
Q19b Frequency Percent
No 1022 47.95
Yes 1109 52.05
Frequency Missing = 150.0257375
Q19c Frequency Percent
No 806 37.99
Yes 1316 62.01
Frequency Missing = 158.33854406
Q19d Frequency Percent
No 1349 63.51
Yes 775 36.49
Frequency Missing = 156.28879802
Q19e Frequency Percent
No 1455 68.44
Yes 671 31.56
Frequency Missing = 154.82525426
Q20a Frequency Percent
Never 1955 89.12
1 time 153 6.97
2 times 47 2.13
3+ times 39 1.78
Frequency Missing = 87.255745232
Q20b Frequency Percent
Never 2047 94.28
1 time 67 3.10
2 times 29 1.33
3+ times 28 1.29
Frequency Missing = 109.500461
Q20c Frequency Percent
Never 1977 91.19
1 time 134 6.17
2 times 33 1.52
3+ times 24 1.12
Frequency Missing = 112.636654
Q20d Frequency Percent
Never 2075 94.79
1 time 62 2.85
2 times 31 1.42
3+ times 21 0.94
Frequency Missing = 91.7024436
Q21 Frequency Percent
No 2201 98.64
Yes 30 1.36
Frequency Missing = 49.8386848
Q22 Frequency Percent
No 1723 77.35
Yes 504 22.65
Frequency Missing = 53.5704060
Q23 Frequency Perce
Don't like it 1847 83.
Don't care 29 1.
Think it's O.K. 18 0.
Don't know 330 14.
Frequency Missing = 55.2290667
The frequencies have been weighted so that the
analysis reflects the distribution of students by grade
level in the district
Page

7/30/2019 2006 _ harris county _ deer park isd _ 2006 texas school survey of drug and alcohol use _ elementary report
http://slidepdf.com/reader/full/2006-harris-county-deer-park-isd-2006-texas-school-survey-of-drug-and 38/38
Deer Park
Spring 2006
Q24 Frequency Percent
Don't like it 1868 83.89
Don't care 14 0.63
Think it's O.K. 2 0.09
Don't know 343 15.39
Frequency Missing = 54.557019425
Top Related