


Languages
Pages
Legal


1
Set anode potentials affect the electron fluxes and microbial 1
community structure in propionate-fed microbial electrolysis cells 2
Ananda Rao Hari1, Krishna P. Katuri1, Bruce E. Logan2, and Pascal E. Saikaly1,* 3
1King Abdullah University of Science and Technology, Biological and Environmental Sciences 4
and Engineering Division, Water Desalination and Reuse Research Center, Thuwal 23955-6900, 5 Saudi Arabia 6 2The Pennsylvania State University, Department of Civil and Environmental Engineering, 7
University Park, PA 16802, USA 8
*Corresponding author: Pascal Saikaly ([email protected]) 9
10

2
Supplementary Methods 11
Analyses. The gas generated by the MECs was collected from both chambers in the head space 12
and in a gas bag (0.1 L Cali -5 -Bond. Calibrate, Inc.), and the total gas volume was measured by 13
the gas bag method as previously described 1. Concentrations of H2, N2, CH4 were measured 14
using a gas chromatograph (GC) (model 310; SRI Instruments) with a thermal conductivity 15
detector (TCD), a 1.83-m molecular sieve packed 5A column, and an argon carrier gas. CO2 16
concentration was measured with a second GC (model 310; SRI Instruments) with a TCD, a 17
0.91-m silica gel column, and using helium as the carrier gas. The volatile fatty acids (VFAs) 18
profile (propionate, formate, and acetate) and their concentrations were analyzed by high-19
performance liquid chromatograph (HPLC) (Thermo Scientific, Accela, country) equipped with 20
a photo-diode array (210 nm) and an ultraviolet detector. An Aminex HPX-87H column (Bio-21
Rad Laboratories, Hercules, CA, USA) was used to separate the VFAs. Sulfuric acid (5 mM) 22
was used as the mobile phase at a flow rate of 550 µL/min, and the pressure was maintained at 23
9650 kPa. The total elution time was 30 min, each sample was measured in triplicate, and the 24
average concentrations were reported 2. 25
26
16S rRNA gene sequencing. Genomic DNA was extracted using the PowerBiofilm DNA 27
extraction kit (MO BIO Laboratories, Inc., Carlsbad, CA) following the manufacturer's 28
instructions. The quality (A260/A280) and quantity (A260) of the extracted genomic DNA was 29
determined using a Nanodrop 1000 spectrophotometer (Thermo Fisher Scientific, Waltham, 30
MA). 31
Triplicate PCR reactions were performed for each sample in a 25 µL reaction volume using 32
the HotStarTaqPlus Master Mix (Qiagen, Valencia, CA), 0.5 µM of each primer, and 100-200 ng 33
3
of template DNA. The V3-V4 hypervariable region of 16S rRNA genes were amplified using a 34
universal primer set for prokaryotes: Pro 341F (5’-Illumina adapter-Barcode-Linker- 35
CCTACGGGNBGCASCAG-3’) and Pro 805R (5’-5’-Illumina adapter-Linker -36
GACTACNVGGGTATCTAATCC-3’) 3. PCR was performed using life technologies veritus 37
thermocycler with the following PCR conditions: initial denaturation at 94oC for 3 min, followed 38
by 28 cycles of denaturation at 94o C for 30 seconds, annealing at 53o C for 40 seconds, 39
extension at 72o C for 1 min and a final extension at 72o C for 5 min. 40
Following PCR, all amplicon products from the different samples were mixed in equal 41
concentrations, purified using Agencourt Ampure beads (Agencourt Bioscience Corporation, 42
MA, USA), and sequenced on the Illumina TruSeq technology (San Diego, CA) according to 43
manufacturer's instructions. 44
The 16S rRNA sequences were processed using the Quantitative Insights Into Microbial 45
Ecology (QIIME v 1.9.0) pipeline 4. Raw reads were first demultiplexed, trimmed and filtered 46
for quality. The minimum acceptable length was set to 200 bp 4. Sequences were clustered into 47
operational taxonomic units (OTUs) at 97% sequence similarity using the uclust algorithm 5. A 48
representative sequence from each OTU was aligned using PyNAST 6, and these were 49
phylogenetically assigned to a taxonomic identity (phylum, class and genus level) using the RDP 50
Naive Bayesian rRNA classifier at a confidence threshold of 80% 7. Chimeric sequences were 51
identified and removed from the aligned sequences using chimera Slayer as implemented in 52
QIIME. Rarified OTU tables were used to generate alpha and beta diversity metrics by 53
normalizing to the lowest sequence read of the samples. For alpha diversity measurements, both 54
non-phylogenetic based metrics (observed OTUs, Shannon diversity index (H), Simpson 55
diversity index (D) and Chao 1 richness estimator) and phylogenetic based metric (phylogenetic 56

4
diversity (PD_whole)) were calculated with QIIME at the 3% distance level. Beta diversity 57
metrics using the unweighted UniFrac distance matrix 8 was calculated and visualized with 58
nonmetric multidimensional scaling (NMDS) using statistical software PRIMER 6 (version 59
6.1.13). 60
61
5
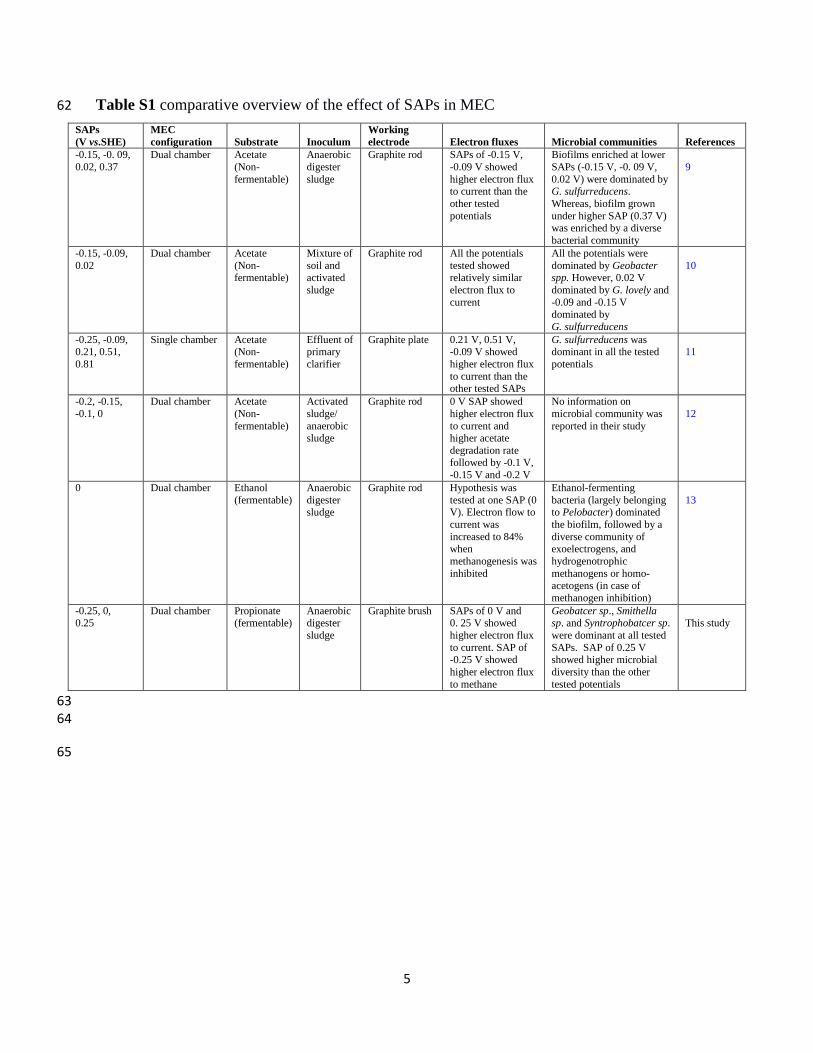
Table S1 comparative overview of the effect of SAPs in MEC 62
63 64
65
SAPs
(V vs.SHE)
MEC
configuration
Substrate
Inoculum
Working
electrode
Electron fluxes
Microbial communities
References
-0.15, -0. 09,
0.02, 0.37
Dual chamber Acetate
(Non-
fermentable)
Anaerobic
digester
sludge
Graphite rod SAPs of -0.15 V,
-0.09 V showed
higher electron flux to current than the
other tested
potentials
Biofilms enriched at lower
SAPs (-0.15 V, -0. 09 V,
0.02 V) were dominated by G. sulfurreducens.
Whereas, biofilm grown
under higher SAP (0.37 V) was enriched by a diverse
bacterial community
9
-0.15, -0.09,
0.02
Dual chamber Acetate
(Non-fermentable)
Mixture of
soil and activated
sludge
Graphite rod All the potentials
tested showed relatively similar
electron flux to
current
All the potentials were
dominated by Geobacter spp. However, 0.02 V
dominated by G. lovely and
-0.09 and -0.15 V dominated by
G. sulfurreducens
10
-0.25, -0.09, 0.21, 0.51,
0.81
Single chamber Acetate (Non-
fermentable)
Effluent of primary
clarifier
Graphite plate 0.21 V, 0.51 V, -0.09 V showed
higher electron flux
to current than the other tested SAPs
G. sulfurreducens was dominant in all the tested
potentials
11
-0.2, -0.15,
-0.1, 0
Dual chamber Acetate
(Non-
fermentable)
Activated
sludge/
anaerobic sludge
Graphite rod 0 V SAP showed
higher electron flux
to current and higher acetate
degradation rate followed by -0.1 V,
-0.15 V and -0.2 V
No information on
microbial community was
reported in their study
12
0 Dual chamber Ethanol
(fermentable)
Anaerobic
digester sludge
Graphite rod Hypothesis was
tested at one SAP (0 V). Electron flow to
current was
increased to 84% when
methanogenesis was
inhibited
Ethanol-fermenting
bacteria (largely belonging to Pelobacter) dominated
the biofilm, followed by a
diverse community of exoelectrogens, and
hydrogenotrophic
methanogens or homo-acetogens (in case of
methanogen inhibition)
13
-0.25, 0, 0.25
Dual chamber Propionate (fermentable)
Anaerobic digester
sludge
Graphite brush SAPs of 0 V and 0. 25 V showed
higher electron flux
to current. SAP of -0.25 V showed
higher electron flux
to methane
Geobatcer sp., Smithella sp. and Syntrophobatcer sp.
were dominant at all tested
SAPs. SAP of 0.25 V showed higher microbial
diversity than the other
tested potentials
This study
6
Supplementary Results 66
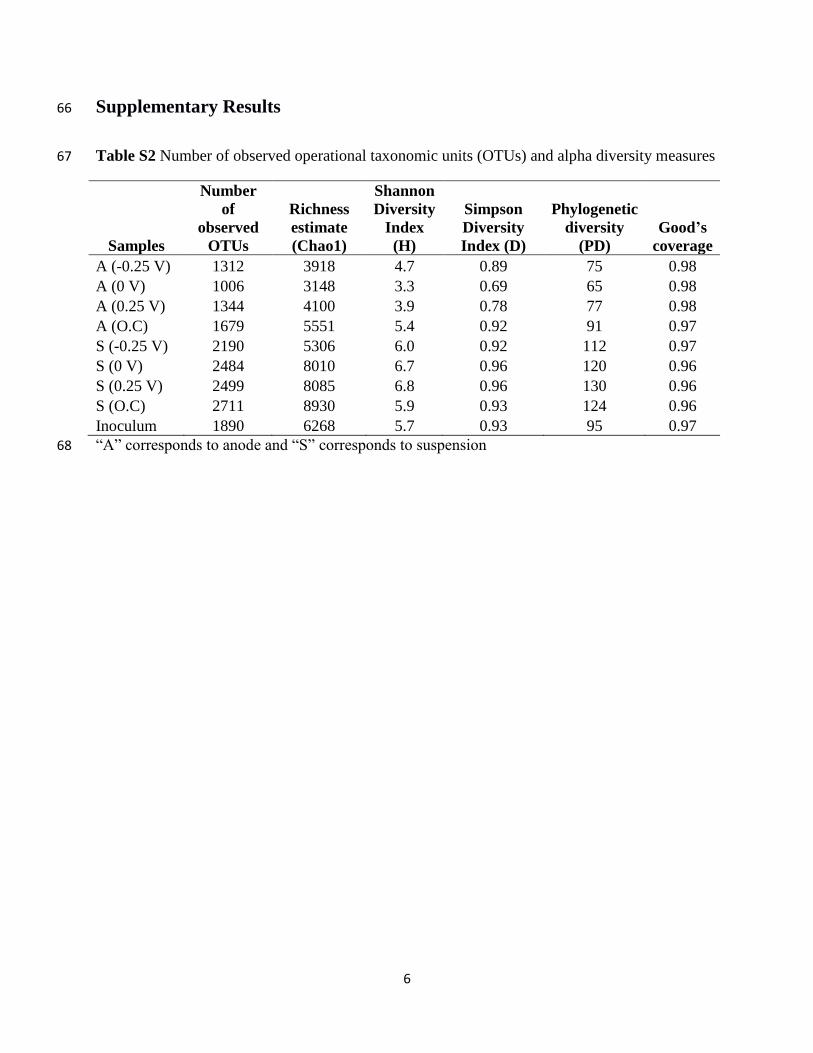
Table S2 Number of observed operational taxonomic units (OTUs) and alpha diversity measures 67
Samples
Number
of
observed
OTUs
Richness
estimate
(Chao1)
Shannon
Diversity
Index
(H)
Simpson
Diversity
Index (D)
Phylogenetic
diversity
(PD)
Good’s
coverage
A (-0.25 V) 1312 3918 4.7 0.89 75 0.98
A (0 V) 1006 3148 3.3 0.69 65 0.98
A (0.25 V) 1344 4100 3.9 0.78 77 0.98
A (O.C) 1679 5551 5.4 0.92 91 0.97
S (-0.25 V) 2190 5306 6.0 0.92 112 0.97
S (0 V) 2484 8010 6.7 0.96 120 0.96
S (0.25 V) 2499 8085 6.8 0.96 130 0.96
S (O.C) 2711 8930 5.9 0.93 124 0.96
Inoculum 1890 6268 5.7 0.93 95 0.97
“A” corresponds to anode and “S” corresponds to suspension 68
7
69
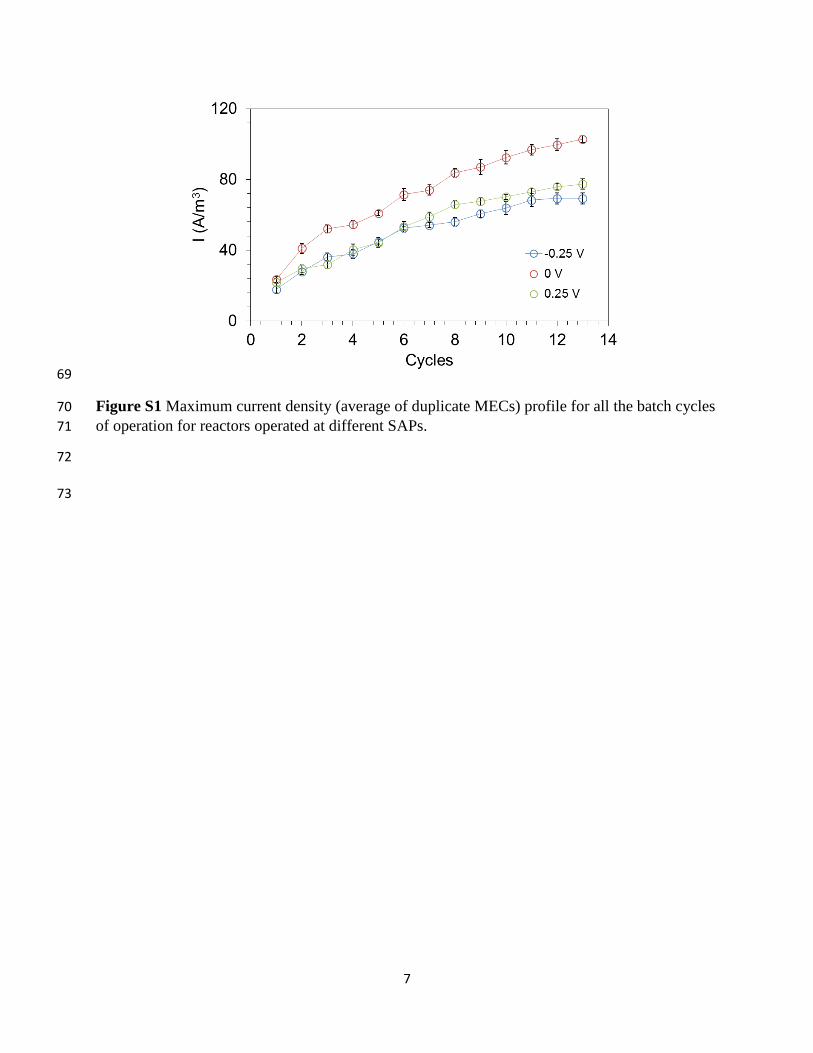
Figure S1 Maximum current density (average of duplicate MECs) profile for all the batch cycles 70
of operation for reactors operated at different SAPs. 71
72
73

8
74
75
76
77
78
79
80
81
82
83
84
85
86
87
88
89
Figure S2 (A) Nyquist plots of electrochemical impedance spectroscopy spectra of the virgin 90
carbon fiber brush anode performed at different set potentials in cell-free growth medium. (B) 91 Profiles of measured potential of working electrode (circles; ohmic drop compensated) for all the 92
batch cycles of MECs operated at different SAPs. The dashed lines correspond to the SAP of 93 working electrode (uncompensated resistance). 94 95
A
B
9
96
97
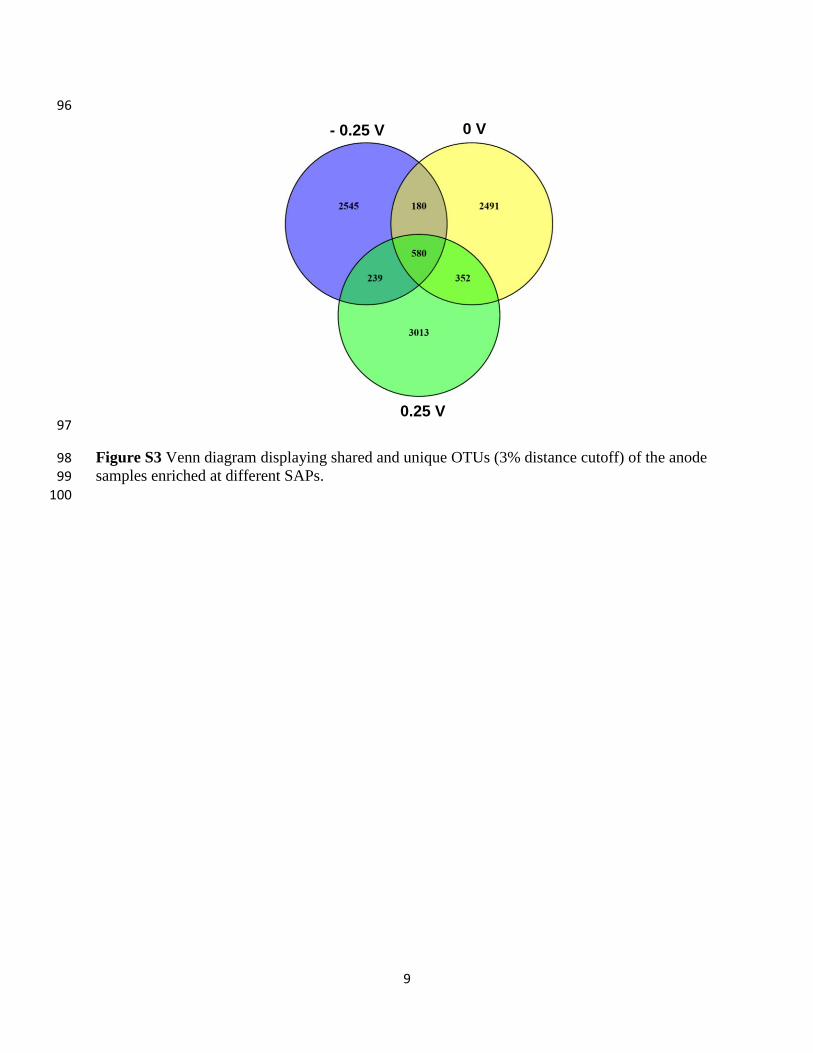
Figure S3 Venn diagram displaying shared and unique OTUs (3% distance cutoff) of the anode 98
samples enriched at different SAPs. 99
100
- 0.25 V 0 V
0.25 V
10
101
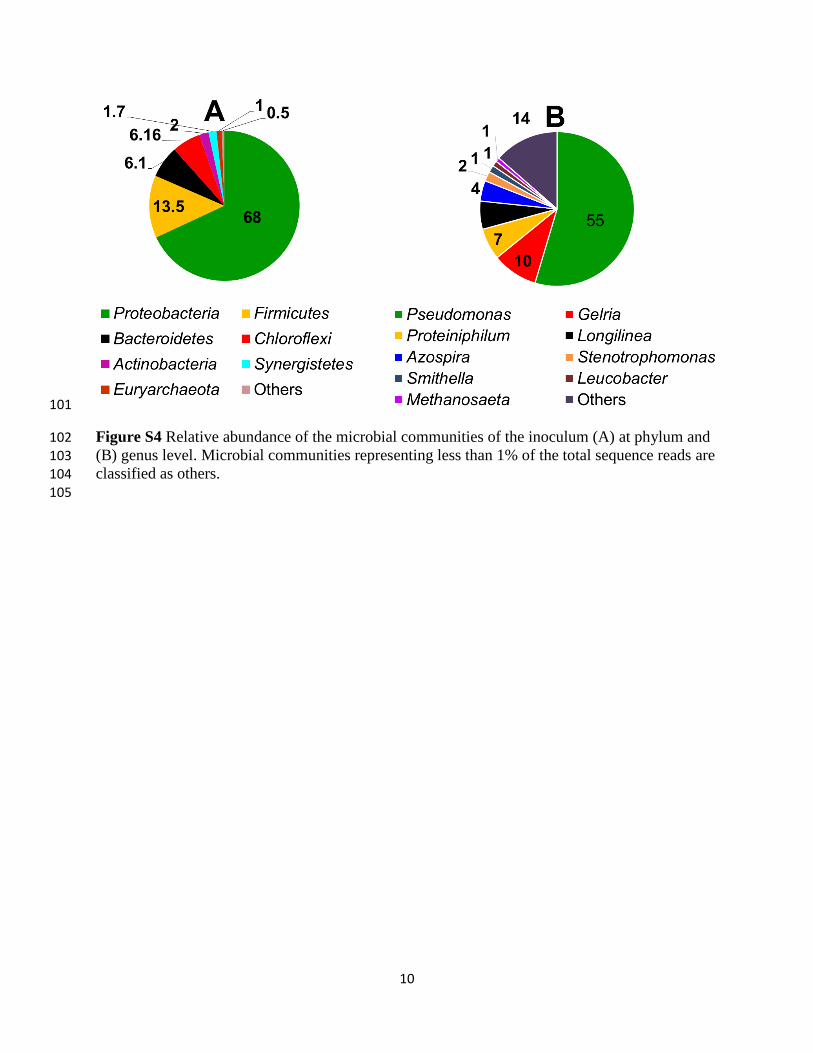
Figure S4 Relative abundance of the microbial communities of the inoculum (A) at phylum and 102 (B) genus level. Microbial communities representing less than 1% of the total sequence reads are 103 classified as others. 104
105

11
106
Figure S5 The ratio of Archaea to Bacteria in the anode and suspension samples of the different 107
SAP (-0.25, 0 and 0.25 V) and open circuit (O.C) reactors. “A” and “S” correspond to the anode 108 and suspension. 109
110
12
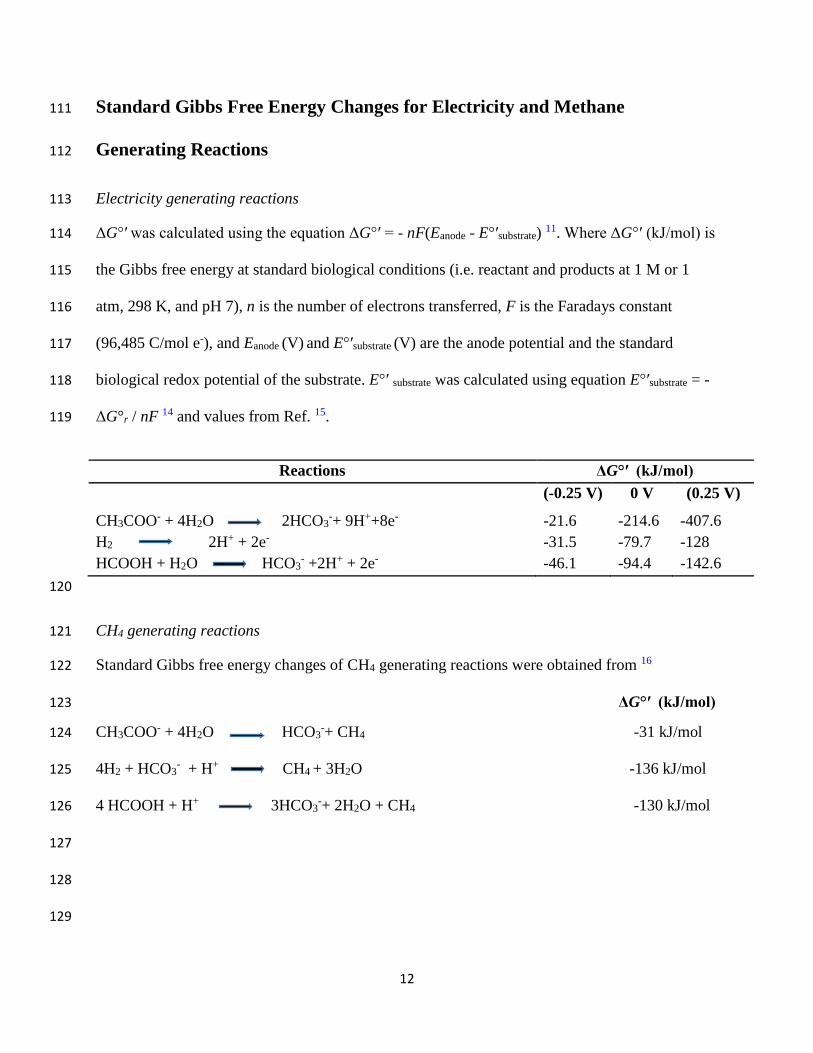
Standard Gibbs Free Energy Changes for Electricity and Methane 111
Generating Reactions 112
Electricity generating reactions 113
ΔG°′ was calculated using the equation ΔG°′ = - nF(Eanode - E°′substrate) 11. Where ΔG°′ (kJ/mol) is 114
the Gibbs free energy at standard biological conditions (i.e. reactant and products at 1 M or 1 115
atm, 298 K, and pH 7), n is the number of electrons transferred, F is the Faradays constant 116
(96,485 C/mol e-), and Eanode (V) and E°′substrate (V) are the anode potential and the standard 117
biological redox potential of the substrate. E°′ substrate was calculated using equation E°′substrate = - 118
ΔG°r / nF 14 and values from Ref. 15. 119
Reactions ΔG°′ (kJ/mol)
(-0.25 V) 0 V (0.25 V)
CH3COO- + 4H2O 2HCO3-+ 9H++8e- -21.6 -214.6 -407.6
H2 2H+ + 2e- -31.5 -79.7 -128
HCOOH + H2O HCO3- +2H+ + 2e- -46.1 -94.4 -142.6
120
CH4 generating reactions 121
Standard Gibbs free energy changes of CH4 generating reactions were obtained from 16 122
ΔG°′ (kJ/mol) 123
CH3COO- + 4H2O HCO3-+ CH4 -31 kJ/mol 124
4H2 + HCO3- + H+ CH4 + 3H2O -136 kJ/mol 125
4 HCOOH + H+ 3HCO3-+ 2H2O + CH4 -130 kJ/mol 126
127
128
129

13
Theoretical Distribution of Electrons from Propionate Oxidation to Various 130
Electron Sinks 131
Conversion of propionate concentration from mM to milli electron (me–) equivalents 132
Conversion of propionate concentration from mM to me– equivalents = 133
Propionate concentration (mM)×volume of the reactor (Litre)×moles of electrons/ mole of 134
propionate. 135
For example 35.8 mM of propionate used in this study is equivalent to 20 me– equivalents, 136
calculated as follows: 137
35.8 ×0.04 ×14 = 20 me– equivalents 138
139
Electrons utilized for biomass synthesis 140
The fraction of electrons from the donor substrate that is utilized for biomass synthesis is 141
represented by fos
17. fos = 0.05 for G. sulfurreducens, as representative of exoelectrogens 18,19; fo
s 142
= 0.1 for fermenters and fos = 0.08 for hydrogenotrophic methanogens 17. The electrons utilized 143
for the different microbial groups was calculated by multiplying the substrate concentration in 144
me– equivalent with the fos values of the corresponding organisms. 145
For example, the electrons utilized for propionate fermenters biomass (2) was calculated by 146
multiplying 20 me– equivalent by the fos value (0.1) for propionate fermenters (Supplementary 147
Figure S6). 148
149
Predicted electron distribution to various electron sinks (Supplementary Figure S6) 150
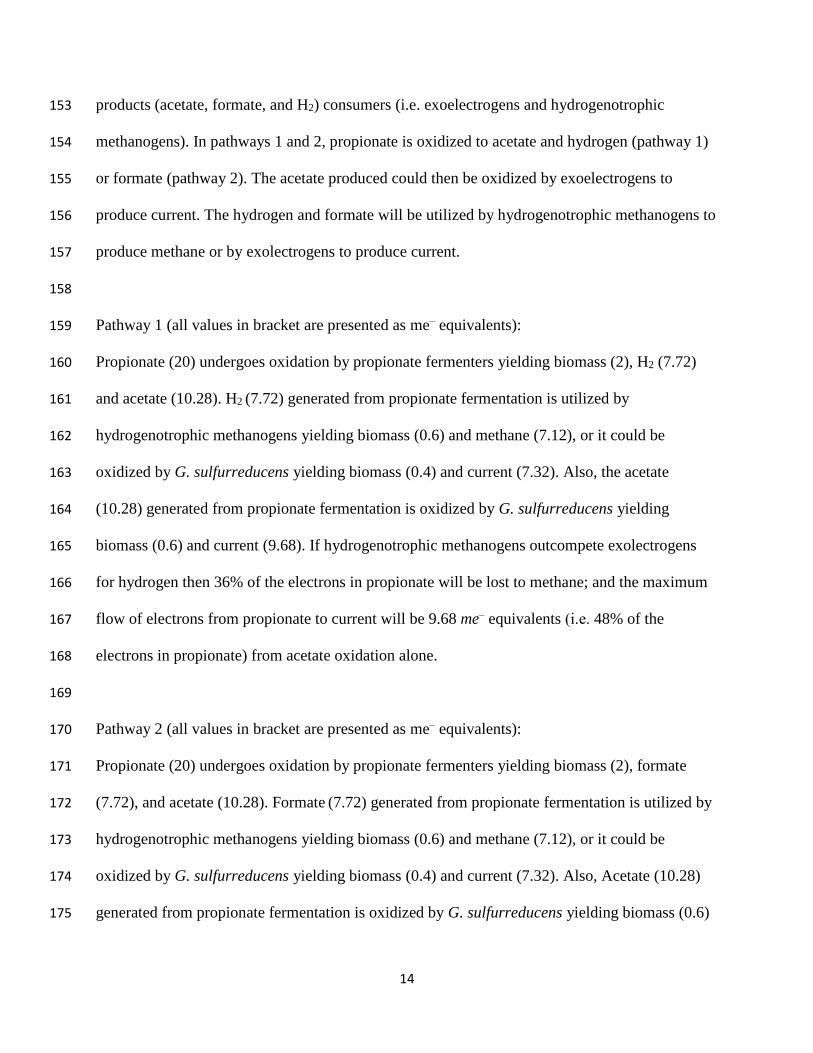
Two possible pathways of propionate oxidation could occur in the anode of MECs. Pathways 1 151
and 2 involve a microbial partnership between propionate fermenting bacteria and fermentation 152
14
products (acetate, formate, and H2) consumers (i.e. exoelectrogens and hydrogenotrophic 153
methanogens). In pathways 1 and 2, propionate is oxidized to acetate and hydrogen (pathway 1) 154
or formate (pathway 2). The acetate produced could then be oxidized by exoelectrogens to 155
produce current. The hydrogen and formate will be utilized by hydrogenotrophic methanogens to 156
produce methane or by exolectrogens to produce current. 157
158
Pathway 1 (all values in bracket are presented as me– equivalents): 159
Propionate (20) undergoes oxidation by propionate fermenters yielding biomass (2), H2 (7.72) 160
and acetate (10.28). H2 (7.72) generated from propionate fermentation is utilized by 161
hydrogenotrophic methanogens yielding biomass (0.6) and methane (7.12), or it could be 162
oxidized by G. sulfurreducens yielding biomass (0.4) and current (7.32). Also, the acetate 163
(10.28) generated from propionate fermentation is oxidized by G. sulfurreducens yielding 164
biomass (0.6) and current (9.68). If hydrogenotrophic methanogens outcompete exolectrogens 165
for hydrogen then 36% of the electrons in propionate will be lost to methane; and the maximum 166
flow of electrons from propionate to current will be 9.68 me– equivalents (i.e. 48% of the 167
electrons in propionate) from acetate oxidation alone. 168
169
Pathway 2 (all values in bracket are presented as me– equivalents): 170
Propionate (20) undergoes oxidation by propionate fermenters yielding biomass (2), formate 171
(7.72), and acetate (10.28). Formate (7.72) generated from propionate fermentation is utilized by 172
hydrogenotrophic methanogens yielding biomass (0.6) and methane (7.12), or it could be 173
oxidized by G. sulfurreducens yielding biomass (0.4) and current (7.32). Also, Acetate (10.28) 174
generated from propionate fermentation is oxidized by G. sulfurreducens yielding biomass (0.6) 175

15
and current (9.68). If hydrogenotrophic methanogens outcompete exolectrogens for formate then 176
36% of the electrons in propionate will be lost to methane; and the maximum flow of electrons 177
from propionate to current will be 9.68 me– equivalents (i.e. 48% of the electrons in propionate) 178
from acetate oxidation alone. 179
180
Figure S6 Possible theoretical pathways of electron flow in the anode of MECs fed with 181 propionate (20 me– equivalents =36 mM). All values in bracket are presented as me– equivalents. 182
Blue represents fermenters, red represents methanogens and green represents exoelectrogens. 183 Figure S4 was created by Ananda Rao Hari. 184 185

16
References 186
1 Ambler, J. R. & Logan, B. E. Evaluation of stainless steel cathodes and a bicarbonate 187
buffer for hydrogen production in microbial electrolysis cells using a new method for 188
measuring gas production. Int. J. Hydrogen. Energy. 36, 160-166 (2011). 189
2 Lee, H. S., Torres, C. I., Parameswaran, P. & Rittmann, B. E. Fate of H2 in an upflow 190
single-chamber microbial electrolysis cell using a metal-catalyst-free cathode. Environ. 191
Sci. Technol. 43, 7971-7976 (2009). 192
3 Takahashi, S., Tomita, J., Nishioka, K., Hisada, T. & Nishijima, M. Development of a 193
prokaryotic universal primer for simultaneous analysis of Bacteria and Archaea using 194
next-generation sequencing. PloS one. 9, e105592 (2014). 195
4 Caporaso, J. G. et al. QIIME allows analysis of high-throughput community sequencing 196
data. Nature Met. 7, 335-336 (2010). 197
5 Edgar, R. C. Search and clustering orders of magnitude faster than BLAST. 198
Bioinformatics. 26, 2460-2461 (2010). 199
6 Caporaso, J. G. et al. PyNAST: a flexible tool for aligning sequences to a template 200
alignment. Bioinformatics. 26, 266-267 (2010). 201
7 Wang, Q., Garrity, G. M., Tiedje, J. M. & Cole, J. R. Naive Bayesian classifier for rapid 202
assignment of rRNA sequences into the new bacterial taxonomy. Appl. Environ. 203
Microbiol. 73, 5261-5267 (2007). 204
8 Lozupone, C. & Knight, R. UniFrac: a new phylogenetic method for comparing microbial 205
communities. Appl. Environ. Microbiol. 71, 8228-8235 (2005). 206
207

17
9 Torres, C. I. et al. Selecting anode-respiring bacteria based on anode potential: 208
phylogenetic, electrochemical, and microscopic characterization. Environ. Sci. Technol. 209
43, 9519-9524 (2009). 210
10 Commault, A. S., Lear, G., Packer, M. A. & Weld, R. J. Influence of anode potentials on 211
selection of Geobacter strains in microbial electrolysis cells. Bioresour. Technol. 139, 212
226-234 (2013). 213
11 Zhu, X. et al. Microbial community composition is unaffected by anode potential. 214
Environ. Sci. Technol. 48, 1352-1358 (2014). 215
12 Villano, M., Ralo, C., Zeppilli, M., Aulenta, F. & Majone, M. Influence of the set anode 216
potential on the performance and internal energy losses of a methane-producing 217
microbial electrolysis cell. Bioelectrochem. 107, 1-6 (2016). 218
13 Parameswaran, P., Torres, C. I., Lee, H. S., Krajmalnik‐Brown, R. & Rittmann, B. E. 219
Syntrophic interactions among anode respiring bacteria (ARB) and Non‐ARB in a 220
biofilm anode: electron balances. Biotechnol. Bioeng. 103, 513-523 (2009). 221
14 Logan, B. E. et al. Microbial fuel cells: methodology and technology. Environ. Sci. 222
Technol. 40, 5181-5192 (2006). 223
15 Heijnen, J. J. Bioenergetics of Microbial Growth Encyclopedia of Bioprocess 224
Technology. John Wiley & Sons, Inc. 162 (2002). 225
16 Thauer, R. K., Jungermann, K. & Decker, K. Energy conservation in chemotrophic 226
anaerobic bacteria. Bacteriol. Rev. 41, 100 (1977). 227
17 Rittmann, B. E. & McCarty, P. L. Environmental biotechnology. (McGraw-Hill New 228
York, 2001). 229

18
18 Bond, D. R. & Lovley, D. R. Electricity production by Geobacter sulfurreducens attached 230
to electrodes. Appl. Environ. Microbiol. 69, 1548-1555 (2003). 231
19 Esteve‐Núñez, A., Rothermich, M., Sharma, M. & Lovley, D. Growth of Geobacter 232
sulfurreducens under nutrient‐limiting conditions in continuous culture. Environ. 233
Microbiol. 7, 641-648 (2005). 234
235
236
Top Related